Embed Size (px)
Citation preview
Solium Capital Inc. MD&A for the quarter ended MARCH 31, 2016 Page 1
SOLIUM CAPITAL INC. MANAGEMENT’S DISCUSSION AND ANALYSIS
FOR THE QUARTER ENDED MARCH 31, 2016
This Management’s Discussion and Analysis (“MD&A”) of Solium Capital Inc. (“Solium” or the “Company”) for the three months ended March 31, 2016 is dated May 2, 2016. This MD&A should be read in conjunction with the unaudited Condensed Consolidated Interim Financial Statements for the quarter ended March 31, 2016, the Company’s audited Consolidated Financial Statements and the accompanying notes for the year ended December 31, 2015, and the MD&A included in the Company’s 2015 Annual Report. The unaudited Condensed Consolidated Interim Financial Statements have been prepared in accordance with International Financial Reporting Standards.
Additional information relating to the Company, including the Company’s annual information form for the year ended December 31, 2015, is available on SEDAR at www.sedar.com under Solium Capital Inc.
All dollar amounts discussed in the MD&A are in Canadian dollars unless otherwise specified.
SPECIAL NOTE REGARDING FORWARD-LOOKING STATEMENTS
Certain statements included or incorporated by reference in this MD&A constitute forward-looking statements or forward-looking information under applicable securities legislation. Forward-looking statements or information typically contain statements with words such as "anticipate", "believe", "expect", "plan", "intend", "estimate", "propose", or similar words suggesting future outcomes or statements regarding an outlook. Forward-looking statements or information in this MD&A include but are not limited to expectations regarding future revenues, earnings, capital expenditures and the funding thereof, and operating and other costs; business strategy and objectives; market trends; the sufficiency of cash and working capital for future operations and growth strategies; the timing and the completion of various development projects; and the growth of international operations and international markets.
Such forward-looking statements or information are based on a number of assumptions which may prove to be incorrect. In addition to other assumptions identified in this MD&A, assumptions have been made regarding, among other things, the Company's transition to new products and releases; the number of customer transactions; the length of the sales cycles; the competitive environment; the ability to maintain or accurately forecast revenue from the Company's products or services; the ability of the Company to identify, hire, train, motivate and retain qualified personnel; currency fluctuations; the ability of the Company to develop, introduce and implement new products as well as enhancements or improvements for existing products that respond, in a timely fashion, to customer/product requirements and rapid technological change; risks associated with operations; the impact of any changes in the laws and regulations in the jurisdictions in which the Company operates; the effect of new accounting pronouncements or guidance; and the accuracy of the Company’s calculations respecting the contingent obligation to Computershare Inc. (“Computershare”) and the corresponding requirement of the Company to make required payments pursuant to its agreements with Computershare.
Although the Company believes that the expectations reflected in such forward-looking statements or information are reasonable, undue reliance should not be placed on forward-looking statements or information because the Company can give no assurance that such expectations will prove to be correct. The forward-looking statements and information are based on Solium’s current expectations, estimates and projections, and are subject to a number of significant risks and uncertainties that could cause actual results to differ materially from those anticipated. Such risks and uncertainties include, among others, general business and economic conditions; the overall performance of stock market(s); actions of competitors and partners; the regulatory environment; the corporate governance environment and regulatory reporting requirements for Solium’s clients; product capability and acceptance; the Company’s ability to generate sufficient cash flow from operations to meet its current and future obligations; and the Company’s ability to access external sources of financing if required. A more detailed assessment of the risks that could cause
Solium Capital Inc. MD&A for the quarter ended MARCH 31, 2016 Page 2
actual results to materially differ from current expectations is contained in the Risk Assessment section of this MD&A. The foregoing is not exhaustive and other risks are detailed from time to time in other continuous disclosure filings of the Company. Should one or more of these risks or uncertainties materialize, or should assumptions underlying the forward-looking statements or information prove incorrect, actual results may vary materially from those described herein as anticipated, believed, estimated or expected. These forward-looking statements contained herein are made as of the date of this MD&A. The Company does not intend to nor does it assume any obligation to update publicly or to revise any of the forward-looking statements, whether as a result of new information, subsequent events or otherwise, except as required by law. OVERVIEW OF THE COMPANY
Solium Capital Inc. (TSX: SUM) provides cloud-enabled services for global equity-based incentive plans including administration, financial reporting and compliance. From offices in the United States, Canada, the United Kingdom, Europe and Australia, the Company’s innovative software-as-a-service (SaaS) technology powers share plan administration and equity transactions for more than 3,000 corporate clients with employee participants in more than 100 countries. Solium’s technology provides functionality that streamlines a client’s workflow relating to the issuance of equity incentives, the exercise of incentives, reporting of incentives and day-to-day maintenance of the incentives database. The technology provides constant online access to reports for securities regulators, internal management and financial disclosure purposes. Solium’s solutions empower plan participants by providing them with online access to review their stock incentive portfolios from any internet-connected computer, anywhere in the world. Plan participants have direct access to the financial markets through Solium’s brokerage partners.
Revenue is primarily earned on a recurring basis; derived from corporate clients, their associated employee plan participants, and Solium’s brokerage partners. From corporate clients, Solium receives recurring access, subscription or maintenance fees. From share transaction activity, revenue is received from participants in the form of transaction and money movement fees and fees that are based on the share transactions executed by the brokerage partners for Solium’s participants. In addition, the Company receives one-time (non-recurring) revenue for the implementation of plans for new clients onto the system, ad hoc customization and consulting.
Solium Capital Inc. MD&A for the quarter ended MARCH 31, 2016 Page 3
OVERALL PERFORMANCE
Revenue was $25.4 for the first quarter of 2016 (Q1 2015: $24.6 million). Adjusted EBITDA (a) decreased to $4.4 million for the first quarter of 2016 (Q1 2015: $6.4 million).
(a) Adjusted EBITDA is a non-IFRS financial measure. A reconciliation of the Adjusted EBITDA to net earnings is found under “Summary of Quarterly Results” in this MD&A.
The key factors affecting the results in the three months ended March 31, 2016 are:
Organic growth in license revenue - License and subscription fees increased by $2.4 million or 16% during the first quarter of 2016 compared to the same period in 2015. Based on local currencies, the growth was 7% between the comparable quarters.
Transaction activity - In addition to the recurring license revenue that Solium collects for the use of its Shareworks platform, the Company also collects reoccurring transaction based revenue. Transaction based revenue decreased by $1.5 million or 17% in the first quarter of 2016 as compared to the same period in 2015. The per participant trading activity was 19% lower than the level in the first quarter of 2015 and was 9% lower than the historical five-year rolling average.
Global expansion - The Company continues to focus on building scale in its global platform and operations. Operating expenses increased by $2.9 million compared to the same period of 2015. The increase is attributable to growth in headcount primarily associated with international expansion, translation of international expenses into CAD, and other increases in systems and regulatory compliance costs. The Company had 467 full-time equivalent employees (FTE’s) at the end of the first quarter of 2016 compared to 424 FTE at the end of the first quarter of 2015. The FTE count held consistent to the fourth quarter of 2015.
Foreign exchange - The strength of the international currencies against the Canadian dollar (CAD) increased during the three months ended March 31, 2016 compared to the same period in 2015. This had a positive impact on the Company’s overall net financial results primarily due to the translation of U.S. dollar (USD) financial results into CAD for consolidated financial reporting purposes.
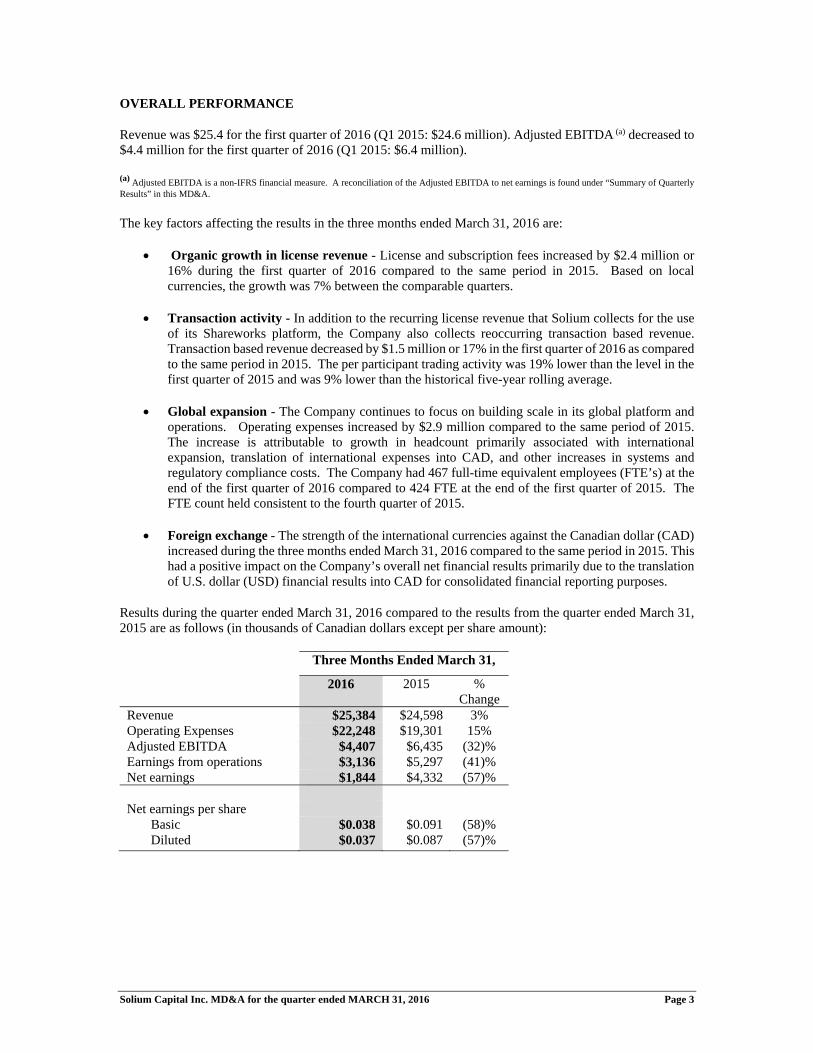
Results during the quarter ended March 31, 2016 compared to the results from the quarter ended March 31, 2015 are as follows (in thousands of Canadian dollars except per share amount):
Three Months Ended March 31,
2016 2015 % Change
Revenue $25,384 $24,598 3% Operating Expenses $22,248 $19,301 15% Adjusted EBITDA $4,407 $6,435 (32)% Earnings from operations $3,136 $5,297 (41)% Net earnings $1,844 $4,332 (57)% Net earnings per share
Basic $0.038 $0.091 (58)% Diluted $0.037 $0.087 (57)%
Solium Capital Inc. MD&A for the quarter ended MARCH 31, 2016 Page 4
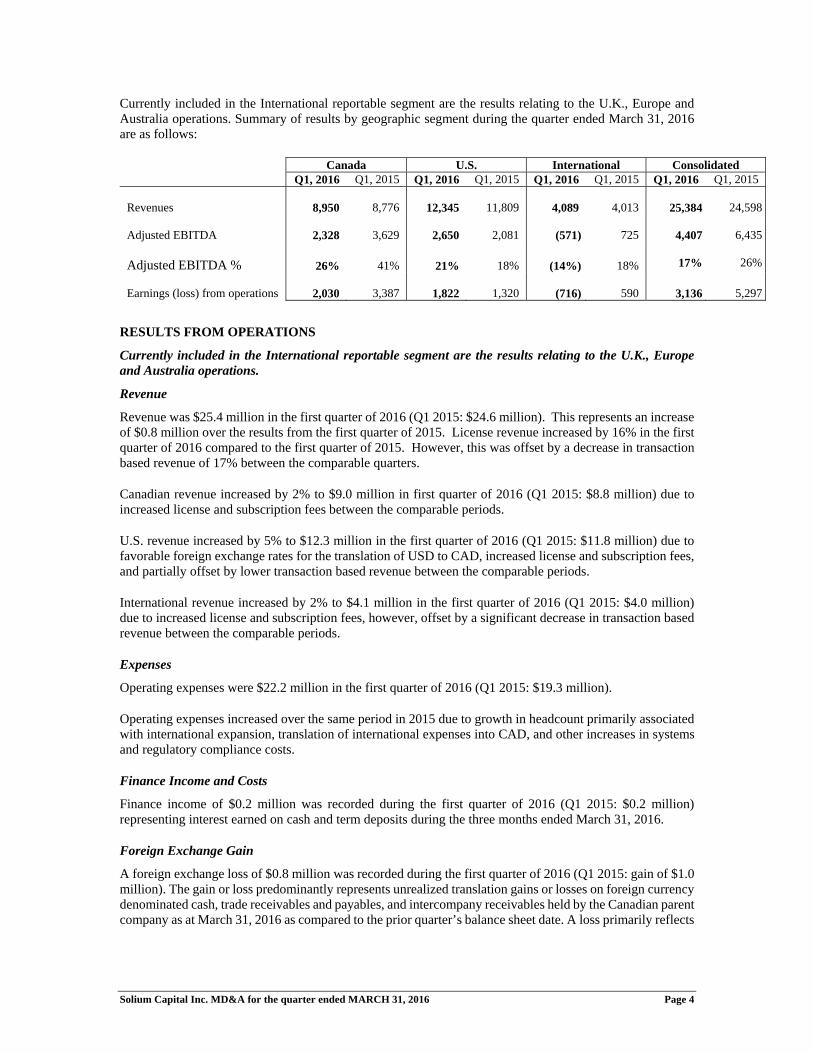
Currently included in the International reportable segment are the results relating to the U.K., Europe and Australia operations. Summary of results by geographic segment during the quarter ended March 31, 2016 are as follows:
Canada U.S. International Consolidated Q1, 2016 Q1, 2015 Q1, 2016 Q1, 2015 Q1, 2016 Q1, 2015 Q1, 2016 Q1, 2015
Revenues
8,950
8,776
12,345
11,809
4,089
4,013
25,384
24,598
Adjusted EBITDA
2,328
3,629
2,650
2,081
(571)
725 4,407 6,435 Adjusted EBITDA % 26% 41% 21% 18% (14%) 18% 17% 26%
Earnings (loss) from operations
2,030 3,387 1,822 1,320 (716) 590 3,136 5,297
RESULTS FROM OPERATIONS
Currently included in the International reportable segment are the results relating to the U.K., Europe and Australia operations.
Revenue
Revenue was $25.4 million in the first quarter of 2016 (Q1 2015: $24.6 million). This represents an increase of $0.8 million over the results from the first quarter of 2015. License revenue increased by 16% in the first quarter of 2016 compared to the first quarter of 2015. However, this was offset by a decrease in transaction based revenue of 17% between the comparable quarters.
Canadian revenue increased by 2% to $9.0 million in first quarter of 2016 (Q1 2015: $8.8 million) due to increased license and subscription fees between the comparable periods.
U.S. revenue increased by 5% to $12.3 million in the first quarter of 2016 (Q1 2015: $11.8 million) due to favorable foreign exchange rates for the translation of USD to CAD, increased license and subscription fees, and partially offset by lower transaction based revenue between the comparable periods.
International revenue increased by 2% to $4.1 million in the first quarter of 2016 (Q1 2015: $4.0 million) due to increased license and subscription fees, however, offset by a significant decrease in transaction based revenue between the comparable periods.
Expenses
Operating expenses were $22.2 million in the first quarter of 2016 (Q1 2015: $19.3 million).
Operating expenses increased over the same period in 2015 due to growth in headcount primarily associated with international expansion, translation of international expenses into CAD, and other increases in systems and regulatory compliance costs.
Finance Income and Costs
Finance income of $0.2 million was recorded during the first quarter of 2016 (Q1 2015: $0.2 million) representing interest earned on cash and term deposits during the three months ended March 31, 2016.
Foreign Exchange Gain
A foreign exchange loss of $0.8 million was recorded during the first quarter of 2016 (Q1 2015: gain of $1.0 million). The gain or loss predominantly represents unrealized translation gains or losses on foreign currency denominated cash, trade receivables and payables, and intercompany receivables held by the Canadian parent company as at March 31, 2016 as compared to the prior quarter’s balance sheet date. A loss primarily reflects

Solium Capital Inc. MD&A for the quarter ended MARCH 31, 2016 Page 5
the strengthening of the CAD against foreign currencies during the period, while a gain represents the weakening of the CAD against such currencies.
Gain on Derecognition of Liability
In connection with the acquisition of Executive Trading Solutions’ (ETS) assets that closed on July 31, 2014, the Company had an obligation to pay to ETS a holdback of $0.26 million (U.S. $0.2 million) and earn-out of $0.325 million (U.S. $0.25 million) on April 30, 2016. Management performed an assessment of the contingent terms of the holdback and earn-out payable as at March 31, 2016 and determined that the earn-out has not met the terms of the agreement for payout, and $7,000 (U.S. $5,000) of the holdback is payable to ETS. The derecognition of the liability due to ETS resulted in a gain of $0.587 million (U.S. $0.445 million).
Income Taxes
Income tax expense of $1.2 million was recorded in the first quarter of 2016 (Q1 2015: $2.2 million).
Based on consolidated earnings before income taxes, the effective income tax rate for the three months ended March 31, 2016 is 40.1% (Q1 2015: 33.9%). The effective tax rate increased compared to 2015 mainly due to a) an increase in operating losses in the international segment while still remaining non-taxable, thereby decreasing consolidated accounting income without the associated decrease in consolidated income tax expense; and b) an increase in the statutory corporate income tax rate in Canada.
Other Comprehensive Income
A foreign currency translation loss of $3.3 million resulting from the translation of the Company’s assets and liabilities in its U.S., U.K., European and Australian operations was included in other comprehensive income for the three months ended March 31, 2016 (Q1 2015: gain $3.6 million). A loss primarily reflects the strengthening of the CAD against the foreign currencies during the period, while a gain represents the weakening of the CAD against such currencies. FINANCIAL CONDITION, LIQUIDITY AND CAPITAL RESOURCES
Cash and Working Capital
Cash on hand as at March 31, 2016 was $71.0 million (December 31, 2015: $73.0 million).
Working capital as at March 31, 2016 was $76.8 million (December 31, 2015: $73.9 million). Included in working capital was accounts receivable of $21.8 million (December 31, 2015: $20.0 million), which increased as at March 31, 2016 compared to December 31, 2015 mainly as a result of the normal annual first quarter billing cycle of fees for certain clients.
Cash Flows
During the three months ended March 31, 2016, the Company had a net cash outflow of $2.1 million (Q1 2015: inflow $0.3 million). Funds from operations were $4.4 million during the first quarter of 2016 (Q1 2015: $8.3 million), while total cash outflow from operations was $1.3 million during the first quarter of 2016 (Q1 2015: inflow $0.02 million). Consistent with prior years, the payment of accrued employee staff bonuses for 2015 occurred in the first quarter of 2016.
Cash inflow from financing activities was $0.1 million in the first quarter of 2016 (Q1 2015: $0.3 million) as a result of the issuance of common shares.
Cash outflow from investing activities was $0.1 million in the first quarter of 2016 (Q1 2015: $0.3 million) as a result of the purchase of capital assets.
Solium Capital Inc. MD&A for the quarter ended MARCH 31, 2016 Page 6
Liquidity
The Company believes it will generate sufficient cash and working capital from operations to fund ongoing operations and growth strategies.
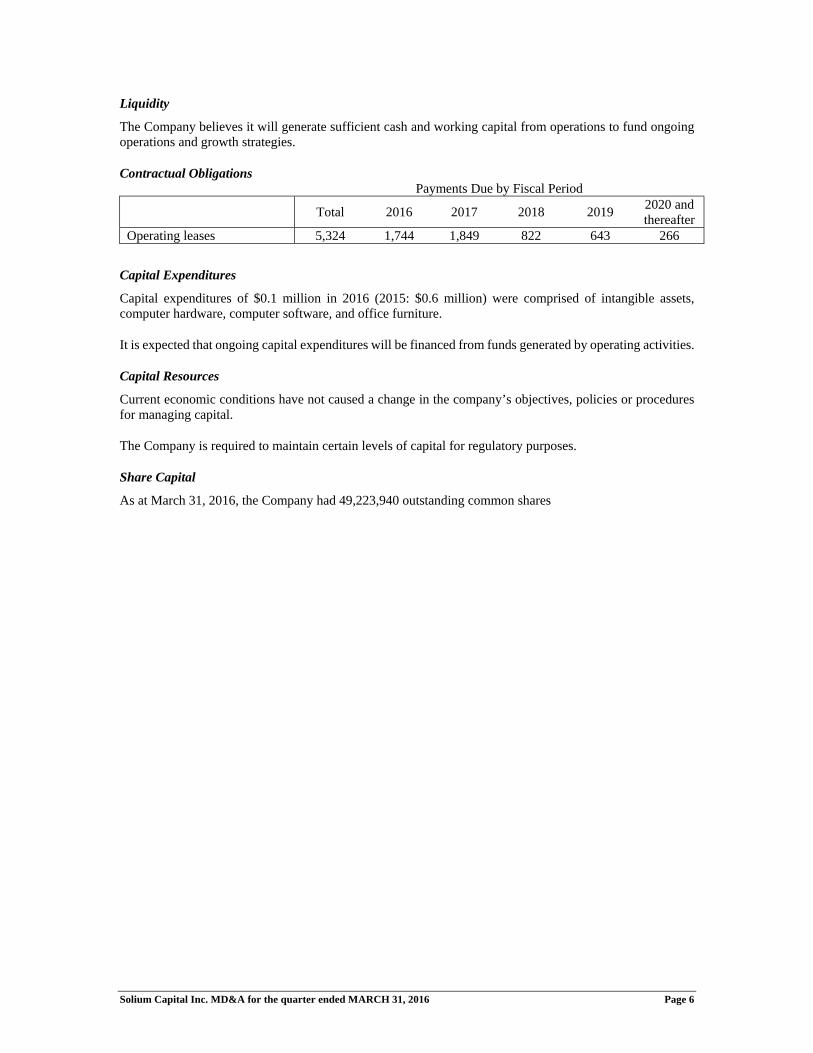
Contractual Obligations Payments Due by Fiscal Period
Total 2016 2017 2018 2019 2020 and thereafter
Operating leases 5,324 1,744 1,849 822 643 266
Capital Expenditures
Capital expenditures of $0.1 million in 2016 (2015: $0.6 million) were comprised of intangible assets, computer hardware, computer software, and office furniture.
It is expected that ongoing capital expenditures will be financed from funds generated by operating activities.
Capital Resources
Current economic conditions have not caused a change in the company’s objectives, policies or procedures for managing capital.
The Company is required to maintain certain levels of capital for regulatory purposes.
Share Capital
As at March 31, 2016, the Company had 49,223,940 outstanding common shares

Solium Capital Inc. MD&A for the quarter ended MARCH 31, 2016 Page 7
SUMMARY OF QUARTERLY RESULTS (In thousands of Canadian dollars except per share amount) The following table summarizes the quarterly results for the eight most recently completed quarters.
2016 2015 2014
Q1 Q4 Q3 Q2 Q1 Q4 Q3 Q2
Revenues2
25,384 22,586 22,451 22,936 24,598 18,680 18,696 20,028
Operating expenses2
22,248 20,879 19,772 19,692 19,301 16,631 16,185 15,868
Earnings from operations2
3,136 1,707 2,679 3,244 5,297 2,049 2,512 4,161
Adjusted EBITDA1, 2
4,407 2,761 3,875 4,388 6,435 2,897 3,699 5,368
Earnings before income taxes2
3,078 3,583 3,541 3,277 6,549 2,209 2,813 3,791
Net earnings 2
1,844 1,809 2,286 2,259 4,332 1,028 1,599 2,434
Per share – basic2 – diluted2
$0.038 $0.037
$0.037 $0.036
$0.047 $0.045
$0.047 $0.045
$0.091 $0.087
$0.021 $0.021
$0.034 $0.032
$0.052 $0.049
Notes: 1. Earnings before interest, taxes, depreciation and amortization (“EBITDA”) and Adjusted EBITDA are non-IFRS financial measures which do not
have any standardized meaning prescribed by IFRS and are therefore unlikely to be comparable to similar measures presented by other issuers. EBITDA and Adjusted EBITDA provide useful information to users as they reflect the net earnings prior to the effect of non-operating expenses such as finance costs, income tax, amortization, foreign exchange gain or loss (on translation of working capital), and gain on derecognition of liability. Management uses Adjusted EBITDA in measuring the financial performance of the Company. Management monitors Adjusted EBITDA against budget and past results on a regular basis. The measure is a component in determining the annual bonus pool for staff and management.
The following is a reconciliation of Adjusted EBITDA to net earnings:
2016 2015 2014 Q1 Q4 Q3 Q2 Q1 Q4 Q3 Q2
Adjusted EBITDA
4,407
2,761
3,875
4,388
6,435
2,897
3,699
5,368
Foreign exchange gain (loss) (838)
1,694
702
(176)
1,010
14
114
(553)
Gain on derecognition of liability 587 - - - - - - -
EBITDA
4,156
4,455
4,577
4,212
7,445
2,911
3,813
4,815
Finance income
193
182
160
209
242
147
188
184
Amortization
(1,271)
(1,054)
(1,196)
(1,144)
(1,138)
(848)
(1,188)
(1,207)
Income tax
(1,234)
(1,774)
(1,255)
(1,018)
(2,217)
(1,182)
(1)
(1,358)
Net earnings
1,844
1,809
2,286
2,259
4,332
1,028
1,599
2,434
2. Comparability of quarterly results is affected by factors such as SRED investment tax credits, fluctuation of foreign currency exchange rates used to translate foreign denominated results into Canadian dollars, and gain on derecognition of liability.
Solium Capital Inc. MD&A for the quarter ended MARCH 31, 2016 Page 8
FACTORS CONTRIBUTING TO QUARTERLY RESULTS
Participant Activity
The transaction based fees collected from participants are affected by several factors, some of which are seasonal. These factors include: (i) grant vesting dates; (ii) grant termination dates; (iii) the pattern of the Canadian population of making retirement contributions in the first quarter of every year; (iv) the stock trading prices for a corporate client relative to an employee participant’s associated option exercise price; and (v) employee participant perceptions of future stock trading prices. Historically, the first three factors contribute to higher transaction based fees in the first quarter of a given year. However, the actual magnitude of transaction based fees for a specific quarter or year is difficult to predict, primarily due to the last two factors. CRITICAL ACCOUNTING ESTIMATES AND JUDGEMENTS
The preparation of the consolidated financial statements in conformity with IFRS requires management to make estimates and assumptions that affect the reported amounts of assets, liabilities and contingent liabilities at the date of the consolidated financial statements and reported amounts of revenues and expenses during the reporting period. Estimates and judgments are continuously evaluated and are based on management’s experience and other factors, including expectations of future events that are believed to be reasonable under the circumstances. Actual outcomes can differ from these estimates.
The key sources of estimation uncertainty that have a significant risk of causing material adjustment to the amounts recognized in the consolidated financial statements are:
Useful lives of property and equipment
The Company estimates the useful lives of property and equipment based on the period over which the assets are expected to be available for use. The estimated useful lives of property and equipment are reviewed periodically and are updated if expectations differ from previous estimates due to physical wear and tear, technical or commercial obsolescence and legal or other limits on the use of the relevant assets. In addition, the estimation of the useful lives of property and equipment are based on internal technical evaluation and experience with similar assets. It is possible, however, that future results of operations could be materially affected by changes in the estimates brought about by changes in factors mentioned above. The amounts and timing of recorded expenses for any period would be affected by changes in these factors and circumstances. A reduction in the estimated useful lives of the property and equipment would increase the recorded expenses and decrease the non-current assets.
Fair value of financial instruments
The estimated fair value of financial assets and liabilities, by their very nature, are subject to measurement uncertainty.
Impairment of non-financial assets
Impairment exists when the carrying value of an asset or cash generating unit exceeds its recoverable amount, which is the higher of its fair value less costs to sell and its value in use. The fair value less costs to sell calculation is based on available data from binding sales transactions in an arm’s length transaction of similar assets or observable market prices less incremental costs for disposing of the asset. The value in use calculation is based on a discounted cash flow model. The cash flows are derived from financial forecasts and do not include restructuring activities that the Company is not yet committed to or significant future investments that will enhance the asset’s performance of the cash generating unit being tested. The recoverable amount is most sensitive to the discount rate used for the discounted cash flow model as well as the expected future cash inflows and the growth rate used for extrapolation purposes. The Company’s goodwill and intangible assets are currently predominantly in the U.S. segment.

Solium Capital Inc. MD&A for the quarter ended MARCH 31, 2016 Page 9
Taxes
Provisions for taxes are made using the best estimate of the amount expected to be paid based on a qualitative assessment of all relevant factors. The Company reviews the adequacy of these provisions at the end of the reporting period. However, it is possible that at some future date an additional liability could result from audits by taxing authorities. Where the final outcome of these tax-related matters is different from the amounts that were initially recorded, such differences will affect the tax provisions in the period in which such determination is made. The Company is currently incurring operating losses in its international segment. Deferred tax assets have not been recognized in respect of these losses because it is not certain that future taxable profit will be available against which the Company can utilize the benefits in the applicable business in these international jurisdictions.
Share-based payment transactions
The Company measures the cost of equity-settled transactions with employees by reference to the fair value of the equity instruments at the date at which they are granted. Estimating fair value for share-based payment transactions requires determining the most appropriate valuation model, which is dependent on the terms and conditions of the grant. This estimate also requires determining and making assumptions about the most appropriate inputs to the valuation model including the expected life, volatility and dividend yield of the share option.
Business combinations
The Company accounts for business combinations using the acquisition method, under which it allocates the excess of the purchase price of business acquisitions over the fair value of identifiable net assets acquired to goodwill. One of the most significant estimates relates to the determination of the fair value of the assets and liabilities acquired. For any intangible asset identified, depending on the type of intangible asset and the complexity of determining its fair value, purchase price allocations are derived from a formal valuation, which, where appropriate, is performed by an independent third party valuation expert. Fair values are determined using appropriate valuation techniques, which are generally based on a forecast of the total expected future net cash flows and are closely linked to the assumptions made by management regarding the future performance of the assets concerned and the discount rate applied.
Any goodwill or intangible assets with indefinite useful lives acquired in business combinations are not amortized to income over their useful lives but are assessed annually for any potential impairment in value.
All other intangible assets are amortized to operations over their estimated useful lives. The Company’s intangible assets relate to acquired technology, brand, customer relationships and non-compete agreements. The Company also reviews the carrying value of amortizable intangible assets for impairment whenever events and circumstances indicate that the carrying value of an asset may not be recoverable from the estimated future cash flows expected from its use and eventual disposition. In assessing the recoverability of these intangible assets, the Company must make assumptions regarding estimated future cash flows, market conditions and other factors to determine the fair value of the assets. If these estimates or related assumptions change in the future, the Company may be required to record impairment charges for these assets. The Company’s goodwill and intangible assets currently are predominantly in the U.S. segment. FUTURE ADOPTION OF ACCOUNTING PRONOUNCEMENTS
i) IFRS 9 ‘Financial instruments’ was issued by the IASB in July 2014 as a complete standard, including the requirements previously issued related to classification and measurement of financial assets and liabilities, and additional amendments to introduce a new expected loss impairment model for financial assets including credit losses. Retrospective application of this standard with certain exemptions is effective for fiscal years beginning on or after January 1, 2018, with earlier application permitted.
ii) IFRS 15 ‘Revenue from contracts with customers’ was issued by the IASB in May 2014. IFRS 15 replaces existing revenue recognition guidance and provides a single, principles-based five-step model to be applied to all contracts with customers. Retrospective application of this standard is effective for fiscal years beginning on or after January 1, 2018, with earlier application permitted.
Solium Capital Inc. MD&A for the quarter ended MARCH 31, 2016 Page 10
iii) IFRS 16 ‘Leases’ was issued by the IASB in January 2016. IFRS 16 replaces the existing standard (IAS 17) and requires the recognition of most leases on the balance sheet. IFRS 16 effectively removes the classification of leases as either finance or operating leases and treats all leases as finance leases for lessees with exemptions for short-term leases where the term is twelve months or less and for leases of low value items. The accounting treatment for lessors remains the same. IFRS 16 is effective January 1, 2019, with earlier application permitted.
The Company is in the process of assessing the impact of the adoption of these standards and interpretation on the Company’s consolidated financial statements. FINANCIAL INSTRUMENTS Exposure to counterparty credit risk, interest rate risk and foreign currency risk arises in the normal course of the Company’s business. The Company currently does not enter into derivative financial instruments to reduce exposure to fluctuations in any of the risks impacting the Company’s operations.
The Company has credit risk as a result of its trade accounts receivable. The concentration of credit risk is limited due to the fact that the customer base is large and unrelated. As such, the Company does not anticipate any significant credit losses.
The Company has foreign exchange risk because it is exposed to foreign currency fluctuations due to its U.S. and International operations.
The Company currently has no interest rate risk as the Company has no long-term debt outstanding. DISCLOSURE CONTROLS
The Company has a Corporate Disclosure Policy in place to ensure that communications with the public about the Company are timely, factual and accurate; disseminated in accordance with all applicable legal and regulatory requirements; and that all material information in respect of the Company is communicated to the Chief Executive Officer and the Executive Vice President (EVP), Finance, and where appropriate, the Board of Directors and/or committees thereof. The Company’s Chief Executive Officer and EVP, Finance have concluded that the Company’s disclosure controls and procedures are effective to provide reasonable assurance that information required to be disclosed by the Company in its annual filings, interim filings or other reports or submitted under securities legislation is recorded, processed, summarized and reported within the time periods specified in the securities legislation and include controls and procedures designed to ensure that information required to be disclosed in the annual filings, interim filings or other reports filed or submitted under securities legislation is accumulated and communicated to the Company’s management, including its certifying officers, as appropriate to allow timely decisions regarding required disclosure.
It should be noted that while the Chief Executive Officer and EVP, Finance believe that the disclosure controls and procedures will provide a reasonable level of assurance and that they are effective, they do not expect that the disclosure controls and procedures will prevent all errors and fraud. A control system, no matter how well conceived or operated, can provide only reasonable, not absolute assurance that the objectives of the control system are met.
INTERNAL CONTROL OVER FINANCIAL REPORTING
The Chief Executive Officer and EVP, Finance of Solium are responsible for designing internal controls over financial reporting or causing them to be designed under their supervision in order to provide reasonable assurance regarding the reliability of financial reporting and the preparation of financial statements for external purposes in accordance with IFRS. Due to its inherent limitations, internal control over financial reporting may not prevent or detect misstatements on a timely basis. Also, projections of any evaluation of the effectiveness of internal control over financial reporting to future periods are subject to the risk that the controls may become inadequate
Solium Capital Inc. MD&A for the quarter ended MARCH 31, 2016 Page 11
because of changes in conditions, or that the degree of compliance with the policies or procedures may deteriorate. Management assessed the effectiveness of the Company’s internal control over financial reporting as of December 31, 2015, based on the criteria set forth in Internal Control – Integrated Framework issued by the Committee of Sponsoring Organizations of the Treadway Commission. Based on that assessment, management concluded that, as of December 31, 2015, the Company’s internal control over financial reporting was effective based on the criteria established in the Internal Control – Integrated Framework. Also, management determined that there were no material weaknesses in Solium’s internal control over financial reporting as of December 31, 2015. No changes were made in the Company’s internal control over financial reporting during the period beginning January 1, 2016 and ended March 31, 2016 that have materially affected, or are reasonably likely to materially affect, the Company’s internal control over financial reporting. OUTSTANDING SHARE DATA The Company is authorized to issue an unlimited number of common shares and an unlimited number of preferred shares. As at the date of this MD&A, there were 49,247,558 common shares outstanding. Employees, directors, officers and consultants have been granted options to purchase common shares under a stock option plan. As at the date of this MD&A, there were options outstanding to purchase 3,189,665 common shares. Employees have been granted rights to receive common shares under a share award incentive plan. As at the date of this MD&A, there were 533,537 restricted share units outstanding.
OUTLOOK One of Solium’s key strategic objectives is currently the penetration into global companies. Leading indicators of success in this strategy recently include the following:
The Company has had success in selling modules and services related to global regulatory and tax compliance (Shareworks Global Compliance) to multinational companies, including several Fortune 100 companies. This indicates growing awareness of the breadth and sophistication of our offering, and creates the opportunity to eventually win the full mandate for the clients’ overall equity administration programs.
Solium will be opening a client service center of excellence in Barcelona in 2016, to increase the depth of its team in Spain and increased support for continental Europe operations. The Barcelona center will roll out in the second half of 2016 and will include a multi-language call center and become the center of expertise for the Shareworks Global Compliance product and service.
Solium had the honor in April 2016 of accepting, on behalf of two clients, separate global awards for equity compensation initiatives. These are given out each spring by the industry association GEO (Global Equity Organization), an organization focused on equity compensation administration practices for corporate issuers. These awards indicate the increasing enablement and advancement that Solium is bringing to the overall profession, which is further evidence of becoming the industry leader on the global stage.
RISK ASSESSMENT Management defines risk as the evaluation of probability that an event might happen in the future that could negatively affect the financial condition and/or results of operations of the Company. The risks that could affect the Company have been described in the MD&A included in the Company’s Annual Report for the
Solium Capital Inc. MD&A for the quarter ended MARCH 31, 2016 Page 12
year ended December 31, 2015. The risks identified therein do not constitute an exhaustive list of all possible risks which may impact the Company as there may be additional risks of which management is currently unaware of. As it is difficult to predict whether any risk will happen or its related consequences, the actual effect of any risk on the business could be materially different from what is anticipated.
CONDENSED CONSOLIDATED INTERIM FINANCIAL STATEMENTS For the three months ended March 31, 2016 (Unaudited)
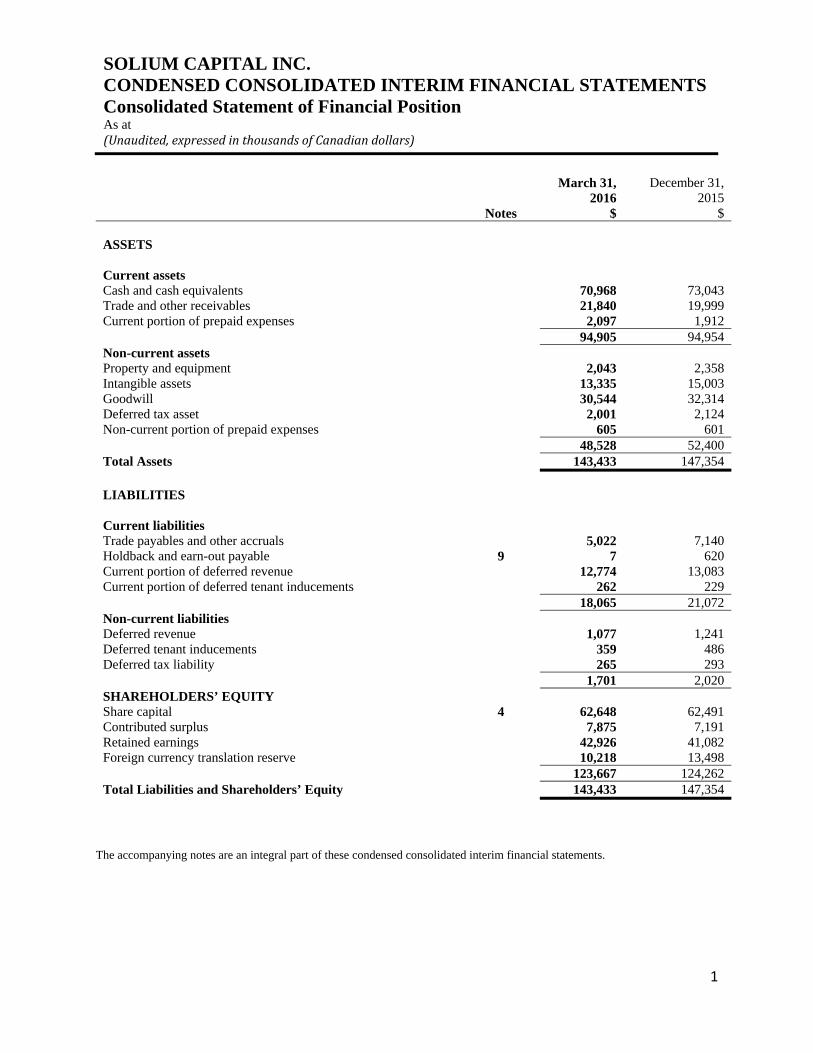
SOLIUM CAPITAL INC. CONDENSED CONSOLIDATED INTERIM FINANCIAL STATEMENTS Consolidated Statement of Financial Position As at (Unaudited,expressedinthousandsofCanadiandollars)
1
March 31, 2016
December 31, 2015
Notes $ $ ASSETS Current assets Cash and cash equivalents 70,968 73,043 Trade and other receivables 21,840 19,999 Current portion of prepaid expenses 2,097 1,912 94,905 94,954 Non-current assets Property and equipment 2,043 2,358 Intangible assets 13,335 15,003 Goodwill 30,544 32,314 Deferred tax asset 2,001 2,124 Non-current portion of prepaid expenses 605 601 48,528 52,400 Total Assets 143,433 147,354 LIABILITIES Current liabilities Trade payables and other accruals 5,022 7,140 Holdback and earn-out payable 9 7 620 Current portion of deferred revenue 12,774 13,083 Current portion of deferred tenant inducements 262 229 18,065 21,072 Non-current liabilities Deferred revenue 1,077 1,241 Deferred tenant inducements 359 486 Deferred tax liability 265 293 1,701 2,020 SHAREHOLDERS’ EQUITY Share capital 4 62,648 62,491 Contributed surplus 7,875 7,191 Retained earnings 42,926 41,082 Foreign currency translation reserve 10,218 13,498 123,667 124,262 Total Liabilities and Shareholders’ Equity 143,433 147,354
The accompanying notes are an integral part of these condensed consolidated interim financial statements.
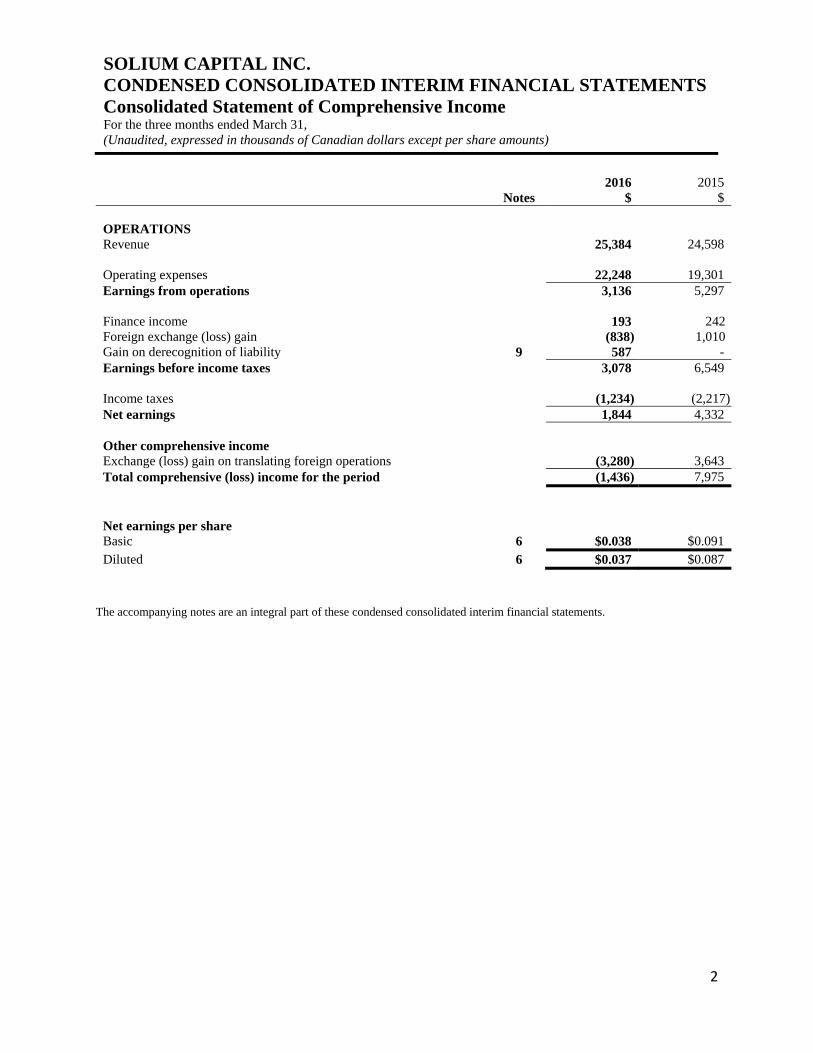
SOLIUM CAPITAL INC. CONDENSED CONSOLIDATED INTERIM FINANCIAL STATEMENTS Consolidated Statement of Comprehensive Income For the three months ended March 31, (Unaudited, expressed in thousands of Canadian dollars except per share amounts)
2
2016 2015 Notes $ $ OPERATIONS Revenue 25,384 24,598 Operating expenses 22,248 19,301 Earnings from operations 3,136 5,297 Finance income 193 242Foreign exchange (loss) gain (838) 1,010Gain on derecognition of liability 9 587 - Earnings before income taxes 3,078 6,549 Income taxes (1,234) (2,217)Net earnings 1,844 4,332 Other comprehensive income Exchange (loss) gain on translating foreign operations (3,280) 3,643 Total comprehensive (loss) income for the period (1,436) 7,975 Net earnings per share Basic 6 $0.038 $0.091 Diluted 6 $0.037 $0.087
The accompanying notes are an integral part of these condensed consolidated interim financial statements.

SOLIUM CAPITAL INC. CONDENSED CONSOLIDATED INTERIM FINANCIAL STATEMENTS Consolidated Statement of Changes in Equity For the three months ended March 31, 2016 (Unaudited, expressed in thousands of Canadian dollars)
3
Share capital Contributed
surplus Retained earnings
Foreign currency
translation reserve
Total equity
$ $ $ $ $ As at January 1, 2015 57,820 6,021 30,396 5,757 99,994
Net earnings - - 4,332 - 4,332 Foreign currency translation differences for foreign
operations, net of tax
-
-
-
3,643
3,643 Share-based compensation expense, net of tax - 644 - - 644
Share unit releases, net of tax 3 (3) - - -
Stock options exercised, net of tax 552 (212) - - 340
Transaction costs, net of tax (30) - - - (30)
As at March 31, 2015 58,345 6,450 34,728 9,400 108,923
Net earnings - - 6,354 - 6,354 Foreign currency translation differences for foreign
operations, net of tax
-
-
-
4,098
4,098 Share-based compensation expense, net of tax - 2,383 - - 2,383
Share unit releases, net of tax 514 (410) - - 104
Stock options exercised, net of tax 3,632 (1,232) - - 2,400
Transaction costs, net of tax - - - - -
As at December 31, 2015 62,491 7,191 41,082 13,498 124,262
Net earnings - - 1,844 - 1,844 Foreign currency translation differences for foreign
operations, net of tax
-
-
-
(3,280) (3,280)Share-based compensation expense, net of tax - 745 - - 745
Stock options exercised, net of tax 157 (61) - - 96
As at March 31, 2016 62,648 7,875 42,926 10,218 123,667
The accompanying notes are an integral part of these condensed consolidated interim financial statements.
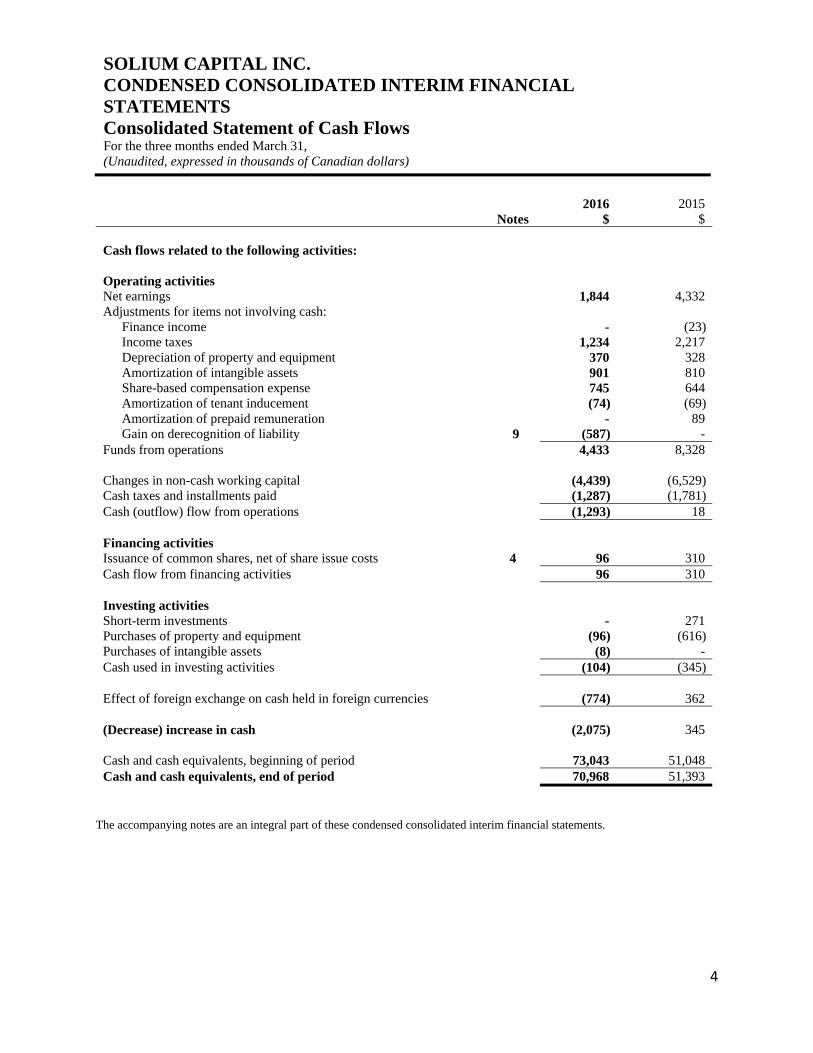
SOLIUM CAPITAL INC. CONDENSED CONSOLIDATED INTERIM FINANCIAL STATEMENTS Consolidated Statement of Cash Flows For the three months ended March 31, (Unaudited, expressed in thousands of Canadian dollars)
4
2016 2015 Notes $ $ Cash flows related to the following activities: Operating activities Net earnings 1,844 4,332 Adjustments for items not involving cash:
Finance income - (23)Income taxes 1,234 2,217 Depreciation of property and equipment 370 328 Amortization of intangible assets 901 810 Share-based compensation expense 745 644 Amortization of tenant inducement (74) (69)Amortization of prepaid remuneration - 89 Gain on derecognition of liability 9 (587) -
Funds from operations 4,433 8,328
Changes in non-cash working capital (4,439) (6,529)Cash taxes and installments paid (1,287) (1,781)Cash (outflow) flow from operations (1,293) 18 Financing activities Issuance of common shares, net of share issue costs 4 96 310 Cash flow from financing activities 96 310 Investing activities Short-term investments - 271 Purchases of property and equipment (96) (616)Purchases of intangible assets (8) - Cash used in investing activities (104) (345) Effect of foreign exchange on cash held in foreign currencies
(774) 362
(Decrease) increase in cash (2,075) 345 Cash and cash equivalents, beginning of period 73,043 51,048 Cash and cash equivalents, end of period 70,968 51,393
The accompanying notes are an integral part of these condensed consolidated interim financial statements.

SOLIUM CAPITAL INC. Notes to the Condensed Consolidated Interim Financial Statements As at March 31, 2016 and for the three months ended March 31, 2016 and 2015 (Unaudited, expressed in thousands of Canadian dollars, except as otherwise noted)
5
1 General Information Solium Capital Inc. (“Solium” or the “Company”) was incorporated in September of 1999 under the laws of the Province of Alberta. Solium Capital Inc. (TSX: SUM) provides cloud-enabled services for global equity administration, financial reporting and compliance. From operation centers in the United States, Canada, the United Kingdom, Europe, and Australia, the Company’s software-as-a-service (SaaS) technology powers share plan administration and equity transactions for more than 3,000 corporate clients with employee participants in more than 100 countries. Solium's technology platforms, Shareworks and Transcentive, are leading online solutions that integrate the management of multiple equity plan types including stock options, share units, share appreciation rights, restricted stock awards, and employee share purchase plans. The Company generates revenue predominantly from recurring license and subscription fees, and from transaction based fees. The address of the registered office is 1500, 800 – 6th Avenue SW, Calgary, Alberta, T2P 3G3.
2 Basis of preparation Statement of compliance These condensed consolidated interim financial statements present Solium’s financial results of operations and financial position prepared in accordance with International Accounting Standard 34 – Interim Financial Reporting (“IAS 34”) as at and for the three months ended March 31, 2016, including 2015 comparative periods. The condensed consolidated interim financial statements are prepared using accounting policies consistent with the Company’s annual audited consolidated financial statements issued under International Financing Reporting Standards (“IFRS”) for the year ended December 31, 2015. The condensed consolidated interim financial statements do not include all information required for full annual financial statements and should be read in conjunction with the consolidated financial statements of the Company as at and for the year ended December 31, 2015.
3 Significant accounting policies Revision of useful lives of intangible assets Effective January 1, 2016, acquired customer contracts for US private market subsidiaries are amortized using 7 years of useful life instead of 10 years applied previously. The change in amortization rate reflects the increased turnover of customers and average attrition rate. The effect of the change in estimate has been accounted for on a prospective basis.
4 Share capital The Company has authorized an unlimited number of common shares and an unlimited number of preferred shares.
Number of Amount Shares $ Issued - common shares Balance, January 1, 2015 47,819,549 57,820
Issued on exercise of stock options, net of tax 1,237,271 4,184 Issued on vesting of share units, net of tax 120,995 517 Share issue costs, net of tax - (30) Balance, December 31, 2015 49,177,815 62,491
Issued on exercise of stock options, net of tax 46,125 157 Balance, March 31, 2016 49,223,940 62,648
SOLIUM CAPITAL INC. Notes to the Condensed Consolidated Interim Financial Statements As at March 31, 2016 and for the three months ended March 31, 2016 and 2015 (Unaudited, expressed in thousands of Canadian dollars, except as otherwise noted)
6
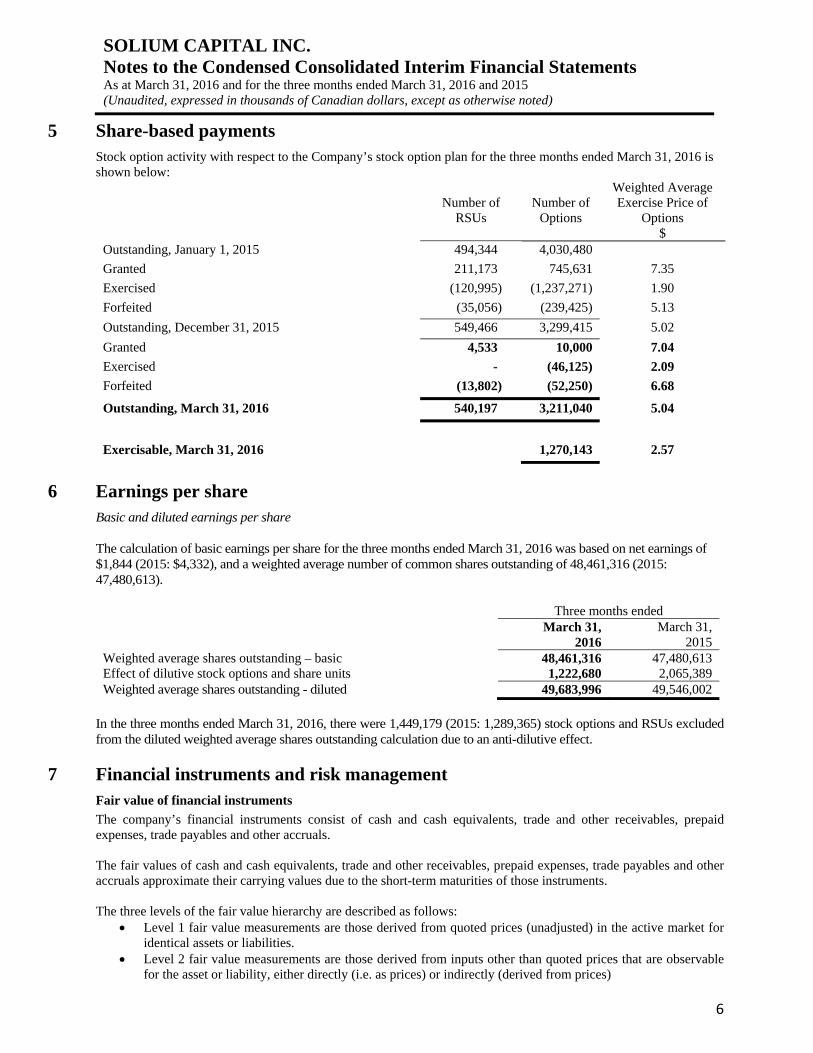
5 Share-based payments Stock option activity with respect to the Company’s stock option plan for the three months ended March 31, 2016 is shown below:
Weighted Average Number of
RSUs Number of
Options Exercise Price of
Options $ Outstanding, January 1, 2015 494,344 4,030,480
Granted 211,173 745,631 7.35
Exercised (120,995) (1,237,271) 1.90
Forfeited (35,056) (239,425) 5.13
Outstanding, December 31, 2015 549,466 3,299,415 5.02
Granted 4,533 10,000 7.04
Exercised - (46,125) 2.09
Forfeited (13,802) (52,250) 6.68
Outstanding, March 31, 2016 540,197 3,211,040 5.04
Exercisable, March 31, 2016 1,270,143 2.57
6 Earnings per share Basic and diluted earnings per share The calculation of basic earnings per share for the three months ended March 31, 2016 was based on net earnings of $1,844 (2015: $4,332), and a weighted average number of common shares outstanding of 48,461,316 (2015: 47,480,613).
Three months ended March 31,
2016 March 31,
2015 Weighted average shares outstanding – basic 48,461,316 47,480,613 Effect of dilutive stock options and share units 1,222,680 2,065,389 Weighted average shares outstanding - diluted 49,683,996 49,546,002
In the three months ended March 31, 2016, there were 1,449,179 (2015: 1,289,365) stock options and RSUs excluded from the diluted weighted average shares outstanding calculation due to an anti-dilutive effect.
7 Financial instruments and risk management Fair value of financial instruments
The company’s financial instruments consist of cash and cash equivalents, trade and other receivables, prepaid expenses, trade payables and other accruals. The fair values of cash and cash equivalents, trade and other receivables, prepaid expenses, trade payables and other accruals approximate their carrying values due to the short-term maturities of those instruments. The three levels of the fair value hierarchy are described as follows:
Level 1 fair value measurements are those derived from quoted prices (unadjusted) in the active market for identical assets or liabilities.
Level 2 fair value measurements are those derived from inputs other than quoted prices that are observable for the asset or liability, either directly (i.e. as prices) or indirectly (derived from prices)
SOLIUM CAPITAL INC. Notes to the Condensed Consolidated Interim Financial Statements As at March 31, 2016 and for the three months ended March 31, 2016 and 2015 (Unaudited, expressed in thousands of Canadian dollars, except as otherwise noted)
7
Level 3 fair value measurements are those derived from valuation techniques that include inputs for the asset or liability that are not based on observable market data (unobservable inputs).
Risk management
Exposure to counterparty credit risk and foreign currency risk arises in the normal course of the Company’s business. The Company currently does not enter into derivative financial instruments to reduce exposure to fluctuations in any of the risks impacting the Company’s operations. Credit risk
Credit risk refers to the risk that a counterparty will default on its contractual obligations resulting in financial loss to the Company. The Company has credit risk as a result of its trade accounts receivable. Trade accounts receivable consists of a large number of customers, spread across diverse industries. The concentration of credit risk is limited due to the fact that the customer base is large and unrelated. As such, the Company does not anticipate any significant credit losses. The Company does not have significant credit risk exposure to any single counterparty. Total trade accounts receivable (net of allowances) held by the Company at March 31, 2016 amounted to $15,247 (December 31, 2015: 14,367). Allowances are provided against trade accounts receivable based on estimated unrecoverable amounts. In determining the recoverability of a trade accounts receivable, the Company considers the client’s financial position, service history and payment history. The credit risk on cash is limited because the counterparties are banks with high credit-ratings assigned by international credit-rating agencies. Foreign Currency risk
The Company has foreign currency risk mainly because it is exposed to foreign currency fluctuations due to its operations in the United States (U.S.), United Kingdom (U.K.), Europe, and Australia. The Company operates in Canada, the U.S., the U.K., Europe, and Australia. The Company’s functional currency is Canadian dollars (CAD) and the reporting currency is CAD. Foreign exchange risk arises because the amount receivable on revenue or payable on expenditures that are denominated in U.S. dollars (“USD”), British Sterling Pound (“GBP”), European euros (“EUR”), and Australian dollars (“AUD”) may vary when converted to CAD due to changes in exchange rates arising from timing differences between when the revenue or expense occurs and when actual payment is received or made (“transaction exposures”) and because the foreign currency denominated net assets of the Company’s foreign subsidiaries may vary on consolidation and revaluation into CAD (“translation exposure”). Based on the balance of net monetary assets carried on the consolidated statement of financial position of the Canadian operations as at March 31, 2016, an increase of 1% in the exchange rate of foreign currency to CAD would, everything else being equal, have had a positive effect on earnings before taxes for the three months ended and retained earnings as at March 31, 2016 of approximately $217 (December 31, 2015: $242). Based on the balance of net assets carried in the statement of financial position of the U.S., U.K., Europe, and Australia operations as at March 31, 2016, an increase of 1% in the exchange rate of USD, GBP, EURO, and AUD to CAD would, everything else being equal, have had a positive effect on other comprehensive income for the three months ended and foreign currency translation reserve as at March 31, 2016 of approximately $379 (December 31, 2015: $358). Liquidity risk
Liquidity risk is the risk that the Company will not have sufficient funds to meet its obligations as they come due. The Company’s objective in managing liquidity risk is to maintain sufficient readily available reserves in order to meet its liquidity requirements at any point in time. The Company achieves this by maintaining sufficient cash through the availability of funding from committed credit facilities. As at March 31, 2016, the Company had cash and cash equivalents of $70,968 (December 31, 2015: 73,043).
SOLIUM CAPITAL INC. Notes to the Condensed Consolidated Interim Financial Statements As at March 31, 2016 and for the three months ended March 31, 2016 and 2015 (Unaudited, expressed in thousands of Canadian dollars, except as otherwise noted)
8
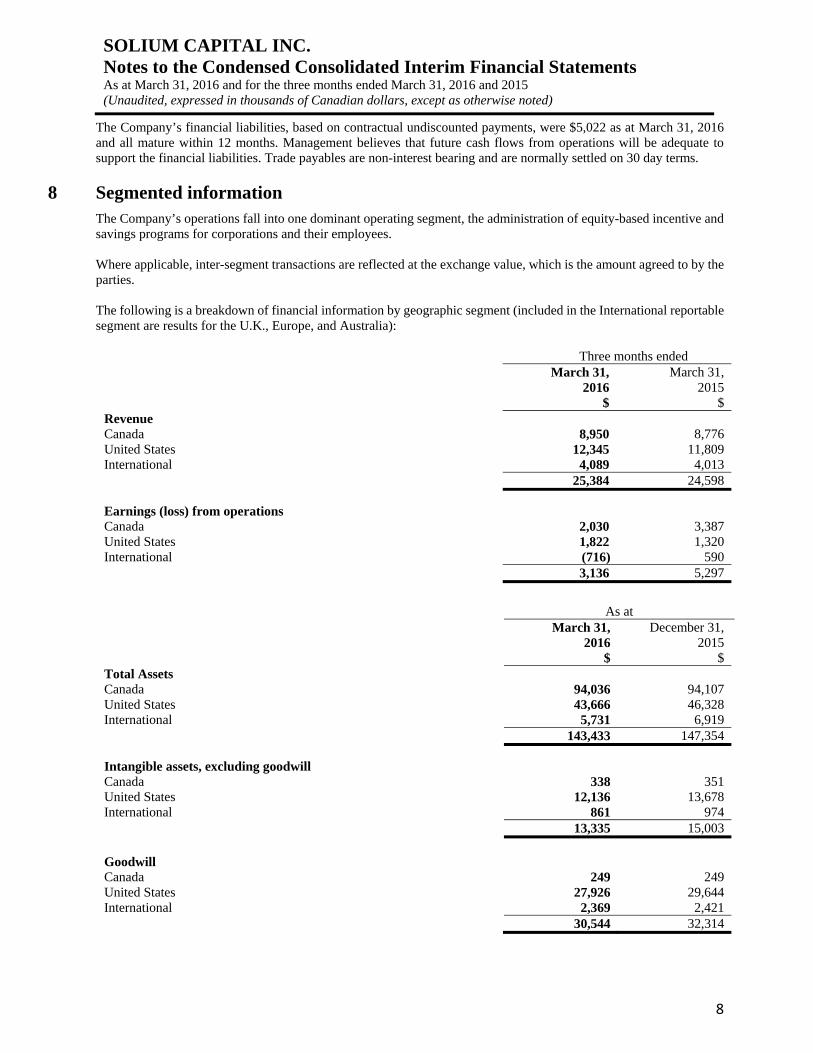
The Company’s financial liabilities, based on contractual undiscounted payments, were $5,022 as at March 31, 2016 and all mature within 12 months. Management believes that future cash flows from operations will be adequate to support the financial liabilities. Trade payables are non-interest bearing and are normally settled on 30 day terms.
8 Segmented information The Company’s operations fall into one dominant operating segment, the administration of equity-based incentive and savings programs for corporations and their employees.
Where applicable, inter-segment transactions are reflected at the exchange value, which is the amount agreed to by the parties. The following is a breakdown of financial information by geographic segment (included in the International reportable segment are results for the U.K., Europe, and Australia):
Three months ended
March 31,
2016 $
March 31, 2015
$ Revenue Canada 8,950 8,776 United States 12,345 11,809 International 4,089 4,013 25,384 24,598
Earnings (loss) from operations Canada 2,030 3,387 United States 1,822 1,320 International (716) 590 3,136 5,297
As at
March 31,
2016 $
December 31, 2015
$ Total Assets Canada 94,036 94,107 United States 43,666 46,328 International 5,731 6,919 143,433 147,354
Intangible assets, excluding goodwill Canada 338 351 United States 12,136 13,678 International 861 974 13,335 15,003 Goodwill Canada 249 249 United States 27,926 29,644 International 2,369 2,421 30,544 32,314
SOLIUM CAPITAL INC. Notes to the Condensed Consolidated Interim Financial Statements As at March 31, 2016 and for the three months ended March 31, 2016 and 2015 (Unaudited, expressed in thousands of Canadian dollars, except as otherwise noted)
9
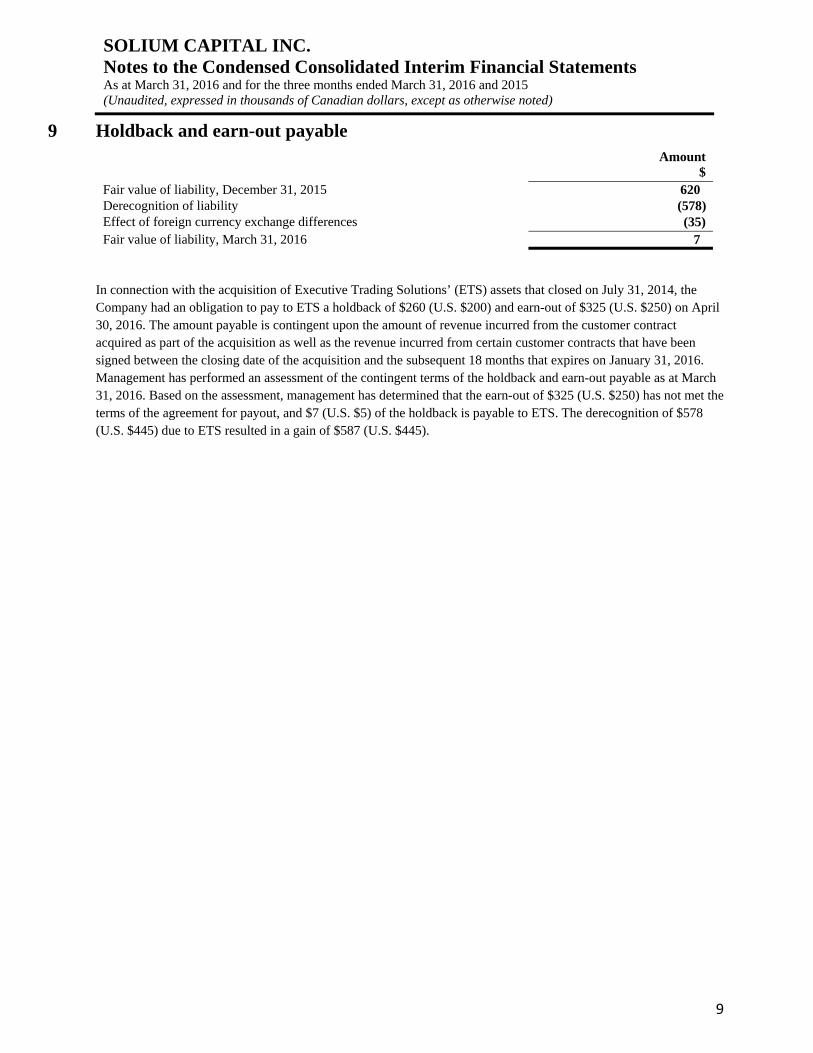
9 Holdback and earn-out payable Amount
$ Fair value of liability, December 31, 2015 620 Derecognition of liability (578) Effect of foreign currency exchange differences (35) Fair value of liability, March 31, 2016 7
In connection with the acquisition of Executive Trading Solutions’ (ETS) assets that closed on July 31, 2014, the Company had an obligation to pay to ETS a holdback of $260 (U.S. $200) and earn-out of $325 (U.S. $250) on April 30, 2016. The amount payable is contingent upon the amount of revenue incurred from the customer contract acquired as part of the acquisition as well as the revenue incurred from certain customer contracts that have been signed between the closing date of the acquisition and the subsequent 18 months that expires on January 31, 2016. Management has performed an assessment of the contingent terms of the holdback and earn-out payable as at March 31, 2016. Based on the assessment, management has determined that the earn-out of $325 (U.S. $250) has not met the terms of the agreement for payout, and $7 (U.S. $5) of the holdback is payable to ETS. The derecognition of $578 (U.S. $445) due to ETS resulted in a gain of $587 (U.S. $445).