Embed Size (px)
Citation preview

Process Metallurgy
steel research int 77 (2006) No.7 1
Solidification and Particle Entrapment during Continuous Casting of Steel C. Pfeiler1), B. G. Thomas2), M. Wu1), A. Ludwig1), A. Kharicha1) 1) Christian-Doppler Laboratory for Multiphase Modeling of Metallurgical Processes, Department of Metallurgy, University of Leoben, Franz-Josef-Str. 18, 8700 Leoben, Austria, [email protected] 2) Department of Mechanical Science & Engineering, University of Illinois at Urbana-Champaign, 1206 West Green Street, Urbana, IL 61801, USA, [email protected] Avoiding particle entrapment into the solidifying shell of a steel continuous caster is important to improve the quality of the continuous cast product. Therefore, the fluid flow dynamics in the steel melt and mushy zone, heat transfer and solidification of the steel shell, as well as the motion and entrapment of inclusion particles during the casting process were investigated using computational models. Solidification of the strand shell is modelled with an enthalpy-formulation by assuming a columnar morphology in the mushy zone. The motion of particles is tracked with a Lagrangian approach. When the particles reach the solidification front they can be entrapped/engulfed into the solid shell or pushed away from the solidification front, depending on the mushy zone morphology and the forces acting on them. The current paper focuses on the mould region at a steel continuous caster, including the submerged entry nozzle (SEN) and 1.2 m length of the strand. The results are validated with plant measurements and demonstrate the potential of the model to predict fluid flow, shell growth and the posi-tions and the amount of entrapped/engulfed particles in the solidifying strand. Keywords: particle, inclusions, entrapment, continuous casting, solidification, mould, latent heat
Introduction
During steelmaking non-metallic inclusions, originating from deoxidation, chemical reactions with the refractories, dislogged nozzle clogging materials, entrainment of ladle slag and casting slag, can be brought into the final steel product, and deteriorate its quality. Continuous casting is the last procedure having molten steel in the production chain of steelmaking. It is the last opportunity to remove the remaining inclusions from the steel melt. Most non-metallic inclusions have a lower density than the steel. It is believed that they would rise in the mould region and finally be collected and removed by the covering slag with some metallurgical methods, e.g. purging with argon gas and/or electromagnetical stirring. Some successes were achieved, but there are still inclusions remaining in the steel melt. With an increase of the casting speed, espe-cially in the case of thin slab casting, the removal of inclu-sions is more difficult. Understanding of the transport of the non-metallic particles in the steel melt, of the interac-tion of the particles with the solidification front, and of the entrapment-engulfment into the solidified shell is essential.
Many theoretical approaches were done in the past to understand the interaction of particles with a solidifying interface. The models include the effect of the solid-liquid interface shape on the drag due to inflowing liquid into the gap between the particle and the solidification front and the effect of the particle roughness [1]. Thermal, solute and gravitational effects on the solid-liquid interface and the repulsive force implementing surface energies was examined [2 - 4]. Due to the complexity of the phenome-non people still discuss and improve the analytical models [5 - 8]
These theoretical approaches have to be compared with experiments, e.g. polystyrene particles suspended in water or NaCl solution [9, 10]. In-situ measurements in experi-ments using CCD camera [11], digital microscope [12] or
laser microscope for metals [13] have determined the critical interface velocity for pushing or engulfment and the movement of inclusions/bubbles from or into the so-lidified front. Considering turbulent flow the engulfment of inclusions shows probabilistically behaviour [9].
Computer simulations were also used to do small scale studies in this field. Garvin developed a multi scale model to simulate the transport at the scale of the particle dimen-sion coupled with intermolecular interactions and lubrica-tion forces in a thin layer of the melt between the particle and the front to determine the overall dynamics of the interaction [14, 15]. For industrial purpose, it is important to have an engineering scale simulation which can predict the amount, size, type and entrapment regions of inclu-sions. Only recently the entrapment under engineering scale is modelled. A balance between forces acting be-tween particles, the surrounding fluid, and a solidification front, which is assumed to be a wall boundary, was derived by Yuan [16]. The dendritic tip front was defined as a wall boundary.
In-situ measurements on a caster are extremely difficult and rough due to the high temperature and the closed sys-tem. Therefore simulation becomes an important tool to get knowledge about the conditions in a steel continuous caster.
Great modelling efforts were made to study the melt flow in the molten pool [17 - 20] and, very recently, also to investigate directly the influence of the flow on the trans-port of inclusions [21 - 26].
The purpose of the current work is to establish a general model to describe the motion of particles during solidifica-tion in a steel continuous caster, and to predict the amount and positions of the entrapped particles in the solidified shell using the commercial CFD Software FLUENT and user defined subroutines. Based on the capacity of the recent computer hardware, the model can be used by in-dustry with reasonable calculation cost to aid in optimizing the process parameters and the design of the submerged

Process Metallurgy
steel research int 77 (2006) No.7 2
entry nozzles. To validate the present model, comparisons with experimental measurements on a breakout shell have been performed [27].
Model Description
Solidification. The energy conservation equation of the enthalpy-formulation is
( ) ( ) Leff QTkhuth +∇⋅∇=⋅∇+
∂∂ ρρ , (1)
where, h is the sensitive enthalpy defined as
∫+=T
Tpref
ref
dTchh . (2)
href is the reference enthalpy at the reference temperature Tref and cp is the specific heat. ρ is the density of the melt, u the velocity and keff is the effective conductivity which is defined as keff = k + kt. Here, k defines the thermal con-ductivity of the material and kt is the turbulent thermal conductivity.
The source term QL concerning the latent heat in a single phase solidification model can be written as
spulls
L fuLtfLQ ∇⋅+
∂∂= ρρ . (3)
Two terms have to be considered to treat the latent heat, the explicit latent heat term, tfL s ∂∂ρ , and the convective term, spull fuL ∇⋅ρ . The relationship between solid fraction fs and the temperature was calculated with IDS [28] for the given steel composition of a 434 stainless steel assuming non-equilibrium cooling conditions. The Tfs − relation-ship is shown in Figure 1.
The latent heat, L, is released in the mushy zone. In steel continuous casting the solidifying shell is moving down-wards with a constant casting velocity pullu . The melt which is being solidified has the speed of the solidifying shell. One interesting point worthy mentioning is the treatment of the convective part of the latent heat. As de-rived in the Appendix, the latent heat which belongs inher-ently to the liquid phase should advect with the melt con-vection, ( )Luf llρ⋅∇ , before it is released due to solidifica-tion. Unfortunately, the liquid velocity in the mushy zone is not explicitly computed in the current model. Therefore, the above mentioned advection term is estimated by using the mass conservation equation.
The mass and momentum conservation equations are
given by
0=⋅∇ u , (4)
( ) ( ) Deff Supuutu +⋅∇∇+−∇=⊗⋅∇+
∂∂ μρρ , (5)
where µeff = µl + µt is the effective viscosity due to turbu-lence, for which the standard k-ε model is used. µl is the dynamic viscosity, µt, is the turbulent viscosity, which is
defined by µt = ρCµk²/ε with Cµ = 0.09 and p is the static pressure. The pressure drop caused by the presence of solid material is considered as a momentum sink DS in the momentum conservation equation. The mushy zone is treated as a porous region with volume fraction of pores equal to the liquid fraction fl. The momentum sink for steel, applying the Blake-Kozeny law, is taken from [29]:
( ) ( )pulll
l
lD uu
ffS −−−= 2
13
2 16601λ
μ . (6)
Here, λ1 is the primary dendrite arm spacing of the so-lidified strand. Corresponding sink terms are also added to all of the turbulence equations in the mush and solidified areas.
Particle tracking. Particles are considered as discrete spheres of a secondary phase dispersed in the melt. The trajectories of these particles are tracked by integrating the equation of motion in a Lagrangian frame of reference considering the drag force, the gravitational force, the lift force, the virtual mass force and the pressure and stress gradient forces, as given in the terms on the right-hand-side (RHS) of the following equation:
( )
.6
12
6181
3
3
3
2
DtuDd
dtud
DtuDd
Fgd
uuuuuCddtud
m
pp
ppl
Lpp
ppDlpp
p
l
l
lll
ρπ
πρ
ρπ
ρπ
+
+⎟⎟⎠
⎞⎜⎜⎝
⎛−+
+++
+−′+−=
(7)
The superscripts l and p correspond to the melt and par-ticle, respectively. d is the diameter, m the mass, g the gravity and lu′ is the fluctuating velocity caused by turbu-lence. The dispersion of particles due to turbulence in the melt is treated using a stochastic tracking model, described in detail elsewhere [30]. The effect of the discrete phase on turbulence is ignored. FL is described in detail by Yuan [16]. For the drag coefficient, =DC
pp Re24)Re15.01( 687.0+ , the approach of Crowe [31] is taken.
Particle capture. A balance between forces acting be-tween particles, the surrounding fluid, and a solidification front, which is assumed to be a wall boundary, was derived by Yuan [16]. When the particles reach the wall they can be entrapped, engulfed or pushed away. If the particle diameter is smaller than the primary dendrite arm spacing, dp < PDAS, the particle is modelled to be entrapped. If the particle diameter is bigger than the primary dendrite arm spacing, dp > PDAS, the particle is either be engulfed or pushed away from the wall. Which case occurs, engulf-ment or pushing, depends on the local cooling conditions (e.g. the solidification speed of the dendrites and their tip radius), the melt flow, the steel composition, the bending
Process Metallurgy
steel research int 77 (2006) No.7 3
of the caster and the particle density. The force balance mentioned above includes these conditions.
In the present work the entrapment model is combined with solidification of steel in the mould. The place of par-ticle entrapment/engulfment/pushing is, instead of a wall, the modelled “solidification front” which is supposed to be the iso-surface of the liquidus temperature. This iso-surface mimics the dendritic tip front.
In order to model particle pushing at the solidification front, the reflection angle of particles equals to the inci-dence angle on the iso-surface of the liquidus temperature. The positions of entrapped or engulfed particles are re-corded. Afterwards the particles are deleted from the do-main to save CPU time.
Figure 2 shows a particle near a dendritic solidification front which can be engulfed or pushed away or roll along the front, depending on the direction of the resulting force
totalF . The angle θ is defined between the temperature
gradient and totalF . The angel Φ is defined between the temperature gradient and the line connecting the particle centre and the dendrite tip. If θ is bigger than Φ ( totalF shows in the direction of the dendrites) the particle will be engulfed. If θ is smaller than 90°, as shown in Figure 2, the particle is pushed by the dendrites. The third possibility occur if 90° < θ < Φ. In this case the resulting force points along the solid front, and so the particle is pushed and roll along the dendrites.
The total force on the particle near a dendritic front con-sists of lift force, buoyancy force, drag force, lubrication force, interfacial force and surface energy gradient force
GradILubDBLtotal FFFFFFF +++++= . (8)
The last three, acting only near dendrites towards their tips, are further described as follows:
Lubrication force. Considering a gap between particle and dendrite tip, which is much smaller than the tip and the particle radius, particle pushing can only occur when liquid is constantly flowing into the gap. This flow causes a pressure drop that attracts the particle. This force, known as the lubrication force, thus enhances particle engulfment and its magnitude is defined near a dendritic front [3] as
22
6 ⎟⎟⎠
⎞⎜⎜⎝
⎛
+=
pd
dpsollLub RR
Rb
RvF πμ , (9)
where vsol is the dendrite tip velocity depending on the local cooling conditions, b is the distance between the particle and the dendrite, and is in the order of nanometres. The radius of the particle is Rp and the radius of the den-drite tip is Rd.
Interfacial force. If the particle moves close to the so-lidification front, the energy of the surface atoms of both phases will influence each other. The interfacial energies between the solid and liquid phase, between the liquid and the particle, and between the solid phase and the particle, are σsl., σlp and σsp. The interfacial force for a spherical particle in front of a solidifying interface with a convex curvature, assuming Rp >> b, is defined as [3]
⎟⎟⎠
⎞⎜⎜⎝
⎛
+Δ=
pd
dpI RR
Rba
RF2
20
02 σπ , (10)
where, Δσ0 = σsp - σlp - σsl. If Δσ0 > 0 the force tends to push the particle away from the interface. a0 is the atomic diameter of an iron atom.
Surface energy gradient force. The surface energy of steel at the dendritic front is greatly affected by sulphur, an interfacial-active element. A steep sulphur concentration gradient ahead of the dendrites, changes the surface energy of the melt around the particle, and tends to encourage particle engulfment. The surface energy gradient force near a dendritic front derived by Yuan [4] is
( ) ( ) ( )[ ]
( ) ( )[ ]( )[ ]( )[ ] ,ln
2
ln
2
22
2
⎪⎭
⎪⎬⎫
⎥⎥⎦
⎤
⎢⎢⎣
⎡
+−++
−+
⎪⎩
⎪⎨⎧
⎥⎥⎦
⎤
⎢⎢⎣
⎡
++−+−+−
−=
βξαβξα
αβ
α
βξαξβξαξ
βξ
ξ
βπ
p
pp
pp
ppp
pGrad
RRR
RRRRR
RmF
(11)
where α = 1 + nCs, β = nRd (C* - CS) and ξ is defined as ξ = Rp + Rd + b. CS is the sulphur concentration in the bulk melt, C* is the concentration at the solid-liquid interface and n and m are empirical constants with values of 0.17 J/m² and 844 (mass %)-1.
At present, a discussion in the scientific community is ongoing whether this surface energy gradient force acts only on liquid or gaseous phases (such as bubbles), or also on solid particles [6, 8]. In the present study this force was considered.
Further details on the entrapment model are given by Yuan and Thomas [17].
Simulation Details
Assuming double symmetry, the calculation domain (Figure 3) consists of a quarter of the 1.2 m long upper part of the caster including a trifurcated submerged entry nozzle without any geometrical simplifications. The sym-metric and stable flow field was demonstrated in former studies [32]. The computational domain is discretised into structured hexahedral in the mould and unstructured poly-hedral volume elements in the submerged entry nozzle. The whole grid consists of 1.2 million cells with a fine graded mesh in the mushy zone. The inlet is positioned at the top surface of the trifurcated nozzle. At the inlet of the calculation domain, a flat velocity profile and at the bot-tom a constant pressure were applied as boundary condi-tions. The top surface of the liquid melt pool being in contact with the casting slag is supposed to be flat. Here, a free-slip condition is used. The solidified shell moves downwards at constant casting speed.
At the inlet the particles are injected. Particles are mod-elled as to be caught at the top surface, but in the mushy region of the caster they can be entrapped, engulfed or

Process Metallurgy
steel research int 77 (2006) No.7 4
pushed away from the solidification front following the rules of the capture criteria.
At the mould walls heat flux profiles for the narrow and the wide face of the mould based on industrial measure-ments [32] shown in Figure 4 are used. Although the two profiles do not look very different, the predicted shell thickness is very sensitive to these profiles. Figure 5 shows the shell thickness along the narrow face for both of the heat flux profiles shown in Figure 4. The higher heat flux (narrow face) produces a thicker shell, which matches closer to the measured shell thickness profile The shell thinning produced by impingement of the flowing jet onto the narrow face shell is observed in every case.
The calculation time for the steady-state turbulent flow and solidification result was 5 days with 8 nodes (Intel Pentium 4, 3.2 GHz, 1GB RAM) in parallel on a distrib-uted memory cluster. The calculation time for particle movement and entrapment/engulfment took 30 minutes for 5000 injected particles.
The considered process parameters and material proper-ties are shown in Table 1. To validate this work, the pre-dicted shell thickness is compared with measurements on a breakout shell [27]. Therefore, the values given in Table 1 and the geometry were taken from this literature.
Results
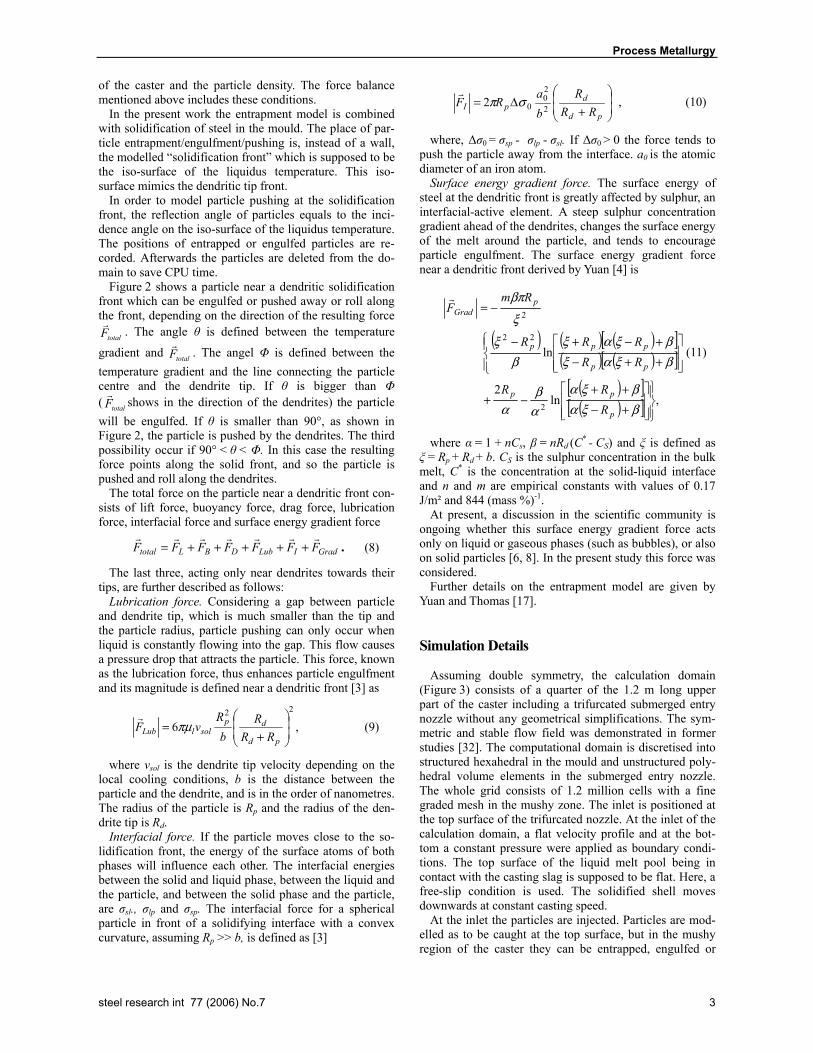
Melt flow and solidification. The steady-state flow pat-tern of the melt in the wide central plane is shown in Fig-ure 6. The liquid melt emerges from the inlet of the nozzle, divides through the trifurcated SEN into two side jets and one centre jet. The two side jets split at the narrow face of the mould and create the usual flow pattern, which in-cludes an upper and a lower roll. The flow pattern in this caster was validated with water models in [32].
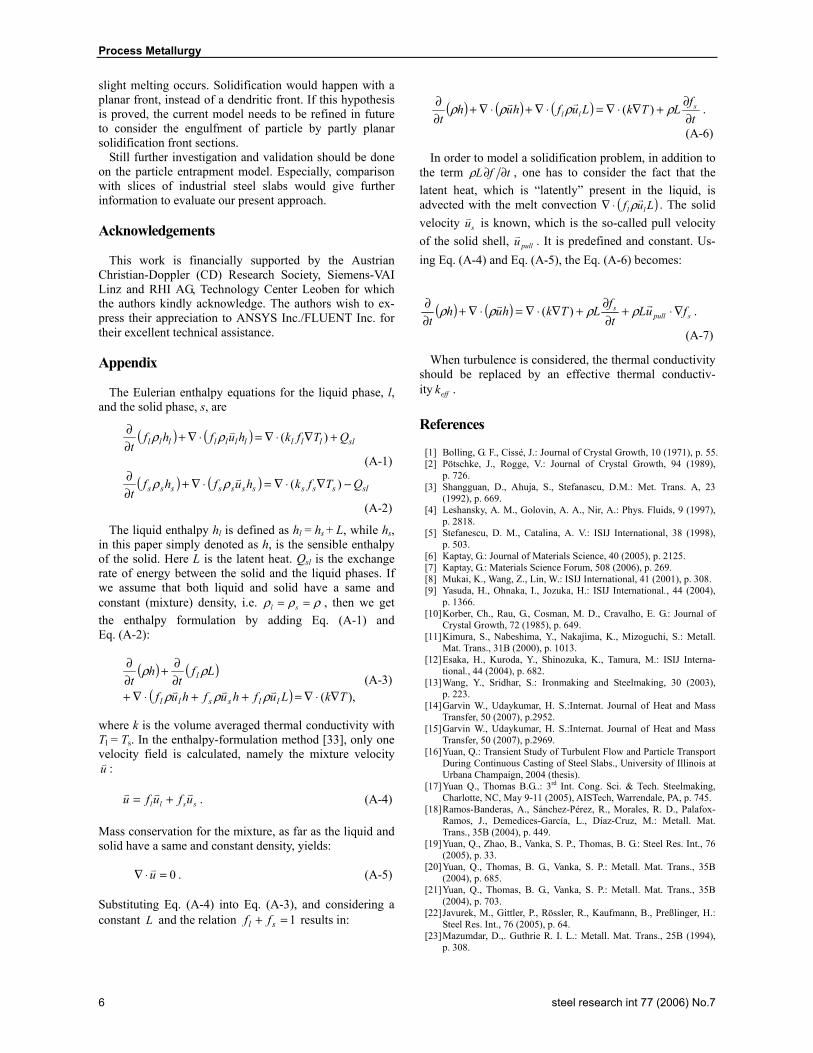
Due to the drag of the dendrites, the flow slows down in the mushy zone and reaches the casting speed in the fully solid region. The shape of the solidified shell is shown in Figure 7 as an iso-surface of liquid fraction fl = 0.5. It starts to build at the slag-melt interface and grows, de-pending on the cooling condition in the mould, while mov-ing downwards. The unevenness is due to the influence of the flow, temperature and turbulence. The measurements of the shell thickness (Figure 5) on the actual breakout shell also show unevenness both along the length and across the width.
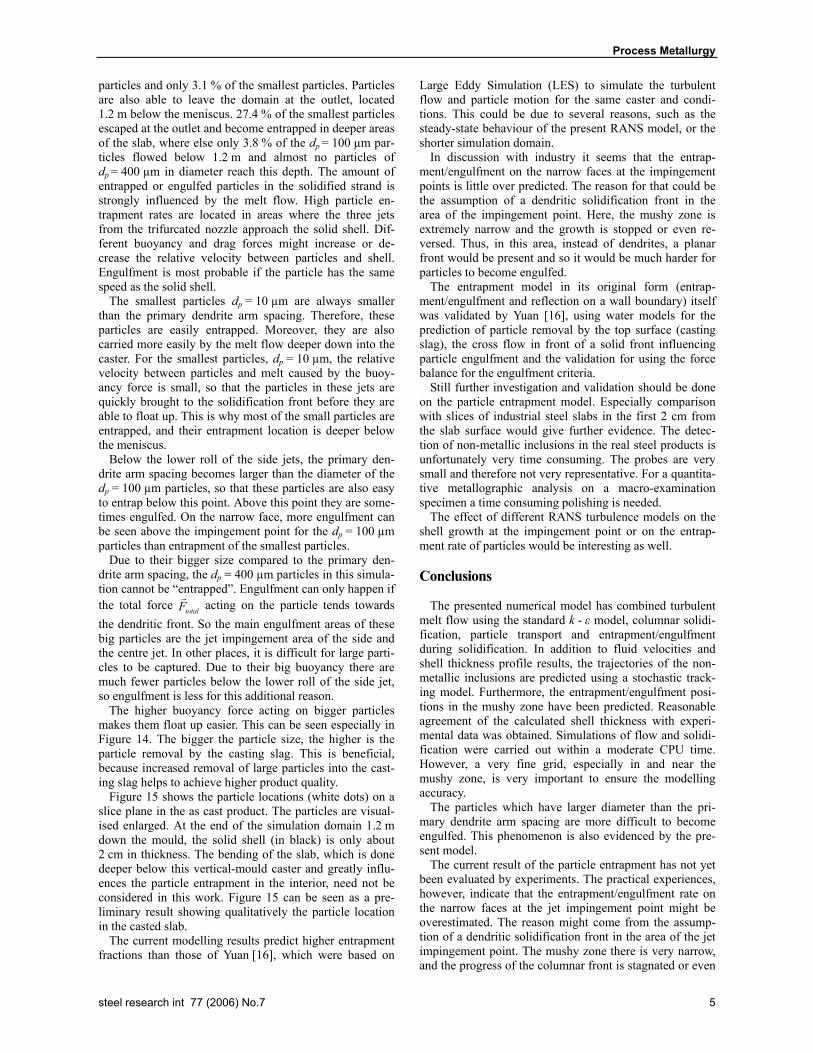
Figure 8 shows the solidified shell thickness (black col-our) in several slice planes through the mould. The white colour is the steel melt. The influence of the centre jet on lowering the shell thickness and the shell growth in the corners of the mould is apparent.
Due to the complexity of the geometry, a polyhedral mesh was chosen in and around the nozzle. This mesh causes unevenness of the shell in the quadratic region near the nozzle. However, the region affected by polyhedral elements is small compared to the remaining solidification area. The best results for this case for modelling of solidi-fication were achieved with extremely fine and graded hexahedral elements. Grid refinement was done, especially in the vicinity of the solidification front. Figure 9 shows the influence of grid size on the calculated shell thickness of the narrow face. Grid independence was achieved using
a grid of 1.2 million cells. The grid studies have shown that mesh refinement is very important, especially near the narrow faces of the mould, due to the high temperature and velocity gradients at the impingement area of the side jet. The mushy zone (0 < fl < 1) on the narrow face at the jet impingement point seems to be extremely thin. Using the finest mesh the calculated mushy zone is about 0.5 mm. Without grid refinement the thickness of the mushy zone is over predicted and the effect of the jet on the shell thick-ness cannot be resolved properly. The reason is that with-out grid refinement the mushy zone has a width of only one cell in this area. There has to be more than one cell in the mushy zone to resolve the temperature and velocity gradient in a correct way. It has to be mentioned that for this grid study the heat flux profile for the wide face was used for both, wide and narrow face.
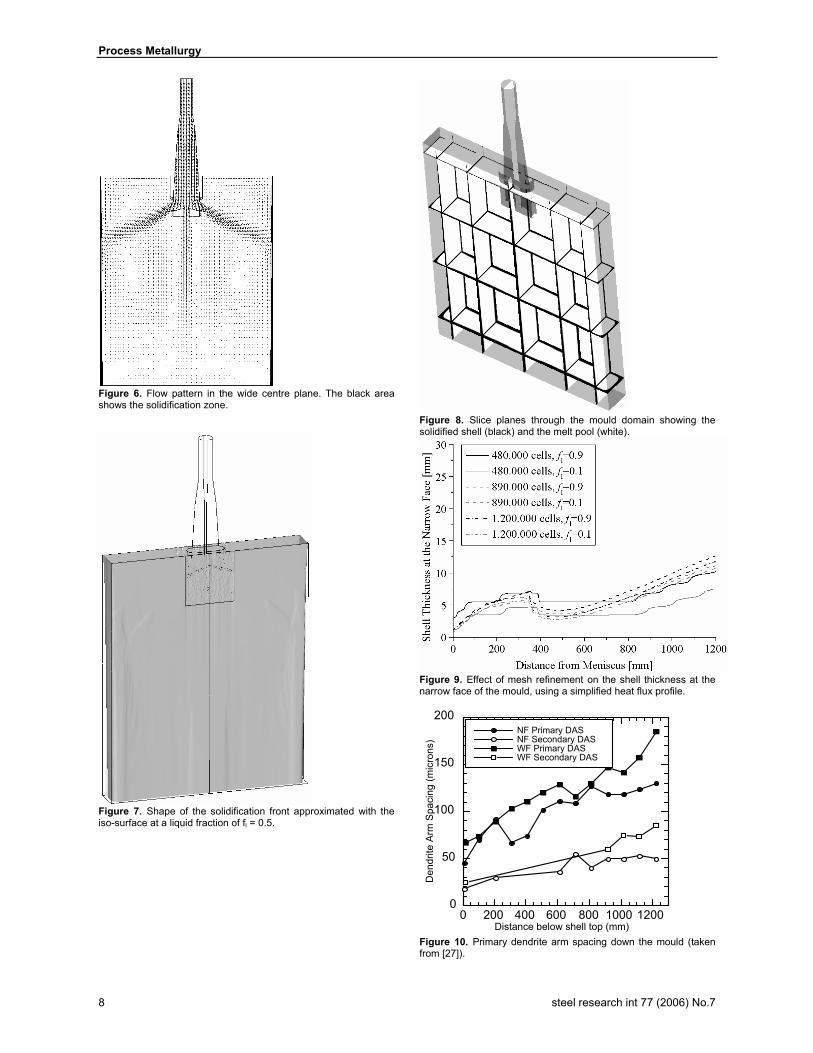
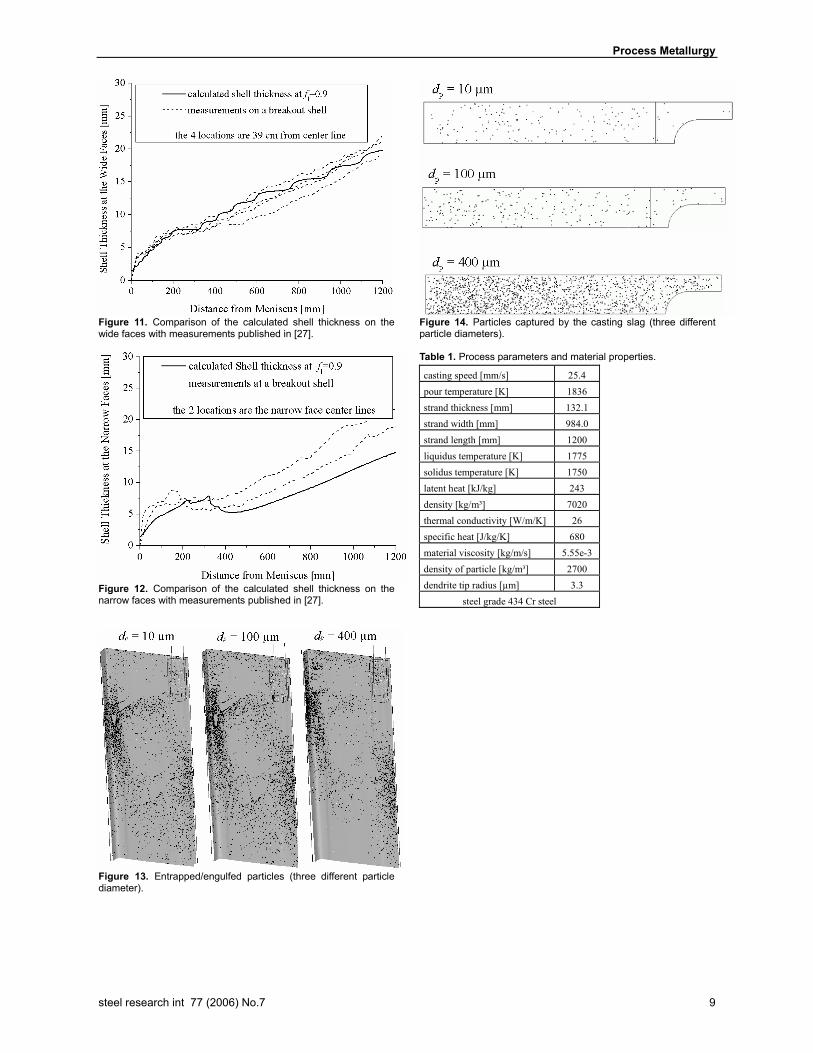
The predictions of the present work were compared with measurements on a breakout shell [27]. Values of the pri-mary dendrite arm spacing along the slab length can be seen in Figure 10. The predicted shell thickness at fl = 0.9 is compared with the measurements at the wide and the narrow faces in Figure 11 and Figure 12. The predicted shell thickness is in good agreement with the measure-ments. The modelled narrow-face shell thickness has the same tendency and is only a few millimetres thinner. Also the measurements on both narrow faces (Figure 12 dotted lines) differ by a similar magnitude. It seems that the pre-dicted shell thickness along the narrow face is shifted slightly to lower positions. This could be due to the downward displacement of the shell tip relative to the steady-state meniscus that likely occurred during the breakout while the fluid flow and jet direction was un-changed [27]. This transient nature of the breakout is also responsible for the greater shell thicknesses measured near the top of the breakout shell, relative to the steady-state conditions that were simulated [32].
Particle entrapment. After a converged steady-state fluid flow and solidification solution was achieved, 5000 particles of different particle size classes were injected computationally into the top inlet of the nozzle, and their trajectories were tracked, including the capture model. The distribution of the entrapped or engulfed particles is shown in Figure 13. Three different particle size classes (10 µm, 100 µm and 400 µm alumina inclusions) are shown. Cap-ture on the “inside” and “outside” radius of this straight-mould caster is similar. Particles which are smaller than the primary dendrite arm spacing are directly entrapped. Due to the difficulty to distinguish between the narrow and wide face mushy zone, the average-value curve of the two curves for the primary dendrite arm spacing (Figure 10) is used. Depending on the local conditions at the dendritic front (liquidus iso-surface), particles bigger than the pri-mary dendrite arm spacing are either engulfed or pushed away (reflected) from the mushy zone. The oversized black dots in Figure 13 show the entrapment/engulfment positions of particles within the wide and narrow face mushy zone. The grey background shows the position of the mushy zone defined as an iso-surface of liquid fraction fl = 0.5.
The results predict a removal at the casting slag of 30 % of the dp = 400 µm particles, 4.5 % of the dp = 100 µm
Process Metallurgy
steel research int 77 (2006) No.7 5
particles and only 3.1 % of the smallest particles. Particles are also able to leave the domain at the outlet, located 1.2 m below the meniscus. 27.4 % of the smallest particles escaped at the outlet and become entrapped in deeper areas of the slab, where else only 3.8 % of the dp = 100 µm par-ticles flowed below 1.2 m and almost no particles of dp = 400 µm in diameter reach this depth. The amount of entrapped or engulfed particles in the solidified strand is strongly influenced by the melt flow. High particle en-trapment rates are located in areas where the three jets from the trifurcated nozzle approach the solid shell. Dif-ferent buoyancy and drag forces might increase or de-crease the relative velocity between particles and shell. Engulfment is most probable if the particle has the same speed as the solid shell.
The smallest particles dp = 10 µm are always smaller than the primary dendrite arm spacing. Therefore, these particles are easily entrapped. Moreover, they are also carried more easily by the melt flow deeper down into the caster. For the smallest particles, dp = 10 µm, the relative velocity between particles and melt caused by the buoy-ancy force is small, so that the particles in these jets are quickly brought to the solidification front before they are able to float up. This is why most of the small particles are entrapped, and their entrapment location is deeper below the meniscus.
Below the lower roll of the side jets, the primary den-drite arm spacing becomes larger than the diameter of the dp = 100 µm particles, so that these particles are also easy to entrap below this point. Above this point they are some-times engulfed. On the narrow face, more engulfment can be seen above the impingement point for the dp = 100 µm particles than entrapment of the smallest particles.
Due to their bigger size compared to the primary den-drite arm spacing, the dp = 400 µm particles in this simula-tion cannot be “entrapped”. Engulfment can only happen if the total force totalF acting on the particle tends towards the dendritic front. So the main engulfment areas of these big particles are the jet impingement area of the side and the centre jet. In other places, it is difficult for large parti-cles to be captured. Due to their big buoyancy there are much fewer particles below the lower roll of the side jet, so engulfment is less for this additional reason.
The higher buoyancy force acting on bigger particles makes them float up easier. This can be seen especially in Figure 14. The bigger the particle size, the higher is the particle removal by the casting slag. This is beneficial, because increased removal of large particles into the cast-ing slag helps to achieve higher product quality.
Figure 15 shows the particle locations (white dots) on a slice plane in the as cast product. The particles are visual-ised enlarged. At the end of the simulation domain 1.2 m down the mould, the solid shell (in black) is only about 2 cm in thickness. The bending of the slab, which is done deeper below this vertical-mould caster and greatly influ-ences the particle entrapment in the interior, need not be considered in this work. Figure 15 can be seen as a pre-liminary result showing qualitatively the particle location in the casted slab.
The current modelling results predict higher entrapment fractions than those of Yuan [16], which were based on
Large Eddy Simulation (LES) to simulate the turbulent flow and particle motion for the same caster and condi-tions. This could be due to several reasons, such as the steady-state behaviour of the present RANS model, or the shorter simulation domain.
In discussion with industry it seems that the entrap-ment/engulfment on the narrow faces at the impingement points is little over predicted. The reason for that could be the assumption of a dendritic solidification front in the area of the impingement point. Here, the mushy zone is extremely narrow and the growth is stopped or even re-versed. Thus, in this area, instead of dendrites, a planar front would be present and so it would be much harder for particles to become engulfed.
The entrapment model in its original form (entrap-ment/engulfment and reflection on a wall boundary) itself was validated by Yuan [16], using water models for the prediction of particle removal by the top surface (casting slag), the cross flow in front of a solid front influencing particle engulfment and the validation for using the force balance for the engulfment criteria.
Still further investigation and validation should be done on the particle entrapment model. Especially comparison with slices of industrial steel slabs in the first 2 cm from the slab surface would give further evidence. The detec-tion of non-metallic inclusions in the real steel products is unfortunately very time consuming. The probes are very small and therefore not very representative. For a quantita-tive metallographic analysis on a macro-examination specimen a time consuming polishing is needed.
The effect of different RANS turbulence models on the shell growth at the impingement point or on the entrap-ment rate of particles would be interesting as well.
Conclusions
The presented numerical model has combined turbulent melt flow using the standard k - ε model, columnar solidi-fication, particle transport and entrapment/engulfment during solidification. In addition to fluid velocities and shell thickness profile results, the trajectories of the non-metallic inclusions are predicted using a stochastic track-ing model. Furthermore, the entrapment/engulfment posi-tions in the mushy zone have been predicted. Reasonable agreement of the calculated shell thickness with experi-mental data was obtained. Simulations of flow and solidi-fication were carried out within a moderate CPU time. However, a very fine grid, especially in and near the mushy zone, is very important to ensure the modelling accuracy.
The particles which have larger diameter than the pri-mary dendrite arm spacing are more difficult to become engulfed. This phenomenon is also evidenced by the pre-sent model.
The current result of the particle entrapment has not yet been evaluated by experiments. The practical experiences, however, indicate that the entrapment/engulfment rate on the narrow faces at the jet impingement point might be overestimated. The reason might come from the assump-tion of a dendritic solidification front in the area of the jet impingement point. The mushy zone there is very narrow, and the progress of the columnar front is stagnated or even
Process Metallurgy
steel research int 77 (2006) No.7 6
slight melting occurs. Solidification would happen with a planar front, instead of a dendritic front. If this hypothesis is proved, the current model needs to be refined in future to consider the engulfment of particle by partly planar solidification front sections.
Still further investigation and validation should be done on the particle entrapment model. Especially, comparison with slices of industrial steel slabs would give further information to evaluate our present approach.
Acknowledgements
This work is financially supported by the Austrian Christian-Doppler (CD) Research Society, Siemens-VAI Linz and RHI AG, Technology Center Leoben for which the authors kindly acknowledge. The authors wish to ex-press their appreciation to ANSYS Inc./FLUENT Inc. for their excellent technical assistance.
Appendix
The Eulerian enthalpy equations for the liquid phase, l, and the solid phase, s, are
( ) ( ) slllllllllll QTfkhufhft
+∇⋅∇=⋅∇+∂∂ )(ρρ
(A-1)
( ) ( ) slssssssssss QTfkhufhft
−∇⋅∇=⋅∇+∂∂ )(ρρ
(A-2)
The liquid enthalpy hl is defined as hl = hs + L, while hs, in this paper simply denoted as h, is the sensible enthalpy of the solid. Here L is the latent heat. Qsl is the exchange rate of energy between the solid and the liquid phases. If we assume that both liquid and solid have a same and constant (mixture) density, i.e. ρρρ == sl , then we get the enthalpy formulation by adding Eq. (A-1) and Eq. (A-2):
( ) ( )
( ) ),( TkLufhufhuf
Lft
ht
llssll
l
∇⋅∇=++⋅∇+∂∂+
∂∂
ρρρ
ρρ (A-3)
where k is the volume averaged thermal conductivity with Tl = Ts. In the enthalpy-formulation method [33], only one velocity field is calculated, namely the mixture velocity u :
ssll ufufu += . (A-4)
Mass conservation for the mixture, as far as the liquid and solid have a same and constant density, yields:
0=⋅∇ u . (A-5)
Substituting Eq. (A-4) into Eq. (A-3), and considering a constant L and the relation 1=+ sl ff results in:
( ) ( ) ( )tfLTkLufhuh
ts
ll ∂∂+∇⋅∇=⋅∇+⋅∇+
∂∂ ρρρρ )( .
(A-6)
In order to model a solidification problem, in addition to the term tfL ∂∂ρ , one has to consider the fact that the latent heat, which is “latently” present in the liquid, is advected with the melt convection ( )Luf ll ρ⋅∇ . The solid velocity su is known, which is the so-called pull velocity of the solid shell, pullu . It is predefined and constant. Us-ing Eq. (A-4) and Eq. (A-5), the Eq. (A-6) becomes:
( ) ( ) spulls fuLtfLTkhuh
t∇⋅+
∂∂+∇⋅∇=⋅∇+
∂∂ ρρρρ )( .
(A-7)
When turbulence is considered, the thermal conductivity should be replaced by an effective thermal conductiv-ity effk .
References
[1] Bolling, G. F., Cissé, J.: Journal of Crystal Growth, 10 (1971), p. 55. [2] Pötschke, J., Rogge, V.: Journal of Crystal Growth, 94 (1989),
p. 726. [3] Shangguan, D., Ahuja, S., Stefanascu, D.M.: Met. Trans. A, 23
(1992), p. 669. [4] Leshansky, A. M., Golovin, A. A., Nir, A.: Phys. Fluids, 9 (1997),
p. 2818. [5] Stefanescu, D. M., Catalina, A. V.: ISIJ International, 38 (1998),
p. 503. [6] Kaptay, G.: Journal of Materials Science, 40 (2005), p. 2125. [7] Kaptay, G.: Materials Science Forum, 508 (2006), p. 269. [8] Mukai, K., Wang, Z., Lin, W.: ISIJ International, 41 (2001), p. 308. [9] Yasuda, H., Ohnaka, I., Jozuka, H.: ISIJ International., 44 (2004),
p. 1366. [10] Korber, Ch., Rau, G., Cosman, M. D., Cravalho, E. G.: Journal of
Crystal Growth, 72 (1985), p. 649. [11] Kimura, S., Nabeshima, Y., Nakajima, K., Mizoguchi, S.: Metall.
Mat. Trans., 31B (2000), p. 1013. [12] Esaka, H., Kuroda, Y., Shinozuka, K., Tamura, M.: ISIJ Interna-
tional., 44 (2004), p. 682. [13] Wang, Y., Sridhar, S.: Ironmaking and Steelmaking, 30 (2003),
p. 223. [14] Garvin W., Udaykumar, H. S.:Internat. Journal of Heat and Mass
Transfer, 50 (2007), p.2952. [15] Garvin W., Udaykumar, H. S.:Internat. Journal of Heat and Mass
Transfer, 50 (2007), p.2969. [16] Yuan, Q.: Transient Study of Turbulent Flow and Particle Transport
During Continuous Casting of Steel Slabs., University of Illinois at Urbana Champaign, 2004 (thesis).
[17] Yuan Q., Thomas B.G..: 3rd Int. Cong. Sci. & Tech. Steelmaking, Charlotte, NC, May 9-11 (2005), AISTech, Warrendale, PA, p. 745.
[18] Ramos-Banderas, A., Sánchez-Pérez, R., Morales, R. D., Palafox-Ramos, J., Demedices-García, L., Díaz-Cruz, M.: Metall. Mat. Trans., 35B (2004), p. 449.
[19] Yuan, Q., Zhao, B., Vanka, S. P., Thomas, B. G.: Steel Res. Int., 76 (2005), p. 33.
[20] Yuan, Q., Thomas, B. G., Vanka, S. P.: Metall. Mat. Trans., 35B (2004), p. 685.
[21] Yuan, Q., Thomas, B. G., Vanka, S. P.: Metall. Mat. Trans., 35B (2004), p. 703.
[22] Javurek, M., Gittler, P., Rössler, R., Kaufmann, B., Preßlinger, H.: Steel Res. Int., 76 (2005), p. 64.
[23] Mazumdar, D.,. Guthrie R. I. L.: Metall. Mat. Trans., 25B (1994), p. 308.

Process Metallurgy
steel research int 77 (2006) No.7 7
[24] Mukhopadhyay, A., Grald, E. W., Dhanasekharan, K., Sarkar, S., Sanyal, J.: Steel Res. Int., 76 (2005), p. 22.
[25] Schwarz, M. P.: Appl. Math. Modelling, 20 (1996), p. 41. [26] Alexiadis, A., Gardin. P., and Domgin, J. F.: Metall. Mat. Trans.,
35B (2004), p. 949. [27] Thomas, B.G., O’Malley, R., Stone, D.: MCWASP VIII Conf. Proc.,
1998, TMS, p.1185. [28] IDS, a commercial solidification analysis package developed at the
Helsinki University of Technology. [29] Gu, J. P., Beckermann, C.: Metallurgical and Materials Transactions
A, 30A (1999), p. 1357. [30] Pfeiler, C., Wu M., Ludwig, A., Chimani, C., Watzinger, J., Dös-
inger, H.: Simulation of Inlcusion and Bubble Motion in a Steel Continuous Caster, MCWASP XI Conf. Proc., 2006, TMS, p. 737.
[31] Crowe, C., Sommerfeld, M., Tsuji, Y.: Multiphase Flows with Droplets and Particles, CRC Press LLC 1998, pp.
[32] Thomas, B.G., O’Malley, R., Shi, T., Meng, Y., Creech, D., Stone, D.: Validation of Fluid Flow and Solidification Simulation of a Continuous Thin-Slab Caster., MCWASP IX Conf. Proc., 2000, Shaker Verlag GmbH, Aachen, p. 769.
[33] Voller, V. R., Brent, A. D.: Applied Mathematical Modelling, 14 (1990), p. 320.
Figure 1. Relation between temperature and solid fraction.
Figure 2. Particle near the dendritic front.
Figure 3. Geometrical domain.
Figure 4. Heat flux profiles down the mould for the wide and the narrow face (taken from [32]).
Figure 5. Shell thickness at the narrow faces using different heat flux profiles (figure 4) in comparison with measurements pub-lished in [27].
Process Metallurgy
steel research int 77 (2006) No.7 8
Figure 6. Flow pattern in the wide centre plane. The black area shows the solidification zone.
Figure 7. Shape of the solidification front approximated with the iso-surface at a liquid fraction of fl = 0.5.
Figure 8. Slice planes through the mould domain showing the solidified shell (black) and the melt pool (white).
Figure 9. Effect of mesh refinement on the shell thickness at the narrow face of the mould, using a simplified heat flux profile.
0
50
100
150
200
0 200 400 600 800 1000 1200
NF Primary DASNF Secondary DASWF Primary DASWF Secondary DAS
Den
drite
Arm
Spa
cing
(mic
rons
)
Distance below shell top (mm) Figure 10. Primary dendrite arm spacing down the mould (taken from [27]).
Process Metallurgy
steel research int 77 (2006) No.7 9
Figure 11. Comparison of the calculated shell thickness on the wide faces with measurements published in [27].
Figure 12. Comparison of the calculated shell thickness on the narrow faces with measurements published in [27].
Figure 13. Entrapped/engulfed particles (three different particle diameter).
Figure 14. Particles captured by the casting slag (three different particle diameters). Table 1. Process parameters and material properties.
casting speed [mm/s] 25.4 pour temperature [K] 1836 strand thickness [mm] 132.1 strand width [mm] 984.0 strand length [mm] 1200 liquidus temperature [K] 1775 solidus temperature [K] 1750 latent heat [kJ/kg] 243 density [kg/m³] 7020 thermal conductivity [W/m/K] 26 specific heat [J/kg/K] 680 material viscosity [kg/m/s] 5.55e-3 density of particle [kg/m³] 2700 dendrite tip radius [µm] 3.3
steel grade 434 Cr steel

Process Metallurgy
steel research int 77 (2006) No.7 10
dp = 400 µm
dp = 10 µm
dp = 400 µm
dp = 10 µm
Figure 15. A slice plane through a slab solidified 1.2 m below meniscus. Particles (white dots) entrapped/engulfed in the solid shell.