Embed Size (px)
Citation preview
G. Lee et al., AISTech 2008, Pittsburgh, PA, May 5-8, 2008
1
Asymmetric Multi-phase Fluid Flow and Particle Entrapment in a Continuous Casting Mold
Go-Gi Lee Pohang University of Science and Technology
San31, Hyoja-dong, Nam-gu, Pohang, Kyungbuk 790-784 South Korea
Tel: +82-54-279-2815 Fax: +82-54-279-2399
E-mail: [email protected]
Ho-Jung Shin POSCO Technical Research Laboratories
699, Gumho-dong, Gwangyang, Jeonnam 545-090 South Korea
Tel: +82-61-790-8770 Fax: +82-61-790-9287
E-mail: [email protected]
Brian G. Thomas University of Illinois at Urbana-Champaign
1206 West Green Street Urbana, IL 61801
Tel.: 217-333-6919 Fax: 217-244-6534
E-mail: [email protected]
Seon-Hyo Kim Pohang University of Science and Technology
San31, Hyoja-dong, Nam-gu, Pohang, Kyungbuk 790-784 South Korea
Tel: +82-54-279-4315 Fax: +82-54-279-2399
E-mail: [email protected]
Key words: Argon bubble, Continuous Casting, Mold, Fluid flow, Inclusions, Particle transport, Steel caster, Defect
INTRODUCTION
The quality of continuous-cast steel slabs is greatly affected by the flow pattern in the mold, which depends on the flow exiting the nozzle. This flow pattern governs the motion of non-metallic inclusion particles and bubbles, surface fluctuation at the meniscus. The flow patterns in the nozzle and mold are also greatly affected by argon gas injection, which is widely employed to reduce nozzle clogging [1, 2]. The argon gas bubbles may attach with small inclusions and become entrapped in the solidifying shell, resulting in pencil pipe and blister defects [3, 4] on the surface of the final product, especially in ultra-low carbon steels for automotive applications. Particle entrapment is more severe towards the inside-radius side of the wide face [5], which has been attributed solely to strand curvature increasing the upward flotation of bubbles towards that face of curved casters [5]. Little previous experimental work has been done to investigate fluid flow in continuous casting. Computational models have been widely used to simulate multiphase turbulent flow of molten steel and injected gas bubbles in both the nozzle [6-8] and mold [1, 9]. In addition to the gas flow rate, the predictions also depend greatly on the argon bubble size distributions. Previous work on bubble formation and size distribution has been done in water model systems, as reviewed by H. Bai et al. [10], who also measured the average bubble sizes and predicted significant differences in steel-argon systems. Recently, Ishiguro et al. [11] showed that flow in a nozzle water model is greatly affected by the pressure drop beneath the slide gate, which induced asymmetric, inverted annular flow in the nozzle, and allowed the bubbles to coalesce into large gas pockets at the nonwetting walls just below the slide gate. This present study was conducted to increase understanding of bubble formation and behavior during gas injection through the porous refractory into the downward flowing liquid. First, the gas bubble size and its size distribution were measured in specially-treated samples of porous nozzle refractory, and applied to improve the prediction of argon bubble size in steel casters. Next, two-phase
G. Lee et al., AISTech 2008, Pittsburgh, PA, May 5-8, 2008
2
computations of fluid flow and bubble transport in the nozzle and mold were performed, including the effects of slide-gate asymmetry and the measured argon bubble size distributions. These results were validated with plant measurements of top-surface velocity (from nail-board measurements) and inclusion size and location distributions (from ultra-sonic detection) and combined together to gain new understanding of inclusion and bubble entrapment in cast slabs.
EXPERIMENTS
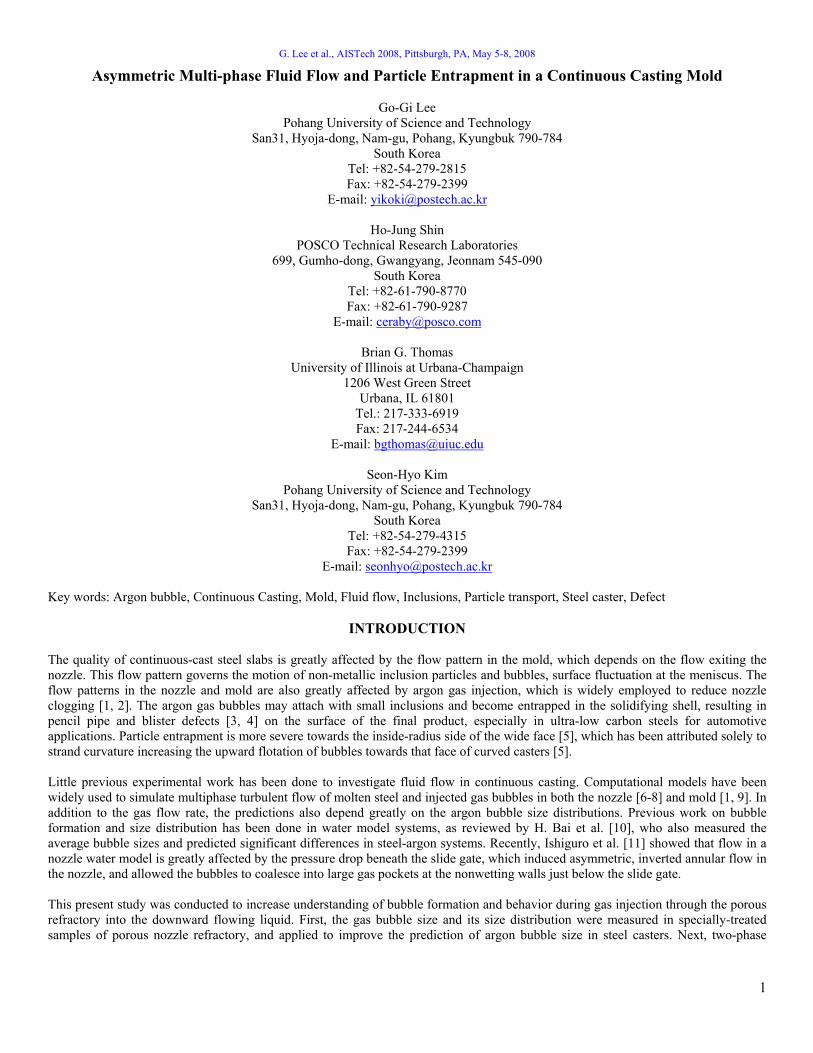
Water Model Bubble Measurements Figure 1(a) shows a schematic of the 1/3-scale water model at POSTECH of the tundish, nozzle, and mold of the caster at POSCO Gwangyang Works, South Korea. Water is pumped from a water bath collector at the bottom of the mold into the tundish. The water flow rate is controlled by a slide gate system, which moves perpendicular to the port direction. To investigate the bubble size distribution formed upon gas injection through porous refractory, bubbles were observed in an upper tundish nozzle (UTN) consisting of a 140mm long transparent acrylic tube with a square 22 x 22mm cross section. The brick pieces of MgO porous refractory (14mm wide x 44mm long x 17mm deep) were made with different permeabilities (7.52 and 16.32nPm) and inserted at the UTN wall to simulate a portion of the actual porous refractory, as shown in Figure 1(b). The gas exits from surface pores after diffusing through interconnected pores inside the porous MgO refractory. The initial behavior of the forming bubbles was recorded by a high speed camera at 2000 frames/s. The number of “active sites” where gas bubbles actually exit the refractory were counted by inspecting the sequences of video images frame by frame with both stagnant and downward-flowing water. Bubble sizes and distributions were also measured directly from individual images.
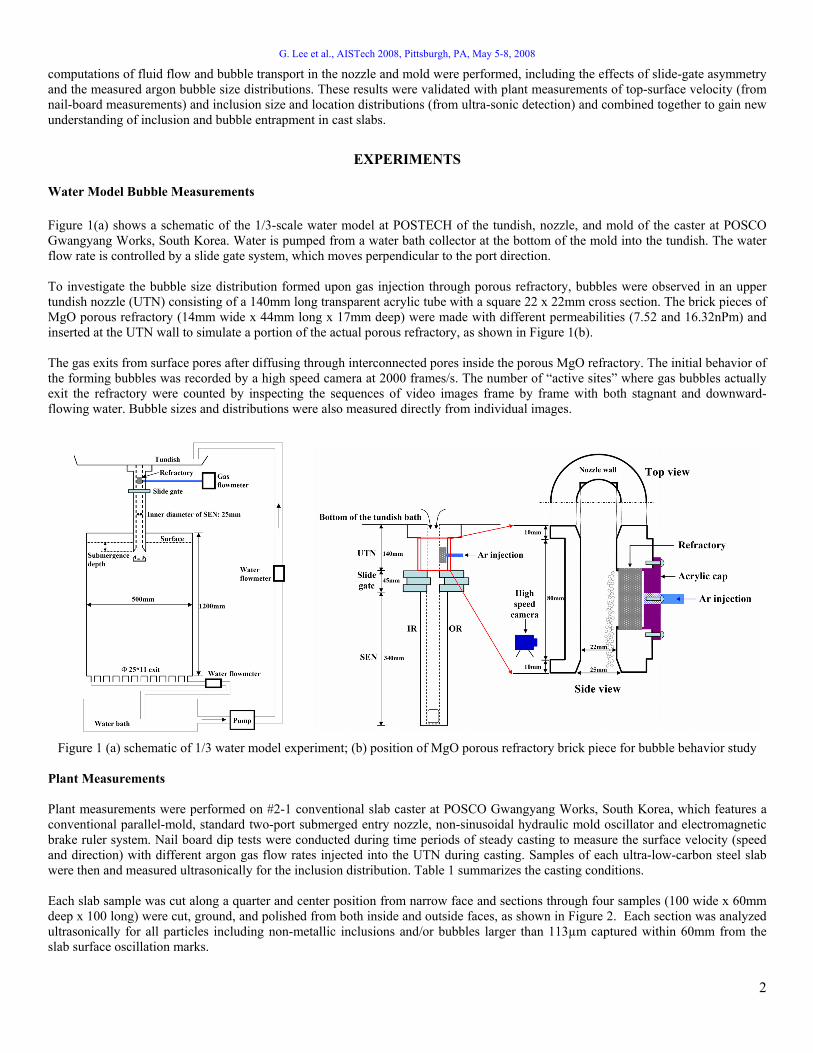
Plant Measurements Plant measurements were performed on #2-1 conventional slab caster at POSCO Gwangyang Works, South Korea, which features a conventional parallel-mold, standard two-port submerged entry nozzle, non-sinusoidal hydraulic mold oscillator and electromagnetic brake ruler system. Nail board dip tests were conducted during time periods of steady casting to measure the surface velocity (speed and direction) with different argon gas flow rates injected into the UTN during casting. Samples of each ultra-low-carbon steel slab were then and measured ultrasonically for the inclusion distribution. Table 1 summarizes the casting conditions. Each slab sample was cut along a quarter and center position from narrow face and sections through four samples (100 wide x 60mm deep x 100 long) were cut, ground, and polished from both inside and outside faces, as shown in Figure 2. Each section was analyzed ultrasonically for all particles including non-metallic inclusions and/or bubbles larger than 113µm captured within 60mm from the slab surface oscillation marks.
Figure 1 (a) schematic of 1/3 water model experiment; (b) position of MgO porous refractory brick piece for bubble behavior study
G. Lee et al., AISTech 2008, Pittsburgh, PA, May 5-8, 2008
3
Table 1 Casting conditions for slab samples
Test number
Slab thickness (mm)
Pour temperature (˚C)
Electromagnetic current(A)
Slab width (mm)
Casting speed (m/min)
Argon gas flow rate (SLPM)
Test 1 9.60 Test 2
1570 1.30 12.20
Test 3 6.18 Test 4
250 1567 250 1450 1.34
4.58
COMPUTATIONAL MODEL OF FULID FLOW
A computational model has been developed to study the fluid flow phenomena in both the nozzle and mold. Owing to the left-right symmetry, the domain includes half of the nozzle and mold, extending from the tundish bottom to 3m below the meniscus, including both the inner and outer radius. The Reynolds Stress Model (RSM) to simulate turbulent fluid flow in three dimensions was used in solving the continuity equation and momentum transport equations for the Reynolds stresses and pressure, together with an equation for the dissipation rate, using the commercial computational fluid dynamics (CFD) package FLUENT. The casting conditions and properties are given in Table 2. A discrete phase model (DPM) was used for Lagrangian tracking of the trajectories of the argon bubbles in both the nozzle and mold. The turbulent motion of the argon bubbles was predicted using a stochastic tracking model. The approach was coupled, including the buoyancy effect of the discrete particle phase on the fluid continuum phase. Transient simulations of the nozzle flow were computed for three different gas flow rates for 2s using an injection interval of 0.001s, equal to the time step. Because the residence time of particles in the nozzle is only ~0.66s, steady flow and bubble conditions were established. Corresponding simulations of flow in the mold were computed up to ~30s, which is only 0.25 residence times, so the gas distributions are not quite fully developed. The size distribution of the argon bubbles was input according to a Rosin-Rammler diameter distribution in FLUENT[12]. For this method, the mean bubble diameter measured in the water model experiments were modified to predict bubble diameters in the argon-steel system using the following equation from Bai [10],:
( ) ( )22 7
3 2 1 215 7 3 21 17
_
5.2692 22 2
d
e
r
d d eg hole N r
U ar dr ar b ar b dr r e rQ D
π ⎛ ⎞+ + + = + −⎜ ⎟
⎝ ⎠∫ (1)
In this equation, U is the average liquid velocity in the nozzle (m/s), Qg_hole is the gas injection flow rate per hole (ml/s/hole), DN is the diameter of nozzle bore (mm), r is the horizontal radius of an ellipsoidal bubble (mm) at detachment (rd) or the end of expansion (re), a and b are constants, ed is the elongation factor at detachment as a function of U (m/s), and d is the gas injection hole diameter (mm). To enable use of this equation for porous refractory, the gas injection flow rate per active site was investigated with water model experiments.
Figure 2 Schematic of sample locations and surfaces of particle analysis

G. Lee et al., AISTech 2008, Pittsburgh, PA, May 5-8, 2008
4
Table 2 Simulation conditions and materials properties used in this calculation Mold size 230mm thick x 1570mm wide x 3000mm long Casting speed 1.46m/min (Average liquid velocity in nozzle: 2m/s) Submerged Entry Nozzle type Bifurcated SEN submergence depth 180mm Nozzle port height x thickness 98mm x 70mm Nozzle bore diameter 75mm Nozzle port angle 35 degree downward Density of molten steel 7020kg/m3 Viscosity of molten steel 0.0067kg/m·s Argon gas flow rate 5, 9 and 11 SLPM Density of argon gas at 1560°C 0.446kg/m3
RESULTS AND DISCUSSION
Active Sites on Porous Refractory Surface Figure 3 shows the number of active sites of bubbles exiting from the surface pores in both stagnant and downward-flowing water. More active sites form under downward-flowing water than in stagnant water, due to the drag force from the water flow along the surface of porous refractory, which acts to shear the bubbles into the water stream. The refractory with lower permeability has slightly more active sites. The following empirical equation of the water model results can be used to estimate the mean active sites in downward-flowing water (SU_W), the (dotted blue line in Figure 3):
( )2_ # 2.31 ln 13.4g
U WW
QS cm
A⎛ ⎞
= × +⎜ ⎟⎝ ⎠
(2)
where Qg (SLPM) is the gas injection flow rate and AW (cm2) is the surface area of refractory sample used in the water model. This equation is used to estimate the area density of active sites for the real steel UTN, in which argon gas flow rates range from 5 ~ 11 SLPM, and total surface area of porous refractory of 764.6cm2. Thomas et al. [13] have modeled the nonuniform distribution of gas flow over the inner wall where the gas bubbles exit. The velocity distribution drops significantly with distance away from the injection ring in the porous refractory wall, so an effective length or only 0.15m of the total 0.24m porous region was chosen. For the cylindrical UTN with 0.075m diameter, the inner-wall surface area, AAr, is 353.4cm2. In the actual caster, the gas expands to 99% of the molten steel temperature before it enters the liquid steel[14]. Thus, the gas flow rate leaving through each active site on the UTN refractory in the steel caster, Qg_site, (same as Qg_hole in Eq. 1), is easily converted from the nominal operating gas flow rate (given in Table 2) and the results of Eq. 2, using Eq. 3, as follows:
( )__
1000/ / , where60
g Std S S Stdg site
Ar U W Std S
Q P g H TQ ml s siteA S P T
β ρβ⎛ ⎞× ⎛ ⎞⎛ ⎞+ ⋅ ⋅⎛ ⎞= =⎜ ⎟ ⎜ ⎟⎜ ⎟⎜ ⎟⎜ ⎟× ⎝ ⎠ ⎝ ⎠⎝ ⎠⎝ ⎠
(3)
In Eq. (3), β is the gas volume expansion factor, PStd is the standard pressure, ρS is the density of steel, g is the gravitational acceleration, HS is the height of steel in the tundish above the UTN, TStd is the standard temperature and TS is the temperature of steel. To match the gas injection flow velocity (SLPM/cm2) in both systems, 0.1, 0.2 and 0.3 SLPM used in water model experiments corresponds with 5.7, 11.5 and 17.2 SLPM in the plant respectively. Figure 4 relates the mean standard gas flow rate per unit surface area of UTN wall with the actual flow rate of hot argon gas per active site in the steel caster for the same three flow rates and three simulation gas flow rates. This work also gives new insight into similarity analysis of water and steel systems to aid in the design of future water modes.

G. Lee et al., AISTech 2008, Pittsburgh, PA, May 5-8, 2008
5
Bubble Behavior in Downward-flowing Water The water model measurements show that both the mean bubble size and the variation of its distribution increase with increasing gas injection flow rate, and decreasing water velocity, as shown in Figure 5. Decreasing water velocity below a critical minimum level (such as found in recirculation regions beneath the slide gate) allows the formation of very large bubbles [10]. The periodic release of such large gas pockets, may cause large level fluctuations in the mold, leading to the entrapment of molten flux and other defects associated with an unstable meniscus.
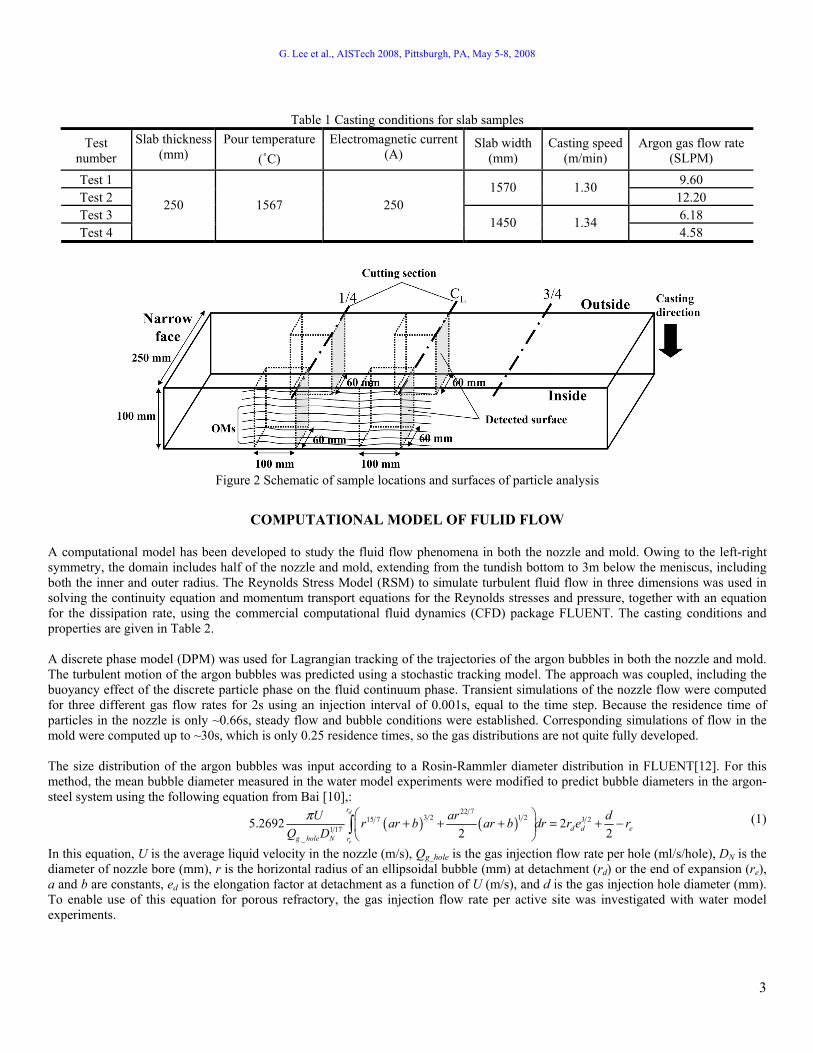
Bubble Size Prediction in Liquid Steel Using Eq. (1), [10] to predict the mean bubble diameter in the water model experiments, Figure 6 (black lines) show a reasonable agreement of trend with the present measurements (points) for different water velocities and gas flow rates. Recent work with coated refractory that increases contact angle produces larger bubble sizes and fewer active sites. Figure 6 also shows the predicted mean bubble diameter in the liquid steel, which is almost constant with these low gas flow rates. Figure 7 shows the mean bubble size predicted in the steel casting nozzle for different downward liquid velocities using Eq. (1). With 2m/s mean liquid velocity in the nozzle (Table 2), the mean bubble diameter predicted in Figure 7 is 2.3mm. A Rosin-Rammler curve fit with 3 as the spread parameter using this diameter roughly matches the bubble size distribution measured in the water model, as shown in Figure 8(a). The corresponding mass fraction distribution, plotted in Figure 8(b) shows a bubble diameter range of ~5mm. The mass flow rate of each bubble diameter was obtained from this mass fraction by multiplying it by the total gas mass flow rate, ρAr·β·Qg. Finally, the number of bubbles injected per unit time with each diameter was obtained by dividing by the mass of each bubble. The entire distribution shown in Figure 8(a) contains 302 bubbles every 0.001sec at 9SLPM, which is injected from 302 random locations on the inner wall of the UTN each time step.
Figure 3 Active sites in water models for different refractories Figure 4 Relation of mean gas flow rate both per unit surface
area of UTN wall and per active site in steel caster
Figure 5 Bubble size distribution with different water velocity and gas flow rate (6.2cm2 surface area of refractory sample)
G. Lee et al., AISTech 2008, Pittsburgh, PA, May 5-8, 2008
6
Figure 6 Comparison of bubble size between measurements and predictions in water model experiment
Figure 7 Prediction of bubble size in steel caster
(a)
(b)
Figure 8 (a) Rosin-Rammler distribution of bubble diameters and number of bubbles and (b) corresponding mass fractions
G. Lee et al., AISTech 2008, Pittsburgh, PA, May 5-8, 2008
7
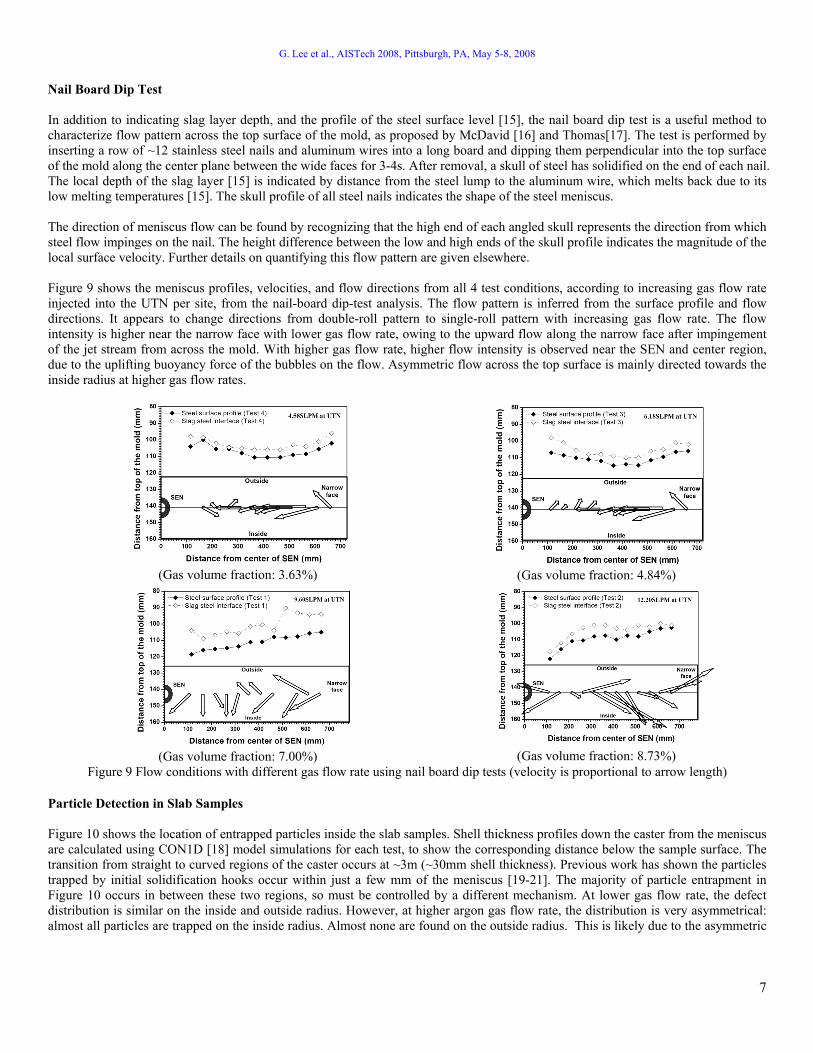
Nail Board Dip Test In addition to indicating slag layer depth, and the profile of the steel surface level [15], the nail board dip test is a useful method to characterize flow pattern across the top surface of the mold, as proposed by McDavid [16] and Thomas[17]. The test is performed by inserting a row of ~12 stainless steel nails and aluminum wires into a long board and dipping them perpendicular into the top surface of the mold along the center plane between the wide faces for 3-4s. After removal, a skull of steel has solidified on the end of each nail. The local depth of the slag layer [15] is indicated by distance from the steel lump to the aluminum wire, which melts back due to its low melting temperatures [15]. The skull profile of all steel nails indicates the shape of the steel meniscus. The direction of meniscus flow can be found by recognizing that the high end of each angled skull represents the direction from which steel flow impinges on the nail. The height difference between the low and high ends of the skull profile indicates the magnitude of the local surface velocity. Further details on quantifying this flow pattern are given elsewhere. Figure 9 shows the meniscus profiles, velocities, and flow directions from all 4 test conditions, according to increasing gas flow rate injected into the UTN per site, from the nail-board dip-test analysis. The flow pattern is inferred from the surface profile and flow directions. It appears to change directions from double-roll pattern to single-roll pattern with increasing gas flow rate. The flow intensity is higher near the narrow face with lower gas flow rate, owing to the upward flow along the narrow face after impingement of the jet stream from across the mold. With higher gas flow rate, higher flow intensity is observed near the SEN and center region, due to the uplifting buoyancy force of the bubbles on the flow. Asymmetric flow across the top surface is mainly directed towards the inside radius at higher gas flow rates.
Particle Detection in Slab Samples Figure 10 shows the location of entrapped particles inside the slab samples. Shell thickness profiles down the caster from the meniscus are calculated using CON1D [18] model simulations for each test, to show the corresponding distance below the sample surface. The transition from straight to curved regions of the caster occurs at ~3m (~30mm shell thickness). Previous work has shown the particles trapped by initial solidification hooks occur within just a few mm of the meniscus [19-21]. The majority of particle entrapment in Figure 10 occurs in between these two regions, so must be controlled by a different mechanism. At lower gas flow rate, the defect distribution is similar on the inside and outside radius. However, at higher argon gas flow rate, the distribution is very asymmetrical: almost all particles are trapped on the inside radius. Almost none are found on the outside radius. This is likely due to the asymmetric
(Gas volume fraction: 3.63%)
(Gas volume fraction: 4.84%)
(Gas volume fraction: 7.00%)
(Gas volume fraction: 8.73%)
Figure 9 Flow conditions with different gas flow rate using nail board dip tests (velocity is proportional to arrow length)

G. Lee et al., AISTech 2008, Pittsburgh, PA, May 5-8, 2008
8
flow towards the inside radius, as mentioned previously. Thus, gas injection through the nozzle greatly affects both fluid flow in the mold and defect distribution in the slab.
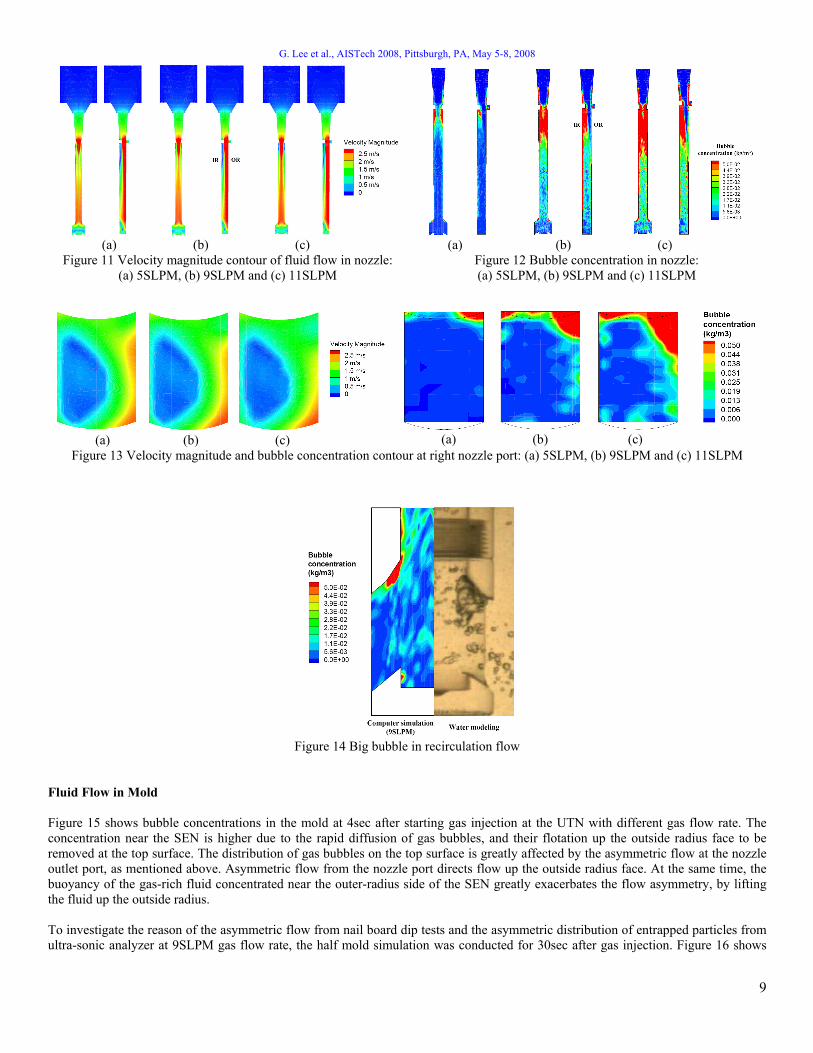
Fluid Flow in Nozzle Figure 11 shows velocity contours computed in the nozzle (both front and side views) for different gas flow rates into the UTN. The recirculation region beneath the slide gate increases with increasing argon injection flow rate. The concentration of gas in the recirculation region also increases, as shown in Figure 12, likely leading to large gas pockets. This phenomenon leads to asymmetric flow at the nozzle outlet right port, as shown in Figure 13. More gas exits the right top of the right nozzle port, while stronger steel flow exits the right bottom side of the right nozzle. Higher gas injection flow rate produces stronger asymmetric recirculation flow at the nozzle outlet ports. Bubble concentration is higher at the upper regions of the nozzle outlet ports, owing to accumulation of the buoyant phase in the low-velocity regions there, flow, as shown in Figure 12. The coalescence of bubbles in this region may cause large bubbles to form there, as clearly observed in the water model experiment in Figure 14. Later, the periodic rupture of these large escaping gas pockets at the slag-steel interface at the top surface of the mold can cause unstable meniscus behavior, level fluctuations, and corresponding surface defects.
Figure 10 Locations of entrapped particles in slab samples
G. Lee et al., AISTech 2008, Pittsburgh, PA, May 5-8, 2008
9
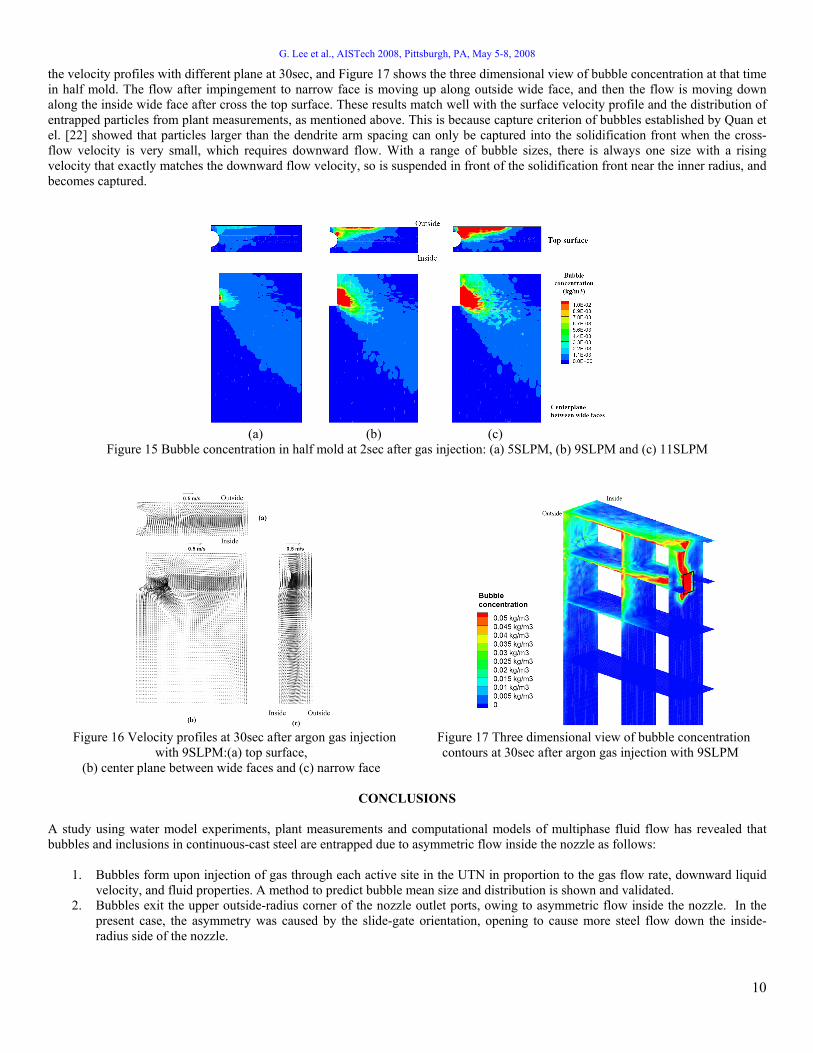
Fluid Flow in Mold Figure 15 shows bubble concentrations in the mold at 4sec after starting gas injection at the UTN with different gas flow rate. The concentration near the SEN is higher due to the rapid diffusion of gas bubbles, and their flotation up the outside radius face to be removed at the top surface. The distribution of gas bubbles on the top surface is greatly affected by the asymmetric flow at the nozzle outlet port, as mentioned above. Asymmetric flow from the nozzle port directs flow up the outside radius face. At the same time, the buoyancy of the gas-rich fluid concentrated near the outer-radius side of the SEN greatly exacerbates the flow asymmetry, by lifting the fluid up the outside radius. To investigate the reason of the asymmetric flow from nail board dip tests and the asymmetric distribution of entrapped particles from ultra-sonic analyzer at 9SLPM gas flow rate, the half mold simulation was conducted for 30sec after gas injection. Figure 16 shows
(a) (b) (c)
(a) (b) (c)
Figure 11 Velocity magnitude contour of fluid flow in nozzle: (a) 5SLPM, (b) 9SLPM and (c) 11SLPM
Figure 12 Bubble concentration in nozzle: (a) 5SLPM, (b) 9SLPM and (c) 11SLPM
(a) (b) (c)
(a) (b) (c)
Figure 13 Velocity magnitude and bubble concentration contour at right nozzle port: (a) 5SLPM, (b) 9SLPM and (c) 11SLPM
Figure 14 Big bubble in recirculation flow
G. Lee et al., AISTech 2008, Pittsburgh, PA, May 5-8, 2008
10
the velocity profiles with different plane at 30sec, and Figure 17 shows the three dimensional view of bubble concentration at that time in half mold. The flow after impingement to narrow face is moving up along outside wide face, and then the flow is moving down along the inside wide face after cross the top surface. These results match well with the surface velocity profile and the distribution of entrapped particles from plant measurements, as mentioned above. This is because capture criterion of bubbles established by Quan et el. [22] showed that particles larger than the dendrite arm spacing can only be captured into the solidification front when the cross-flow velocity is very small, which requires downward flow. With a range of bubble sizes, there is always one size with a rising velocity that exactly matches the downward flow velocity, so is suspended in front of the solidification front near the inner radius, and becomes captured.
CONCLUSIONS
A study using water model experiments, plant measurements and computational models of multiphase fluid flow has revealed that bubbles and inclusions in continuous-cast steel are entrapped due to asymmetric flow inside the nozzle as follows:
1. Bubbles form upon injection of gas through each active site in the UTN in proportion to the gas flow rate, downward liquid velocity, and fluid properties. A method to predict bubble mean size and distribution is shown and validated.
2. Bubbles exit the upper outside-radius corner of the nozzle outlet ports, owing to asymmetric flow inside the nozzle. In the present case, the asymmetry was caused by the slide-gate orientation, opening to cause more steel flow down the inside-radius side of the nozzle.
(a) (b) (c)
Figure 15 Bubble concentration in half mold at 2sec after gas injection: (a) 5SLPM, (b) 9SLPM and (c) 11SLPM
Figure 16 Velocity profiles at 30sec after argon gas injection
with 9SLPM:(a) top surface, (b) center plane between wide faces and (c) narrow face
Figure 17 Three dimensional view of bubble concentration contours at 30sec after argon gas injection with 9SLPM

G. Lee et al., AISTech 2008, Pittsburgh, PA, May 5-8, 2008
11
3. Bubbles rise up the outside radius of mold, increasing gas concentration at the outside radius, causing buoyancy-driven flow to move up and across the top surface towards the inside radius.
4. Particles and bubbles trapped in the flow down the inside radius may become suspended at the solidification front, allowing time for entrapment. This explains the increase number of large particles found on the inside radius.
This mechanism has the following implications: 1. Increasing gas flow rate causes more flow towards the inside radius, as confirmed by the nail board dip test measurements. 2. Straight (vertical) mold walls and strand extend until the solidifying shell is ~30mm thick. The increased inside-radius
entrapment within this thickness indicates that the defects are not due to machine curvature, but due to the asymmetric flow. 3. Asymmetric steel flow towards one side of the nozzle increases the frequency and size of particles entrapped on that the
opposite side of the strand and decreases entrapment on the other strand face. The asymmetry may reverse periodically owing to chaotic turbulent variations. Efforts to limit the entrapment of large particles should focus on preventing asymmetric effects that cause downward flow from the top surface of the mold.
ACKNOWLEDGEMENTS
The authors are grateful to Technology Innovation Center for Metals & Materials at POSTECH for use of their facilities, and also thank to the continuous casting team in Technology Development Groups of Steelmaking Department at POSCO Gwangyang Works for their efforts and cooperation during plant experiments. The authors also thank to the Continuous Casting Consortium at the University of Illinois at Urbana-Champaign for support of this project, especially Rob Nunnington and LWB Refractories for supplying samples, and thanks to Korea Science and Engineering Foundation for supporting of partial fund under Science & Technology Scholarship program.
REFERENCES
1. B. G. Thomas, X. Huang, and R.C. Sussman, Effect of Argon Gas on Fluid Flow in a Continuous Slab Casting Mold. Metall. Trans. B, 1994. 25B(4): p. 527-547.
2. H. Tozawa, et al., CAMP-ISIJ, 1996. 9: p. 604. 3. B. G. Thomas, A. Dennisov, and H. Bai. in 80th ISS Steelmaking Conference. 1997. Chicago, IL: Warrendale,
PA. 4. J. Knoepke and M. Hubbard. in 77th ISS Steelmaking Conference. 1994. Washington, DC: Warrendale, PA. 5. Sussman, R.C., et al., Inclusion Particle Behavior in a Continuous Slab Casting Mold, in 10th Process
Technology Conference Proc. 1992, Iron and Steel Society, Warrendale, PA: Toronto, Canada, April 5-8, 1992. p. 291-304.
6. Bai Hua, B.G.T., Effects of Clogging, Argon Injection, and Continuous Casting Conditions on Flow and Air Aspiration in Submerged Entry Nozzles. Metallurgical and Materials Transactions B, 2001. 32(4): p. 707-722.
7. Bai Hua, B.G.T., Turbulent Flow of Liquid Steel and Argon Bubbles in Slide-Gate Tundish Nozzles: Part I. Model Development and Validation. Metallurgical and Materials Transactions B, 2001. 32(2): p. 253-267.
8. Bai Hua, B.G.T., Turbulent Flow of Liquid Steel and Argon Bubbles in Slide-Gate Tundish Nozzles: Part II. Effect of Operation Conditions and Nozzle Design. Metallurgical and Materials Transactions B, 2001. 32(2): p. 269-284.
9. T. Shi, Effect of Argon Injection on Fluid Flow and Heat Transfer in the Continuous Slab Casting Mold, in Dept. Mech. & Eng. 2001, University of Illinois at Urbana-Champaign: Urbana.
10. H. Bai and B.G. Thomas, Bubble Formation during Horizontal Gas Injection into Downward-Flowing Liquid. Metallurgical and Materials Transactions B, 2001. 32(6): p. 1143-1159.
11. K. Ishiguro and M. Iguchi, Model experiment on the behavior of argon gas in immersion nozzle. Isij International, 2003. 43(5): p. 663-670.
12. FLUENT6.2-Manual, I. Fluent, Editor. 2005: Lebanon, NH. 13. Brian G. Thomas and Z. Hashisho, Argon Gas Flow through Nozzle Refractories, in CCC Annual report, B.G.
Thomas, Editor. 2005: Champaign. 14. H. Bai, Argon Bubble Behavior in Slide-gate Tundish Nozzles during Continuous Casting of Steel Slabs, in Dept.
Mech. Eng. 2000, University of Illinois at Urbana-Champaign: Urbana. 15. P.H. Dauby, W.H. Emling, and R. Sobolewski. Lubrication in the mold: A Multiple Variable System. 1986. 16. R. McDavid and B.G. Thomas, Metall. Trans. B, 1996. 27B: p. 672-85. 17. Thomas, B.G., Chapter 14. Fluid Flow in the mold, in Making, Shaping and Treating of Steel, A.W. Cramb,
Editor. 2003, AISE Steel Foundation: Pittsburgh, PA.

G. Lee et al., AISTech 2008, Pittsburgh, PA, May 5-8, 2008
12
18. Shin, H.-J., et al. Analysis of Hook Formation Mechanism in Ultra Low Carbon Steel using CON1D Heat Flow Solidification Model. in MS&T 2004. 2004. New Orleans, LA: The Association for Iron and Steel Technology (AISTech) and TMS.
19. J. Sengupta, et al., Micrograph evidence of meniscus solidification and sub-surface microstructure evolution in continuous-cast ultralow-carbon steels. Acta materialia, 2006. 54(No. 4): p. 1165-1173.
20. J. Sengupta, et al., A New Mechanism of Hook Formation during Continuous Casting of Ultra-low-carbon Steel Slabs. Metallurgical and Materials Transactions A, 2006. 37A(No. 5): p. 1597-1611.
21. Go-Gi Lee, et al., Microstructure near corners of continuous-cast steel slabs showing three-dimensional frozen meniscus and hooks. Acta Materialia, 2007.
22. Quan Yuan, Brian G. Thomas, and S.P. Vanka, Study of Transient Flow and Particle Transport in Continuous Steel Caster Molds: Part II. Particle Tranport. Metall. Trans. B, 2004. 35B(4): p. 703-714.


![[Historical] survey of beta particle interaction ... · [Historical] survey of beta‐particle interaction experiments with asymmetric matter. J. David Van Horn, Fei Wu and Y. C](https://img.pdfslide.us/doc/110x75/5f5c66cbf4616f10d027e8e4/historical-survey-of-beta-particle-interaction-historical-survey-of-betaaparticle.jpg)


![Explicit Coupled Thermo-Mechanical Finite Element Model …ccc.illinois.edu/s/Reports08/Koric_S Explicit Thermal... · software ABAQUS/Explicit [2] using a VUMAT subroutine. The model](https://img.pdfslide.us/doc/110x75/5adcbee47f8b9a595f8bf147/explicit-coupled-thermo-mechanical-finite-element-model-ccc-explicit-thermalsoftware.jpg)