Embed Size (px)
Citation preview
Brigham Young University Brigham Young University
BYU ScholarsArchive BYU ScholarsArchive
Theses and Dissertations
1971-05-01
Solid-liquid phase equilibria of the potassium-rubidium and Solid-liquid phase equilibria of the potassium-rubidium and
rubidium-cesium alloy systems rubidium-cesium alloy systems
Elisabeth M. Delawarde Brigham Young University - Provo
Follow this and additional works at: https://scholarsarchive.byu.edu/etd
BYU ScholarsArchive Citation BYU ScholarsArchive Citation Delawarde, Elisabeth M., "Solid-liquid phase equilibria of the potassium-rubidium and rubidium-cesium alloy systems" (1971). Theses and Dissertations. 8199. https://scholarsarchive.byu.edu/etd/8199
This Thesis is brought to you for free and open access by BYU ScholarsArchive. It has been accepted for inclusion in Theses and Dissertations by an authorized administrator of BYU ScholarsArchive. For more information, please contact [email protected], [email protected].
. ~J) J.oi
. r J)?6' {fq11
\. ..
SOLID-LIQUID PHASE EQUILIBRIA OF THE POTASSIUM-RUBIDIUM
AND RUBIDIUM-CESIUM ALLOY SYSTEMS
A Thesis
Presented to the
Depa~tment of Chemistry
Brigham Young University
In Partial Fulfillment
of the Requirements for the Degree
'
Master of Science
by
Elisabeth M. Delawarde
May 1971
This thesis, by Elisabeth M. Delawarde, is
accepted in its present form by the DepartmeQt of Chemistry
of Brigham Young University as satisfying the thesis
requirement for the degree of Master of Science.
I
ii
--J
ACKNOWLEDGEMENT
The writer is deeply thankful for the cheerful
assistance and encouragement of Dr. J. Bevan Ott,
especially during difficult situations. Appreciation
is extended to H. Tracy Hall, Jr., and Joan Reeder for
their kind cooperation throughout the work.
The support of Brigham Young University in
conjunction with the United States Atomic Energy Commis-
sion under contract AT(ll-1)-17O7 without which this
work could not have been undertaken is hereby acknowledged.
This thesis is dedicated to my wonderful parents,
who, through their sacrifice and example, encouraged me
to accomplish.
iii
r
TABLE OF CONTENTS
ACKNOWLEDGEMENTS
LIST OF TABLES ..
. . . . . . . . . . . . . . . . . . . . . . .
LIST OF FIGURES . . . . . . . . . . . . . . . . . Chapter
I. INTRODUCTION. . . . . . . . . II.
III.
IV.
- V.
THEORETICAL CONSIDERATIONS. . . . . . . . . . EXPERIMENTAL .....
Purity of Chemical .•..•.••• Sample Preparation . . • . . . . • • • • Apparatus ....• Temperature Scale . . . • . . • . . • .
RESULTS -. . . . . . . . . . . . . . . . . --Measurements . . . .•. . . . . Comparison with Other Works
CONCLUSION.
APPENDIX.
LITERATURE CITED
iv
iii
V
vi
1
4
9 10 11 13
15
15 21
23
27 -
36
Table
1.
2.
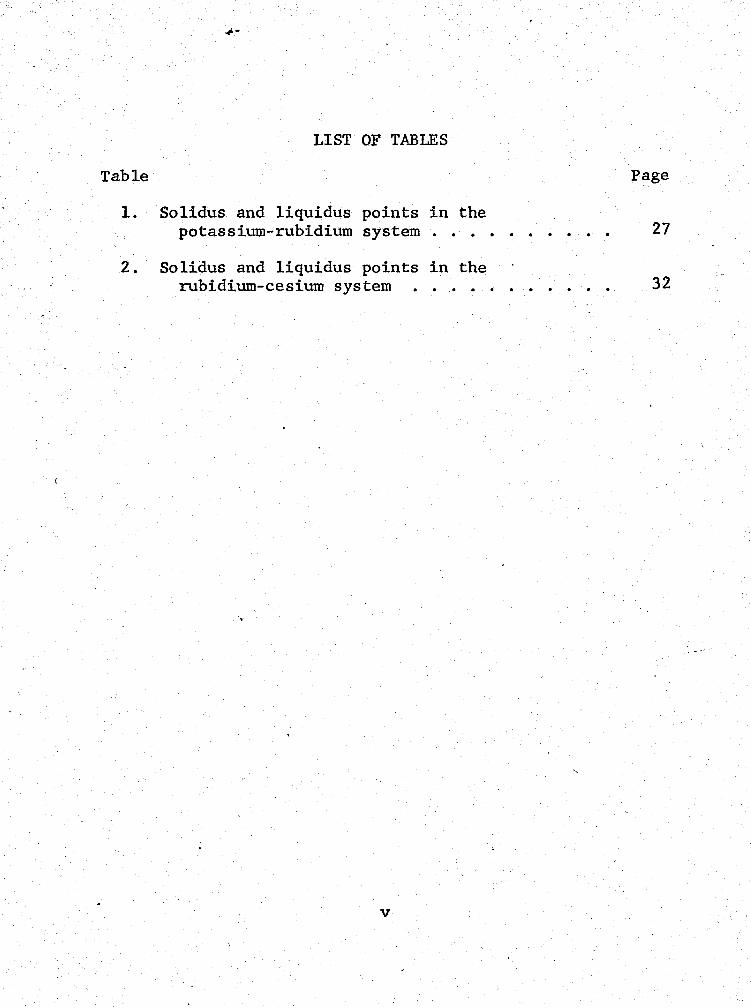
LIST OF TABLES
Solidus and liquidus points in the potassium-rubidium system ..•••
Solidus and liquidus points in the rubidium-cesium system •.••.
V
Page
. . . .- . 27
32
Figure
1.
2.
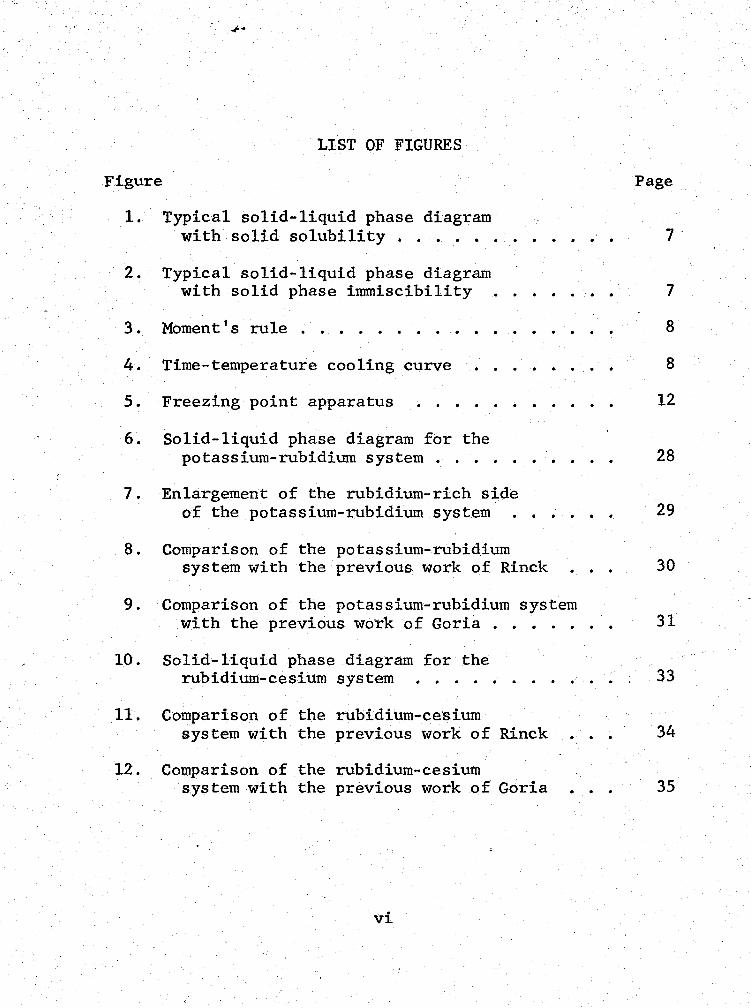
LIST OF FIGURES
Typical solid-liquid phase diagram with solid solubility ..•.••
Typical solid-liquid phase diagram with solid phase immiscibility
3. Moment's rule .•.•.....
4. Time-temperature cooling curve
5. Freezing point apparatus
6. Solid-liquid phase diagram for the potassium-rubidium system ...•
7. Enlargement of the rubidium-rich side
Page
7
7
8
8
12
28
of the potassium-rubidium system . • . . . . 29
8. Comparison of the potassium-rubidium system with the previous work of Rinck
9. Comparison of the potassium-rubidium system with the previous work of Goria •••..
10.
11.
12.
Solid-liquid phase diagram for the rubidium-cesium system •...
Comparison of the rubidium-cesium system with the previous work of
Comparison of the rubidium-cesium system with the previous work of
vi
Rinck .
Goria .
30
31
33
. . 34
. . 35
CHAPTER I
INTRODUCTION
Recent technological developments in industry
have focused attention on alkali metals. For example,
heat transfer systems in fast nuclear reactors use liquid
sodium or sodium-potassium as a heat transfer fluid. .
Because of their high chemical reactivity, many technical
problems arise in using alkali metals. The rate at which
these problems can be solved depends upon the extent of
our knowledge of these metals and their compounds.
With the exception of the potassium-rubidium and
the rubidium-cesium systems, accurate and detailed solid-
liquid phase diagrams for all the alkali metal binary
systems containing sodium, potassium, rubidium and cesium
have previously been determined (1, 2, 3, 4) in this
laboratory. Liquid lithium is only partially soluble in
sodium, and even more immiscible with the heavier alkali
metals, disqualifying it as a major component in a low
melting alloy. It is the purpose of this present study to
obtain detailed and accurate phase diagrams for the systems
1
potassium-rubidium and rubidium-cesium, completing the
binary mixtures of sodium, potassium, rubidium and cesium.
Two workers have already made freezing point
measurements on potassium-rubidium and rubidium-cesium
solutions in order to determine the solid-liquid phase
diagrams for these systems (5, 6, 7, 8). These early
measurements were made without the advantage of high
quality inert atmosphere facilities, high purity chemicals
and platinium resistance thermometry. The results of
these investigators were, understandably, in very poor
agreement. Goria (5, 7) obtained a simple eutectic
without solid phase solubility for both systems, while
Rinck (6, 8) obtained continuous solid solutions in both
systems with a freezing point minimum at about 67 mole
% in the potassium-rubidium systems and about 50 \
mole % in the rubidium-cesium systems. The fr~_<:zing
point curve was very flat around the minimum in each case,
making it difficult to accurately establish the compo-
sition at this minimum point. The accuracy possible with
the facilities now available in our laboratory is at least
an order of magnitude better than that reported in e'ither
of the p~evious studies. As a result, it was considered
worthwhile to reinvestigate these systems. Of special
2
interest is the flatness of the solidus line at compo-
sitions around the minimum freezing point. Detailed
measurements in this region were made to investigate the
_possibility of the formation of eutectic mixtures or
intermetallic solid compounds.
3
.,j,•
CHAPTER II
THEORETICAL CONSIDERATIONS
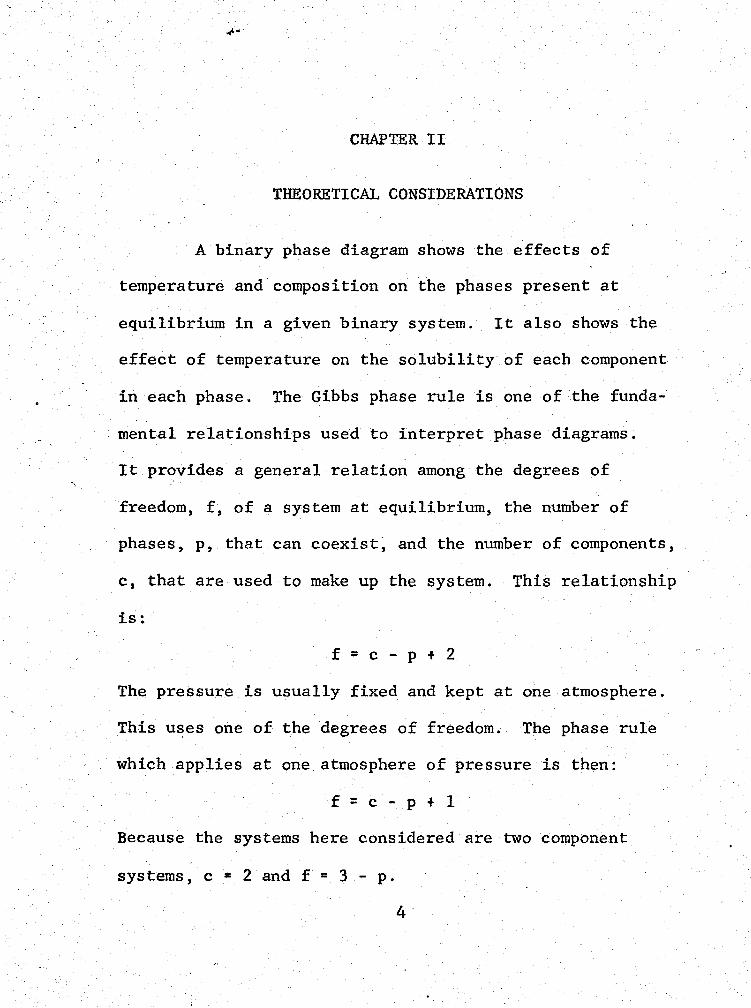
A binary phase diagram shows the effects of
temperature and composition on the phases present at
equilibrium in a given binary system. It also shows the
effect of temperature on the solubility of each component
in each phase. The Gibbs phase rule is one of the funda-
mental relationships used to interpret phase diagrams.
It provides a general relation among the. degrees of
freedom, f, of a system at equilibrium, the number of
phases, p, that can coexist, and the number of components,
c, that are used to make up the system. This relationship
is:
f = C - p + 2
The pressure is usually fixed and kept at one atmosphere.
This uses one of the degrees of freedom. The phase rule
which applies at one atmosphere of pressure is then:
f : C - p + 1
Because the systems here considered are two component
systems, c = 2 and f = 3 - p.
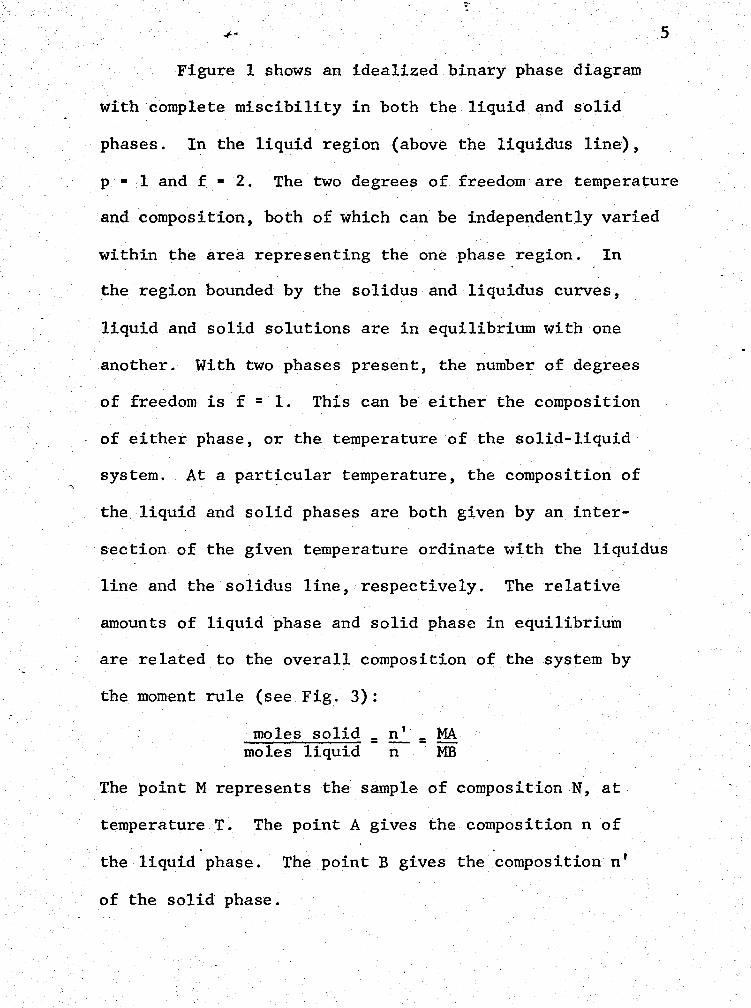
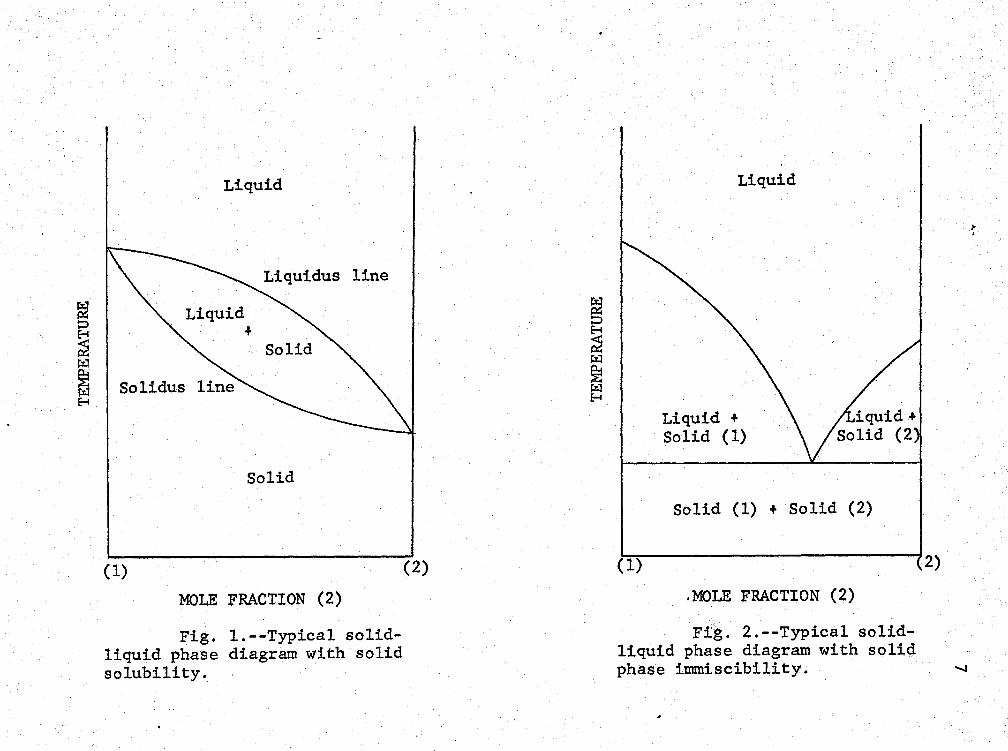
Figure 1 shows an idealized binary phase diagram
with complete miscibility in both the liquid and solid
phases. In the liquid region (above the liquidus line),
5
p • 1 and f • 2. The two degrees of freedom are temperature
and composition, both of which can be independently varied
within the area representing the one phase region. In
the region bounded by the solidus and liquidus curves,
liquid and solid solutions are in equilibrium with one
another. With two phases present, the number of degrees
of freedom is f = 1. This can be either the composition
of either phase, or the temperature of the solid-liquid
system. At a particular temperature, the composition of
the liquid and solid phases are both given by an inter-
section of the given temperature ordinate with the liquidus
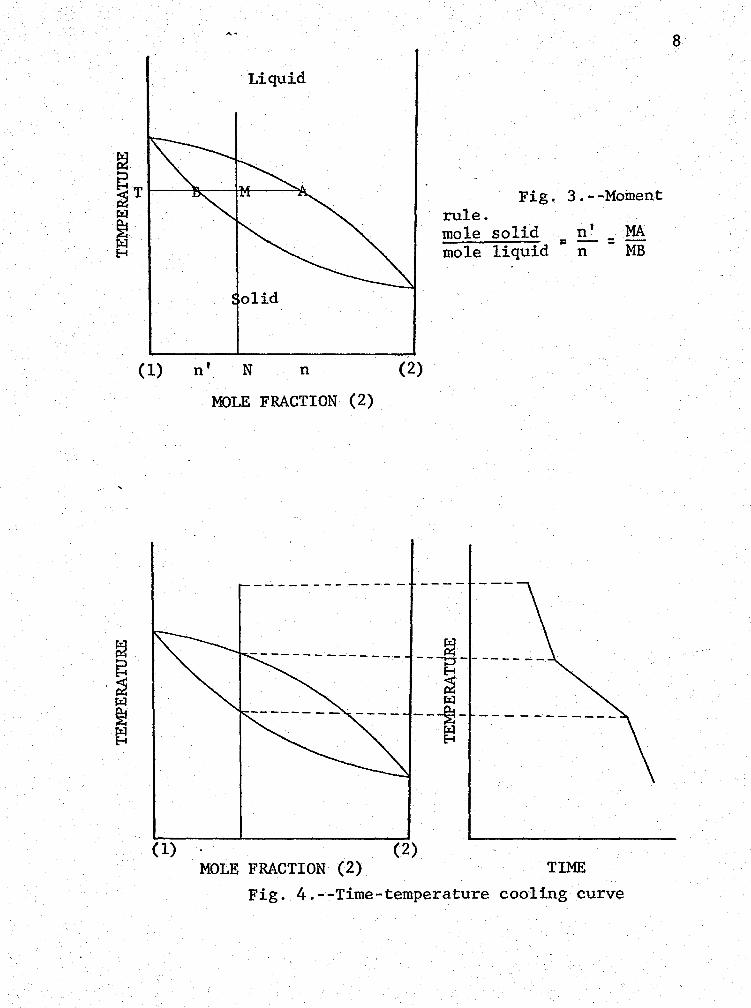
line and the solidus line, respectively. The relative
amounts of liquid phase and solid phase in equilibrium
are related to the overall composition of the system by
the moment rule (see Fig. 3):
moles solid moles liquid
n' MA = = n MB
The point M represents the sample of composition N, at
temperature T. The point A gives the composition n of
the liquid phase. The point B gives the ~omposition n'
of the solid phase.
,., . 6
Figure 2 shows a typical diagram for a system
with liquid phase miscibility and solid phase immiscibility.
At the eutectic point E, three phases are present, and the
number of degrees of freedom is f: 0. At this compo-
sition, the temperature stays constant until one of the
phases disappears. This temperature in a time-temperature
cooling or wanning curve is called the eutectic halt. Two
eutectic halts occur if the components react to form a
compound with a congruent melting point. A eutectic halt
and a peritectic halt occur if there is formation of a
compound with an incongruent melting point.
~ :::,
~ l':iJ
~ E-t
Liquid
Liquidus line
Solid
(1)
MOLE FRACTION (2)
Fig. 1.--Typical solid-liquid phase diagram with solid solubility.
(2)
~ ~ l':iJ
~ E-t
(1)
Liquid
Liquid+ Solid {1)
Solid (1) + Solid (2)
,MOLE FRACTION (2)
Fig. 2. --Typical solid-liquid phase diagram with solid phase immiscibility.
_:,
2)
....,
(1) n'
(1)
....
Liquid
N n
MOLE FRACTION (2)
(2)
Fig. 3.--Moment rule. mole solid n' MA mole liquid= n = MB
------------- ---- ---
~ ---::,--- ---- --~ rz:I
--~-~
(2) MOLE FRACTION (2) TIME
Fig. 4.--Time-temperature cooling curve
8
'. ~-
CHAPTER III
EXPERIMENTAL
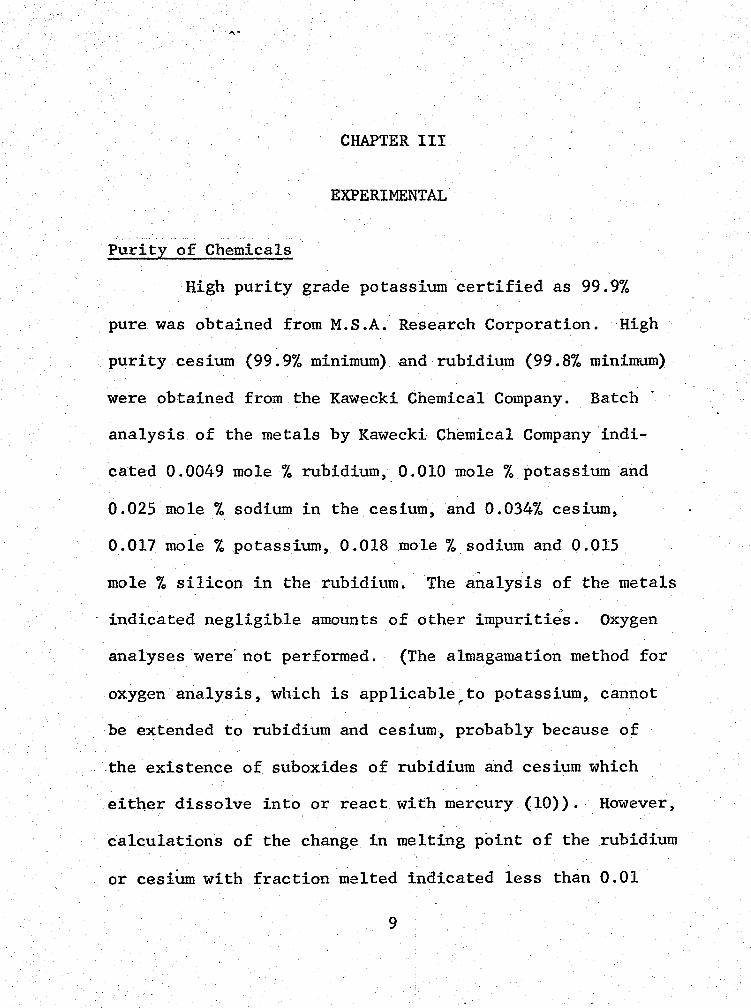
Purity of Chemicals
High purity grade potassium certified as 99.9%
pure was obtained from M.S.A. Research Corporation. High
purity cesium (99.9% minimum) and rubidium (99.8% minimum)
were obtained from the Kawecki Chemical Company. Batch·
analysis of the metals by Kawecki Chemical Company indi-
cated 0.0049 mole% rubidium,_ 0.010 mole% potassium and
0.025 mole% sodium in the cesium, and 0.034% cesium,
0.017 mole% potassium, 0.018 mole% sodium and 0.015
mole% silicon in the rubidium. The analysis of the metals
indicated negligible amounts of other impurities. Oxygen
analyses were· not performed .. (The almagamation method for
oxygen analysis, which is applicable to potassium, cannot r
be extended to rubidium and cesium, probably because of
the existence of suboxides of rubidium and cesium which
either dissolve into or react with mercury (10)). However,
calculations of the change in melting point of the rubidium
or cesium with fraction melted indicated less than 0.01
9
mole% oxygen.
than 99.9% pure.
Both metals are considered to be better
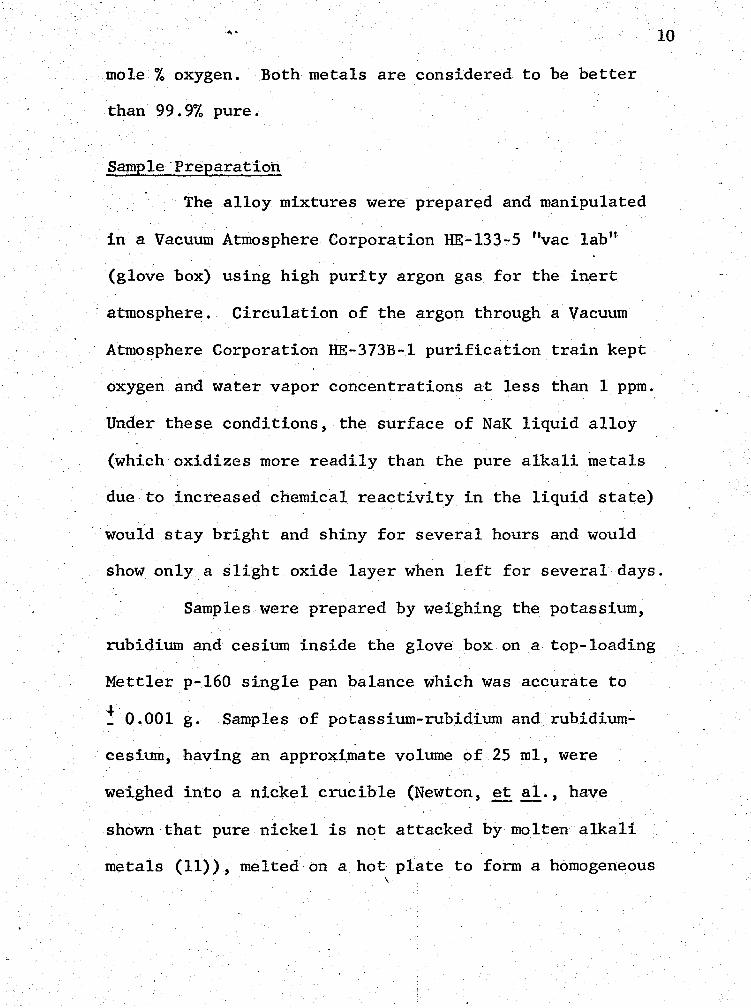
Sample·Preparatioh
10
The alloy mixtures were· prepared and manipulated
in a Vacuum Atmosphere Corporation HE-133-5 "vac lab"
(glove box) using high purity argon gas for the inert
atmosphere. Circulation of the argon through a Vacuum
Atmo~phere Corporation HE-373B-1 purification train kept
oxygen and water vapor concentrations at less than 1 ppm.
Under these conditions, the surface of NaK liquid alloy
(which oxidizes more readily than the pure alkali metals
due to increased chemical reactivity in the liquid state)
would stay bright and shiny for several hours and would
show only a slight oxide layer when left for several days.
Samples were prepared by weighing the potassium,
rubidium and cesium inside the glove box on a top-loading
Mettler p-160 single pan balance which was accurate to
~ 0.001 g. Samples of potassium-rubidium and rubidium-
. cesium, having an approximate volume of 25 ml, were
weighed into a nickel crucible (Newton, et al., have
shown that pure nickel is not attacked by molten alkali
metals (11)), melted on a hot plate to form a homogeneous \
....
liquid solution and then transferred into the freezing
point apparatus.
The weights of alkali metals to be used to obtain
a 25 ml sample were calculated using the atomic weights
11
of 3~.102, 85~47, and 132.905, and the densities of 0.83
g/cm3, 1.475 g/cm3, and 1.873 g/cm3 for potassium, rubidium
and cesium respectively.
To conserve rubidium and cesium metal, some samples
were prepared in a similar manner by dilution of an alloy
sample of known composition.
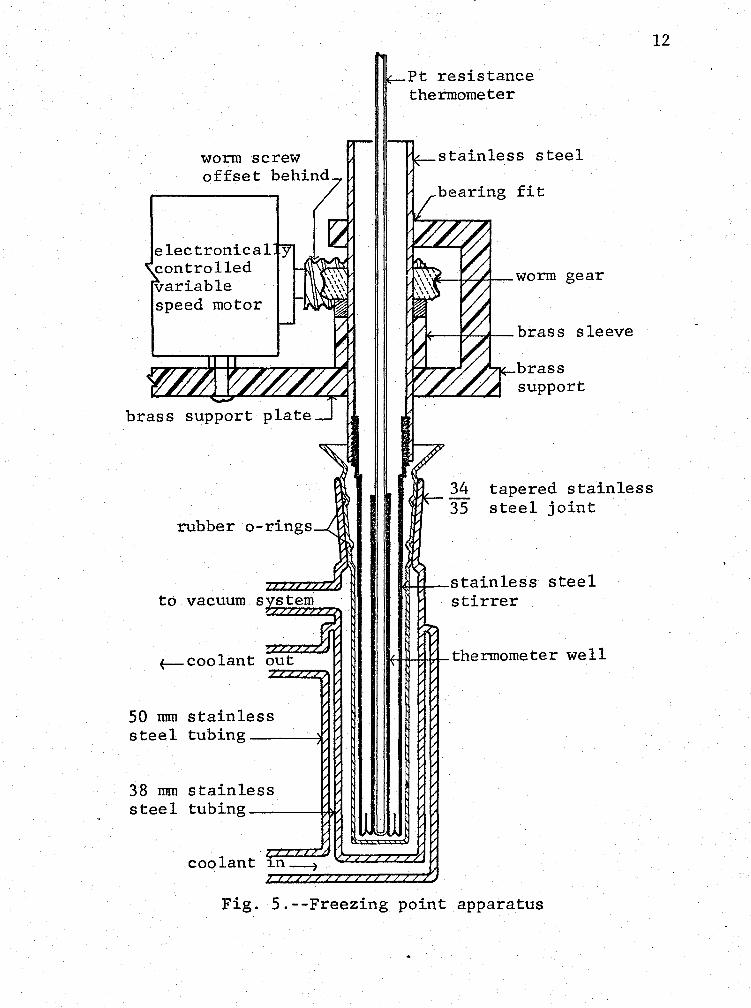
Apparatus
The apparatus used for making the freezing point
measurements is shown in figure 5. It was contained
inside the argon glove box, so that all operations from
preparation of sample to the final measurements were made
with minimal chance for contamination of the metals with
oxide. The apparatus was suspended in the glove box from
a brass plate at the top of the box. The sample was
contained in a double jacketed stainless steel sample
tube. Liquid nitrogen circulating through the outer jacket
and a heating tape wound around the outside of the jacket
provided the temperature variability needed to obtain
worm screw offset behind
electronical controlled variable speed motor
rubber
50 mm stainless steel tubing ___ _
38 mm stainless steel tubing ___ -+,N,IJ
coolant
Pt resistance thermometer
stainless steel
bearing fit
brass support
34 tapered stainless 35 steel joint
tM!--1,-1---stainless steel stirrer
Fig. 5.--Freezing point apparatus
12
13
time-temperature cooling and warming curves. The inner
jacket could be filled with helium exchange gas or eva-
cuated to a reproducible gas pressure. The rate of cooling
or warming was controlled by varying the pressure of the
helium exchange gas in the inner jacket, as well as by
varying the speed of circulation of liquid nitrogen through
the jacket, or the electrical current through the heating
tape. Rotary stirring was accomplished by a stainless
steel stirrer tube driven through a worm gear by a
variable speed motor.
A thermometer passed through the brass plate
down through the center of the stirrer tube and into a
thermometer well in the center of the sample tube. A
Veeco Quick Vacuum coupling was used to seal the thermo-
meter into the brass plate. With this arrangement, the
thermometer could be readily raised and lowered into the
thermometer well without contaminating the atmosphere in
the glove box.
Temperature Scale
Temperatures were measured with a Leeds and North-
rup platinium resistance thermometer in combination with a
Leeds and Northrup high precision resistance recorder. The
14
thermometer (No. 1424247) was calibrated by Leeds and
Northrup at the well-established ice, steam, sulfur and
oxygen points. The calibration was checked at the ice
point (273.150° K), the mercury freezing point (234.29° K),
and the sodium sulfate decahydrate transition temperature
(305.534° K) before, during and at the conclusion of the
experiments. In all cases, the values obtained agreed
with the calibration to within! 0.01° K. The temperature
scale is estimated to be accurate to at least t 0.02° K
over the range of the experimental measurements here
considered.
.-
.,., .
CHAPTER IV
RESULTS
Measurements
Solidus and liquidus points were determined from
thermal measurements, over the entire composition range,
for both the potassium-rubidium and rubidium-cesium
. systems. Time-temperature cooling curves were obtained
by starting with a "hot" completely melted sample. The
sample was cooled at a uniform rate until solidified. The
sample was stirred at a uniform rate during the cooling
until the· stirrer froze up. A continuous time-temperature
cooling curve (in terms of thermometer resistance) was
traced out on the high precision resistance recorder.
Time-temperature warming curves were obtained in a similar
manner. A completely solid sample was heated uniformly
until it completely melted. The sample was stirred as
soon as the stirrer would go.
Breaks in the time-temperature curves give the
solidus and liquidus points as shown in figure 4. On
cooling the system, a decrease in the slope of the cooling
15
16
curve is observed when the separation of the first solid
solution begins. From this point on, heat must be removed
to provide for the solidification of the liquid, as well
as to cool the liquid and solid present. Thus, since part
of the heat removed is heat of solidification, cooling
takes place more slowly when solid and liquid are both
present. The proportional amount of solid to liquid
increases as the sample solidifies. Since solid and
liquid have different heat capacities, the total heat
capacity of the system is not constant; and hence, the
slope of the cooling curve is not constant.· When the last
of the liquid solution solidifies, the slope of the cooling
curve increases again. The heat capacity of the solid
phase is essentially invariant over the temperature range
involved. Hence, the slope of the cooling curve will be
essentially constant.
When a compound is formed in a binary system
consisting of components either totally soluble, partially
soluble or insoluble in the solid state, the cooling curve
is analogous to that of any pure substance with a character-
istic melting point halt for the liquid at the composition
of the compound. Freezing point minima or maxima can also
give an invariant halt even though a compound does not form.
.... 17
At least three successive time-temperature cooling
and warming curves were obtained for each sample. In the
system studied, the solidus and liquidus temperatures
were determined in each run by changes in the slope of
both the cooling and warming curves. The agreement was
well within the experimental error, indicating that phase
segregation was not a problem in the determination of the
solidus point. The results of the measurements are
summarized in Tables 1 and 2, and the phase diagrams are
shown in Figures 5 and 6. The liquidus points are con-
sidered accurate to f 0.1° Kin both systems.
In the rubidium-cesium system, the time-
temperature curves were very flat around the freezing point
minimum (0.45-0.60 mole fraction cesium). It was easy
to detect and reproduce the solidus point in this region
to within f 0.2° K. This can be accomplished by extrapo-
lating the time-temperature curves before and after
melting began to an intersection point. Over the rest
of the composition range, the change in slope near the
solidus point was too gradual to find an intersection
point with precision. When this occurred, uncertainty
in the extrapolation to the solidus point was decreased
by replotting the data in a form dictated by an equation
~- 18
derived from Newton's law of cooling. Newton's law can
be written in the form:
rt = k (Ts - T) (1)
Where Ts is the temperature of the surroundings, Tis the
temperature of the system, and k is a constant. Prior to
the start of melting at constant pressure,-
_q - C dT - P
Where Cp is the heat capacity at constant pressure.
Combining equations (1) and (2) to eliminate Q and
integrating, assuming Cp and Ts constant gives:
ln (Ts - T) =Kt+ c
Where c is the constant of integration and K = - h. p
The data were plotted as ln (Ts - T) versus time. This
(2)
(3)
temperature function is linear with time for that part of
the warming process prior to the start of melting. With
this region straightened, the sensitivity of the method
is increased by plotting a difference function:
0 = ln (Ts - T) - (Kt+ c) (4)
versus time from the time-temperature data. According to
equation (4), a plot of T versus t should follow the
abscissa µntil melting starts. The poin,t at which
deviation from the abscissa occurs gives the solidus point.
.... 19
The details of this method are given in the literature
(12). Using this technique, the uncertainty of the solidus
points as given in Table 1 are estimated to be less than
~ 0.5° K. This estimation is valid for the steep portion
of the rubidium-cesium phase diagram,on either side of
the freezing point minimum, where the corresponding slope
of the time-temperature cooling and warming curves is
steep.
In the potassium-rubidium system, the time-
temperature curves were very flat over a large portion of
the composition range (0.55-1.00 mole fraction rubidium).
In this region, very reproducible solidus points were
easily obtained directly from the time-temperature curve.
These points are considered to be accurate to i 0.10° K.
Over the rest of the composition range, the change in ->
slope was too gradual to obtain the solidus points
directly from the curve with much accuracy. On the other
hand, the liquidus point was so close to the solidus point
that the curve straightening technique could not be used
to improve the accuracy. Some of the solidus points in
this region are uncertain by as much as f 1° K.
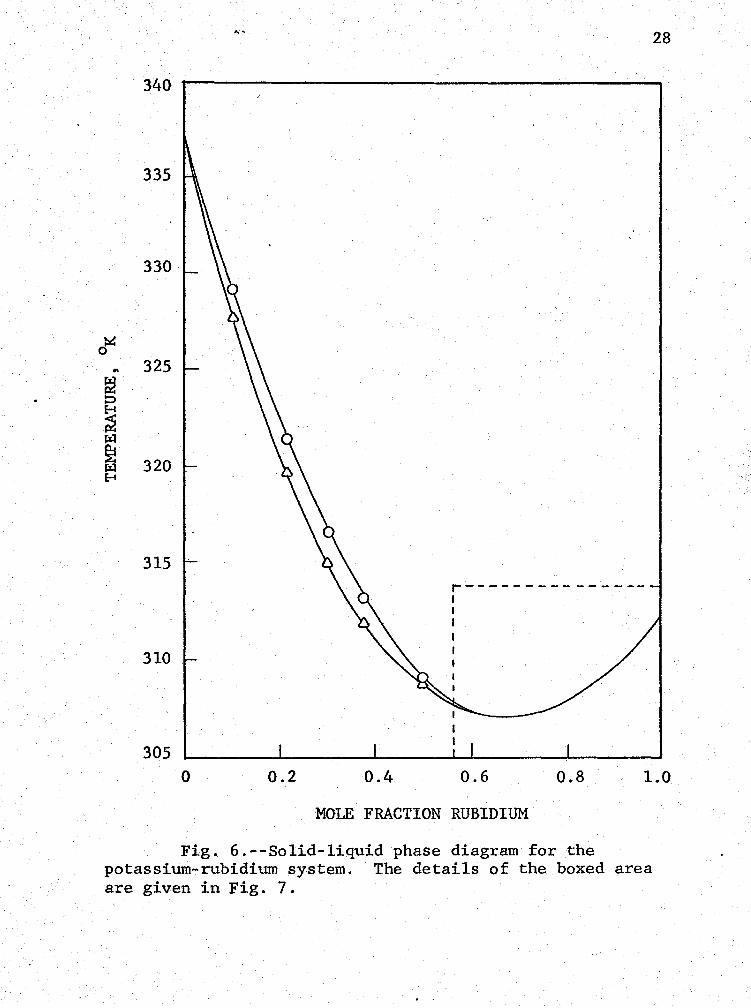
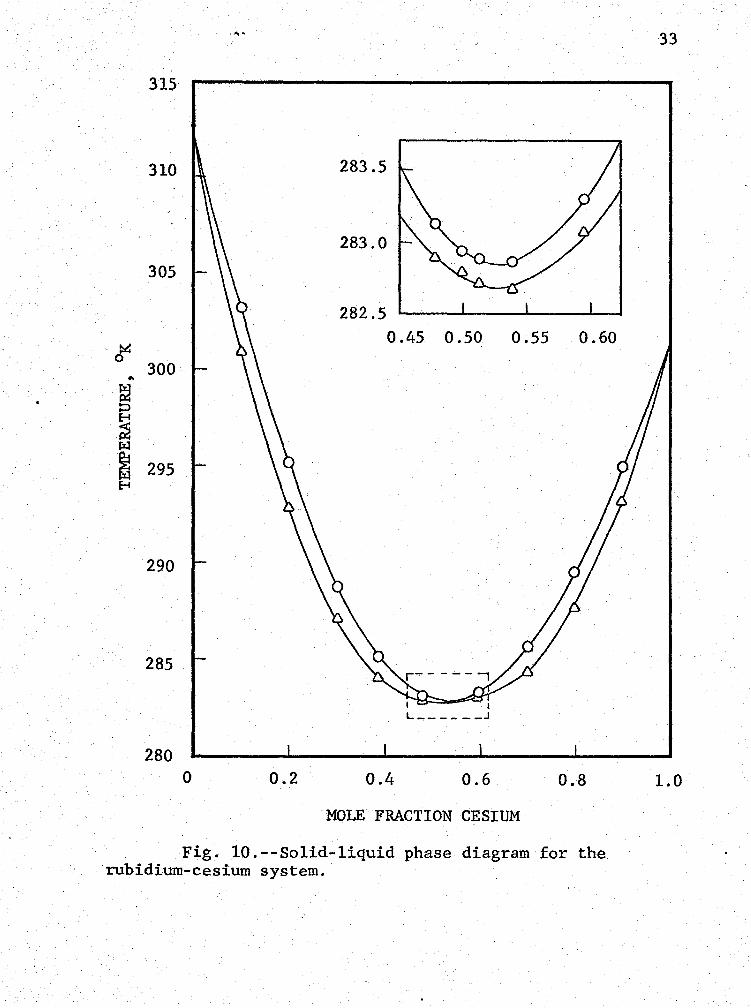
It is apparent from Figures 6 and 8 that both the .
potassium-rubidium and the rubidium-cesium systems form
.... 20
solid solutions of continuously varying composition. A
freezing point minimum where the composition of liquid
and-solid are identical is present in each system. The
liquidus lines have zero slopes at the freezing point
minimum, which is indicative of solid solution ~ather than
eutectic formation. Furthermore, the solidus lines have
measurable non-zero slopes on either side of the solid
solution minimum. The solidus and liquidus curves lack
0.05° Kand 0.15° K of merging in the potassium-rubidium
and rubidium-cesium systems,respectively. These are
about the differences that would be expected from the
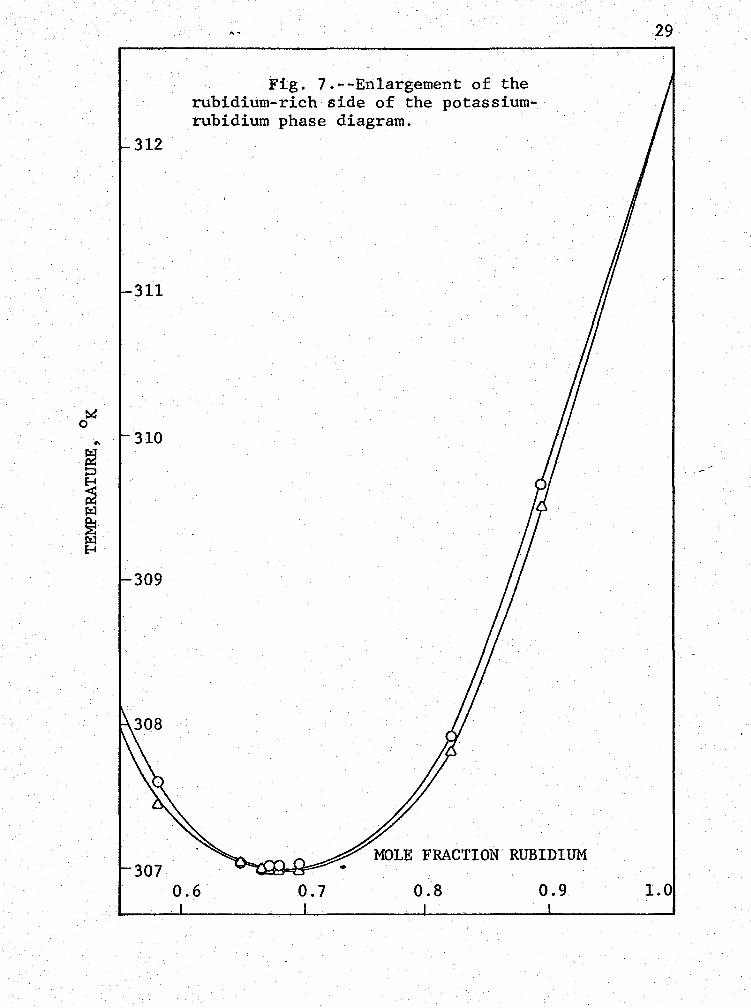
impurities in the samples. The potassium-rubidium system
is especially interesting in that the solidus and liquidus
points are very close together. The two phase region
exists over a very narrow temperature range. Figure 3 is
an enlargement of the rubidium rich side of this diagram.
The maximum temperature difference in this region between
the solidus and liquidus lines is only 0.15° K. The
freezing point minimum occurs at 0.667 mole fraction
rubidium and 0.530 mole fraction cesium in the potassium-
rubidium and rubidium-cesium systems, respectively. It
has been shown iri an earlier paper (1) that the potassium-
cesium system has a solid solution minimum at 0.500 mole
21
fraction cesium. It is interesting that in the two systems
which contain potassium (potassium-rubidium and potassium-
cesium), the minimum occurs at a single stoichiometric
ratio, suggesting the possible formation of an inter-
metallic compound, K - Rbz or K - Cs. The thermal data
alone, however, are not sufficient to confirm the existence
of a compound.
Comparison with Other Work
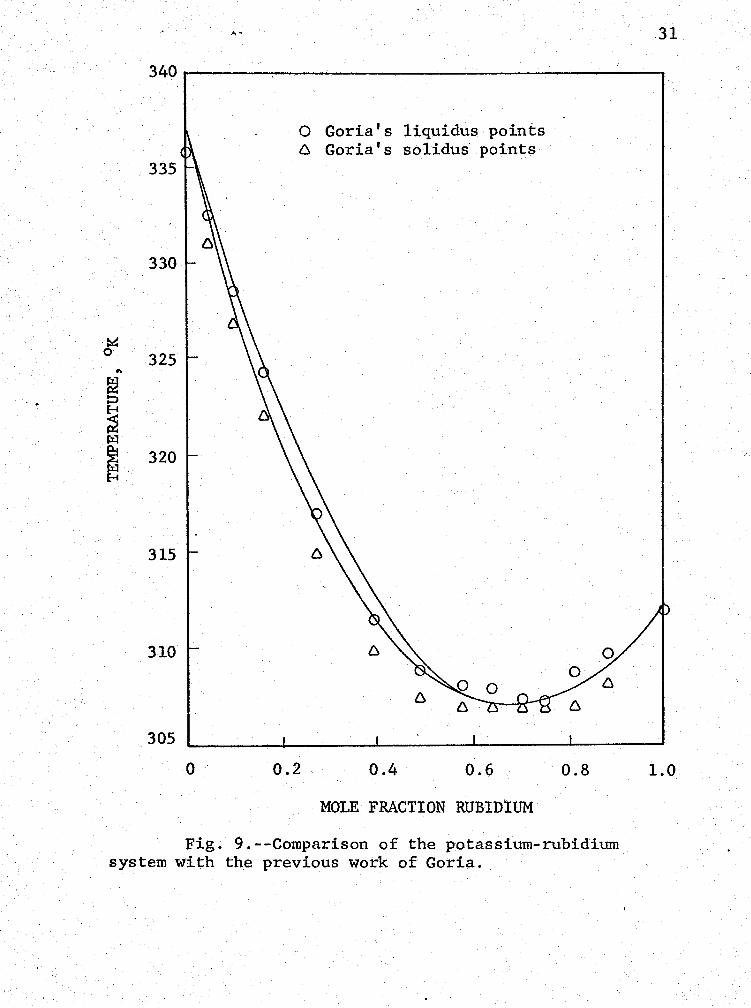
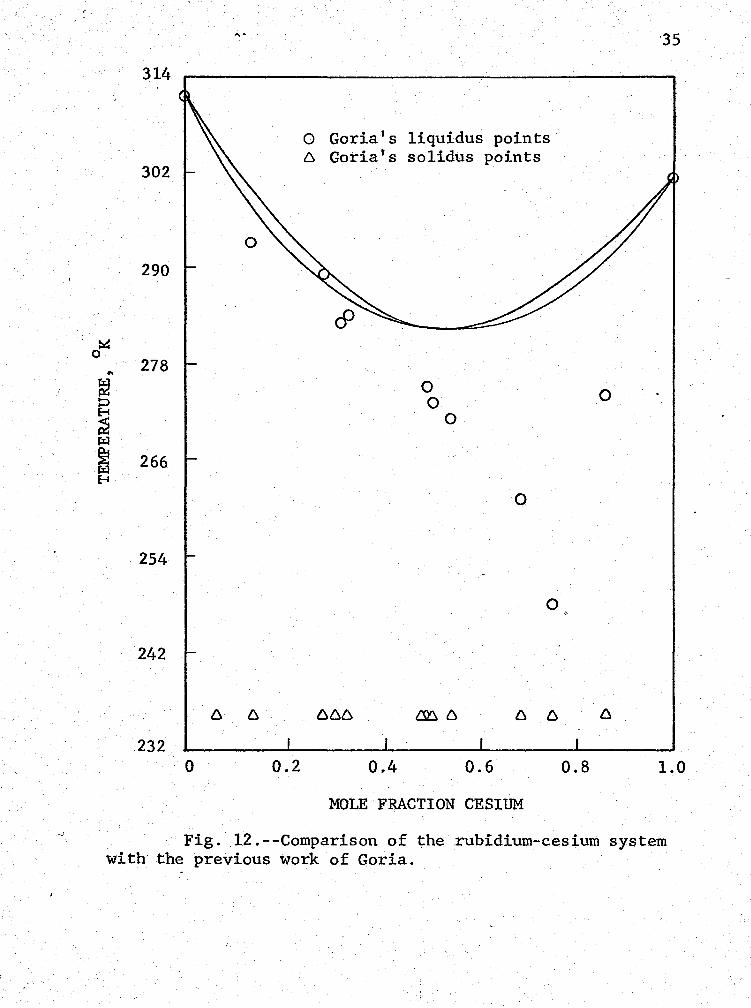
It is difficult to compare the experimental results
of this study with· the earlier work of Goria (5, 7), since
he proposed simple eutectics for both systems. Figure 9
compares the potassium-rubidium system and Figure 12
compares the rubidium-cesium system with the previous
work of Goria (5, 7).
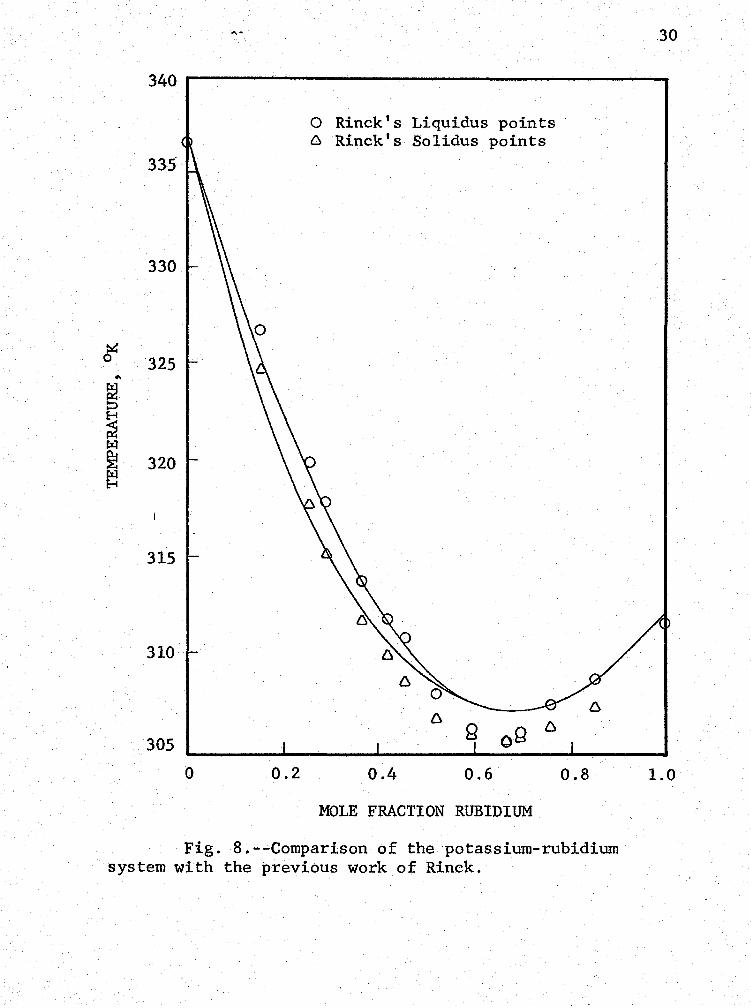
The results of this study are in agreement with
Rinck (6, 8) that a series of continuously variable
solid solutions forms in both systems. In the potassium-
rubidium system, both the solidus and the liquidus points
of Rinck (6) are within one degree of the values .obtaig_ed
in this study. The freezing point minima are in excel-
lent agreement in the two sets of data. In general,
on both sides of the freezing minimum, Rinck!.s (6)
.... 22
liquidus points are a little higher than the ones obtained
in this study, while his solidus points are a little lower.
The larger two-phase region which resulted can probably be
accounted for by the larger amount of impurities found in
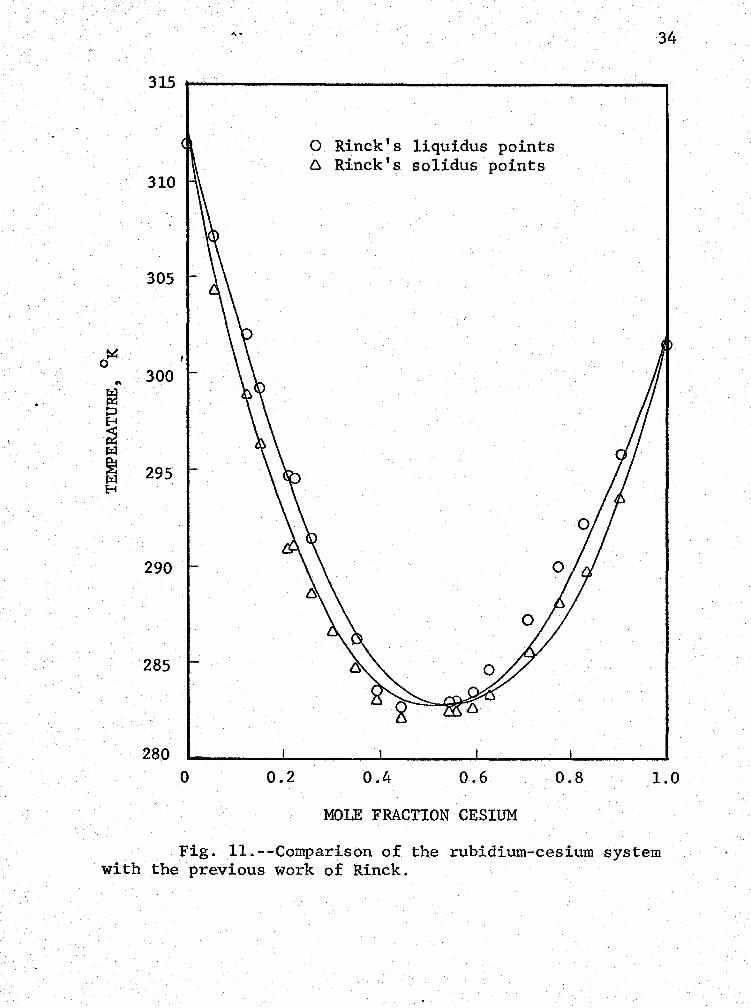
his samples. For the rubidium-cesium system, Rinck (8)
reported a freezing point minimum at 50 mole%, at which
value his freezing point is about 1° K lower than the
observed value. Both his liquidus and solidus points
increase in temperature more rapidly than these data
would indicate on either side of the minimum. At 0.25
mole fraction cesium, Rinck (8) is about 1.5° K higher
for both solidus and liquidus, while at 0.75 mole fraction
cesium, his data agree closely with the results of this
study. Figure 8 compares the potassium-rubidium system
and Figure 11 compares the rubidium-cesium system with
the previous work of Rinck.
CHAPTER V
CONCLUSION
The_rmal methods of high precision .were used to
determine the solid-liquid phase equilibria diagrams fo}
the potassium-rubidium and the rubidium-cesium systems.
Both form solid solutions of continuously variable compo-
sition. The minima in the liquidus curves occur at
307.000° Kand 0.667 mole fraction rubidium in the potas-
sium-rubidium system, and 282.85° Kand 0.530 mole
fraction cesium in the rubidium-cesium system.
It is interesting to speculate on the nature of
the solid solutions in these systems. Three kinds of
solid solutions must be given consideration. The first
·one is the substitutional solid solution. According to
Hume-Rothery, complete miscibility of two metals resulting
from this type of solid solution can occur only if (1) the
crystal structure of the two metals is essentially the
same so that replacement at random of one metal atom by
the other·can proceed with a minimum of rearrangement of
the crystal lattice; (2) the diameters of the solute
23
I
.....
and the solvent atoms differ by less than 13% so that the
replacement proceeds with a minimum of distortion of the
structure; (3) the two metals exhibit small differences
in electronegativity and valence to minimize the possible
interaction forces. Mixing of two metals meeting these
three conditions produces a solid solution·in which the
geometrical arrangement of the atoms is the same as in
each pure metal, with the two kinds of atoms arranged at
random.
24
The second type of solid solution to consider
results from the formation of the Laves phase. This phase
results when the atoms of one component fill the holes of
the crystal lattice of the other component. The result is
a stoichiometric solid solution of formula AB2, KNa2 is
one of the primary examples of this type of system. Laves
and Wallbaum (14) investigated the importance of geometrical
factors required in forming the Laves phase. The deter-
mining factor is the relative sizes of the constituent atoms. ' On the basis of a.hard sphere packing model, A atoms
touching A atoms and B atoms touching B atoms, the ideal
ratio. EA of the atomic radii for the formation of the Laves rB.
phases is 1.23. In practice, the Laves'phases are observed
radius ratio in the range_ 1.06 to 1.68, based on the
....
Goldschmidt radii. A and B atoms having a wide range of
Goldschmidt radii contract or expand in order to achieve
the effective ratio.
-25
The third type is the interstitial solid solution.
Hume-Rothery (13) states that for interstitial solid
solution.to occur, the solute atoms must b~ very much
smaller than those of the solvent so that the solute atoms
can enter the interstitial vacancies in the solvent.
The freezing point minimum in the potassium-
rubidium system occurs at 0.667 mole fraction rubidium,
suggesting the possible formation of the intermetallic
compound KRb2. Among the alkali metals, two compounds,
KNa2 and CsNa2, are known to form. KNa2 is a Laves phase
which depends on the size factor for its existence. The
crystal structure of CsNa2 has not been identified (18).
The Goldschmidt radius ratio of KRb2 (if KRh2 exists),
KNa2 and CsNa2 are 0.94, 1.24 and 1.31, respectively. The
ratio for KRb2 is not within the range found for the Laves
phase.
It seems reasonable to conclude that Laves phase
solubility does not occur. It is not possible to rule out
the formation of a different type of stoichiometric solid
solution. However, most probably, substitutional solid
-26
solutions form in both the potassium-rubidium and rubidium-
cesium systems. The atoms are next to each other in the
same group of the periodic table. The electronegativity
differences-are small between adjacent pairs in the series
potassium, rubidium and cesium; and they all form the
body centered cubic structure with differences in atomic
radii of about 5.37% for potassium and rubidium and about
7.36% for rubidium and cesium.
--

APPENDIX
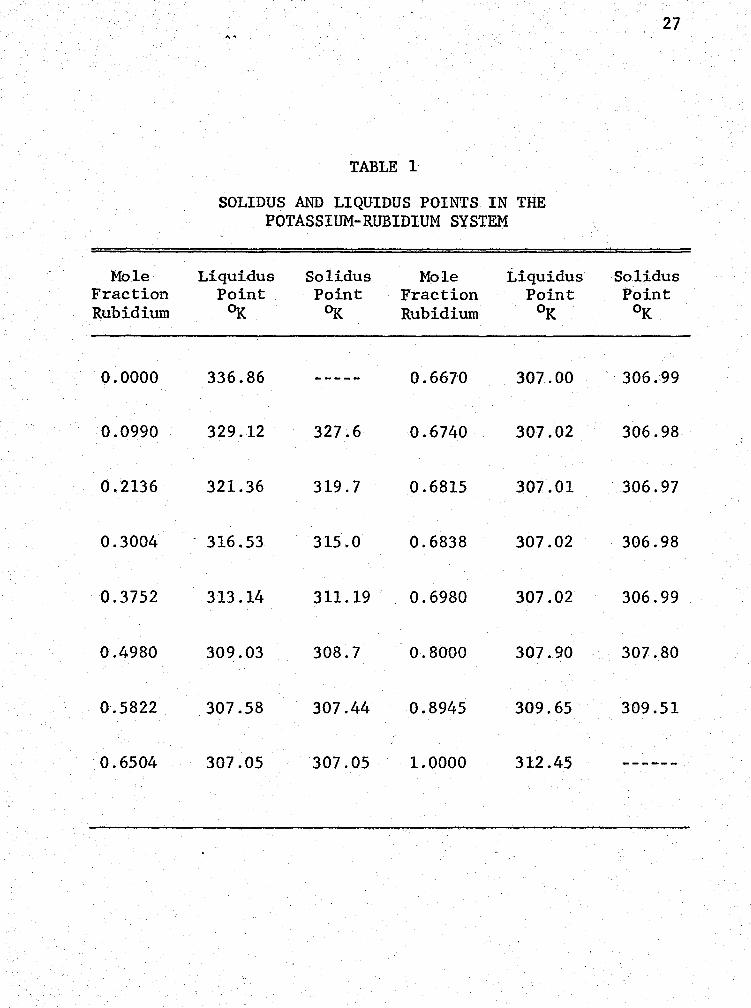
Mole Fraction Rubidium
0.0000
0.0990
0.2136
0.3004
0.3752
0.4980
0.5822
0.6504
....
TABLE 1
SOLIDUS AND LIQUIDUS POINTS IN THE POTASSIUM-RUBIDIUM SYSTEM
Liquidus Point °K
336.86
329.12
321.36
316.53
313 .14
309.03
307.58
307.05
Solidus Point
°K
327.6
319. 7
315.0
311.19
308.7
307.44
307.05
Mole Fraction Rubidium
0.6670
0.6740
0.6815
0.6838
0.6980
0.8000
0.8945
1.0000
Liquidus Point
OK
307.00
307.02
307.01
307.02
307.02
307.90
309.65
312.45
27
Solidus Point
OK
306.99
306.98
· 306. 97
306.98
306.99
307.80
309.51
28 340 ,_ ____________________ _
335
330
~ .. 325 g} ::,
~ ll:'.I t 320 E-4
315 r---------------1 I I
310
305 0 0 .2 · 0.4 0.6 0.8 1.0
MOLE FRACTION RUBIDIUM
Fig. 6.--Solid-liquid phase diagram for the potassium-rubidium system. The details of the boxed area are given in Fig. 7.
312
311
~ 0 .. 310 ~ ::::,
~ ~
~ r1l E-t
309
307
Fig. 7.--Enlargement of the rubidium-rich side of the potassium-rubidium phase diagram.
MOLE FRACTION RUBIDIUM
0.6 0.7 0.8 0.9
29
1.0
.30
340 ,----------------------
335
330
325
320
315
310
305 0 0.2
0 Rinck' s Liquidus points 6 Rinck' s Solidus points
0.4 0.6
MOLE FRACTION RUBIDIUM
0.8
Fig. 8.--Comparison of the potassium-rubidium system with the previous work of Rinck.
1.0
. .
..... .31
340--------------------
.335
330
~ 0 325 .. ~ 0
~ l'.xl ~ 320 l'.xl E-1
315
310
305
0
0 Goria's liquidus points 6 Goria's solidus points
0.2 0.4 0.6
MOLE FRACTION RUBIDIUM
0.8
Fig. 9.--Comparison of the potassium-rubidium system with the previous work of Goria.
1.0
...
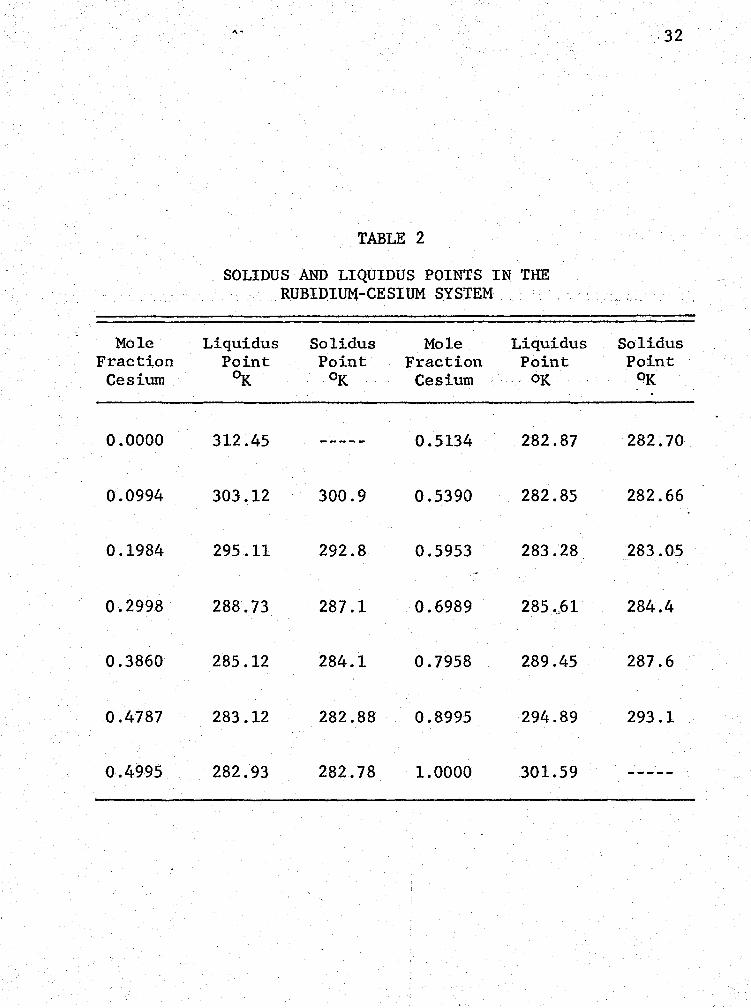
TABLE 2
SOLIDUS AND LIQUIDUS POINTS IN THE RUBIDIUM-CESIUM SYSTEM
Mole Liquidus Solidus Mole Liquidus Fraction Point Point Fraction Point
Cesium °K °K Cesium · OK
0.0000 312.45 ----- 0.5134 282.87
0.0994 303.12 300.9 0.5390 282.85
0.1984 295.11 292.8 0.5953 283.28
0.2998 288.73 287 .1 0. 6989 285 •.,61
0.3860 285.12 284.1 0.7958 289.45
0.4787 283.12 282.88 0.8995 294.89
0.4995 282.93 282.78 1.0000 301.59
-32
Solidus Point
0K
282.70
282.66
283.05
284.4
287.6
293.1
....
315
310 283.5
283.0 305
282.5 0.45
~ 0.50 0.55 0.60
0 300
"' t1 ::>
~ 'lzl
t 295 E-1
290
285
280 0 0.2 0.4 0.6 0.8
MOLE FRACTION CESIUM
Fig. 10.--Solid-liquid phase diagram for the rubidium-cesium system.
·33
1.0
~ 0 .. t! :=>
~ f:rl ~ f:rl E-1
... 34 315 ..,_ ____________________ _
310
305
. 300
295
290
285
280 0 0.2
0 Rinck' s liquidus points D. Rinck' s solidus points
0.4 0.6
MOLE FRACTION CESIUM
0.8 1.0
Fig. 11.--Comparison of the rubidium-cesium system with the previous work of Rinck.
✓
314
302
290
-~ 0 .. 278 tJ :::>
~ 1;1:1
~ 266 E--1
254
242
232 0 0.2
O Goria's liquidus points 6 Goria's solidus points
0 0
0
0
0
0.4 0.6
MOLE FRACTION CESIUM
·35
0
0.8 1.0
Fig. 12.--Comparison of the rubidium-cesium system with the previous work of Goria.
LITERATURE CITED
1. J.B. Ott, J. R. Goates, D. R. Anderson, and H. T. Hall,. Jr., Trans. Faraday Soc., 66, 25 (1970).
2. J. R. Goates, J. B. Ott, and C. C. Hsu, Trans. Faraday Soc., 66, 25 (1970).
3. J.B. Ott, J. R. Goates, and D. E. Oyler, Trans. Fara-day Soc., (In press).
4. J. R. Goates, J. B. Ott, and H. Tracy Hall, Jr.' J. Chem. Eng. Data, (In press).
5. c. Goria, Gazz. chim. ital., 65, 865 (1935).
6. E. Rinck, Compt. rend., 200, 1205 (1935).
7. C. Goria, Gazz. chim ital., 65, 1226 (1935).
8. E. Rinck, Compt. rend., 205, 135 (1937).
9. ·F. Tepper, the Chemical Society, 22, 372 (1967).
10. Hatterer, the Chemical Society, 22, 354 (1970).
11. R. C. Newton, et al., J. Graphys. Res., 67, 2559 (1962).
12. PhD dissertation by D. Ray Anderson, Dept. of Chemistry, Brigham Young University, Provo, Utah.
13. W. Hume Rothery, et al., "Metallurgical Equilibrium Diagrams," Chapman and Hall, Ltd., London (1952).
14. F. Laves and H. J. Wallbaum, z. anorg. Allgem. Chem. 250, 110 (1942).
15. Klem and Kunz, Chem. Soc. (London), Spec. Puhl. No. 22, 3 (1967).
16. B. W. Mott, Chem. Soc. (London), Spec. Puhl. No. 22, p. 95.
36
...
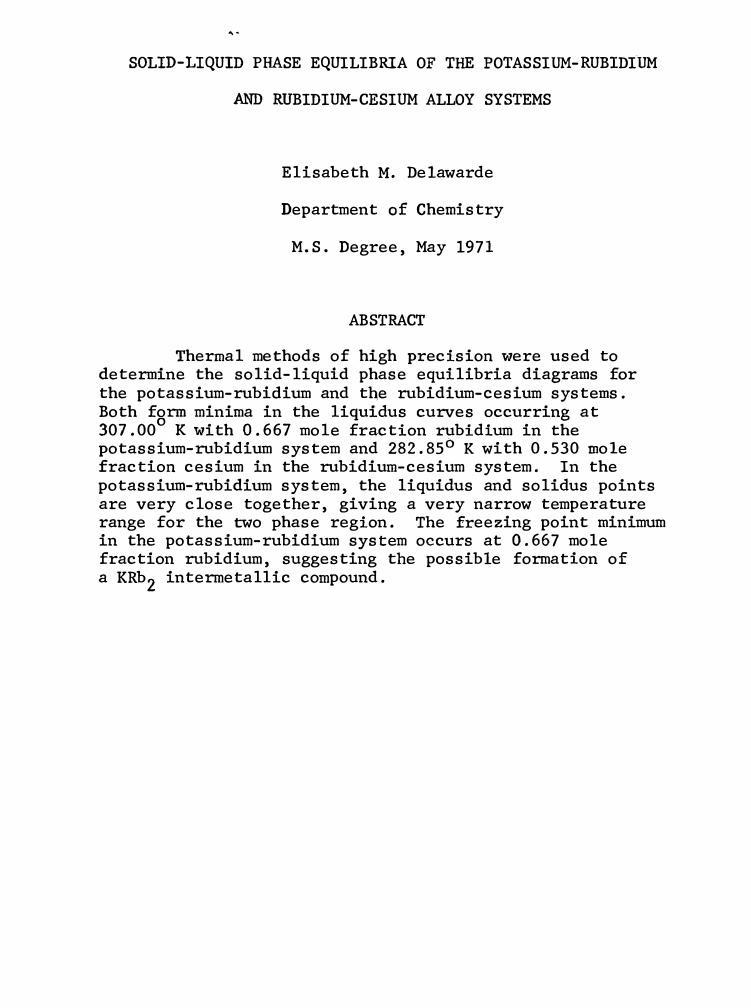
SOLID-LIQUID PHASE EQUILIBRIA OF THE POTASSIUM-RUBIDIUM
AND RUBIDIUM-CESIUM ALLOY SYSTEMS
Elisabeth M. Delawarde
Department of Chemistry
M.S. Degree, May 1971
ABSTRACT
Thermal methods of high precision were used to determine the solid-liquid phase equilibria diagrams for the potassium-rubidium and the rubidium-cesium systems. Both form minima in the liquidus curves occurring at 307.00
° K with 0.667 mole fraction rubidium in the
potassium-rubidium system and 282.85° K with 0.530 mole fraction cesium in the rubidium-cesium system. In the potassium-rubidium system, the liquidus and solidus points are very close together, giving a very narrow temperature range for the two phase region. The freezing point minimum in the potassium-rubidium system occurs at 0.667 mole fraction rubidium, suggesting the possible formation of a KRb2 intermetallic compound.