Embed Size (px)
Citation preview

“Solid and profitable with potential for growth”
1
JP Morgan London Small/Mid Cap Conference September 8th; 2015
Disclaimer
2
This document has been prepared by NATURHOUSE HEALTH S.A. (“NATURHOUSE” or the “Company”) for its exclusive use during the presentations to investors. NATURHOUSE does not authorise its dissemination, publication or use by any other person, whether physical or legal, to an end other than that which has been expressed above, unless they have prior express consent in writing from NATURHOUSE, and neither does it, consequently, accept any responsibility for the content of the document if it is used to an end other than that expressed above without the authorisation of the Company. Readers are warned that the information in this document has not been audited by the Company’s auditors and it has been summarised. The information and the opinions and statements contained in this document have not been verified by independent third parties and, unless another source is expressly mentioned, they have been drawn up by the Company. This document contains forecasts and estimates relating to the business progress or results of the Company in the future. These forecasts respond to the current opinion and expectations of NATURHOUSE HEALTH, S.A. These forecasts, that are uncertain by nature, are affected by risks, including those mentioned in the prospectus for the IPO and the offering and listing of NATURHOUSE shares, approved by the CNMV (Spanish stock exchange commission) and recorded in its official register on 9 April 2015, and it is available to investors on the issuer’s website (www.naturhouse.com) and that of the CNMV (www.cnmv.es). These risks may cause real results to be significantly different to said forecasts or estimates. The contents of this document must be taken into account by all individuals or entities that may have to make decisions or draw up or disseminate opinions regarding shares issued by NATURHOUSE HEALTH SA, and in particular by the analysts that make use of this document. This document is not an offer of sale or subscription and neither is it an invitation to subscribe to or acquire NATURHOUSE shares or any other securities in Spain or in any other jurisdiction.
Contents
Description of the business model
The Naturhouse Method
Naturhouse Centres
Contractual Framework: Franchises and Master Franchises
International Growth
Main Figures
Centres
Main Figures from the Profit and Loss Account
Net Cash Position and Dividends
Strategy and Outlook
Naturhouse vs. Peers
Conclusions
3
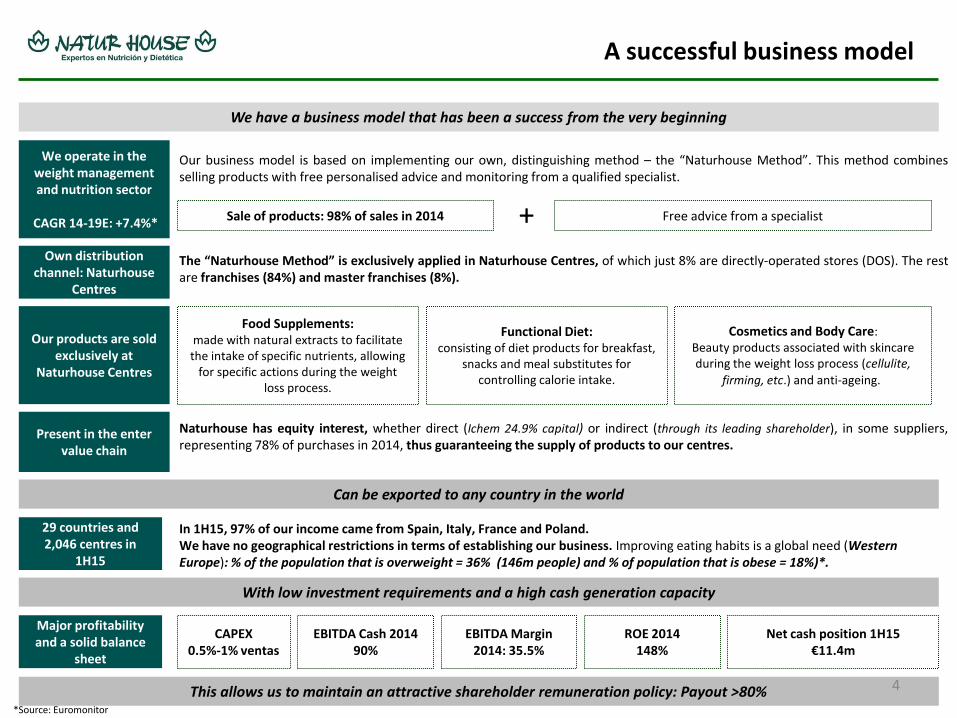
Our business model is based on implementing our own, distinguishing method – the “Naturhouse Method”. This method combines selling products with free personalised advice and monitoring from a qualified specialist.
The “Naturhouse Method” is exclusively applied in Naturhouse Centres, of which just 8% are directly-operated stores (DOS). The rest are franchises (84%) and master franchises (8%). Naturhouse has equity interest, whether direct (Ichem 24.9% capital) or indirect (through its leading shareholder), in some suppliers, representing 78% of purchases in 2014, thus guaranteeing the supply of products to our centres. In 1H15, 97% of our income came from Spain, Italy, France and Poland. We have no geographical restrictions in terms of establishing our business. Improving eating habits is a global need (Western Europe): % of the population that is overweight = 36% (146m people) and % of population that is obese = 18%)*.
A successful business model
We operate in the weight management and nutrition sector
CAGR 14-19E: +7.4%*
Sale of products: 98% of sales in 2014 Free advice from a specialist
Own distribution channel: Naturhouse
Centres
We have a business model that has been a success from the very beginning
Our products are sold exclusively at
Naturhouse Centres
Present in the enter value chain
Can be exported to any country in the world
29 countries and 2,046 centres in
1H15
Food Supplements: made with natural extracts to facilitate the intake of specific nutrients, allowing
for specific actions during the weight loss process.
Functional Diet: consisting of diet products for breakfast,
snacks and meal substitutes for controlling calorie intake.
Cosmetics and Body Care: Beauty products associated with skincare during the weight loss process (cellulite,
firming, etc.) and anti-ageing..
Major profitability and a solid balance
sheet
With low investment requirements and a high cash generation capacity
This allows us to maintain an attractive shareholder remuneration policy: Payout >80%
CAPEX 0.5%-1% ventas
EBITDA Cash 2014 90%
EBITDA Margin 2014: 35.5%
ROE 2014 148%
Net cash position 1H15 €11.4m
4
+
*Source: Euromonitor

Masterfranchises
8%
Franchises
84%
DOS
8%
Naturhouse Centres
Main characteristics Located in commercial areas with considerable foot traffic Divided into two areas – consultation area and sales area Covering a surface area of between 30m2 and 50m2 All have a similar aesthetic
Centre types
Directly-owned centres are managed by the company with its own staff. They tend to be the laboratories for new ideas for the Group’s other centres as well as a training hub for employees and franchisees. They are also the foundation for growth in new countries.
Franchised centres are Naturhouse Centres operated by third parties under the franchise model.
In addition, Naturhouse has contracts called ‘master franchises’, through which a third party can exclusively operate Naturhouse’s business for a whole country.
Breakdown according to centre type at 1H15 Rapid growth
2,046 centres and 29 countries
Major flexibility
Reduces the need for investment
CAPEX: 0.5%-1% sales
and human capital 440 employees on average in
1H15
Franchises as a channel for growth
Directly-operated stores (DOS)
Franchises
Master Franchises
5

Contractual Framework
Franchises
Duration 5 years. 90% of franchisees have renewed their contract for another 5 years after the first 5-year period.
Main economic points No initial franchise fee Annual franchise fee of €600 + VAT Gross Margin of 60% Compulsory investment of 5% of product purchases in advertising for the store or the Naturhouse brand Payment when placing an order or with a bank guarantee at 30 days Minimum stock: €7,000 (stock rotation every 15 days) Initial investment: €10,000-€40,000 depending on the country
Agreements Obligation to sell only Naturhouse products Non-competition agreement for 1 year after the end of the contract
Support for the franchisee The right to use the Naturhouse brand Use of Peso Perfecto magazine to promote the Naturhouse Method Support from Naturhouse regarding strategy, products, know-how, etc.
Master Franchises Duration 7 years
Main economic points Initial franchise fee of between €50,000 and €300,000
Agreements Obligation to open a specific number of centres during the contracted period
Support for the master franchisee The right to use the Naturhouse brand Use of Peso Perfecto magazine to promote the Naturhouse Method Support from Naturhouse regarding strategy, products, know-how, etc
The master franchisee is responsible for the costs of registering the product and the necessary investment for implementing the
business (staff, furniture and fittings, alteration work on premises, etc.).
6

International Growth
Subsidiaries
Master Franchises
1,882 164
29 countries 2,046 centres at end 1H15
Subsidiaries
Master Franchises
Legal certainty High per capita income High population density levels
Low levels of legal certainty Low per capita income Low population density levels
79% of sales and 83% of EBITDA came from outside Spain at
1H15
7
France Spain Italy Poland Portugal Belgium Germany UK Mexico Canada Lithuania USA
Czech Republic Romania Slovakia Belgium - Master Morocco Croatia Bulgaria Slovenia Peru UAE Dominican Republic Mauritius Philippines Russia Gibraltar* Andorra* Panama Switzerland
Masterfranchises
8%
Franchises
84%
DOS
8%
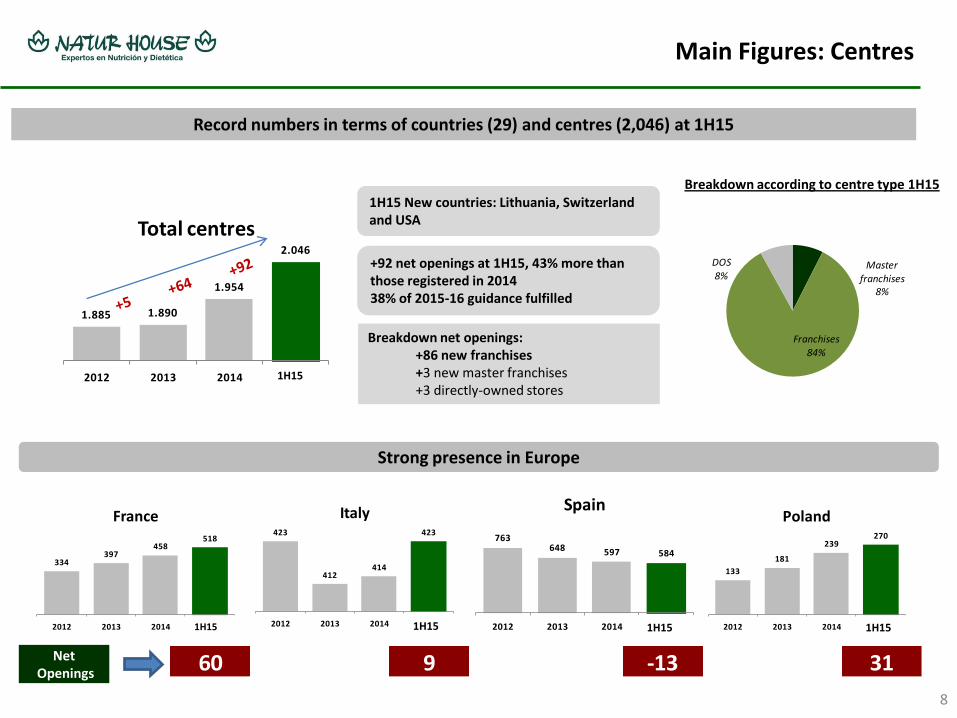
1.885 1.890
1.954
2.046
2012 2013 2014 1S15
Total centres
Main Figures: Centres
8
Net Openings
60 9 -13 31
334397
458518
2012 2013 2014 1S15
France423
412414
423
2012 2013 2014 1S15
Italy
763648 597 584
2012 2013 2014 1S15
Spain
133
181
239270
2012 2013 2014 1S15
Poland
Breakdown net openings: +86 new franchises +3 new master franchises +3 directly-owned stores
Strong presence in Europe
+92
Record numbers in terms of countries (29) and centres (2,046) at 1H15
+92 net openings at 1H15, 43% more than those registered in 2014 38% of 2015-16 guidance fulfilled
1H15 New countries: Lithuania, Switzerland and USA
Breakdown according to centre type 1H15
1H15
1H15 1H15 1H15 1H15

9.669
19.047
22.758
12.976 13.284
2012 2013 2014 1H14 1H15
Net Income
26,5%
32,8%35,5% 36,5% 36,8%
2012 2013 2014 1H14 1H15
EBITDA Margin
22.657
29.483
33.986
19.117 19.365
2012 2013 2014 1H14 1H15
EBITDA
85.594 89.76895.731
52.382 52.556
2012 2013 2014 1H14 1H15
Sales
Main Figures: P&G
Sustained growth in the Group’s main figures since 2012 EBITDA margin above the industry average (+36.8% at 1H15 vs +16%* for the sector)
Figures in Thousands of euros
+0.3% +1.3%
+2.4%
Sales in 1H14 include non recurrent income of €0.25m from the sale of the master franchises for Switzerland and Slovenia and €0.49m from the sale of products to herbal stores, an activity that came to an end in 2014. Without these effects, sales would have grown by 1.8%.
In 1H15, there was a 7% increase in advertising expenditure, as a result of the company’s clear commitment to recovering the market in Spain.
In 1H15 the contribution from Ichem stood at €0.58m, a 41.6% increase vs 1H14.
A sustained improvement in the EBITDA margin due to the constant implementation of operational efficiency measures. A sustained improvement in procurement costs since 2012. 9
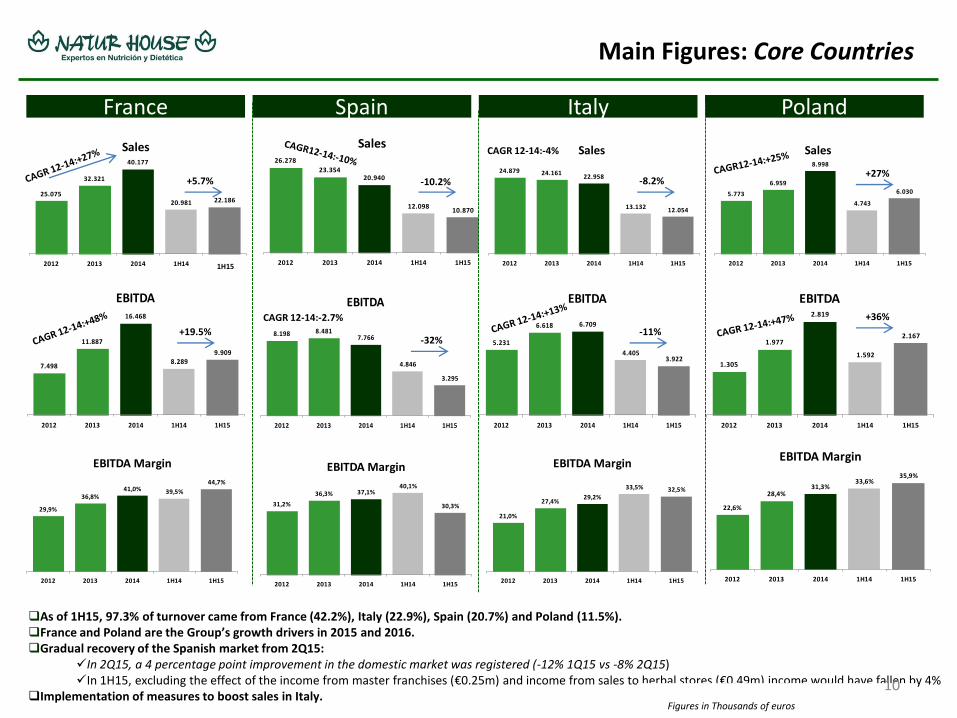
As of 1H15, 97.3% of turnover came from France (42.2%), Italy (22.9%), Spain (20.7%) and Poland (11.5%). France and Poland are the Group’s growth drivers in 2015 and 2016. Gradual recovery of the Spanish market from 2Q15:
In 2Q15, a 4 percentage point improvement in the domestic market was registered (-12% 1Q15 vs -8% 2Q15) In 1H15, excluding the effect of the income from master franchises (€0.25m) and income from sales to herbal stores (€0.49m) income would have fallen by 4%
Implementation of measures to boost sales in Italy.
Figures in Thousands of euros
22,6%
28,4%31,3%
33,6%35,9%
2012 2013 2014 1H14 1H15
EBITDA Margin
21,0%
27,4%29,2%
33,5% 32,5%
2012 2013 2014 1H14 1H15
EBITDA Margin
31,2%
36,3% 37,1%40,1%
30,3%
2012 2013 2014 1H14 1H15
EBITDA Margin
1.305
1.977
2.819
1.592
2.167
2012 2013 2014 1H14 1H15
EBITDA
5.773
6.959
8.998
4.743
6.030
2012 2013 2014 1H14 1H15
Sales
8.198 8.4817.766
4.846
3.295
2012 2013 2014 1H14 1H15
EBITDA
26.278
23.35420.940
12.09810.870
2012 2013 2014 1H14 1H15
Sales
5.231
6.618 6.709
4.4053.922
2012 2013 2014 1H14 1H15
EBITDA
24.879 24.16122.958
13.132 12.054
2012 2013 2014 1H14 1H15
Sales
29,9%
36,8%41,0% 39,5%
44,7%
2012 2013 2014 1H14 1H15
EBITDA Margin
7.498
11.887
16.468
8.2899.909
2012 2013 2014 1H14 1H15
EBITDA
25.075
32.321
40.177
20.981 22.186
2012 2013 2014 1H14 1H15
Sales
1H15
Main Figures: Core Countries
France Spain Italy Poland
CAGR 12-14:-2.7%
CAGR 12-14:-4%
+5.7%
+19.5%
-10.2%
-32%
-8.2%
-11%
+27%
+36%
10

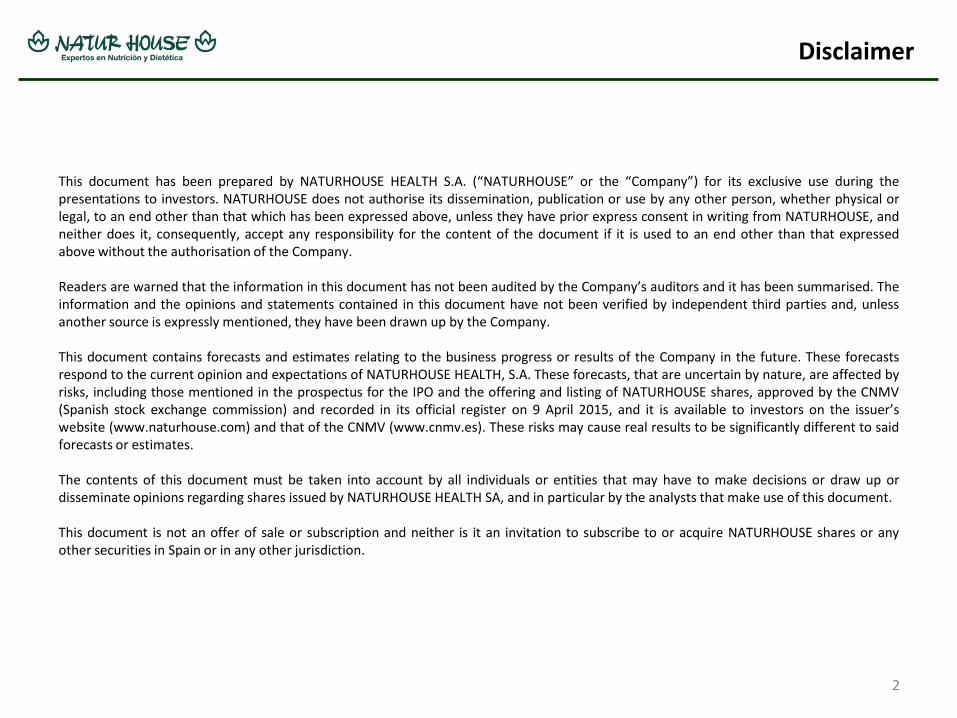
8.100
11.600
25.675
11.050
2012 2013 2014 1H15
Dividends
Main Figures: Net Cash Position & Dividends
11
La solidez del balance y la retribución al accionista son nuestra prioridad
Figures in thousands of euros
7.338
15.087
10.880 11.402
2012 2013 2014 1H15
Net Cash
Figures in thousands of euros Note 1: Data from 2012, 2013 and 2014 include SAS Naturhouse in all periods Note 2: Of the €11.05m in 1H15, €8.5m correspond almost completely to the income generated by Naturhouse Health SA’s subsidiaries in 2014 and the rest to the income from Naturhouse Health SA and its subsidiaries in 2015, up until 16 March.
A solid balance sheet and shareholder remuneration are our priority
Major cash flow generation capacity: Net Cash at the end of 1H15 of €11.4m, after paying out dividends to the amount of €11.05m. The company distributed an interim dividend of €3m (€0.05 gross per share) on September 4, 2015, ahead of its initial forecast of doing so in 2016.
Attractive remuneration policy for shareholders: Payout >80%.

Naturhouse vs. Peers (1)
12
17
108
IGBM Average Sector Average* Naturhouse
24
19
13
IGBM Average Sector Average* Naturhouse
1416
34
IGBM Average Sector Average* Naturhouse
42
26
80
IGBM Average Sector Average* Naturhouse
30
73
148
IGBM Average Sector Average* Naturhouse
EV/EBITDA P/E EBITDA Margin 2014 (%)
Payout (%) ROE 2014 (%)
(1)Herbalife, Weight Watchers, Nutrisystem, Vitamin Shoppe & GNC
Naturhouse trades with a discount vs peers and the Spanish market Its EBITDA Margin is double the sector average*
It has an attractive shareholder remuneration policy ROE is higher than the IBGM and sector averages
Source: Factset
>
Strategy & Outlook
“A succeful Business Model"
13
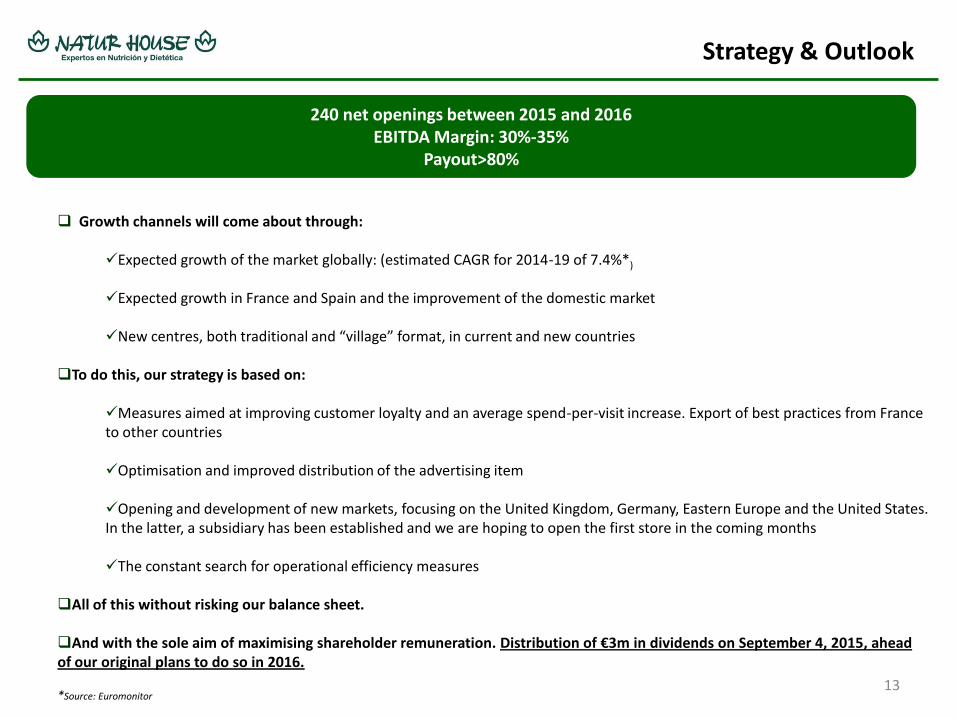
240 net openings between 2015 and 2016 EBITDA Margin: 30%-35%
Payout>80%
Growth channels will come about through:
Expected growth of the market globally: (estimated CAGR for 2014-19 of 7.4%*)
Expected growth in France and Spain and the improvement of the domestic market
New centres, both traditional and “village” format, in current and new countries
To do this, our strategy is based on:
Measures aimed at improving customer loyalty and an average spend-per-visit increase. Export of best practices from France to other countries
Optimisation and improved distribution of the advertising item
Opening and development of new markets, focusing on the United Kingdom, Germany, Eastern Europe and the United States. In the latter, a subsidiary has been established and we are hoping to open the first store in the coming months
The constant search for operational efficiency measures
All of this without risking our balance sheet.
And with the sole aim of maximising shareholder remuneration. Distribution of €3m in dividends on September 4, 2015, ahead of our original plans to do so in 2016. *Source: Euromonitor
Conclusions
*Source: Euromonitor
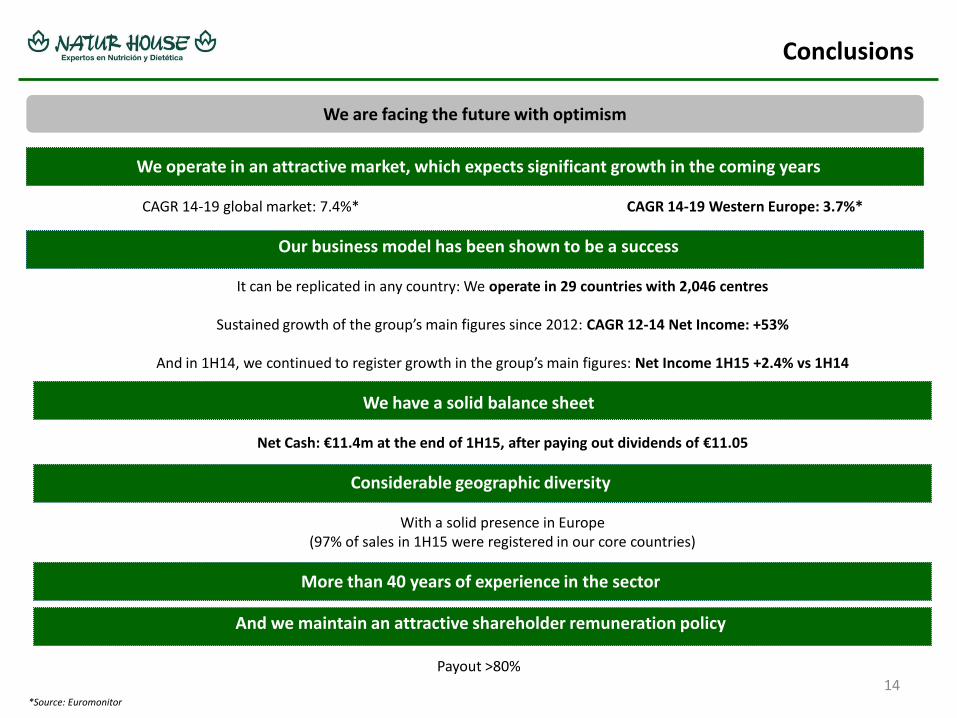
We are facing the future with optimism
We operate in an attractive market, which expects significant growth in the coming years
CAGR 14-19 global market: 7.4%* CAGR 14-19 Western Europe: 3.7%*
Our business model has been shown to be a success
It can be replicated in any country: We operate in 29 countries with 2,046 centres
Sustained growth of the group’s main figures since 2012: CAGR 12-14 Net Income: +53%
And in 1H14, we continued to register growth in the group’s main figures: Net Income 1H15 +2.4% vs 1H14
We have a solid balance sheet
Net Cash: €11.4m at the end of 1H15, after paying out dividends of €11.05
Considerable geographic diversity
With a solid presence in Europe (97% of sales in 1H15 were registered in our core countries)
More than 40 years of experience in the sector
And we maintain an attractive shareholder remuneration policy
Payout >80% 14
1H15 Results: Profit & Loss Account
15
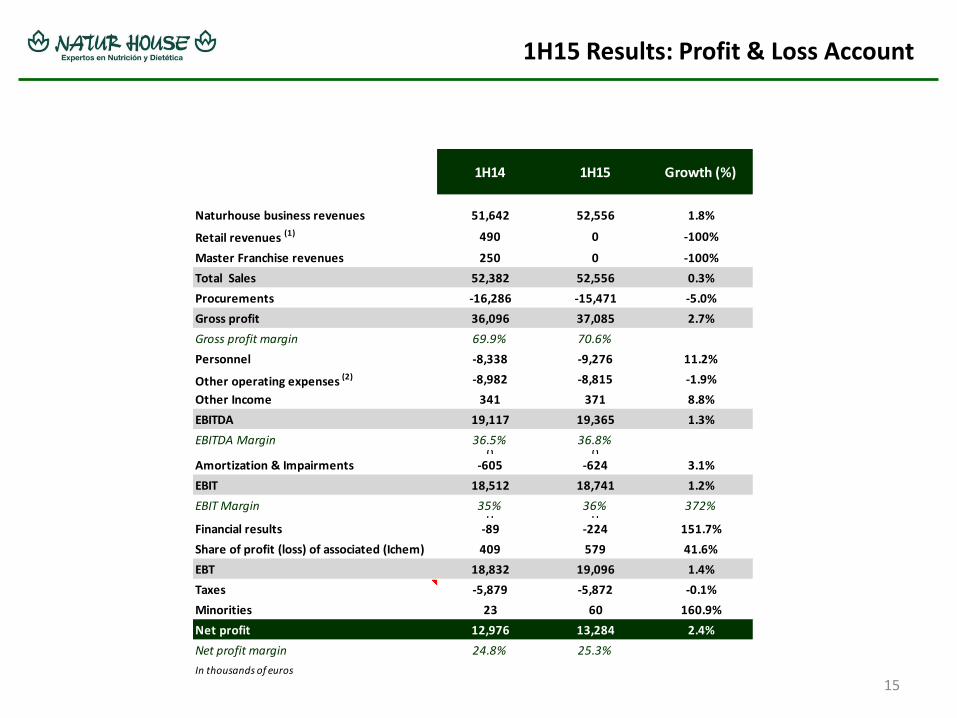
1H14 1H15 Growth (%)
Naturhouse business revenues 51,642 52,556 1.8%
Retail revenues (1) 490 0 -100%
Master Franchise revenues 250 0 -100%
Total Sales 52,382 52,556 0.3%
Procurements -16,286 -15,471 -5.0%
Gross profit 36,096 37,085 2.7%
Gross profit margin 69.9% 70.6%
Personnel -8,338 -9,276 11.2%
Other operating expenses (2) -8,982 -8,815 -1.9%
Other Income 341 371 8.8%
EBITDA 19,117 19,365 1.3%
EBITDA Margin 36.5% 36.8%0 0
Amortization & Impairments -605 -624 3.1%
EBIT 18,512 18,741 1.2%
EBIT Margin 35% 36% 372%0 0
Financial results -89 -224 151.7%
Share of profit (loss) of associated (Ichem) 409 579 41.6%
EBT 18,832 19,096 1.4%
Taxes -5,879 -5,872 -0.1%
Minorities 23 60 160.9%
Net profit 12,976 13,284 2.4%
Net profit margin 24.8% 25.3%
In thousands of euros

1H15 Results: Balance Sheet
16
2014 1H15
Intangible assets 2,345 2,219
property, plant & equipment 5,522 5,171
Non current financial assets 757 959
Investment in associated companies 2,749 3,317
Deferred tax assets 458 368
Non current Assets 11,831 12,034
Inventories 3,925 3,982
Trade receivables 5,564 7,101
Other current assets 683 741
investment in related companies 11,007 0
Financial assets 42 0
Cash & equivalents 8,659 17,706
Current assets 29,880 29,530
TOTAL ASSETS 41,711 41,564
Equity 15,371 15,877
Non current provisions 798 921
Non current borrowings 4,363 3,045
Long term accrued expenses 456 460
Non current liabilities 5,617 4,426
Current borrowings 4,525 3,259
Financial l iabilities with related companies 2,007 2,040
Suppliers 4,621 5,443
Suppliers related companies 6,369 7,271
Current tax l iabilities and other payables 3,201 3,248
Current liabilities 20,723 21,261
TOTAL LIABILITIES 41,711 41,564
In Thousands of euros
Net cash position of €11.4m at end of 1H15, allowing us to maintain an attractive shareholder remuneration policy.
Payment of interim dividend for the amount of €11.05m (€8.5m almost totally coming from the income of the subsidiaries of Naturhouse Health SA in 2014 and the rest from the income accumulated in 2015 by Naturhouse Health SA and its subsidiaries until 16 March).
29% reduction in the gross financial debt (-€2.6m).
Kiluva SA debt paid off as forecast.

CONTACT
María Pardo Martinez
Investor Relations Manager
Telephone number: +34 914323953
Email: [email protected]
17