Embed Size (px)
Citation preview
Solar Project: System Impact
Study CONDUCTED FOR
CRL SOLAR, LLC
Green Mountain Power 163 Acorn Lane Colchester, VT 05446 +1.888.835.4672 www.greenmountainpower.com

Solar Project: System Impact Study iii
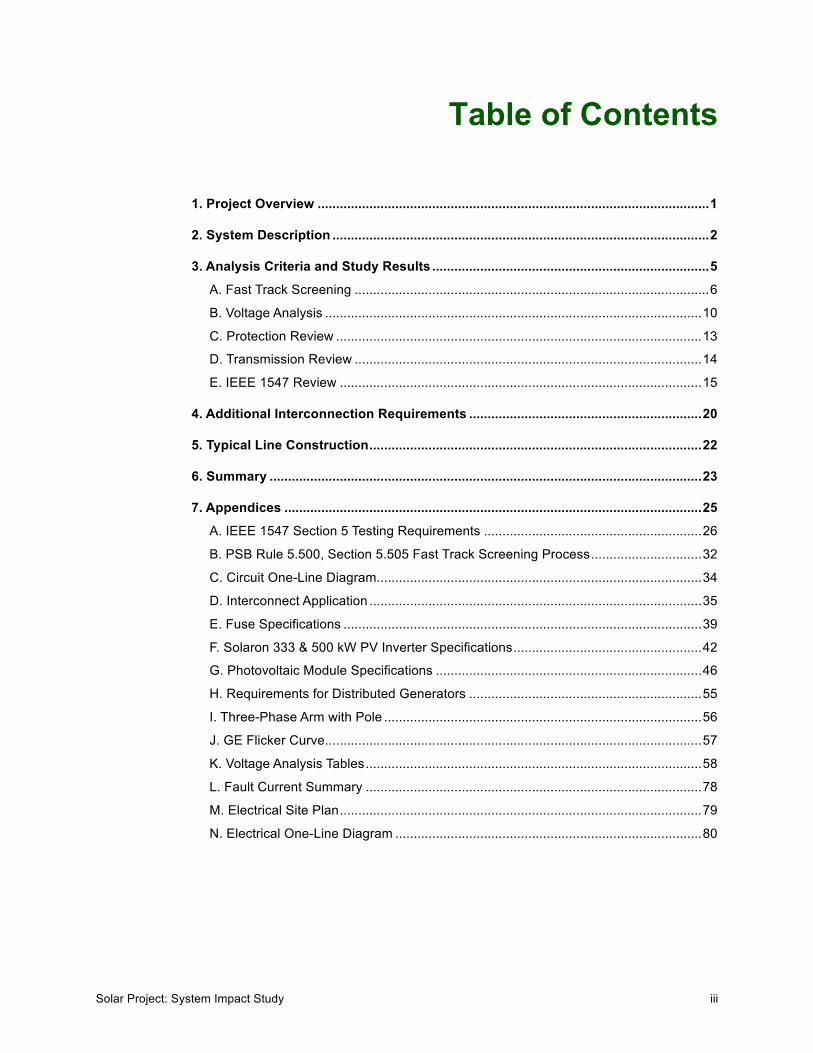
Table of Contents
1. Project Overview .......................................................................................................... 1
2. System Description ...................................................................................................... 2
3. Analysis Criteria and Study Results ........................................................................... 5A. Fast Track Screening ................................................................................................ 6B. Voltage Analysis ...................................................................................................... 10C. Protection Review ................................................................................................... 13D. Transmission Review .............................................................................................. 14E. IEEE 1547 Review .................................................................................................. 15
4. Additional Interconnection Requirements ............................................................... 20
5. Typical Line Construction .......................................................................................... 22
6. Summary ..................................................................................................................... 23
7. Appendices ................................................................................................................. 25A. IEEE 1547 Section 5 Testing Requirements ........................................................... 26B. PSB Rule 5.500, Section 5.505 Fast Track Screening Process .............................. 32C. Circuit One-Line Diagram ........................................................................................ 34D. Interconnect Application .......................................................................................... 35E. Fuse Specifications ................................................................................................. 39F. Solaron 333 & 500 kW PV Inverter Specifications ................................................... 42G. Photovoltaic Module Specifications ........................................................................ 46H. Requirements for Distributed Generators ............................................................... 55I. Three-Phase Arm with Pole ...................................................................................... 56J. GE Flicker Curve ...................................................................................................... 57K. Voltage Analysis Tables ........................................................................................... 58L. Fault Current Summary ........................................................................................... 78M. Electrical Site Plan .................................................................................................. 79N. Electrical One-Line Diagram ................................................................................... 80
iv Green Mountain Power
Tables
Table 1: Maximum and Minimum Loads on Project Facilities ............................................ 4Table 2: Interconnection System Response to Abnormal Voltages ................................. 17Table 3: Interconnection System Response to Abnormal Frequencies ............................ 17Table 4: Maximum Harmonic Current Distortion in Percent of Current (I)b ...................... 18Table 5: Requirements for Distributed Generators with a Rating Between 100 kW
and 500 kW ........................................................................................................ 55Table 6: 71G3, On Peak ................................................................................................... 58Table 7: 71G3, Off Peak ................................................................................................... 59Table 8: 71G3, Modified Capacitor at Taglet 21844, On Peak ......................................... 60Table 9: 71G3, Modified Capacitor at Taglet 21844, Off Peak ......................................... 61Table 10: 71G3, Modified Capacitor at Taglet 21844, 55146, and
Reconductoring, On Peak .................................................................................. 62Table 11: 71G3, Modified Capacitor at Taglet 21844, 55146, and
Reconductoring, Off Peak .................................................................................. 63Table 12: 70G4, On Peak ................................................................................................. 64Table 13: 70G4, Off Peak ................................................................................................. 67Table 14: 70G4, On Peak, Caps Modified ........................................................................ 68Table 15: 70G4, Off Peak, Caps Modified ........................................................................ 69Table 16: 70G4 Backed Up by the 71G3, at 78% of Peak ............................................... 70Table 17: 70G4 Backed Up by the 71G3, Off Peak .......................................................... 71Table 18: 71G3 Backed Up by the 70G4, at 94% of Peak ............................................... 72Table 19: 71G3 Backed Up by the 70G4, Off Peak .......................................................... 73Table 20: 71G2 Backed Up by the 70G4, at 75% of Peak ............................................... 74Table 21: 71G2 Backed Up by the 70G4, Off Peak .......................................................... 75Table 22: 70G4 Backed Up by the 71G2, at 50% of Peak ............................................... 76Table 23: 70G4 Backed Up by the 71G2, Off Peak .......................................................... 77Table 24: Fault Current Summary .................................................................................... 78
Solar Project: System Impact Study v
Figures
Figure 1: IEEE 1547 Section 5 Interconnection Test Specifications and Requirements (6 pages) .................................................................................... 26
Figure 2: Circuit One-Line Installation Diagram ................................................................ 34Figure 3: Completed Vermont PSB Standard Application Form to Rule 5.500 (4
pages) ................................................................................................................ 35Figure 4: Low-Peak® Time-Delay Fuse Dimensional Data ............................................... 39Figure 5: Low-Peak® Time-Delay Fuse Time-Current Characteristic Curves—
Average Melt ...................................................................................................... 40Figure 6: Low-Peak® Time-Delay Fuses Current-Limitation Curves ................................ 41Figure 7: Solaron® 333 kW PV Inverter Specifications (2 pages) ..................................... 42Figure 8: Solaron® 500 kW PV Inverter Specifications (2 pages) ..................................... 44Figure 9: Specifications of Kyocera Photovoltaic Module, Type KD245GX-LPBN
(7 pages) ............................................................................................................ 46Figure 10: Photovoltaic Module Drawing .......................................................................... 53Figure 11: Photovoltaic Module Characteristics, Open Circuit Voltage, and Short
Circuit Current at Various Cell Temperatures and Irradiance Levels ................. 54Figure 12: Three-phase Arm with Pole ............................................................................. 56Figure 13: GE Flicker Limit Curve: Voltage Fluctuations .................................................. 57Figure 14: Solari Project Electrical Site Plan .................................................................... 79Figure 15: Solar Project Electrical One-Line Diagram ...................................................... 80

vi Green Mountain Power
1. Project Overview
Solar Project: System Impact Study 1
1. Project Overview
CRL Solar, LLC has proposed installing a solar generator at the end of Melisi Road in White River Junction, Vermont1 (called the Project).
The solar generator is rated at 2,166 kW (AC) and may be interconnected with a 7.2/12.47 kV Grounded Wye Green Mountain Power (GMP) distribution circuit called the 71G3. This circuit is fed from the GMP #71 Wilder Substation, which is served by a Central Vermont Public Service 46 kV Transmission line.
The Project will be in the future interconnected by the GMP circuit 70G4, originating from the #70 White River Junction Substation and served by a 13.2 kV transmission line from National Grid’s Wilder Hydro Station. This switch in interconnection circuit could occur due to load growth or as backup for the #71 Substation.
The proposed generation requires a Certificate of Public Good (CPG) under 30 V.S.A. §248. As required by §248(b)(3), the applicant must demonstrate that the generation “will not adversely affect system stability and reliability”.2
This System Impact Study describes the review process undertaken by Green Mountain Power to ensure the Project meets the necessary operational requirements. The study cites the additional analyses and upgrades to be performed and the recommended upgrades and settings to be implemented for the solar generator to meet these operational requirements.
This study assumes a maximum net output for the Project at 2,166 kW. For outputs above this level, additional analyses is required.
1 See Appendix M. Electrical Site Plan on page 79 and Appendix N. Electrical One-Line Diagram on page 80.
2 See Appendix D. Interconnect Application on page 35 for a copy of the completed PSB application.
2. System Description
2 Green Mountain Power
2. System Description
The Project’s Point of Interconnection (“POI”) is presently located on GMP’s 71G3 distribution circuit originating from the #71 Wilder Distribution Substation. The 71G3 is fed by a 14 MVA, 44-12.47 kV transformer, with three 668 Amp GE VR1 Regulators with GE VR1 controls. The circuit is protected by a recloser at the substation.
A pre-existing hydro generation facility (Hydro) is located downstream of the proposed solar project. There are two synchronous generators present at the Hydro site, with a total output at 2,109 kW. This System Impact Study takes into account the generation from this project plus other smaller net metering facilities in the area.
A line recloser is located at Pole 70, taglet 21850, on the VA Cutoff Road in White River Junction. This line recloser is the device closest to the project capable of separating the Project from the substation with other customers. The Hydro will also be separated from the substation with the solar Project.
Three-Phase Construction The total distance on the 71G3 between the substation and the Point of Interconnection (POI) for the Project will be 25,910 feet or 4.91 miles. The entire Project will be three-phase construction with the conductor, from the substation out, consisting of:
§ 15,330 feet of 336 ACSR 26/7 with a 1/0AAAC neutral
§ 6,173 feet of 336AAC with a 3/0ACSR neutral; the last 705 feet of neutral are 1/0ACSR
§ 1,246 feet of 3/0ACSR with a 1/0AA neutral
§ 2,161 feet of 1/0AA with a #2ACSR neutral
Approximately the last 1,000 feet will be new construction consisting of 477ACSR with a 4/0AAAC neutral.
The following capacitors are on the 71G3:
§ Taglet 31862; 450 kVAR total; three-phase; switched on voltage
§ Taglet 21844; 600 kVAR total; three-phase; fixed
§ Taglet 55423; 150 kVAR total; three-phase; fixed
§ Taglet 55146; 600 kVAR total; three-phase; fixed
2. System Description
Solar Project: System Impact Study 3
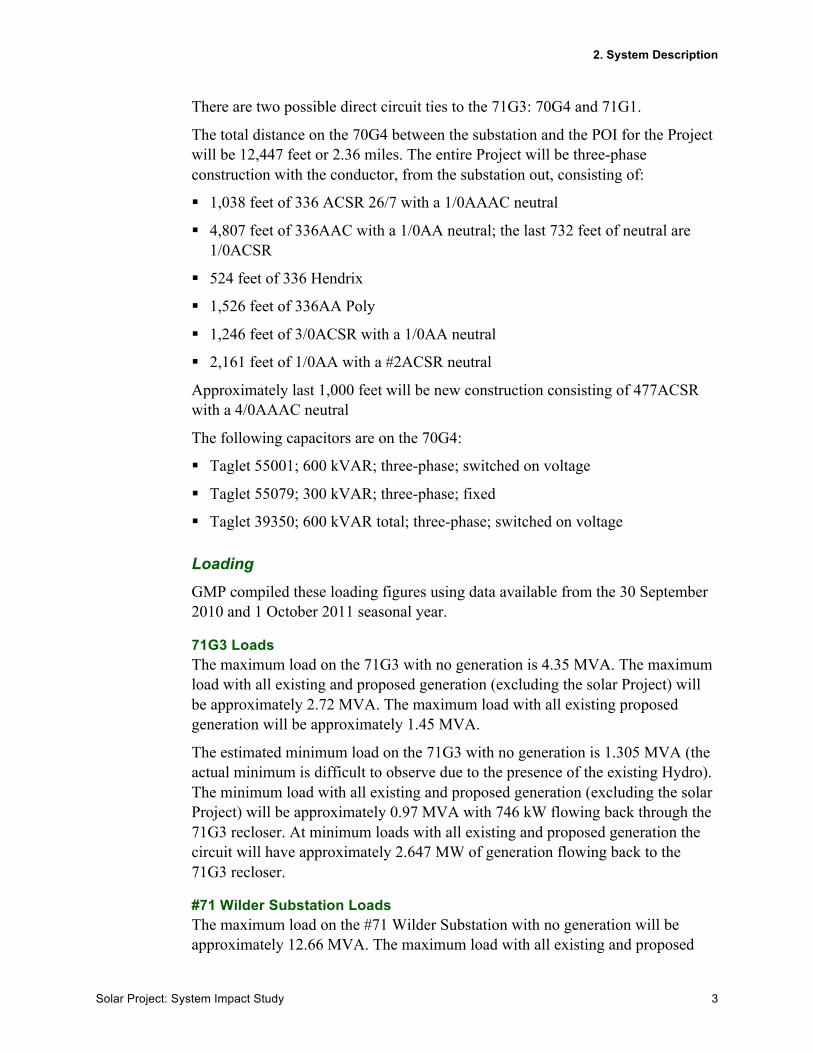
There are two possible direct circuit ties to the 71G3: 70G4 and 71G1.
The total distance on the 70G4 between the substation and the POI for the Project will be 12,447 feet or 2.36 miles. The entire Project will be three-phase construction with the conductor, from the substation out, consisting of:
§ 1,038 feet of 336 ACSR 26/7 with a 1/0AAAC neutral
§ 4,807 feet of 336AAC with a 1/0AA neutral; the last 732 feet of neutral are 1/0ACSR
§ 524 feet of 336 Hendrix
§ 1,526 feet of 336AA Poly
§ 1,246 feet of 3/0ACSR with a 1/0AA neutral
§ 2,161 feet of 1/0AA with a #2ACSR neutral
Approximately last 1,000 feet will be new construction consisting of 477ACSR with a 4/0AAAC neutral
The following capacitors are on the 70G4:
§ Taglet 55001; 600 kVAR; three-phase; switched on voltage
§ Taglet 55079; 300 kVAR; three-phase; fixed
§ Taglet 39350; 600 kVAR total; three-phase; switched on voltage
Loading GMP compiled these loading figures using data available from the 30 September 2010 and 1 October 2011 seasonal year.
71G3 Loads The maximum load on the 71G3 with no generation is 4.35 MVA. The maximum load with all existing and proposed generation (excluding the solar Project) will be approximately 2.72 MVA. The maximum load with all existing proposed generation will be approximately 1.45 MVA.
The estimated minimum load on the 71G3 with no generation is 1.305 MVA (the actual minimum is difficult to observe due to the presence of the existing Hydro). The minimum load with all existing and proposed generation (excluding the solar Project) will be approximately 0.97 MVA with 746 kW flowing back through the 71G3 recloser. At minimum loads with all existing and proposed generation the circuit will have approximately 2.647 MW of generation flowing back to the 71G3 recloser.
#71 Wilder Substation Loads The maximum load on the #71 Wilder Substation with no generation will be approximately 12.66 MVA. The maximum load with all existing and proposed
2. System Description
4 Green Mountain Power
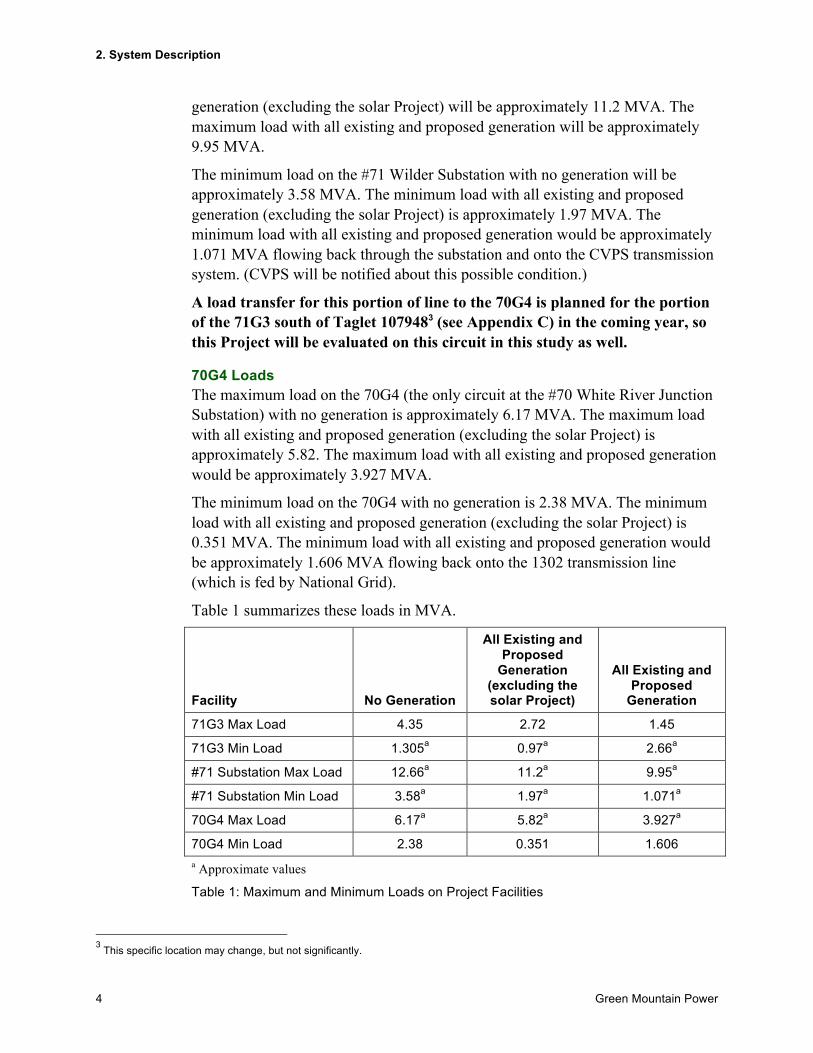
generation (excluding the solar Project) will be approximately 11.2 MVA. The maximum load with all existing and proposed generation will be approximately 9.95 MVA.
The minimum load on the #71 Wilder Substation with no generation will be approximately 3.58 MVA. The minimum load with all existing and proposed generation (excluding the solar Project) is approximately 1.97 MVA. The minimum load with all existing and proposed generation would be approximately 1.071 MVA flowing back through the substation and onto the CVPS transmission system. (CVPS will be notified about this possible condition.)
A load transfer for this portion of line to the 70G4 is planned for the portion of the 71G3 south of Taglet 1079483 (see Appendix C) in the coming year, so this Project will be evaluated on this circuit in this study as well.
70G4 Loads The maximum load on the 70G4 (the only circuit at the #70 White River Junction Substation) with no generation is approximately 6.17 MVA. The maximum load with all existing and proposed generation (excluding the solar Project) is approximately 5.82. The maximum load with all existing and proposed generation would be approximately 3.927 MVA.
The minimum load on the 70G4 with no generation is 2.38 MVA. The minimum load with all existing and proposed generation (excluding the solar Project) is 0.351 MVA. The minimum load with all existing and proposed generation would be approximately 1.606 MVA flowing back onto the 1302 transmission line (which is fed by National Grid).
Table 1 summarizes these loads in MVA.
Facility No Generation
All Existing and Proposed
Generation (excluding the solar Project)
All Existing and Proposed
Generation 71G3 Max Load 4.35 2.72 1.45
71G3 Min Load 1.305a 0.97a 2.66a
#71 Substation Max Load 12.66a 11.2a 9.95a
#71 Substation Min Load 3.58a 1.97a 1.071a
70G4 Max Load 6.17a 5.82a 3.927a
70G4 Min Load 2.38 0.351 1.606 a Approximate values
Table 1: Maximum and Minimum Loads on Project Facilities
3 This specific location may change, but not significantly.
3. Analysis Criteria and Study Results
Solar Project: System Impact Study 5
3. Analysis Criteria and Study Results
Green Mountain Power conducts this system impact study using the CYME distribution circuit analysis program. CYME calculated peak and minimum load level cases and the fault values for the Project on the 71G3 and the 70G4, with separate cases for feeder backup scenarios. Each of these cases with different feeds has four scenarios:
§ No generation
§ All generation online
§ Only the WRJ Solar generator online
§ Only the Hydro generation online
With only 154 kW of net metering projects currently proposed for the 71G3 and none for the 70G4, we presumed that a separate case for only net metering generation is unnecessary because all of the smaller scattered projects should have a minimal impact on the circuits as a whole.
We conducted this study under the guidance of the following reports:
§ IEEE Standard 1547, IEEE Standard for Interconnecting Distributed Resources with Electric Power Systems; July 28, 2003.
§ PSB Rule 5.500 Interconnection Procedures for Proposed Electric Generation Resources
§ Utility Interconnection Guidelines for Distributed Generation Equipment of 1 MW or Less Connected to Radial Distribution Systems, Philip Barker, January 23, 2006.
We present resulting analysis from the study in five section:
A. Fast Track Screening (page 6)
B. Voltage Analysis (page 10)
C. Protection Review (page 13)
D. Transmission Review (page 14)
E. IEEE 1547 Review (page 15)
3. Analysis Criteria and Study Results A. Fast Track Screening
6 Green Mountain Power
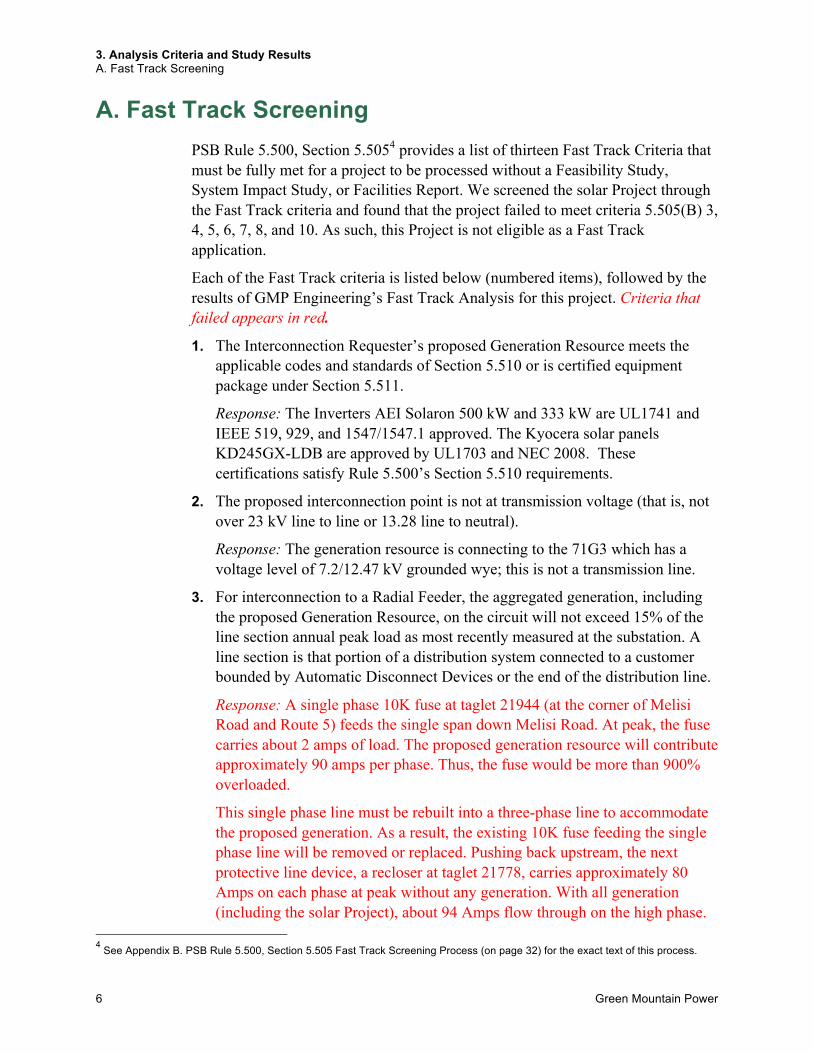
A. Fast Track Screening PSB Rule 5.500, Section 5.5054 provides a list of thirteen Fast Track Criteria that must be fully met for a project to be processed without a Feasibility Study, System Impact Study, or Facilities Report. We screened the solar Project through the Fast Track criteria and found that the project failed to meet criteria 5.505(B) 3, 4, 5, 6, 7, 8, and 10. As such, this Project is not eligible as a Fast Track application.
Each of the Fast Track criteria is listed below (numbered items), followed by the results of GMP Engineering’s Fast Track Analysis for this project. Criteria that failed appears in red.
1. The Interconnection Requester’s proposed Generation Resource meets the applicable codes and standards of Section 5.510 or is certified equipment package under Section 5.511.
Response: The Inverters AEI Solaron 500 kW and 333 kW are UL1741 and IEEE 519, 929, and 1547/1547.1 approved. The Kyocera solar panels KD245GX-LDB are approved by UL1703 and NEC 2008. These certifications satisfy Rule 5.500’s Section 5.510 requirements.
2. The proposed interconnection point is not at transmission voltage (that is, not over 23 kV line to line or 13.28 line to neutral).
Response: The generation resource is connecting to the 71G3 which has a voltage level of 7.2/12.47 kV grounded wye; this is not a transmission line.
3. For interconnection to a Radial Feeder, the aggregated generation, including the proposed Generation Resource, on the circuit will not exceed 15% of the line section annual peak load as most recently measured at the substation. A line section is that portion of a distribution system connected to a customer bounded by Automatic Disconnect Devices or the end of the distribution line.
Response: A single phase 10K fuse at taglet 21944 (at the corner of Melisi Road and Route 5) feeds the single span down Melisi Road. At peak, the fuse carries about 2 amps of load. The proposed generation resource will contribute approximately 90 amps per phase. Thus, the fuse would be more than 900% overloaded.
This single phase line must be rebuilt into a three-phase line to accommodate the proposed generation. As a result, the existing 10K fuse feeding the single phase line will be removed or replaced. Pushing back upstream, the next protective line device, a recloser at taglet 21778, carries approximately 80 Amps on each phase at peak without any generation. With all generation (including the solar Project), about 94 Amps flow through on the high phase.
4 See Appendix B. PSB Rule 5.500, Section 5.505 Fast Track Screening Process (on page 32) for the exact text of this process.
3. Analysis Criteria and Study Results A. Fast Track Screening
Solar Project: System Impact Study 7
This means that the aggregate generation is 17.5% of the line section annual peak load.
4. The aggregated generation, including the proposed Generation Resource, on a distribution circuit will not contribute more than 10% to the distribution circuit’s maximum fault current at the point on the high voltage (primary) level nearest the proposed interconnection point.
Response: The maximum available line to ground fault current without the generation taken into account is 1,317 Amps. First dividing 2,166 kW (the maximum AC output of the Project) by 3, then dividing by 7.2 kV results in the single phase amps: 100 Amps. Because the maximum fault current contribution of inverters is 200%, the fault current contribution would be 200 Amps per a phase. When this fault current is divided by 1,317 Amps, the result is 15% of the distribution circuit’s maximum fault current at the primary voltage point closest to the proposed interconnection point.
5. The aggregated generation, including the proposed Generation Resources, on a distribution circuit will not cause any distribution protective devices and equipment (including, but not limited to, substation breakers, fuse cutouts, and line reclosers), or customer equipment on the system to exceed 85% of the short-circuit interrupting capability; nor is the Generation Resource proposed for a circuit that already exceeds 85% of the short-circuit interrupting capability.
Response: A single phase 10K fuse at taglet 21944 (at the corner of Melisi Road and Route 5) feeds the single span down Melisi Road. The solar Project will generate approximately 90 Amps per a phase, thus the fuse will exceed its short-circuit rating by 900%.
This single phase line must be rebuilt into a three-phase line to accommodate the proposed generation. As a result, the existing 10K fuse feeding the single phase line will be removed or replaced. Pushing back upstream, the next protective line device, a recloser at taglet 21778, is rated at 12.5 kA; the device settings are 340 Amps on a phase. Because the aggregated generation would send approximately 94 Amps of load through the high phase, the device would only be loaded up to 28%, significantly below the device’s interrupting rating.
6. For interconnection of a proposed single-phase or effectively-grounded three-phase Generation Resource where the primary distribution System is three-phase, four-wire, the Generation Resource will be connected line-to-neutral. For interconnection of a proposed single-phase or three-phase Generation Resource where the primary distribution system is three-phase, three-wire, the Generation Resource will be connected line-to-line.
3. Analysis Criteria and Study Results A. Fast Track Screening
8 Green Mountain Power
Response: The 71G3 is a three-phase, four-wire system. While the interconnecting transformer is also connected three-phase, four-wire on both sides, the inverters are connected three-phase, three-wire. Thus this Project will not be considered to be “effectively grounded” to the utility.
7. Voltage drop due to starting the proposed generator is within acceptable limits, meaning that inrush current, due to starting the proposed Generation Resource up to once per hour, is not greater than 3% of the available fault current. Voltage drop due to starting the proposed Generation Resource more than once per hour meets a tighter inrush-current tolerance, to be determined by the Interconnecting Utility.
Response: Inrush current for a solar facility is not as significant an indicator of voltage flicker as would be for a rotating generator. Instead, a simple test monitoring the voltage before and after startup will be used.
Before any generation being online, the voltages at peak are 117.5, 118.8, and 118.9 kV at the POI. With the regulator taps locked (following the previous case) and all generation being started together, the voltages at peak are 122.2, 123.5, and 123.4 kV at the POI. This results in a voltage flicker of 3.96%, which is over the maximum allowable voltage flicker of 3% and thus unacceptable.
Most likely, all generation would not start at once. Nonetheless, a subsequent System Impact Study will be needed to assess the actual probability of all generation starting simultaneously and what measures would be needed to prevent such an event from ever occurring.
8. For any single Generation Resource, the available utility short circuit current at the POI divided by the rated output current of the Generation Resource is no less than:
§ 50 for Generation Resource of less than 100 kW;
§ 40 for Generation Resources from 100 kW to less than 500 kW; and
§ 20 for Generation Resources equal to or greater than 500 kW.
Response: At the POI:
§ The line-to-ground fault current on the primary side is 1,317 Amps.
§ The per-phase amps of the Project are derived from this formula: 2,166 kW/(3*7.2 kV) = 100 Amps.
§ 1,317 Amps/100 = 13.17 Amps.
3. Analysis Criteria and Study Results A. Fast Track Screening
Solar Project: System Impact Study 9
9. Aggregate generation, including the Generation Resource, on a circuit will not exceed 2 MVA in an area where there are known or posted transient stability limitations to generating units located in the general electrical vicinity (for example, three or four busses from the point of interconnection).
Response: There are no transient stability limitations that GMP is aware of.
10. No System Upgrades, in excess of limited preparation that do not necessitate a Facilities Study, are required to facilitate the interconnection of the Generation Resource.
Response: A three-phase line extension will be necessary because currently, there is no line to the point of interconnection.
11. For interconnection of the proposed Generation Resource to the load side of spot network protectors, the proposed Generation Resource utilizes inverter-based equipment and aggregate generation, including proposed Generation Resource, will not exceed the smaller of 5% of a spot network’s maximum load or 50 kW. Synchronous generators cannot be connected to a secondary network.
Response: There are no spot networks on the GMP system.
12. If the Generation Resource is to be connected on a shared, single-phase secondary, aggregate generation capacity on the shared secondary, including the proposed generation, will not exceed 20 kVA.
Response: This requirements is not applicable because the Project is three-phase.
13. If the Generation Resource is single-phased and is to be interconnected on a center tap neutral of a 240 volts service, its addition will not create an imbalance between the two side of the 240 volt service of more than 20% of the service transformer nameplate.
Response: This requirements is not applicable because the Project is three-phase.
3. Analysis Criteria and Study Results B. Voltage Analysis
10 Green Mountain Power
B. Voltage Analysis
Cases
The 71G3 circuit currently feeds the Project location. Due to equipment capacity constraints, the feed must be switched to the 70G4 circuit. At times, it might be necessary to feed the Project for a short duration from the 71G3. As such, this scenario was included in the analysis. See Table 6 through Table 11 in Appendix K. Voltage Analysis Tables (pages 58 through 63) for an analysis of the 71G3.
Feeder backup was considered in this analysis, however, none of these feeder backup configurations can be currently done at peak. The purpose of our analysis is to ensure that generation does not make feeder backup worse and, if it does, to mitigate that impact. See Table 16 through Table 23 in Appendix K. Voltage Analysis Tables (pages 70 through 77) for an analysis of the backup circuits.
Note: In all tables in Appendix K. Voltage Analysis Tables, where GMP power quality requirements are not met, the entries appear in red.
Assumptions The following is a list of assumptions made in the analysis:
§ Regulator taps are frozen when generation is turned on to simulate the 15–30 second time delay inherent in these devices.
§ The hydro units start singly and only at 20% of their full output.
§ Full output of the larger hydro, (the Allis Chalmers) unit at rated capacity, is 1,609 kVA, or 1,287 kW and 965 kVAR.
§ The Hydro’s output ramps from initial startup by about 10% of their output in 30 second intervals.
§ Both hydro units are capable of getting up to full speed approximately 10 minutes after they are initially started.
§ The Ottaquechee Hydro Operator attempts to maintain unity (100%) power factor as much as possible (if the power factor is not unity, it will be lagging). The hydro units are modeled as 90% and 95% lagging to determine the impact on the GMP and CRL Solar systems. If there is seen to be an impact at the lower power factors it will be seen what can be done to restrict the Hydro output to a more system friendly power factor. By default the power factor for the facility is assumed to be unity.
3. Analysis Criteria and Study Results B. Voltage Analysis
Solar Project: System Impact Study 11
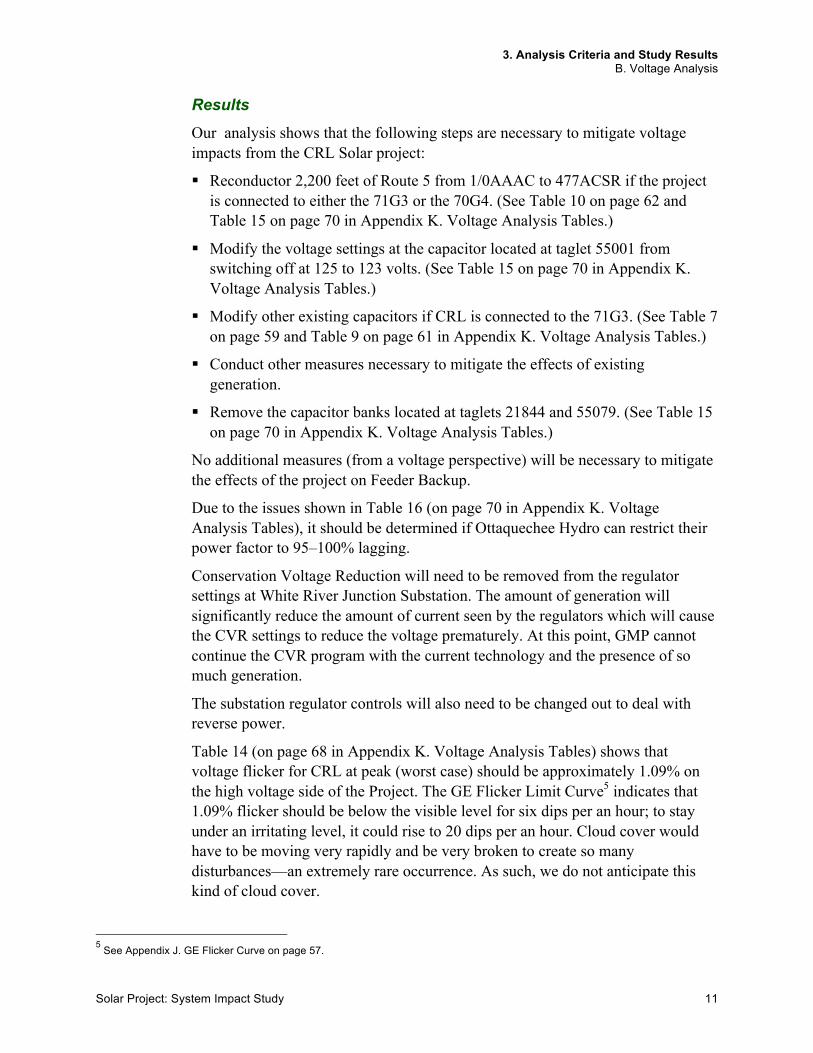
Results Our analysis shows that the following steps are necessary to mitigate voltage impacts from the CRL Solar project:
§ Reconductor 2,200 feet of Route 5 from 1/0AAAC to 477ACSR if the project is connected to either the 71G3 or the 70G4. (See Table 10 on page 62 and Table 15 on page 70 in Appendix K. Voltage Analysis Tables.)
§ Modify the voltage settings at the capacitor located at taglet 55001 from switching off at 125 to 123 volts. (See Table 15 on page 70 in Appendix K. Voltage Analysis Tables.)
§ Modify other existing capacitors if CRL is connected to the 71G3. (See Table 7 on page 59 and Table 9 on page 61 in Appendix K. Voltage Analysis Tables.)
§ Conduct other measures necessary to mitigate the effects of existing generation.
§ Remove the capacitor banks located at taglets 21844 and 55079. (See Table 15 on page 70 in Appendix K. Voltage Analysis Tables.)
No additional measures (from a voltage perspective) will be necessary to mitigate the effects of the project on Feeder Backup.
Due to the issues shown in Table 16 (on page 70 in Appendix K. Voltage Analysis Tables), it should be determined if Ottaquechee Hydro can restrict their power factor to 95–100% lagging.
Conservation Voltage Reduction will need to be removed from the regulator settings at White River Junction Substation. The amount of generation will significantly reduce the amount of current seen by the regulators which will cause the CVR settings to reduce the voltage prematurely. At this point, GMP cannot continue the CVR program with the current technology and the presence of so much generation.
The substation regulator controls will also need to be changed out to deal with reverse power.
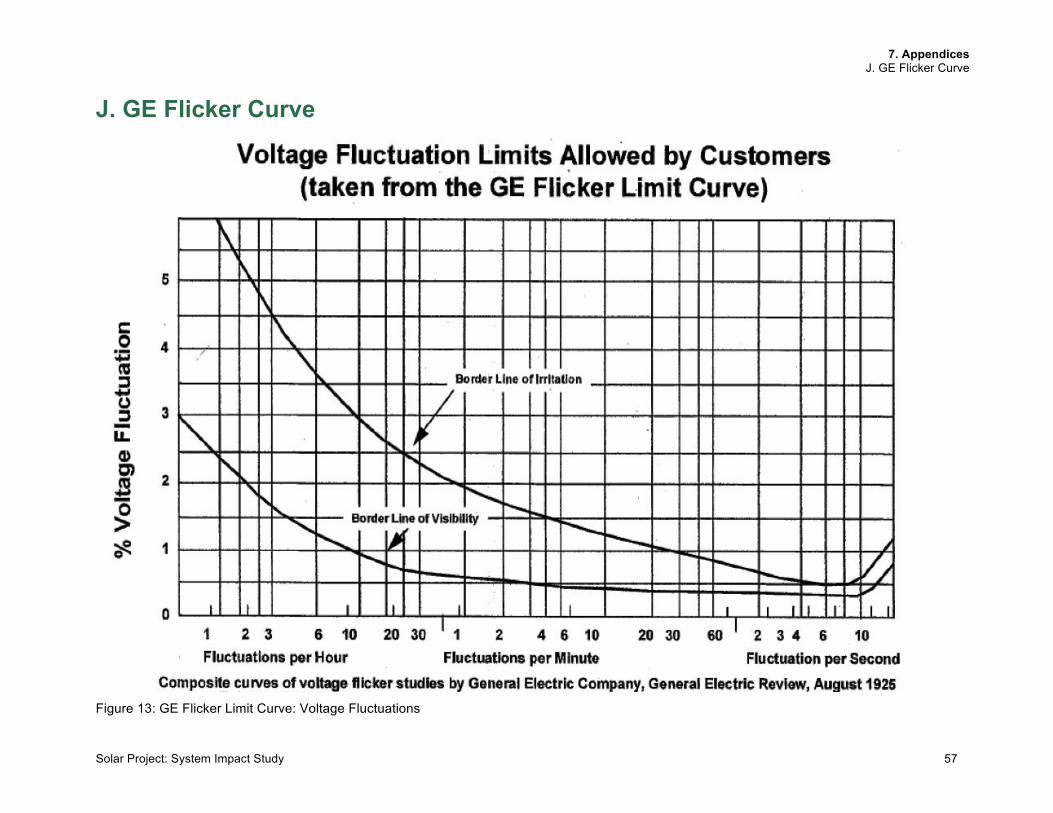
Table 14 (on page 68 in Appendix K. Voltage Analysis Tables) shows that voltage flicker for CRL at peak (worst case) should be approximately 1.09% on the high voltage side of the Project. The GE Flicker Limit Curve5 indicates that 1.09% flicker should be below the visible level for six dips per an hour; to stay under an irritating level, it could rise to 20 dips per an hour. Cloud cover would have to be moving very rapidly and be very broken to create so many disturbances—an extremely rare occurrence. As such, we do not anticipate this kind of cloud cover.
5 See Appendix J. GE Flicker Curve on page 57.
3. Analysis Criteria and Study Results B. Voltage Analysis
12 Green Mountain Power
In addition, while the Hydro generator is on the same line, we find it very unlikely that these two types of generation would start simultaneously. A certain benefit is that hydrogenation typically only starts once a day. As such, these two types of generation—hydro and solar—should work well together, for this particular concern. The situation will be monitored closely before and after installation to make sure that all is well.
Our analysis also demonstrates that, from a voltage flicker perspective, aggregate generation would not be an issue. (See Table 14 through Table 23 on pages 68 through 77 for this analysis.)
The Ottaquechee generator should be upgraded to monitor voltage and power factor (or kVAR if possible) so as to monitor and assist in reducing voltage excursions beyond the allowable ANSI limits.
3. Analysis Criteria and Study Results C. Protection Review
Solar Project: System Impact Study 13
C. Protection Review As previously stated, the solar Project interconnection point is currently located on the 71G3 circuit, however it will ultimately be connected to the 70G4 circuit. Based on this, we analyzed the circuit protection on both circuits and the effect of adding the new solar bank. In the event of a fault, we considered the contribution of the other larger power producers on both circuits in addition to the proposed solar Project.
The amount of fault current available from the circuit source will not change appreciably depending on the connecting circuit (per Table 24 on page 78 in Appendix K. Voltage Analysis Tables), thus no relay changes are necessary. All devices currently installed should be capable of withstanding these fault currents.
For a three-phase solar installation of this size and connection type, our standard is to install a line recloser with settings sensitive enough to remove the generation from the circuit in the event of a fault. In our opinion, the solar installation will not be effectively grounded, thus we will require that the line recloser be installed with three relay class accuracy voltage transformers. These three voltage transformers be rated for the line-to-line voltage of 12.47kV and be connected in a broken delta configuration. (The broken delta arrangement is standard protection for detecting a line-to-ground fault when a generator is not effectively grounded.)
In the event of a line-to-ground fault that operates the upstream line recloser on Route 5 or the substation recloser, the generator won’t be able to detect the absence of the system neutral and will be generating unanchored by the system. This is due to a lack of continuous low impedance bond to the utility system neutral and the origin of the AC output in the Project’s inverter. In the time it takes for the anti-islanding protection to remove the solar generation from the system, the generation could cause overvoltage conditions that could damage both the utility system and the generator’s system. The broken delta scheme will operate instantaneously for a scenario like this, thus removing the potential for ground fault overvoltage. This is true regardless of the connecting circuit.
The solar generation being isolated with the Hydro generation that is downstream of the Project’s interconnection point could also occur. Whether connected to the 71G3 or the 70G4 circuit, this potential scenario could result in the solar generation exciting the Hydro and islanding the isolated section of the circuit. To prevent this, GMP requires that a Direct Transfer Trip (DTT) scheme be installed on the substation recloser, the line recloser on Route 5, and the interconnection recloser at the Project. The DTT scheme will transfer trip the interconnecting recloser in the event that the line recloser on Route 5 or the substation recloser trips.
3. Analysis Criteria and Study Results D. Transmission Review
14 Green Mountain Power
D. Transmission Review Because of the total aggregate generation in the Wilder/Hartford area, the Project, whether connected to the 71G3 or the 70G4, will most likely push approximately a MW of power back onto the CVPS or National Grid infrastructure.
The 71G3 is fed by the CVPS #25 line, a 44 kV transmission line, which is sourced out of the Hartford VELCO and the CVPS Taftsville Substation. CVPS has been requested to review their system and to inform GMP of what changes would be necessary to accommodate the Project.
All costs necessary to allow this backfeed, as well as any costs that CVPS charges GMP to study the backfeed, must be paid by the Project. As well as any charges that CVPS may make to GMP to study the backfeed. At a minimum, metering will need to be upgraded.
Most likely, the Project will be connected to the 70G4. Due to equipment capacity constraints, the portion of circuit that this Project will be connected to has been slotted for a load transfer to the 70G4 since last year. The Project will not be able to remedy the capacity constraint. Even the combination of the Project and the Hydro generation will not ensure the capacity constraint will be avoided.
The 70G4 is fed by a National Grid substation via the 1302, a 13.8 kV transmission line. We requested National Grid review their system in this area, and inform us of the necessary upgrades that will mitigate this impact. National Grid has informed GMP that it will begin this review when the System Impact Study has been completed.
Again, all costs necessary to allow this backfeed, as well as any costs that National Grid charges GMP to study the backfeed, must be paid by the Project. At a minimum, metering will need to be upgraded.
3. Analysis Criteria and Study Results E. IEEE 1547 Review
Solar Project: System Impact Study 15
E. IEEE 1547 Review The Project must meet the requirements stated in IEEE 1547 Sections 4 and 5. We respond to each section (and subsection) requirements.
Section 4.1.1 requires that the generators not actively regulate the voltage at the point of common connection.
Response: The generator will not actively regulate the line voltage to meet this condition.
Section 4.1.2 requires that the generators not disrupt the area grounding nor have an undue effect on ground fault protection of the circuit.
Response: The connection type on both sides of the interconnecting transformer are grounded wye (four-wire) at the generation however, the neutral stops. The inverters themselves are connected ungrounded wye—an ineffectively grounded system with respect to GMP. Because there is not sufficient load to suppress this condition, a recloser with ground fault overvoltage detection scheme must be implemented.
Section 4.1.3 requires that synchronization not cause large voltage fluctuations or flicker issues.
Response: Because the generator will be inverter based, no large inrush currents will occur. The variability of the proposed and aggregate projects should not cause a voltage flicker problem (based on our analysis presented in Table 14 through Table 23 on pages 68 through 77).
Section 4.1.4 addresses interconnection with a secondary spot network.
Response: The Project installation will not be connected to a spot network.
Section 4.1.5 requires that the generators not energize the distribution circuit when the circuit is de-energized.
Response: This requirement is mostly met by the anti-islanding features provided by the UL1741 approved inverter to be used by the Project. It is possible, however, that the existing Hydro project may “trick” itself or the Project into an islanding situation. To definitively determine if this is a problem that needs correction. A study must be conducted. The approximate cost of this study through MelTran is $12,000. Going straight to a Direct Transfer Trip (DTT) solution could be more cost effective. The substation recloser, the line recloser on the VA Cutoff Road, and the Project’s interconnection recloser must be included in the DTT scheme.
3. Analysis Criteria and Study Results E. IEEE 1547 Review
16 Green Mountain Power
Section 4.1.6 requires that generators above 250 kVA have monitoring provisions to provide connection status, and real and reactive power output and the voltage at the point of common coupling.
Response: The Project plans to install a total of 2.2 MW of generation, therefore monitoring provisions will be required. At a minimum, a tele-metering package that includes, real and reactive power output and voltage monitoring will be required.
Section 4.1.7 requires the installation of a readily accessible, lockable switch with a visible opening be installed between GMP and the Project unit.
Response: A recloser will be installed between the Project and the GMP system. To provide a visible lockable disconnect, a load break switch will be installed between the recloser and the GMP system as well.
Section 4.1.8.1 requires that the interconnection system shall be capable of withstanding electromagnetic interference in accordance with IEEE standard C37.90.2-1995 without mis-operation.
Response: The equipment will meet this standard.
Section 4.1.8.2 requires that the system withstand voltage and current surges in accordance with IEEE C62.41.2-2002 or C37.90.1-2002, as applicable.
Response: The equipment will meet this standard.
Section 4.1.8.3 requires that the interconnection paralleling device be capable of 220% of the interconnection voltage.
Response: The equipment will meet this standard.
Section 4.2.1 requires that the DR unit shall cease to energize the circuit for faults on the circuit to which is connected.
Response: This requirement is mostly met by the anti-islanding features provided by the UL1741 approved inverter to be used by the Project. It is possible, however, that the existing Hydro project may “trick” itself or the Project into an islanding situation. To definitively determine if this is a problem that needs correction. A study must be conducted. The approximate cost of this study through MelTran is $12,000. Going straight to a Direct Transfer Trip (DTT) solution could be more cost effective. The substation recloser, the line recloser on the VA Cutoff Road, and the Project’s interconnection recloser must be included in the DTT scheme.
3. Analysis Criteria and Study Results E. IEEE 1547 Review
Solar Project: System Impact Study 17
Section 4.2.2 requires that the generator cease to energize the circuit it is connected to when the system is reclosing.
Response: Because of potential islanding discussed in sections 4.1.5 and 4.2.1, a “live line reclosing” scheme will be employed at the line recloser located on the VA Cutoff Road and at the substation recloser. This will prevent the reclosers from closing back onto an energized circuit and causing equipment damage.
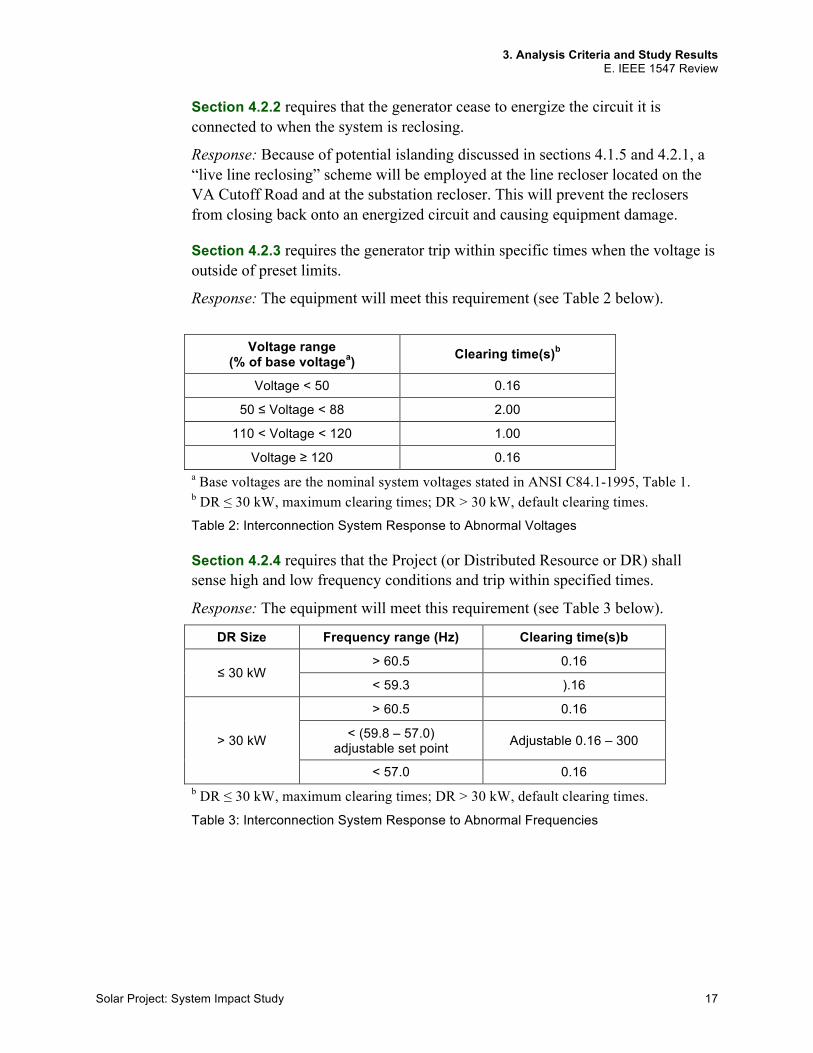
Section 4.2.3 requires the generator trip within specific times when the voltage is outside of preset limits.
Response: The equipment will meet this requirement (see Table 2 below).
Voltage range (% of base voltagea) Clearing time(s)b
Voltage < 50 0.16
50 ≤ Voltage < 88 2.00
110 < Voltage < 120 1.00
Voltage ≥ 120 0.16 a Base voltages are the nominal system voltages stated in ANSI C84.1-1995, Table 1. b DR ≤ 30 kW, maximum clearing times; DR > 30 kW, default clearing times. Table 2: Interconnection System Response to Abnormal Voltages
Section 4.2.4 requires that the Project (or Distributed Resource or DR) shall sense high and low frequency conditions and trip within specified times.
Response: The equipment will meet this requirement (see Table 3 below).
DR Size Frequency range (Hz) Clearing time(s)b
≤ 30 kW > 60.5 0.16 < 59.3 ).16
> 30 kW
> 60.5 0.16 < (59.8 – 57.0)
adjustable set point Adjustable 0.16 – 300
< 57.0 0.16 b DR ≤ 30 kW, maximum clearing times; DR > 30 kW, default clearing times.
Table 3: Interconnection System Response to Abnormal Frequencies
3. Analysis Criteria and Study Results E. IEEE 1547 Review
18 Green Mountain Power
Section 4.2.6 requires that the Project not reconnect until the distribution system is within the limits specified by Range B of ANSI C84.1-1995 and a frequency range of 59.3–60.5 Hz. The applicable B Range values are 424 to 508 volts. In addition, a time delay for up to five minutes prior to re-energizing shall be included in the generator relaying.
Response: Based on the UL1741 listing of this equipment, the generator will meet this requirement.
Section 4.3.1 requires that the system not inject DC current greater than 0.5% of the full rated output current at the point of interconnection.
Response: The generator will comply with this requirement, per its UL1741 listing.
Section 4.3.2 requires that the Project not result in objectionable flicker for other customers on the distribution circuit.
Response: Due to our comprehensive voltage flicker analysis if this Project were connected with no changes to our infrastructure there would be significant voltage flicker issues. We have determined however, what it will take to mitigate the flicker and allow the Project to connect.
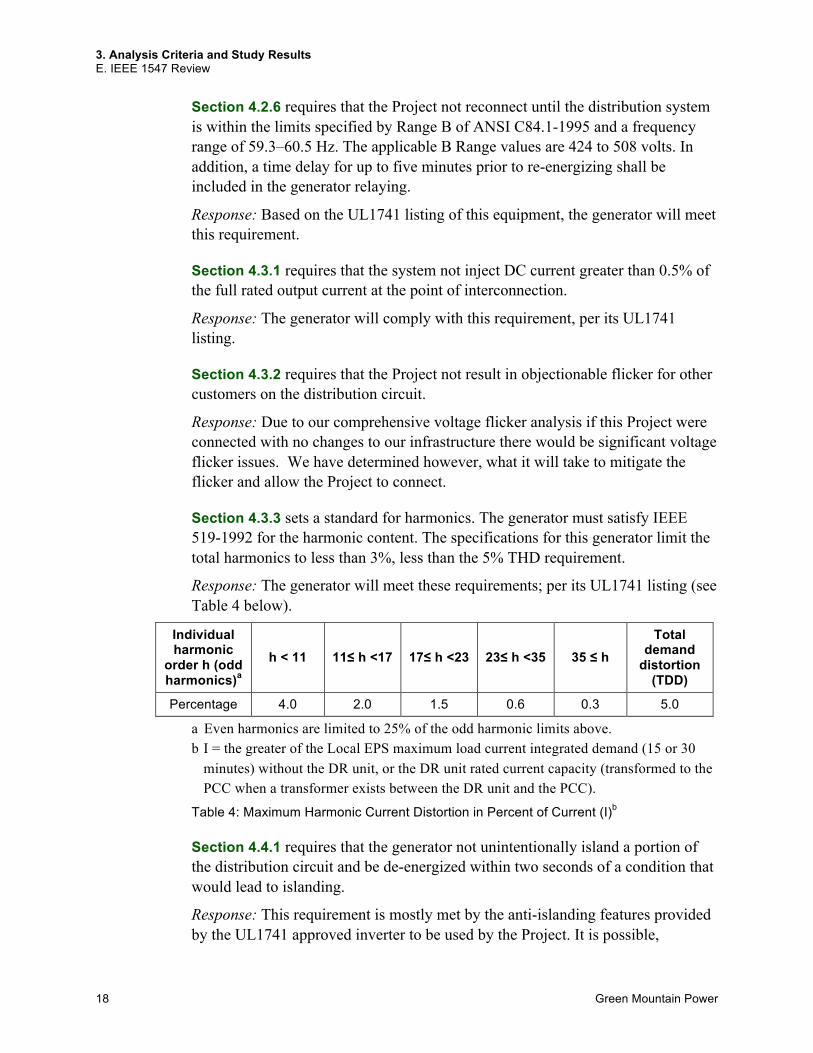
Section 4.3.3 sets a standard for harmonics. The generator must satisfy IEEE 519-1992 for the harmonic content. The specifications for this generator limit the total harmonics to less than 3%, less than the 5% THD requirement.
Response: The generator will meet these requirements; per its UL1741 listing (see Table 4 below).
Individual harmonic
order h (odd harmonics)a
h < 11 11≤ h <17 17≤ h <23 23≤ h <35 35 ≤ h Total
demand distortion
(TDD) Percentage 4.0 2.0 1.5 0.6 0.3 5.0
a Even harmonics are limited to 25% of the odd harmonic limits above. b I = the greater of the Local EPS maximum load current integrated demand (15 or 30
minutes) without the DR unit, or the DR unit rated current capacity (transformed to the PCC when a transformer exists between the DR unit and the PCC).
Table 4: Maximum Harmonic Current Distortion in Percent of Current (I)b
Section 4.4.1 requires that the generator not unintentionally island a portion of the distribution circuit and be de-energized within two seconds of a condition that would lead to islanding.
Response: This requirement is mostly met by the anti-islanding features provided by the UL1741 approved inverter to be used by the Project. It is possible,
3. Analysis Criteria and Study Results E. IEEE 1547 Review
Solar Project: System Impact Study 19
however, that the existing Hydro project may “trick” itself or the Project into an islanding situation. To definitively determine if this is a problem that needs correction. A study must be conducted. The approximate cost of this study through MelTran is $12,000. Going straight to a Direct Transfer Trip (DTT) solution could be more cost effective. The substation recloser, the line recloser on the VA Cutoff Road, and the Project’s interconnection recloser must be included in the DTT scheme.
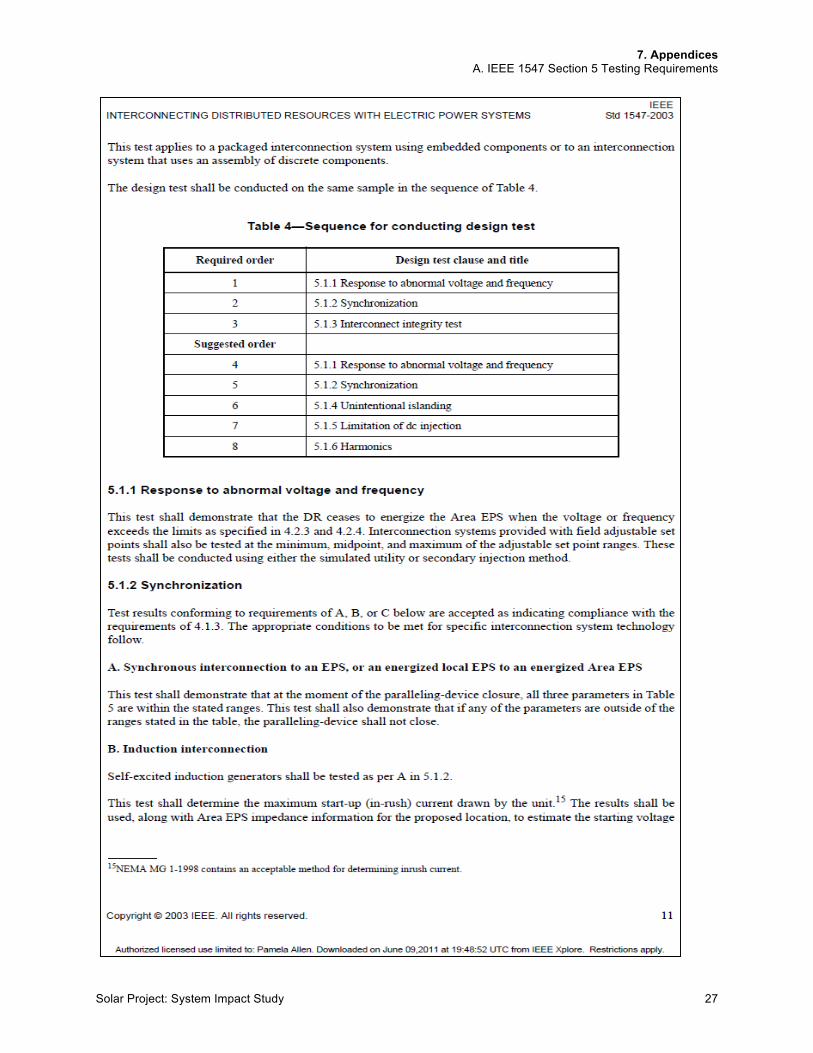
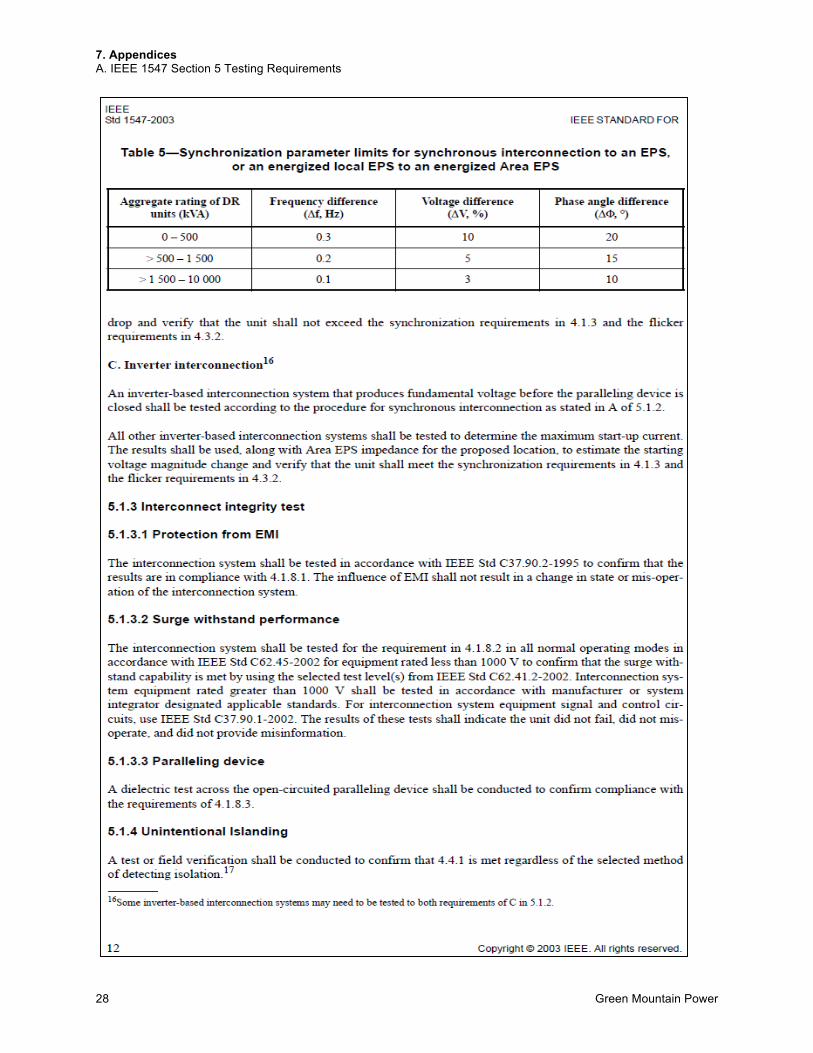
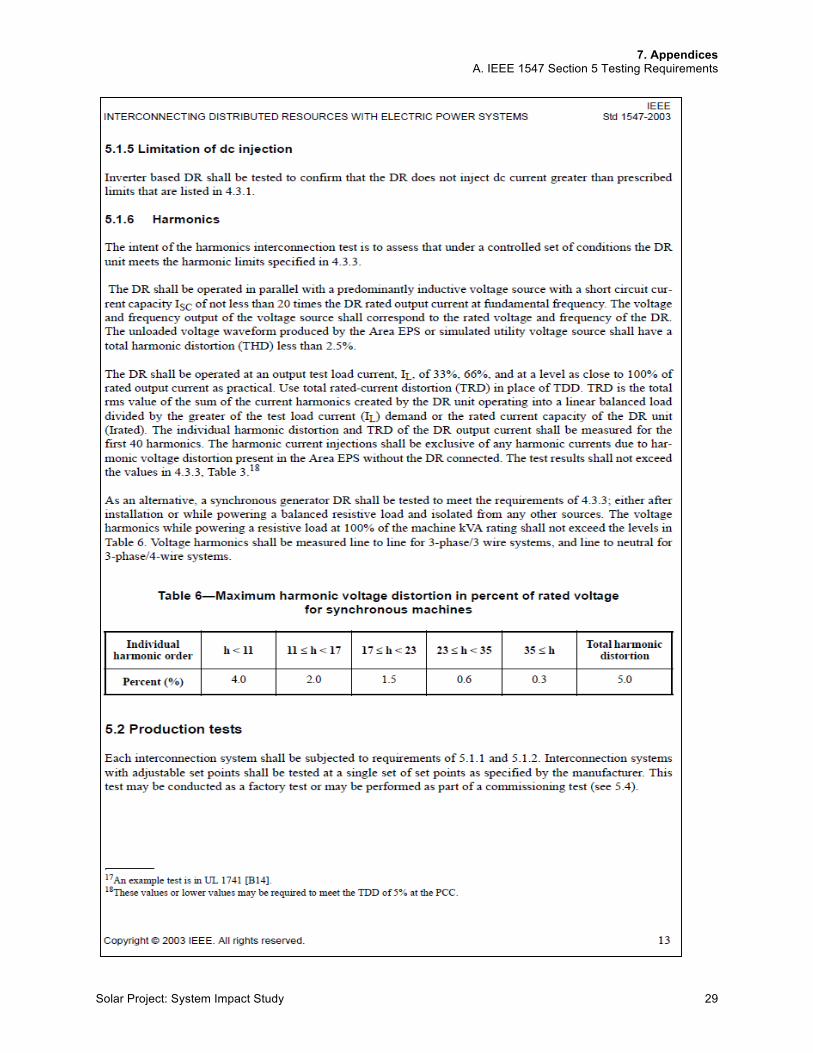
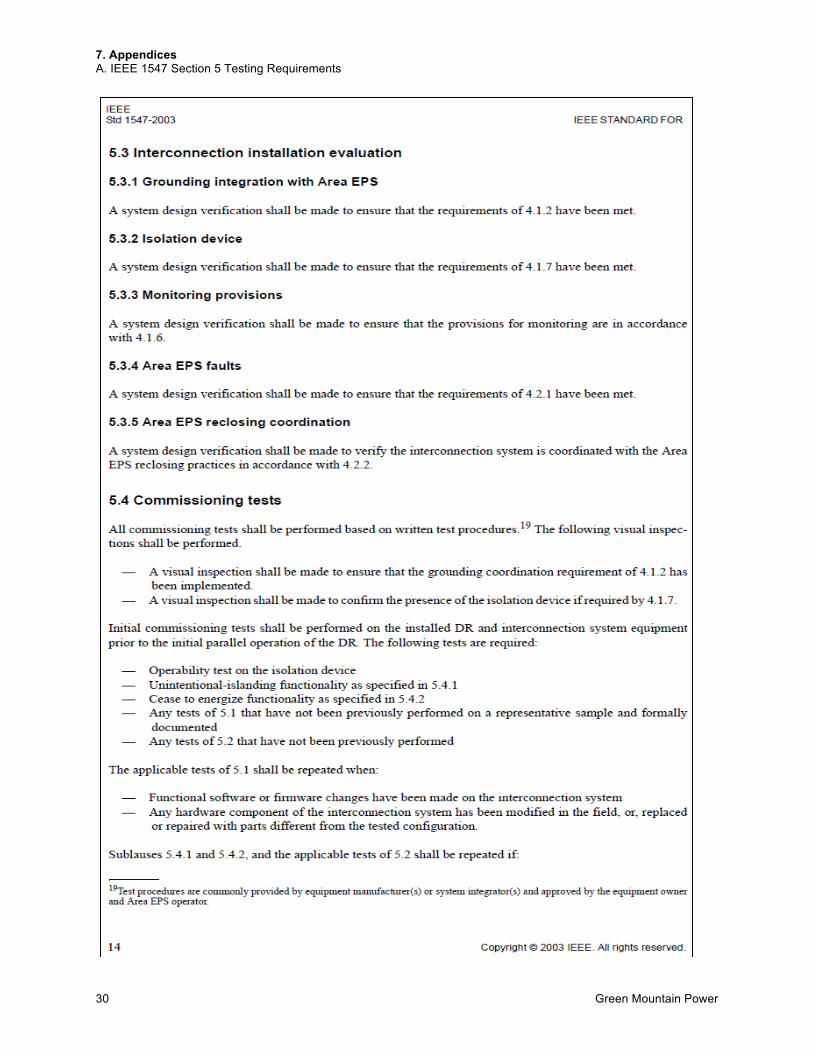
Section 5. Lists the performance tests required to be conducted to demonstrate that the interconnection meets the requirements laid out in Section 4 (of this IEEE 1547 review).
Response: The Project will be required to conduct and document the results of these tests prior to normal operation of the units in parallel with the GMP System. Copies of these results shall be given to GMP; a GMP technician shall be present at the time of testing. The specific test requirements are listed in Appendix A. IEEE 1547 Section 5 Testing Requirements on page 26.
4. Additional Interconnection Requirements
20 Green Mountain Power
4. Additional Interconnection
Requirements
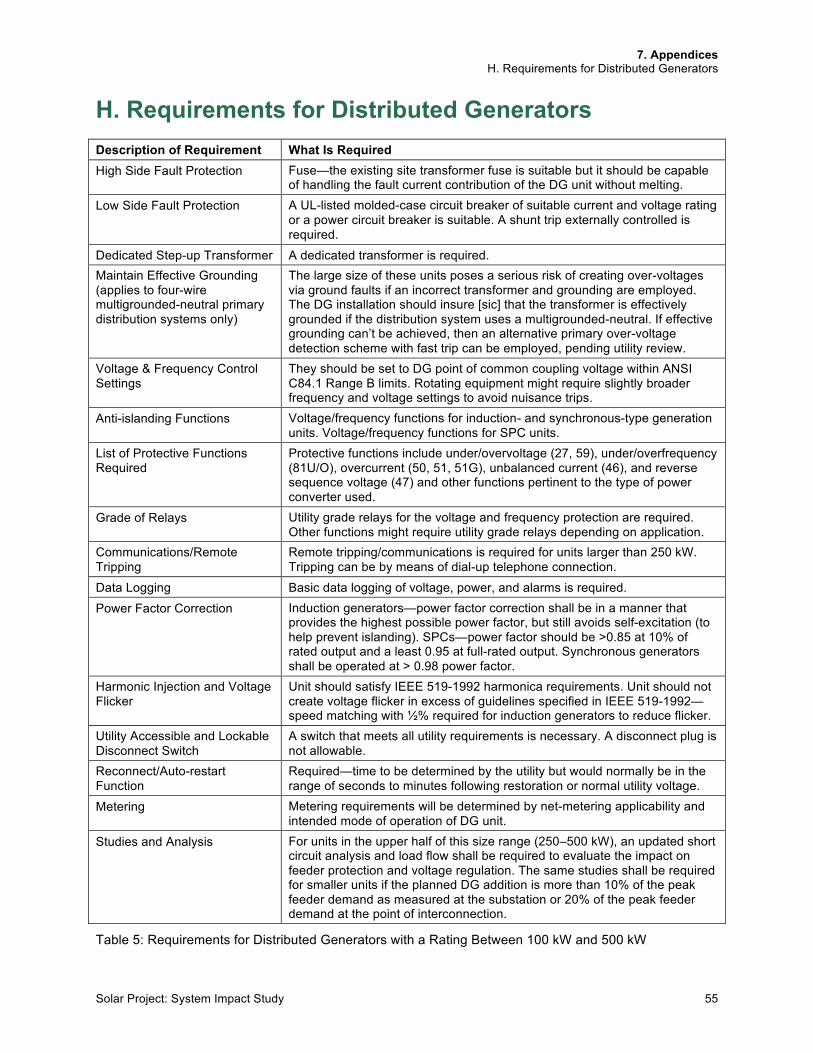
Addressed are the interconnection requirements and recommendations in response to the guidelines specified in Philip Barker’s report, Utility Interconnection Guidelines for Distributed Generation Equipment of 1 MW or Less Connected to a Radial Distribution System (published 23 January 2006). Specifically, we address the column of requirements listed in “Table 4-4: Requirements of Distributed Generators with a Rating Between 100 kW and 500 kW”6. Each requirement is listed here in bold, followed by how we address the requirement.
High Side Fuse Protection Response: The high side protection for this project will be the recloser located at the POI.
Low Side Fault Protection Response: A breaker will be located in the switchgear on the generator side of the transformer and the inverters. The breaker will be a Square D, BP, with a 4,000 A load rating and interruption rating of 65kA. In addition, the inverters are UL1741 approved and possess their own protection features.
Maintain Effective Grounding Response: The connection type on both sides of the interconnecting transformer are grounded wye (four-wire) at the generation switchgear, however, the neutral stops. The inverters themselves are connected ungrounded wye—an ineffective grounded system. Because there is not sufficient load to suppress this condition, a recloser together with ground fault overvoltage detection scheme must be implemented.
Voltage and Frequency Control Settings Response: The Barker report recommends the voltage and frequency settings be based on ANSI C84.1, Range B limits while allowing the settings to be adjusted to a slightly broader range to avoid nuisance trips. These requirements are made in IEEE 1547 as well. The generator shall comply with these limits.
6 This table is reproduced in Appendix H. Requirements for Distributed Generators on page 55.
4. Additional Interconnection Requirements
Solar Project: System Impact Study 21
Grade of Relays Response: The Barker report requires “utility grade” relays for voltage and frequency functions. The generation protection’s proposed integrated relays shall meet these criteria. Review of the proposed relay settings will be required to coordinate the relays with the GMP system.
Communications/Remote Tripping Response: Remote monitoring and tripping will be required for this project. Due to potential islanding, a confirmation of the Project’s recloser tripping will need to be sent to the GMP control center.
Power Factor Correction Response: The generator must maintain a power factor greater than 98%. The proposed inverters have an output power factor of 99%.
Harmonic Injection and Voltage Flicker Response: The generator shall satisfy IEEE 519-1992 for the harmonic content, as indicated by Table 4 (in Section 4.3.3 on page 18).
Utility Accessible and Lockable Disconnect Switch Response: A disconnect switch that can provide a visible and lockable opening between the generator and GMP shall be present between the GMP system and the Project.
Reconnect/Auto Restart Function Response: A time delay mechanism should be employed to stagger the restart of the generators after the normal 5 minute reconnect timer expires. This additional delay is to provide minimum impact on system voltage.
Metering Response: Metering requirements are to be determined by an agreement between the SPEED facilitator and the Project. A comprehensive generator metering package is proposed for the unit and includes primary potential and current transformers and an Elster Alpha Plus meter.
Studies and Analysis Response: The Interconnection Guidelines in the Barker report recommend an updated short circuit and load flow analysis to evaluate the impact of the generator operation on distribution system protection and voltage regulation. This report provides the load flow study and short circuit study.
The additional fault current will affect the present coordination of the entire circuit. A complete coordination study will be completed by GMP to assure the fuses and the substation are properly coordinated. The fuses and breaker settings should then be changed to reflect the coordination study’s recommendations.
5. Typical Line Construction
22 Green Mountain Power
5. Typical Line Construction
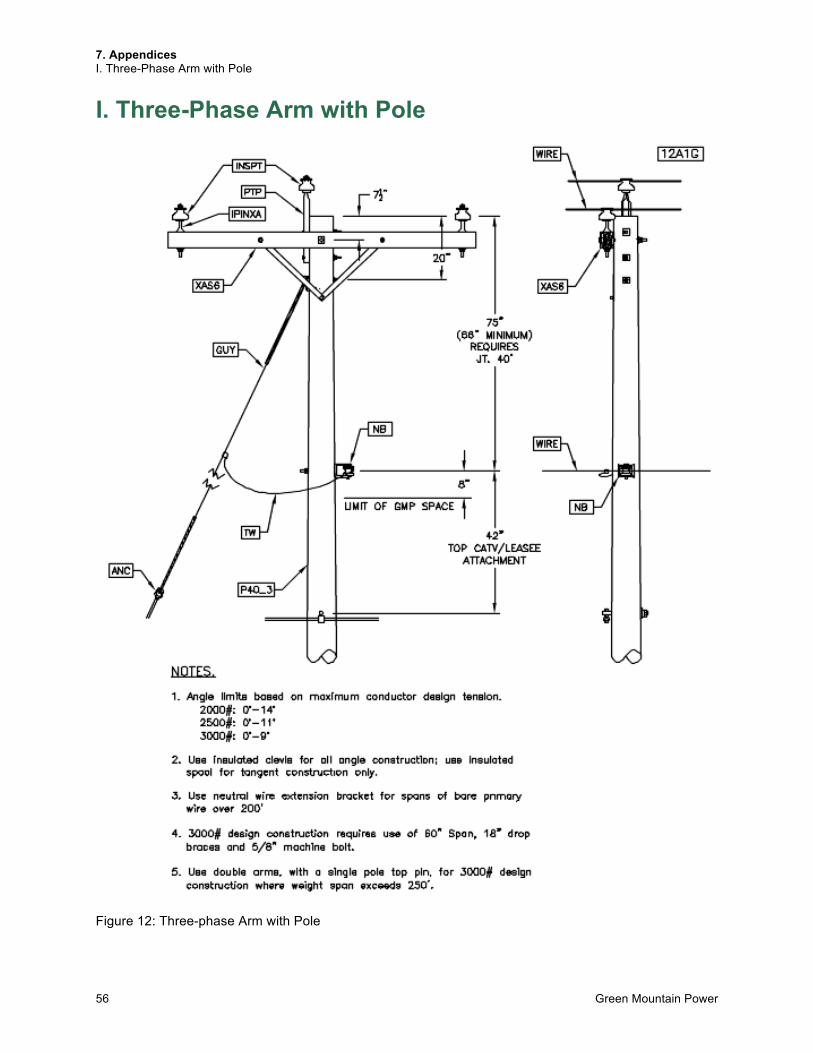
The Project will require a new line extension to connect to the Green Mountain Power System. Typical pole heights for such an extension are between 40 and 45 feet tall, with average distances between poles being approximately 250 feet.
Appendix I. Three-Phase Arm with Pole (on page 56) contains a cross section diagram of a typical three-phase straight line pole.
6. Summary
Solar Project: System Impact Study 23
6. Summary
The following items are required to interconnect CRL Solar in White River Junction, Vermont.
§ Complete a coordination study on the GMP distribution system and the Project generating system to allow proper setting of the generator relays and the distribution circuit reclosers and fusing.
§ Reconductor of 2,200 feet of main line from 1/0AAAC to 477ACSR with a 4/0AAAC neutral.
§ Remove capacitors at taglets 21844 and 55079. GMP will pay for this removal so as to limit the voltage impact from the pre-existing Hydro generation.
§ Change the capacitor settings at taglet 55001 from off at 125 volts to off at 123 volts.
§ Remove Conservation Voltage Reduction settings from the 70G4 regulators.
§ Replace regulator controls at the 70G4 with ones that can sense reverse power.
§ Update the metering at Ottaquechee to monitor voltage and power factor or kVAR.
§ Possibly connect (“island” together) the Hydro generation and the proposed solar Project. MelTran could conduct a $12,000 study to rule this out, or a DTT scheme involving the connecting circuit recloser, the VA Cutoff Road recloser and the CRL recloser will need to be implemented. The cost of such a scheme is estimated to be about $28,500 (with CIAC tax surcharge included). It may be necessary to implement the DTT scheme even after the MelTran study is completed. If a DTT scheme is implemented it is a requirement that the generation will be de-energized whenever the circuit feed is temporarily changed. If it is desired for the Project to operate when being fed temporarily by another circuit, a separate DTT scheme must be setup. This may be more expensive than the original scheme since additional control logic and equipment may be necessary.
§ If the project is for some reason connected to the 71G3, GMP and CVPS must pay for whatever measures necessary to accommodate power flowing back towards the #25 CVPS 44 kV transmission line. This will most likely at minimum include metering upgrade costs. All costs associated with this accommodation will be paid for by the Project.
6. Summary
24 Green Mountain Power
§ When the Project is connected to the 70G4 circuit (which is fed by a National Grid Substation), the Project combined with the Hydro generation will push back power onto this system. National Grid will review the GMP System Impact Study for this project to determine what upgrades may be necessary in order to accommodate this backflow. All costs pertaining to this accommodation will be the responsibility of the Project.
§ A State Electrical Inspector must inspect the Project system to ensure it complies with the National Electrical Code.
§ Complete testing of the Project required by IEEE 1547, Section 5 (as listed in Appendix A. IEEE 1547 Section 5 Testing Requirements on page 26) and provide a written copy to GMP. A GMP technician shall be present during testing.
7. Appendices
Solar Project: System Impact Study 25
7. Appendices
7. Appendices A. IEEE 1547 Section 5 Testing Requirements
26 Green Mountain Power
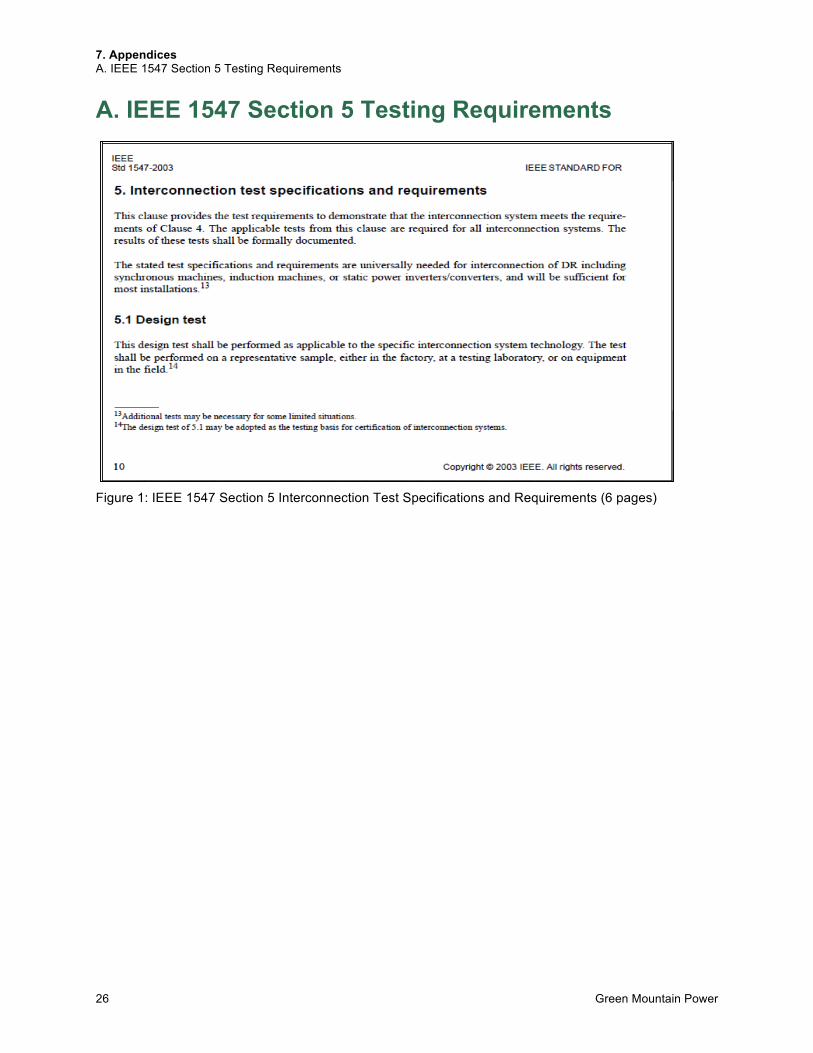
A. IEEE 1547 Section 5 Testing Requirements
Figure 1: IEEE 1547 Section 5 Interconnection Test Specifications and Requirements (6 pages)
7. Appendices A. IEEE 1547 Section 5 Testing Requirements
Solar Project: System Impact Study 27
7. Appendices A. IEEE 1547 Section 5 Testing Requirements
28 Green Mountain Power
7. Appendices A. IEEE 1547 Section 5 Testing Requirements
Solar Project: System Impact Study 29
7. Appendices A. IEEE 1547 Section 5 Testing Requirements
30 Green Mountain Power
7. Appendices A. IEEE 1547 Section 5 Testing Requirements
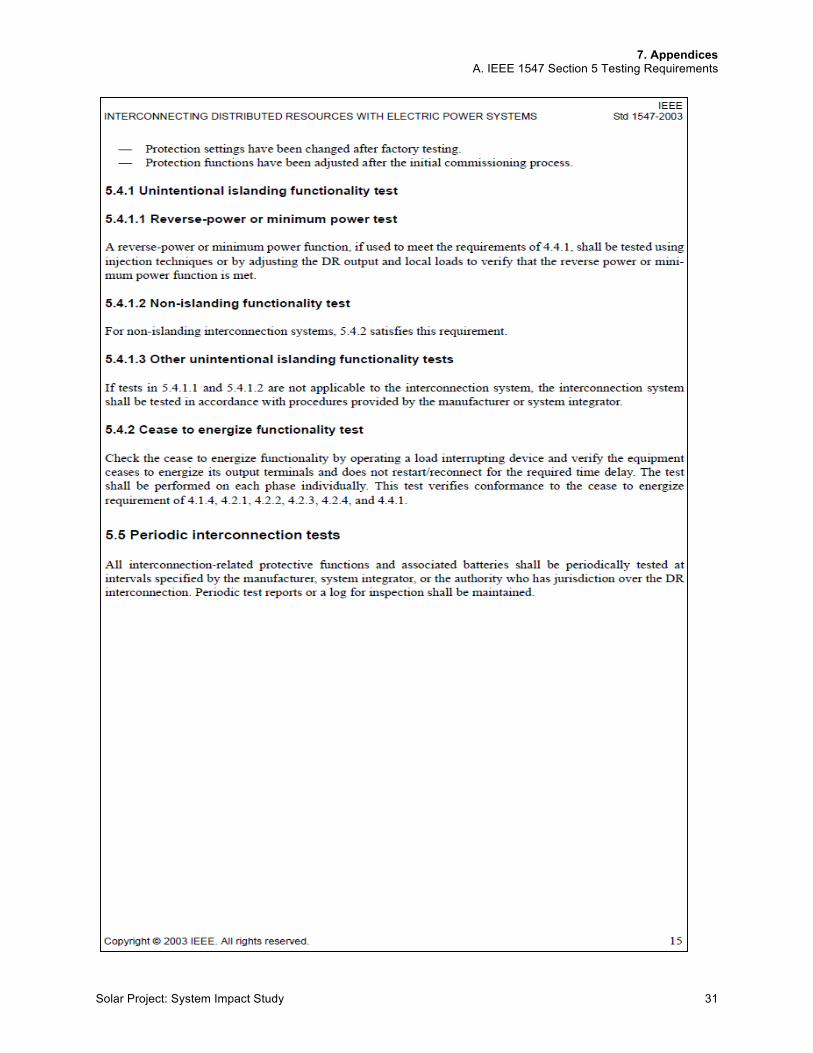
Solar Project: System Impact Study 31
7. Appendices B. PSB Rule 5.500, Section 5.505 Fast Track Screening Process
32 Green Mountain Power
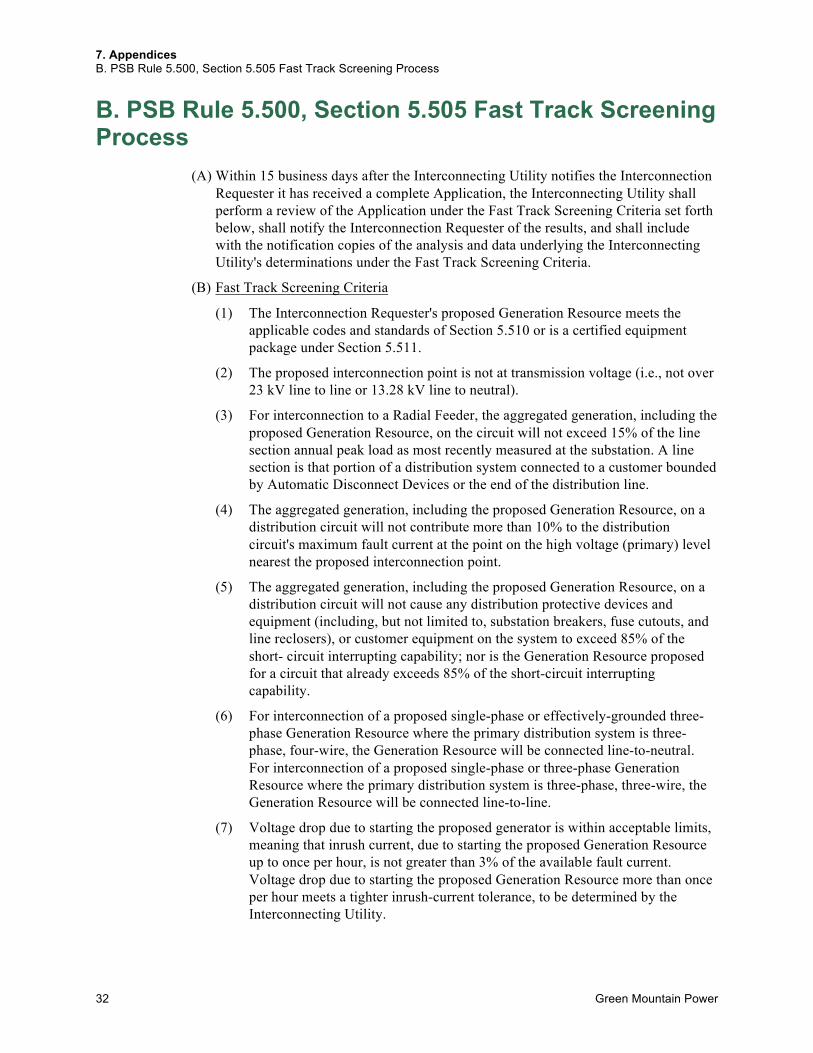
B. PSB Rule 5.500, Section 5.505 Fast Track Screening Process
(A) Within 15 business days after the Interconnecting Utility notifies the Interconnection Requester it has received a complete Application, the Interconnecting Utility shall perform a review of the Application under the Fast Track Screening Criteria set forth below, shall notify the Interconnection Requester of the results, and shall include with the notification copies of the analysis and data underlying the Interconnecting Utility's determinations under the Fast Track Screening Criteria.
(B) Fast Track Screening Criteria
(1) The Interconnection Requester's proposed Generation Resource meets the applicable codes and standards of Section 5.510 or is a certified equipment package under Section 5.511.
(2) The proposed interconnection point is not at transmission voltage (i.e., not over 23 kV line to line or 13.28 kV line to neutral).
(3) For interconnection to a Radial Feeder, the aggregated generation, including the proposed Generation Resource, on the circuit will not exceed 15% of the line section annual peak load as most recently measured at the substation. A line section is that portion of a distribution system connected to a customer bounded by Automatic Disconnect Devices or the end of the distribution line.
(4) The aggregated generation, including the proposed Generation Resource, on a distribution circuit will not contribute more than 10% to the distribution circuit's maximum fault current at the point on the high voltage (primary) level nearest the proposed interconnection point.
(5) The aggregated generation, including the proposed Generation Resource, on a distribution circuit will not cause any distribution protective devices and equipment (including, but not limited to, substation breakers, fuse cutouts, and line reclosers), or customer equipment on the system to exceed 85% of the short- circuit interrupting capability; nor is the Generation Resource proposed for a circuit that already exceeds 85% of the short-circuit interrupting capability.
(6) For interconnection of a proposed single-phase or effectively-grounded three- phase Generation Resource where the primary distribution system is three-phase, four-wire, the Generation Resource will be connected line-to-neutral. For interconnection of a proposed single-phase or three-phase Generation Resource where the primary distribution system is three-phase, three-wire, the Generation Resource will be connected line-to-line.
(7) Voltage drop due to starting the proposed generator is within acceptable limits, meaning that inrush current, due to starting the proposed Generation Resource up to once per hour, is not greater than 3% of the available fault current. Voltage drop due to starting the proposed Generation Resource more than once per hour meets a tighter inrush-current tolerance, to be determined by the Interconnecting Utility.
7. Appendices B. PSB Rule 5.500, Section 5.505 Fast Track Screening Process
Solar Project: System Impact Study 33
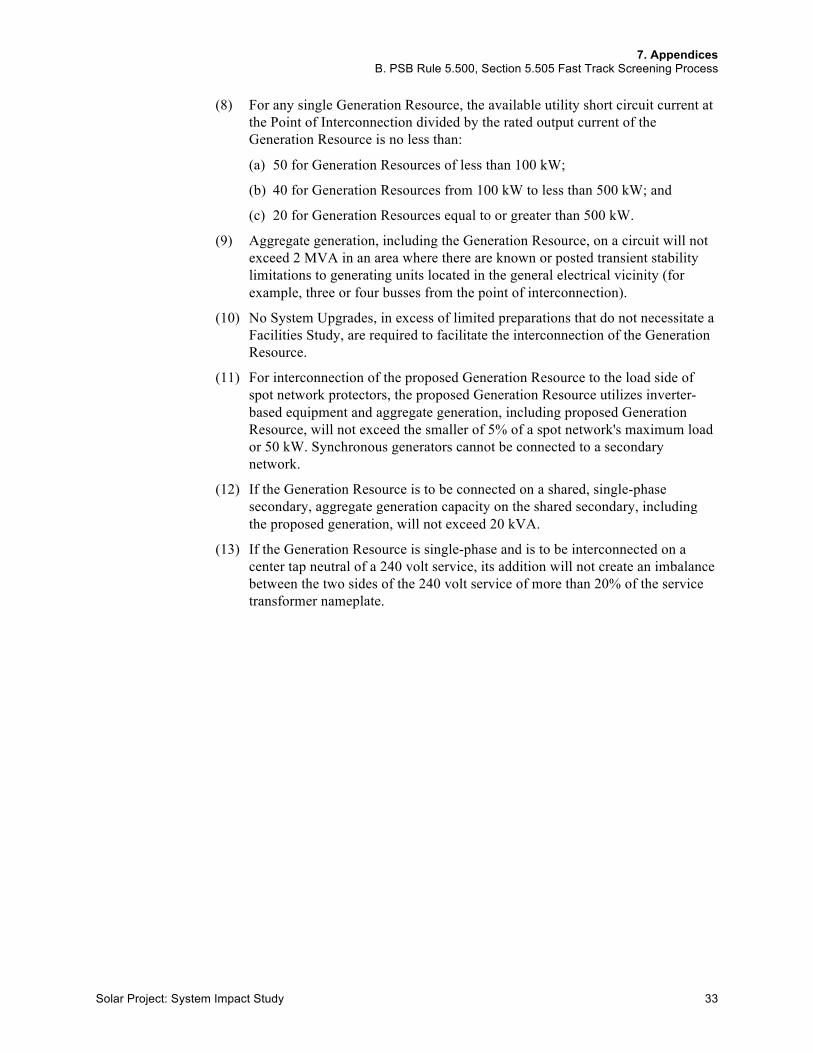
(8) For any single Generation Resource, the available utility short circuit current at the Point of Interconnection divided by the rated output current of the Generation Resource is no less than:
(a) 50 for Generation Resources of less than 100 kW;
(b) 40 for Generation Resources from 100 kW to less than 500 kW; and
(c) 20 for Generation Resources equal to or greater than 500 kW.
(9) Aggregate generation, including the Generation Resource, on a circuit will not exceed 2 MVA in an area where there are known or posted transient stability limitations to generating units located in the general electrical vicinity (for example, three or four busses from the point of interconnection).
(10) No System Upgrades, in excess of limited preparations that do not necessitate a Facilities Study, are required to facilitate the interconnection of the Generation Resource.
(11) For interconnection of the proposed Generation Resource to the load side of spot network protectors, the proposed Generation Resource utilizes inverter-based equipment and aggregate generation, including proposed Generation Resource, will not exceed the smaller of 5% of a spot network's maximum load or 50 kW. Synchronous generators cannot be connected to a secondary network.
(12) If the Generation Resource is to be connected on a shared, single-phase secondary, aggregate generation capacity on the shared secondary, including the proposed generation, will not exceed 20 kVA.
(13) If the Generation Resource is single-phase and is to be interconnected on a center tap neutral of a 240 volt service, its addition will not create an imbalance between the two sides of the 240 volt service of more than 20% of the service transformer nameplate.
7. Appendices C. Circuit One-Line Diagram
34 Green Mountain Power
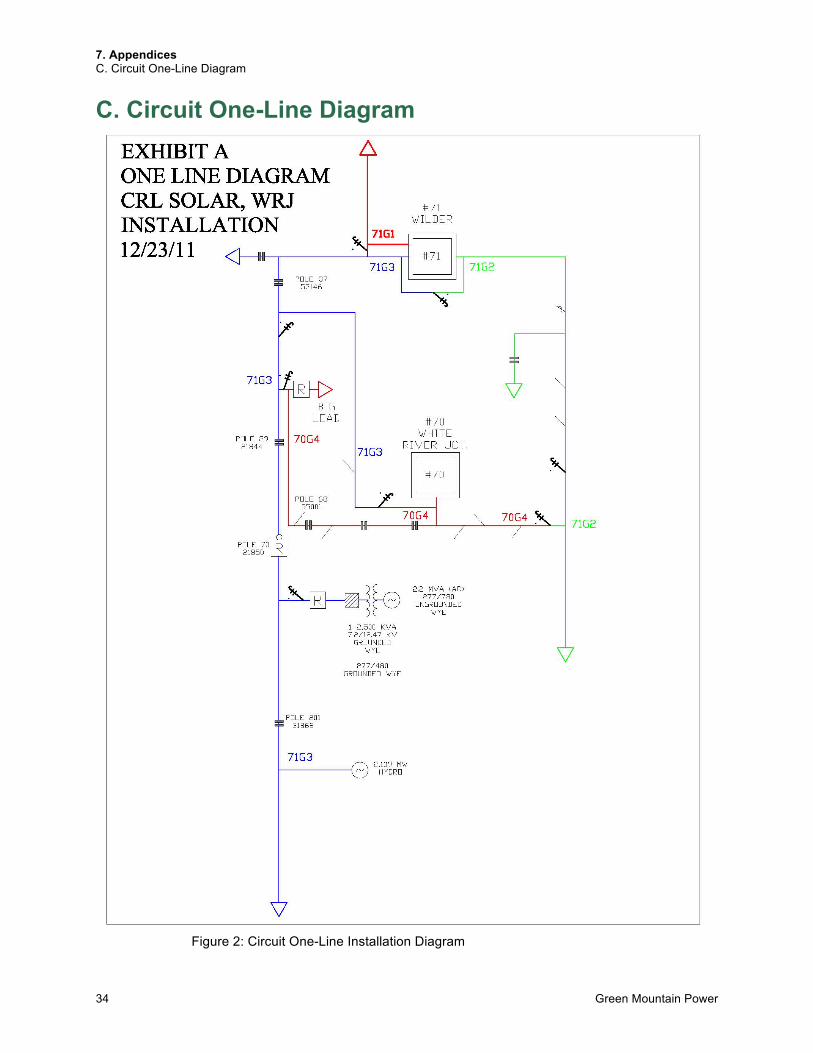
C. Circuit One-Line Diagram
Figure 2: Circuit One-Line Installation Diagram
7. Appendices D. Interconnect Application
Solar Project: System Impact Study 35
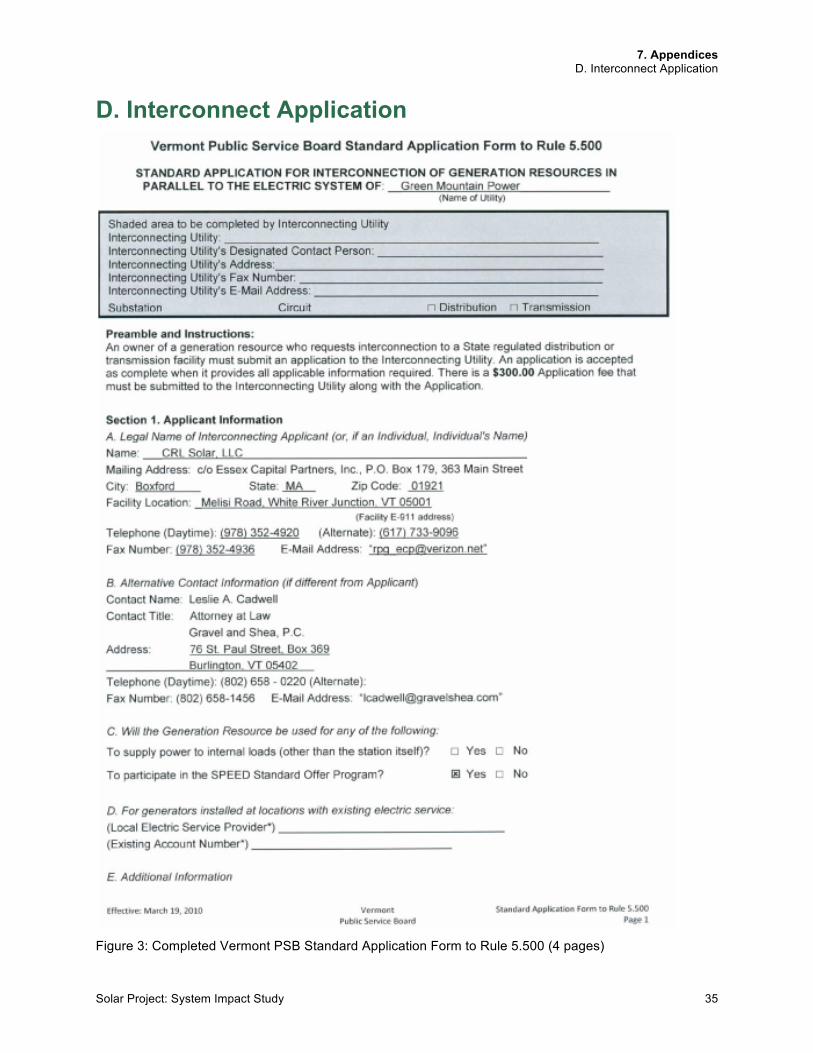
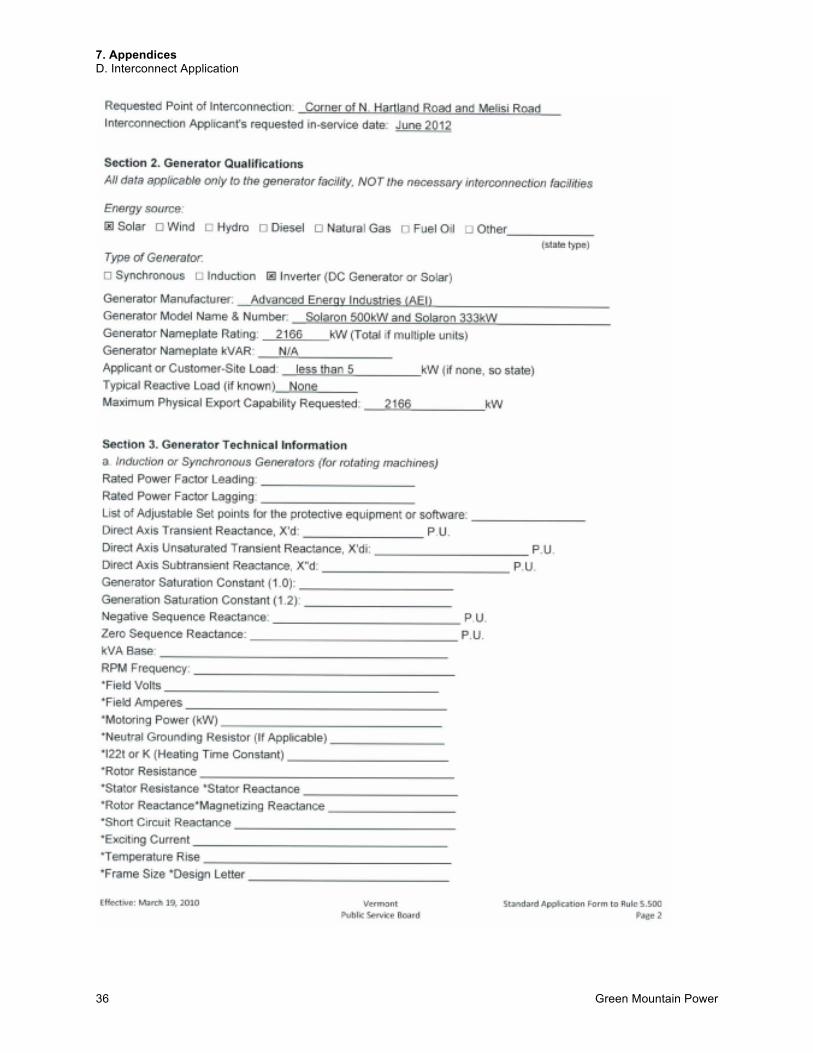
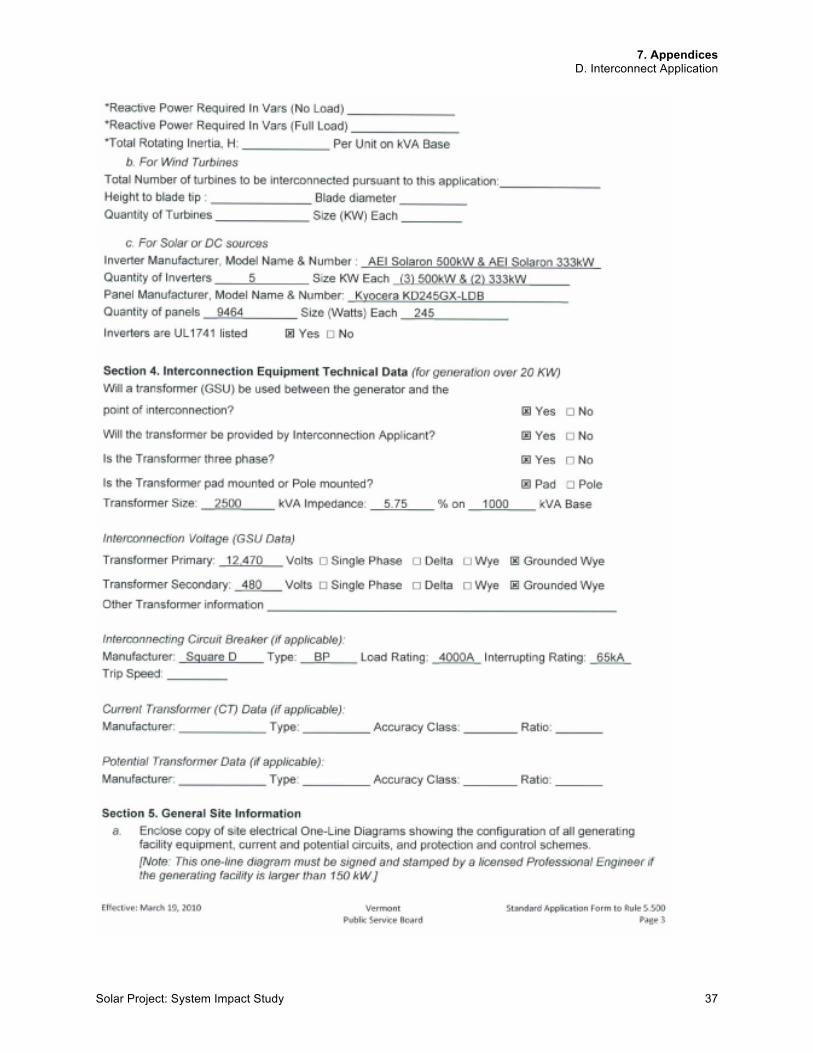
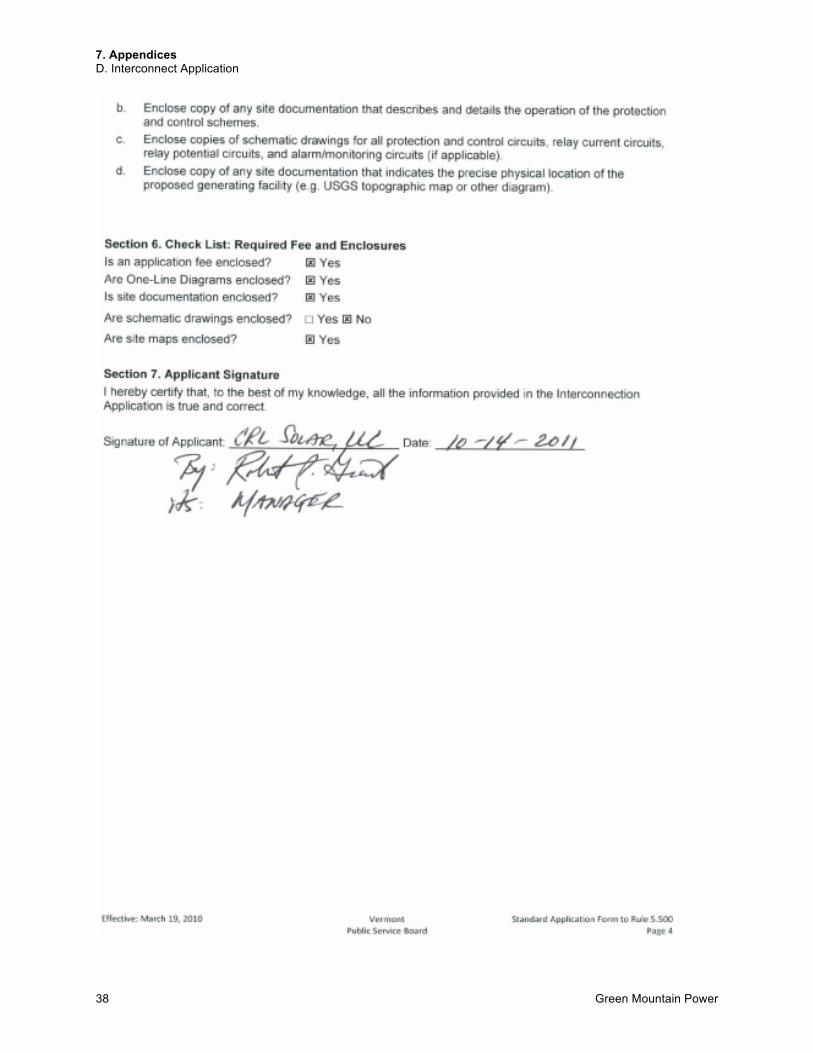
D. Interconnect Application
Figure 3: Completed Vermont PSB Standard Application Form to Rule 5.500 (4 pages)
7. Appendices D. Interconnect Application
36 Green Mountain Power
7. Appendices D. Interconnect Application
Solar Project: System Impact Study 37
7. Appendices D. Interconnect Application
38 Green Mountain Power
7. Appendices E. Fuse Specifications
Solar Project: System Impact Study 39
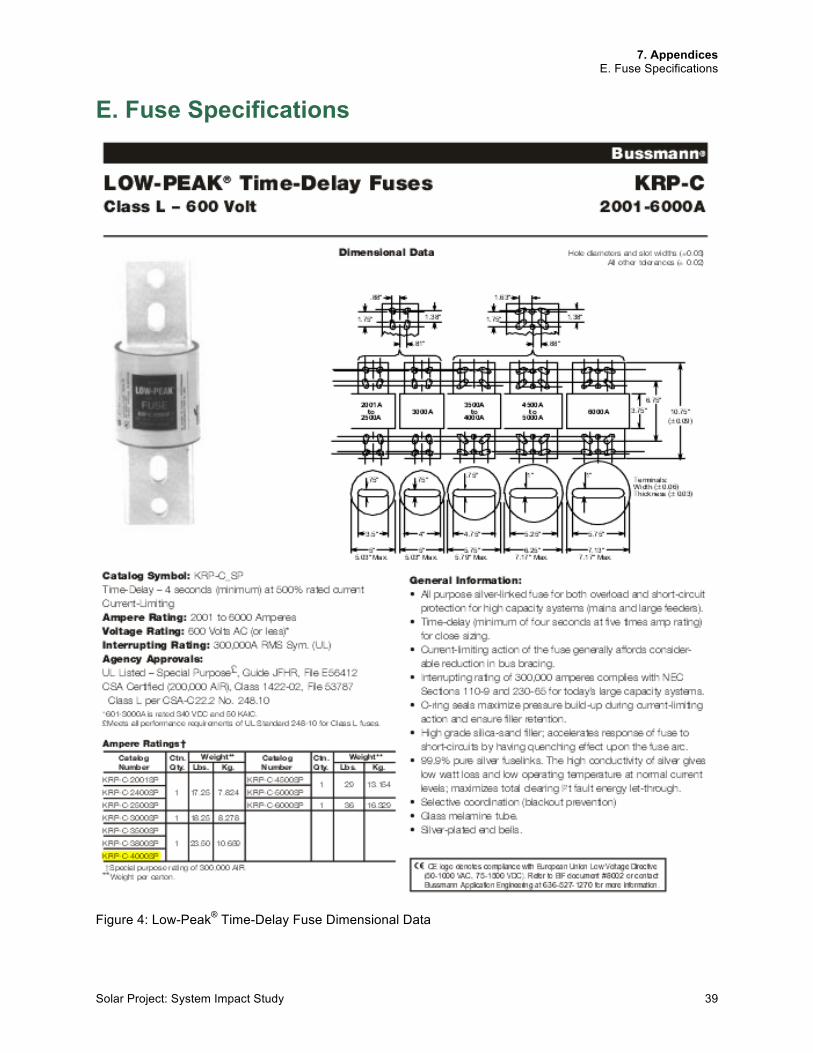
E. Fuse Specifications
Figure 4: Low-Peak® Time-Delay Fuse Dimensional Data
7. Appendices E. Fuse Specifications
40 Green Mountain Power
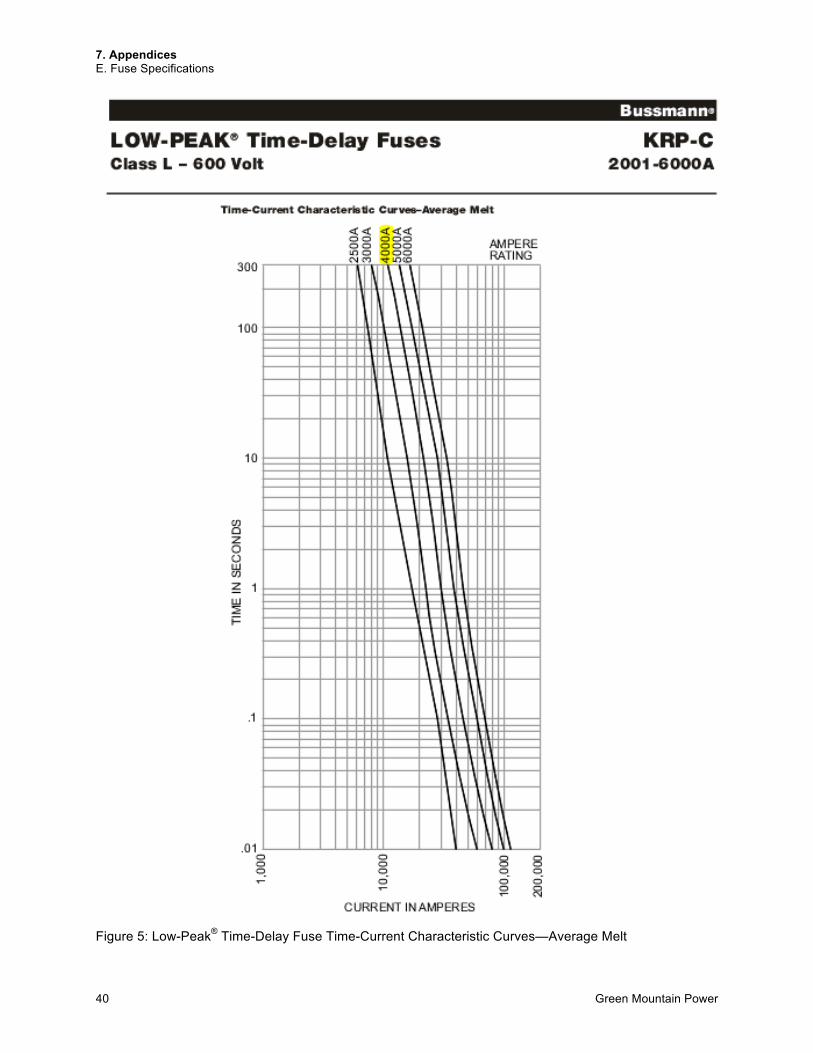
Figure 5: Low-Peak® Time-Delay Fuse Time-Current Characteristic Curves—Average Melt
7. Appendices E. Fuse Specifications
Solar Project: System Impact Study 41
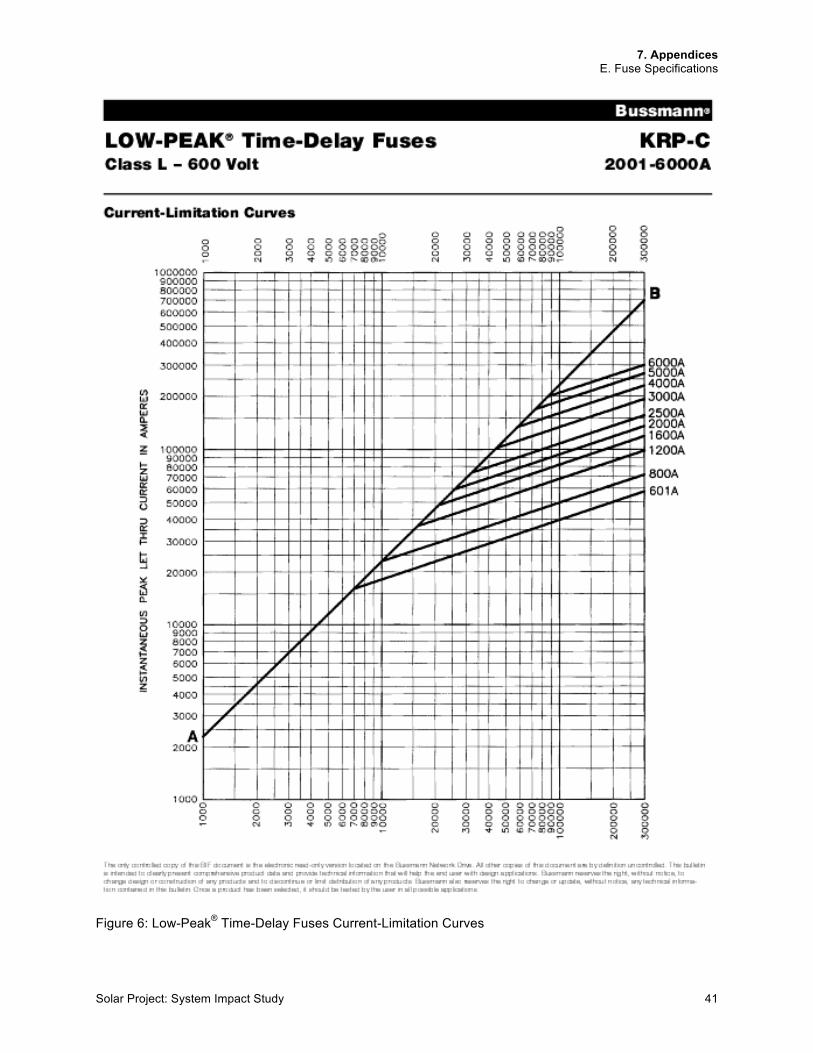
Figure 6: Low-Peak® Time-Delay Fuses Current-Limitation Curves
7. Appendices F. Solaron 333 & 500 kW PV Inverter Specifications
42 Green Mountain Power
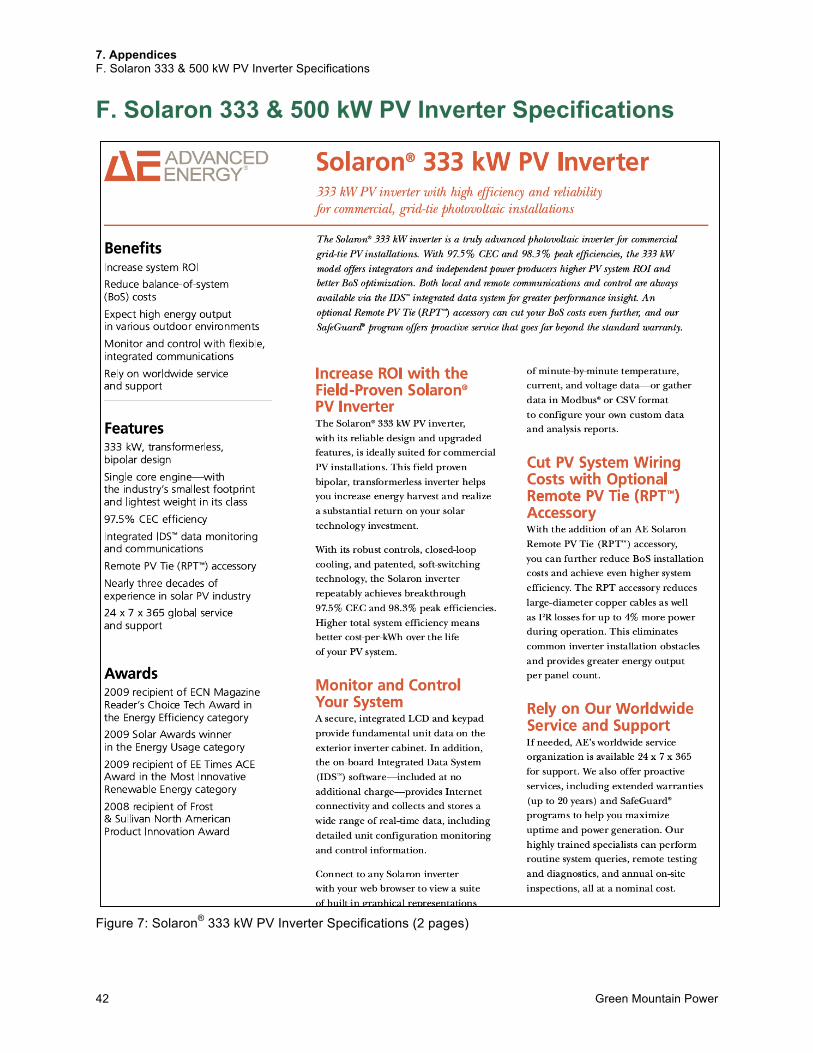
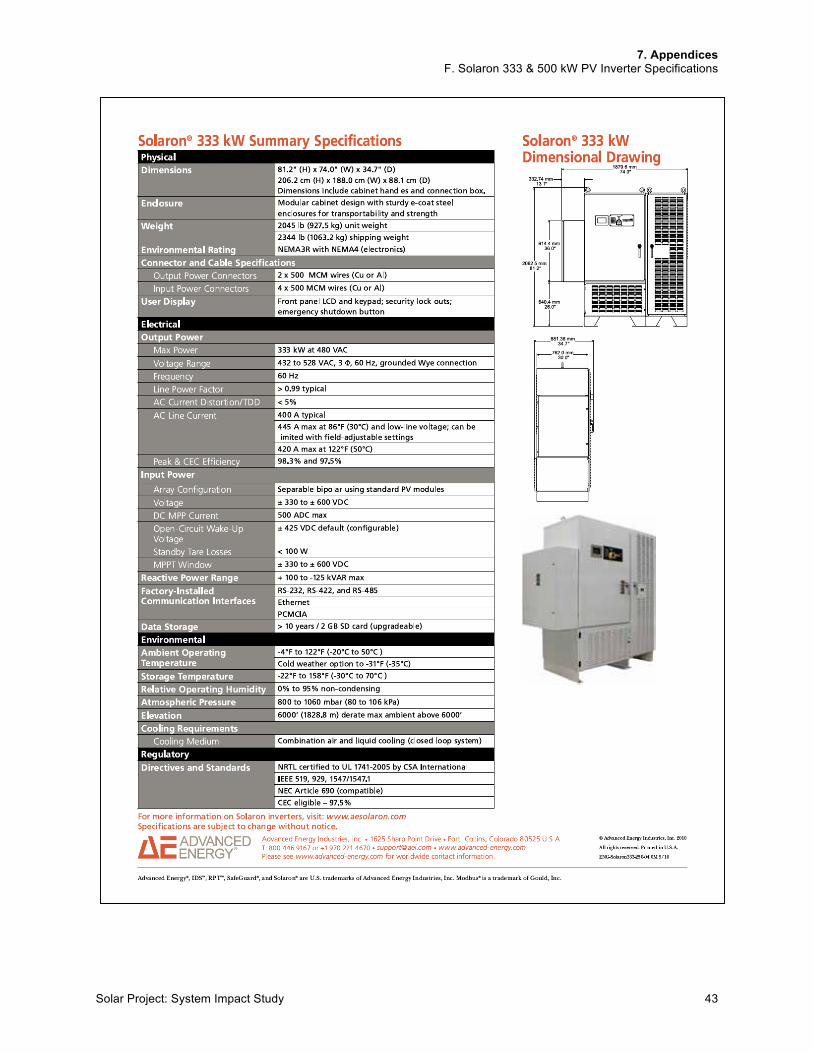
F. Solaron 333 & 500 kW PV Inverter Specifications
Figure 7: Solaron® 333 kW PV Inverter Specifications (2 pages)
7. Appendices F. Solaron 333 & 500 kW PV Inverter Specifications
Solar Project: System Impact Study 43
7. Appendices F. Solaron 333 & 500 kW PV Inverter Specifications
44 Green Mountain Power
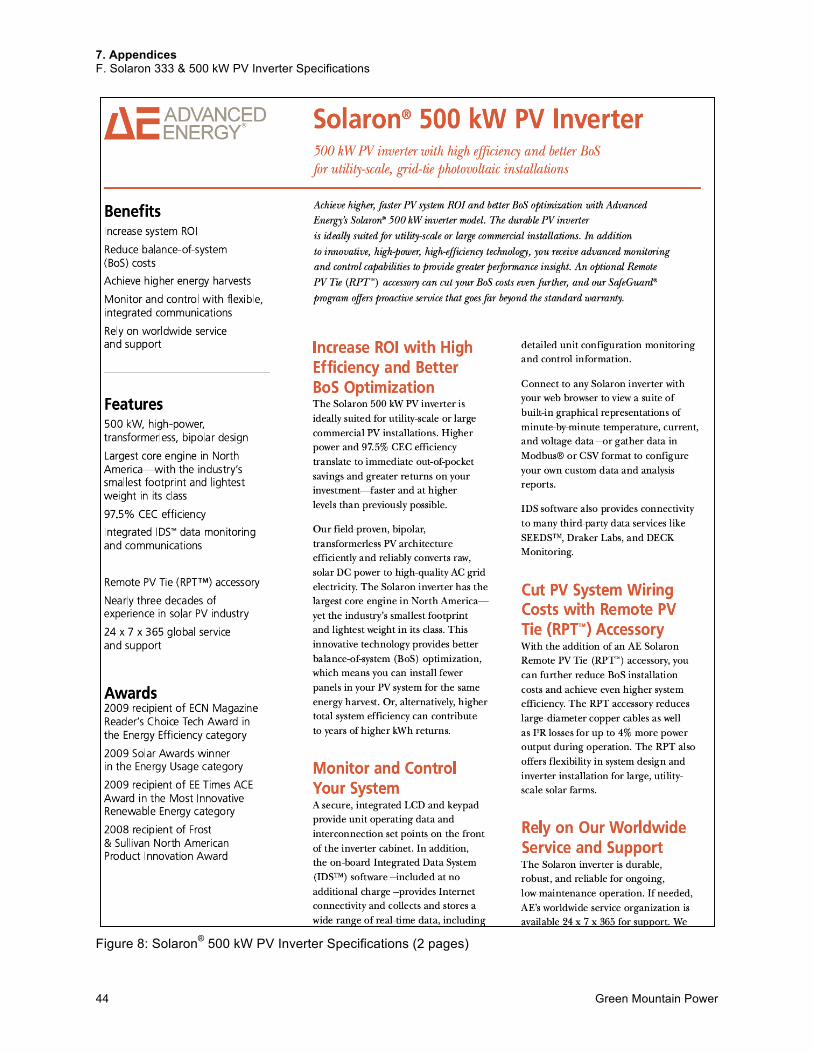
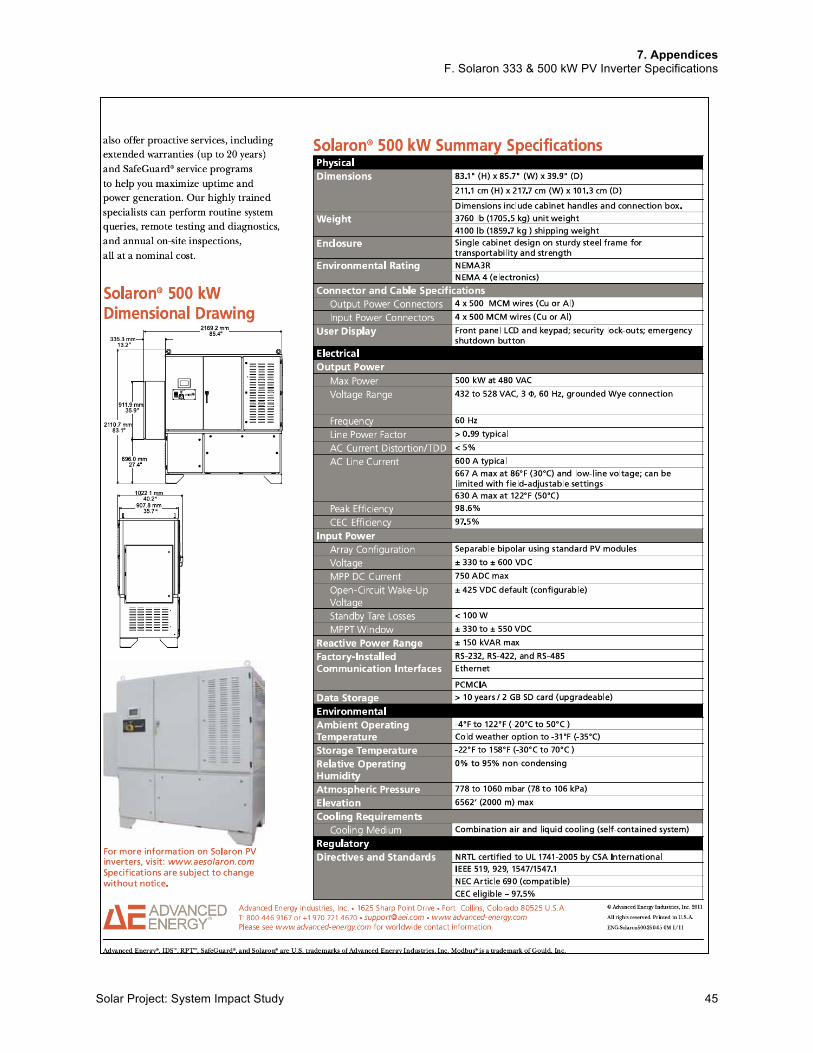
Figure 8: Solaron® 500 kW PV Inverter Specifications (2 pages)
7. Appendices F. Solaron 333 & 500 kW PV Inverter Specifications
Solar Project: System Impact Study 45
7. Appendices G. Photovoltaic Module Specifications
46 Green Mountain Power
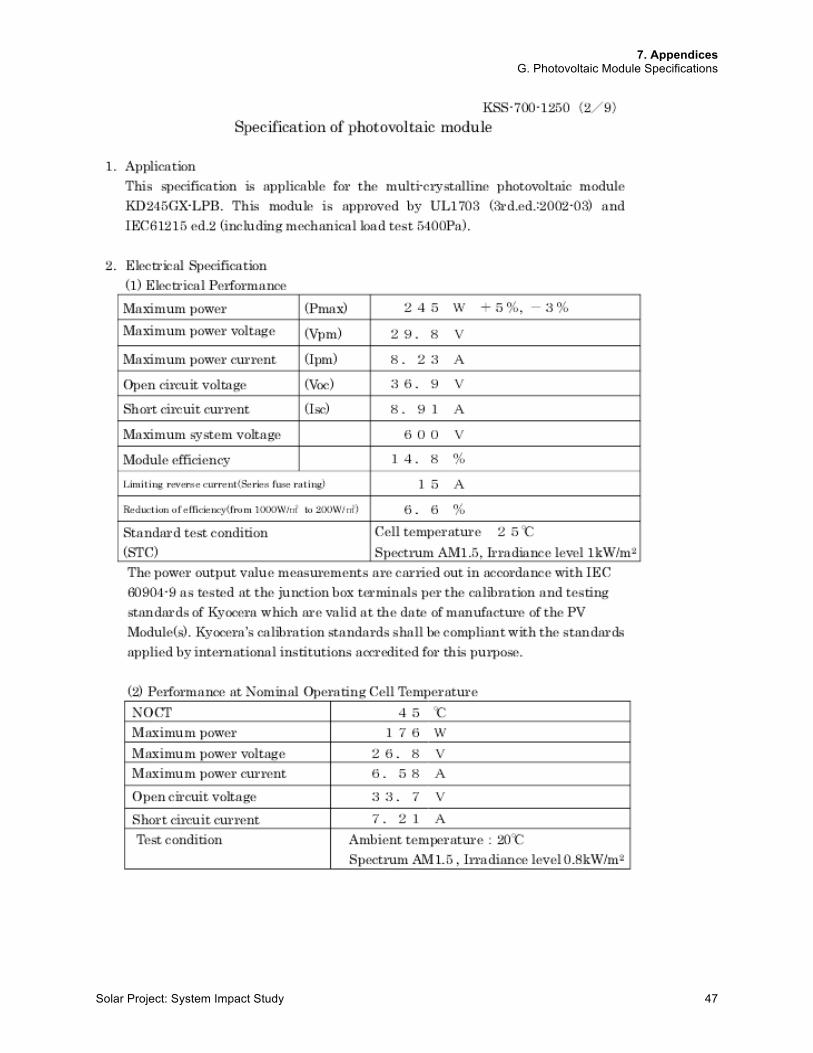
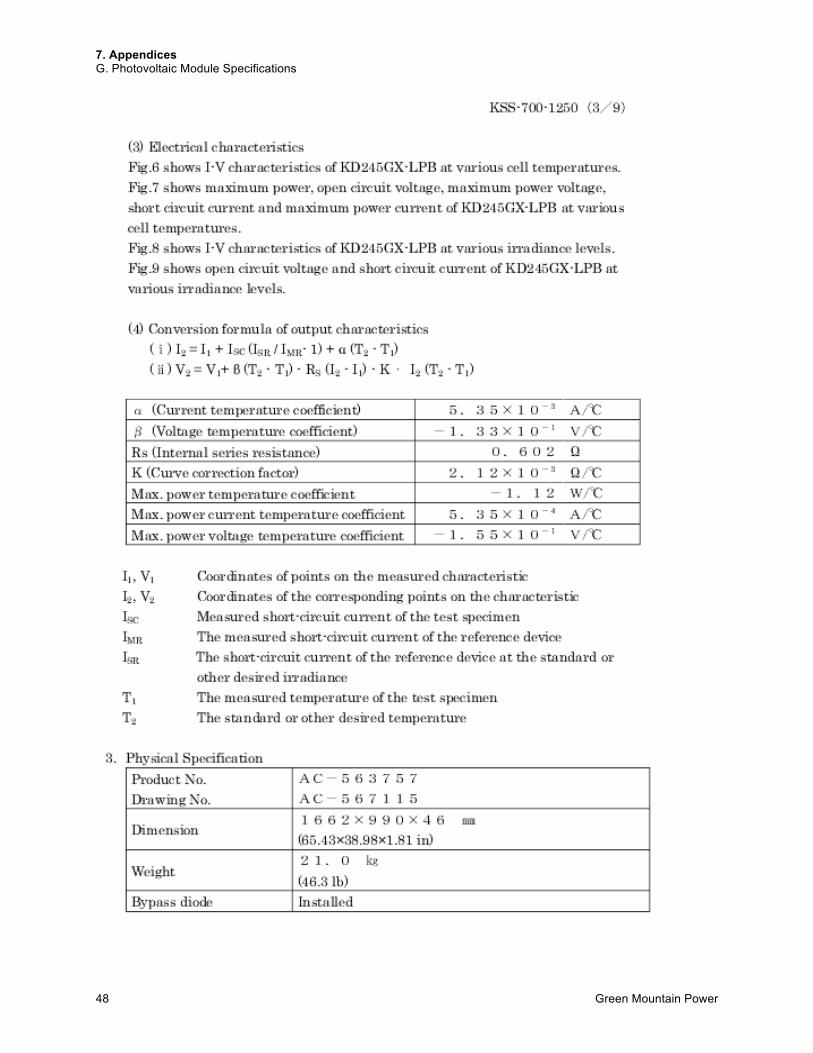
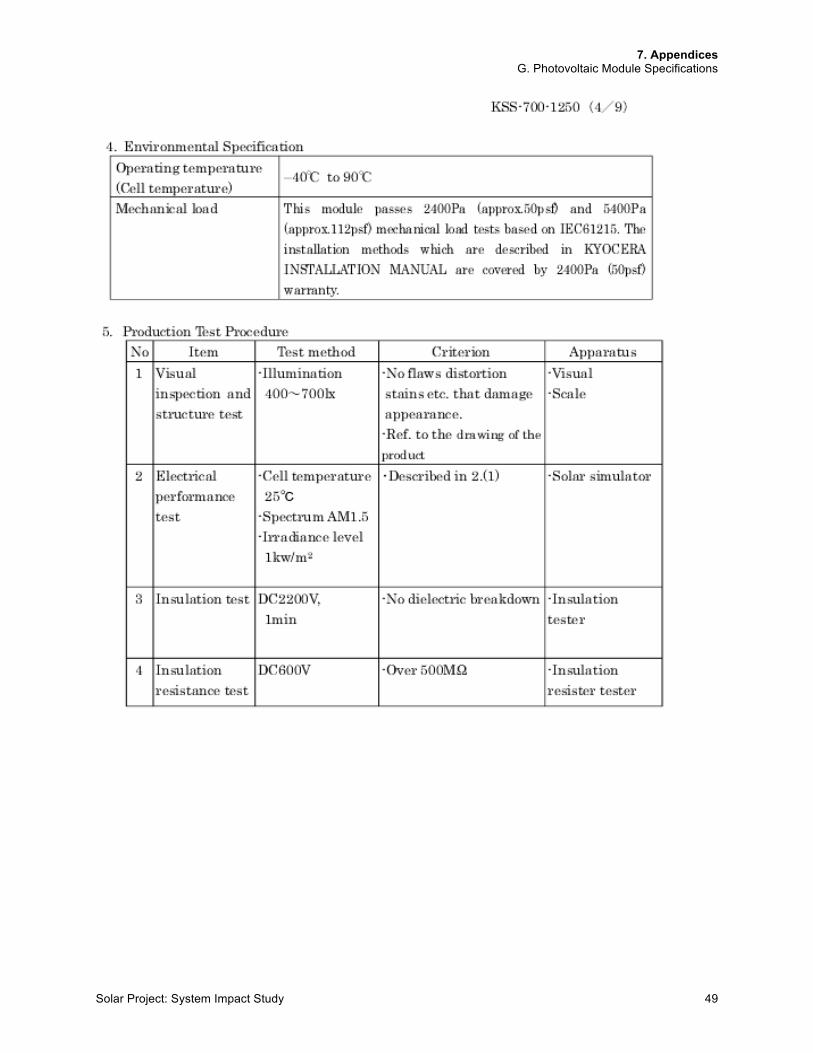
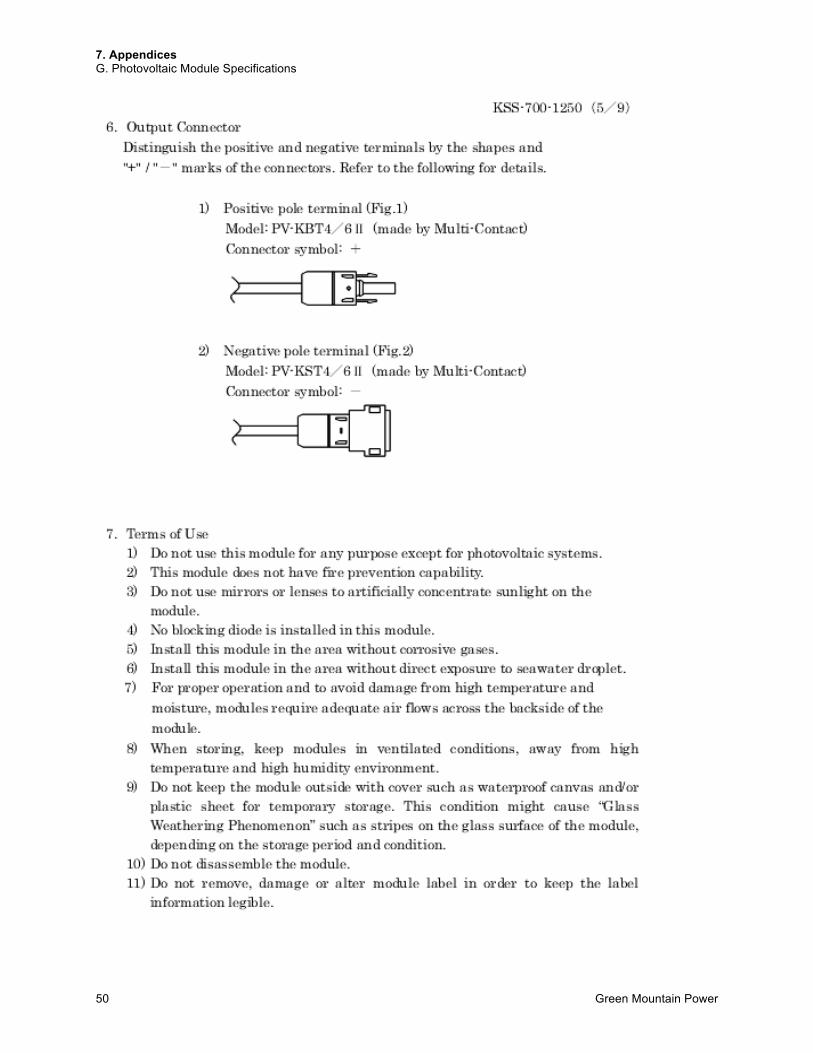
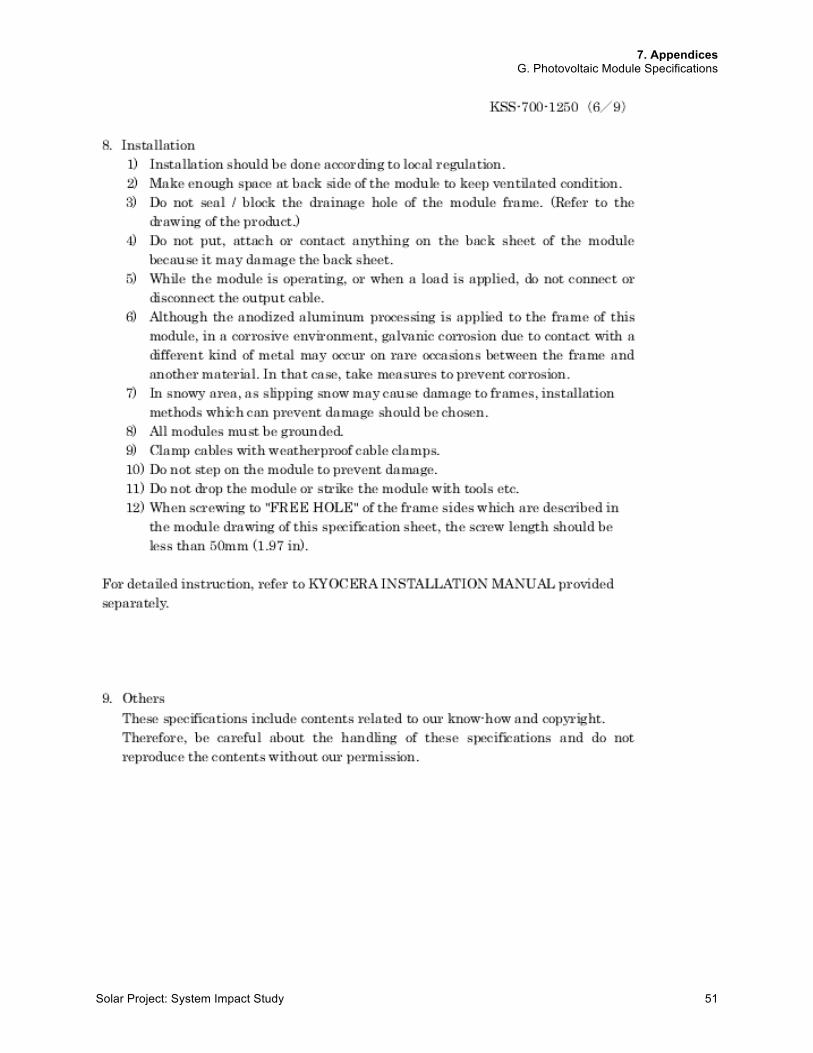
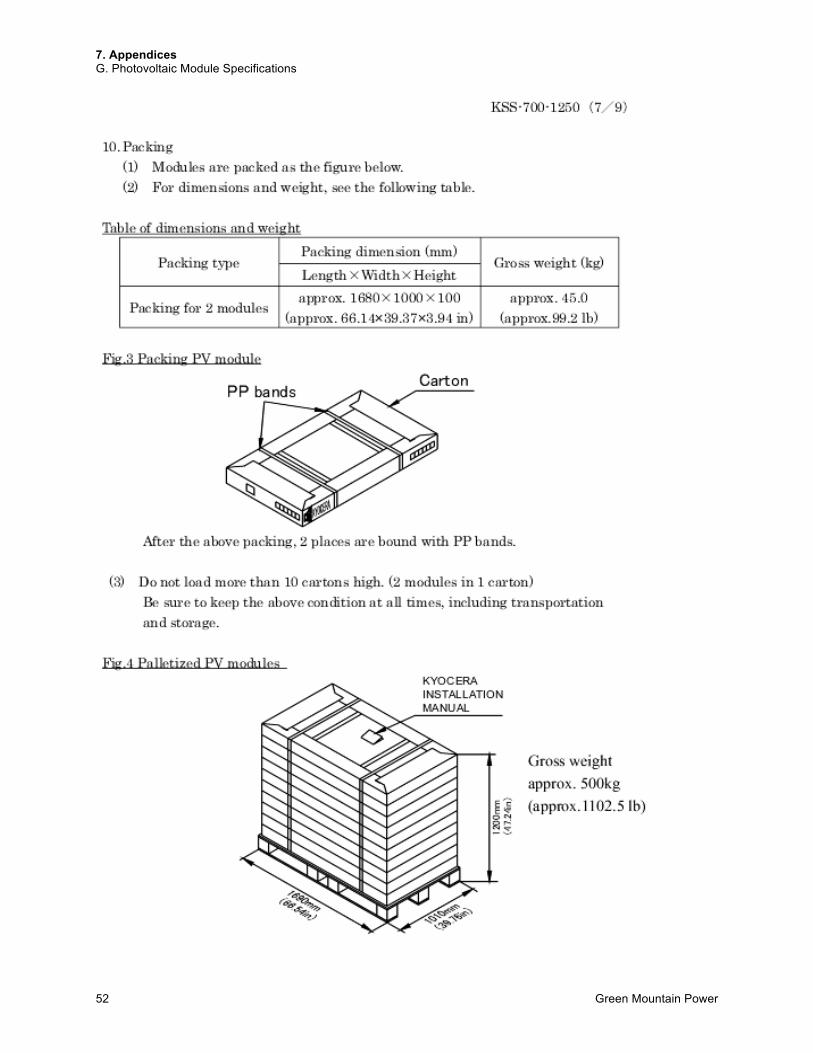
G. Photovoltaic Module Specifications
Figure 9: Specifications of Kyocera Photovoltaic Module, Type KD245GX-LPBN (7 pages)
7. Appendices G. Photovoltaic Module Specifications
Solar Project: System Impact Study 47
7. Appendices G. Photovoltaic Module Specifications
48 Green Mountain Power
7. Appendices G. Photovoltaic Module Specifications
Solar Project: System Impact Study 49
7. Appendices G. Photovoltaic Module Specifications
50 Green Mountain Power
7. Appendices G. Photovoltaic Module Specifications
Solar Project: System Impact Study 51
7. Appendices G. Photovoltaic Module Specifications
52 Green Mountain Power
7. Appendices G. Photovoltaic Module Specifications
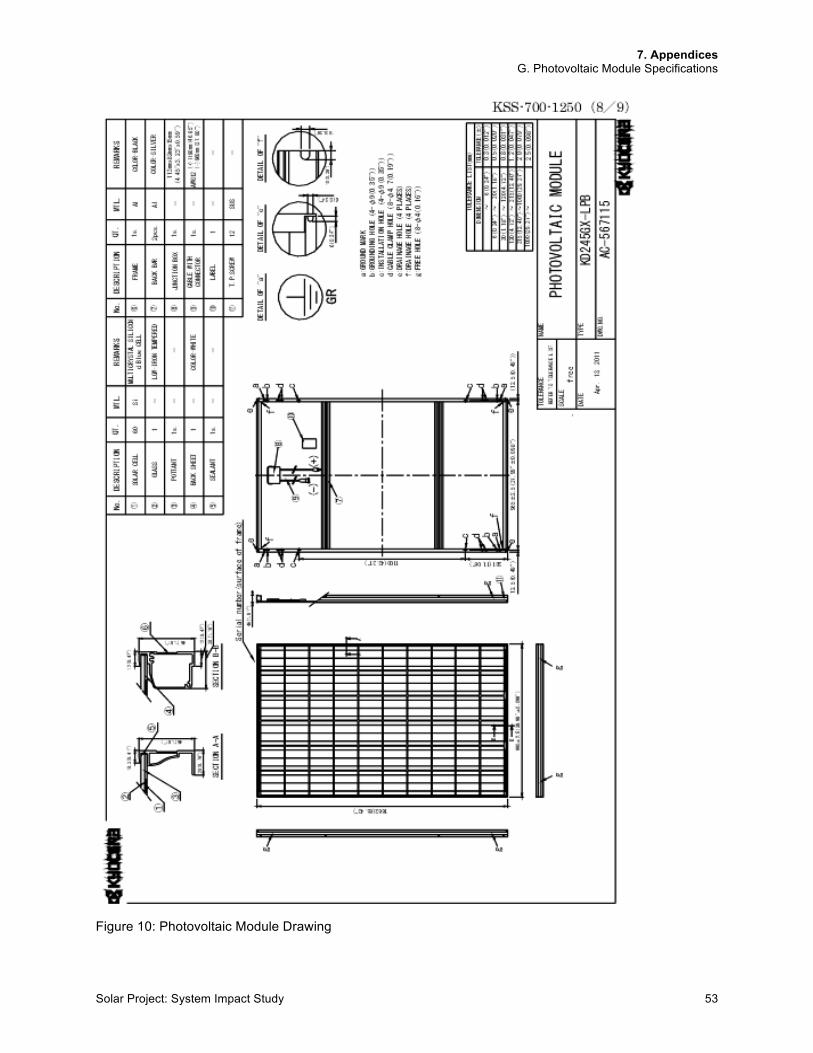
Solar Project: System Impact Study 53
Figure 10: Photovoltaic Module Drawing
7. Appendices G. Photovoltaic Module Specifications
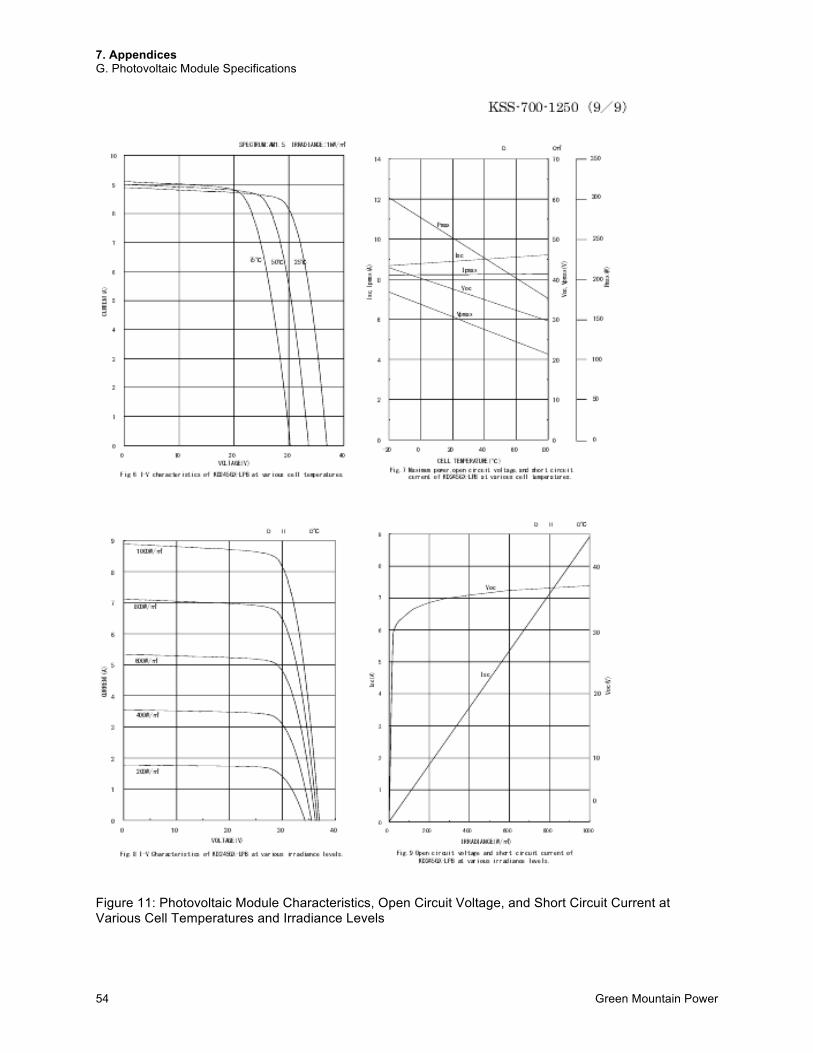
54 Green Mountain Power
Figure 11: Photovoltaic Module Characteristics, Open Circuit Voltage, and Short Circuit Current at Various Cell Temperatures and Irradiance Levels
7. Appendices H. Requirements for Distributed Generators
Solar Project: System Impact Study 55
H. Requirements for Distributed Generators Description of Requirement What Is Required High Side Fault Protection Fuse—the existing site transformer fuse is suitable but it should be capable
of handling the fault current contribution of the DG unit without melting.
Low Side Fault Protection A UL-listed molded-case circuit breaker of suitable current and voltage rating or a power circuit breaker is suitable. A shunt trip externally controlled is required.
Dedicated Step-up Transformer A dedicated transformer is required.
Maintain Effective Grounding (applies to four-wire multigrounded-neutral primary distribution systems only)
The large size of these units poses a serious risk of creating over-voltages via ground faults if an incorrect transformer and grounding are employed. The DG installation should insure [sic] that the transformer is effectively grounded if the distribution system uses a multigrounded-neutral. If effective grounding can’t be achieved, then an alternative primary over-voltage detection scheme with fast trip can be employed, pending utility review.
Voltage & Frequency Control Settings
They should be set to DG point of common coupling voltage within ANSI C84.1 Range B limits. Rotating equipment might require slightly broader frequency and voltage settings to avoid nuisance trips.
Anti-islanding Functions Voltage/frequency functions for induction- and synchronous-type generation units. Voltage/frequency functions for SPC units.
List of Protective Functions Required
Protective functions include under/overvoltage (27, 59), under/overfrequency (81U/O), overcurrent (50, 51, 51G), unbalanced current (46), and reverse sequence voltage (47) and other functions pertinent to the type of power converter used.
Grade of Relays Utility grade relays for the voltage and frequency protection are required. Other functions might require utility grade relays depending on application.
Communications/Remote Tripping
Remote tripping/communications is required for units larger than 250 kW. Tripping can be by means of dial-up telephone connection.
Data Logging Basic data logging of voltage, power, and alarms is required.
Power Factor Correction Induction generators—power factor correction shall be in a manner that provides the highest possible power factor, but still avoids self-excitation (to help prevent islanding). SPCs—power factor should be >0.85 at 10% of rated output and a least 0.95 at full-rated output. Synchronous generators shall be operated at > 0.98 power factor.
Harmonic Injection and Voltage Flicker
Unit should satisfy IEEE 519-1992 harmonica requirements. Unit should not create voltage flicker in excess of guidelines specified in IEEE 519-1992—speed matching with ½% required for induction generators to reduce flicker.
Utility Accessible and Lockable Disconnect Switch
A switch that meets all utility requirements is necessary. A disconnect plug is not allowable.
Reconnect/Auto-restart Function
Required—time to be determined by the utility but would normally be in the range of seconds to minutes following restoration or normal utility voltage.
Metering Metering requirements will be determined by net-metering applicability and intended mode of operation of DG unit.
Studies and Analysis For units in the upper half of this size range (250–500 kW), an updated short circuit analysis and load flow shall be required to evaluate the impact on feeder protection and voltage regulation. The same studies shall be required for smaller units if the planned DG addition is more than 10% of the peak feeder demand as measured at the substation or 20% of the peak feeder demand at the point of interconnection.
Table 5: Requirements for Distributed Generators with a Rating Between 100 kW and 500 kW
7. Appendices I. Three-Phase Arm with Pole
56 Green Mountain Power
I. Three-Phase Arm with Pole
Figure 12: Three-phase Arm with Pole
7. Appendices J. GE Flicker Curve
Solar Project: System Impact Study 57
J. GE Flicker Curve
Figure 13: GE Flicker Limit Curve: Voltage Fluctuations
7. Appendices K. Voltage Analysis Tables
58 Green Mountain Power
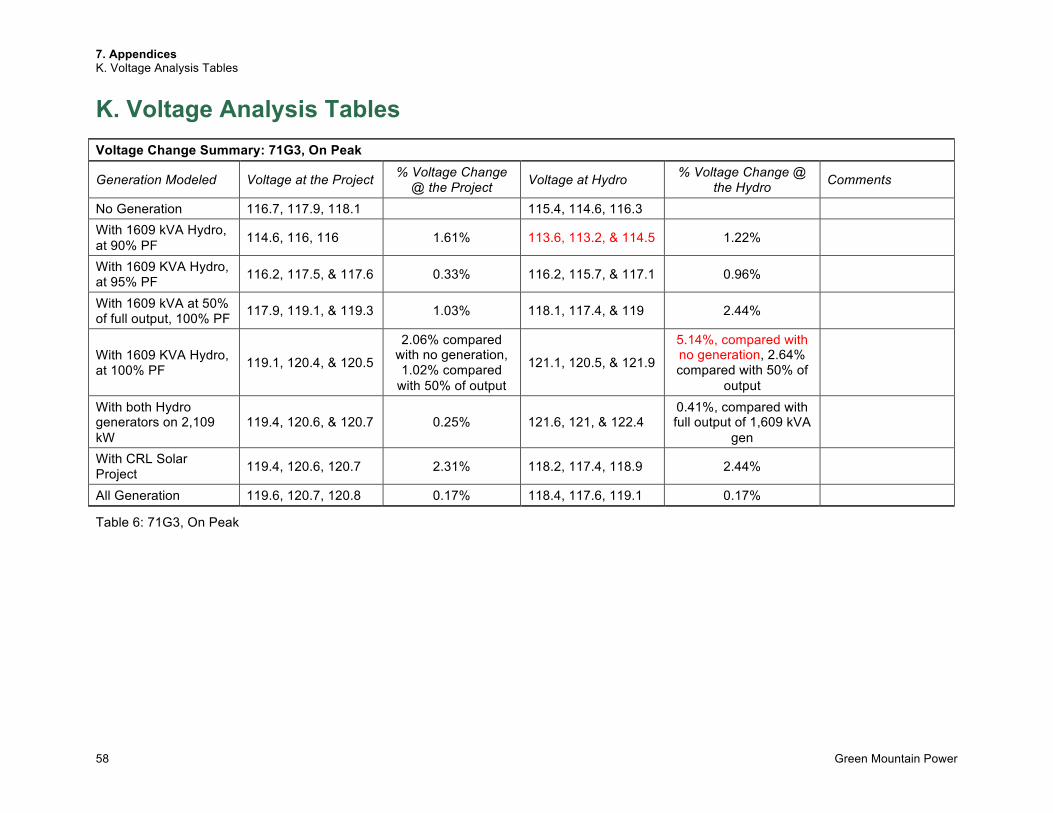
K. Voltage Analysis Tables Voltage Change Summary: 71G3, On Peak
Generation Modeled Voltage at the Project % Voltage Change @ the Project Voltage at Hydro % Voltage Change @
the Hydro Comments
No Generation 116.7, 117.9, 118.1 115.4, 114.6, 116.3 With 1609 kVA Hydro, at 90% PF 114.6, 116, 116 1.61% 113.6, 113.2, & 114.5 1.22%
With 1609 KVA Hydro, at 95% PF 116.2, 117.5, & 117.6 0.33% 116.2, 115.7, & 117.1 0.96%
With 1609 kVA at 50% of full output, 100% PF 117.9, 119.1, & 119.3 1.03% 118.1, 117.4, & 119 2.44%
With 1609 KVA Hydro, at 100% PF 119.1, 120.4, & 120.5
2.06% compared with no generation, 1.02% compared
with 50% of output
121.1, 120.5, & 121.9
5.14%, compared with no generation, 2.64% compared with 50% of
output
With both Hydro generators on 2,109 kW
119.4, 120.6, & 120.7 0.25% 121.6, 121, & 122.4 0.41%, compared with full output of 1,609 kVA
gen
With CRL Solar Project 119.4, 120.6, 120.7 2.31% 118.2, 117.4, 118.9 2.44%
All Generation 119.6, 120.7, 120.8 0.17% 118.4, 117.6, 119.1 0.17%
Table 6: 71G3, On Peak
7. Appendices K. Voltage Analysis Tables
Solar Project: System Impact Study 59
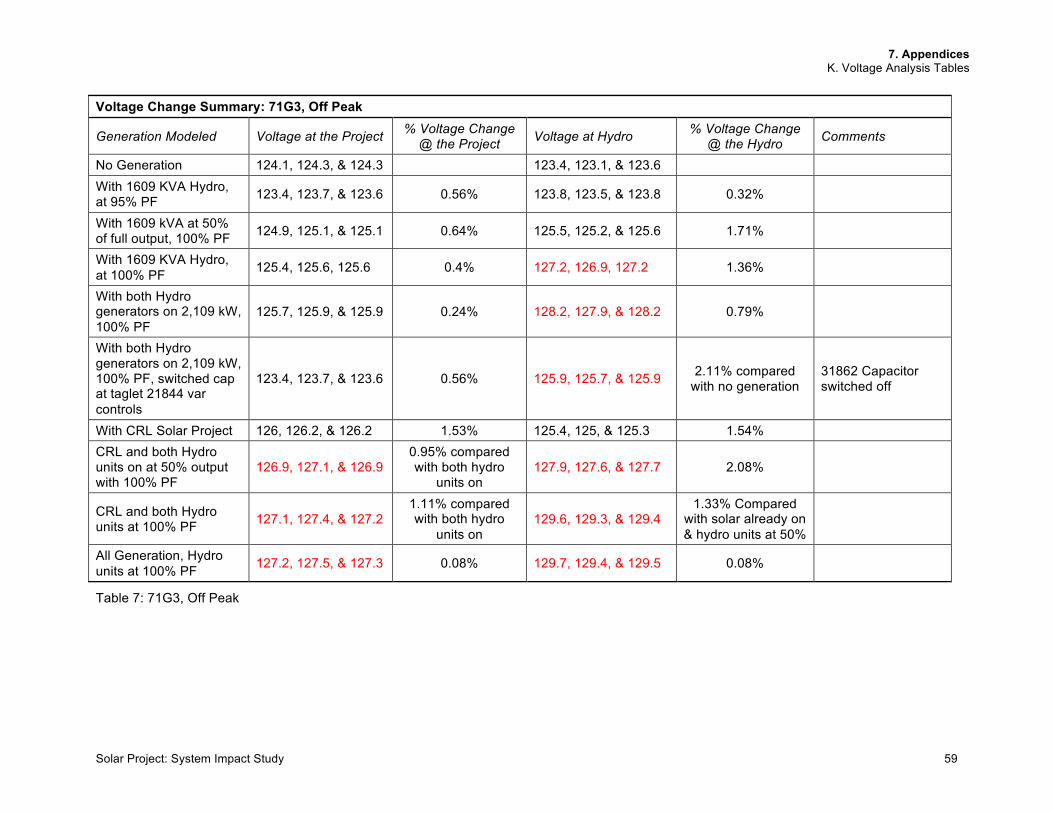
Voltage Change Summary: 71G3, Off Peak
Generation Modeled Voltage at the Project % Voltage Change @ the Project Voltage at Hydro % Voltage Change
@ the Hydro Comments
No Generation 124.1, 124.3, & 124.3 123.4, 123.1, & 123.6 With 1609 KVA Hydro, at 95% PF 123.4, 123.7, & 123.6 0.56% 123.8, 123.5, & 123.8 0.32%
With 1609 kVA at 50% of full output, 100% PF 124.9, 125.1, & 125.1 0.64% 125.5, 125.2, & 125.6 1.71%
With 1609 KVA Hydro, at 100% PF 125.4, 125.6, 125.6 0.4% 127.2, 126.9, 127.2 1.36%
With both Hydro generators on 2,109 kW, 100% PF
125.7, 125.9, & 125.9 0.24% 128.2, 127.9, & 128.2 0.79%
With both Hydro generators on 2,109 kW, 100% PF, switched cap at taglet 21844 var controls
123.4, 123.7, & 123.6 0.56% 125.9, 125.7, & 125.9 2.11% compared with no generation
31862 Capacitor switched off
With CRL Solar Project 126, 126.2, & 126.2 1.53% 125.4, 125, & 125.3 1.54% CRL and both Hydro units on at 50% output with 100% PF
126.9, 127.1, & 126.9 0.95% compared with both hydro
units on 127.9, 127.6, & 127.7 2.08%
CRL and both Hydro units at 100% PF 127.1, 127.4, & 127.2
1.11% compared with both hydro
units on 129.6, 129.3, & 129.4
1.33% Compared with solar already on & hydro units at 50%
All Generation, Hydro units at 100% PF 127.2, 127.5, & 127.3 0.08% 129.7, 129.4, & 129.5 0.08%
Table 7: 71G3, Off Peak
7. Appendices K. Voltage Analysis Tables
60 Green Mountain Power
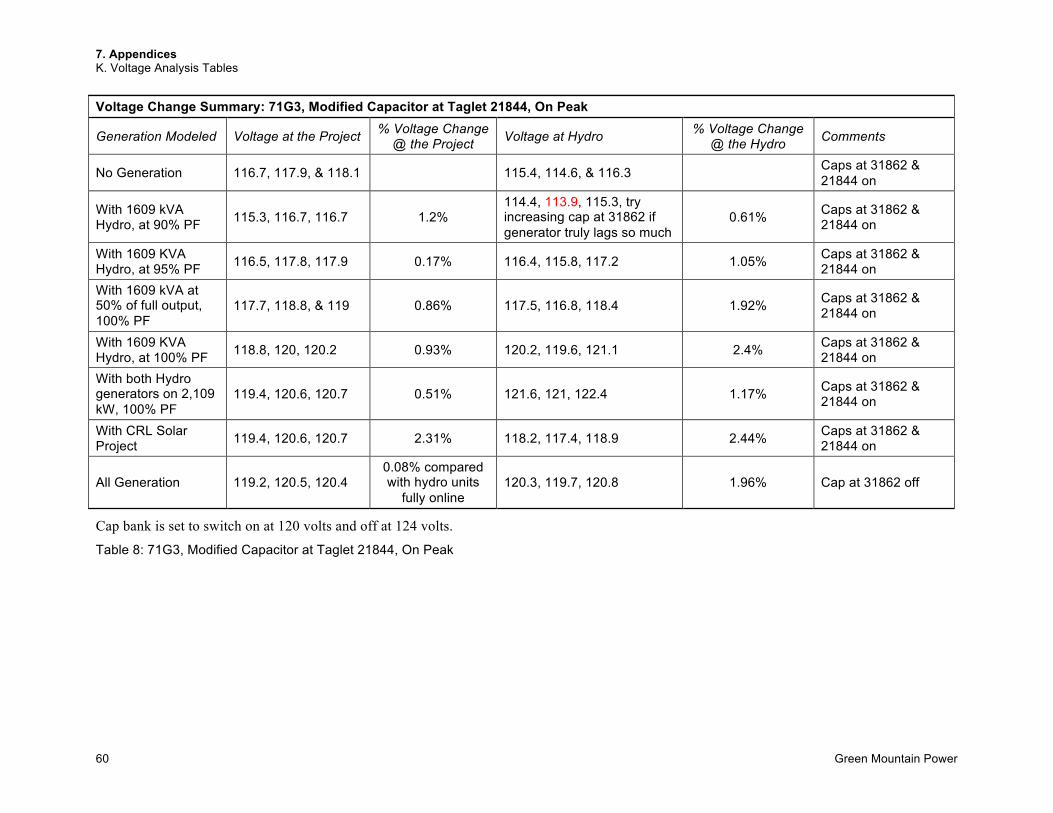
Voltage Change Summary: 71G3, Modified Capacitor at Taglet 21844, On Peak
Generation Modeled Voltage at the Project % Voltage Change @ the Project Voltage at Hydro % Voltage Change
@ the Hydro Comments
No Generation 116.7, 117.9, & 118.1 115.4, 114.6, & 116.3 Caps at 31862 & 21844 on
With 1609 kVA Hydro, at 90% PF 115.3, 116.7, 116.7 1.2%
114.4, 113.9, 115.3, try increasing cap at 31862 if generator truly lags so much
0.61% Caps at 31862 & 21844 on
With 1609 KVA Hydro, at 95% PF 116.5, 117.8, 117.9 0.17% 116.4, 115.8, 117.2 1.05% Caps at 31862 &
21844 on With 1609 kVA at 50% of full output, 100% PF
117.7, 118.8, & 119 0.86% 117.5, 116.8, 118.4 1.92% Caps at 31862 & 21844 on
With 1609 KVA Hydro, at 100% PF 118.8, 120, 120.2 0.93% 120.2, 119.6, 121.1 2.4% Caps at 31862 &
21844 on With both Hydro generators on 2,109 kW, 100% PF
119.4, 120.6, 120.7 0.51% 121.6, 121, 122.4 1.17% Caps at 31862 & 21844 on
With CRL Solar Project 119.4, 120.6, 120.7 2.31% 118.2, 117.4, 118.9 2.44% Caps at 31862 &
21844 on
All Generation 119.2, 120.5, 120.4 0.08% compared with hydro units
fully online 120.3, 119.7, 120.8 1.96% Cap at 31862 off
Cap bank is set to switch on at 120 volts and off at 124 volts.
Table 8: 71G3, Modified Capacitor at Taglet 21844, On Peak
7. Appendices K. Voltage Analysis Tables
Solar Project: System Impact Study 61
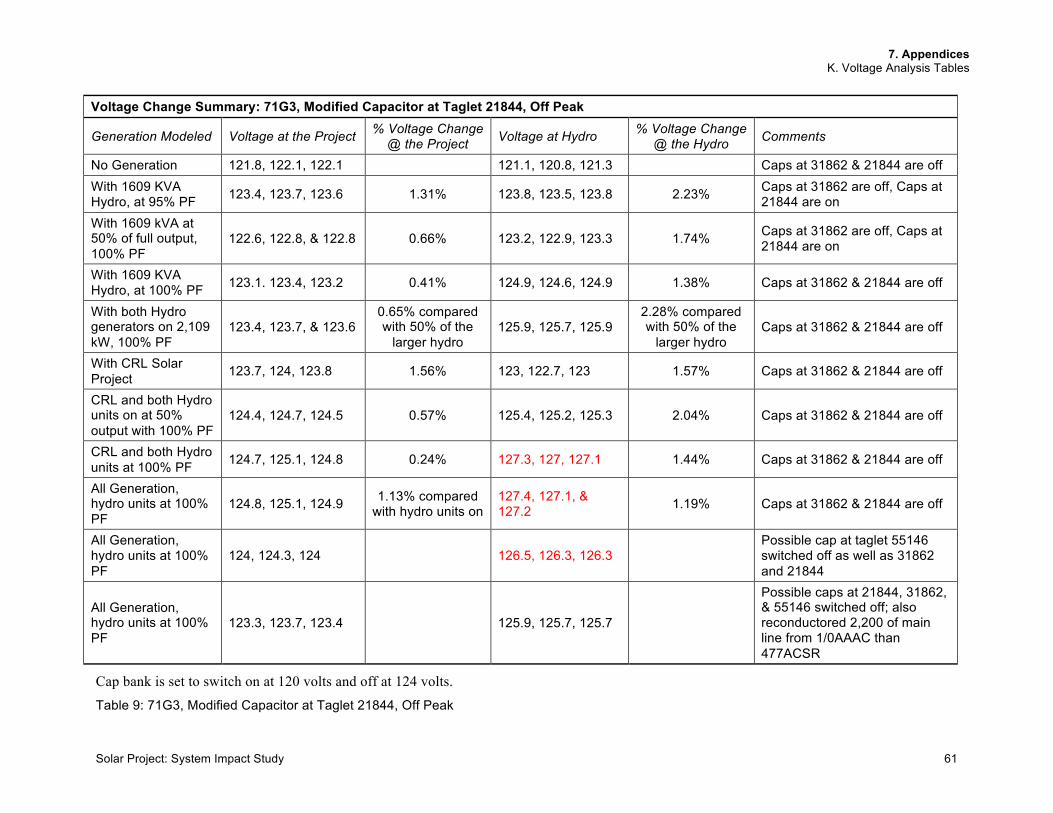
Voltage Change Summary: 71G3, Modified Capacitor at Taglet 21844, Off Peak
Generation Modeled Voltage at the Project % Voltage Change @ the Project Voltage at Hydro % Voltage Change
@ the Hydro Comments
No Generation 121.8, 122.1, 122.1 121.1, 120.8, 121.3 Caps at 31862 & 21844 are off With 1609 KVA Hydro, at 95% PF 123.4, 123.7, 123.6 1.31% 123.8, 123.5, 123.8 2.23% Caps at 31862 are off, Caps at
21844 are on With 1609 kVA at 50% of full output, 100% PF
122.6, 122.8, & 122.8 0.66% 123.2, 122.9, 123.3 1.74% Caps at 31862 are off, Caps at 21844 are on
With 1609 KVA Hydro, at 100% PF 123.1. 123.4, 123.2 0.41% 124.9, 124.6, 124.9 1.38% Caps at 31862 & 21844 are off
With both Hydro generators on 2,109 kW, 100% PF
123.4, 123.7, & 123.6 0.65% compared with 50% of the
larger hydro 125.9, 125.7, 125.9
2.28% compared with 50% of the
larger hydro Caps at 31862 & 21844 are off
With CRL Solar Project 123.7, 124, 123.8 1.56% 123, 122.7, 123 1.57% Caps at 31862 & 21844 are off
CRL and both Hydro units on at 50% output with 100% PF
124.4, 124.7, 124.5 0.57% 125.4, 125.2, 125.3 2.04% Caps at 31862 & 21844 are off
CRL and both Hydro units at 100% PF 124.7, 125.1, 124.8 0.24% 127.3, 127, 127.1 1.44% Caps at 31862 & 21844 are off
All Generation, hydro units at 100% PF
124.8, 125.1, 124.9 1.13% compared with hydro units on
127.4, 127.1, & 127.2 1.19% Caps at 31862 & 21844 are off
All Generation, hydro units at 100% PF
124, 124.3, 124 126.5, 126.3, 126.3 Possible cap at taglet 55146 switched off as well as 31862 and 21844
All Generation, hydro units at 100% PF
123.3, 123.7, 123.4 125.9, 125.7, 125.7
Possible caps at 21844, 31862, & 55146 switched off; also reconductored 2,200 of main line from 1/0AAAC than 477ACSR
Cap bank is set to switch on at 120 volts and off at 124 volts.
Table 9: 71G3, Modified Capacitor at Taglet 21844, Off Peak
7. Appendices K. Voltage Analysis Tables
62 Green Mountain Power
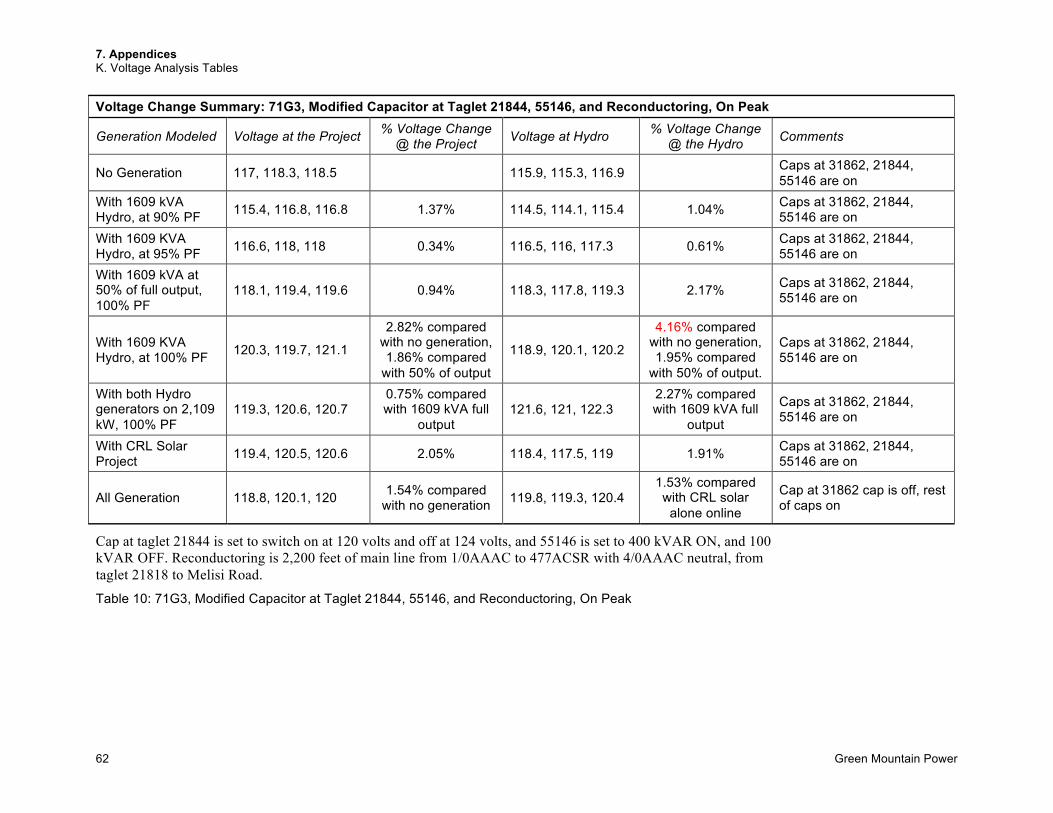
Voltage Change Summary: 71G3, Modified Capacitor at Taglet 21844, 55146, and Reconductoring, On Peak
Generation Modeled Voltage at the Project % Voltage Change @ the Project Voltage at Hydro % Voltage Change
@ the Hydro Comments
No Generation 117, 118.3, 118.5 115.9, 115.3, 116.9 Caps at 31862, 21844, 55146 are on
With 1609 kVA Hydro, at 90% PF 115.4, 116.8, 116.8 1.37% 114.5, 114.1, 115.4 1.04% Caps at 31862, 21844,
55146 are on With 1609 KVA Hydro, at 95% PF 116.6, 118, 118 0.34% 116.5, 116, 117.3 0.61% Caps at 31862, 21844,
55146 are on With 1609 kVA at 50% of full output, 100% PF
118.1, 119.4, 119.6 0.94% 118.3, 117.8, 119.3 2.17% Caps at 31862, 21844, 55146 are on
With 1609 KVA Hydro, at 100% PF 120.3, 119.7, 121.1
2.82% compared with no generation, 1.86% compared
with 50% of output
118.9, 120.1, 120.2
4.16% compared with no generation, 1.95% compared
with 50% of output.
Caps at 31862, 21844, 55146 are on
With both Hydro generators on 2,109 kW, 100% PF
119.3, 120.6, 120.7 0.75% compared with 1609 kVA full
output 121.6, 121, 122.3
2.27% compared with 1609 kVA full
output
Caps at 31862, 21844, 55146 are on
With CRL Solar Project 119.4, 120.5, 120.6 2.05% 118.4, 117.5, 119 1.91% Caps at 31862, 21844,
55146 are on
All Generation 118.8, 120.1, 120 1.54% compared with no generation 119.8, 119.3, 120.4
1.53% compared with CRL solar
alone online
Cap at 31862 cap is off, rest of caps on
Cap at taglet 21844 is set to switch on at 120 volts and off at 124 volts, and 55146 is set to 400 kVAR ON, and 100 kVAR OFF. Reconductoring is 2,200 feet of main line from 1/0AAAC to 477ACSR with 4/0AAAC neutral, from taglet 21818 to Melisi Road.
Table 10: 71G3, Modified Capacitor at Taglet 21844, 55146, and Reconductoring, On Peak
7. Appendices K. Voltage Analysis Tables
Solar Project: System Impact Study 63
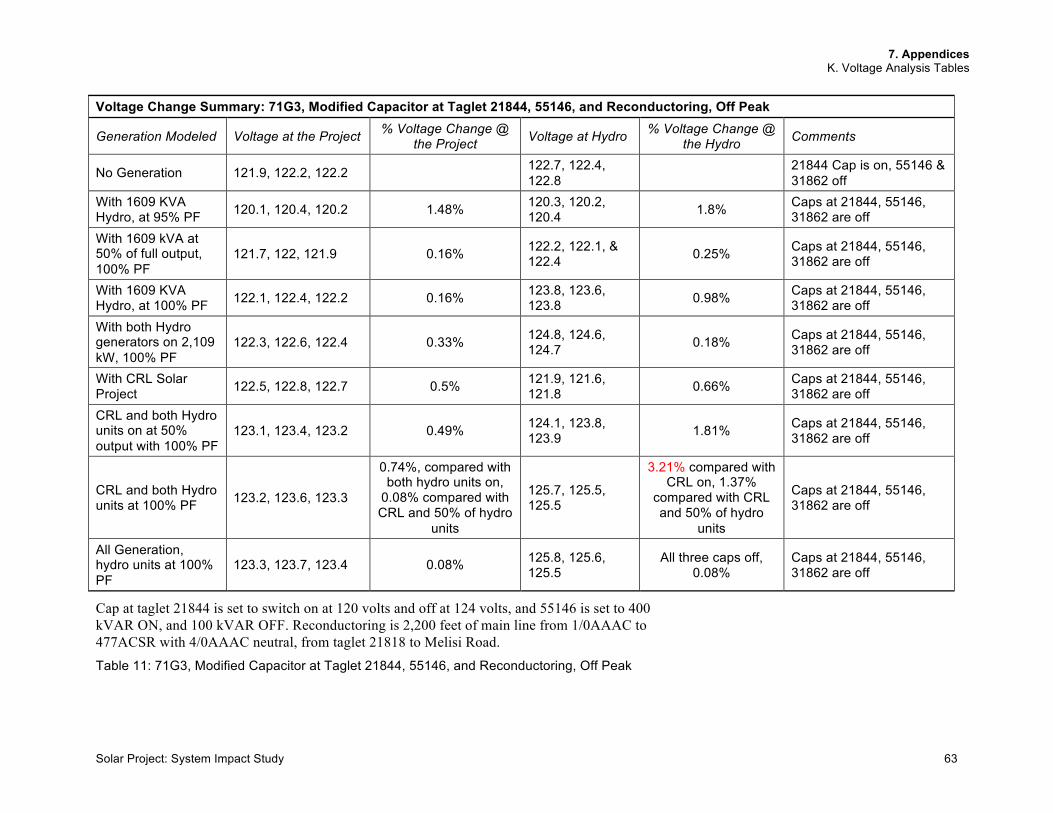
Voltage Change Summary: 71G3, Modified Capacitor at Taglet 21844, 55146, and Reconductoring, Off Peak
Generation Modeled Voltage at the Project % Voltage Change @ the Project Voltage at Hydro % Voltage Change @
the Hydro Comments
No Generation 121.9, 122.2, 122.2 122.7, 122.4, 122.8 21844 Cap is on, 55146 &
31862 off With 1609 KVA Hydro, at 95% PF 120.1, 120.4, 120.2 1.48% 120.3, 120.2,
120.4 1.8% Caps at 21844, 55146, 31862 are off
With 1609 kVA at 50% of full output, 100% PF
121.7, 122, 121.9 0.16% 122.2, 122.1, & 122.4 0.25% Caps at 21844, 55146,
31862 are off
With 1609 KVA Hydro, at 100% PF 122.1, 122.4, 122.2 0.16% 123.8, 123.6,
123.8 0.98% Caps at 21844, 55146, 31862 are off
With both Hydro generators on 2,109 kW, 100% PF
122.3, 122.6, 122.4 0.33% 124.8, 124.6, 124.7 0.18% Caps at 21844, 55146,
31862 are off
With CRL Solar Project 122.5, 122.8, 122.7 0.5% 121.9, 121.6,
121.8 0.66% Caps at 21844, 55146, 31862 are off
CRL and both Hydro units on at 50% output with 100% PF
123.1, 123.4, 123.2 0.49% 124.1, 123.8, 123.9 1.81% Caps at 21844, 55146,
31862 are off
CRL and both Hydro units at 100% PF 123.2, 123.6, 123.3
0.74%, compared with both hydro units on,
0.08% compared with CRL and 50% of hydro
units
125.7, 125.5, 125.5
3.21% compared with CRL on, 1.37%
compared with CRL and 50% of hydro
units
Caps at 21844, 55146, 31862 are off
All Generation, hydro units at 100% PF
123.3, 123.7, 123.4 0.08% 125.8, 125.6, 125.5
All three caps off, 0.08%
Caps at 21844, 55146, 31862 are off
Cap at taglet 21844 is set to switch on at 120 volts and off at 124 volts, and 55146 is set to 400 kVAR ON, and 100 kVAR OFF. Reconductoring is 2,200 feet of main line from 1/0AAAC to 477ACSR with 4/0AAAC neutral, from taglet 21818 to Melisi Road. Table 11: 71G3, Modified Capacitor at Taglet 21844, 55146, and Reconductoring, Off Peak
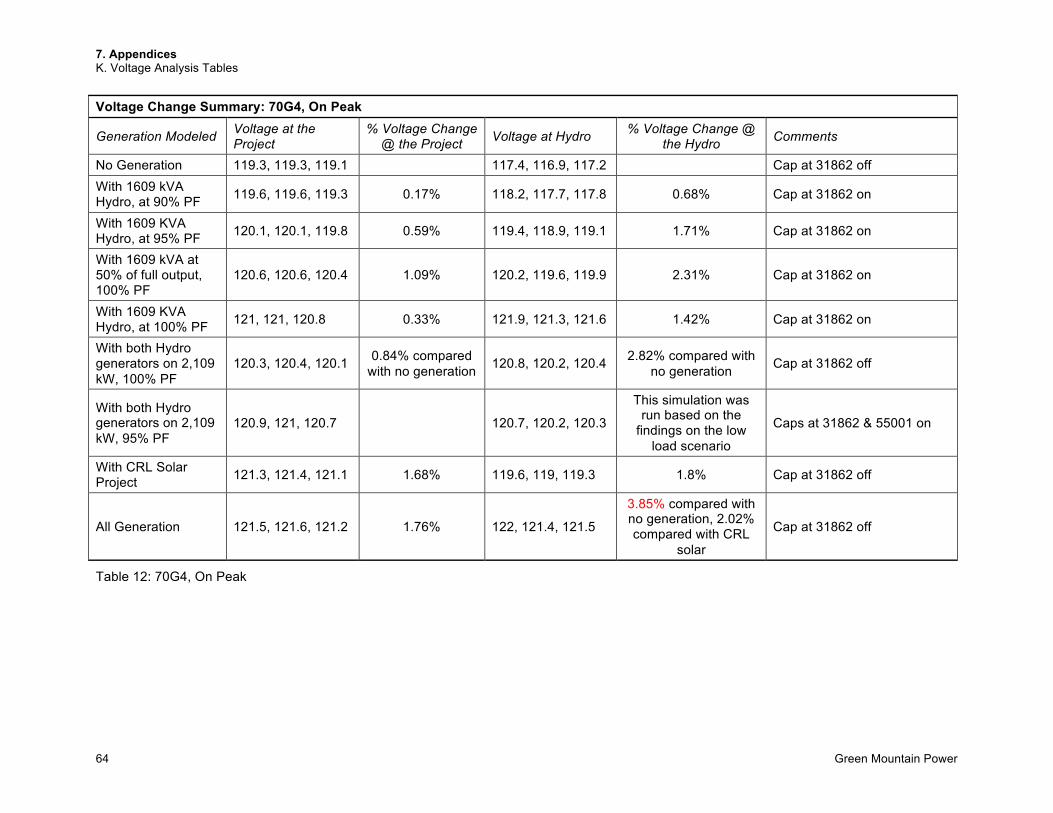
7. Appendices K. Voltage Analysis Tables
64 Green Mountain Power
Voltage Change Summary: 70G4, On Peak
Generation Modeled Voltage at the Project
% Voltage Change @ the Project Voltage at Hydro % Voltage Change @
the Hydro Comments
No Generation 119.3, 119.3, 119.1 117.4, 116.9, 117.2 Cap at 31862 off With 1609 kVA Hydro, at 90% PF 119.6, 119.6, 119.3 0.17% 118.2, 117.7, 117.8 0.68% Cap at 31862 on
With 1609 KVA Hydro, at 95% PF 120.1, 120.1, 119.8 0.59% 119.4, 118.9, 119.1 1.71% Cap at 31862 on
With 1609 kVA at 50% of full output, 100% PF
120.6, 120.6, 120.4 1.09% 120.2, 119.6, 119.9 2.31% Cap at 31862 on
With 1609 KVA Hydro, at 100% PF 121, 121, 120.8 0.33% 121.9, 121.3, 121.6 1.42% Cap at 31862 on
With both Hydro generators on 2,109 kW, 100% PF
120.3, 120.4, 120.1 0.84% compared with no generation 120.8, 120.2, 120.4 2.82% compared with
no generation Cap at 31862 off
With both Hydro generators on 2,109 kW, 95% PF
120.9, 121, 120.7 120.7, 120.2, 120.3
This simulation was run based on the
findings on the low load scenario
Caps at 31862 & 55001 on
With CRL Solar Project 121.3, 121.4, 121.1 1.68% 119.6, 119, 119.3 1.8% Cap at 31862 off
All Generation 121.5, 121.6, 121.2 1.76% 122, 121.4, 121.5
3.85% compared with no generation, 2.02% compared with CRL
solar
Cap at 31862 off
Table 12: 70G4, On Peak
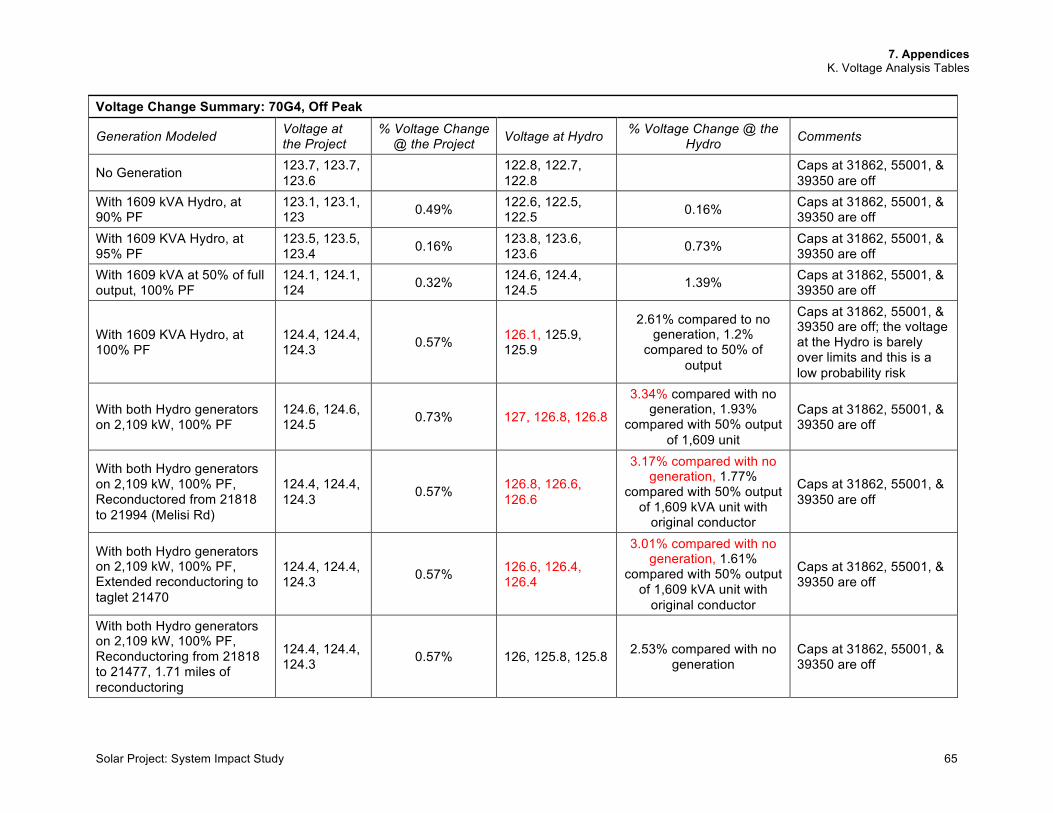
7. Appendices K. Voltage Analysis Tables
Solar Project: System Impact Study 65
Voltage Change Summary: 70G4, Off Peak
Generation Modeled Voltage at the Project
% Voltage Change @ the Project Voltage at Hydro % Voltage Change @ the
Hydro Comments
No Generation 123.7, 123.7, 123.6 122.8, 122.7,
122.8 Caps at 31862, 55001, & 39350 are off
With 1609 kVA Hydro, at 90% PF
123.1, 123.1, 123 0.49% 122.6, 122.5,
122.5 0.16% Caps at 31862, 55001, & 39350 are off
With 1609 KVA Hydro, at 95% PF
123.5, 123.5, 123.4 0.16% 123.8, 123.6,
123.6 0.73% Caps at 31862, 55001, & 39350 are off
With 1609 kVA at 50% of full output, 100% PF
124.1, 124.1, 124 0.32% 124.6, 124.4,
124.5 1.39% Caps at 31862, 55001, & 39350 are off
With 1609 KVA Hydro, at 100% PF
124.4, 124.4, 124.3 0.57% 126.1, 125.9,
125.9
2.61% compared to no generation, 1.2%
compared to 50% of output
Caps at 31862, 55001, & 39350 are off; the voltage at the Hydro is barely over limits and this is a low probability risk
With both Hydro generators on 2,109 kW, 100% PF
124.6, 124.6, 124.5 0.73% 127, 126.8, 126.8
3.34% compared with no generation, 1.93%
compared with 50% output of 1,609 unit
Caps at 31862, 55001, & 39350 are off
With both Hydro generators on 2,109 kW, 100% PF, Reconductored from 21818 to 21994 (Melisi Rd)
124.4, 124.4, 124.3 0.57% 126.8, 126.6,
126.6
3.17% compared with no generation, 1.77%
compared with 50% output of 1,609 kVA unit with
original conductor
Caps at 31862, 55001, & 39350 are off
With both Hydro generators on 2,109 kW, 100% PF, Extended reconductoring to taglet 21470
124.4, 124.4, 124.3 0.57% 126.6, 126.4,
126.4
3.01% compared with no generation, 1.61%
compared with 50% output of 1,609 kVA unit with
original conductor
Caps at 31862, 55001, & 39350 are off
With both Hydro generators on 2,109 kW, 100% PF, Reconductoring from 21818 to 21477, 1.71 miles of reconductoring
124.4, 124.4, 124.3 0.57% 126, 125.8, 125.8 2.53% compared with no
generation Caps at 31862, 55001, & 39350 are off
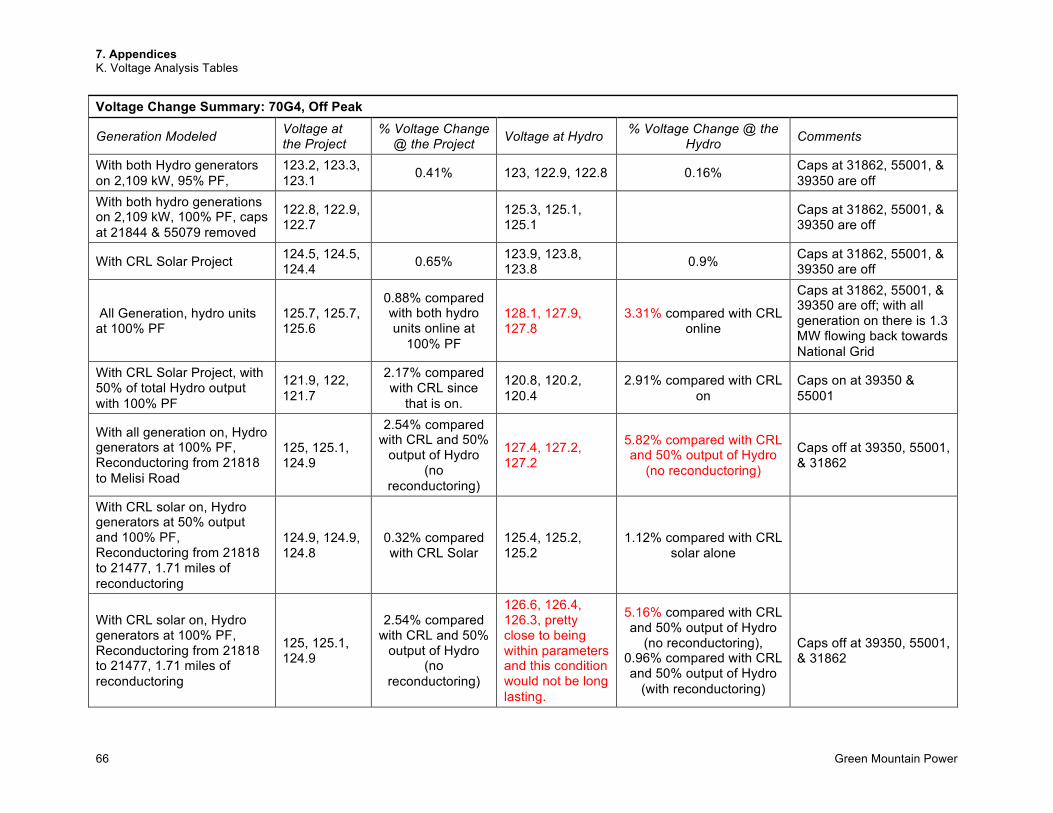
7. Appendices K. Voltage Analysis Tables
66 Green Mountain Power
Voltage Change Summary: 70G4, Off Peak
Generation Modeled Voltage at the Project
% Voltage Change @ the Project Voltage at Hydro % Voltage Change @ the
Hydro Comments
With both Hydro generators on 2,109 kW, 95% PF,
123.2, 123.3, 123.1 0.41% 123, 122.9, 122.8 0.16% Caps at 31862, 55001, &
39350 are off With both hydro generations on 2,109 kW, 100% PF, caps at 21844 & 55079 removed
122.8, 122.9, 122.7 125.3, 125.1,
125.1 Caps at 31862, 55001, & 39350 are off
With CRL Solar Project 124.5, 124.5, 124.4 0.65% 123.9, 123.8,
123.8 0.9% Caps at 31862, 55001, & 39350 are off
All Generation, hydro units at 100% PF
125.7, 125.7, 125.6
0.88% compared with both hydro units online at
100% PF
128.1, 127.9, 127.8
3.31% compared with CRL online
Caps at 31862, 55001, & 39350 are off; with all generation on there is 1.3 MW flowing back towards National Grid
With CRL Solar Project, with 50% of total Hydro output with 100% PF
121.9, 122, 121.7
2.17% compared with CRL since
that is on.
120.8, 120.2, 120.4
2.91% compared with CRL on
Caps on at 39350 & 55001
With all generation on, Hydro generators at 100% PF, Reconductoring from 21818 to Melisi Road
125, 125.1, 124.9
2.54% compared with CRL and 50%
output of Hydro (no
reconductoring)
127.4, 127.2, 127.2
5.82% compared with CRL and 50% output of Hydro
(no reconductoring)
Caps off at 39350, 55001, & 31862
With CRL solar on, Hydro generators at 50% output and 100% PF, Reconductoring from 21818 to 21477, 1.71 miles of reconductoring
124.9, 124.9, 124.8
0.32% compared with CRL Solar
125.4, 125.2, 125.2
1.12% compared with CRL solar alone
With CRL solar on, Hydro generators at 100% PF, Reconductoring from 21818 to 21477, 1.71 miles of reconductoring
125, 125.1, 124.9
2.54% compared with CRL and 50%
output of Hydro (no
reconductoring)
126.6, 126.4, 126.3, pretty close to being within parameters and this condition would not be long lasting.
5.16% compared with CRL and 50% output of Hydro
(no reconductoring), 0.96% compared with CRL and 50% output of Hydro
(with reconductoring)
Caps off at 39350, 55001, & 31862
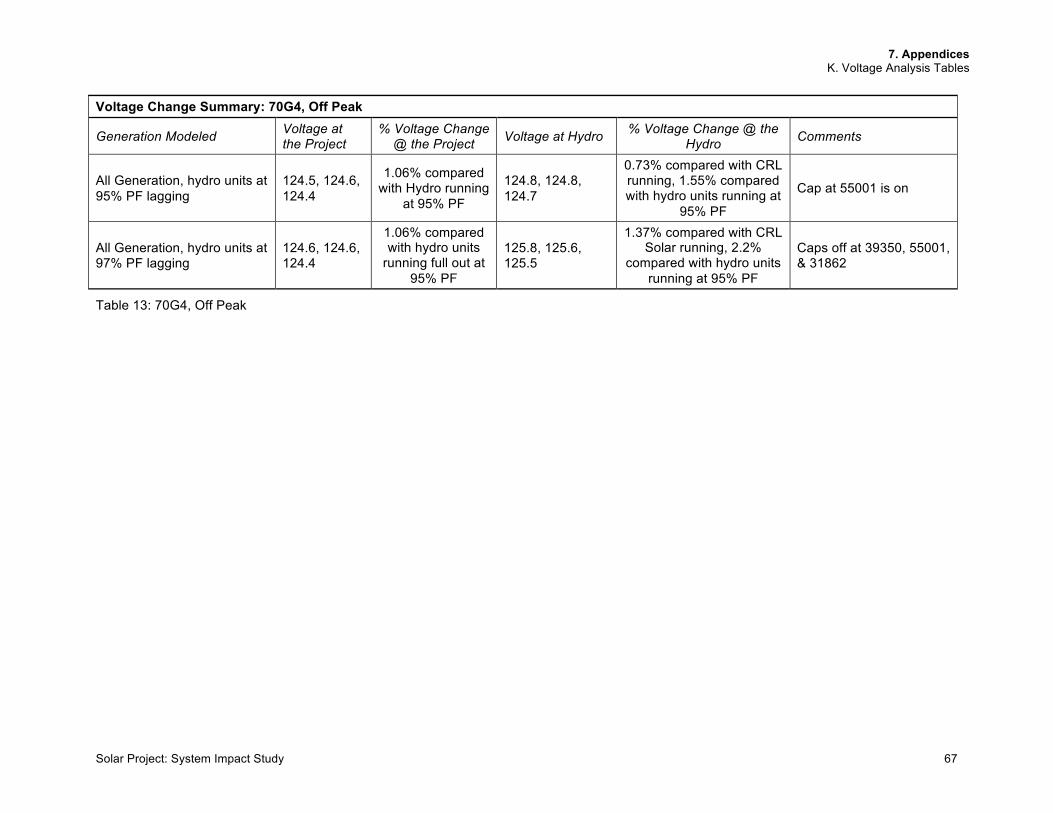
7. Appendices K. Voltage Analysis Tables
Solar Project: System Impact Study 67
Voltage Change Summary: 70G4, Off Peak
Generation Modeled Voltage at the Project
% Voltage Change @ the Project Voltage at Hydro % Voltage Change @ the
Hydro Comments
All Generation, hydro units at 95% PF lagging
124.5, 124.6, 124.4
1.06% compared with Hydro running
at 95% PF
124.8, 124.8, 124.7
0.73% compared with CRL running, 1.55% compared with hydro units running at
95% PF
Cap at 55001 is on
All Generation, hydro units at 97% PF lagging
124.6, 124.6, 124.4
1.06% compared with hydro units
running full out at 95% PF
125.8, 125.6, 125.5
1.37% compared with CRL Solar running, 2.2%
compared with hydro units running at 95% PF
Caps off at 39350, 55001, & 31862
Table 13: 70G4, Off Peak
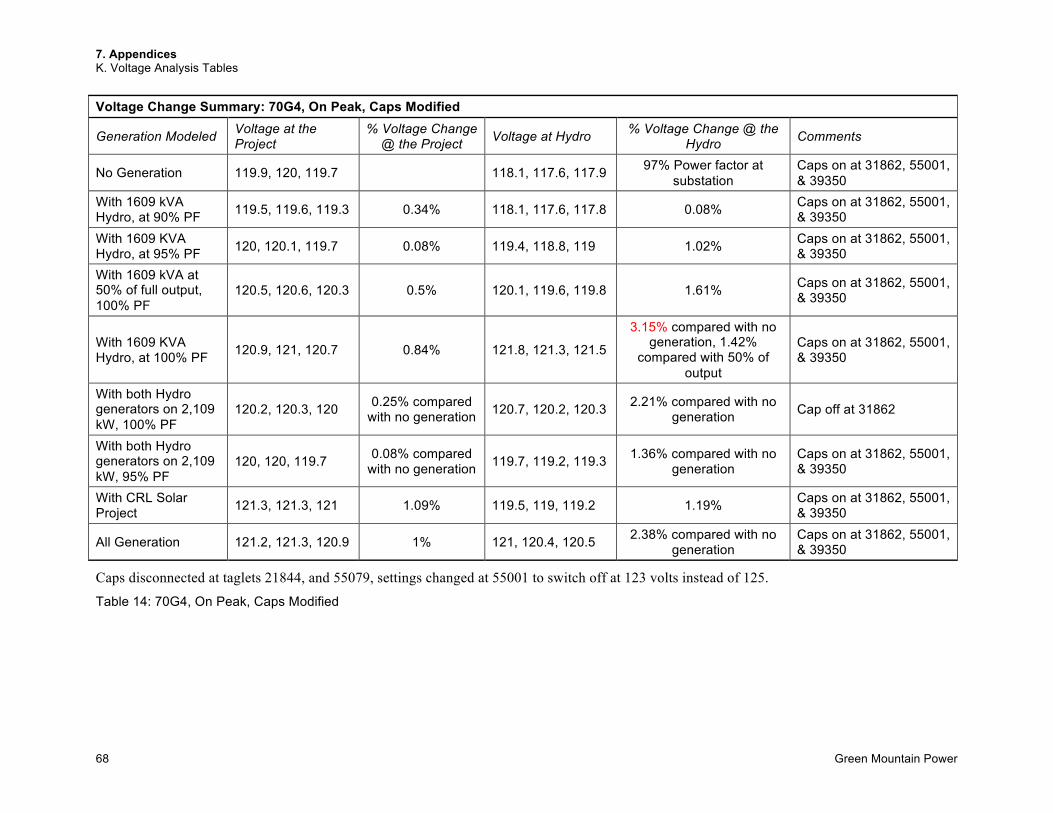
7. Appendices K. Voltage Analysis Tables
68 Green Mountain Power
Voltage Change Summary: 70G4, On Peak, Caps Modified
Generation Modeled Voltage at the Project
% Voltage Change @ the Project Voltage at Hydro % Voltage Change @ the
Hydro Comments
No Generation 119.9, 120, 119.7 118.1, 117.6, 117.9 97% Power factor at substation
Caps on at 31862, 55001, & 39350
With 1609 kVA Hydro, at 90% PF 119.5, 119.6, 119.3 0.34% 118.1, 117.6, 117.8 0.08% Caps on at 31862, 55001,
& 39350 With 1609 KVA Hydro, at 95% PF 120, 120.1, 119.7 0.08% 119.4, 118.8, 119 1.02% Caps on at 31862, 55001,
& 39350 With 1609 kVA at 50% of full output, 100% PF
120.5, 120.6, 120.3 0.5% 120.1, 119.6, 119.8 1.61% Caps on at 31862, 55001, & 39350
With 1609 KVA Hydro, at 100% PF 120.9, 121, 120.7 0.84% 121.8, 121.3, 121.5
3.15% compared with no generation, 1.42%
compared with 50% of output
Caps on at 31862, 55001, & 39350
With both Hydro generators on 2,109 kW, 100% PF
120.2, 120.3, 120 0.25% compared with no generation 120.7, 120.2, 120.3 2.21% compared with no
generation Cap off at 31862
With both Hydro generators on 2,109 kW, 95% PF
120, 120, 119.7 0.08% compared with no generation 119.7, 119.2, 119.3 1.36% compared with no
generation Caps on at 31862, 55001, & 39350
With CRL Solar Project 121.3, 121.3, 121 1.09% 119.5, 119, 119.2 1.19% Caps on at 31862, 55001,
& 39350
All Generation 121.2, 121.3, 120.9 1% 121, 120.4, 120.5 2.38% compared with no generation
Caps on at 31862, 55001, & 39350
Caps disconnected at taglets 21844, and 55079, settings changed at 55001 to switch off at 123 volts instead of 125.
Table 14: 70G4, On Peak, Caps Modified
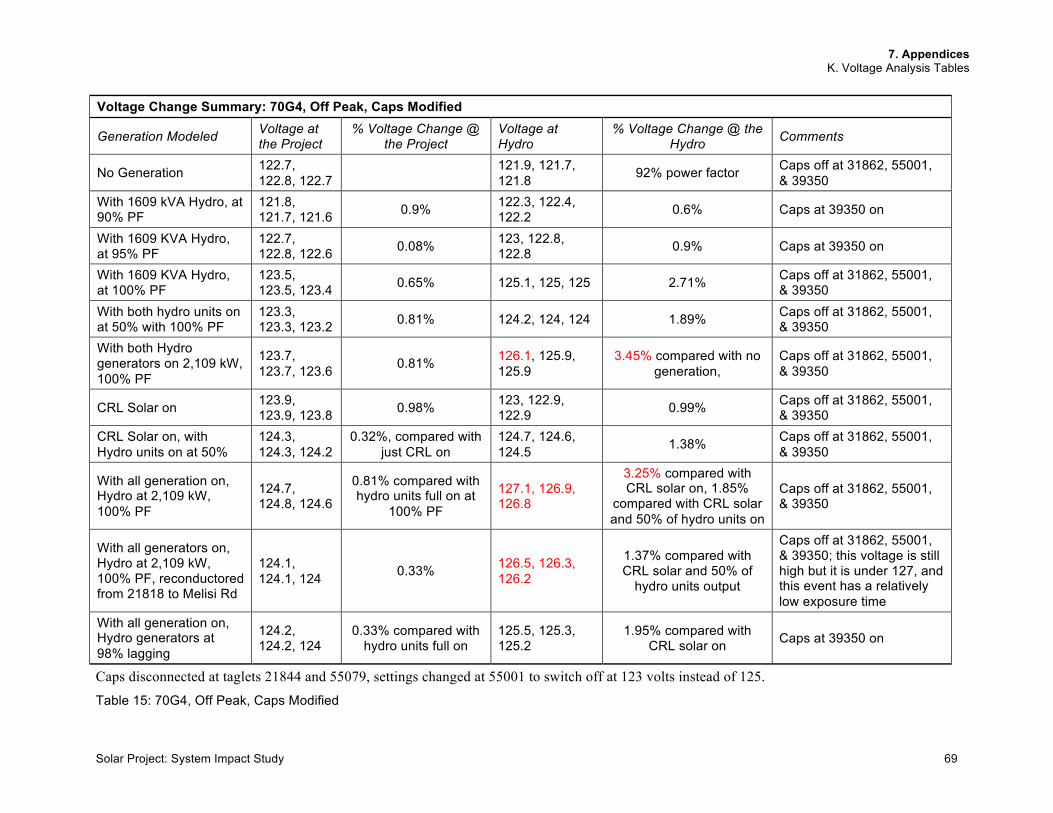
7. Appendices K. Voltage Analysis Tables
Solar Project: System Impact Study 69
Voltage Change Summary: 70G4, Off Peak, Caps Modified
Generation Modeled Voltage at the Project
% Voltage Change @ the Project
Voltage at Hydro
% Voltage Change @ the Hydro Comments
No Generation 122.7, 122.8, 122.7 121.9, 121.7,
121.8 92% power factor Caps off at 31862, 55001, & 39350
With 1609 kVA Hydro, at 90% PF
121.8, 121.7, 121.6 0.9% 122.3, 122.4,
122.2 0.6% Caps at 39350 on
With 1609 KVA Hydro, at 95% PF
122.7, 122.8, 122.6 0.08% 123, 122.8,
122.8 0.9% Caps at 39350 on
With 1609 KVA Hydro, at 100% PF
123.5, 123.5, 123.4 0.65% 125.1, 125, 125 2.71% Caps off at 31862, 55001,
& 39350 With both hydro units on at 50% with 100% PF
123.3, 123.3, 123.2 0.81% 124.2, 124, 124 1.89% Caps off at 31862, 55001,
& 39350 With both Hydro generators on 2,109 kW, 100% PF
123.7, 123.7, 123.6 0.81% 126.1, 125.9,
125.9 3.45% compared with no
generation, Caps off at 31862, 55001, & 39350
CRL Solar on 123.9, 123.9, 123.8 0.98% 123, 122.9,
122.9 0.99% Caps off at 31862, 55001, & 39350
CRL Solar on, with Hydro units on at 50%
124.3, 124.3, 124.2
0.32%, compared with just CRL on
124.7, 124.6, 124.5 1.38% Caps off at 31862, 55001,
& 39350
With all generation on, Hydro at 2,109 kW, 100% PF
124.7, 124.8, 124.6
0.81% compared with hydro units full on at
100% PF
127.1, 126.9, 126.8
3.25% compared with CRL solar on, 1.85%
compared with CRL solar and 50% of hydro units on
Caps off at 31862, 55001, & 39350
With all generators on, Hydro at 2,109 kW, 100% PF, reconductored from 21818 to Melisi Rd
124.1, 124.1, 124 0.33% 126.5, 126.3,
126.2
1.37% compared with CRL solar and 50% of
hydro units output
Caps off at 31862, 55001, & 39350; this voltage is still high but it is under 127, and this event has a relatively low exposure time
With all generation on, Hydro generators at 98% lagging
124.2, 124.2, 124
0.33% compared with hydro units full on
125.5, 125.3, 125.2
1.95% compared with CRL solar on Caps at 39350 on
Caps disconnected at taglets 21844 and 55079, settings changed at 55001 to switch off at 123 volts instead of 125.
Table 15: 70G4, Off Peak, Caps Modified
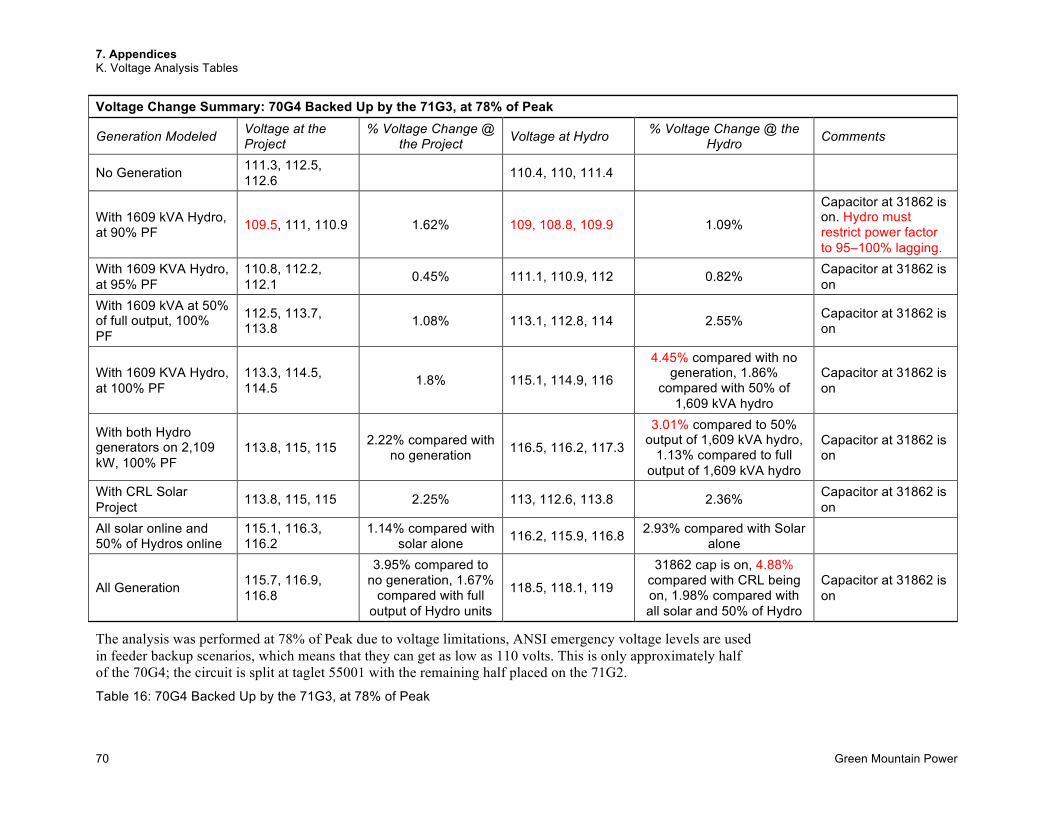
7. Appendices K. Voltage Analysis Tables
70 Green Mountain Power
Voltage Change Summary: 70G4 Backed Up by the 71G3, at 78% of Peak
Generation Modeled Voltage at the Project
% Voltage Change @ the Project Voltage at Hydro % Voltage Change @ the
Hydro Comments
No Generation 111.3, 112.5, 112.6 110.4, 110, 111.4
With 1609 kVA Hydro, at 90% PF 109.5, 111, 110.9 1.62% 109, 108.8, 109.9 1.09%
Capacitor at 31862 is on. Hydro must restrict power factor to 95–100% lagging.
With 1609 KVA Hydro, at 95% PF
110.8, 112.2, 112.1 0.45% 111.1, 110.9, 112 0.82% Capacitor at 31862 is
on With 1609 kVA at 50% of full output, 100% PF
112.5, 113.7, 113.8 1.08% 113.1, 112.8, 114 2.55% Capacitor at 31862 is
on
With 1609 KVA Hydro, at 100% PF
113.3, 114.5, 114.5 1.8% 115.1, 114.9, 116
4.45% compared with no generation, 1.86%
compared with 50% of 1,609 kVA hydro
Capacitor at 31862 is on
With both Hydro generators on 2,109 kW, 100% PF
113.8, 115, 115 2.22% compared with no generation 116.5, 116.2, 117.3
3.01% compared to 50% output of 1,609 kVA hydro,
1.13% compared to full output of 1,609 kVA hydro
Capacitor at 31862 is on
With CRL Solar Project 113.8, 115, 115 2.25% 113, 112.6, 113.8 2.36% Capacitor at 31862 is
on All solar online and 50% of Hydros online
115.1, 116.3, 116.2
1.14% compared with solar alone 116.2, 115.9, 116.8 2.93% compared with Solar
alone
All Generation 115.7, 116.9, 116.8
3.95% compared to no generation, 1.67%
compared with full output of Hydro units
118.5, 118.1, 119
31862 cap is on, 4.88% compared with CRL being on, 1.98% compared with all solar and 50% of Hydro
Capacitor at 31862 is on
The analysis was performed at 78% of Peak due to voltage limitations, ANSI emergency voltage levels are used in feeder backup scenarios, which means that they can get as low as 110 volts. This is only approximately half of the 70G4; the circuit is split at taglet 55001 with the remaining half placed on the 71G2.
Table 16: 70G4 Backed Up by the 71G3, at 78% of Peak
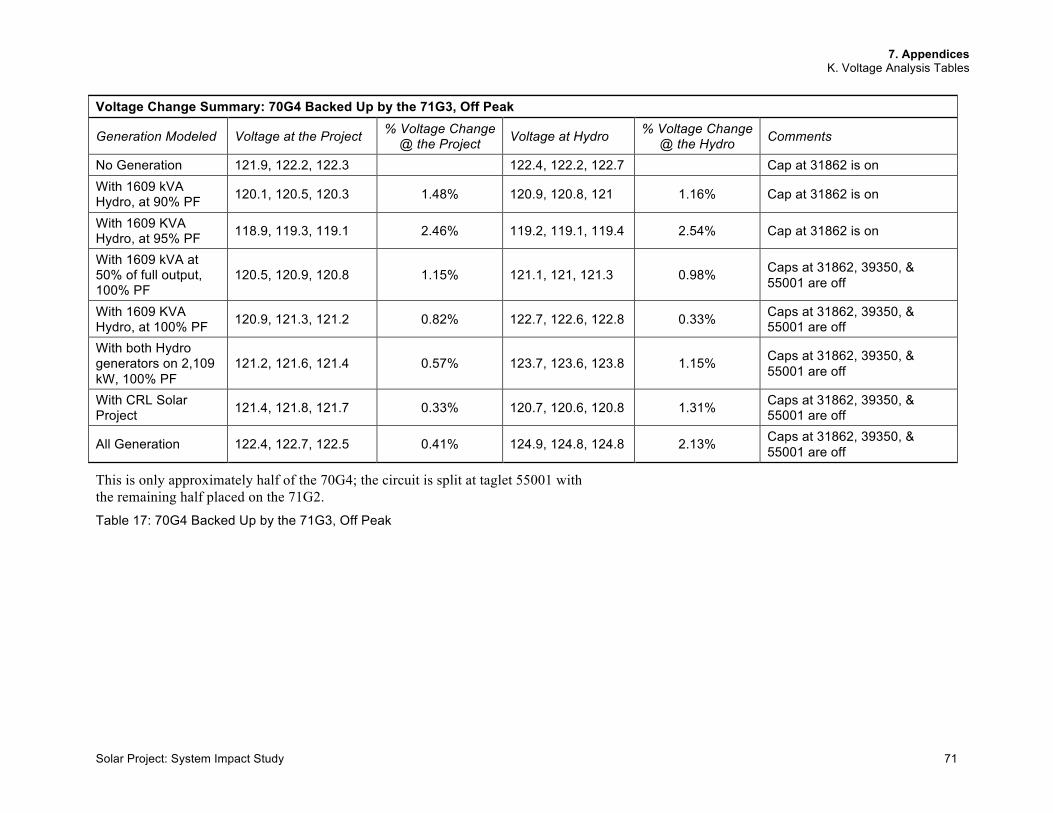
7. Appendices K. Voltage Analysis Tables
Solar Project: System Impact Study 71
Voltage Change Summary: 70G4 Backed Up by the 71G3, Off Peak
Generation Modeled Voltage at the Project % Voltage Change @ the Project Voltage at Hydro % Voltage Change
@ the Hydro Comments
No Generation 121.9, 122.2, 122.3 122.4, 122.2, 122.7 Cap at 31862 is on With 1609 kVA Hydro, at 90% PF 120.1, 120.5, 120.3 1.48% 120.9, 120.8, 121 1.16% Cap at 31862 is on
With 1609 KVA Hydro, at 95% PF 118.9, 119.3, 119.1 2.46% 119.2, 119.1, 119.4 2.54% Cap at 31862 is on
With 1609 kVA at 50% of full output, 100% PF
120.5, 120.9, 120.8 1.15% 121.1, 121, 121.3 0.98% Caps at 31862, 39350, & 55001 are off
With 1609 KVA Hydro, at 100% PF 120.9, 121.3, 121.2 0.82% 122.7, 122.6, 122.8 0.33% Caps at 31862, 39350, &
55001 are off With both Hydro generators on 2,109 kW, 100% PF
121.2, 121.6, 121.4 0.57% 123.7, 123.6, 123.8 1.15% Caps at 31862, 39350, & 55001 are off
With CRL Solar Project 121.4, 121.8, 121.7 0.33% 120.7, 120.6, 120.8 1.31% Caps at 31862, 39350, &
55001 are off
All Generation 122.4, 122.7, 122.5 0.41% 124.9, 124.8, 124.8 2.13% Caps at 31862, 39350, & 55001 are off
This is only approximately half of the 70G4; the circuit is split at taglet 55001 with the remaining half placed on the 71G2. Table 17: 70G4 Backed Up by the 71G3, Off Peak
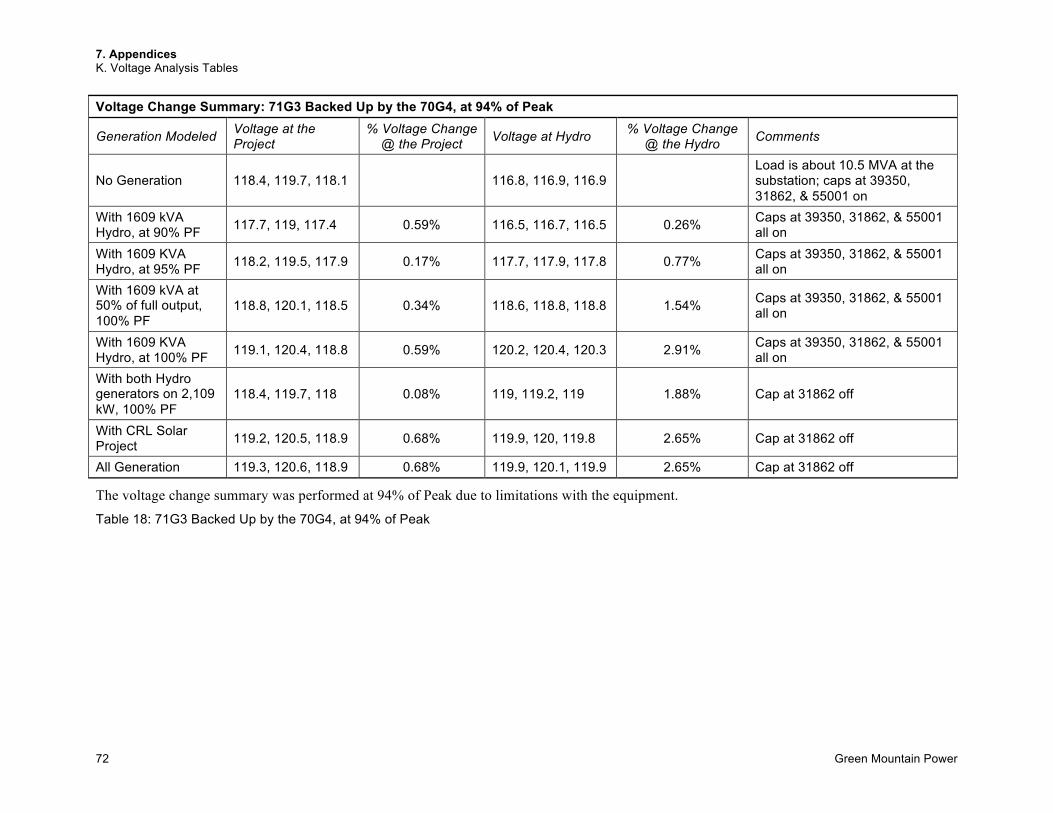
7. Appendices K. Voltage Analysis Tables
72 Green Mountain Power
Voltage Change Summary: 71G3 Backed Up by the 70G4, at 94% of Peak
Generation Modeled Voltage at the Project
% Voltage Change @ the Project Voltage at Hydro % Voltage Change
@ the Hydro Comments
No Generation 118.4, 119.7, 118.1 116.8, 116.9, 116.9 Load is about 10.5 MVA at the substation; caps at 39350, 31862, & 55001 on
With 1609 kVA Hydro, at 90% PF 117.7, 119, 117.4 0.59% 116.5, 116.7, 116.5 0.26% Caps at 39350, 31862, & 55001
all on With 1609 KVA Hydro, at 95% PF 118.2, 119.5, 117.9 0.17% 117.7, 117.9, 117.8 0.77% Caps at 39350, 31862, & 55001
all on With 1609 kVA at 50% of full output, 100% PF
118.8, 120.1, 118.5 0.34% 118.6, 118.8, 118.8 1.54% Caps at 39350, 31862, & 55001 all on
With 1609 KVA Hydro, at 100% PF 119.1, 120.4, 118.8 0.59% 120.2, 120.4, 120.3 2.91% Caps at 39350, 31862, & 55001
all on With both Hydro generators on 2,109 kW, 100% PF
118.4, 119.7, 118 0.08% 119, 119.2, 119 1.88% Cap at 31862 off
With CRL Solar Project 119.2, 120.5, 118.9 0.68% 119.9, 120, 119.8 2.65% Cap at 31862 off
All Generation 119.3, 120.6, 118.9 0.68% 119.9, 120.1, 119.9 2.65% Cap at 31862 off
The voltage change summary was performed at 94% of Peak due to limitations with the equipment.
Table 18: 71G3 Backed Up by the 70G4, at 94% of Peak
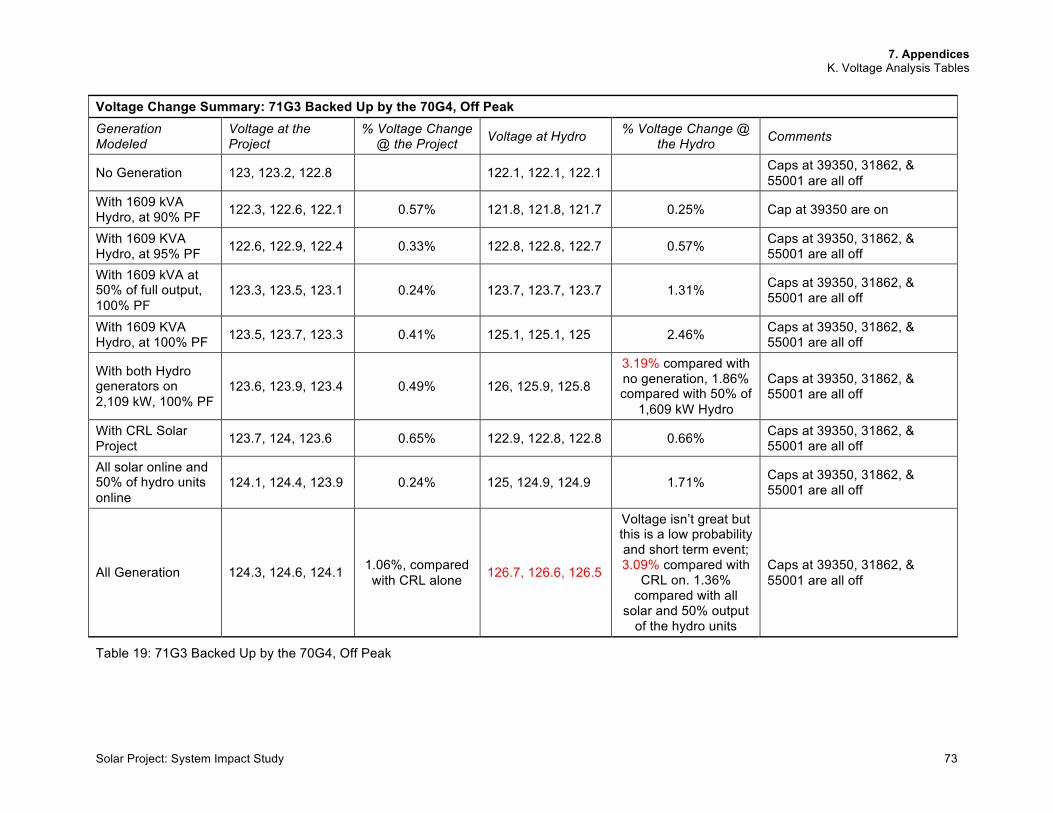
7. Appendices K. Voltage Analysis Tables
Solar Project: System Impact Study 73
Voltage Change Summary: 71G3 Backed Up by the 70G4, Off Peak Generation Modeled
Voltage at the Project
% Voltage Change @ the Project Voltage at Hydro % Voltage Change @
the Hydro Comments
No Generation 123, 123.2, 122.8 122.1, 122.1, 122.1 Caps at 39350, 31862, & 55001 are all off
With 1609 kVA Hydro, at 90% PF 122.3, 122.6, 122.1 0.57% 121.8, 121.8, 121.7 0.25% Cap at 39350 are on
With 1609 KVA Hydro, at 95% PF 122.6, 122.9, 122.4 0.33% 122.8, 122.8, 122.7 0.57% Caps at 39350, 31862, &
55001 are all off With 1609 kVA at 50% of full output, 100% PF
123.3, 123.5, 123.1 0.24% 123.7, 123.7, 123.7 1.31% Caps at 39350, 31862, & 55001 are all off
With 1609 KVA Hydro, at 100% PF 123.5, 123.7, 123.3 0.41% 125.1, 125.1, 125 2.46% Caps at 39350, 31862, &
55001 are all off
With both Hydro generators on 2,109 kW, 100% PF
123.6, 123.9, 123.4 0.49% 126, 125.9, 125.8
3.19% compared with no generation, 1.86% compared with 50% of
1,609 kW Hydro
Caps at 39350, 31862, & 55001 are all off
With CRL Solar Project 123.7, 124, 123.6 0.65% 122.9, 122.8, 122.8 0.66% Caps at 39350, 31862, &
55001 are all off All solar online and 50% of hydro units online
124.1, 124.4, 123.9 0.24% 125, 124.9, 124.9 1.71% Caps at 39350, 31862, & 55001 are all off
All Generation 124.3, 124.6, 124.1 1.06%, compared with CRL alone 126.7, 126.6, 126.5
Voltage isn’t great but this is a low probability and short term event; 3.09% compared with
CRL on. 1.36% compared with all
solar and 50% output of the hydro units
Caps at 39350, 31862, & 55001 are all off
Table 19: 71G3 Backed Up by the 70G4, Off Peak
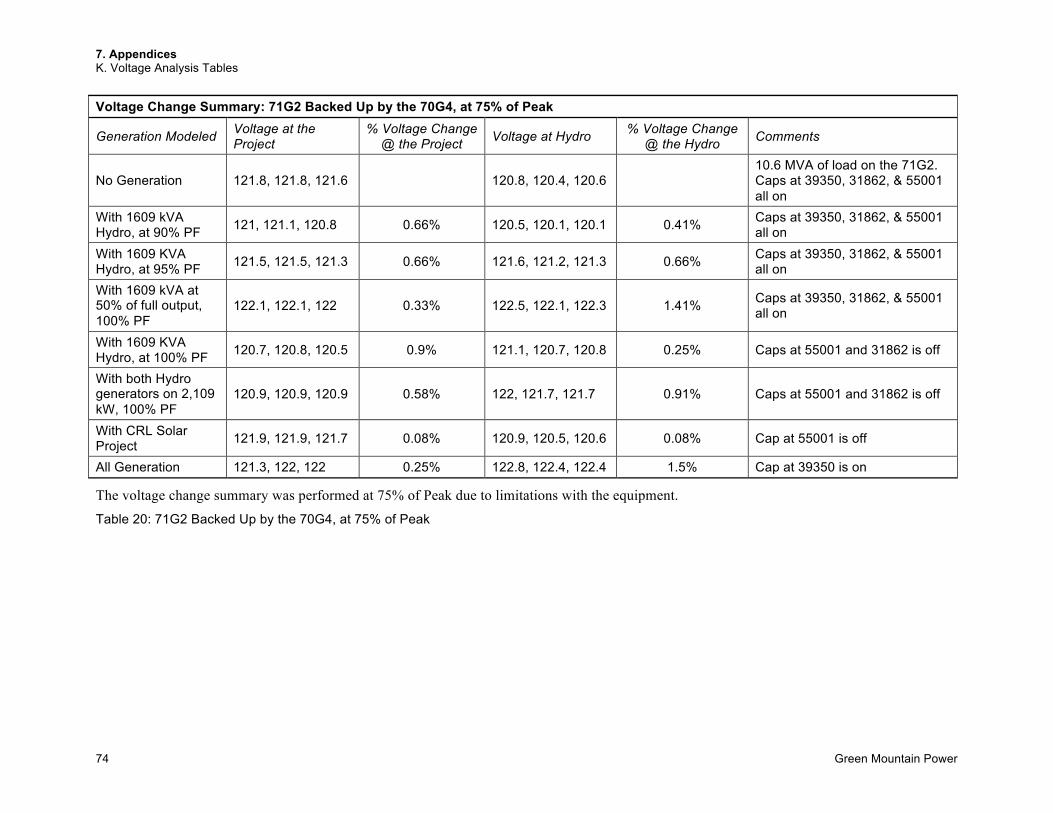
7. Appendices K. Voltage Analysis Tables
74 Green Mountain Power
Voltage Change Summary: 71G2 Backed Up by the 70G4, at 75% of Peak
Generation Modeled Voltage at the Project
% Voltage Change @ the Project Voltage at Hydro % Voltage Change
@ the Hydro Comments
No Generation 121.8, 121.8, 121.6 120.8, 120.4, 120.6 10.6 MVA of load on the 71G2. Caps at 39350, 31862, & 55001 all on
With 1609 kVA Hydro, at 90% PF 121, 121.1, 120.8 0.66% 120.5, 120.1, 120.1 0.41% Caps at 39350, 31862, & 55001
all on With 1609 KVA Hydro, at 95% PF 121.5, 121.5, 121.3 0.66% 121.6, 121.2, 121.3 0.66% Caps at 39350, 31862, & 55001
all on With 1609 kVA at 50% of full output, 100% PF
122.1, 122.1, 122 0.33% 122.5, 122.1, 122.3 1.41% Caps at 39350, 31862, & 55001 all on
With 1609 KVA Hydro, at 100% PF 120.7, 120.8, 120.5 0.9% 121.1, 120.7, 120.8 0.25% Caps at 55001 and 31862 is off
With both Hydro generators on 2,109 kW, 100% PF
120.9, 120.9, 120.9 0.58% 122, 121.7, 121.7 0.91% Caps at 55001 and 31862 is off
With CRL Solar Project 121.9, 121.9, 121.7 0.08% 120.9, 120.5, 120.6 0.08% Cap at 55001 is off
All Generation 121.3, 122, 122 0.25% 122.8, 122.4, 122.4 1.5% Cap at 39350 is on
The voltage change summary was performed at 75% of Peak due to limitations with the equipment.
Table 20: 71G2 Backed Up by the 70G4, at 75% of Peak
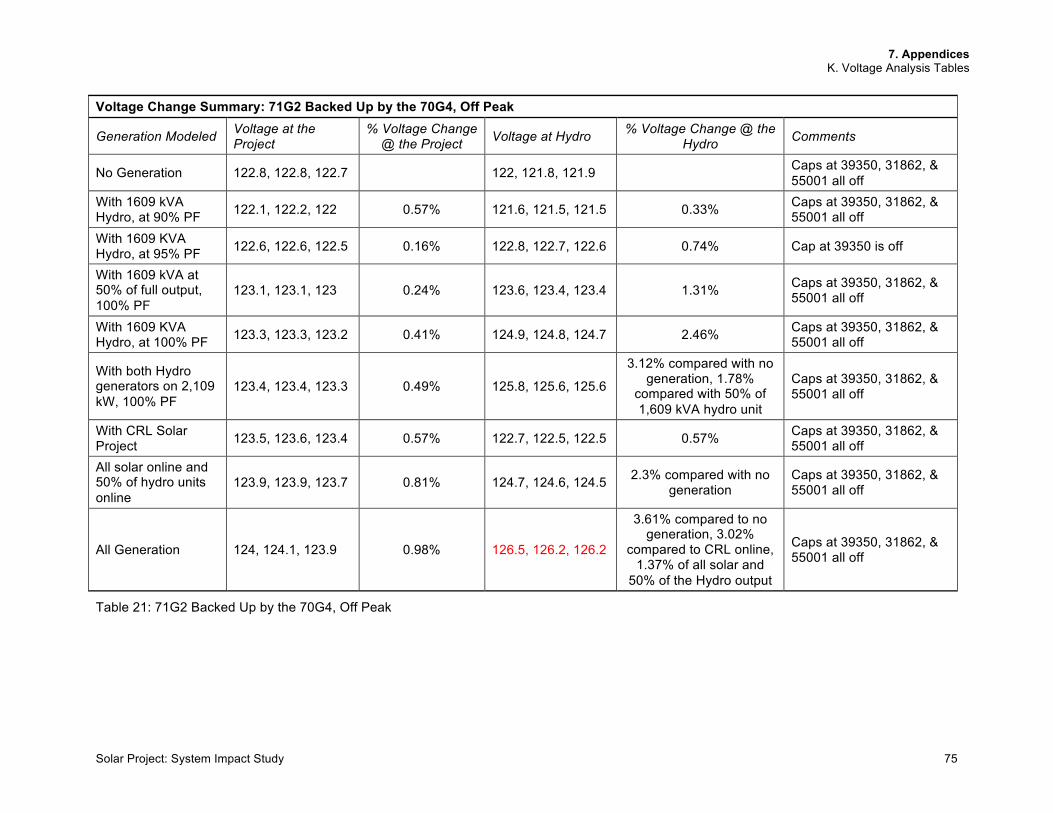
7. Appendices K. Voltage Analysis Tables
Solar Project: System Impact Study 75
Voltage Change Summary: 71G2 Backed Up by the 70G4, Off Peak
Generation Modeled Voltage at the Project
% Voltage Change @ the Project Voltage at Hydro % Voltage Change @ the
Hydro Comments
No Generation 122.8, 122.8, 122.7 122, 121.8, 121.9 Caps at 39350, 31862, & 55001 all off
With 1609 kVA Hydro, at 90% PF 122.1, 122.2, 122 0.57% 121.6, 121.5, 121.5 0.33% Caps at 39350, 31862, &
55001 all off With 1609 KVA Hydro, at 95% PF 122.6, 122.6, 122.5 0.16% 122.8, 122.7, 122.6 0.74% Cap at 39350 is off
With 1609 kVA at 50% of full output, 100% PF
123.1, 123.1, 123 0.24% 123.6, 123.4, 123.4 1.31% Caps at 39350, 31862, & 55001 all off
With 1609 KVA Hydro, at 100% PF 123.3, 123.3, 123.2 0.41% 124.9, 124.8, 124.7 2.46% Caps at 39350, 31862, &
55001 all off
With both Hydro generators on 2,109 kW, 100% PF
123.4, 123.4, 123.3 0.49% 125.8, 125.6, 125.6
3.12% compared with no generation, 1.78%
compared with 50% of 1,609 kVA hydro unit
Caps at 39350, 31862, & 55001 all off
With CRL Solar Project 123.5, 123.6, 123.4 0.57% 122.7, 122.5, 122.5 0.57% Caps at 39350, 31862, &
55001 all off All solar online and 50% of hydro units online
123.9, 123.9, 123.7 0.81% 124.7, 124.6, 124.5 2.3% compared with no generation
Caps at 39350, 31862, & 55001 all off
All Generation 124, 124.1, 123.9 0.98% 126.5, 126.2, 126.2
3.61% compared to no generation, 3.02%
compared to CRL online, 1.37% of all solar and
50% of the Hydro output
Caps at 39350, 31862, & 55001 all off
Table 21: 71G2 Backed Up by the 70G4, Off Peak
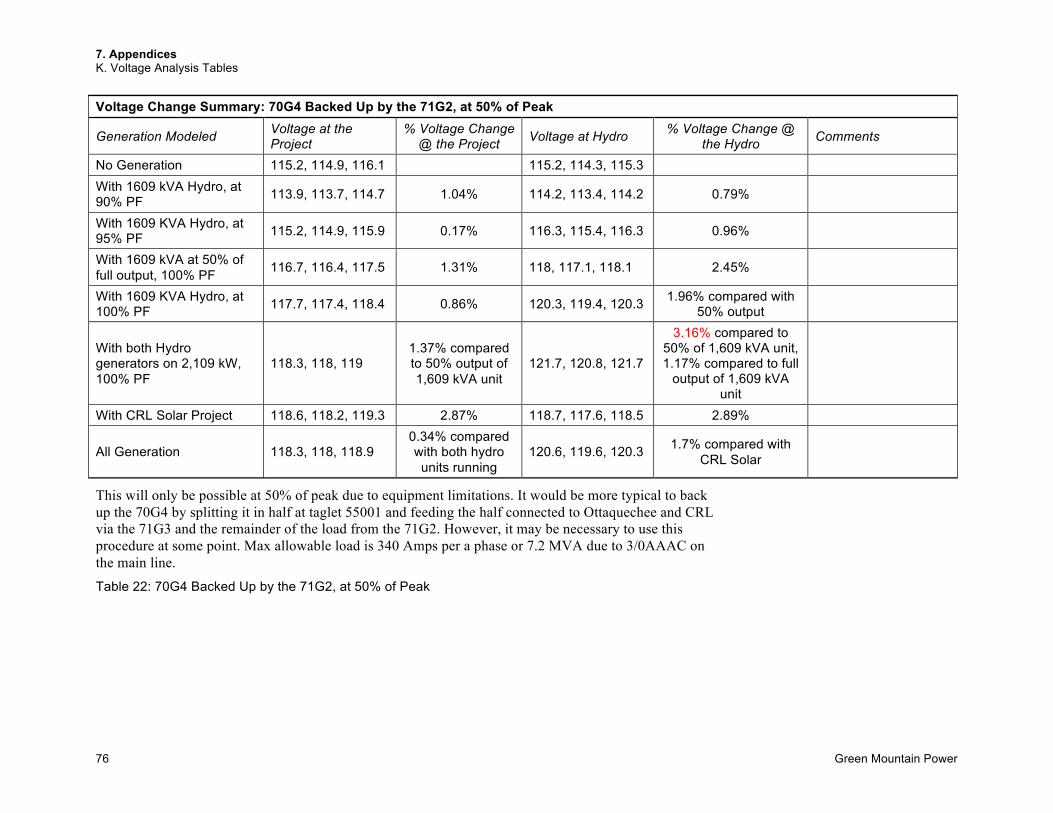
7. Appendices K. Voltage Analysis Tables
76 Green Mountain Power
Voltage Change Summary: 70G4 Backed Up by the 71G2, at 50% of Peak
Generation Modeled Voltage at the Project
% Voltage Change @ the Project Voltage at Hydro % Voltage Change @
the Hydro Comments
No Generation 115.2, 114.9, 116.1 115.2, 114.3, 115.3 With 1609 kVA Hydro, at 90% PF 113.9, 113.7, 114.7 1.04% 114.2, 113.4, 114.2 0.79%
With 1609 KVA Hydro, at 95% PF 115.2, 114.9, 115.9 0.17% 116.3, 115.4, 116.3 0.96%
With 1609 kVA at 50% of full output, 100% PF 116.7, 116.4, 117.5 1.31% 118, 117.1, 118.1 2.45%
With 1609 KVA Hydro, at 100% PF 117.7, 117.4, 118.4 0.86% 120.3, 119.4, 120.3 1.96% compared with
50% output
With both Hydro generators on 2,109 kW, 100% PF
118.3, 118, 119 1.37% compared to 50% output of 1,609 kVA unit
121.7, 120.8, 121.7
3.16% compared to 50% of 1,609 kVA unit, 1.17% compared to full
output of 1,609 kVA unit
With CRL Solar Project 118.6, 118.2, 119.3 2.87% 118.7, 117.6, 118.5 2.89%
All Generation 118.3, 118, 118.9 0.34% compared with both hydro units running
120.6, 119.6, 120.3 1.7% compared with CRL Solar
This will only be possible at 50% of peak due to equipment limitations. It would be more typical to back up the 70G4 by splitting it in half at taglet 55001 and feeding the half connected to Ottaquechee and CRL via the 71G3 and the remainder of the load from the 71G2. However, it may be necessary to use this procedure at some point. Max allowable load is 340 Amps per a phase or 7.2 MVA due to 3/0AAAC on the main line.
Table 22: 70G4 Backed Up by the 71G2, at 50% of Peak
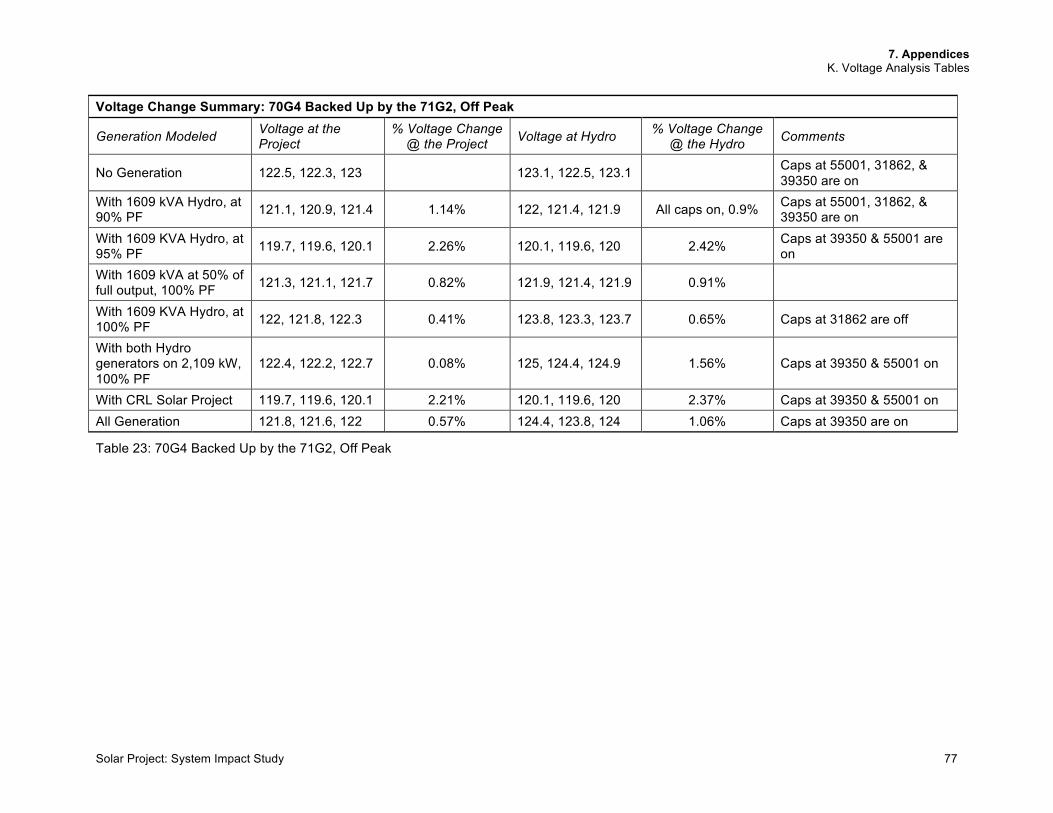
7. Appendices K. Voltage Analysis Tables
Solar Project: System Impact Study 77
Voltage Change Summary: 70G4 Backed Up by the 71G2, Off Peak
Generation Modeled Voltage at the Project
% Voltage Change @ the Project Voltage at Hydro % Voltage Change
@ the Hydro Comments
No Generation 122.5, 122.3, 123 123.1, 122.5, 123.1 Caps at 55001, 31862, & 39350 are on
With 1609 kVA Hydro, at 90% PF 121.1, 120.9, 121.4 1.14% 122, 121.4, 121.9 All caps on, 0.9% Caps at 55001, 31862, &
39350 are on With 1609 KVA Hydro, at 95% PF 119.7, 119.6, 120.1 2.26% 120.1, 119.6, 120 2.42% Caps at 39350 & 55001 are
on With 1609 kVA at 50% of full output, 100% PF 121.3, 121.1, 121.7 0.82% 121.9, 121.4, 121.9 0.91%
With 1609 KVA Hydro, at 100% PF 122, 121.8, 122.3 0.41% 123.8, 123.3, 123.7 0.65% Caps at 31862 are off
With both Hydro generators on 2,109 kW, 100% PF
122.4, 122.2, 122.7 0.08% 125, 124.4, 124.9 1.56% Caps at 39350 & 55001 on
With CRL Solar Project 119.7, 119.6, 120.1 2.21% 120.1, 119.6, 120 2.37% Caps at 39350 & 55001 on All Generation 121.8, 121.6, 122 0.57% 124.4, 123.8, 124 1.06% Caps at 39350 are on
Table 23: 70G4 Backed Up by the 71G2, Off Peak
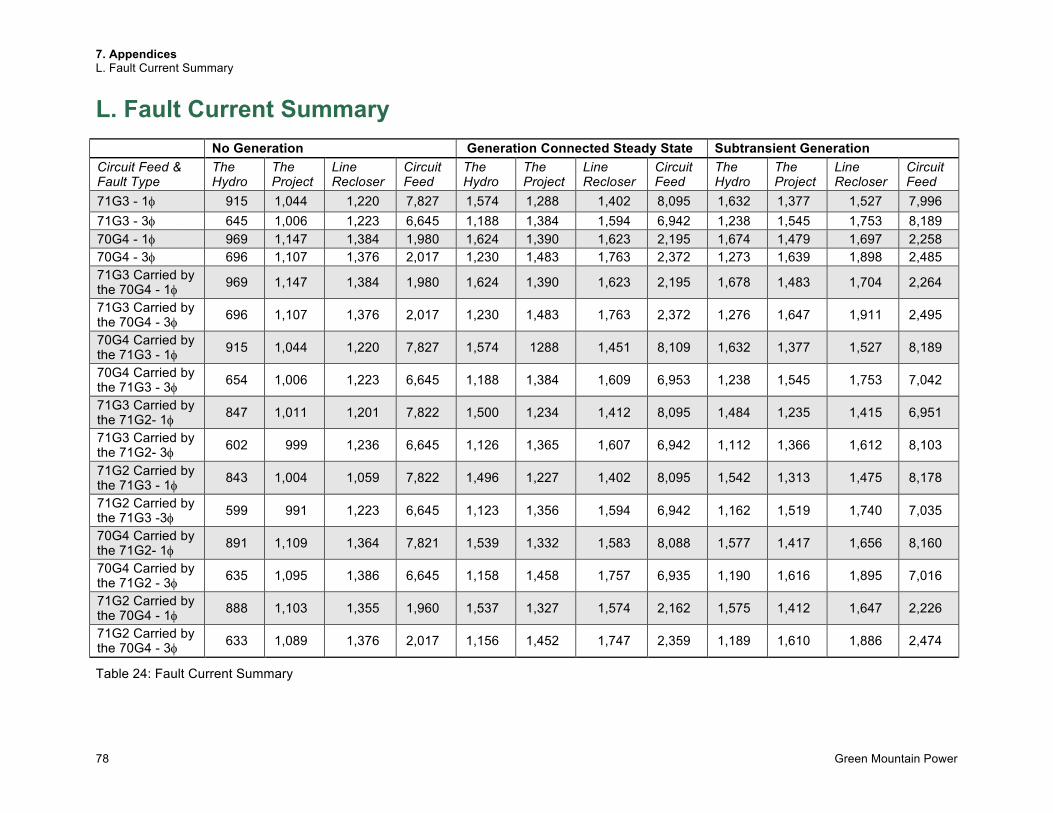
7. Appendices L. Fault Current Summary
78 Green Mountain Power
L. Fault Current Summary No Generation Generation Connected Steady State Subtransient Generation Circuit Feed & Fault Type
The Hydro
The Project
Line Recloser
Circuit Feed
The Hydro
The Project
Line Recloser
Circuit Feed
The Hydro
The Project
Line Recloser
Circuit Feed
71G3 - 1f 915 1,044 1,220 7,827 1,574 1,288 1,402 8,095 1,632 1,377 1,527 7,996 71G3 - 3f 645 1,006 1,223 6,645 1,188 1,384 1,594 6,942 1,238 1,545 1,753 8,189 70G4 - 1f 969 1,147 1,384 1,980 1,624 1,390 1,623 2,195 1,674 1,479 1,697 2,258 70G4 - 3f 696 1,107 1,376 2,017 1,230 1,483 1,763 2,372 1,273 1,639 1,898 2,485 71G3 Carried by the 70G4 - 1f 969 1,147 1,384 1,980 1,624 1,390 1,623 2,195 1,678 1,483 1,704 2,264
71G3 Carried by the 70G4 - 3f 696 1,107 1,376 2,017 1,230 1,483 1,763 2,372 1,276 1,647 1,911 2,495
70G4 Carried by the 71G3 - 1f 915 1,044 1,220 7,827 1,574 1288 1,451 8,109 1,632 1,377 1,527 8,189
70G4 Carried by the 71G3 - 3f 654 1,006 1,223 6,645 1,188 1,384 1,609 6,953 1,238 1,545 1,753 7,042
71G3 Carried by the 71G2- 1f 847 1,011 1,201 7,822 1,500 1,234 1,412 8,095 1,484 1,235 1,415 6,951
71G3 Carried by the 71G2- 3f 602 999 1,236 6,645 1,126 1,365 1,607 6,942 1,112 1,366 1,612 8,103
71G2 Carried by the 71G3 - 1f 843 1,004 1,059 7,822 1,496 1,227 1,402 8,095 1,542 1,313 1,475 8,178
71G2 Carried by the 71G3 -3f 599 991 1,223 6,645 1,123 1,356 1,594 6,942 1,162 1,519 1,740 7,035
70G4 Carried by the 71G2- 1f 891 1,109 1,364 7,821 1,539 1,332 1,583 8,088 1,577 1,417 1,656 8,160
70G4 Carried by the 71G2 - 3f 635 1,095 1,386 6,645 1,158 1,458 1,757 6,935 1,190 1,616 1,895 7,016
71G2 Carried by the 70G4 - 1f 888 1,103 1,355 1,960 1,537 1,327 1,574 2,162 1,575 1,412 1,647 2,226
71G2 Carried by the 70G4 - 3f 633 1,089 1,376 2,017 1,156 1,452 1,747 2,359 1,189 1,610 1,886 2,474
Table 24: Fault Current Summary
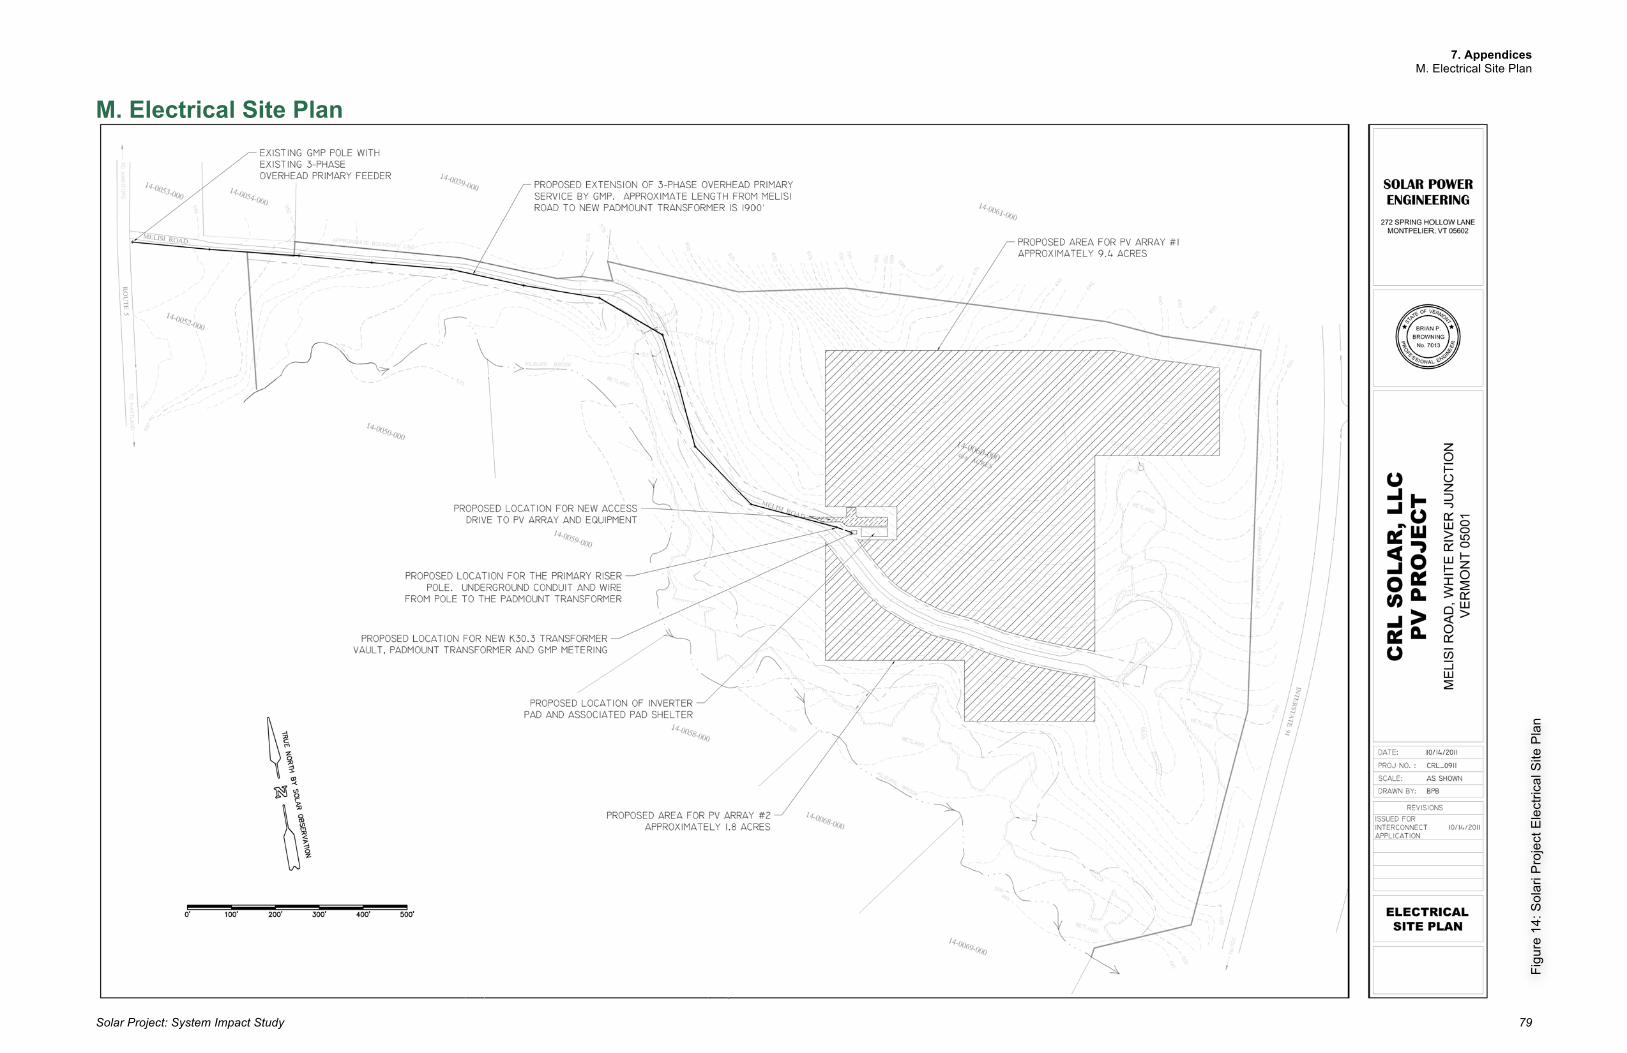
7. Appendices M. Electrical Site Plan
Solar Project: System Impact Study 79
M. Electrical Site Plan
Figu
re 1
4: S
olar
i Pro
ject
Ele
ctric
al S
ite P
lan
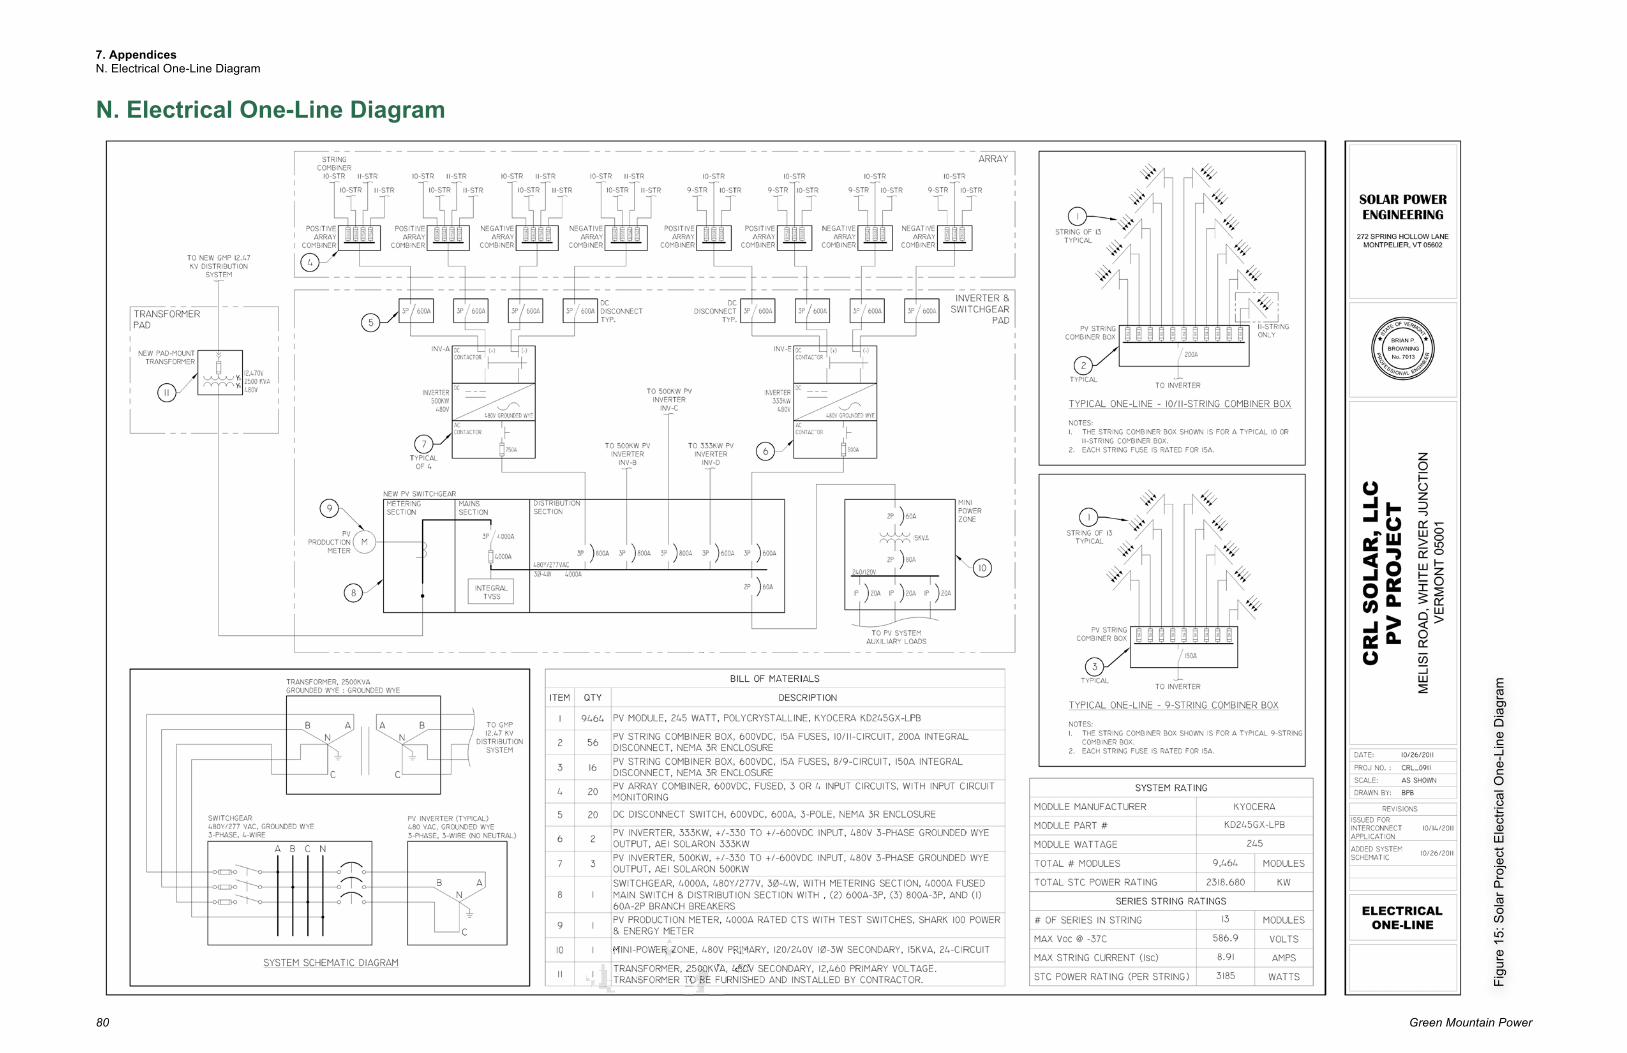
7. Appendices N. Electrical One-Line Diagram
80 Green Mountain Power
N. Electrical One-Line Diagram
Figu
re 1
5: S
olar
Pro
ject
Ele
ctric
al O
ne-L
ine
Dia
gram