Embed Size (px)
Citation preview
Solar Heat WorldwideWerner Weiss Irene Bergmann Gerhard Faninger| |
Markets and Contribution to the Energy Supply 2006
E D I T I O N 2 0 0 8
SOLAR HEATING & COOLING PROGRAMMEINTERNATIONAL ENERGY AGENCY
SOLAR HEATING & COOLING PROGRAMMEINTERNATIONAL ENERGY AGENCY
Solar Heat WorldwideMarkets and Contribution to the Energy Supply 2006
E D I T I O N 2 0 0 8
IEA Solar Heating & Cooling Programme, May 2008
Supported by the Austrian Ministry for Transport, Innovation and Technology
Design, Grafics, Typesetting & Imageprocessing: STEINHUBER INFODESIGN, Graz, AustriaCover Photo: Hans Pattist for SenterNovem
Werner Weiss Irene Bergmann Gerhard Faninger| |
AEE INTECAEE - Institute for Sustainable Technologies
A-8200 Gleisdorf, Austria
Notice:The Solar Heating and Cooling Programme functions within a framework created by the International Energy Agency (IEA). Views, findings and publications of the Solar Heating and Cooling Programme do not necessarily represent the views or policies of the IEA Secretariat or of all its individual member countries.
2
SOLAR HEAT WORLDWIDE 2006
Ta ble of Con tents
1 Back ground · · · · · · · · · · · · · · · · · · · · · · · · · · · · · · · · · · · · · · · · · · · · · · · · · · · · · · · · · · · · · · · · · · · · · · · · · · · · · · · · · · · · · · · · · · · · · · · · · · · · · · · · · · · · · · · · · · · · · · · 3
2 Sum mary · · · · · · · · · · · · · · · · · · · · · · · · · · · · · · · · · · · · · · · · · · · · · · · · · · · · · · · · · · · · · · · · · · · · · · · · · · · · · · · · · · · · · · · · · · · · · · · · · · · · · · · · · · · · · · · · · · · · · · · · · · · 4
3 To tal ca pac ity by the year 2006 · · · · · · · · · · · · · · · · · · · · · · · · · · · · · · · · · · · · · · · · · · · · · · · · · · · · · · · · · · · · · · · · · · · · · · · · · · · · · · · · · · · · · · · · · · · 7
3.1 To tal ca pac ity of glazed flat-plate and evac u ated tube col lec tors at the end of 2006 · · · · · · · · · · · · · · · · · · · · · · · · · · · · · · 10
3.2 To tal ca pac ity of glazed flat-plate and evac u ated tube col lec tors in operation at the end of 2006
by eco nomic re gion · · · · · · · · · · · · · · · · · · · · · · · · · · · · · · · · · · · · · · · · · · · · · · · · · · · · · · · · · · · · · · · · · · · · · · · · · · · · · · · · · · · · · · · · · · · · · · · · · · · · · · · · · · · · · · · · 11
3.3 To tal ca pac ity of un glazed wa ter col lec tors in op er a tion at the end of 2006 · · · · · · · · · · · · · · · · · · · · · · · · · · · · · · · · · · · · · · · · · 12
3.4 To tal ca pac ity of un glazed wa ter col lec tors in op er a tion by eco nomic region at the end of 2006 · · · · · · · · · · · · · · · 13
4 Mar ket de vel op ment · · · · · · · · · · · · · · · · · · · · · · · · · · · · · · · · · · · · · · · · · · · · · · · · · · · · · · · · · · · · · · · · · · · · · · · · · · · · · · · · · · · · · · · · · · · · · · · · · · · · · · · · · · 14
4.1 An nual in stalled ca pac ity · · · · · · · · · · · · · · · · · · · · · · · · · · · · · · · · · · · · · · · · · · · · · · · · · · · · · · · · · · · · · · · · · · · · · · · · · · · · · · · · · · · · · · · · · · · · · · · · · · · · · · · · · 14
4.2 Mar ket de vel op ment of glazed flat-plate and evac u ated tube col lec tors by eco nomic re gion · · · · · · · · · · · · · · · · · · 15
4.3 Mar ket de vel op ment of un glazed plas tic col lec tors by eco nomic re gion · · · · · · · · · · · · · · · · · · · · · · · · · · · · · · · · · · · · · · · · · · · · · 17
5 Con tri bu tion to the en ergy sup ply and CO2 re duc tion · · · · · · · · · · · · · · · · · · · · · · · · · · · · · · · · · · · · · · · · · · · · · · · · · · · · · · · · · · · · 18
5.1 Ba sis for cal cu la tion · · · · · · · · · · · · · · · · · · · · · · · · · · · · · · · · · · · · · · · · · · · · · · · · · · · · · · · · · · · · · · · · · · · · · · · · · · · · · · · · · · · · · · · · · · · · · · · · · · · · · · · · · · · · · · · 18
5.2 Re sults · · · · · · · · · · · · · · · · · · · · · · · · · · · · · · · · · · · · · · · · · · · · · · · · · · · · · · · · · · · · · · · · · · · · · · · · · · · · · · · · · · · · · · · · · · · · · · · · · · · · · · · · · · · · · · · · · · · · · · · · · · · · · · · · 18
5.3 Col lec tor yield by eco nomic re gion at the end of 2006 · · · · · · · · · · · · · · · · · · · · · · · · · · · · · · · · · · · · · · · · · · · · · · · · · · · · · · · · · · · · · · · · · · · · 22
5.4 En ergy sav ings by eco nomic re gion at the end of 2006 · · · · · · · · · · · · · · · · · · · · · · · · · · · · · · · · · · · · · · · · · · · · · · · · · · · · · · · · · · · · · · · · · · · 24
5.5 Con tri bu tion to CO2 re duc tion by eco nomic re gion at the end of 2006 · · · · · · · · · · · · · · · · · · · · · · · · · · · · · · · · · · · · · · · · · · · · · · · · 26
6 Dis tri bu tion of Sys tems by Ap pli ca tion · · · · · · · · · · · · · · · · · · · · · · · · · · · · · · · · · · · · · · · · · · · · · · · · · · · · · · · · · · · · · · · · · · · · · · · · · · · · · · · · 28
7 Ap pen dix · · · · · · · · · · · · · · · · · · · · · · · · · · · · · · · · · · · · · · · · · · · · · · · · · · · · · · · · · · · · · · · · · · · · · · · · · · · · · · · · · · · · · · · · · · · · · · · · · · · · · · · · · · · · · · · · · · · · · · · · · · · 31
7.1 Ref er ence sys tems · · · · · · · · · · · · · · · · · · · · · · · · · · · · · · · · · · · · · · · · · · · · · · · · · · · · · · · · · · · · · · · · · · · · · · · · · · · · · · · · · · · · · · · · · · · · · · · · · · · · · · · · · · · · · · · · 31
7.2 Ref er ence col lec tor · · · · · · · · · · · · · · · · · · · · · · · · · · · · · · · · · · · · · · · · · · · · · · · · · · · · · · · · · · · · · · · · · · · · · · · · · · · · · · · · · · · · · · · · · · · · · · · · · · · · · · · · · · · · · · · · 35
7.3 Ref er ence cli mates · · · · · · · · · · · · · · · · · · · · · · · · · · · · · · · · · · · · · · · · · · · · · · · · · · · · · · · · · · · · · · · · · · · · · · · · · · · · · · · · · · · · · · · · · · · · · · · · · · · · · · · · · · · · · · · · 35
7.4 Pop u la tion data · · · · · · · · · · · · · · · · · · · · · · · · · · · · · · · · · · · · · · · · · · · · · · · · · · · · · · · · · · · · · · · · · · · · · · · · · · · · · · · · · · · · · · · · · · · · · · · · · · · · · · · · · · · · · · · · · · · · · 35
7.5 In stalled ca pac ity in 2005 · · · · · · · · · · · · · · · · · · · · · · · · · · · · · · · · · · · · · · · · · · · · · · · · · · · · · · · · · · · · · · · · · · · · · · · · · · · · · · · · · · · · · · · · · · · · · · · · · · · · · · · · 36
7.6 2005 and 2006 data in m² · · · · · · · · · · · · · · · · · · · · · · · · · · · · · · · · · · · · · · · · · · · · · · · · · · · · · · · · · · · · · · · · · · · · · · · · · · · · · · · · · · · · · · · · · · · · · · · · · · · · · · · 37
7.7 Ref er ences to re ports and per sons that have sup plied the data · · · · · · · · · · · · · · · · · · · · · · · · · · · · · · · · · · · · · · · · · · · · · · · · · · · · · · · · 41
7.8 Re ports and Sta tis tics · · · · · · · · · · · · · · · · · · · · · · · · · · · · · · · · · · · · · · · · · · · · · · · · · · · · · · · · · · · · · · · · · · · · · · · · · · · · · · · · · · · · · · · · · · · · · · · · · · · · · · · · · · · · · 44
7.9 In dex of Fig ures · · · · · · · · · · · · · · · · · · · · · · · · · · · · · · · · · · · · · · · · · · · · · · · · · · · · · · · · · · · · · · · · · · · · · · · · · · · · · · · · · · · · · · · · · · · · · · · · · · · · · · · · · · · · · · · · · · · · 45
7.10 In dex of Ta bles · · · · · · · · · · · · · · · · · · · · · · · · · · · · · · · · · · · · · · · · · · · · · · · · · · · · · · · · · · · · · · · · · · · · · · · · · · · · · · · · · · · · · · · · · · · · · · · · · · · · · · · · · · · · · · · · · · · · · · 46
1 Back ground
This re port was pre pared within the frame work of the So lar Heat ing and Cool ing Programme (SHC) of the In ter na -
tional En ergy Agency (IEA). The goal of the re port is to doc u ment the so lar ther mal ca pac ity pre vi ously in stalled in
the im por tant mar kets world wide, and to as cer tain the con tri bu tion of so lar plants to the sup ply of en ergy and the
CO2 emis sions avoided as a re sult of op er at ing these plants. The col lec tors doc u mented are un glazed col lec tors,
glazed flat-plate and evac u ated tube col lec tors with wa ter as the en ergy car rier as well as glazed and unglazed air
collectors.
The data were col lected within the frame work of a ques tion naire sur vey of the na tional del e gates of the Ex ec u tive
Com mit tee of the SHC Programme and other na tional ex perts ac tive in the field of so lar ther mal en ergy. Since some
of the 48 coun tries in cluded in this re port have very de tailed sta tis tics and oth ers could only pro vide es ti mates from
ex perts, the data was checked for its plau si bil ity on the basis of various publications.
Start ing with the col lec tor area, the ca pac ity in stalled, the con tri bu tions of so lar plants to wards the sup ply of en ergy
and the re duc tion of CO2 were ascertained.
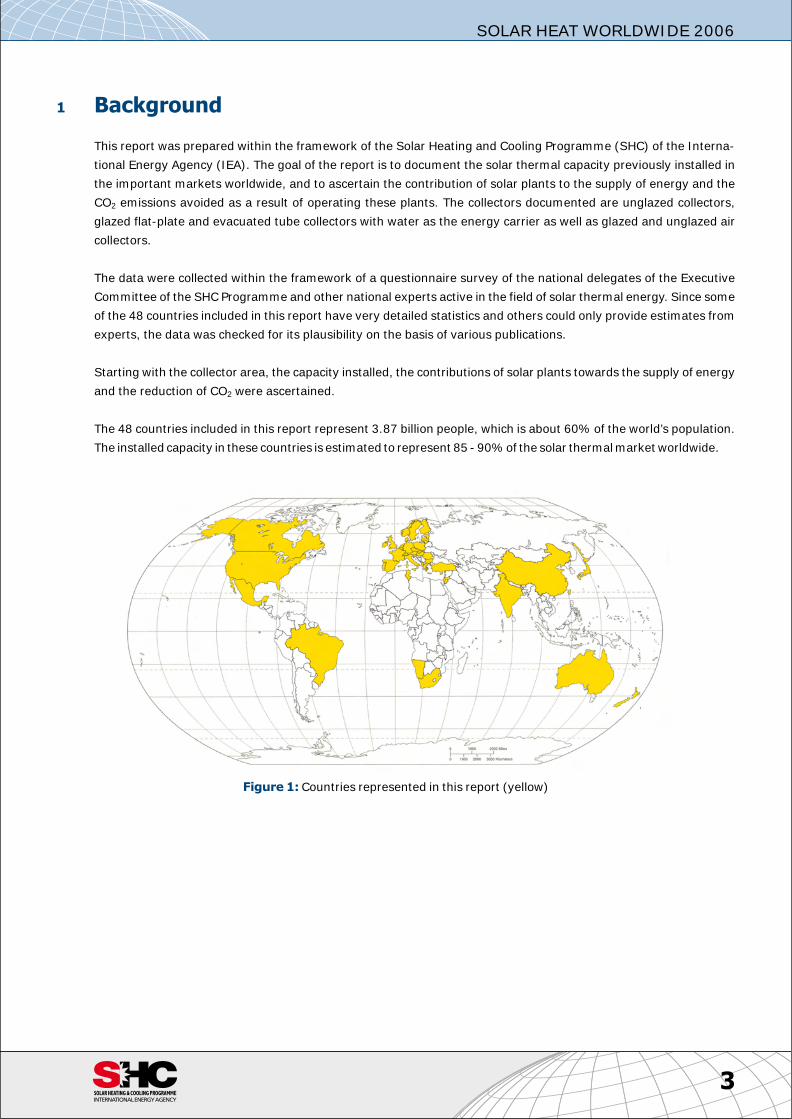
The 48 coun tries in cluded in this re port rep re sent 3.87 bil lion peo ple, which is about 60% of the world’s pop u la tion.
The in stalled ca pac ity in these coun tries is es ti mated to rep re sent 85 - 90% of the so lar ther mal market worldwide.[[Bil der\Fig01_World ma pAEE.tif]]a01
3
SOLAR HEAT WORLDWIDE 2006
Fig ure 1: Coun tries rep re sented in this re port (yel low)
2 Sum mary
So lar Ther mal Ca pac ity in Op er a tion World wide
The so lar ther mal col lec tor ca pac ity in op er a tion world wide equalled 127.8 GWth cor re spond ing to 182.5 mil lion
square me ters1 at the end of the year 2006. Of this, 102.1 GWth were ac counted for by flat-plate and evac u ated tube
col lec tors and 24.5 GWth for un glazed plas tic col lec tors. Air col lec tor ca pac ity was in stalled to an ex tent of 1.2 GWth.
Dis tri bu tion by Ap pli ca tion
If one ob serves the use of so lar ther mal en ergy it be comes clear that it greatly var ies in the dif fer ent coun tries. In
China and Tai wan (65.9 GWth), Eu rope (14.2 GWth) and Ja pan (4.7 GWth), plants with flat-plate and evac u ated tube
col lec tors are mainly used to pre pare hot wa ter and to pro vide space heat ing, while in North Amer ica (USA and Can -
ada) swim ming pool heat ing is the dom i nant ap pli ca tion with an in stalled ca pac ity of 19.6 GWth of unglazed plastic
collectors.
It should be men tioned that there is a grow ing un glazed so lar air heat ing mar ket in Can ada and the USA out side pool
heat ing. Un glazed col lec tors are also used for com mer cial and in dus trial build ing ven ti la tion, air heat ing and ag ri cul -
tural ap pli ca tions. It is ex pected that this mar ket will grow sig nif i cantly in the near fu ture. A 4 MWth pro ject was re -
cently com pleted in the USA us ing unglazed Solarwall collectors.
Eu rope has the most so phis ti cated mar ket for dif fer ent so lar ther mal ap pli ca tions. It in cludes sys tems for hot wa ter
prep a ra tion, plants for space heat ing of sin gle- and multi-fam ily houses and ho tels, large-scale plants for dis trict
heat ing as well as a grow ing num ber of sys tems for air con di tion ing, cool ing and industrial applications.
In Aus tria, Ger many and Swit zer land the share of ap pli ca tions other than hot wa ter prep a ra tion in sin gle-fam ily
houses is 20% and higher. There are 120 large-scale plants (≥ 500 m²; 350 kWth) in op er a tion in Eu rope with a to tal
in stalled ca pac ity of 137 MWth. The big gest plants are lo cated in Den mark with 13 MWth (18,300 m²) and Swe den
with 7 MWth (10,000 m²).
Lead ing Coun tries
Flat-plate and evac u ated tube col lec tors
Fo cus ing on the to tal ca pac ity in op er a tion of flat-plate and evac u ated tube col lec tors in stalled at the end of the year
2006, China (65.1 GWth), Tur key (6.6 GWth), Ger many (5.6 GWth), Ja pan (4.7 GWth) and Is rael (3.4 GWth) are the
lead ing coun tries. They are fol lowed by Greece (2.3 GWth), Brazil (2.2 GWth), Aus tria (1.9 GWth), the USA (1.6 GWth)
and Aus tra lia (1.1 GWth). As can be seen from these fig ures, China is by far the larg est mar ket, rep re sent ing 64% of
the world mar ket of flat-plate and evacuated tube collectors.
Fo cus ing on the mar ket pen e tra tion—to tal ca pac ity in op er a tion per 1,000 in hab it ants—Cy prus (680 kWth), Is rael
(506 kWth), Aus tria (231 kWth), Bar ba dos (208 kWth) and Greece (207 kWth) are the lead ing coun tries. They are fol -
lowed by Jor dan (103 kWth), Tur key (90 kWth), Ger many (68 kWth), Aus tra lia (56 kWth) and China (49 kWth).
4
SOLAR HEAT WORLDWIDE 2006
1 Making the installed capacity of solar thermal collectors comparable with that of other energy sources, solar thermal experts from seven
countries agreed upon a methodology to convert installed collector area into solar thermal capacity at a joint meeting of the IEA SHC
Programme and major solar thermal trade associations held September 2004 in Gleisdorf, Austria. The represented associations from Austria,
Canada, Germany, the Netherlands, Sweden and the USA as well as the European Solar Thermal Industry Federation (ESTIF) and the IEA SHC
Programme agreed to use a factor of 0.7 kWth/m² to derive the nominal capacity from the area of installed collectors.
Un glazed plas t ic col lec tors
With re gard to the heat ing of swim ming pools with un glazed plas tic col lec tors, the USA leads with a to tal ca pac ity of
19.2 GWth in op er a tion ahead of Aus tra lia with 2.7 GWth, Ger many and Can ada with 0.5 GWth each, and Aus tria and
South Af rica with 0.4 GWth.
The mar ket pen e tra tion gives a slightly dif fer ent pic ture: Aus tra lia leads with 132 kWth ahead of the USA with 64 kWth
and Aus tria with 51 kWth per 1,000 in hab it ants. In fourth to sixth places there are Swit zer land, Can ada and the Neth -
er lands with an in stalled ca pac ity be tween 21 and 14 kWth per 1,000 inhabitants.
In stalled ca pac ity in 2006
In the year 2006, a new ca pac ity of 18.3 GWth cor re spond ing to 26.1 mil lion square metres of so lar col lec tors were in -
stalled world wide. The new in stal la tions grew 22% com pared to 2005.
Flat-plate and evac u ated tube col lec tors ac counted for 16.7 GWth. Com pared to the ca pac ity in stalled in 2005, the
world wide growth of the in stalled ca pac ity of glazed wa ter col lec tors was 23%.
The most dy namic mar kets for wa ter col lec tors (un glazed, flat-plate and evac u ated tube col lec tors) in Eu rope with
growth rates above 50% com pared to the ca pac ity in stalled in 2005 were in the UK 93%, France 83% (in clud ing
over seas de part ments), Spain 64%, Bel gium 61%, Ger many 56% and Po land 50%. Be sides the Eu ro pean coun -
tries, the mar kets in Namibia 73%, Tu ni sia 52%, Tur key 46% and In dia 25% have re corded a large growth rate. The
new in stal la tions in China, the world’s larg est mar ket, in creased in 2006 by 20% com pared to in stal la tions in 2005.
Mar ket de vel op ment
The most dy namic mar kets for flat-plate and evac u ated tube col lec tors world wide are in China and Eu rope as well as
in Aus tra lia and New Zea land. The av er age an nual growth rate be tween 1999 and 2006 was 22% in China and Tai -
wan, 20% in Eu rope and 16% in Aus tra lia and New Zea land. The mar ket for flat-plate and evac u ated tube col lec tors
has been con sis tently low in Can ada and the USA.
Al though the in stalled ca pac ity of flat-plate and evac u ated tube col lec tors in the USA is very low com pared to other
coun tries, es pe cially with re gard to the large pop u la tion in the USA, the mar ket for new in stalled glazed col lec tors has
been sig nif i cantly grow ing in the years 2005 (45 MWth) and 2006 (87 MWth).
The world wide mar ket of un glazed col lec tors for swim ming pool heat ing re corded an in crease be tween 1999 and
2002 and a slight de crease in 2003. From 2004 to 2006 the in stalled ca pac ity again was in creas ing. The main mar ket
for un glazed col lec tors can mainly be found in the USA (1.0 GWth) and Aus tra lia (0.4 GWth). South Af rica, Can ada,
Ger many, Mex ico, The Neth er lands, Swe den, Swit zer land, Bel gium and Aus tria also have no ta ble mar kets, but all
with val ues be low 0.1 GWth of new in stalled unglazed collectors in 2006.
Con tri bu tion of so lar col lec tors to the sup ply of en ergy
The an nual col lec tor yield of all so lar ther mal sys tems in op er a tion by the end of 2006 in the 48 re corded coun tries is
76,959 GWh (277,054 TJ). This cor re sponds to an oil equiv a lent of 12.5 bil lion li ters and an an nual avoid ance of 34.1
mil lion tons of CO2.
These val ues have been cal cu lated from all wa ter-based sys tems ex clud ing the air sys tems. Since the da ta base of
the ap pli ca tions of air col lec tors is in suf fi cient, the con tri bu tion of air col lec tors to the en ergy sup ply and CO2 re duc -
tion was not calculated.
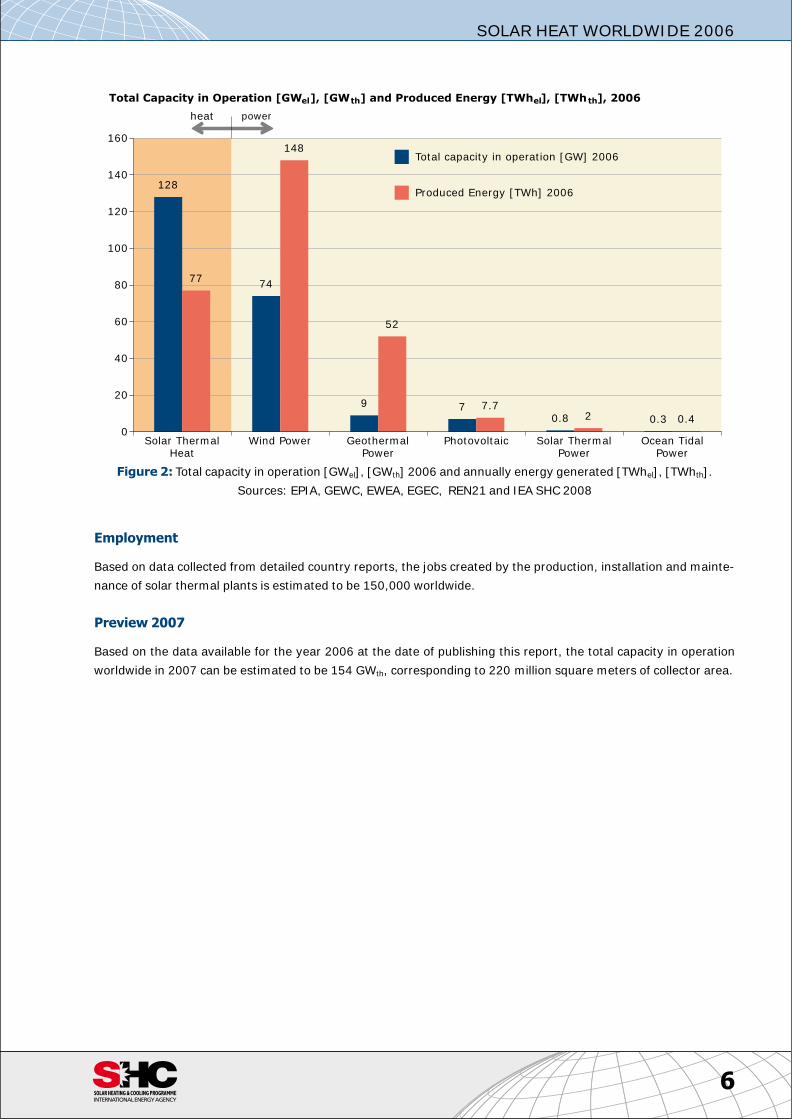
Com pared with other forms of re new able en ergy, so lar heat ing’s con tri bu tion in meet ing global en ergy de mand is,
be sides the tra di tional re new able en er gies like bio mass and hydropower, sec ond only to wind power, and has a much
larger con tri bu tion than photovoltaics (Fig ure 2). This fact is still un der es ti mated by energy policy.
5
SOLAR HEAT WORLDWIDE 2006
[[Bil der\a02.prn]]a02
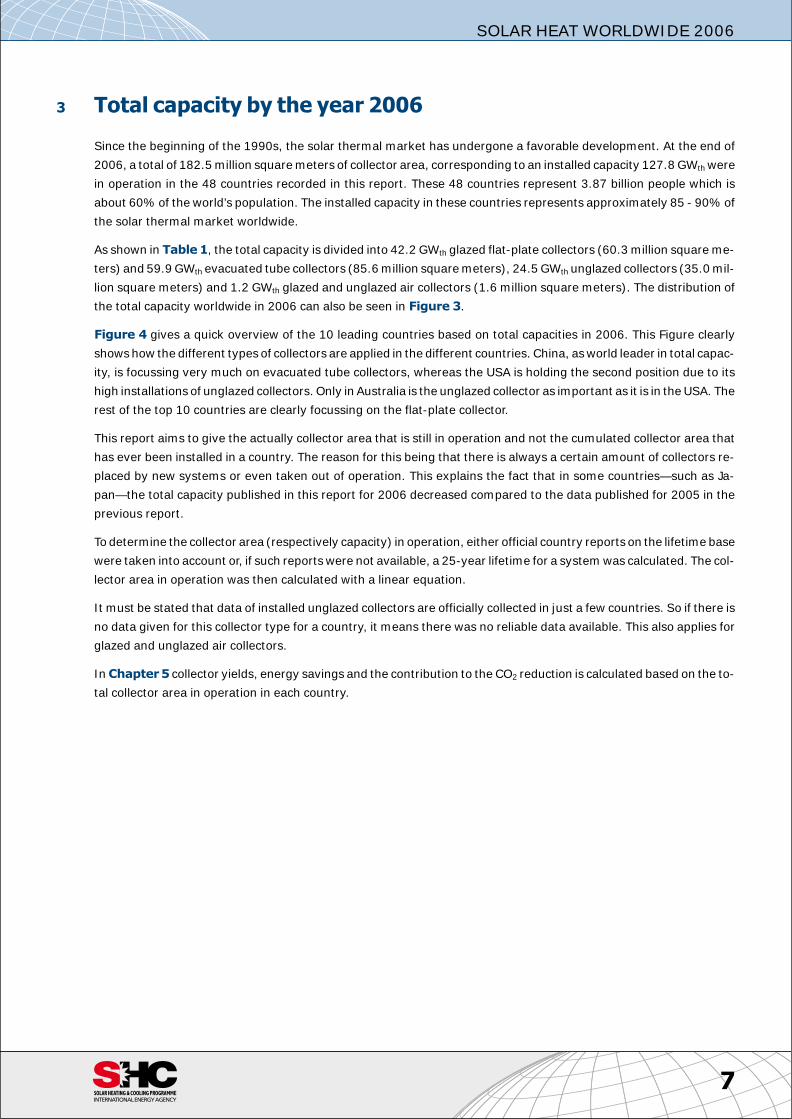
Em ploy ment
Based on data col lected from de tailed coun try re ports, the jobs cre ated by the pro duc tion, in stal la tion and main te -
nance of so lar ther mal plants is es ti mated to be 150,000 worldwide.
Pre view 2007
Based on the data avail able for the year 2006 at the date of pub lish ing this re port, the to tal ca pac ity in op er a tion
world wide in 2007 can be es ti mated to be 154 GWth, cor re spond ing to 220 mil lion square me ters of collector area.
6
SOLAR HEAT WORLDWIDE 2006
128
74
9 70.8 0.3
77
148
52
7.72 0.4
0
20
40
60
80
100
120
140
160
Solar ThermalHeat
Wind Power GeothermalPower
Photovoltaic Solar ThermalPower
Ocean TidalPower
Total Capacity in Operation [GW ], [GW ] and Produced Energy [TWh ], [TWh ], 2006 el th el th
Total capacity in operation [GW] 2006
Produced Energy [TWh] 2006
heat power
Fig ure 2: To tal ca pac ity in op er a tion [GWel], [GWth] 2006 and an nu ally en ergy gen er ated [TWhel], [TWhth].
Sources: EPIA, GEWC, EWEA, EGEC, REN21 and IEA SHC 2008
3 To tal ca pac ity by the year 2006
Since the be gin ning of the 1990s, the so lar ther mal mar ket has un der gone a fa vor able de vel op ment. At the end of
2006, a to tal of 182.5 mil lion square me ters of col lec tor area, cor re spond ing to an in stalled ca pac ity 127.8 GWth were
in op er a tion in the 48 coun tries re corded in this re port. These 48 coun tries rep re sent 3.87 bil lion peo ple which is
about 60% of the world’s pop u la tion. The in stalled ca pac ity in these coun tries rep re sents ap prox i mately 85 - 90% of
the solar thermal market worldwide.
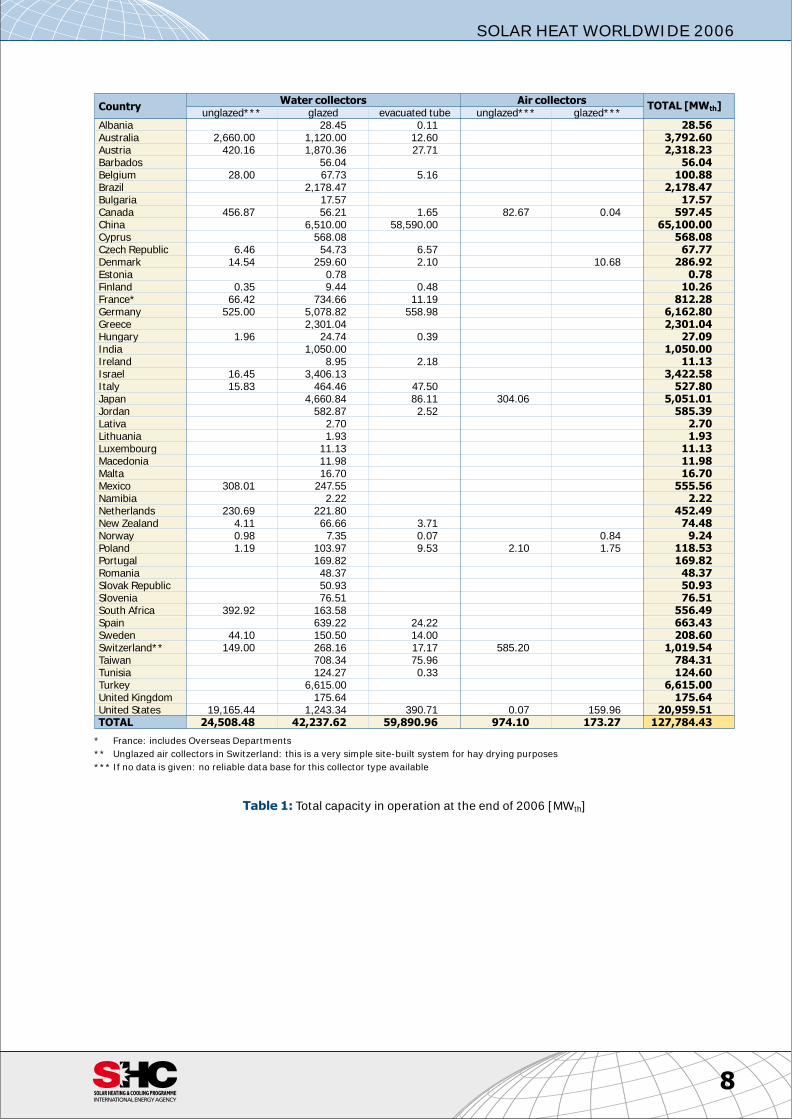
As shown in Ta ble 1, the to tal ca pac ity is di vided into 42.2 GWth glazed flat-plate col lec tors (60.3 mil lion square me -
ters) and 59.9 GWth evac u ated tube col lec tors (85.6 mil lion square me ters), 24.5 GWth un glazed col lec tors (35.0 mil -
lion square me ters) and 1.2 GWth glazed and un glazed air col lec tors (1.6 mil lion square me ters). The dis tri bu tion of
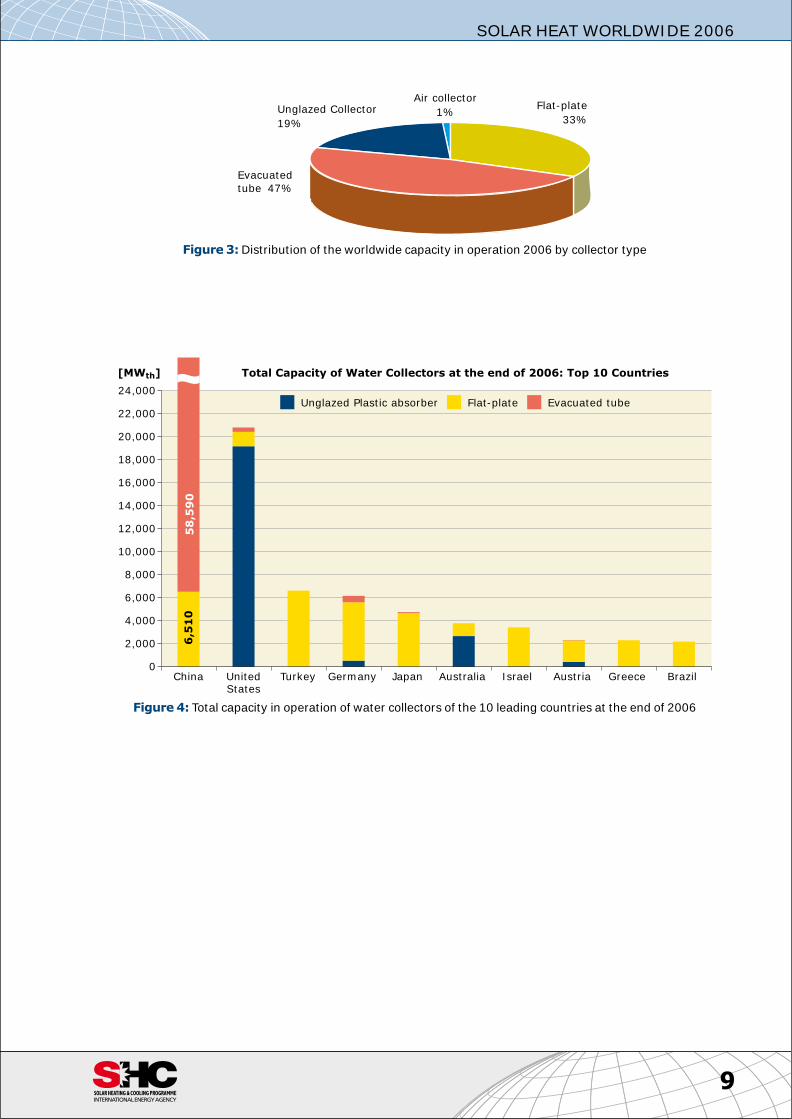
the to tal ca pac ity world wide in 2006 can also be seen in Fig ure 3.
Fig ure 4 gives a quick over view of the 10 lead ing coun tries based on to tal ca pac i ties in 2006. This Fig ure clearly
shows how the dif fer ent types of col lec tors are ap plied in the dif fer ent coun tries. China, as world leader in to tal ca pac -
ity, is fo cus sing very much on evac u ated tube col lec tors, whereas the USA is hold ing the sec ond po si tion due to its
high in stal la tions of un glazed col lec tors. Only in Aus tra lia is the un glazed col lec tor as im por tant as it is in the USA. The
rest of the top 10 coun tries are clearly focussing on the flat-plate collector.
This re port aims to give the ac tu ally col lec tor area that is still in op er a tion and not the cu mu lated col lec tor area that
has ever been in stalled in a coun try. The rea son for this be ing that there is al ways a cer tain amount of col lec tors re -
placed by new sys tems or even taken out of op er a tion. This ex plains the fact that in some coun tries—such as Ja -
pan—the to tal ca pac ity pub lished in this re port for 2006 de creased com pared to the data pub lished for 2005 in the
previous report.
To de ter mine the col lec tor area (re spec tively ca pac ity) in op er a tion, ei ther of fi cial coun try re ports on the life time base
were taken into ac count or, if such re ports were not avail able, a 25-year life time for a sys tem was cal cu lated. The col -
lec tor area in op er a tion was then cal cu lated with a linear equation.
It must be stated that data of in stalled un glazed col lec tors are of fi cially col lected in just a few coun tries. So if there is
no data given for this col lec tor type for a coun try, it means there was no re li able data avail able. This also ap plies for
glazed and un glazed air collectors.
In Chap ter 5 col lec tor yields, en ergy sav ings and the con tri bu tion to the CO2 re duc tion is cal cu lated based on the to -
tal col lec tor area in op er a tion in each country. [[Tab le01.txt]]t01
7
SOLAR HEAT WORLDWIDE 2006
8
SOLAR HEAT WORLDWIDE 2006
Coun tryWa ter col lec tors Air col lec tors
TOTAL [MWth]un glazed*** glazed evac u ated tube un glazed*** glazed***
Al ba nia 28.45 0.11 28.56Aus tra lia 2,660.00 1,120.00 12.60 3,792.60Aus tria 420.16 1,870.36 27.71 2,318.23Bar ba dos 56.04 56.04Bel gium 28.00 67.73 5.16 100.88Brazil 2,178.47 2,178.47Bul garia 17.57 17.57Can ada 456.87 56.21 1.65 82.67 0.04 597.45China 6,510.00 58,590.00 65,100.00Cy prus 568.08 568.08Czech Re pub lic 6.46 54.73 6.57 67.77Den mark 14.54 259.60 2.10 10.68 286.92Es to nia 0.78 0.78Fin land 0.35 9.44 0.48 10.26France* 66.42 734.66 11.19 812.28Ger many 525.00 5,078.82 558.98 6,162.80Greece 2,301.04 2,301.04Hun gary 1.96 24.74 0.39 27.09In dia 1,050.00 1,050.00Ire land 8.95 2.18 11.13Is rael 16.45 3,406.13 3,422.58It aly 15.83 464.46 47.50 527.80Ja pan 4,660.84 86.11 304.06 5,051.01Jor dan 582.87 2.52 585.39Lativa 2.70 2.70Lith u a nia 1.93 1.93Lux em bourg 11.13 11.13Mac e do nia 11.98 11.98Malta 16.70 16.70Mex ico 308.01 247.55 555.56Namibia 2.22 2.22Neth er lands 230.69 221.80 452.49New Zea land 4.11 66.66 3.71 74.48Nor way 0.98 7.35 0.07 0.84 9.24Po land 1.19 103.97 9.53 2.10 1.75 118.53Por tu gal 169.82 169.82Ro ma nia 48.37 48.37Slo vak Re pub lic 50.93 50.93Slovenia 76.51 76.51South Af rica 392.92 163.58 556.49Spain 639.22 24.22 663.43Swe den 44.10 150.50 14.00 208.60Swit zer land** 149.00 268.16 17.17 585.20 1,019.54Tai wan 708.34 75.96 784.31Tu ni sia 124.27 0.33 124.60Tur key 6,615.00 6,615.00United King dom 175.64 175.64United States 19,165.44 1,243.34 390.71 0.07 159.96 20,959.51TOTAL 24,508.48 42,237.62 59,890.96 974.10 173.27 127,784.43
* France: in cludes Over seas De part ments
** Un glazed air col lec tors in Swit zer land: this is a very sim ple site-built sys tem for hay dry ing pur poses
*** If no data is given: no re li able data base for this col lec tor type avail able
Ta ble 1: To tal ca pac ity in op er a tion at the end of 2006 [MWth]
[[Bil der\a03.prn]]a03
[[Bil der\a04.prn]]a04
9
SOLAR HEAT WORLDWIDE 2006
Evacuatedtube 47%
Unglazed Collector
19%
Air collector
1%Flat-plate
33%
Fig ure 3: Dis tri bu tion of the world wide ca pac ity in op er a tion 2006 by col lec tor type
Total Capacity of Water Collectors at the end of 2006: Top 10 Countries
6,5
10
58
,59
0
0
2,000
4,000
6,000
8,000
10,000
12,000
14,000
16,000
18,000
20,000
22,000
24,000
China UnitedStates
Turkey Germany Japan Australia Israel Austria Greece Brazil
[MW ]th
Unglazed Plastic absorber Flat-plate Evacuated tube
Fig ure 4: To tal ca pac ity in op er a tion of wa ter col lec tors of the 10 lead ing coun tries at the end of 2006
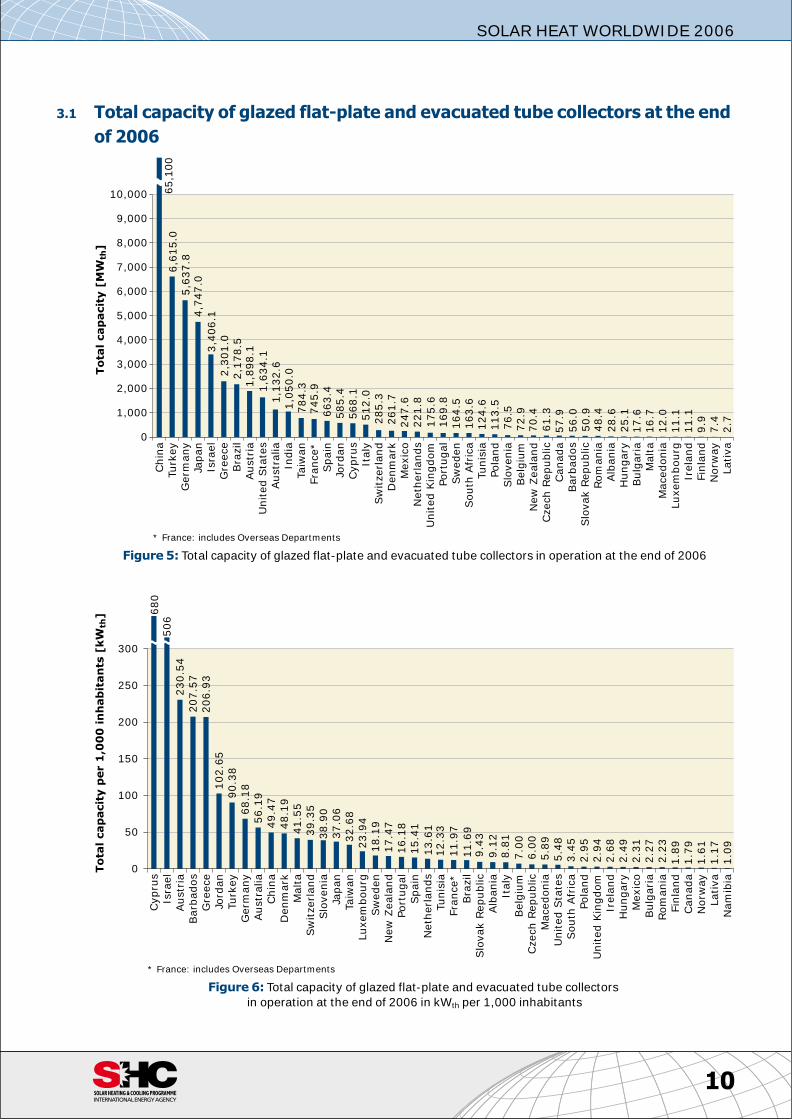
3.1 To tal ca pac ity of glazed flat-plate and evac u ated tube col lec tors at the end
of 2006[[Bil der\a05.prn]]a05[[Bil der\a06.prn]]a06
10
SOLAR HEAT WORLDWIDE 2006
17.6
16.7
12.0
11.1
11.1
9.9
7.4
2.7113.5
124.6
163.6
76.5
72.9
70.4
61.3
57.9
56.0
50.9
48.4
28.6
25.1
164.5
175.6
169.8
221.8
247.6
261.7
285.3
512.0
568.1
585.4
663.4
745.9
784.3
1,0
50.0
1,1
32.6
1,6
34.1
1,8
98.1
2,1
78.5
2,3
01.0
3,4
06.14
,747.0
5,6
37.8
6,6
15.0
0
1,000
2,000
3,000
4,000
5,000
6,000
7,000
8,000
9,000
10,000
To
tal cap
acit
y [
MW
]th
65,1
00
Chin
aTurk
ey
Germ
any
Japan
Isra
el
Gre
ece
Bra
zil
Austr
iaU
nited S
tate
sAustr
alia
India
Taiw
an
Fra
nce*
Spain
Jord
an
Cypru
sIt
aly
Sw
itzerland
Denm
ark
Mexic
oN
eth
erlands
United K
ingdom
Port
ugal
Sw
eden
South
Afr
ica
Tunis
iaPola
nd
Slo
venia
Belg
ium
New
Zeala
nd
Czech R
epublic
Canada
Barb
ados
Slo
vak R
epublic
Rom
ania
Alb
ania
Hungary
Bulg
aria
Malta
Macedonia
Luxem
bourg
Irela
nd
Fin
land
Norw
ay
Lativa
* France: in cludes Over seas De part ments
Fig ure 5: To tal ca pac ity of glazed flat-plate and evac u ated tube col lec tors in op er a tion at the end of 2006
1.8
91.7
91.6
11.1
71.0
9
2.2
32.2
72.3
12.4
92.6
82.9
42.9
53.4
55.4
85.8
96.0
07.0
0
8.8
19.1
2
9.4
311.6
9
11.9
7
12.3
313.6
1
15.4
116.1
817.4
718.1
923.9
432.6
837.0
638.9
039.3
541.5
548.1
949.4
756.1
968.1
890.3
8102.6
5206.9
3207.5
7
506
680
230.5
4
0
50
100
150
200
250
300
To
tal
cap
acit
y p
er
1,0
00
in
hab
itan
ts [
kW
]th
Cypru
sIs
rael
Austr
iaBarb
ados
Gre
ece
Jord
an
Turk
ey
Germ
any
Austr
alia
Chin
aD
enm
ark
Malta
Sw
itzerland
Slo
venia
Japan
Taiw
an
Luxem
bourg
Sw
eden
New
Zeala
nd
Port
ugal
Spain
Neth
erlands
Tunis
iaFra
nce*
Bra
zil
Slo
vak R
epublic
Alb
ania
Italy
Belg
ium
Czech R
epublic
Macedonia
United S
tate
sSouth
Afr
ica
Pola
nd
United K
ingdom
Irela
nd
Hungary
Mexic
oBulg
aria
Rom
ania
Fin
land
Canada
Norw
ay
Lativa
Nam
ibia
* France: in cludes Over seas De part ments
Fig ure 6: To tal ca pac ity of glazed flat-plate and evac u ated tube col lec tors
in op er a tion at the end of 2006 in kWth per 1,000 in hab it ants
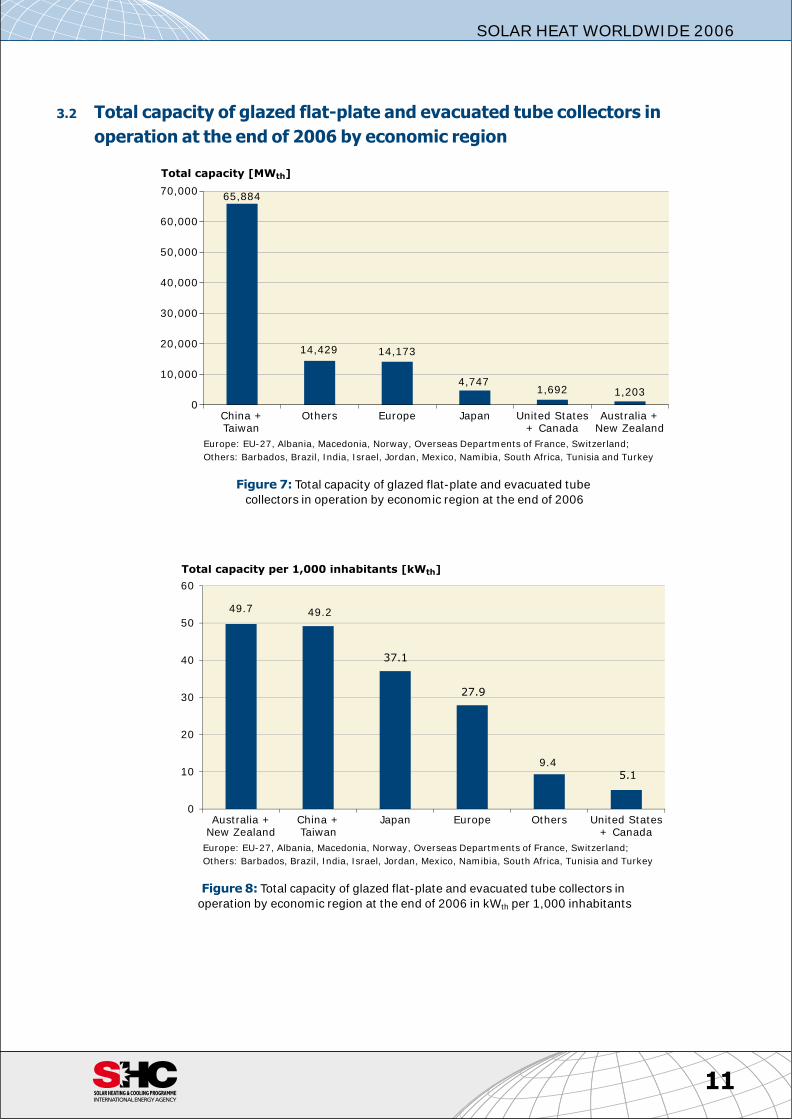
3.2 To tal ca pac ity of glazed flat-plate and evac u ated tube col lec tors in
operation at the end of 2006 by eco nomic region[[Bil der\a07.prn]]a07[[Bil der\a08.prn]]a08
11
SOLAR HEAT WORLDWIDE 2006
65,884
1,2031,692
14,429
4,747
14,173
0
10,000
20,000
30,000
40,000
50,000
60,000
70,000
China +Taiwan
Others Europe Japan United States+ Canada
Australia +New Zealand
Total capacity [MW ]th
Eu rope: EU-27, Al ba nia, Mac e do nia, Nor way, Over seas De part ments of France, Swit zer land;
Oth ers: Bar ba dos, Brazil, In dia, Is rael, Jor dan, Mex ico, Namibia, South Af rica, Tu ni sia and Tur key
Fig ure 7: To tal ca pac ity of glazed flat-plate and evac u ated tube
col lec tors in op er a tion by eco nomic re gion at the end of 2006
49.2
9.4
49.7
0
10
20
30
40
50
60
Australia +New Zealand
China +Taiwan
Japan Europe Others United States+ Canada
Total capacity per 1,000 inhabitants [kW ]th
Eu rope: EU-27, Al ba nia, Mac e do nia, Nor way, Over seas De part ments of France, Swit zer land;
Oth ers: Bar ba dos, Brazil, In dia, Is rael, Jor dan, Mex ico, Namibia, South Af rica, Tu ni sia and Tur key
Fig ure 8: To tal ca pac ity of glazed flat-plate and evac u ated tube col lec tors in
op er a tion by eco nomic re gion at the end of 2006 in kWth per 1,000 in hab it ants
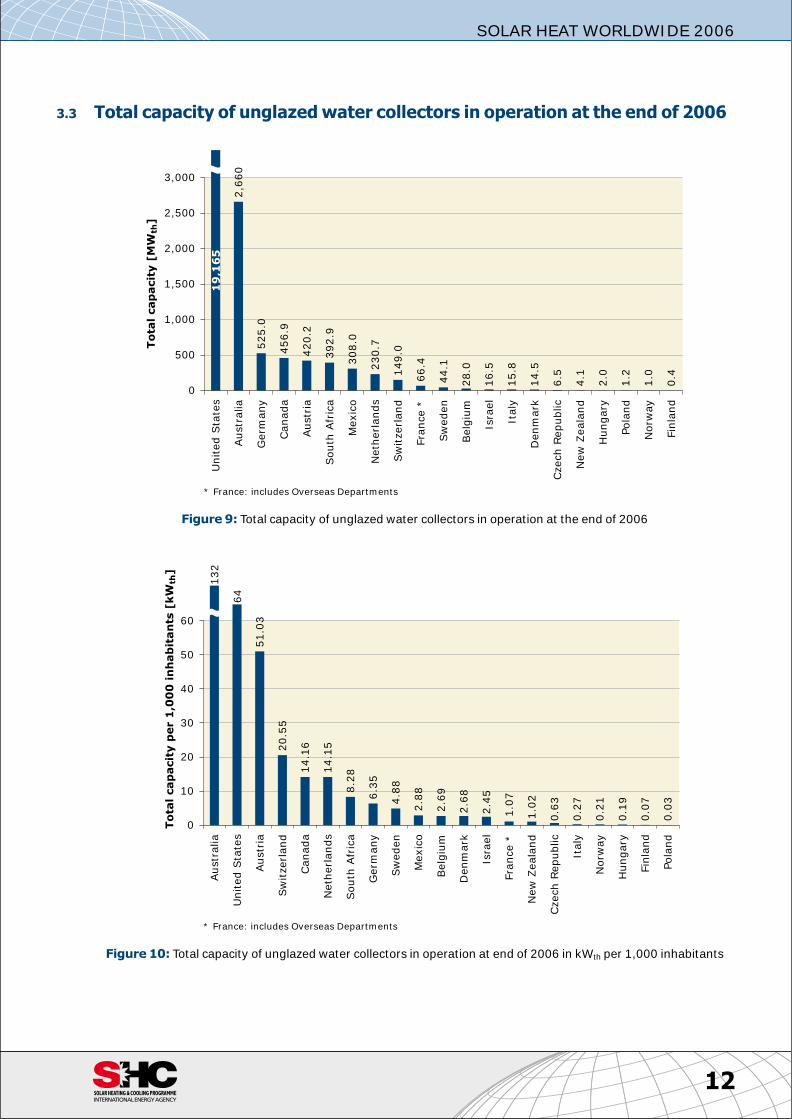
3.3 To tal ca pac ity of un glazed wa ter col lec tors in op er a tion at the end of 2006[[Bil der\a09.prn]]a09[[Bil der\a10.prn]]a10
12
SOLAR HEAT WORLDWIDE 2006
28.0
16.5
15.8
14.5
6.5
4.1
2.0
1.2
1.0
0.444.1
19
,16
5
2,6
60
525.0
456.9
420.2
392.9
308.0
230.7
149.0
66.4
0
500
1,000
1,500
2,000
2,500
3,000
United S
tate
s
Austr
alia
Germ
any
Canada
Austr
ia
South
Afr
ica
Mexic
o
Neth
erlands
Sw
itzerland
Fra
nce *
Sw
eden
Belg
ium
Isra
el
Italy
Denm
ark
Czech R
epublic
New
Zeala
nd
Hungary
Pola
nd
Norw
ay
Fin
land
To
tal
cap
acit
y [
MW
]th
* France: in cludes Over seas De part ments
Fig ure 9: To tal ca pac ity of un glazed wa ter col lec tors in op er a tion at the end of 2006
0.6
3
0.2
7
0.2
1
0.1
9
0.0
7
0.0
3
1.0
2
1.0
7
2.4
5
2.6
8
2.6
9
2.8
8
4.8
8
6.3
5
51.0
3
64
132
20.5
5
14.1
6
14.1
5
8.2
8
0
10
20
30
40
50
60
Austr
alia
United S
tate
s
Austr
ia
Sw
itzerland
Canada
Neth
erlands
South
Afr
ica
Germ
any
Sw
eden
Mexic
o
Belg
ium
Denm
ark
Isra
el
Fra
nce *
New
Zeala
nd
Czech R
epublic
Italy
Norw
ay
Hungary
Fin
land
Pola
nd
To
tal
cap
acit
y p
er
1,0
00
in
hab
itan
ts [
kW
]th
* France: in cludes Over seas De part ments
Fig ure 10: To tal ca pac ity of un glazed wa ter col lec tors in op er a tion at end of 2006 in kWth per 1,000 in hab it ants
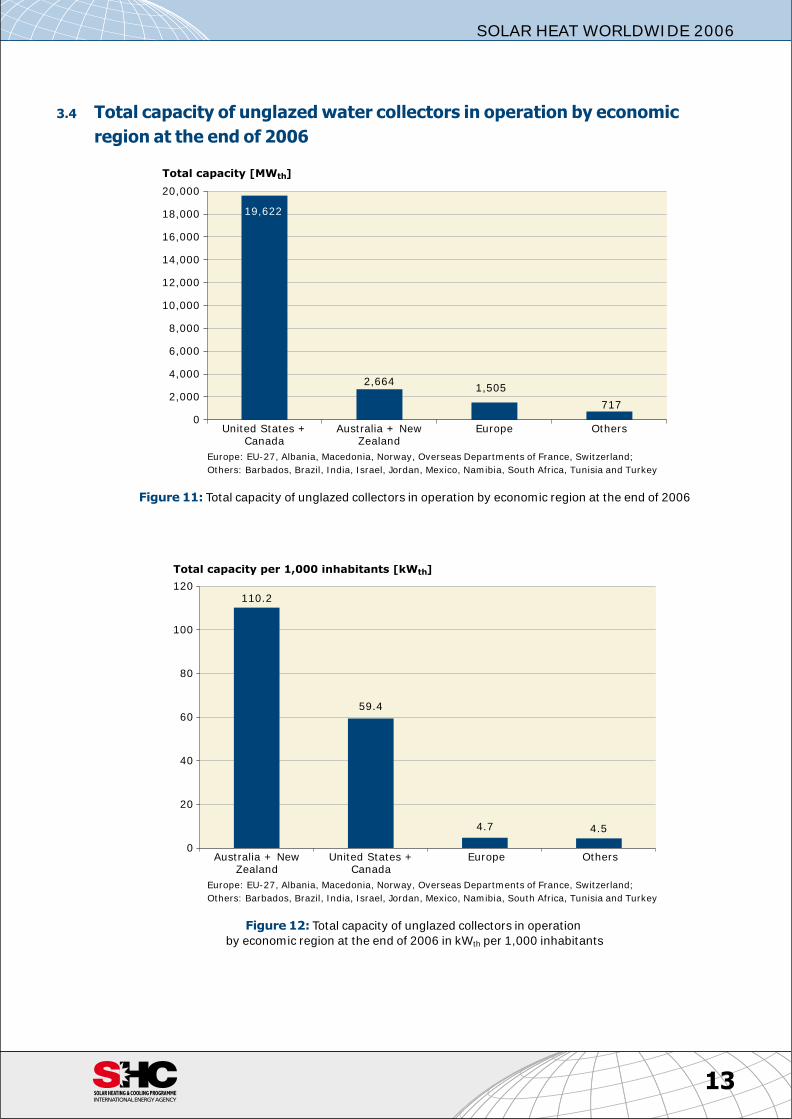
3.4 To tal ca pac ity of un glazed wa ter col lec tors in op er a tion by eco nomic
region at the end of 2006[[Bil der\a11.prn]]a11[[Bil der\a12.prn]]a12
13
SOLAR HEAT WORLDWIDE 2006
2,6641,505
19,622
717
0
2,000
4,000
6,000
8,000
10,000
12,000
14,000
16,000
18,000
20,000
United States +Canada
Australia + NewZealand
Europe Others
Total capacity [MW ]th
Eu rope: EU-27, Al ba nia, Mac e do nia, Nor way, Over seas De part ments of France, Swit zer land;
Oth ers: Bar ba dos, Brazil, In dia, Is rael, Jor dan, Mex ico, Namibia, South Af rica, Tu ni sia and Tur key
Fig ure 11: To tal ca pac ity of un glazed col lec tors in op er a tion by eco nomic re gion at the end of 2006
59.4
110.2
4.7 4.5
0
20
40
60
80
100
120
Australia + NewZealand
United States +Canada
Europe Others
Total capacity per 1,000 inhabitants [kW ]th
Eu rope: EU-27, Al ba nia, Mac e do nia, Nor way, Over seas De part ments of France, Swit zer land;
Oth ers: Bar ba dos, Brazil, In dia, Is rael, Jor dan, Mex ico, Namibia, South Af rica, Tu ni sia and Tur key
Fig ure 12: To tal ca pac ity of un glazed col lec tors in op er a tion
by eco nomic re gion at the end of 2006 in kWth per 1,000 in hab it ants
4 Mar ket de vel op ment
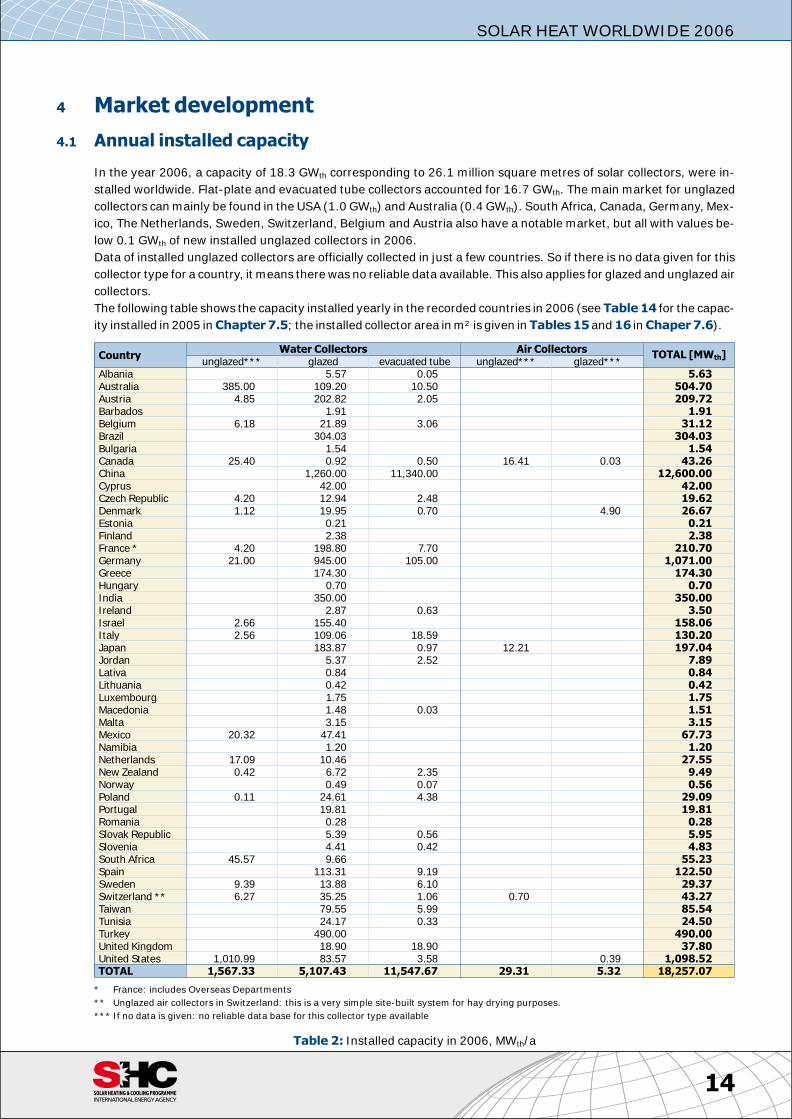
4.1 An nual in stalled ca pac ity
In the year 2006, a ca pac ity of 18.3 GWth cor re spond ing to 26.1 mil lion square metres of so lar col lec tors, were in -
stalled world wide. Flat-plate and evac u ated tube col lec tors ac counted for 16.7 GWth. The main mar ket for un glazed
col lec tors can mainly be found in the USA (1.0 GWth) and Aus tra lia (0.4 GWth). South Af rica, Can ada, Ger many, Mex -
ico, The Neth er lands, Swe den, Swit zer land, Bel gium and Aus tria also have a no ta ble mar ket, but all with val ues be -
low 0.1 GWth of new in stalled un glazed col lec tors in 2006.
Data of in stalled un glazed col lec tors are of fi cially col lected in just a few coun tries. So if there is no data given for this
col lec tor type for a coun try, it means there was no re li able data avail able. This also ap plies for glazed and un glazed air
col lec tors.
The fol low ing ta ble shows the ca pac ity in stalled yearly in the re corded coun tries in 2006 (see Ta ble 14 for the ca pac -
ity in stalled in 2005 in Chap ter 7.5; the in stalled col lec tor area in m² is given in Ta bles 15 and 16 in Chaper 7.6).[[Tab le02.txt]]t02
14
SOLAR HEAT WORLDWIDE 2006
Coun tryWa ter Col lec tors Air Col lec tors
TOTAL [MWth]un glazed*** glazed evac u ated tube un glazed*** glazed***
Al ba nia 5.57 0.05 5.63Aus tra lia 385.00 109.20 10.50 504.70Aus tria 4.85 202.82 2.05 209.72Bar ba dos 1.91 1.91Bel gium 6.18 21.89 3.06 31.12Brazil 304.03 304.03Bul garia 1.54 1.54Can ada 25.40 0.92 0.50 16.41 0.03 43.26China 1,260.00 11,340.00 12,600.00Cy prus 42.00 42.00Czech Re pub lic 4.20 12.94 2.48 19.62Den mark 1.12 19.95 0.70 4.90 26.67Es to nia 0.21 0.21Fin land 2.38 2.38France * 4.20 198.80 7.70 210.70Ger many 21.00 945.00 105.00 1,071.00Greece 174.30 174.30Hun gary 0.70 0.70In dia 350.00 350.00Ire land 2.87 0.63 3.50Is rael 2.66 155.40 158.06It aly 2.56 109.06 18.59 130.20Ja pan 183.87 0.97 12.21 197.04Jor dan 5.37 2.52 7.89Lativa 0.84 0.84Lith u a nia 0.42 0.42Lux em bourg 1.75 1.75Mac e do nia 1.48 0.03 1.51Malta 3.15 3.15Mex ico 20.32 47.41 67.73Namibia 1.20 1.20Neth er lands 17.09 10.46 27.55New Zea land 0.42 6.72 2.35 9.49Nor way 0.49 0.07 0.56Po land 0.11 24.61 4.38 29.09Por tu gal 19.81 19.81Ro ma nia 0.28 0.28Slo vak Re pub lic 5.39 0.56 5.95Slovenia 4.41 0.42 4.83South Af rica 45.57 9.66 55.23Spain 113.31 9.19 122.50Swe den 9.39 13.88 6.10 29.37Swit zer land ** 6.27 35.25 1.06 0.70 43.27Tai wan 79.55 5.99 85.54Tu ni sia 24.17 0.33 24.50Tur key 490.00 490.00United King dom 18.90 18.90 37.80United States 1,010.99 83.57 3.58 0.39 1,098.52TOTAL 1,567.33 5,107.43 11,547.67 29.31 5.32 18,257.07
* France: in cludes Over seas De part ments
** Un glazed air col lec tors in Swit zer land: this is a very sim ple site-built sys tem for hay dry ing pur poses.
*** If no data is given: no re li able data base for this col lec tor type avail able
Ta ble 2: In stalled ca pac ity in 2006, MWth/a
4.2 Mar ket de vel op ment of glazed flat-plate and evac u ated tube col lec tors by
eco nomic re gion
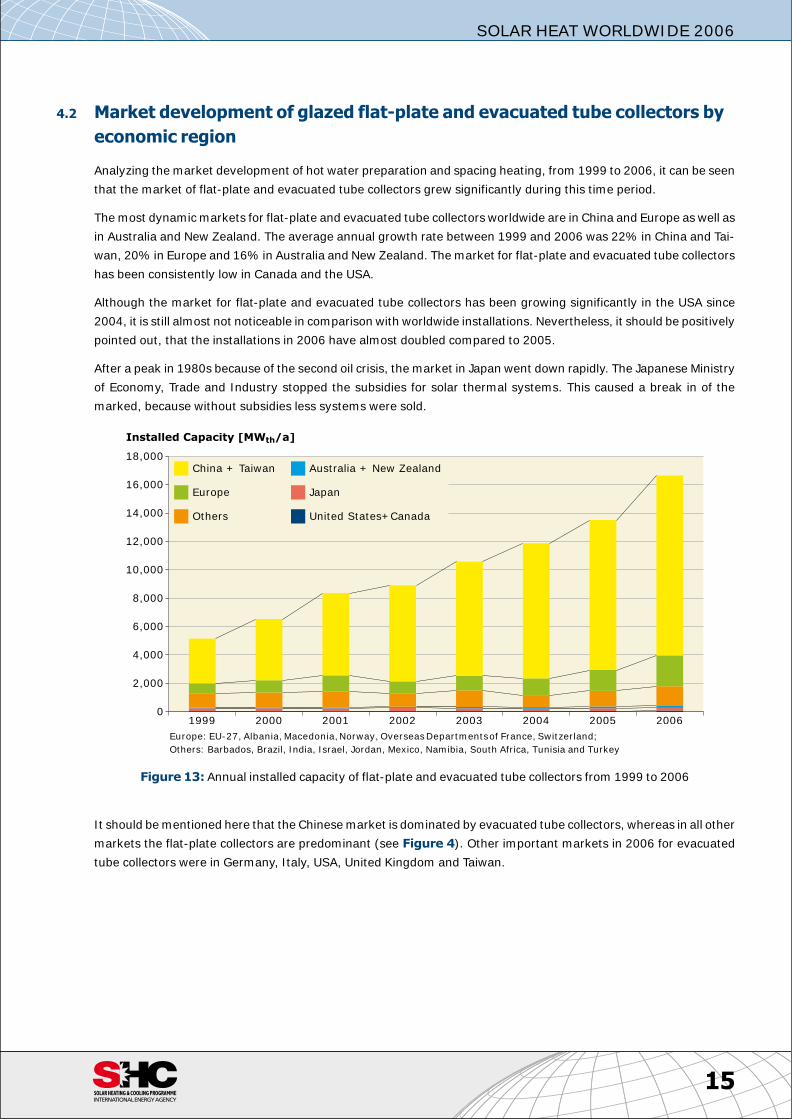
An a lyz ing the mar ket de vel op ment of hot wa ter prep a ra tion and spac ing heat ing, from 1999 to 2006, it can be seen
that the mar ket of flat-plate and evac u ated tube col lec tors grew sig nif i cantly dur ing this time pe riod.
The most dy namic mar kets for flat-plate and evac u ated tube col lec tors world wide are in China and Eu rope as well as
in Aus tra lia and New Zea land. The av er age an nual growth rate be tween 1999 and 2006 was 22% in China and Tai -
wan, 20% in Eu rope and 16% in Aus tra lia and New Zea land. The mar ket for flat-plate and evac u ated tube col lec tors
has been con sis tently low in Can ada and the USA.
Al though the mar ket for flat-plate and evac u ated tube col lec tors has been grow ing sig nif i cantly in the USA since
2004, it is still al most not no tice able in com par i son with world wide in stal la tions. Nev er the less, it should be pos i tively
pointed out, that the in stal la tions in 2006 have al most doubled compared to 2005.
Af ter a peak in 1980s be cause of the sec ond oil cri sis, the mar ket in Ja pan went down rap idly. The Jap a nese Min is try
of Econ omy, Trade and In dus try stopped the sub si dies for so lar ther mal sys tems. This caused a break in of the
marked, be cause with out sub si dies less systems were sold. [[Bil der\a13.prn]]a13
It should be men tioned here that the Chi nese mar ket is dom i nated by evac u ated tube col lec tors, whereas in all other
mar kets the flat-plate col lec tors are pre dom i nant (see Fig ure 4). Other im por tant mar kets in 2006 for evac u ated
tube col lec tors were in Ger many, It aly, USA, United King dom and Tai wan.
15
SOLAR HEAT WORLDWIDE 2006
0
2,000
4,000
6,000
8,000
10,000
12,000
14,000
16,000
18,000
1999 2000 2001 2002 2003 2004 2005 2006
Installed Capacity [MW /a]th
China + Taiwan
Europe
Others
Australia + New Zealand
Japan
United States+Canada
Eu rope: EU-27, Al ba nia, Mac e do nia, Nor way, Over seas De part ments of France, Swit zer land;
Oth ers: Bar ba dos, Brazil, In dia, Is rael, Jor dan, Mex ico, Namibia, South Af rica, Tu ni sia and Tur key
Fig ure 13: An nual in stalled ca pac ity of flat-plate and evac u ated tube col lec tors from 1999 to 2006
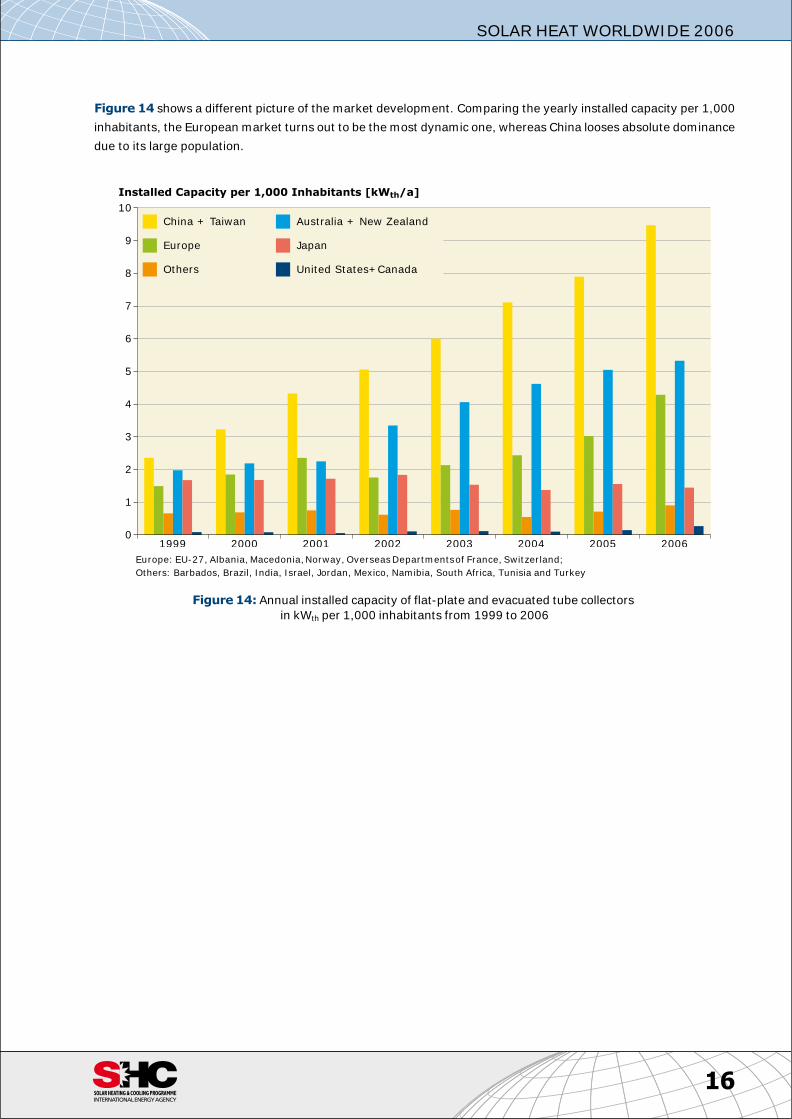
Fig ure 14 shows a dif fer ent pic ture of the mar ket de vel op ment. Com par ing the yearly in stalled ca pac ity per 1,000
in hab it ants, the Eu ro pean mar ket turns out to be the most dy namic one, whereas China looses ab so lute dom i nance
due to its large population. [[Bil der\Fig14.prn]]a14
16
SOLAR HEAT WORLDWIDE 2006
0
1
2
3
4
5
6
7
8
9
10
1999 2000 2001 2002 2003 2004 2005 2006
Installed Capacity per 1,000 Inhabitants [kW /a]th
China + Taiwan
Europe
Others
Australia + New Zealand
Japan
United States+Canada
Eu rope: EU-27, Al ba nia, Mac e do nia, Nor way, Over seas De part ments of France, Swit zer land;
Oth ers: Bar ba dos, Brazil, In dia, Is rael, Jor dan, Mex ico, Namibia, South Af rica, Tu ni sia and Tur key
Fig ure 14: An nual in stalled ca pac ity of flat-plate and evac u ated tube col lec tors
in kWth per 1,000 in hab it ants from 1999 to 2006
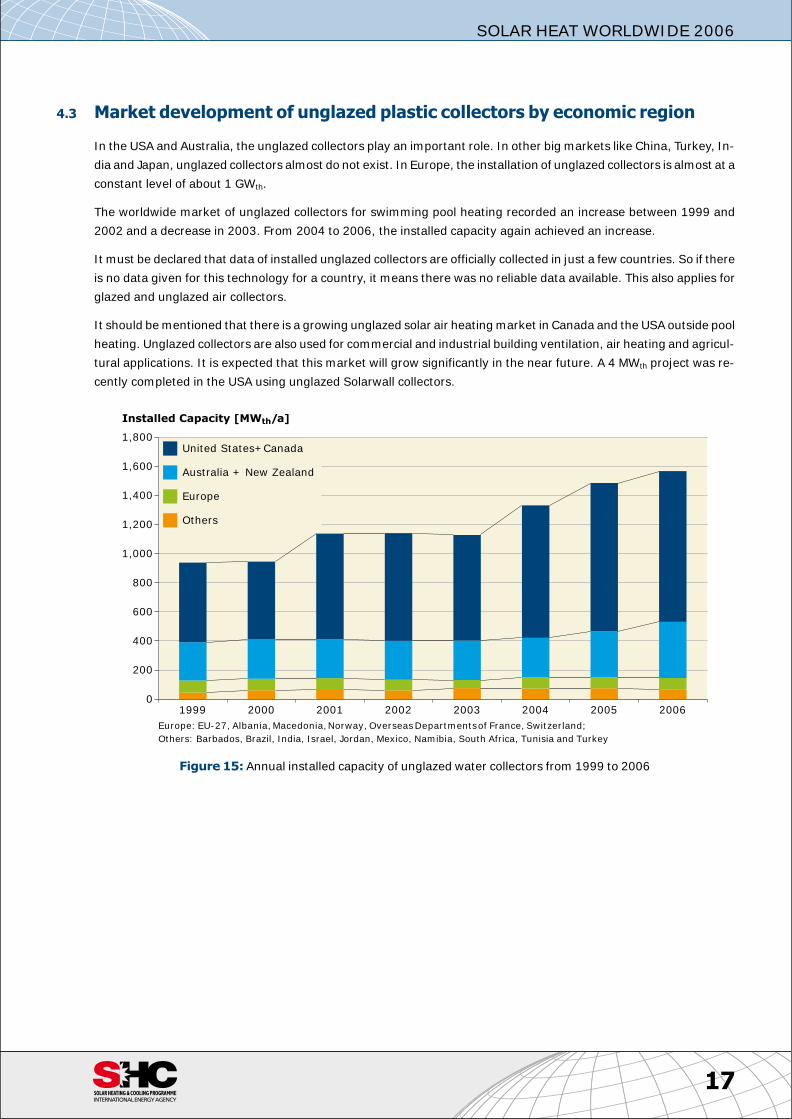
4.3 Mar ket de vel op ment of un glazed plas tic col lec tors by eco nomic re gion
In the USA and Aus tra lia, the un glazed col lec tors play an im por tant role. In other big mar kets like China, Tur key, In -
dia and Ja pan, un glazed col lec tors al most do not ex ist. In Eu rope, the in stal la tion of un glazed col lec tors is al most at a
con stant level of about 1 GWth.
The world wide mar ket of un glazed col lec tors for swim ming pool heat ing re corded an in crease be tween 1999 and
2002 and a de crease in 2003. From 2004 to 2006, the in stalled ca pac ity again achieved an increase.
It must be de clared that data of in stalled un glazed col lec tors are of fi cially col lected in just a few coun tries. So if there
is no data given for this tech nol ogy for a coun try, it means there was no re li able data avail able. This also ap plies for
glazed and un glazed air collectors.
It should be men tioned that there is a grow ing un glazed so lar air heat ing mar ket in Can ada and the USA out side pool
heat ing. Un glazed col lec tors are also used for com mer cial and in dus trial build ing ven ti la tion, air heat ing and ag ri cul -
tural ap pli ca tions. It is ex pected that this mar ket will grow sig nif i cantly in the near fu ture. A 4 MWth pro ject was re -
cently com pleted in the USA us ing unglazed Solarwall collectors. [[Bil der\Fig15.prn]]a15
17
SOLAR HEAT WORLDWIDE 2006
0
200
400
600
800
1,000
1,200
1,400
1,600
1,800
1999 2000 2001 2002 2003 2004 2005 2006
Installed Capacity [MW /a]th
United States+Canada
Australia + New Zealand
Europe
Others
Eu rope: EU-27, Al ba nia, Mac e do nia, Nor way, Over seas De part ments of France, Swit zer land;
Oth ers: Bar ba dos, Brazil, In dia, Is rael, Jor dan, Mex ico, Namibia, South Af rica, Tu ni sia and Tur key
Fig ure 15: An nual in stalled ca pac ity of un glazed wa ter col lec tors from 1999 to 2006
5 Con tri bu tion to the en ergy sup ply and CO2 re duc tion
In this sec tion, the con tri bu tion of in stalled wa ter col lec tors to the en ergy sup ply and CO2 re duc tion is shown. The
data for air col lec tor ap pli ca tions was in suf fi cient, there fore, the con tri bu tion of air col lec tors to the en ergy sup ply and
CO2 re duc tion was not calculated.
The ba sis for these cal cu la tions is the to tal col lec tor area in op er a tion in each coun try. As shown in Ta ble 1, a flat-
plate and evac u ated tube col lec tor ca pac ity of 102.1 GWth and an un glazed plas tic col lec tor ca pac ity of 24.5 GWth was
in stalled by the end of the year 2006 in the recorded countries.
The an nual yield of these col lec tors is cal cu lated to be 76,959 GWh (277,054 TJ). This cor re sponds to a cal cu lated oil
equiv a lent of 12.5 bil lion li ter and an an nual CO2 re duc tion of 34.1 mil lion tons of CO2 (Ta ble 3).
5.1 Ba sis for cal cu la tion
In or der to as cer tain the en ergy yield of ther mal so lar plants, the oil equiv a lent saved and the CO2 emis sions avoided,
the fol low ing pro ce dure was used:
• Only wa ter col lec tors were used for the cal cu la tions (un glazed, flat-plate and evac u ated tube col lec tors). Air col -
lec tor plants were not considered.
• For each coun try, the over all col lec tor area in stalled (wa ter col lec tors) was al lo cated to the four plant types:
• swim ming pool heat ing
• do mes tic hot wa ter sys tems for sin gle fam ily houses
• do mes tic hot wa ter sys tems for multi-fam ily houses and dis trict heat ing
• so lar combisystems for do mes tic hot wa ter and space heat ing
• Ref er ence plants were de fined for each coun try for each type of plant.
• The num ber of plants for each coun try was as cer tained from the share of col lec tor area for each plant type and the
col lec tor area per ref er ence system.
Ref er ence col lec tors and a ref er ence cli mate were de ter mined for each coun try apart from the ref er ence plants. On
the ba sis of these ref er ence con di tions sim u la tions were per formed with the sim u la tion pro gram T-Sol [T-Sol, Ver sion
4.2 Ex pert, dy namic sim u la tion pro gram to de sign and optimise so lar ther mal plants, Valentin Energiesoftware,
www.valentin.de] and in this way the so lar yields, en ergy sav ings and CO2 emis sions were as cer tained. The ref er -
ence con di tions, which formed the ba sis for the simulation, can be found in the appendix.
5.2 Re sults
The an nual col lec tor yield per square me ter of col lec tor area, de pend ing on the ap pli ca tion (do mes tic hot wa ter prep -
a ra tion, space heat ing, etc.), the lo cal cli ma tic con di tions and the plant dimensioning (high or low so lar frac tion), is
be tween 250 kWh/m² for so lar combisystems for hot wa ter prep a ra tion and space heat ing at high lat i tudes and
600 kWh/m² for plants used to pre pare hot wa ter low lat i tudes.
The en ergy sav ings were as cer tained from the en ergy equiv a lent of the fuel used and the rate of ef fi ciency of the aux -
il iary heat ing sys tem. For the aux il iary heat ing sys tem, oil was taken as the fuel for all plants and the en ergy equiv a -
lent per li ter of oil 36,700 kJ re spec tively 10.2 kWh was used in all coun tries in or der to achieve comparable results.
To ob tain an ex act state ment about the CO2 emis sions avoided, the sub sti tuted en ergy me dium would have to be as -
cer tained for each coun try. Since this could only be done in a very de tailed sur vey, which goes be yond the scope of
this re port, the en ergy sav ings and the CO2 emis sions avoided re late to oil. It is ob vi ous that not all so lar ther mal sys -
tems world wide just re place sys tems run ning on oil. This rep re sents a sim pli fi ca tion since gas, coal, bio mass or elec -
tric ity can be used as the en ergy source for the aux il iary heating system instead of oil.
18
SOLAR HEAT WORLDWIDE 2006
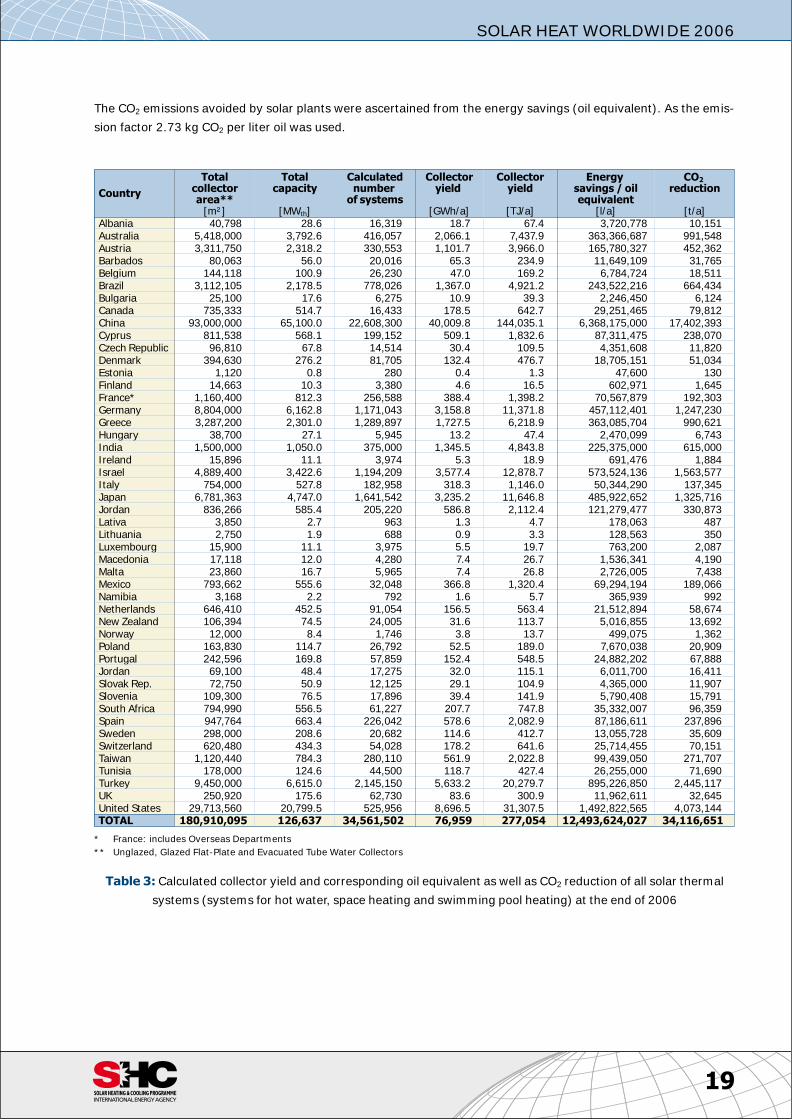
The CO2 emis sions avoided by so lar plants were as cer tained from the en ergy sav ings (oil equiv a lent). As the emis -
sion fac tor 2.73 kg CO2 per li ter oil was used. [[Tab le03.txt]]t03
19
SOLAR HEAT WORLDWIDE 2006
Coun try
To talcol lec torarea**
[m²]
To talca pac ity
[MWth]
Cal cu latednum ber
of sys tems
Col lec toryield
[GWh/a]
Col lec toryield
[TJ/a]
En ergy sav ings / oilequiv a lent
[l/a]
CO2 re duc tion
[t/a]Al ba nia 40,798 28.6 16,319 18.7 67.4 3,720,778 10,151Aus tra lia 5,418,000 3,792.6 416,057 2,066.1 7,437.9 363,366,687 991,548Aus tria 3,311,750 2,318.2 330,553 1,101.7 3,966.0 165,780,327 452,362Bar ba dos 80,063 56.0 20,016 65.3 234.9 11,649,109 31,765Bel gium 144,118 100.9 26,230 47.0 169.2 6,784,724 18,511Brazil 3,112,105 2,178.5 778,026 1,367.0 4,921.2 243,522,216 664,434Bul garia 25,100 17.6 6,275 10.9 39.3 2,246,450 6,124Can ada 735,333 514.7 16,433 178.5 642.7 29,251,465 79,812China 93,000,000 65,100.0 22,608,300 40,009.8 144,035.1 6,368,175,000 17,402,393Cy prus 811,538 568.1 199,152 509.1 1,832.6 87,311,475 238,070Czech Re pub lic 96,810 67.8 14,514 30.4 109.5 4,351,608 11,820Den mark 394,630 276.2 81,705 132.4 476.7 18,705,151 51,034Es to nia 1,120 0.8 280 0.4 1.3 47,600 130Fin land 14,663 10.3 3,380 4.6 16.5 602,971 1,645France* 1,160,400 812.3 256,588 388.4 1,398.2 70,567,879 192,303Ger many 8,804,000 6,162.8 1,171,043 3,158.8 11,371.8 457,112,401 1,247,230Greece 3,287,200 2,301.0 1,289,897 1,727.5 6,218.9 363,085,704 990,621Hun gary 38,700 27.1 5,945 13.2 47.4 2,470,099 6,743In dia 1,500,000 1,050.0 375,000 1,345.5 4,843.8 225,375,000 615,000Ire land 15,896 11.1 3,974 5.3 18.9 691,476 1,884Is rael 4,889,400 3,422.6 1,194,209 3,577.4 12,878.7 573,524,136 1,563,577It aly 754,000 527.8 182,958 318.3 1,146.0 50,344,290 137,345Ja pan 6,781,363 4,747.0 1,641,542 3,235.2 11,646.8 485,922,652 1,325,716Jor dan 836,266 585.4 205,220 586.8 2,112.4 121,279,477 330,873Lativa 3,850 2.7 963 1.3 4.7 178,063 487Lith u a nia 2,750 1.9 688 0.9 3.3 128,563 350Lux em bourg 15,900 11.1 3,975 5.5 19.7 763,200 2,087Mac e do nia 17,118 12.0 4,280 7.4 26.7 1,536,341 4,190Malta 23,860 16.7 5,965 7.4 26.8 2,726,005 7,438Mex ico 793,662 555.6 32,048 366.8 1,320.4 69,294,194 189,066Namibia 3,168 2.2 792 1.6 5.7 365,939 992Neth er lands 646,410 452.5 91,054 156.5 563.4 21,512,894 58,674New Zea land 106,394 74.5 24,005 31.6 113.7 5,016,855 13,692Nor way 12,000 8.4 1,746 3.8 13.7 499,075 1,362Po land 163,830 114.7 26,792 52.5 189.0 7,670,038 20,909Por tu gal 242,596 169.8 57,859 152.4 548.5 24,882,202 67,888Jor dan 69,100 48.4 17,275 32.0 115.1 6,011,700 16,411Slo vak Rep. 72,750 50.9 12,125 29.1 104.9 4,365,000 11,907Slovenia 109,300 76.5 17,896 39.4 141.9 5,790,408 15,791South Af rica 794,990 556.5 61,227 207.7 747.8 35,332,007 96,359Spain 947,764 663.4 226,042 578.6 2,082.9 87,186,611 237,896Swe den 298,000 208.6 20,682 114.6 412.7 13,055,728 35,609Swit zer land 620,480 434.3 54,028 178.2 641.6 25,714,455 70,151Tai wan 1,120,440 784.3 280,110 561.9 2,022.8 99,439,050 271,707Tu ni sia 178,000 124.6 44,500 118.7 427.4 26,255,000 71,690Tur key 9,450,000 6,615.0 2,145,150 5,633.2 20,279.7 895,226,850 2,445,117UK 250,920 175.6 62,730 83.6 300.9 11,962,611 32,645United States 29,713,560 20,799.5 525,956 8,696.5 31,307.5 1,492,822,565 4,073,144TOTAL 180,910,095 126,637 34,561,502 76,959 277,054 12,493,624,027 34,116,651
* France: in cludes Over seas De part ments
** Un glazed, Glazed Flat-Plate and Evac u ated Tube Wa ter Col lec tors
Ta ble 3: Cal cu lated col lec tor yield and cor re spond ing oil equiv a lent as well as CO2 re duc tion of all so lar ther mal
sys tems (sys tems for hot wa ter, space heat ing and swim ming pool heat ing) at the end of 2006
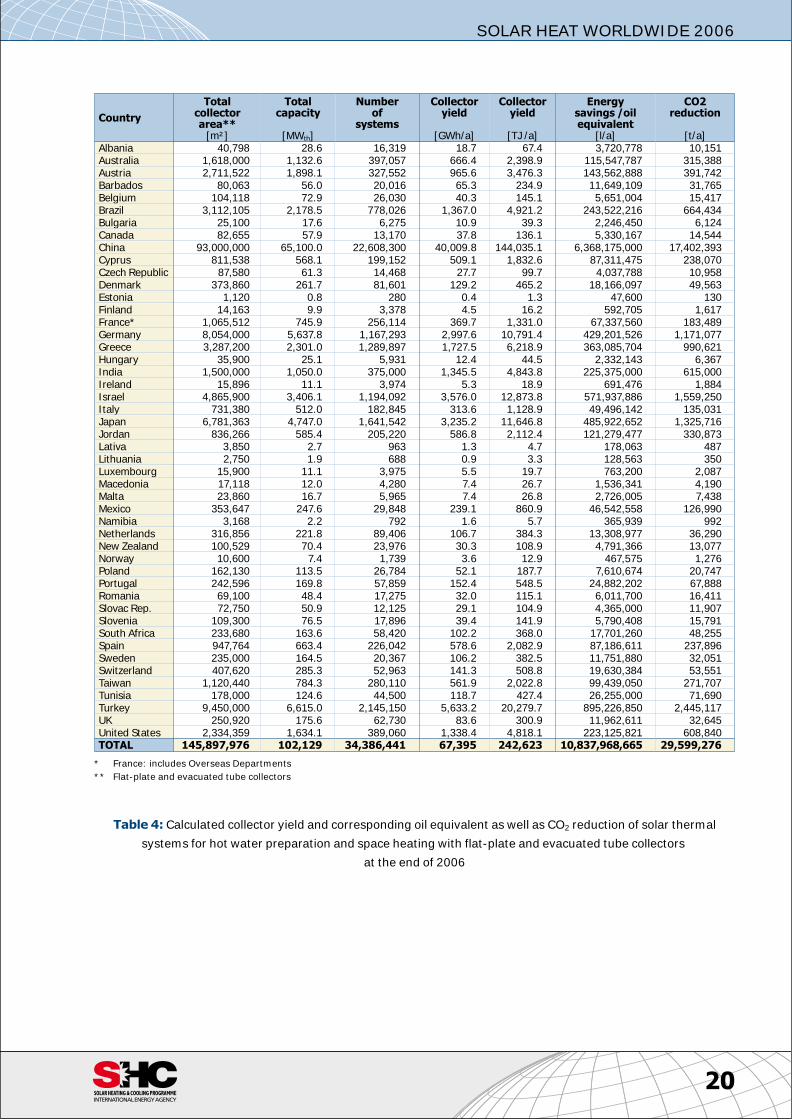
[[Tab le04.txt]]t04
20
SOLAR HEAT WORLDWIDE 2006
Coun try
To talcol lec torarea**
[m²]
To talca pac ity
[MWth]
Num berof
sys tems
Col lec toryield
[GWh/a]
Col lec toryield
[TJ /a]
En ergysav ings /oilequiv a lent
[l/a]
CO2re duc tion
[t/a]Al ba nia 40,798 28.6 16,319 18.7 67.4 3,720,778 10,151Aus tra lia 1,618,000 1,132.6 397,057 666.4 2,398.9 115,547,787 315,388Aus tria 2,711,522 1,898.1 327,552 965.6 3,476.3 143,562,888 391,742Bar ba dos 80,063 56.0 20,016 65.3 234.9 11,649,109 31,765Bel gium 104,118 72.9 26,030 40.3 145.1 5,651,004 15,417Brazil 3,112,105 2,178.5 778,026 1,367.0 4,921.2 243,522,216 664,434Bul garia 25,100 17.6 6,275 10.9 39.3 2,246,450 6,124Can ada 82,655 57.9 13,170 37.8 136.1 5,330,167 14,544China 93,000,000 65,100.0 22,608,300 40,009.8 144,035.1 6,368,175,000 17,402,393Cy prus 811,538 568.1 199,152 509.1 1,832.6 87,311,475 238,070Czech Re pub lic 87,580 61.3 14,468 27.7 99.7 4,037,788 10,958Den mark 373,860 261.7 81,601 129.2 465.2 18,166,097 49,563Es to nia 1,120 0.8 280 0.4 1.3 47,600 130Fin land 14,163 9.9 3,378 4.5 16.2 592,705 1,617France* 1,065,512 745.9 256,114 369.7 1,331.0 67,337,560 183,489Ger many 8,054,000 5,637.8 1,167,293 2,997.6 10,791.4 429,201,526 1,171,077Greece 3,287,200 2,301.0 1,289,897 1,727.5 6,218.9 363,085,704 990,621Hun gary 35,900 25.1 5,931 12.4 44.5 2,332,143 6,367In dia 1,500,000 1,050.0 375,000 1,345.5 4,843.8 225,375,000 615,000Ire land 15,896 11.1 3,974 5.3 18.9 691,476 1,884Is rael 4,865,900 3,406.1 1,194,092 3,576.0 12,873.8 571,937,886 1,559,250It aly 731,380 512.0 182,845 313.6 1,128.9 49,496,142 135,031Ja pan 6,781,363 4,747.0 1,641,542 3,235.2 11,646.8 485,922,652 1,325,716Jor dan 836,266 585.4 205,220 586.8 2,112.4 121,279,477 330,873Lativa 3,850 2.7 963 1.3 4.7 178,063 487Lith u a nia 2,750 1.9 688 0.9 3.3 128,563 350Lux em bourg 15,900 11.1 3,975 5.5 19.7 763,200 2,087Mac e do nia 17,118 12.0 4,280 7.4 26.7 1,536,341 4,190Malta 23,860 16.7 5,965 7.4 26.8 2,726,005 7,438Mex ico 353,647 247.6 29,848 239.1 860.9 46,542,558 126,990Namibia 3,168 2.2 792 1.6 5.7 365,939 992Neth er lands 316,856 221.8 89,406 106.7 384.3 13,308,977 36,290New Zea land 100,529 70.4 23,976 30.3 108.9 4,791,366 13,077Nor way 10,600 7.4 1,739 3.6 12.9 467,575 1,276Po land 162,130 113.5 26,784 52.1 187.7 7,610,674 20,747Por tu gal 242,596 169.8 57,859 152.4 548.5 24,882,202 67,888Ro ma nia 69,100 48.4 17,275 32.0 115.1 6,011,700 16,411Slovac Rep. 72,750 50.9 12,125 29.1 104.9 4,365,000 11,907Slovenia 109,300 76.5 17,896 39.4 141.9 5,790,408 15,791South Af rica 233,680 163.6 58,420 102.2 368.0 17,701,260 48,255Spain 947,764 663.4 226,042 578.6 2,082.9 87,186,611 237,896Swe den 235,000 164.5 20,367 106.2 382.5 11,751,880 32,051Swit zer land 407,620 285.3 52,963 141.3 508.8 19,630,384 53,551Tai wan 1,120,440 784.3 280,110 561.9 2,022.8 99,439,050 271,707Tu ni sia 178,000 124.6 44,500 118.7 427.4 26,255,000 71,690Tur key 9,450,000 6,615.0 2,145,150 5,633.2 20,279.7 895,226,850 2,445,117UK 250,920 175.6 62,730 83.6 300.9 11,962,611 32,645United States 2,334,359 1,634.1 389,060 1,338.4 4,818.1 223,125,821 608,840TOTAL 145,897,976 102,129 34,386,441 67,395 242,623 10,837,968,665 29,599,276
* France: in cludes Over seas De part ments
** Flat-plate and evac u ated tube col lec tors
Ta ble 4: Cal cu lated col lec tor yield and cor re spond ing oil equiv a lent as well as CO2 re duc tion of so lar ther mal
systems for hot wa ter prep a ra tion and space heat ing with flat-plate and evac u ated tube col lec tors
at the end of 2006
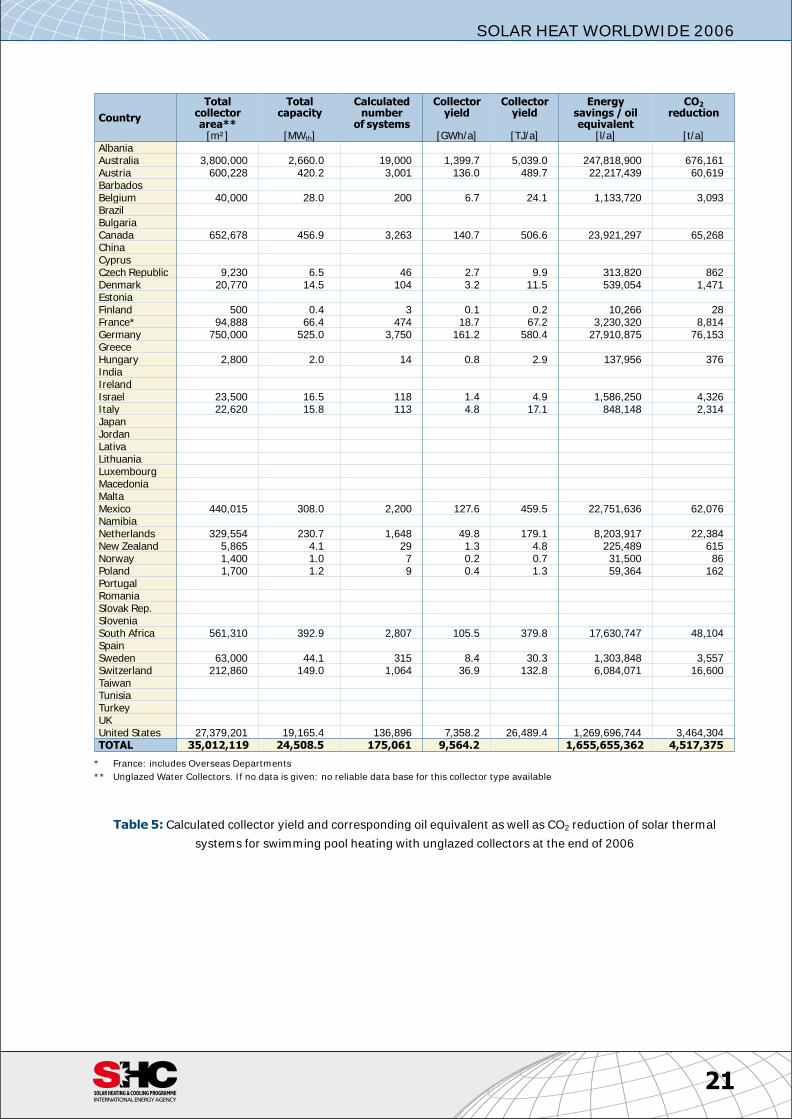
[[Tab le05.txt]]t05
21
SOLAR HEAT WORLDWIDE 2006
Coun try
To talcol lec torarea**
[m²]
To talca pac ity
[MWth]
Cal cu latednum ber
of sys tems
Col lec toryield
[GWh/a]
Col lec toryield
[TJ/a]
En ergysav ings / oilequiv a lent
[l/a]
CO2
re duc tion
[t/a]Al ba niaAus tra lia 3,800,000 2,660.0 19,000 1,399.7 5,039.0 247,818,900 676,161Aus tria 600,228 420.2 3,001 136.0 489.7 22,217,439 60,619Bar ba dosBel gium 40,000 28.0 200 6.7 24.1 1,133,720 3,093BrazilBul gariaCan ada 652,678 456.9 3,263 140.7 506.6 23,921,297 65,268ChinaCy prusCzech Re pub lic 9,230 6.5 46 2.7 9.9 313,820 862Den mark 20,770 14.5 104 3.2 11.5 539,054 1,471Es to niaFin land 500 0.4 3 0.1 0.2 10,266 28France* 94,888 66.4 474 18.7 67.2 3,230,320 8,814Ger many 750,000 525.0 3,750 161.2 580.4 27,910,875 76,153GreeceHun gary 2,800 2.0 14 0.8 2.9 137,956 376In diaIre landIs rael 23,500 16.5 118 1.4 4.9 1,586,250 4,326It aly 22,620 15.8 113 4.8 17.1 848,148 2,314Ja panJor danLativaLith u a niaLux em bourgMac e do niaMaltaMex ico 440,015 308.0 2,200 127.6 459.5 22,751,636 62,076NamibiaNeth er lands 329,554 230.7 1,648 49.8 179.1 8,203,917 22,384New Zea land 5,865 4.1 29 1.3 4.8 225,489 615Nor way 1,400 1.0 7 0.2 0.7 31,500 86Po land 1,700 1.2 9 0.4 1.3 59,364 162Por tu galRo ma niaSlo vak Rep.SloveniaSouth Af rica 561,310 392.9 2,807 105.5 379.8 17,630,747 48,104SpainSwe den 63,000 44.1 315 8.4 30.3 1,303,848 3,557Swit zer land 212,860 149.0 1,064 36.9 132.8 6,084,071 16,600Tai wanTu ni siaTur keyUKUnited States 27,379,201 19,165.4 136,896 7,358.2 26,489.4 1,269,696,744 3,464,304TOTAL 35,012,119 24,508.5 175,061 9,564.2 1,655,655,362 4,517,375
* France: in cludes Over seas De part ments
** Un glazed Wa ter Col lec tors. If no data is given: no re li able data base for this col lec tor type avail able
Ta ble 5: Cal cu lated col lec tor yield and cor re spond ing oil equiv a lent as well as CO2 re duc tion of so lar ther mal
systems for swim ming pool heat ing with un glazed col lec tors at the end of 2006
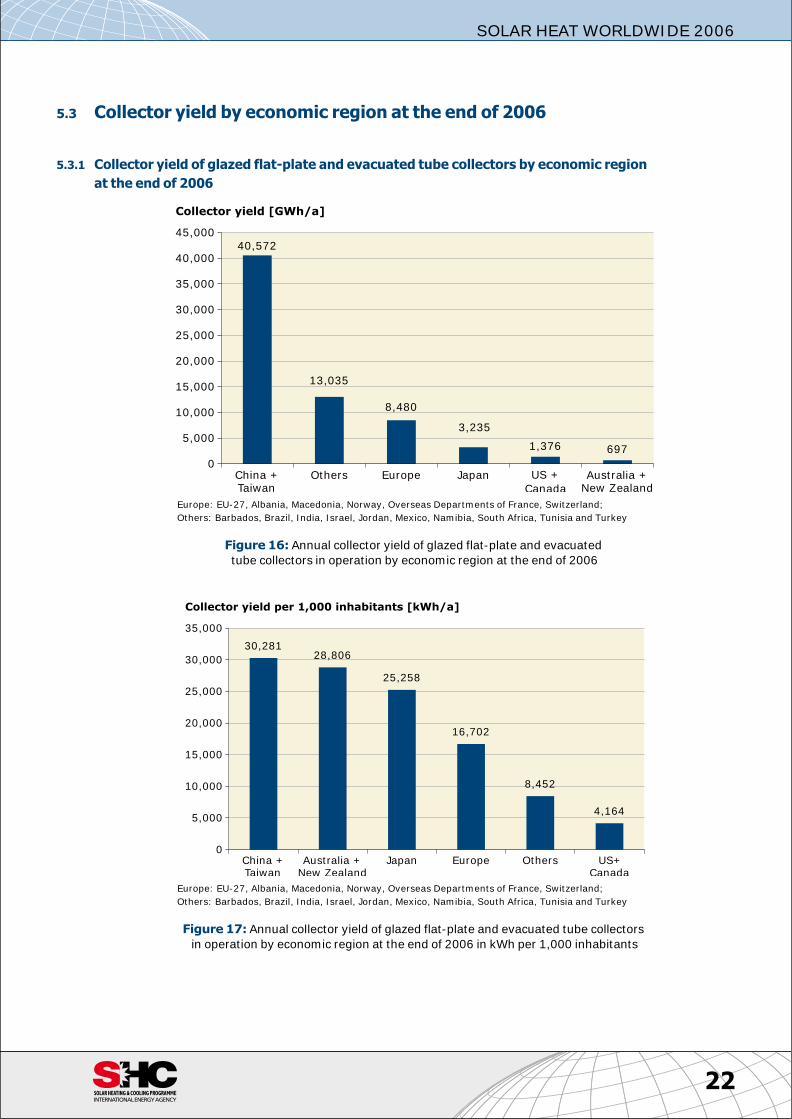
5.3 Col lec tor yield by eco nomic re gion at the end of 2006
5.3.1 Col lec tor yield of glazed flat-plate and evac u ated tube col lec tors by eco nomic re gion
at the end of 2006 [[Bil der\Fig16.prn]]a16[[Bil der\Fig17.prn]]a17
22
SOLAR HEAT WORLDWIDE 2006
697
3,235
1,376
8,480
40,572
13,035
0
5,000
10,000
15,000
20,000
25,000
30,000
35,000
40,000
45,000
China +Taiwan
Others Europe Japan US +Canada
Australia +New Zealand
Collector yield [GWh/a]
Eu rope: EU-27, Al ba nia, Mac e do nia, Nor way, Over seas De part ments of France, Swit zer land;
Oth ers: Bar ba dos, Brazil, In dia, Is rael, Jor dan, Mex ico, Namibia, South Af rica, Tu ni sia and Tur key
Fig ure 16: An nual col lec tor yield of glazed flat-plate and evac u ated
tube col lec tors in op er a tion by eco nomic re gion at the end of 2006
25,258
4,164
16,702
28,80630,281
8,452
0
5,000
10,000
15,000
20,000
25,000
30,000
35,000
China +Taiwan
Australia +New Zealand
Japan Europe Others US+Canada
Collector yield per 1,000 inhabitants [kWh/a]
Eu rope: EU-27, Al ba nia, Mac e do nia, Nor way, Over seas De part ments of France, Swit zer land;
Oth ers: Bar ba dos, Brazil, In dia, Is rael, Jor dan, Mex ico, Namibia, South Af rica, Tu ni sia and Tur key
Fig ure 17: An nual col lec tor yield of glazed flat-plate and evac u ated tube col lec tors
in op er a tion by eco nomic re gion at the end of 2006 in kWh per 1,000 in hab it ants
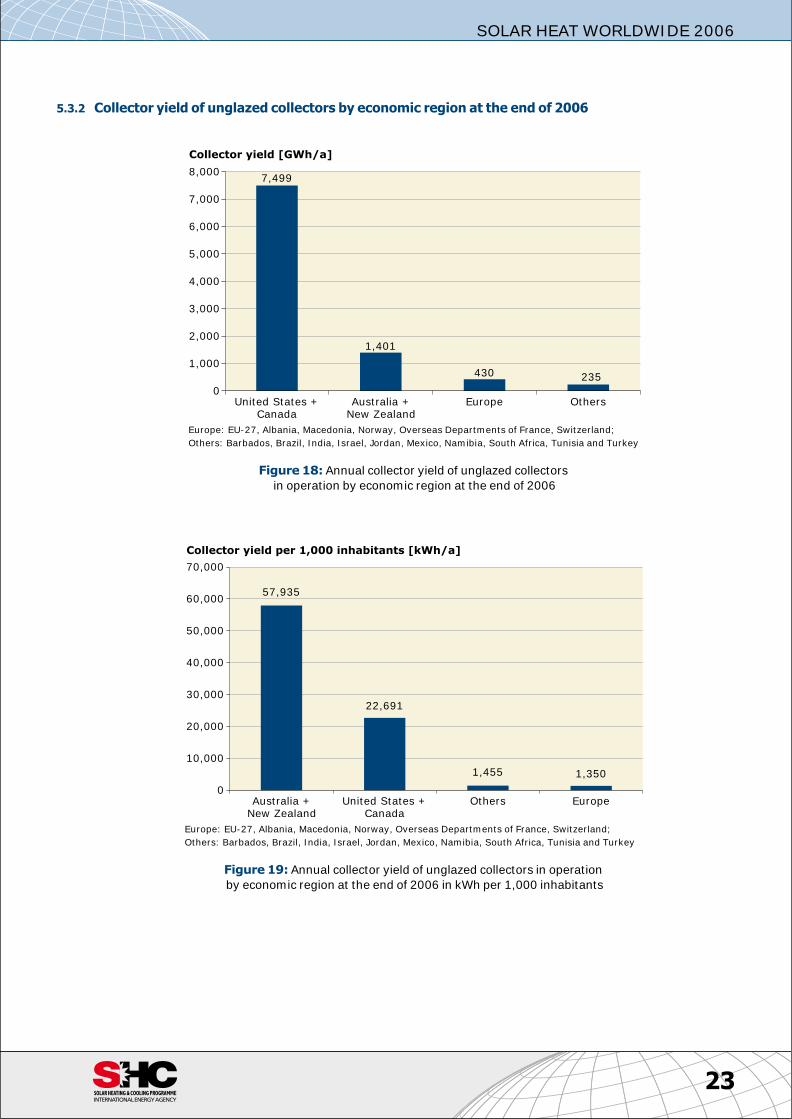
5.3.2 Col lec tor yield of un glazed col lec tors by eco nomic re gion at the end of 2006 [[Bil der\Fig18.prn]]a18[[Bil der\Fig19.prn]]a19
23
SOLAR HEAT WORLDWIDE 2006
1,401
235
7,499
430
0
1,000
2,000
3,000
4,000
5,000
6,000
7,000
8,000
United States +Canada
Australia +New Zealand
Europe Others
Collector yield [GWh/a]
Eu rope: EU-27, Al ba nia, Mac e do nia, Nor way, Over seas De part ments of France, Swit zer land;
Oth ers: Bar ba dos, Brazil, In dia, Is rael, Jor dan, Mex ico, Namibia, South Af rica, Tu ni sia and Tur key
Fig ure 18: An nual col lec tor yield of un glazed col lec tors
in op er a tion by eco nomic re gion at the end of 2006
57,935
22,691
1,3501,455
0
10,000
20,000
30,000
40,000
50,000
60,000
70,000
Australia +New Zealand
United States +Canada
Others Europe
Collector yield per 1,000 inhabitants [kWh/a]
Eu rope: EU-27, Al ba nia, Mac e do nia, Nor way, Over seas De part ments of France, Swit zer land;
Oth ers: Bar ba dos, Brazil, In dia, Is rael, Jor dan, Mex ico, Namibia, South Af rica, Tu ni sia and Tur key
Fig ure 19: An nual col lec tor yield of un glazed col lec tors in op er a tion
by eco nomic re gion at the end of 2006 in kWh per 1,000 in hab it ants
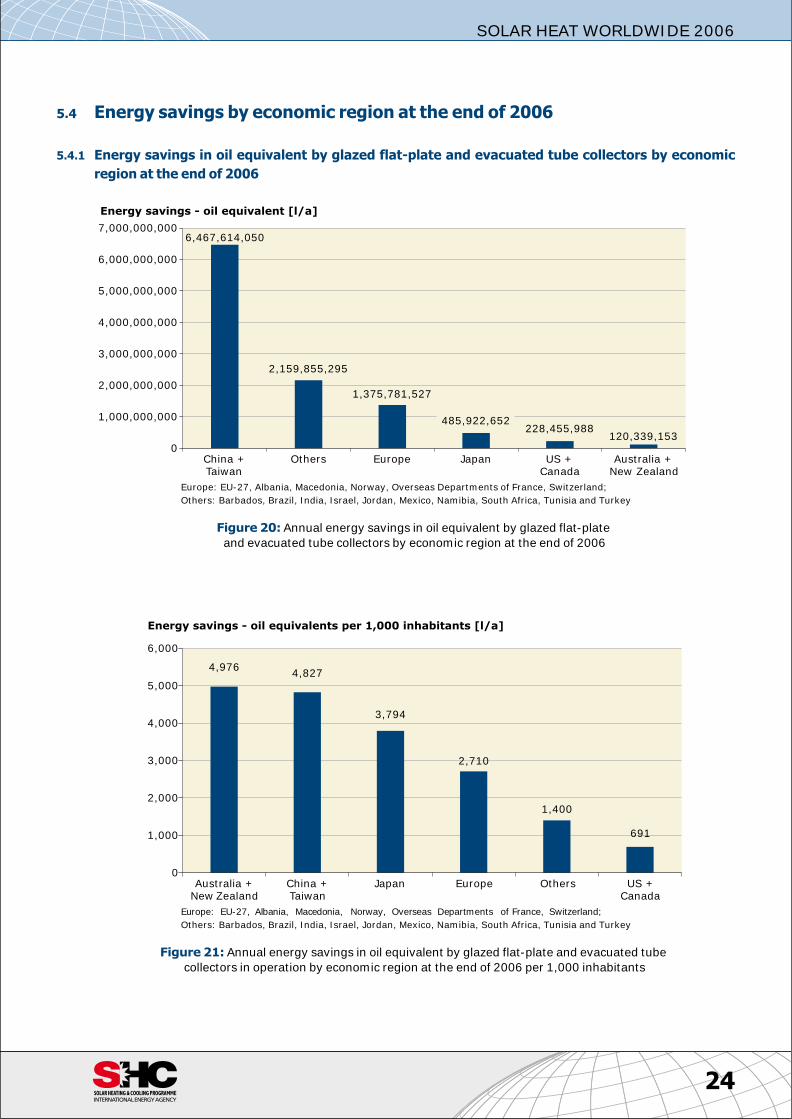
5.4 En ergy sav ings by eco nomic re gion at the end of 2006
5.4.1 En ergy sav ings in oil equiv a lent by glazed flat-plate and evac u ated tube col lec tors by eco nomic
re gion at the end of 2006 [[Bil der\Fig20.prn]]a20[[Bil der\Fig21.prn]]a21
24
SOLAR HEAT WORLDWIDE 2006
485,922,652
120,339,153228,455,988
6,467,614,050
2,159,855,295
1,375,781,527
0
1,000,000,000
2,000,000,000
3,000,000,000
4,000,000,000
5,000,000,000
6,000,000,000
7,000,000,000
China +Taiwan
Others Europe Japan US +Canada
Australia +New Zealand
Energy savings - oil equivalent [l/a]
Eu rope: EU-27, Al ba nia, Mac e do nia, Nor way, Over seas De part ments of France, Swit zer land;
Oth ers: Bar ba dos, Brazil, In dia, Is rael, Jor dan, Mex ico, Namibia, South Af rica, Tu ni sia and Tur key
Fig ure 20: An nual en ergy sav ings in oil equiv a lent by glazed flat-plate
and evac u ated tube col lec tors by eco nomic re gion at the end of 2006
3,794
1,400
4,976
691
4,827
2,710
0
1,000
2,000
3,000
4,000
5,000
6,000
Australia +New Zealand
China +Taiwan
Japan Europe Others US +Canada
Energy savings - oil equivalents per 1,000 inhabitants [l/a]
Eu rope: EU-27, Al ba nia, Mac e do nia, Nor way, Over seas De part ments of France, Swit zer land;
Oth ers: Bar ba dos, Brazil, In dia, Is rael, Jor dan, Mex ico, Namibia, South Af rica, Tu ni sia and Tur key
Fig ure 21: An nual en ergy sav ings in oil equiv a lent by glazed flat-plate and evac u ated tube
col lec tors in op er a tion by eco nomic re gion at the end of 2006 per 1,000 in hab it ants
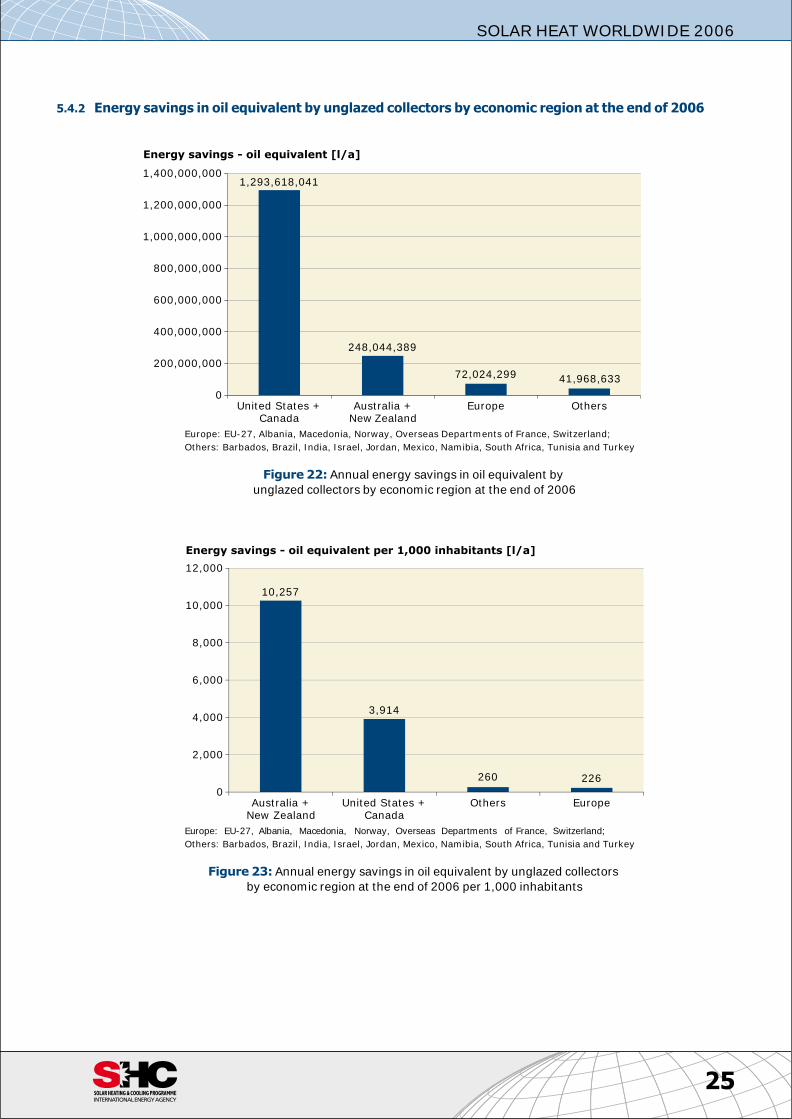
5.4.2 En ergy sav ings in oil equiv a lent by un glazed col lec tors by eco nomic re gion at the end of 2006[[Bil der\Fig22.prn]]a22[[Bil der\Fig23.prn]]a23
25
SOLAR HEAT WORLDWIDE 2006
1,293,618,041
41,968,63372,024,299
248,044,389
0
200,000,000
400,000,000
600,000,000
800,000,000
1,000,000,000
1,200,000,000
1,400,000,000
United States +Canada
Australia +New Zealand
Europe Others
Energy savings - oil equivalent [l/a]
Eu rope: EU-27, Al ba nia, Mac e do nia, Nor way, Over seas De part ments of France, Swit zer land;
Oth ers: Bar ba dos, Brazil, In dia, Is rael, Jor dan, Mex ico, Namibia, South Af rica, Tu ni sia and Tur key
Fig ure 22: An nual en ergy sav ings in oil equiv a lent by
un glazed col lec tors by eco nomic re gion at the end of 2006
3,914
10,257
226260
0
2,000
4,000
6,000
8,000
10,000
12,000
Australia + New Zealand
United States +Canada
Others Europe
Energy savings - oil equivalent per 1,000 inhabitants [l/a]
Eu rope: EU-27, Al ba nia, Mac e do nia, Nor way, Over seas De part ments of France, Swit zer land;
Oth ers: Bar ba dos, Brazil, In dia, Is rael, Jor dan, Mex ico, Namibia, South Af rica, Tu ni sia and Tur key
Fig ure 23: An nual en ergy sav ings in oil equiv a lent by un glazed col lec tors
by eco nomic re gion at the end of 2006 per 1,000 in hab it ants
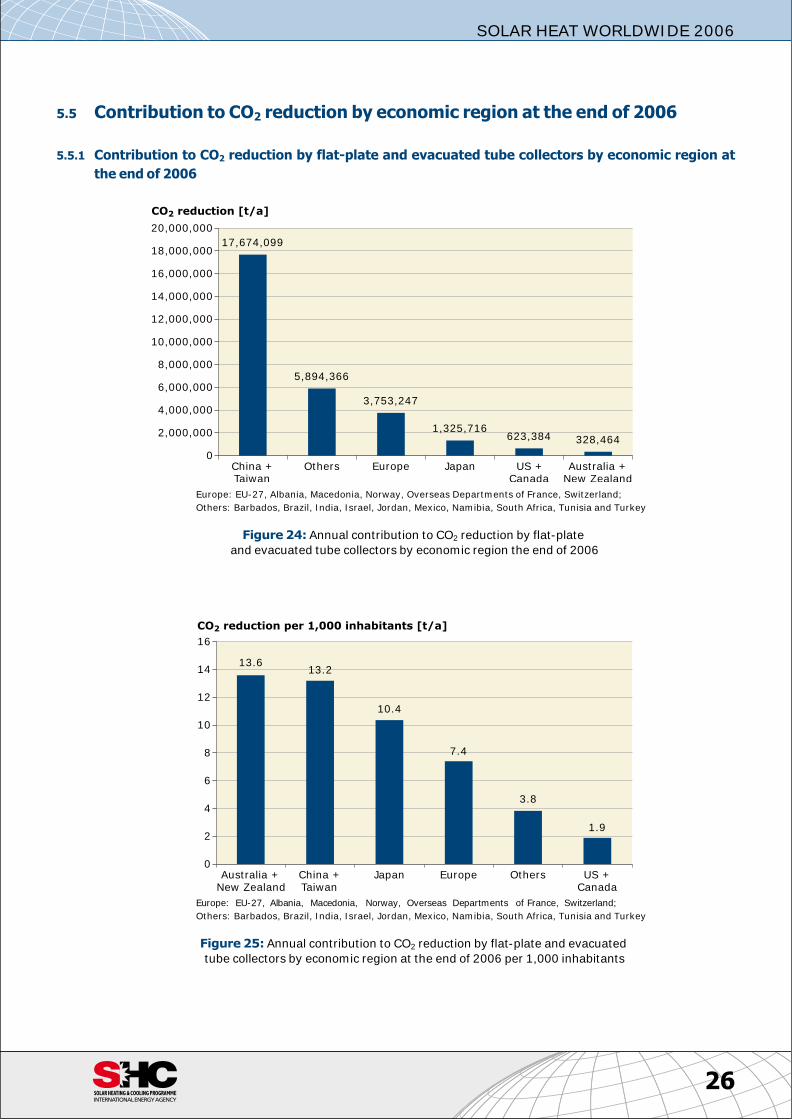
5.5 Con tri bu tion to CO2 re duc tion by eco nomic re gion at the end of 2006
5.5.1 Con tri bu tion to CO2 re duc tion by flat-plate and evac u ated tube col lec tors by eco nomic re gion at
the end of 2006 [[Bil der\Fig24.prn]]a24[[Bil der\Fig25.prn]]a25
26
SOLAR HEAT WORLDWIDE 2006
17,674,099
328,464
3,753,247
1,325,716
5,894,366
623,384
0
2,000,000
4,000,000
6,000,000
8,000,000
10,000,000
12,000,000
14,000,000
16,000,000
18,000,000
20,000,000
China +Taiwan
Others Europe Japan US +Canada
Australia +New Zealand
CO reduction [t/a]2
Eu rope: EU-27, Al ba nia, Mac e do nia, Nor way, Over seas De part ments of France, Swit zer land;
Oth ers: Bar ba dos, Brazil, In dia, Is rael, Jor dan, Mex ico, Namibia, South Af rica, Tu ni sia and Tur key
Fig ure 24: An nual con tri bu tion to CO2 re duc tion by flat-plate
and evac u ated tube col lec tors by eco nomic re gion the end of 2006
13.2
10.4
13.6
7.4
3.8
1.9
0
2
4
6
8
10
12
14
16
Australia +New Zealand
China +Taiwan
Japan Europe Others US +Canada
CO reduction per 1,000 inhabitants [t/a]2
Eu rope: EU-27, Al ba nia, Mac e do nia, Nor way, Over seas De part ments of France, Swit zer land;
Oth ers: Bar ba dos, Brazil, In dia, Is rael, Jor dan, Mex ico, Namibia, South Af rica, Tu ni sia and Tur key
Fig ure 25: An nual con tri bu tion to CO2 re duc tion by flat-plate and evac u ated
tube col lec tors by eco nomic re gion at the end of 2006 per 1,000 in hab it ants
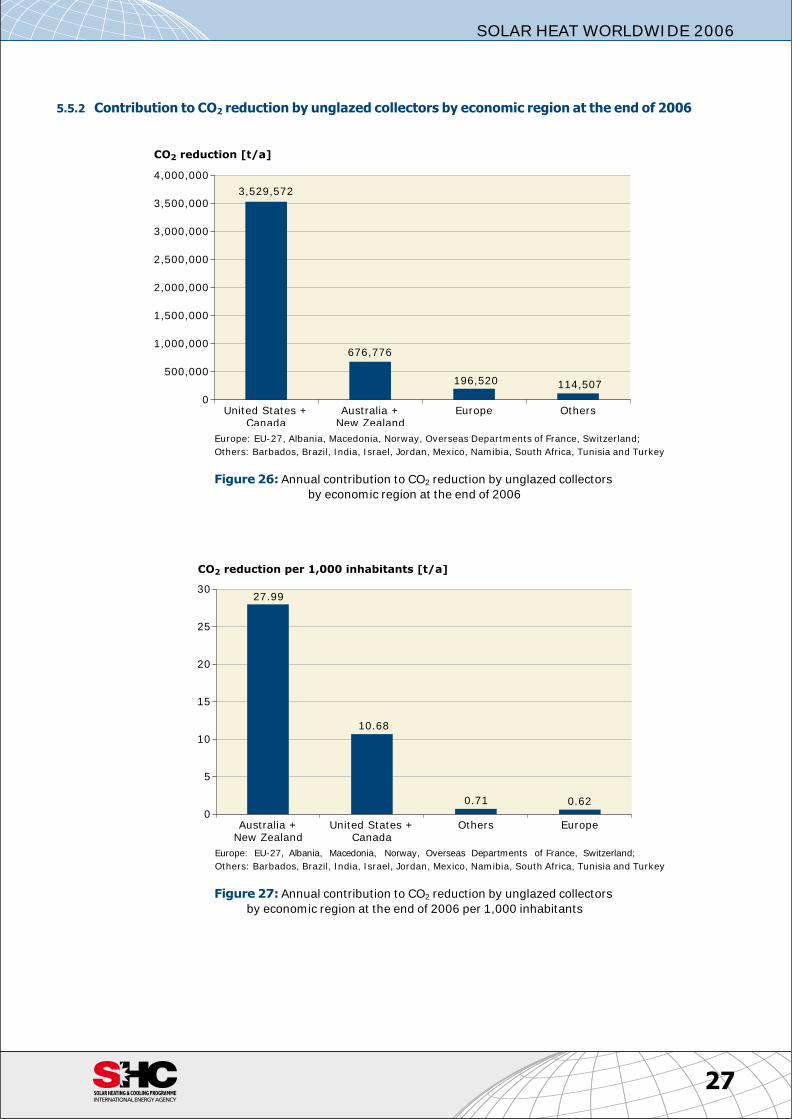
5.5.2 Con tri bu tion to CO2 re duc tion by un glazed col lec tors by eco nomic re gion at the end of 2006[[Bil der\Fig26.prn]]a26[[Bil der\Fig27.prn]]a27
27
SOLAR HEAT WORLDWIDE 2006
3,529,572
114,507196,520
676,776
0
500,000
1,000,000
1,500,000
2,000,000
2,500,000
3,000,000
3,500,000
4,000,000
United States +Canada
Australia +New Zealand
Europe Others
CO reduction [t/a]2
Eu rope: EU-27, Al ba nia, Mac e do nia, Nor way, Over seas De part ments of France, Swit zer land;
Oth ers: Bar ba dos, Brazil, In dia, Is rael, Jor dan, Mex ico, Namibia, South Af rica, Tu ni sia and Tur key
Fig ure 26: An nual con tri bu tion to CO2 re duc tion by un glazed col lec tors
by eco nomic re gion at the end of 2006
0.620.71
10.68
27.99
0
5
10
15
20
25
30
Australia +New Zealand
United States +Canada
Others Europe
CO reduction per 1,000 inhabitants [t/a]2
Eu rope: EU-27, Al ba nia, Mac e do nia, Nor way, Over seas De part ments of France, Swit zer land;
Oth ers: Bar ba dos, Brazil, In dia, Is rael, Jor dan, Mex ico, Namibia, South Af rica, Tu ni sia and Tur key
Fig ure 27: An nual con tri bu tion to CO2 re duc tion by un glazed col lec tors
by eco nomic re gion at the end of 2006 per 1,000 in hab it ants
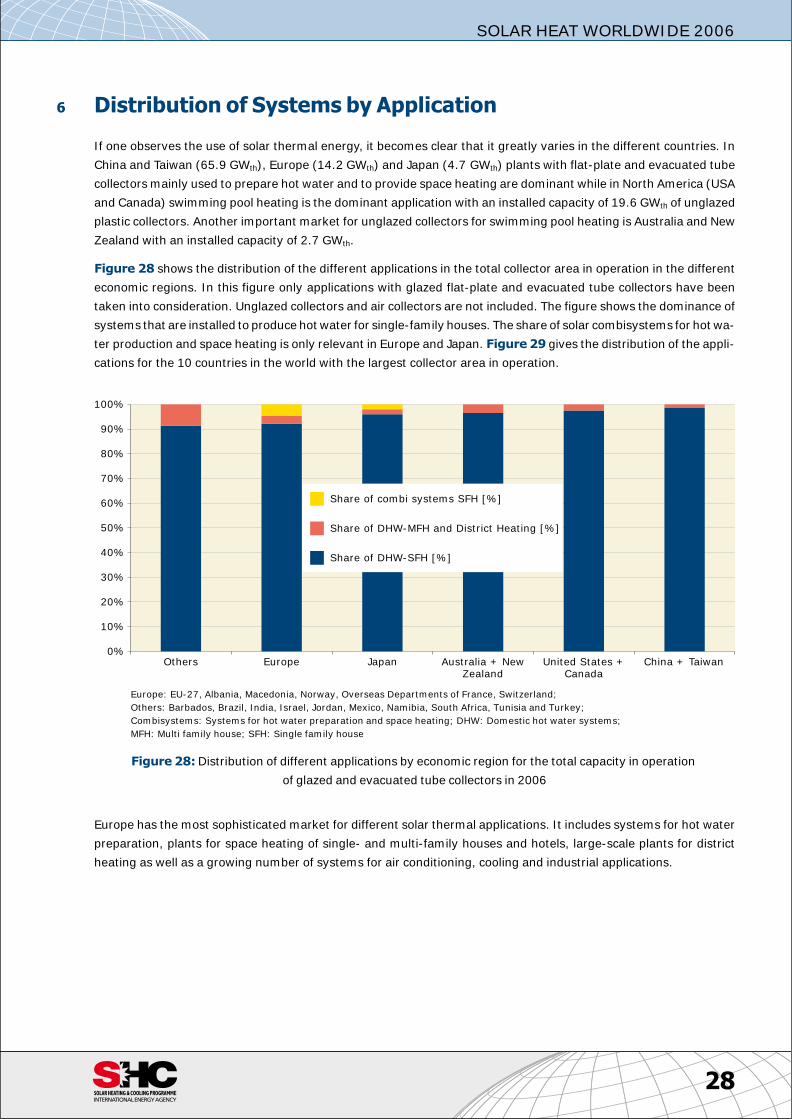
6 Dis tri bu tion of Sys tems by Ap pli ca tion
If one ob serves the use of so lar ther mal en ergy, it be comes clear that it greatly var ies in the dif fer ent coun tries. In
China and Tai wan (65.9 GWth), Eu rope (14.2 GWth) and Ja pan (4.7 GWth) plants with flat-plate and evac u ated tube
col lec tors mainly used to pre pare hot wa ter and to pro vide space heat ing are dom i nant while in North Amer ica (USA
and Can ada) swim ming pool heat ing is the dom i nant ap pli ca tion with an in stalled ca pac ity of 19.6 GWth of un glazed
plas tic col lec tors. An other im por tant mar ket for un glazed col lec tors for swim ming pool heat ing is Aus tra lia and New
Zea land with an in stalled ca pac ity of 2.7 GWth.
Fig ure 28 shows the dis tri bu tion of the dif fer ent ap pli ca tions in the to tal col lec tor area in op er a tion in the dif fer ent
eco nomic re gions. In this fig ure only ap pli ca tions with glazed flat-plate and evac u ated tube col lec tors have been
taken into con sid er ation. Un glazed col lec tors and air col lec tors are not in cluded. The fig ure shows the dom i nance of
sys tems that are in stalled to pro duce hot wa ter for sin gle-fam ily houses. The share of so lar combisystems for hot wa -
ter pro duc tion and space heat ing is only rel e vant in Eu rope and Ja pan. Fig ure 29 gives the dis tri bu tion of the ap pli -
ca tions for the 10 coun tries in the world with the largest collector area in operation. [[Bil der\Fig28.prn]]a28
Eu rope has the most so phis ti cated mar ket for dif fer ent so lar ther mal ap pli ca tions. It in cludes sys tems for hot wa ter
prep a ra tion, plants for space heat ing of sin gle- and multi-fam ily houses and ho tels, large-scale plants for dis trict
heat ing as well as a grow ing num ber of sys tems for air con di tion ing, cool ing and in dus trial ap pli ca tions.
28
SOLAR HEAT WORLDWIDE 2006
0%
10%
20%
30%
40%
50%
60%
70%
80%
90%
100%
Others Europe Japan Australia + NewZealand
United States +Canada
China + Taiwan
Share of combi systems SFH [%]
Share of DHW-MFH and District Heating [%]
Share of DHW-SFH [%]
Eu rope: EU-27, Al ba nia, Mac e do nia, Nor way, Over seas De part ments of France, Swit zer land;
Oth ers: Bar ba dos, Brazil, In dia, Is rael, Jor dan, Mex ico, Namibia, South Af rica, Tu ni sia and Tur key;
Combisystems: Sys tems for hot wa ter prep a ra tion and space heat ing; DHW: Do mes tic hot wa ter sys tems;
MFH: Multi fam ily house; SFH: Sin gle fam ily house
Fig ure 28: Dis tri bu tion of dif fer ent ap pli ca tions by eco nomic re gion for the to tal ca pac ity in op er a tion
of glazed and evac u ated tube col lec tors in 2006
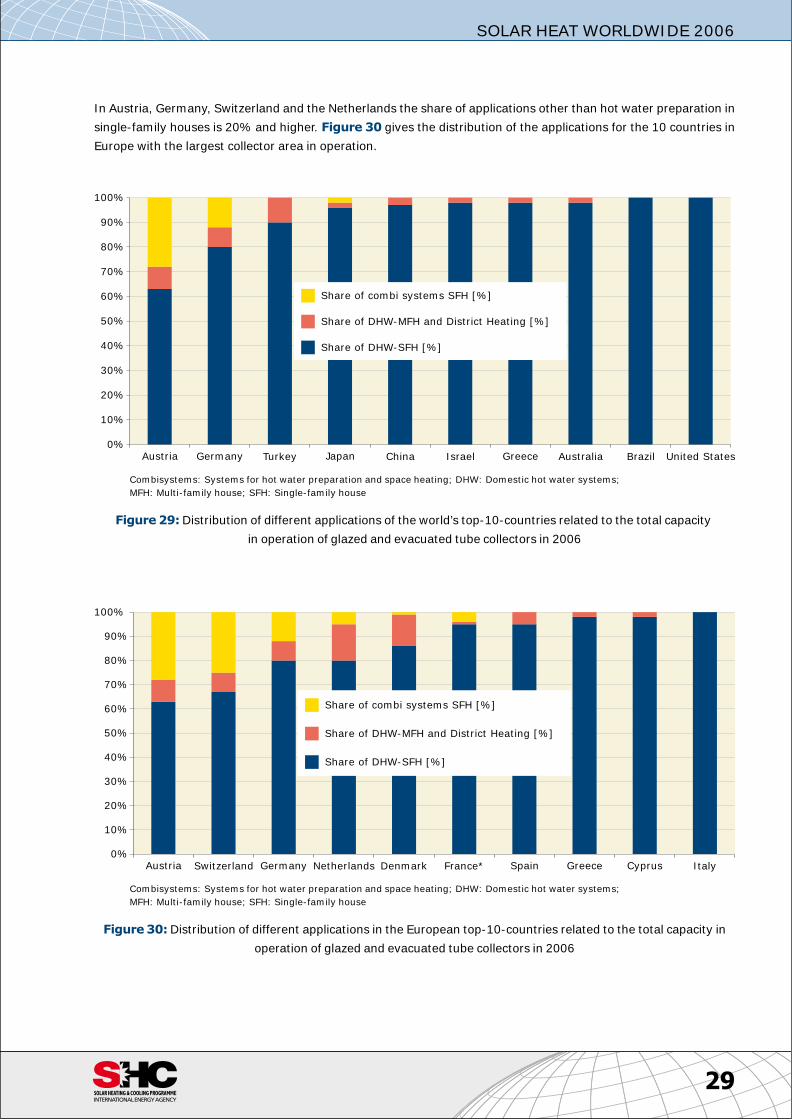
In Aus tria, Ger many, Swit zer land and the Neth er lands the share of ap pli ca tions other than hot wa ter prep a ra tion in
sin gle-fam ily houses is 20% and higher. Fig ure 30 gives the dis tri bu tion of the applications for the 10 coun tries in
Eu rope with the larg est col lec tor area in op er a tion. [[Bil der\Fig29.prn]]a29[[Bil der\Fig30.prn]]a30
29
SOLAR HEAT WORLDWIDE 2006
0%
10%
20%
30%
40%
50%
60%
70%
80%
90%
Austria
100%
Germany Turkey Japan China Israel Greece Australia Brazil United States
Share of combi systems SFH [%]
Share of DHW-MFH and District Heating [%]
Share of DHW-SFH [%]
Combisystems: Sys tems for hot wa ter prep a ra tion and space heat ing; DHW: Do mes tic hot wa ter sys tems;
MFH: Multi-fam ily house; SFH: Sin gle-fam ily house
Fig ure 29: Dis tri bu tion of dif fer ent ap pli ca tions of the world’s top-10-coun tries re lated to the to tal ca pac ity
in op er a tion of glazed and evac u ated tube col lec tors in 2006
Austria0%
10%
20%
30%
40%
50%
60%
70%
80%
90%
100%
Switzerland Germany Netherlands Denmark France* Spain Greece Cyprus Italy
Share of combi systems SFH [%]
Share of DHW-MFH and District Heating [%]
Share of DHW-SFH [%]
Combisystems: Sys tems for hot wa ter prep a ra tion and space heat ing; DHW: Do mes tic hot wa ter sys tems;
MFH: Multi-fam ily house; SFH: Sin gle-fam ily house
Fig ure 30: Dis tri bu tion of dif fer ent ap pli ca tions in the Eu ro pean top-10-coun tries re lated to the to tal ca pac ity in
op er a tion of glazed and evac u ated tube col lec tors in 2006
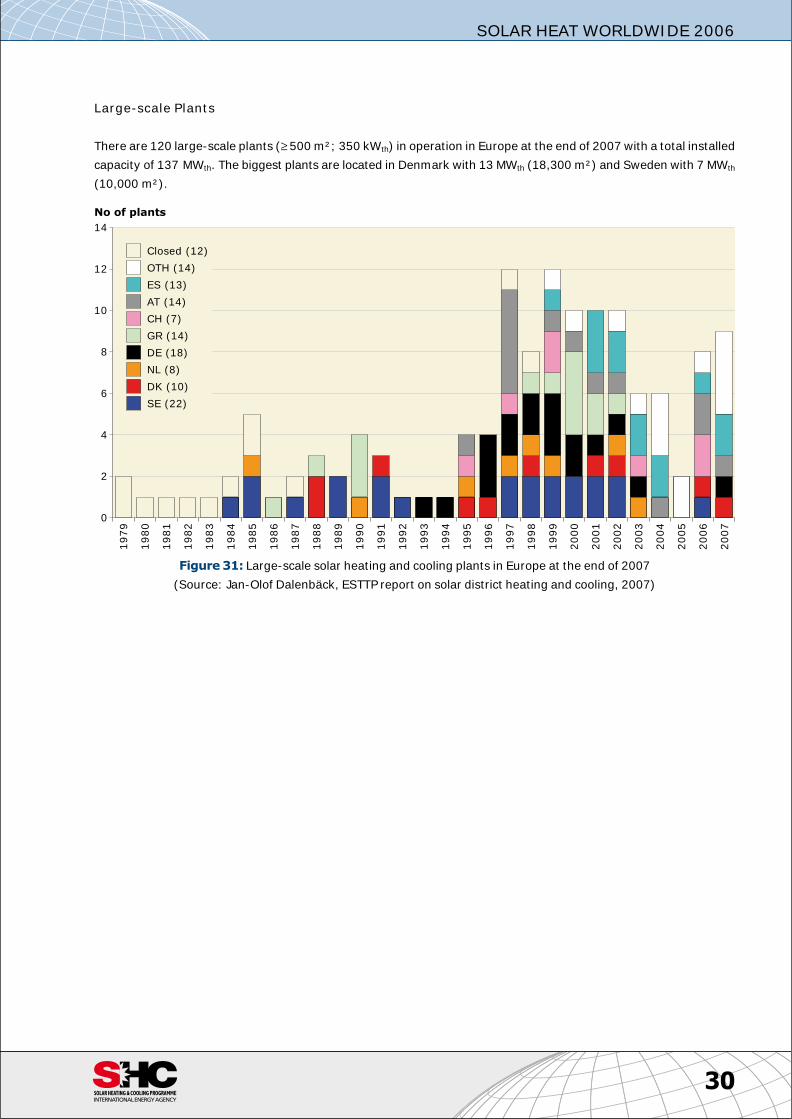
Large-scale Plants
There are 120 large-scale plants (≥ 500 m²; 350 kWth) in op er a tion in Eu rope at the end of 2007 with a to tal in stalled
ca pac ity of 137 MWth. The big gest plants are lo cated in Den mark with 13 MWth (18,300 m²) and Swe den with 7 MWth
(10,000 m²). [[Bil der\Fig31.prn]]a31
30
SOLAR HEAT WORLDWIDE 2006
0
2
4
6
8
10
12
14
1979
1980
1981
1982
1983
1984
1985
1986
1987
1988
1989
1990
1991
1992
1993
1994
1995
1996
1997
1998
1999
2000
2001
2002
2003
2004
2005
2006
2007
No of plants
Closed (12)
OTH (14)
ES (13)
AT (14)
CH (7)
GR (14)
DE (18)
NL (8)
DK (10)
SE (22)
Fig ure 31: Large-scale so lar heat ing and cool ing plants in Eu rope at the end of 2007
(Source: Jan-Olof Dalenbäck, ESTTP re port on so lar dis trict heat ing and cool ing, 2007)
7 Ap pen dix
7.1 Ref er ence sys tems
To make the sim u la tions to de ter mine the en ergy out put of a so lar ther mal heat ing sys tem, it was nec es sary to de fine
ref er ence sys tems for dif fer ent ap pli ca tions and coun tries (re gions).
Based on the ref er ence sys tems, hot wa ter de mand, heat load (only for so lar combisystems) and weather data, the
en ergy out put of the sys tems and the re sult ing en ergy sav ings in oil equiv a lent were calculated.
So lar combisystems are so lar heat ing in stal la tions pro vid ing space heat ing as well as do mes tic hot wa ter for the in -
hab it ants of the build ing. The pri mary en ergy sources are so lar en ergy as well as an aux il iary source such as bio mass,
gas, oil and electricity.
Four ma jor ap pli ca tions and ref er ence sys tems (see ta bles be low) were cho sen for the sim u la tions. For these ref er -
ence sys tems, the daily hot wa ter de mand, the space heat ing de mand (only for so lar combisystems) and the
weather data (lo ca tion) were de fined. The ref er ence sys tems are those sys tems, which are most com mon in the
respective country.
The fol low ing ta bles de scribe the key data of the ref er ence sys tems in dif fer ent coun tries, the lo ca tion of the ref er -
ence cli mate used and the share of the to tal col lec tor area (glazed flat-plate and evac u ated tube col lec tors) in use for
the re spec tive ap pli ca tion. Fur ther more, a hy drau lic scheme is shown for each reference system.
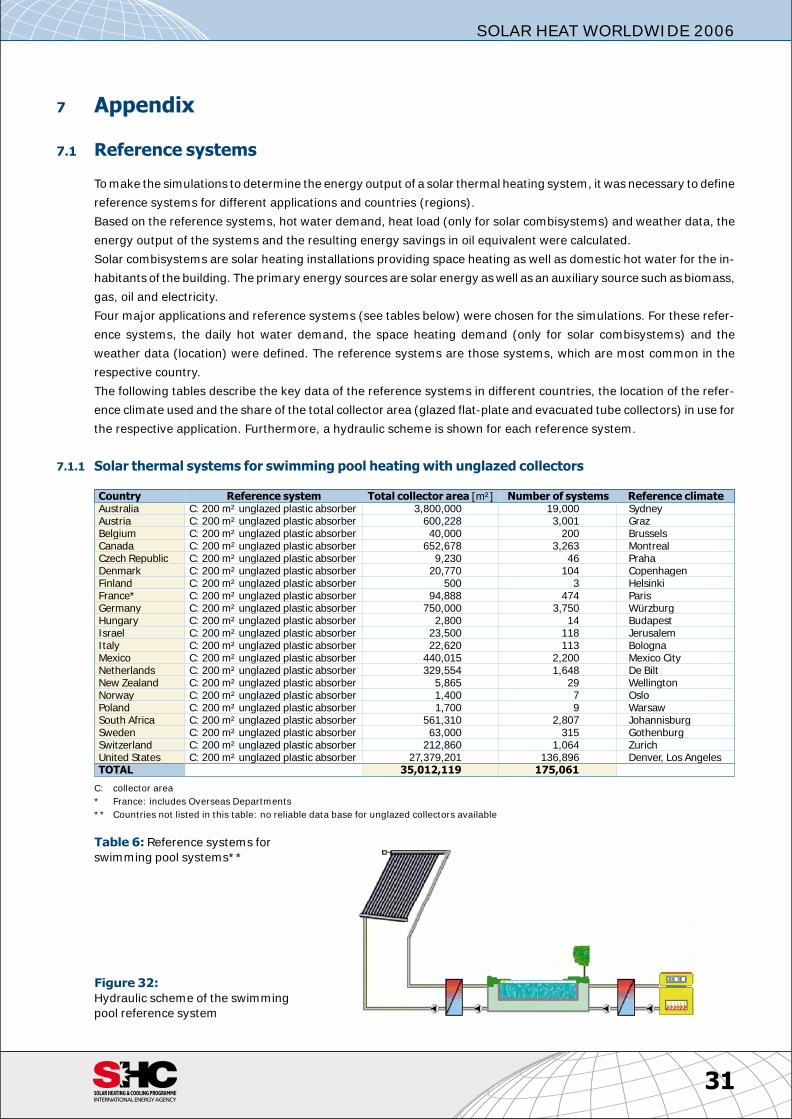
7.1.1 So lar ther mal sys tems for swim ming pool heat ing with un glazed col lec tors [[Tab le06.txt]]t06
[[Bil der\Fi gA1.tif]]a32
31
SOLAR HEAT WORLDWIDE 2006
Coun try Ref er ence sys tem To tal col lec tor area [m²] Num ber of sys tems Ref er ence cli mateAus tra lia C: 200 m² un glazed plas tic ab sorber 3,800,000 19,000 Syd neyAus tria C: 200 m² un glazed plas tic ab sorber 600,228 3,001 GrazBel gium C: 200 m² un glazed plas tic ab sorber 40,000 200 BrusselsCan ada C: 200 m² un glazed plas tic ab sorber 652,678 3,263 Mon trealCzech Re pub lic C: 200 m² un glazed plas tic ab sorber 9,230 46 PrahaDen mark C: 200 m² un glazed plas tic ab sorber 20,770 104 Co pen ha genFin land C: 200 m² un glazed plas tic ab sorber 500 3 Hel sinkiFrance* C: 200 m² un glazed plas tic ab sorber 94,888 474 ParisGer many C: 200 m² un glazed plas tic ab sorber 750,000 3,750 WürzburgHun gary C: 200 m² un glazed plas tic ab sorber 2,800 14 Bu da pestIs rael C: 200 m² un glazed plas tic ab sorber 23,500 118 Je ru sa lemIt aly C: 200 m² un glazed plas tic ab sorber 22,620 113 Bo lo gnaMex ico C: 200 m² un glazed plas tic ab sorber 440,015 2,200 Mex ico CityNeth er lands C: 200 m² un glazed plas tic ab sorber 329,554 1,648 De BiltNew Zea land C: 200 m² un glazed plas tic ab sorber 5,865 29 WellingtonNor way C: 200 m² un glazed plas tic ab sorber 1,400 7 OsloPo land C: 200 m² un glazed plas tic ab sorber 1,700 9 War sawSouth Af rica C: 200 m² un glazed plas tic ab sorber 561,310 2,807 JohannisburgSwe den C: 200 m² un glazed plas tic ab sorber 63,000 315 GothenburgSwit zer land C: 200 m² un glazed plas tic ab sorber 212,860 1,064 Zu richUnited States C: 200 m² un glazed plas tic ab sorber 27,379,201 136,896 Den ver, Los An gelesTOTAL 35,012,119 175,061
C: col lec tor area
* France: in cludes Over seas De part ments
** Coun tries not listed in this ta ble: no re li able data base for un glazed col lec tors avail able
Ta ble 6: Ref er ence sys tems for
swim ming pool sys tems**
Fig ure 32:
Hy drau lic scheme of the swim ming
pool ref er ence sys tem
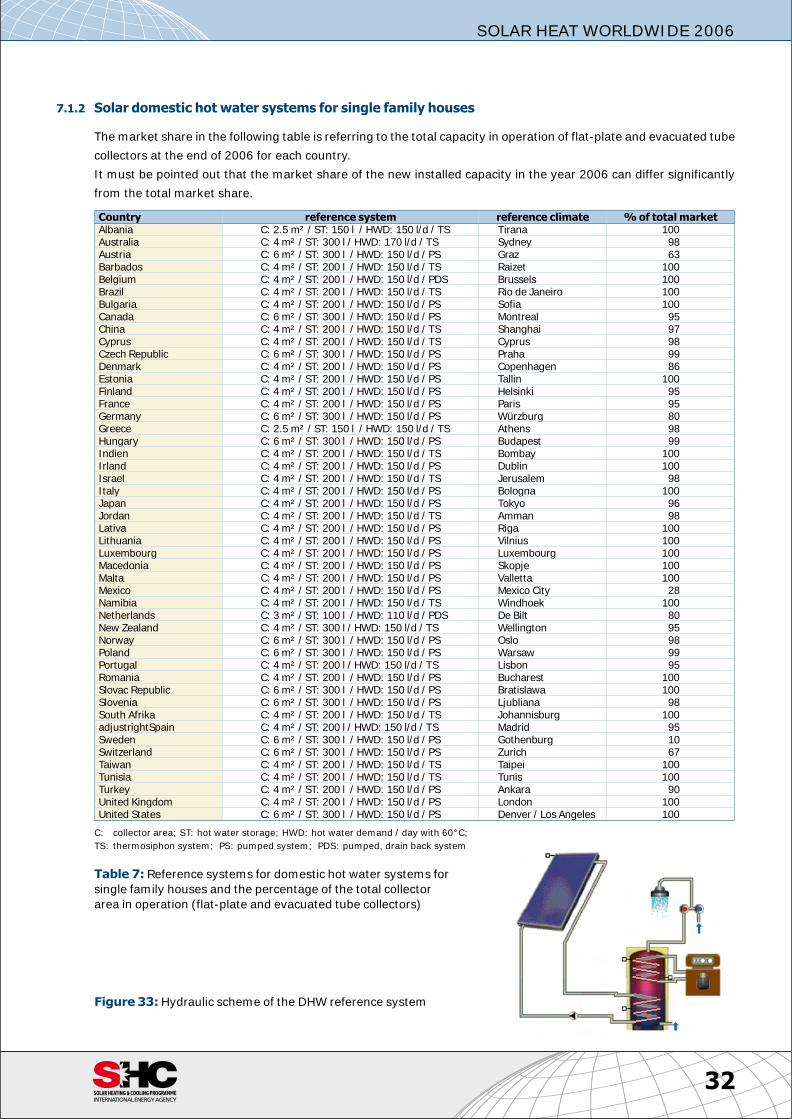
7.1.2 So lar do mes tic hot wa ter sys tems for sin gle fam ily houses
The mar ket share in the fol low ing ta ble is re fer ring to the to tal ca pac ity in op er a tion of flat-plate and evac u ated tube
col lec tors at the end of 2006 for each country.
It must be pointed out that the mar ket share of the new in stalled ca pac ity in the year 2006 can dif fer sig nif i cantly
from the to tal mar ket share. [[Tab le07.txt]]t07
[[Bil der\Fi gA2.tif]]a33
32
SOLAR HEAT WORLDWIDE 2006
Coun try ref er ence sys tem ref er ence cli mate % of to tal mar ketAl ba nia C: 2.5 m² / ST: 150 l / HWD: 150 l/d / TS Tirana 100Aus tra lia C: 4 m² / ST: 300 l / HWD: 170 l/d / TS Syd ney 98Aus tria C: 6 m² / ST: 300 l / HWD: 150 l/d / PS Graz 63Bar ba dos C: 4 m² / ST: 200 l / HWD: 150 l/d / TS Raizet 100Bel gium C: 4 m² / ST: 200 l / HWD: 150 l/d / PDS Brussels 100Brazil C: 4 m² / ST: 200 l / HWD: 150 l/d / TS Rio de Ja neiro 100Bul garia C: 4 m² / ST: 200 l / HWD: 150 l/d / PS So fia 100Can ada C: 6 m² / ST: 300 l / HWD: 150 l/d / PS Mon treal 95China C: 4 m² / ST: 200 l / HWD: 150 l/d / TS Shang hai 97Cy prus C: 4 m² / ST: 200 l / HWD: 150 l/d / TS Cy prus 98Czech Re pub lic C: 6 m² / ST: 300 l / HWD: 150 l/d / PS Praha 99Den mark C: 4 m² / ST: 200 l / HWD: 150 l/d / PS Co pen ha gen 86Es to nia C: 4 m² / ST: 200 l / HWD: 150 l/d / PS Tallin 100Fin land C: 4 m² / ST: 200 l / HWD: 150 l/d / PS Hel sinki 95France C: 4 m² / ST: 200 l / HWD: 150 l/d / PS Paris 95Ger many C: 6 m² / ST: 300 l / HWD: 150 l/d / PS Würzburg 80Greece C: 2.5 m² / ST: 150 l / HWD: 150 l/d / TS Ath ens 98Hun gary C: 6 m² / ST: 300 l / HWD: 150 l/d / PS Bu da pest 99Indien C: 4 m² / ST: 200 l / HWD: 150 l/d / TS Bom bay 100Irland C: 4 m² / ST: 200 l / HWD: 150 l/d / PS Dub lin 100Is rael C: 4 m² / ST: 200 l / HWD: 150 l/d / TS Je ru sa lem 98It aly C: 4 m² / ST: 200 l / HWD: 150 l/d / PS Bo lo gna 100Ja pan C: 4 m² / ST: 200 l / HWD: 150 l/d / PS To kyo 96Jor dan C: 4 m² / ST: 200 l / HWD: 150 l/d / TS Amman 98Lativa C: 4 m² / ST: 200 l / HWD: 150 l/d / PS Riga 100Lith u a nia C: 4 m² / ST: 200 l / HWD: 150 l/d / PS Vilnius 100Lux em bourg C: 4 m² / ST: 200 l / HWD: 150 l/d / PS Lux em bourg 100Mac e do nia C: 4 m² / ST: 200 l / HWD: 150 l/d / PS Skopje 100Malta C: 4 m² / ST: 200 l / HWD: 150 l/d / PS Valletta 100Mex ico C: 4 m² / ST: 200 l / HWD: 150 l/d / PS Mex ico City 28Namibia C: 4 m² / ST: 200 l / HWD: 150 l/d / TS Windhoek 100Neth er lands C: 3 m² / ST: 100 l / HWD: 110 l/d / PDS De Bilt 80New Zea land C: 4 m² / ST: 300 l / HWD: 150 l/d / TS Wellington 95Nor way C: 6 m² / ST: 300 l / HWD: 150 l/d / PS Oslo 98Po land C: 6 m² / ST: 300 l / HWD: 150 l/d / PS War saw 99Por tu gal C: 4 m² / ST: 200 l / HWD: 150 l/d / TS Lis bon 95Ro ma nia C: 4 m² / ST: 200 l / HWD: 150 l/d / PS Bu cha rest 100Slovac Re pub lic C: 6 m² / ST: 300 l / HWD: 150 l/d / PS Bratislawa 100Slovenia C: 6 m² / ST: 300 l / HWD: 150 l/d / PS Ljubliana 98South Afrika C: 4 m² / ST: 200 l / HWD: 150 l/d / TS Johannisburg 100adjustrightSpain C: 4 m² / ST: 200 l / HWD: 150 l/d / TS Ma drid 95Swe den C: 6 m² / ST: 300 l / HWD: 150 l/d / PS Gothenburg 10Swit zer land C: 6 m² / ST: 300 l / HWD: 150 l/d / PS Zu rich 67Tai wan C: 4 m² / ST: 200 l / HWD: 150 l/d / TS Tai pei 100Tu ni sia C: 4 m² / ST: 200 l / HWD: 150 l/d / TS Tu nis 100Tur key C: 4 m² / ST: 200 l / HWD: 150 l/d / PS An kara 90United King dom C: 4 m² / ST: 200 l / HWD: 150 l/d / PS Lon don 100United States C: 6 m² / ST: 300 l / HWD: 150 l/d / PS Den ver / Los An geles 100
C: col lec tor area; ST: hot wa ter stor age; HWD: hot wa ter de mand / day with 60°C;
TS: thermo siphon sys tem; PS: pumped sys tem; PDS: pumped, drain back sys tem
Ta ble 7: Ref er ence sys tems for do mes tic hot wa ter sys tems for
sin gle fam ily houses and the per cent age of the to tal col lec tor
area in op er a tion (flat-plate and evac u ated tube col lec tors)
Fig ure 33: Hy drau lic scheme of the DHW ref er ence sys tem
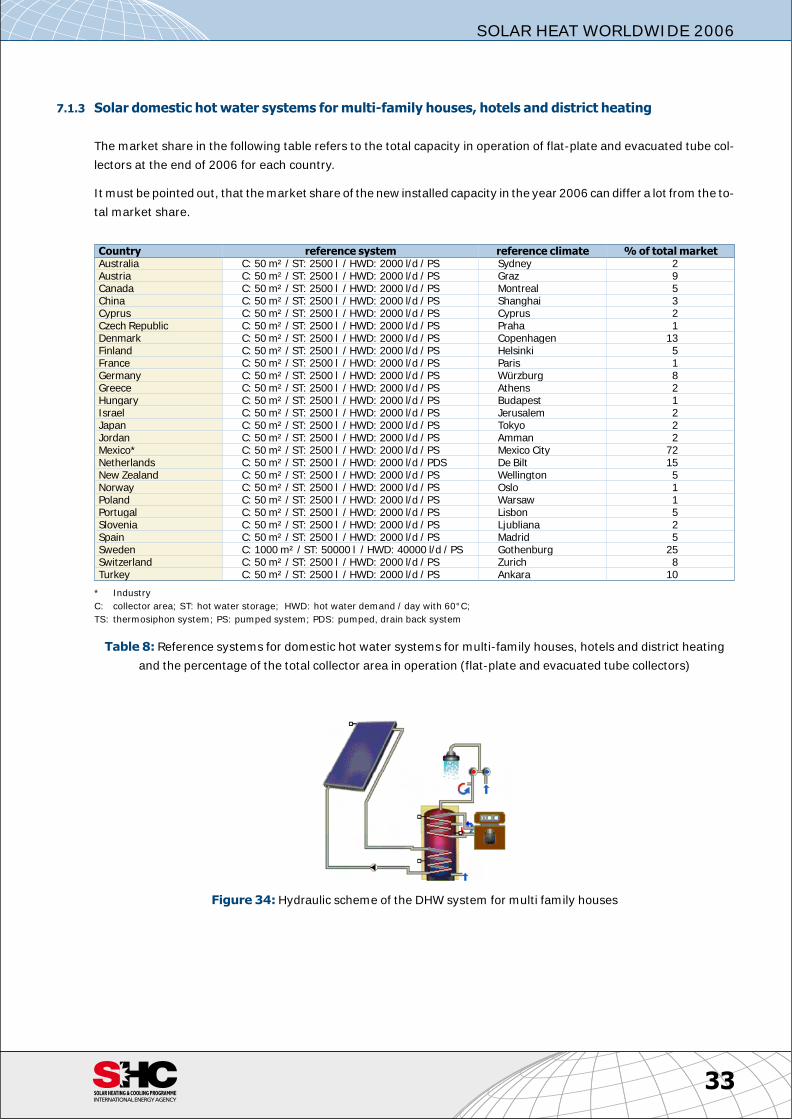
7.1.3 So lar do mes tic hot wa ter sys tems for multi-fam ily houses, ho tels and dis trict heat ing
The mar ket share in the fol low ing ta ble re fers to the to tal ca pac ity in op er a tion of flat-plate and evac u ated tube col -
lec tors at the end of 2006 for each country.
It must be pointed out, that the mar ket share of the new in stalled ca pac ity in the year 2006 can dif fer a lot from the to -
tal mar ket share. [[Tab le08.txt]]t08
[[Bil der\Fi gA3.tif]]a34
33
SOLAR HEAT WORLDWIDE 2006
Coun try ref er ence sys tem ref er ence cli mate % of to tal mar ketAus tra lia C: 50 m² / ST: 2500 l / HWD: 2000 l/d / PS Syd ney 2Aus tria C: 50 m² / ST: 2500 l / HWD: 2000 l/d / PS Graz 9Can ada C: 50 m² / ST: 2500 l / HWD: 2000 l/d / PS Mon treal 5China C: 50 m² / ST: 2500 l / HWD: 2000 l/d / PS Shang hai 3Cy prus C: 50 m² / ST: 2500 l / HWD: 2000 l/d / PS Cy prus 2Czech Re pub lic C: 50 m² / ST: 2500 l / HWD: 2000 l/d / PS Praha 1Den mark C: 50 m² / ST: 2500 l / HWD: 2000 l/d / PS Co pen ha gen 13Fin land C: 50 m² / ST: 2500 l / HWD: 2000 l/d / PS Hel sinki 5France C: 50 m² / ST: 2500 l / HWD: 2000 l/d / PS Paris 1Ger many C: 50 m² / ST: 2500 l / HWD: 2000 l/d / PS Würzburg 8Greece C: 50 m² / ST: 2500 l / HWD: 2000 l/d / PS Ath ens 2Hun gary C: 50 m² / ST: 2500 l / HWD: 2000 l/d / PS Bu da pest 1Is rael C: 50 m² / ST: 2500 l / HWD: 2000 l/d / PS Je ru sa lem 2Ja pan C: 50 m² / ST: 2500 l / HWD: 2000 l/d / PS To kyo 2Jor dan C: 50 m² / ST: 2500 l / HWD: 2000 l/d / PS Amman 2Mex ico* C: 50 m² / ST: 2500 l / HWD: 2000 l/d / PS Mex ico City 72Neth er lands C: 50 m² / ST: 2500 l / HWD: 2000 l/d / PDS De Bilt 15New Zea land C: 50 m² / ST: 2500 l / HWD: 2000 l/d / PS Wellington 5Nor way C: 50 m² / ST: 2500 l / HWD: 2000 l/d / PS Oslo 1Po land C: 50 m² / ST: 2500 l / HWD: 2000 l/d / PS War saw 1Por tu gal C: 50 m² / ST: 2500 l / HWD: 2000 l/d / PS Lis bon 5Slovenia C: 50 m² / ST: 2500 l / HWD: 2000 l/d / PS Ljubliana 2Spain C: 50 m² / ST: 2500 l / HWD: 2000 l/d / PS Ma drid 5Swe den C: 1000 m² / ST: 50000 l / HWD: 40000 l/d / PS Gothenburg 25Swit zer land C: 50 m² / ST: 2500 l / HWD: 2000 l/d / PS Zu rich 8Tur key C: 50 m² / ST: 2500 l / HWD: 2000 l/d / PS An kara 10
* In dus try
C: col lec tor area; ST: hot wa ter stor age; HWD: hot wa ter de mand / day with 60°C;
TS: thermo siphon sys tem; PS: pumped sys tem; PDS: pumped, drain back sys tem
Ta ble 8: Ref er ence sys tems for do mes tic hot wa ter sys tems for multi-fam ily houses, ho tels and dis trict heat ing
and the per cent age of the to tal col lec tor area in op er a tion (flat-plate and evac u ated tube col lec tors)
Fig ure 34: Hy drau lic scheme of the DHW sys tem for multi fam ily houses
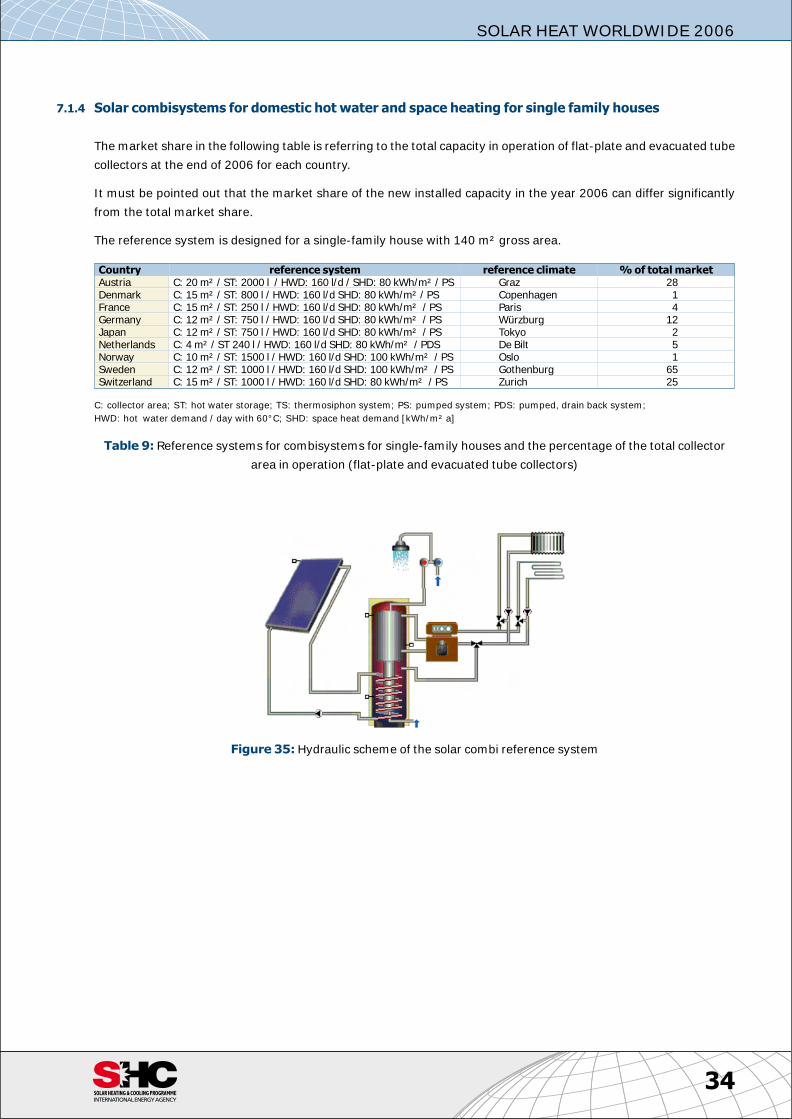
7.1.4 So lar combisystems for do mes tic hot wa ter and space heat ing for sin gle fam ily houses
The mar ket share in the fol low ing ta ble is re fer ring to the to tal ca pac ity in op er a tion of flat-plate and evac u ated tube
col lec tors at the end of 2006 for each country.
It must be pointed out that the mar ket share of the new in stalled ca pac ity in the year 2006 can dif fer sig nif i cantly
from the to tal mar ket share.
The ref er ence sys tem is de signed for a sin gle-fam ily house with 140 m² gross area.
[[Tab le09.txt]]t09[[Bil der\Fi gA4.tif]]a35
34
SOLAR HEAT WORLDWIDE 2006
Coun try ref er ence sys tem ref er ence cli mate % of to tal mar ketAus tria C: 20 m² / ST: 2000 l / HWD: 160 l/d / SHD: 80 kWh/m² / PS Graz 28Den mark C: 15 m² / ST: 800 l / HWD: 160 l/d SHD: 80 kWh/m² / PS Co pen ha gen 1France C: 15 m² / ST: 250 l / HWD: 160 l/d SHD: 80 kWh/m² / PS Paris 4Ger many C: 12 m² / ST: 750 l / HWD: 160 l/d SHD: 80 kWh/m² / PS Würzburg 12Ja pan C: 12 m² / ST: 750 l / HWD: 160 l/d SHD: 80 kWh/m² / PS To kyo 2Neth er lands C: 4 m² / ST 240 l / HWD: 160 l/d SHD: 80 kWh/m² / PDS De Bilt 5Nor way C: 10 m² / ST: 1500 l / HWD: 160 l/d SHD: 100 kWh/m² / PS Oslo 1Swe den C: 12 m² / ST: 1000 l / HWD: 160 l/d SHD: 100 kWh/m² / PS Gothenburg 65Swit zer land C: 15 m² / ST: 1000 l / HWD: 160 l/d SHD: 80 kWh/m² / PS Zu rich 25
C: col lec tor area; ST: hot wa ter stor age; TS: thermo siphon sys tem; PS: pumped sys tem; PDS: pumped, drain back sys tem;
HWD: hot wa ter de mand / day with 60°C; SHD: space heat de mand [kWh/m² a]
Ta ble 9: Ref er ence sys tems for combisystems for sin gle-fam ily houses and the per cent age of the to tal col lec tor
area in op er a tion (flat-plate and evac u ated tube col lec tors)
Fig ure 35: Hy drau lic scheme of the so lar combi ref er ence sys tem
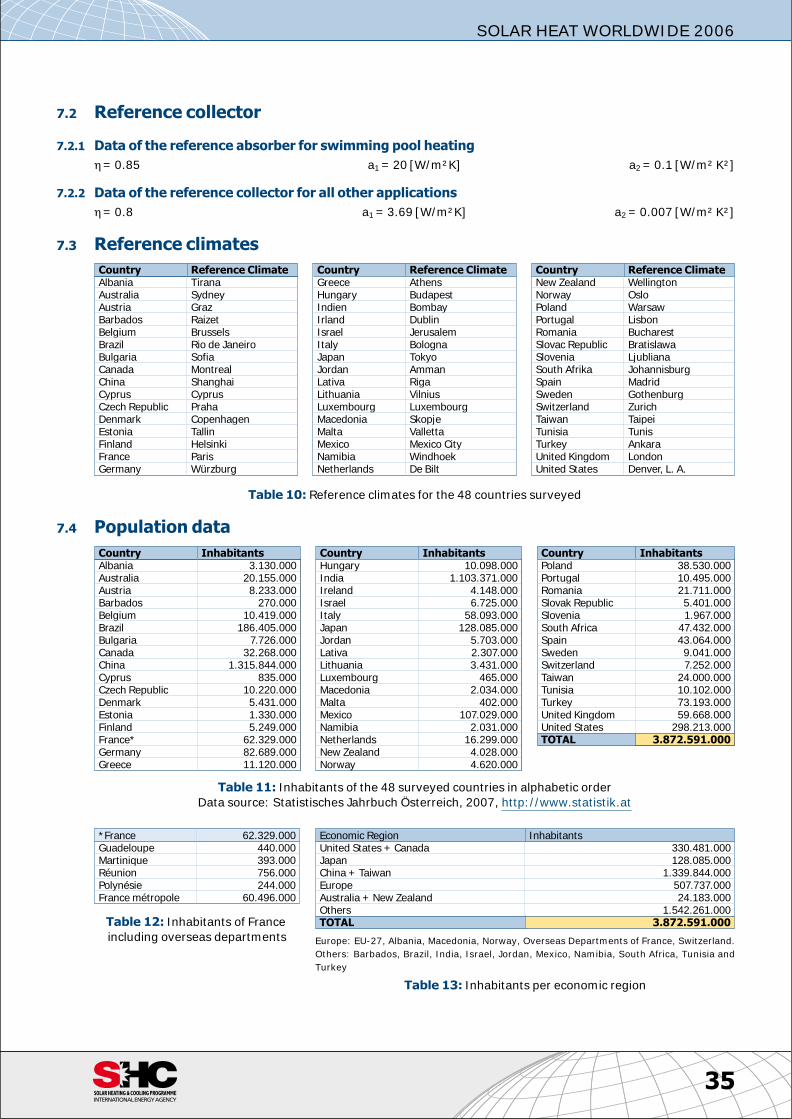
7.2 Reference col lec tor
7.2.1 Data of the ref er ence ab sorber for swim ming pool heat ing
η = 0.85 a1 = 20 [W/m²K] a2 = 0.1 [W/m² K²]
7.2.2 Data of the ref er ence col lec tor for all other ap pli ca tions
η = 0.8 a1 = 3.69 [W/m²K] a2 = 0.007 [W/m² K²]
7.3 Ref er ence cli mates[[Tab le10.txt]]t10
7.4 Pop u la tion data[[Tab le11.txt]]t11[[Tab le12.txt]]t12[[Tab le13.txt]]t13
35
SOLAR HEAT WORLDWIDE 2006
Coun try Ref er ence Cli mateAl ba nia TiranaAus tra lia Syd neyAus tria GrazBar ba dos RaizetBel gium BrusselsBrazil Rio de Ja neiroBul garia So fiaCan ada Mon trealChina Shang haiCy prus Cy prusCzech Re pub lic PrahaDen mark Co pen ha genEs to nia TallinFin land Hel sinkiFrance ParisGer many Würzburg
Coun try Ref er ence Cli mateGreece Ath ensHun gary Bu da pestIndien Bom bayIrland Dub linIs rael Je ru sa lemIt aly Bo lo gnaJa pan To kyoJor dan AmmanLativa RigaLith u a nia VilniusLux em bourg Lux em bourgMac e do nia SkopjeMalta VallettaMex ico Mex ico CityNamibia WindhoekNeth er lands De Bilt
Coun try Ref er ence Cli mateNew Zea land WellingtonNor way OsloPo land War sawPor tu gal Lis bonRo ma nia Bu cha restSlovac Re pub lic BratislawaSlovenia LjublianaSouth Afrika JohannisburgSpain Ma dridSwe den GothenburgSwit zer land Zu richTai wan Tai peiTunisia Tu nisTur key An karaUnited King dom Lon donUnited States Den ver, L. A.
Ta ble 10: Ref er ence cli mates for the 48 coun tries sur veyed
Coun try In hab it antsAl ba nia 3.130.000Aus tra lia 20.155.000Aus tria 8.233.000Bar ba dos 270.000Bel gium 10.419.000Brazil 186.405.000Bul garia 7.726.000Can ada 32.268.000China 1.315.844.000Cy prus 835.000Czech Re pub lic 10.220.000Den mark 5.431.000Es to nia 1.330.000Fin land 5.249.000France* 62.329.000Ger many 82.689.000Greece 11.120.000
Coun try In hab it antsHungary 10.098.000In dia 1.103.371.000Ire land 4.148.000Is rael 6.725.000It aly 58.093.000Ja pan 128.085.000Jor dan 5.703.000Lativa 2.307.000Lith u a nia 3.431.000Lux em bourg 465.000Mac e do nia 2.034.000Malta 402.000Mex ico 107.029.000Namibia 2.031.000Neth er lands 16.299.000New Zea land 4.028.000Nor way 4.620.000
Coun try In hab it antsPo land 38.530.000Por tu gal 10.495.000Ro ma nia 21.711.000Slo vak Re pub lic 5.401.000Slovenia 1.967.000South Af rica 47.432.000Spain 43.064.000Swe den 9.041.000Swit zer land 7.252.000Tai wan 24.000.000Tu ni sia 10.102.000Tur key 73.193.000United King dom 59.668.000United States 298.213.000TOTAL 3.872.591.000
Ta ble 11: In hab it ants of the 48 sur veyed coun tries in al pha betic or der
Data source: Statistisches Jahrbuch Österreich, 2007, http://www.statistik.at
*France 62.329.000Guadeloupe 440.000Martinique 393.000Réunion 756.000Polynésie 244.000France métropole 60.496.000
Ta ble 12: In hab it ants of France
in clud ing overseas departments
Eco nomic Re gion In hab it antsUnited States + Can ada 330.481.000Ja pan 128.085.000China + Tai wan 1.339.844.000Eu rope 507.737.000Aus tra lia + New Zea land 24.183.000Oth ers 1.542.261.000TOTAL 3.872.591.000
Eu rope: EU-27, Al ba nia, Mac e do nia, Nor way, Over seas De part ments of France, Swit zer land.
Oth ers: Bar ba dos, Brazil, In dia, Is rael, Jor dan, Mex ico, Namibia, South Af rica, Tu ni sia and
Tur key
Ta ble 13: In hab it ants per economic region
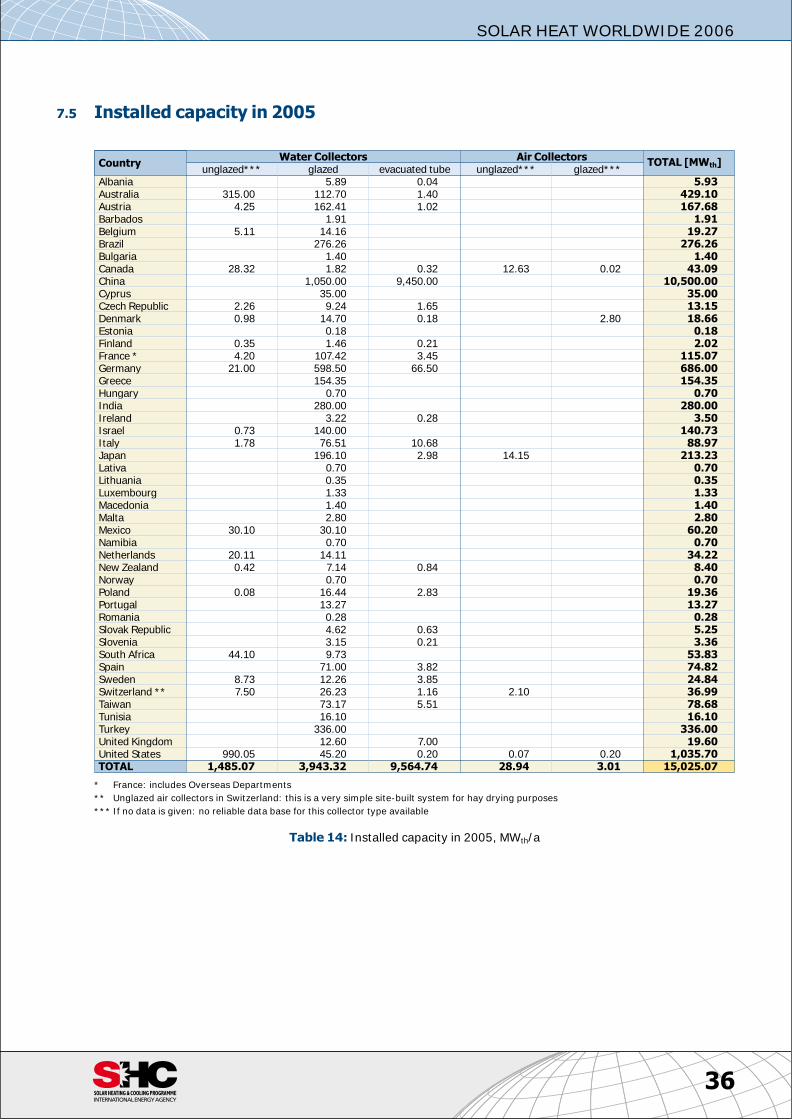
7.5 In stalled ca pac ity in 2005[[Tab le14.txt]]t14
36
SOLAR HEAT WORLDWIDE 2006
Coun tryWa ter Col lec tors Air Col lec tors
TOTAL [MWth]un glazed*** glazed evac u ated tube un glazed*** glazed***
Al ba nia 5.89 0.04 5.93Aus tra lia 315.00 112.70 1.40 429.10Aus tria 4.25 162.41 1.02 167.68Bar ba dos 1.91 1.91Bel gium 5.11 14.16 19.27Brazil 276.26 276.26Bul garia 1.40 1.40Can ada 28.32 1.82 0.32 12.63 0.02 43.09China 1,050.00 9,450.00 10,500.00Cy prus 35.00 35.00Czech Re pub lic 2.26 9.24 1.65 13.15Den mark 0.98 14.70 0.18 2.80 18.66Es to nia 0.18 0.18Fin land 0.35 1.46 0.21 2.02France * 4.20 107.42 3.45 115.07Ger many 21.00 598.50 66.50 686.00Greece 154.35 154.35Hun gary 0.70 0.70In dia 280.00 280.00Ire land 3.22 0.28 3.50Is rael 0.73 140.00 140.73It aly 1.78 76.51 10.68 88.97Ja pan 196.10 2.98 14.15 213.23Lativa 0.70 0.70Lith u a nia 0.35 0.35Lux em bourg 1.33 1.33Mac e do nia 1.40 1.40Malta 2.80 2.80Mex ico 30.10 30.10 60.20Namibia 0.70 0.70Neth er lands 20.11 14.11 34.22New Zea land 0.42 7.14 0.84 8.40Nor way 0.70 0.70Po land 0.08 16.44 2.83 19.36Por tu gal 13.27 13.27Ro ma nia 0.28 0.28Slo vak Re pub lic 4.62 0.63 5.25Slovenia 3.15 0.21 3.36South Af rica 44.10 9.73 53.83Spain 71.00 3.82 74.82Swe den 8.73 12.26 3.85 24.84Swit zer land ** 7.50 26.23 1.16 2.10 36.99Tai wan 73.17 5.51 78.68Tu ni sia 16.10 16.10Tur key 336.00 336.00United King dom 12.60 7.00 19.60United States 990.05 45.20 0.20 0.07 0.20 1,035.70TOTAL 1,485.07 3,943.32 9,564.74 28.94 3.01 15,025.07
* France: in cludes Over seas De part ments
** Un glazed air col lec tors in Swit zer land: this is a very sim ple site-built sys tem for hay dry ing pur poses
*** If no data is given: no re li able data base for this col lec tor type avail able
Ta ble 14: In stalled ca pac ity in 2005, MWth/a
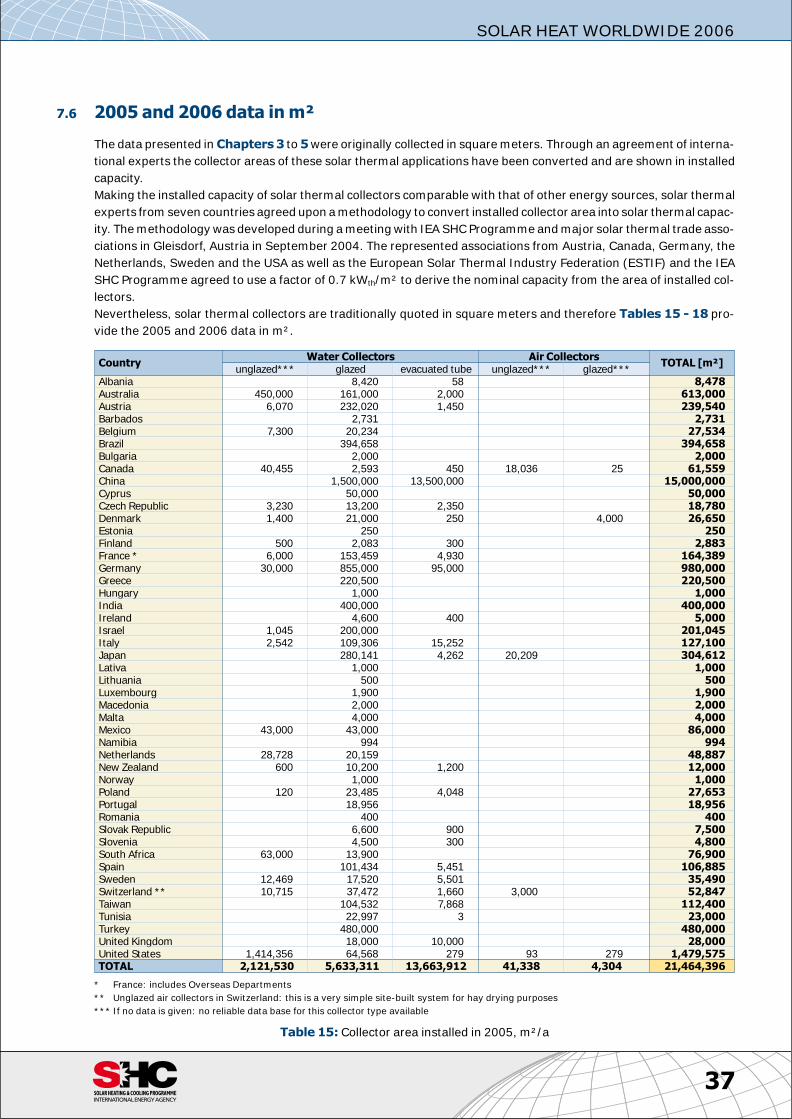
7.6 2005 and 2006 data in m²
The data pre sented in Chap ters 3 to 5 were orig i nally col lected in square me ters. Through an agree ment of in ter na -
tional ex perts the col lec tor ar eas of these so lar ther mal ap pli ca tions have been con verted and are shown in in stalled
ca pac ity.
Mak ing the in stalled ca pac ity of so lar ther mal col lec tors com pa ra ble with that of other en ergy sources, so lar ther mal
ex perts from seven coun tries agreed upon a meth od ol ogy to con vert in stalled col lec tor area into so lar ther mal ca pac -
ity. The meth od ol ogy was de vel oped dur ing a meet ing with IEA SHC Programme and ma jor so lar ther mal trade as so -
ci a tions in Gleisdorf, Aus tria in Sep tem ber 2004. The rep re sented as so ci a tions from Aus tria, Can ada, Ger many, the
Neth er lands, Swe den and the USA as well as the Eu ro pean So lar Ther mal In dus try Fed er a tion (ESTIF) and the IEA
SHC Programme agreed to use a fac tor of 0.7 kWth/m² to de rive the nom i nal ca pac ity from the area of in stalled col -
lec tors.
Nev er the less, so lar ther mal col lec tors are tra di tion ally quoted in square me ters and there fore Ta bles 15 - 18 pro -
vide the 2005 and 2006 data in m². [[Tab le15.txt]]t15
37
SOLAR HEAT WORLDWIDE 2006
Coun tryWa ter Col lec tors Air Col lec tors
TOTAL [m²]un glazed*** glazed evac u ated tube un glazed*** glazed***
Al ba nia 8,420 58 8,478Aus tra lia 450,000 161,000 2,000 613,000Aus tria 6,070 232,020 1,450 239,540Bar ba dos 2,731 2,731Bel gium 7,300 20,234 27,534Brazil 394,658 394,658Bul garia 2,000 2,000Can ada 40,455 2,593 450 18,036 25 61,559China 1,500,000 13,500,000 15,000,000Cy prus 50,000 50,000Czech Re pub lic 3,230 13,200 2,350 18,780Den mark 1,400 21,000 250 4,000 26,650Es to nia 250 250Fin land 500 2,083 300 2,883France * 6,000 153,459 4,930 164,389Ger many 30,000 855,000 95,000 980,000Greece 220,500 220,500Hun gary 1,000 1,000In dia 400,000 400,000Ire land 4,600 400 5,000Is rael 1,045 200,000 201,045It aly 2,542 109,306 15,252 127,100Ja pan 280,141 4,262 20,209 304,612Lativa 1,000 1,000Lith u a nia 500 500Lux em bourg 1,900 1,900Mac e do nia 2,000 2,000Malta 4,000 4,000Mex ico 43,000 43,000 86,000Namibia 994 994Neth er lands 28,728 20,159 48,887New Zea land 600 10,200 1,200 12,000Nor way 1,000 1,000Po land 120 23,485 4,048 27,653Por tu gal 18,956 18,956Ro ma nia 400 400Slo vak Re pub lic 6,600 900 7,500Slovenia 4,500 300 4,800South Af rica 63,000 13,900 76,900Spain 101,434 5,451 106,885Swe den 12,469 17,520 5,501 35,490Swit zer land ** 10,715 37,472 1,660 3,000 52,847Tai wan 104,532 7,868 112,400Tu ni sia 22,997 3 23,000Tur key 480,000 480,000United King dom 18,000 10,000 28,000United States 1,414,356 64,568 279 93 279 1,479,575TOTAL 2,121,530 5,633,311 13,663,912 41,338 4,304 21,464,396
* France: in cludes Over seas De part ments
** Un glazed air col lec tors in Swit zer land: this is a very sim ple site-built sys tem for hay dry ing pur poses
*** If no data is given: no re li able data base for this col lec tor type avail able
Ta ble 15: Col lec tor area in stalled in 2005, m²/a
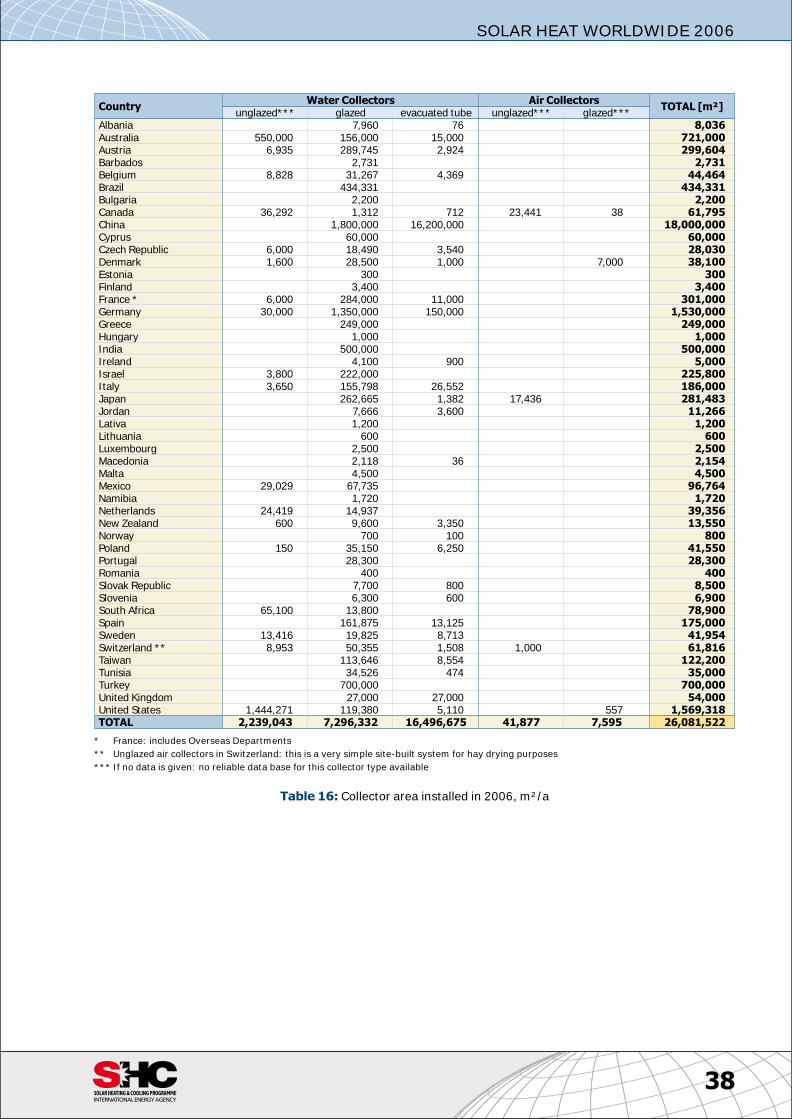
[[Tab le16.txt]]t16
38
SOLAR HEAT WORLDWIDE 2006
Coun tryWa ter Col lec tors Air Col lec tors
TOTAL [m²]un glazed*** glazed evac u ated tube un glazed*** glazed***
Al ba nia 7,960 76 8,036Aus tra lia 550,000 156,000 15,000 721,000Aus tria 6,935 289,745 2,924 299,604Bar ba dos 2,731 2,731Bel gium 8,828 31,267 4,369 44,464Brazil 434,331 434,331Bul garia 2,200 2,200Can ada 36,292 1,312 712 23,441 38 61,795China 1,800,000 16,200,000 18,000,000Cy prus 60,000 60,000Czech Re pub lic 6,000 18,490 3,540 28,030Den mark 1,600 28,500 1,000 7,000 38,100Es to nia 300 300Fin land 3,400 3,400France * 6,000 284,000 11,000 301,000Ger many 30,000 1,350,000 150,000 1,530,000Greece 249,000 249,000Hun gary 1,000 1,000In dia 500,000 500,000Ire land 4,100 900 5,000Is rael 3,800 222,000 225,800It aly 3,650 155,798 26,552 186,000Ja pan 262,665 1,382 17,436 281,483Jor dan 7,666 3,600 11,266Lativa 1,200 1,200Lith u a nia 600 600Lux em bourg 2,500 2,500Mac e do nia 2,118 36 2,154Malta 4,500 4,500Mex ico 29,029 67,735 96,764Namibia 1,720 1,720Neth er lands 24,419 14,937 39,356New Zea land 600 9,600 3,350 13,550Nor way 700 100 800Po land 150 35,150 6,250 41,550Por tu gal 28,300 28,300Ro ma nia 400 400Slo vak Re pub lic 7,700 800 8,500Slovenia 6,300 600 6,900South Af rica 65,100 13,800 78,900Spain 161,875 13,125 175,000Swe den 13,416 19,825 8,713 41,954Swit zer land ** 8,953 50,355 1,508 1,000 61,816Tai wan 113,646 8,554 122,200Tu ni sia 34,526 474 35,000Tur key 700,000 700,000United King dom 27,000 27,000 54,000United States 1,444,271 119,380 5,110 557 1,569,318TOTAL 2,239,043 7,296,332 16,496,675 41,877 7,595 26,081,522
* France: in cludes Over seas De part ments
** Un glazed air col lec tors in Swit zer land: this is a very sim ple site-built sys tem for hay dry ing pur poses
*** If no data is given: no re li able data base for this col lec tor type avail able
Ta ble 16: Col lec tor area in stalled in 2006, m²/a
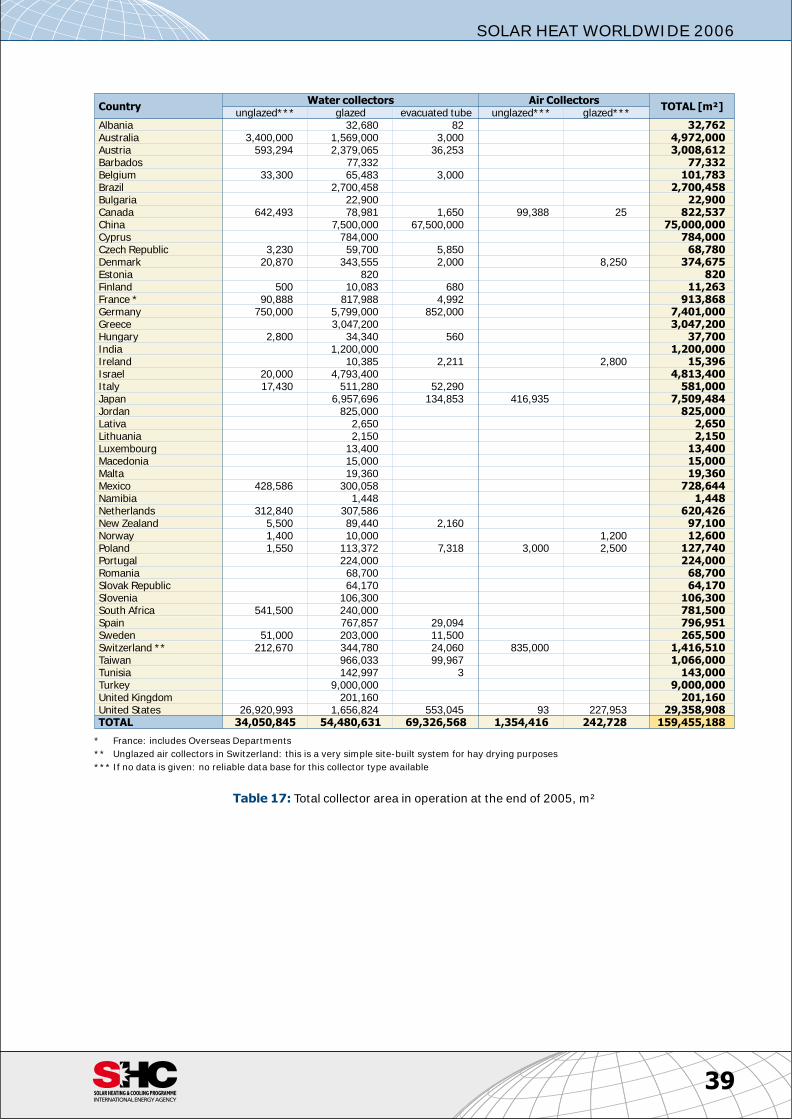
[[Tab le17.txt]]t17
39
SOLAR HEAT WORLDWIDE 2006
Coun tryWa ter col lec tors Air Col lec tors
TOTAL [m²]un glazed*** glazed evac u ated tube un glazed*** glazed***
Al ba nia 32,680 82 32,762Aus tra lia 3,400,000 1,569,000 3,000 4,972,000Aus tria 593,294 2,379,065 36,253 3,008,612Bar ba dos 77,332 77,332Bel gium 33,300 65,483 3,000 101,783Brazil 2,700,458 2,700,458Bul garia 22,900 22,900Can ada 642,493 78,981 1,650 99,388 25 822,537China 7,500,000 67,500,000 75,000,000Cy prus 784,000 784,000Czech Re pub lic 3,230 59,700 5,850 68,780Den mark 20,870 343,555 2,000 8,250 374,675Es to nia 820 820Fin land 500 10,083 680 11,263France * 90,888 817,988 4,992 913,868Ger many 750,000 5,799,000 852,000 7,401,000Greece 3,047,200 3,047,200Hun gary 2,800 34,340 560 37,700In dia 1,200,000 1,200,000Ire land 10,385 2,211 2,800 15,396Is rael 20,000 4,793,400 4,813,400It aly 17,430 511,280 52,290 581,000Ja pan 6,957,696 134,853 416,935 7,509,484Jor dan 825,000 825,000Lativa 2,650 2,650Lith u a nia 2,150 2,150Lux em bourg 13,400 13,400Mac e do nia 15,000 15,000Malta 19,360 19,360Mex ico 428,586 300,058 728,644Namibia 1,448 1,448Neth er lands 312,840 307,586 620,426New Zea land 5,500 89,440 2,160 97,100Nor way 1,400 10,000 1,200 12,600Po land 1,550 113,372 7,318 3,000 2,500 127,740Por tu gal 224,000 224,000Ro ma nia 68,700 68,700Slo vak Re pub lic 64,170 64,170Slovenia 106,300 106,300South Af rica 541,500 240,000 781,500Spain 767,857 29,094 796,951Swe den 51,000 203,000 11,500 265,500Swit zer land ** 212,670 344,780 24,060 835,000 1,416,510Tai wan 966,033 99,967 1,066,000Tu ni sia 142,997 3 143,000Tur key 9,000,000 9,000,000United King dom 201,160 201,160United States 26,920,993 1,656,824 553,045 93 227,953 29,358,908TOTAL 34,050,845 54,480,631 69,326,568 1,354,416 242,728 159,455,188
* France: in cludes Over seas De part ments
** Un glazed air col lec tors in Swit zer land: this is a very sim ple site-built sys tem for hay dry ing pur poses
*** If no data is given: no re li able data base for this col lec tor type avail able
Ta ble 17: To tal collector area in op er a tion at the end of 2005, m²
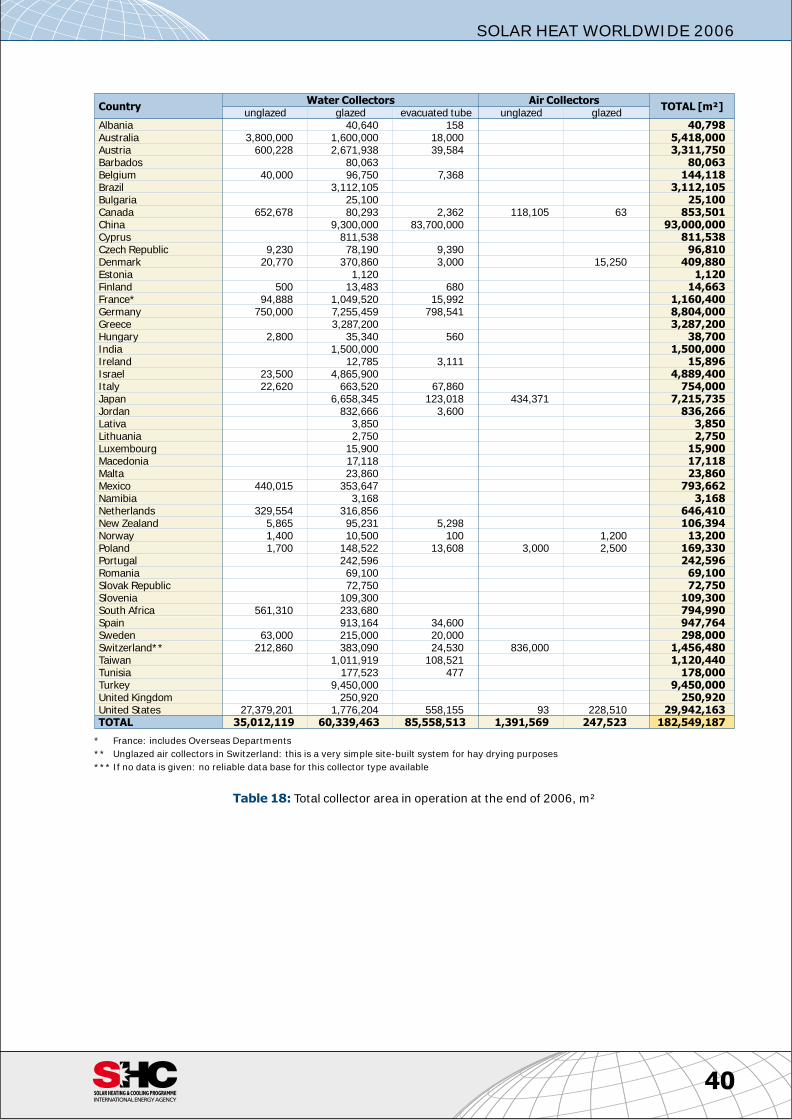
[[Tab le18.txt]]t18
40
SOLAR HEAT WORLDWIDE 2006
Coun tryWa ter Col lec tors Air Col lec tors
TOTAL [m²]un glazed glazed evac u ated tube un glazed glazed
Al ba nia 40,640 158 40,798Aus tra lia 3,800,000 1,600,000 18,000 5,418,000Aus tria 600,228 2,671,938 39,584 3,311,750Bar ba dos 80,063 80,063Bel gium 40,000 96,750 7,368 144,118Brazil 3,112,105 3,112,105Bul garia 25,100 25,100Can ada 652,678 80,293 2,362 118,105 63 853,501China 9,300,000 83,700,000 93,000,000Cy prus 811,538 811,538Czech Re pub lic 9,230 78,190 9,390 96,810Den mark 20,770 370,860 3,000 15,250 409,880Es to nia 1,120 1,120Fin land 500 13,483 680 14,663France* 94,888 1,049,520 15,992 1,160,400Ger many 750,000 7,255,459 798,541 8,804,000Greece 3,287,200 3,287,200Hun gary 2,800 35,340 560 38,700In dia 1,500,000 1,500,000Ire land 12,785 3,111 15,896Is rael 23,500 4,865,900 4,889,400It aly 22,620 663,520 67,860 754,000Ja pan 6,658,345 123,018 434,371 7,215,735Jor dan 832,666 3,600 836,266Lativa 3,850 3,850Lith u a nia 2,750 2,750Lux em bourg 15,900 15,900Mac e do nia 17,118 17,118Malta 23,860 23,860Mex ico 440,015 353,647 793,662Namibia 3,168 3,168Neth er lands 329,554 316,856 646,410New Zea land 5,865 95,231 5,298 106,394Nor way 1,400 10,500 100 1,200 13,200Po land 1,700 148,522 13,608 3,000 2,500 169,330Por tu gal 242,596 242,596Ro ma nia 69,100 69,100Slo vak Re pub lic 72,750 72,750Slovenia 109,300 109,300South Af rica 561,310 233,680 794,990Spain 913,164 34,600 947,764Swe den 63,000 215,000 20,000 298,000Swit zer land** 212,860 383,090 24,530 836,000 1,456,480Tai wan 1,011,919 108,521 1,120,440Tu ni sia 177,523 477 178,000Tur key 9,450,000 9,450,000United King dom 250,920 250,920United States 27,379,201 1,776,204 558,155 93 228,510 29,942,163TOTAL 35,012,119 60,339,463 85,558,513 1,391,569 247,523 182,549,187
* France: in cludes Over seas De part ments
** Un glazed air col lec tors in Swit zer land: this is a very sim ple site-built sys tem for hay dry ing pur poses
*** If no data is given: no re li able data base for this col lec tor type avail able
Ta ble 18: To tal collector area in op er a tion at the end of 2006, m²
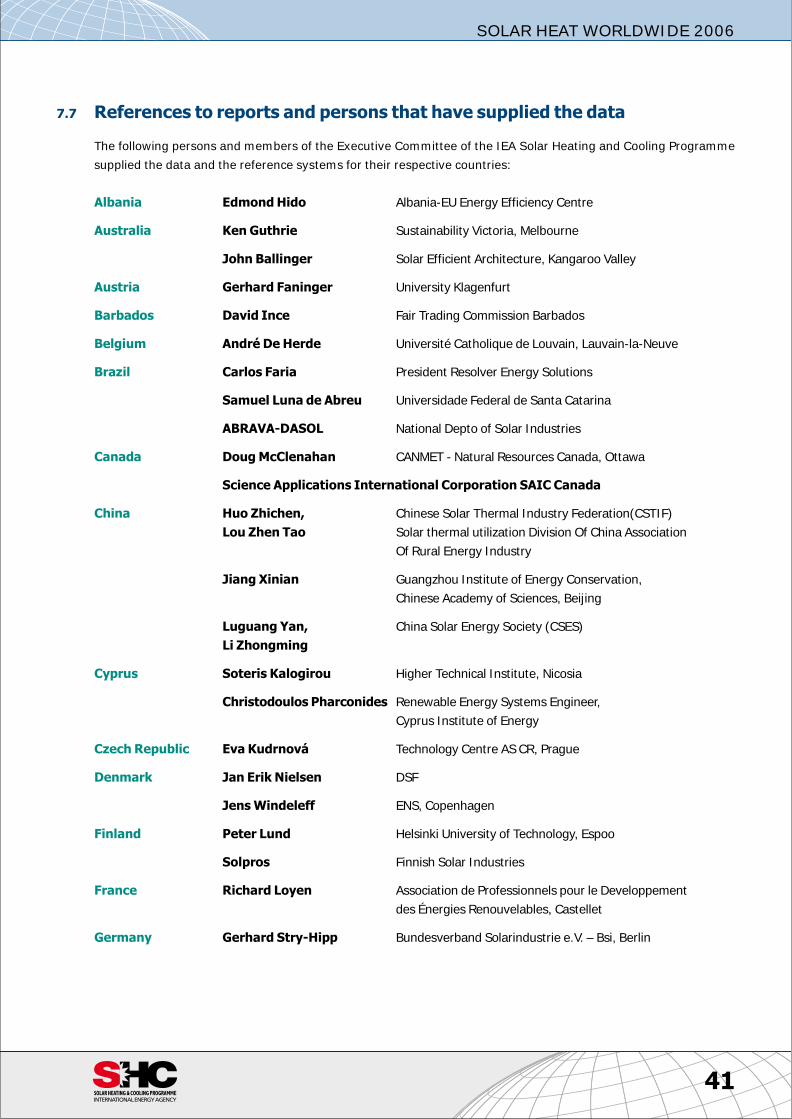
7.7 Ref er ences to re ports and per sons that have sup plied the data
The fol low ing per sons and mem bers of the Ex ec u tive Com mit tee of the IEA So lar Heat ing and Cool ing Programme
sup plied the data and the ref er ence sys tems for their re spec tive coun tries:
Al ba nia Edmond Hido Al ba nia-EU En ergy Ef fi ciency Cen tre
Aus tra lia Ken Guthrie Sustainability Vic to ria, Mel bourne
John Ballinger So lar Ef fi cient Ar chi tec ture, Kan ga roo Val ley
Aus tria Gerhard Faninger Uni ver sity Klagenfurt
Bar ba dos Da vid Ince Fair Trad ing Com mis sion Bar ba dos
Bel gium André De Herde Université Catholique de Louvain, Lauvain-la-Neuve
Brazil Carlos Faria Pres i dent Re solver En ergy So lu tions
Sam uel Luna de Abreu Universidade Fed eral de Santa Catarina
ABRAVA-DASOL Na tional Depto of So lar In dus tries
Can ada Doug McClenahan CANMET - Nat u ral Re sources Can ada, Ot tawa
Sci ence Ap pli ca tions In ter na tional Cor po ra tion SAIC Can ada
China Huo Zhichen,
Lou Zhen Tao
Chi nese So lar Ther mal In dus try Fed er a tion(CSTIF)
So lar ther mal uti li za tion Di vi sion Of China As so ci a tion
Of Ru ral En ergy Industry
Jiang Xinian Guangzhou In sti tute of En ergy Con ser va tion,
Chi nese Acad emy of Sci ences, Beijing
Luguang Yan,
Li Zhongming
China So lar En ergy So ci ety (CSES)
Cy prus Soteris Kalogirou Higher Tech ni cal In sti tute, Nicosia
Christodoulos Pharconides Re new able En ergy Sys tems En gi neer,
Cy prus In sti tute of En ergy
Czech Re pub lic Eva Kudrnová Tech nol ogy Cen tre AS CR, Prague
Den mark Jan Erik Niel sen DSF
Jens Windeleff ENS, Co pen ha gen
Fin land Pe ter Lund Hel sinki Uni ver sity of Tech nol ogy, Espoo
Solpros Finn ish So lar In dus tries
France Rich ard Loyen As so ci a tion de Professionnels pour le Developpement
des Énergies Renouvelables, Castellet
Ger many Gerhard Stry-Hipp Bundesverband Solarindustrie e.V. – Bsi, Berlin
41
SOLAR HEAT WORLDWIDE 2006
Greece Vassiliki Drosou So lar Ther mal Sys tems Sec tion, CRES - Cen tre for Re new able
En ergy Sources
Costas Travasaros Greek So lar In dus try As so ci a tion
Hun gary Istvan Farkas Hun gar ian So lar En ergy So ci ety
In dia Amit Kumar Co or di na tor, En ergy En vi ron ment Tech nol ogy Di vi sion, TERI
C. Palaniappan Plant ers En ergy Net work – PEN
Ire land Neil Cammish Re new able En ergy In for ma tion Of fice,
Sus tain able En ergy Ireland
Is rael Asher Vaturi ICTAF, Tel Aviv Uni ver sity
Min is try of Na tional
In fra struc tures
Solel and Is rael Man u fac tur ing As so ci a tion, Tel Aviv
ICBS Is rael Cen tral Bu reau of Sta tis tics
It aly Riccardo Battisti De part ment of Me chan i cal and Aero nau ti cal En gi neer ing,
Uni ver sity of Rome “La Sapienza”
Paolo Zampetti ENEA, Rome
Giacobbe Braccio ENEA, C.R. Trisaia, Rotondella, Matera
Ja pan Noriaki Yamashita Takuo Yamaguchi, In sti tute for Sus tain able En ergy Pol i cies
(ISEP)
So lar Sys tem De vel op ment As so ci a tion(SSDA)
OM So lar As so ci a tion, Ja pan, www.omsolar.net
Kazuki Yoshimura Na tional In sti tute of Ad vanced In dus trial Sci ence
and Tech nol ogy, Nagoya
Jor dan Walid Shahin Na tional En ergy Re search Cen ter NERC
Mac e do nia Dejan Zrmanovski Min is try of Econ omy, De part ment of En ergy, En ergy Ef fi ciency
and Re new able En ergy Sources Unit
Sanja Popovska-Vasilevska So lar Mac e do nia - Mac e do nian As so ci a tion for so lar energy
Mex ico Wilfrido Rivera
Gomez-Franco
Centro de Investigacion en Energia,
Universidad Nacional Autonoma de Mex ico
Claudio Estrada Centro de Investigacion en Energia, Temixco, Morelos
Asociación Nacional de Energía So lar, A.C.
Namibia Min is try of Mines & En ergy
Kudakwashe Ndhlukula Re new able En ergy & En ergy Ef fi ciency In sti tute-REEE
Brita Emmermacher The Desert Re search Foun da tion of Namibia, En ergy Desk
Neth er lands Reinoud Segers Sta tis tics Neth er lands
Lex Bosselaar SenterNovem, Utrecht
42
SOLAR HEAT WORLDWIDE 2006
New Zea land Mi chael Donn School of Ar chi tec ture, Vic to ria Uni ver sity of Wellington
Brian Cox So lar In dus tries As so ci a tion New Zea land
Nor way Fritjof Salvesen KanEnergi AS, Oslo
Po land Grzegorz Wis’niewski EC BREC In sti tute for Re new able En ergy Ltd., Po land
Stanislaw Golebiowski Krystian Kurowski, EC BREC / IBMER, Warzawa
Por tu gal João Farinha Mendes DER/INETI - Edificio G, Lis bon
ADENE Agência para a Energia (www.adene.pt)
Slovenia Gradbeni Institut ZRMK, Ljubliana
South Af rica Di eter Holm Sus tain able En ergy So ci ety of South ern Af rica, Pre to ria
Nadia Hamid, Mark Tanton En ergy De vel op ment Cor po ra tion (EDC) of the Cen tral En ergy
Fund (CEF)
Spain Manuel Romero Re new able En ergy Di vi sion, CIEMAT, Ma drid
Swe den Jan-Olof Dalenbäck Chalmers Uni ver sity of Tech nol ogy, Göteborg
So lar En ergy As so ci a tion – SEAS
Swit zer land Urs Wolfer Fed eral Of fice of En ergy, Bern
Tai wan Shyi-min Lu,
Tsung-Chi Chen
En ergy and En vi ron ment Re search Lab o ra to ries (EEL),
In dus trial Tech nol ogy Re search In sti tute (ITRI)
Tu ni sia Sami Marrouki Directeur ANME, Directeur Exécutif MEDREC
(Cen tre Méditerranéen des En er gies Renouvelables)
Ghazi Ben Sa lem ANME
Tur key A. Kutay Ülke Ex port De part ment, EZINC Metal San. ve Tic. A.S.
Sebahattin Öz So lar En ergy Di vi sion, Elec tri cal Power Sur vey and
De vel op ment Ad min is tra tion in Turkey
Gulsun Erkul First Sec re tary (En ergy Ad viser), Per ma nent Del e ga tion
of Tur key to the OECD
Mehmet ÇagUlar Ministery of En ergy and Nat u ral Re sources of TURKEY
United States Drury Craw ley U.S. De part ment of En ergy, Wash ing ton D.C.
43
SOLAR HEAT WORLDWIDE 2006
7.8 Re ports and Sta tis tics
The fol low ing re ports and sta tis tics were used in this re port:
• Eu ro pean So lar Ther mal In dus try Fed er a tion (ESTIF): So lar Ther mal Mar kets in Eu rope, Trends and Mar ket Sta -
tis tics 2006, 2007
• So lar Ther mal Ba rom e ter, EurObserv’ER, Oc to ber 2007
• Renewables 2007, Global Sta tus Re port, 2008, Deut sche Gesellschaft für Technische Zusammenarbeit (GTZ)
GmbH
• Na tional En ergy Bal ance 2006, Mex ico, 2008
• Dalenbäck, Jan-Olof: So lar Dis trict Heat ing and Cool ing, 1st draft re port for the Eu ro pean So lar Ther mal Tech nol -
ogy Plat form, 2007
• Faninger, Gerhard: Der Solarmarkt in Österreich 2006, BMVIT and IFF-Universität Klagenfurt, Vi enna and Graz,
Klagenfurt, 2007
• SOFAS: Markterhebung Sonnenenergie 2006, Teilstatistik der Schweizerischen Statistik der erneuerbaren
Energien, Bundesamt für Energie, Bern, 2007
• BCSE clean en ergy re port, Aus tra lia, 2007
• An nual So lar Ther mal Col lec tor Man u fac tures Sur vey, US DOE En ergy In for ma tion Ad min is tra tion EIA, So lar Man -
u fac tur ing Ac tiv i ties 2006, Table 37
• Bsi-Sta tis tic Solarthermie 1990 – 2006, BDH sur vey, Ger many
• En ergy Pol icy Sta tis ti cal Sup port Unit, Sus tain able En ergy Ire land, SEI-REIO sur vey 2007, Ireland
• Mar ket Sur vey of So lar Wa ter Heat ing in South Af rica for the En ergy De vel op ment Cor po ra tion (EDC) of the Cen -
tral En ergy Fund (CEF); by Di eter Holm for SolaSure, 2005-05-23
• South Af rica Year book 2006-2007, Min er als, en ergy and ge ol ogy, www.dme.gov.za/en ergy/re new_so lar.stm
• SARASIN, Sustainability Re port, So lar En ergy 2007, Bank Sarasin & Co. Ltd (“BSC”), Swit zer land, 2007
• Boletín IDAE, Eficienciy Energética y Energías renovables, 2007
• Re search Re port on De vel op ment of China’s So lar Wa ter Heater In dus try (2004-2005), ed ited by China So lar
Ther mal In dus try Fed er a tion(CSTIF)
• Con struc tion and hous ing sta tis tics 2004, Con struc tion Sta tis tics, Re pub lic of Cy prus, De cem ber 2005
• MAJOR PROGRAMMES OF RENEWABLE ENERGY SOURCES, Min is try of Non-Con ven tional En ergy Sources,
Goverment of In dia, http://mnes.nic.in/
• CBS: Sta tis tics Neth er lands, Rijswijk, www.cbs.nl
44
SOLAR HEAT WORLDWIDE 2006
7.9 In dex of Fig ures
Fig ure 1: Coun tries rep re sented in this re port (yel low) . . . . . . . . . . . . . . . . . . . . . . . . . . . . . . . . . . . . . . . . . . . . . . . . . . . . . . . . . . . . . . . . . . . . . 3
Fig ure 2: To tal ca pac ity in op er a tion [GWel], [GWth] 2006 and an nu ally en ergy gen er ated [TWhel], [TWhth].
Sources: EPIA, GEWC, EWEA, EGEC, RENC1 and IEA SHC 2008 . . . . . . . . . . . . . . . . . . . . . . . . . . . . . . . . . . . . . . . . . . . 6
Fig ure 3: Dis tri bu tion of the world wide ca pac ity in op er a tion 2006 by col lec tor type . . . . . . . . . . . . . . . . . . . . . . . . . . . . . . 9
Fig ure 4: To tal ca pac ity in op er a tion of wa ter col lec tors of the 10 lead ing coun tries at the end of 2006 . . . . . . 9
Fig ure 5: To tal ca pac ity of glazed flat-plate and evac u ated tube col lec tors in op er a tion at the end of 2006 . . . . 10
Fig ure 6: To tal ca pac ity of glazed flat-plate and evac u ated tube col lec tors in op er a tion at the end of 2006
in kWth per 1,000 in hab it ants . . . . . . . . . . . . . . . . . . . . . . . . . . . . . . . . . . . . . . . . . . . . . . . . . . . . . . . . . . . . . . . . . . . . . . . . . . . . . . . . . . . . . . . . . 10
Fig ure 7: To tal ca pac ity of glazed flat-plate and evac u ated tube col lec tors in op er a tion by eco nomic re gion
at the end of 2006 . . . . . . . . . . . . . . . . . . . . . . . . . . . . . . . . . . . . . . . . . . . . . . . . . . . . . . . . . . . . . . . . . . . . . . . . . . . . . . . . . . . . . . . . . . . . . . . . . . . . . . . . 11
Fig ure 8: To tal ca pac ity of glazed flat-plate and evac u ated tube col lec tors in op er a tion by eco nomic re gion
at the end of 2006 in kWth per 1,000 in hab it ants . . . . . . . . . . . . . . . . . . . . . . . . . . . . . . . . . . . . . . . . . . . . . . . . . . . . . . . . . . . . . . . . 11
Fig ure 9: To tal ca pac ity of un glazed wa ter col lec tors in op er a tion at the end of 2006 . . . . . . . . . . . . . . . . . . . . . . . . . . . . . . 12
Fig ure 10: To tal ca pac ity of un glazed wa ter col lec tors in op er a tion at end of 2006 in kWth
per 1,000 in hab it ants . . . . . . . . . . . . . . . . . . . . . . . . . . . . . . . . . . . . . . . . . . . . . . . . . . . . . . . . . . . . . . . . . . . . . . . . . . . . . . . . . . . . . . . . . . . . . . . . . . . . 12
Fig ure 11: To tal ca pac ity of un glazed col lec tors in op er a tion by eco nomic re gion at the end of 2006 . . . . . . . . . . . 13
Fig ure 12: To tal ca pac ity of un glazed col lec tors in op er a tion by eco nomic re gion at the end of 2006
in kWth per 1,000 in hab it ants . . . . . . . . . . . . . . . . . . . . . . . . . . . . . . . . . . . . . . . . . . . . . . . . . . . . . . . . . . . . . . . . . . . . . . . . . . . . . . . . . . . . . . . . . 13
Fig ure 13: An nual in stalled ca pac ity of flat-plate and evac u ated tube col lec tors from 1999 to 2006 . . . . . . . . . . . . 15
Fig ure 14: An nual in stalled ca pac ity of flat-plate and evac u ated tube col lec tors in kWth
per 1,000 in hab it ants from 1999 to 2006 . . . . . . . . . . . . . . . . . . . . . . . . . . . . . . . . . . . . . . . . . . . . . . . . . . . . . . . . . . . . . . . . . . . . . . . . . 16
Fig ure 15: An nual in stalled ca pac ity of un glazed wa ter col lec tors from 1999 to 2006 . . . . . . . . . . . . . . . . . . . . . . . . . . . . . . 17
Fig ure 16: An nual col lec tor yield of glazed flat-plate and evac u ated tube col lec tors in op er a tion by eco nomic
re gion at the end of 2006 . . . . . . . . . . . . . . . . . . . . . . . . . . . . . . . . . . . . . . . . . . . . . . . . . . . . . . . . . . . . . . . . . . . . . . . . . . . . . . . . . . . . . . . . . . . . . . 22
Fig ure 17: An nual col lec tor yield of glazed flat-plate and evac u ated tube col lec tors in op er a tion by eco nomic
re gion at the end of 2006 in kWh per 1,000 in hab it ants . . . . . . . . . . . . . . . . . . . . . . . . . . . . . . . . . . . . . . . . . . . . . . . . . . . . . . . 22
Fig ure 18: An nual col lec tor yield of un glazed col lec tors in op er a tion by eco nomic re gion at the end of 2006 . . . . 23
Fig ure 19: An nual col lec tor yield of un glazed col lec tors in op er a tion by eco nomic re gion at the end of 2006
in kWh per 1,000 in hab it ants . . . . . . . . . . . . . . . . . . . . . . . . . . . . . . . . . . . . . . . . . . . . . . . . . . . . . . . . . . . . . . . . . . . . . . . . . . . . . . . . . . . . . . . . . 23
Fig ure 20: An nual en ergy sav ings in oil equiv a lent by glazed flat-plate and evac u ated tube col lec tors
by eco nomic re gion at the end of 2006 . . . . . . . . . . . . . . . . . . . . . . . . . . . . . . . . . . . . . . . . . . . . . . . . . . . . . . . . . . . . . . . . . . . . . . . . . . . . . 24
Fig ure 21: An nual en ergy sav ings in oil equiv a lent by glazed flat-plate and evac u ated tube col lec tors in
op er a tion by eco nomic re gion at the end of 2006 per 1,000 in hab it ants . . . . . . . . . . . . . . . . . . . . . . . . . . . . . . . . . . 24
Fig ure 22: An nual en ergy sav ings in oil equiv a lent by un glazed col lec tors by eco nomic re gion at the end
of 2006 . . . . . . . . . . . . . . . . . . . . . . . . . . . . . . . . . . . . . . . . . . . . . . . . . . . . . . . . . . . . . . . . . . . . . . . . . . . . . . . . . . . . . . . . . . . . . . . . . . . . . . . . . . . . . . . . . . . . . . 25
Fig ure 23: An nual en ergy sav ings in oil equiv a lent by un glazed col lec tors by eco nomic re gion at the end
of 2006 per 1,000 in hab it ants . . . . . . . . . . . . . . . . . . . . . . . . . . . . . . . . . . . . . . . . . . . . . . . . . . . . . . . . . . . . . . . . . . . . . . . . . . . . . . . . . . . . . . . . 25
Fig ure 24: An nual con tri bu tion to CO2 re duc tion by flat-plate and evac u ated tube col lec tors by eco nomic
re gion the end of 2006 . . . . . . . . . . . . . . . . . . . . . . . . . . . . . . . . . . . . . . . . . . . . . . . . . . . . . . . . . . . . . . . . . . . . . . . . . . . . . . . . . . . . . . . . . . . . . . . . . . 26
Fig ure 25: An nual con tri bu tion to CO2 re duc tion by flat-plate and evac u ated tube col lec tors by eco nomic
re gion at the end of 2006 per 1,000 in hab it ants . . . . . . . . . . . . . . . . . . . . . . . . . . . . . . . . . . . . . . . . . . . . . . . . . . . . . . . . . . . . . . . . . 26
Fig ure 26: An nual con tri bu tion to CO2 re duc tion by un glazed col lec tors by eco nomic re gion at the end
of 2006 . . . . . . . . . . . . . . . . . . . . . . . . . . . . . . . . . . . . . . . . . . . . . . . . . . . . . . . . . . . . . . . . . . . . . . . . . . . . . . . . . . . . . . . . . . . . . . . . . . . . . . . . . . . . . . . . . . . . . . 27
Fig ure 27: An nual con tri bu tion to CO2 re duc tion by un glazed col lec tors by eco nomic re gion at the end
of 2006 per 1,000 in hab it ants . . . . . . . . . . . . . . . . . . . . . . . . . . . . . . . . . . . . . . . . . . . . . . . . . . . . . . . . . . . . . . . . . . . . . . . . . . . . . . . . . . . . . . . . 27
45
SOLAR HEAT WORLDWIDE 2006
Fig ure 28: Dis tri bu tion of dif fer ent ap pli ca tions by eco nomic re gion for the to tal ca pac ity in op er a tion
of glazed and evac u ated tube col lec tors in 2006 . . . . . . . . . . . . . . . . . . . . . . . . . . . . . . . . . . . . . . . . . . . . . . . . . . . . . . . . . . . . . . . . . 28
Fig ure 29: Dis tri bu tion of dif fer ent ap pli ca tions of the world’s top-10-coun tries re lated to the to tal ca pac ity
in op er a tion of glazed and evac u ated tube col lec tors in 2006 . . . . . . . . . . . . . . . . . . . . . . . . . . . . . . . . . . . . . . . . . . . . . . . . 29
Fig ure 30: Dis tri bu tion of dif fer ent ap pli ca tions in the Eu ro pean top-10-coun tries re lated to the to tal ca pac ity
in op er a tion of glazed and evac u ated tube col lec tors in 2006 . . . . . . . . . . . . . . . . . . . . . . . . . . . . . . . . . . . . . . . . . . . . . . . 29
Fig ure 31: Large-scale so lar heat ing and cool ing plants in Eu rope at the end of 2007 . . . . . . . . . . . . . . . . . . . . . . . . . . . . . . . 30
Fig ure 32: Hy drau lic scheme of the swim ming pool ref er ence sys tem . . . . . . . . . . . . . . . . . . . . . . . . . . . . . . . . . . . . . . . . . . . . . . . . . . . 31
Fig ure 33: Hy drau lic scheme of the DHW ref er ence sys tem . . . . . . . . . . . . . . . . . . . . . . . . . . . . . . . . . . . . . . . . . . . . . . . . . . . . . . . . . . . . . . . . 32
Fig ure 34: Hy drau lic schemscheme of the so lar combi ref er ence sys tem . . . . . . . . . . . . . . . . . . . . . . . . . . . . . . . . . . . . . . . . . . . . . . . 33
Fig ure 35: Hy drau lic scheme of the so lar combi ref er ence sys tem . . . . . . . . . . . . . . . . . . . . . . . . . . . . . . . . . . . . . . . . . . . . . . . . . . . . . . . . 34
7.10 In dex of Ta bles
Ta ble 1: To tal ca pac ity in op er a tion at the end of 2006 [MWth] . . . . . . . . . . . . . . . . . . . . . . . . . . . . . . . . . . . . . . . . . . . . . . . . . . . . . . . . . . 8
Ta ble 2: In stalled ca pac ity in 2006, MWth/a . . . . . . . . . . . . . . . . . . . . . . . . . . . . . . . . . . . . . . . . . . . . . . . . . . . . . . . . . . . . . . . . . . . . . . . . . . . . . . . . . . 14
Ta ble 3: Cal cu lated col lec tor yield and cor re spond ing oil equiv a lent as well as CO2 re duc tion of all so lar
ther mal sys tems (sys tems for hot wa ter, space heat ing and swim ming pool heat ing)
at the end of 2006 . . . . . . . . . . . . . . . . . . . . . . . . . . . . . . . . . . . . . . . . . . . . . . . . . . . . . . . . . . . . . . . . . . . . . . . . . . . . . . . . . . . . . . . . . . . . . . . . . . . . . . . . 19
Ta ble 4: Cal cu lated col lec tor yield and cor re spond ing oil equiv a lent as well as CO2 re duc tion of so lar
ther mal sys tems for hot wa ter prep a ra tion and space heat ing with flat-plate and evac u ated
tube col lec tors at the end of 2006 . . . . . . . . . . . . . . . . . . . . . . . . . . . . . . . . . . . . . . . . . . . . . . . . . . . . . . . . . . . . . . . . . . . . . . . . . . . . . . . . . . . 20
Ta ble 5: Cal cu lated col lec tor yield and cor re spond ing oil equiv a lent as well as CO2 re duc tion of so lar
ther mal sys tems for swim ming pool heat ing with un glazed col lec tors at the end of 2006 . . . . . . . . . . . 21
Ta ble 6: Ref er ence sys tems for swim ming pool sys tems . . . . . . . . . . . . . . . . . . . . . . . . . . . . . . . . . . . . . . . . . . . . . . . . . . . . . . . . . . . . . . . . . 31
Ta ble 7: Ref er ence sys tems for do mes tic hot wa ter sys tems for sin gle fam ily houses and the per cent age
of the to tal col lec tor area in op er a tion (flat-plate and evac u ated tube col lec tors) . . . . . . . . . . . . . . . . . . . . . . 32
Ta ble 8: Ref er ence sys tems for do mes tic hot wa ter sys tems for multi-fam ily houses, ho tels and dis trict
heat ing and the per cent age of the to tal col lec tor area in op er a tion (flat-plate and evac u ated
tube col lec tors) . . . . . . . . . . . . . . . . . . . . . . . . . . . . . . . . . . . . . . . . . . . . . . . . . . . . . . . . . . . . . . . . . . . . . . . . . . . . . . . . . . . . . . . . . . . . . . . . . . . . . . . . . . . 33
Ta ble 9: Ref er ence sys tems for combisystems for sin gle-fam ily houses and the per cent age of the to tal
col lec tor area in op er a tion (flat-plate and evac u ated tube col lec tors) . . . . . . . . . . . . . . . . . . . . . . . . . . . . . . . . . . . . . 34
Ta ble 10: Ref er ence cli mates for the 48 coun tries sur veyed . . . . . . . . . . . . . . . . . . . . . . . . . . . . . . . . . . . . . . . . . . . . . . . . . . . . . . . . . . . . . . . 35
Ta ble 11: In hab it ants of the 48 sur veyed coun tries in al pha betic or der . . . . . . . . . . . . . . . . . . . . . . . . . . . . . . . . . . . . . . . . . . . . . . . . 35
Ta ble 12: In hab it ants of France in clud ing Over seas De part ments . . . . . . . . . . . . . . . . . . . . . . . . . . . . . . . . . . . . . . . . . . . . . . . . . . . . . . . 35
Ta ble 13: In hab it ants per Eco nomic Re gion . . . . . . . . . . . . . . . . . . . . . . . . . . . . . . . . . . . . . . . . . . . . . . . . . . . . . . . . . . . . . . . . . . . . . . . . . . . . . . . . . . . . 35
Ta ble 14: In stalled ca pac ity in 2005, MWth/a . . . . . . . . . . . . . . . . . . . . . . . . . . . . . . . . . . . . . . . . . . . . . . . . . . . . . . . . . . . . . . . . . . . . . . . . . . . . . . . . . . 36
Ta ble 15: Col lec tor area in stalled in 2005, m²/a . . . . . . . . . . . . . . . . . . . . . . . . . . . . . . . . . . . . . . . . . . . . . . . . . . . . . . . . . . . . . . . . . . . . . . . . . . . . . . 37
Ta ble 16: Col lec tor area in stalled in 2006, m²/a . . . . . . . . . . . . . . . . . . . . . . . . . . . . . . . . . . . . . . . . . . . . . . . . . . . . . . . . . . . . . . . . . . . . . . . . . . . . . . 38
Ta ble 17: To tal collector area in op er a tion at the end of 2005, m² . . . . . . . . . . . . . . . . . . . . . . . . . . . . . . . . . . . . . . . . . . . . . . . . . . . . . . . 39
Ta ble 18: To tal collector area in op er a tion at the end of 2006, m² . . . . . . . . . . . . . . . . . . . . . . . . . . . . . . . . . . . . . . . . . . . . . . . . . . . . . . . 40
46
SOLAR HEAT WORLDWIDE 2006