Embed Size (px)
Citation preview
Solar enhanced oil recoveryAn in-country value assessment for Oman
January 2014

In September 2013, GlassPoint Solar Inc. (GlassPoint) commissioned Ernst & Young LLP (EY) to conduct an economic impact assessment of the roll-out of solar thermal enhanced oil recovery technology in Oman over the next decade (years 2014-23).
This report presents the results of our analysis based on publicly available statistics and information on the Omani and other neighboring Persian Gulf economies as well as project information from GlassPoint.
The economic impacts presented in this report are in current prices, in USD millions.
For any information on the content of this report, please contact:
Mark Gregory Chief Economist, EY
+44 20 7951 5890 [email protected]
David OmomManager, EY
+44 20 7783 0071 [email protected]
Pierre-Alexandre GreilExecutive, EY
+44 20 7951 8868 [email protected]
4Solar enhanced oil recovery An in-country value assessment for Oman
Section Page
Executive summary 1
1. Enhanced oil recovery in Oman 7
Omani oil and gas sector 8
Enhanced Oil Recovery 11
Solar EOR and CSP technologies 16
2. Contribution to the Omani economy 23
Methodology 24
Commercial deployment of solar EOR 25
Direct economic contribution 26
Indirect economic impact of solar EOR 27
Induced effects 27
Use of natural gas savings 28
Summary of economic impact 28
Effectiveness of solar thermal for EOR vs. power generation in saving natural gas 32
Skill development and innovation 33
3. Security of energy supply, EOR potential and environmental impacts 34
EOR in the Middle East and technology export potential 35
Environmental benefits of solar EOR for Oman 37
Security of supply benefits of solar EOR for Oman 37
Glossary 38
Appendices 39
Appendix A Methodology 40
Appendix B Sources 46
Appendix C Time-independent assumptions 47
Appendix D Time-dependent assumptions 48
Appendix E Industry nomenclature 49
Contents
5 Solar enhanced oil recovery An in-country value assessment for Oman
1Solar enhanced oil recovery An in-country value assessment for Oman
Executive summary
2 Solar enhanced oil recovery An in-country value assessment for Oman
In 2012 the Sultanate of Oman (Oman) produced 920,000 barrels per day (bbl/d) of crude oil, ranking 21st in global oil production by country1. It also produced 2.8 billion cubic feet (bcf) of natural gas, making it the 5th largest gas producer in the Middle East and the 26th largest in the world2.Over the last ten years, due to the maturity of its oil fields, Oman’s domestic crude oil production has increasingly relied on enhanced oil recovery (EOR) technologies. Several techniques have been deployed, although thermal EOR, the focus of this report, dominates. The main thermal EOR technique entails burning natural gas to produce steam, which is injected into the reservoir to heat heavy oil and reduce its viscosity. The process increases both the rate of production and the amount of oil that can ultimately be recovered.
The oil and gas sector in Oman is investing significantly in EOR. Petroleum Development Oman (PDO), which commissioned its first EOR project in 2004, announced in 2012 that EOR would grow from 3% of current oil production to 25% of total liquids production by 2020.
1 “Oman Country Analysis,” US Energy Information Administration, http://www.eia.gov/countries/country-data.cfm?fips=MU, accessed 30 October 2013.
2 BP Statistical Review of World Energy 2013, http://www.bp.com/content/dam/bp/pdf/statistical-review/statistical_review_of_world_energy_2013.pdf, accessed 30 October 2013.
Executive summary
Solar EOR is likely to play an important role in the mix of EOR technologies. Instead of burning natural gas to produce steam, solar EOR involves the use of concentrating solar power (CSP) technology to produce steam. Mirrors are used to reflect and concentrate sunlight onto receivers that collect solar energy and then convert it to heat. The heat is then used to produce steam from water.
Solar EOR can generate the same quality and temperature of steam as natural gas3. Therefore, the use of solar EOR could reduce demand for natural gas required for EOR, which can be re-directed to other economic activities such as power generation, water desalination and as feedstock and energy for industrial processes4.
3 Sunil Kokal and Abdulaziz Al-Kaabi, “Enhanced oil recovery: challenges and opportunities,” EXPEC Advanced Research Centre, Saudi Aramco, http://www.world-petroleum.org/docs/docs/publications/2010yearbook/P64-69_Kokal-Al_Kaabi.pdf, accessed 30 October 2013.
4 Ibid.
3Solar enhanced oil recovery An in-country value assessment for Oman
Deploying solar EOR could provide a hedge that reduces the volatility of field operating costs as the cost of steam generated using solar energy is independent of the cost and availability of natural gas. Moreover, it also secures the long-term cost of steam once the system is installed since solar steam generators can produce at low operations cost5.
Solar EOR infrastructure can also be installed in oilfields with limited availability of natural gas, thereby providing a way to create and inject steam for EOR with no capital investment in gas infrastructure and allowing the development of many of Oman’s ‘stranded assets’. Moreover, owing to minimal operating expenses, use of solar EOR could enable producers to steam wells for a longer period of time compared to using gas-fired steam, thereby increasing the proved reserves of a reservoir.
PDO began investigating solar steam generation in 2005 because of a recognition that EOR’s strategic importance to Oman was going to create a long-term gas supply conflict. In 2009, the company initiated a tender process. This resulted in an award to GlassPoint Solar in August 2011 for the construction of a 7MWth pilot project in the Amal West field in Southern Oman. The pilot has delivered its targets so far and large-scale deployment is contemplated.
Oman currently uses 22% of its natural gas resources for EOR6. The continuous increase in domestic demand for natural gas makes the deployment of solar EOR technology an attractive economic proposition for the Sultanate of Oman.
We have assessed the uptake of solar EOR under three alternative scenarios for 2014–23, analyzing the direct and indirect impact on jobs and economic value added. These scenarios assume that by 2020, approximately 35% of the total oil production in Oman, or 370,000 bbl/d will result from the deployment of thermal EOR technologies. This is in line with EOR production estimates from PDO, Occidental Petroleum Corporation (Oxy) and other industry stakeholders.
5 Stuart Heisler, “Oil and Gas Production: Emergence of Solar Enhanced Oil Recovery,” Oilandgasiq.com, accessed 30 October 2013.
6 Idris Kathiwalla, “Omani Oil and Gas Sector Note,” Oman Arab Bank, Investment Management Group, April 2013, http://www.oabinvest.com/Reports/Omani Oil Sector Note.pdf, accessed 30 October 2013.
We have also assumed that solar EOR accounts for varying proportions of this growth in thermal EOR production.
► The “Steady growth” scenario assumes solar EOR accounts for only 22% of the total thermal EOR by the end of the deployment period.
► The “Leadership” scenario assumes solar EOR accounts for half of total thermal EOR. In this scenario we assume that the Sultanate of Oman accelerates the deployment of solar EOR and targets industry leadership with potential export opportunities to other Gulf Cooperation Council (GCC) countries.
► The “Full-scale deployment” scenario assumes deployment that stretches the solar EOR technology to its technical limit, i.e., 80% of all thermal EOR coming from solar by the end of the deployment period.
All three scenarios would lead to significant deployment of solar EOR in Oman.
The installation of the solar EOR systems will have a direct effect on economic activity and job creation in the Omani manufacturing and services sectors. The amount of natural gas displaced due to the substitution by solar EOR technology could be re-injected into the economy. This can be done either by enabling alternative industrial projects or feeding other thermal EOR projects, thereby enabling the extraction of more oil. Alternatively, it could simply improve Oman’s balance of payments and enhance the Sultanate’s security of energy supply.
Executive summary
4 Solar enhanced oil recovery An in-country value assessment for Oman
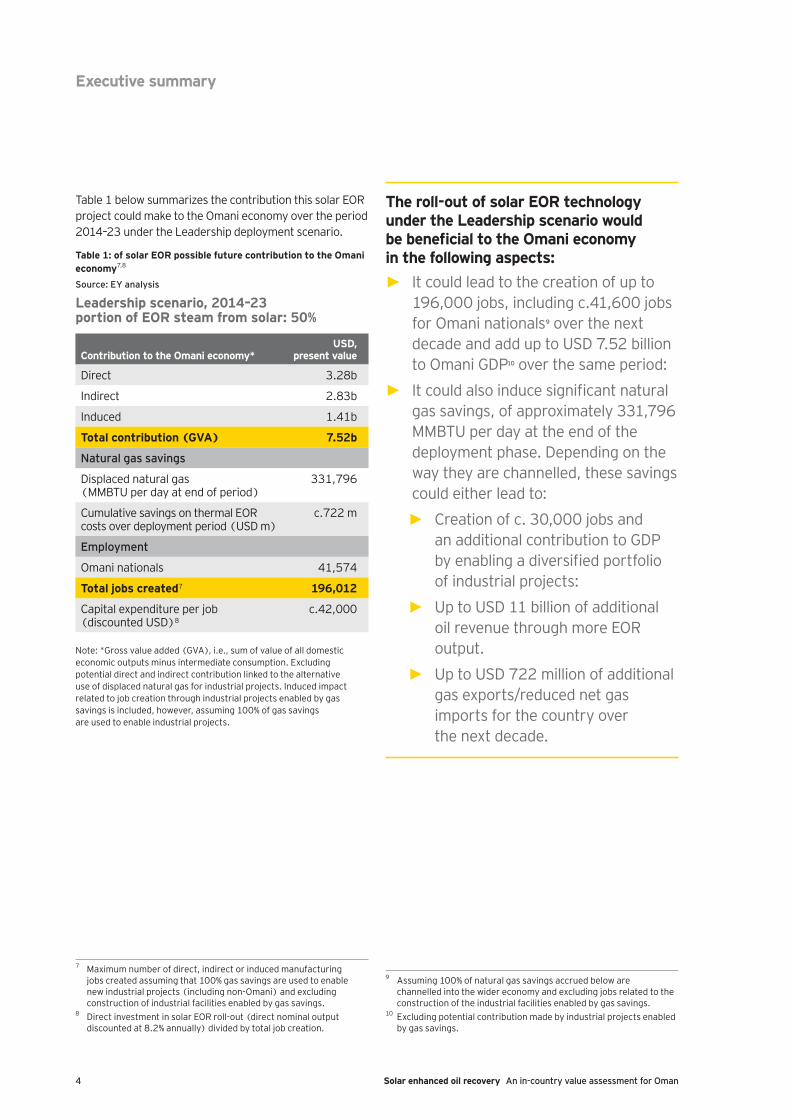
Table 1 below summarizes the contribution this solar EOR project could make to the Omani economy over the period 2014–23 under the Leadership deployment scenario.
Table 1: of solar EOR possible future contribution to the Omani economy7,8
Source: EY analysis
Leadership scenario, 2014–23 portion of EOR steam from solar: 50%
Contribution to the Omani economy*USD,
present value
Direct 3.28b
Indirect 2.83b
Induced 1.41b
Total contribution (GVA) 7.52b
Natural gas savings
Displaced natural gas (MMBTU per day at end of period)
331,796
Cumulative savings on thermal EOR costs over deployment period (USD m)
c.722 m
Employment
Omani nationals 41,574
Total jobs created7 196,012
Capital expenditure per job (discounted USD)8
c.42,000
Note: *Gross value added (GVA), i.e., sum of value of all domestic economic outputs minus intermediate consumption. Excluding potential direct and indirect contribution linked to the alternative use of displaced natural gas for industrial projects. Induced impact related to job creation through industrial projects enabled by gas savings is included, however, assuming 100% of gas savings are used to enable industrial projects.
7 Maximum number of direct, indirect or induced manufacturing jobs created assuming that 100% gas savings are used to enable new industrial projects (including non-Omani) and excluding construction of industrial facilities enabled by gas savings.
8 Direct investment in solar EOR roll-out (direct nominal output discounted at 8.2% annually) divided by total job creation.
The roll-out of solar EOR technology under the Leadership scenario would be beneficial to the Omani economy in the following aspects:
► It could lead to the creation of up to 196,000 jobs, including c.41,600 jobs for Omani nationals9 over the next decade and add up to USD 7.52 billion to Omani GDP10 over the same period:
► It could also induce significant natural gas savings, of approximately 331,796 MMBTU per day at the end of the deployment phase. Depending on the way they are channelled, these savings could either lead to:
► Creation of c. 30,000 jobs and an additional contribution to GDP by enabling a diversified portfolio of industrial projects:
► Up to USD 11 billion of additional oil revenue through more EOR output.
► Up to USD 722 million of additional gas exports/reduced net gas imports for the country over the next decade.
9 Assuming 100% of natural gas savings accrued below are channelled into the wider economy and excluding jobs related to the construction of the industrial facilities enabled by gas savings.
10 Excluding potential contribution made by industrial projects enabled by gas savings.
Executive summary
5Solar enhanced oil recovery An in-country value assessment for Oman
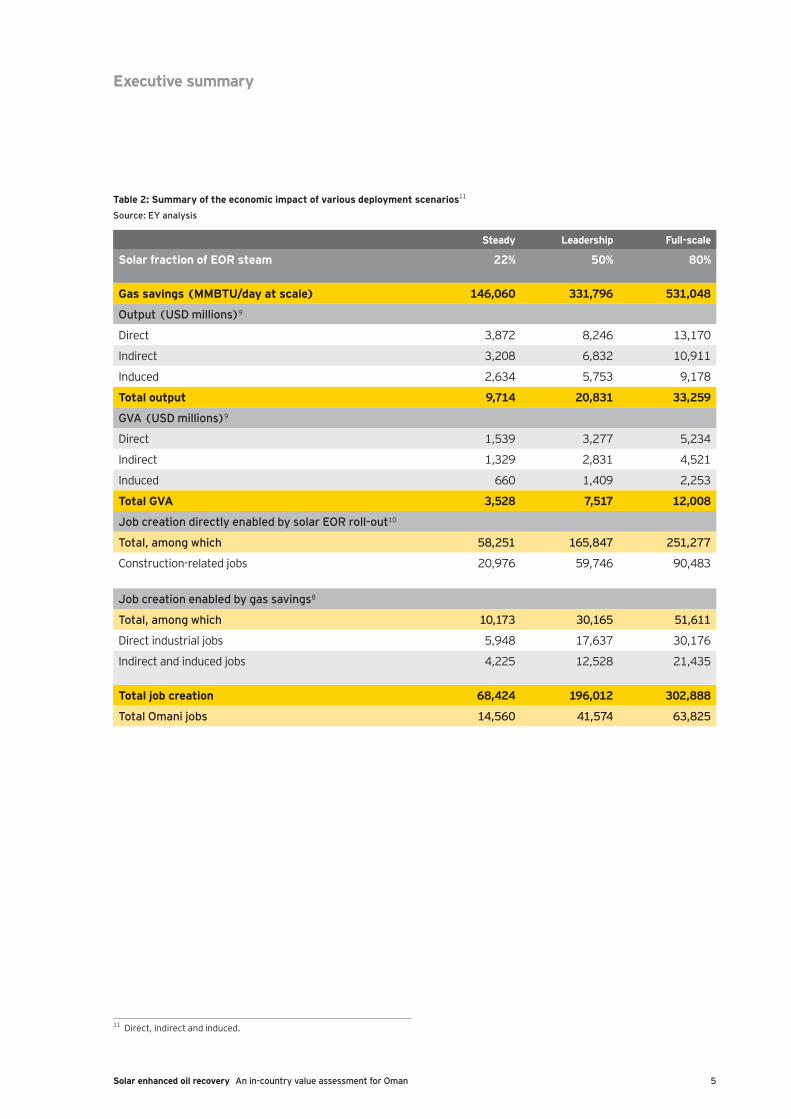
Table 2: Summary of the economic impact of various deployment scenarios11
Source: EY analysis
Steady Leadership Full-scale
Solar fraction of EOR steam 22% 50% 80%
Gas savings (MMBTU/day at scale) 146,060 331,796 531,048
Output (USD millions)9
Direct 3,872 8,246 13,170
Indirect 3,208 6,832 10,911
Induced 2,634 5,753 9,178
Total output 9,714 20,831 33,259
GVA (USD millions)9
Direct 1,539 3,277 5,234
Indirect 1,329 2,831 4,521
Induced 660 1,409 2,253
Total GVA 3,528 7,517 12,008
Job creation directly enabled by solar EOR roll-out10
Total, among which 58,251 165,847 251,277
Construction-related jobs 20,976 59,746 90,483
Job creation enabled by gas savings8
Total, among which 10,173 30,165 51,611
Direct industrial jobs 5,948 17,637 30,176
Indirect and induced jobs 4,225 12,528 21,435
Total job creation 68,424 196,012 302,888
Total Omani jobs 14,560 41,574 63,825
11 Direct, indirect and induced.
Executive summary
6 Solar enhanced oil recovery An in-country value assessment for Oman
An alternative use of CSP technology is for power generation. Other countries such as the United Arab Emirates (UAE) have taken this path with the development of the first phase of the Shams power station, a 100MW parabolic trough CSP plant. Saudi Arabia is also targeting a capacity of 25GW of CSP by 203212.
By comparing gas savings per dollar of capital expenditure from the use of solar energy in power generation and EOR relative to natural gas-fired alternatives, we find that investing in solar EOR saves up to six times as much gas per unit of capital expenditure as saved by a CSP plant.
There are other benefits that the deployment of solar EOR would provide to Oman. It would carry significant Omani content, which will serve as a platform for the development of skills and innovation in the Sultanate. A large sustained deployment will expose local engineers to solar technology and its supply chain, enabling them to bridge skills from the existing oil and gas base in Oman and to widen their expertise to skills applicable across a variety of sectors. Experience in solar technology would also transfer to other uses, e.g., power generation, desalination and process steam, creating a technologically cross-skilled local workforce. Deployment of solar technology also provides scope for global leadership and innovation in this field through industry-university partnerships and through funding of research into different areas such as subsurface effects and behaviour of solar power-generated steam at rock model, lab and simulator levels; and understanding of the local environmental conditions and solar energy; as well as primary research on materials, durability of equipment and construction methods.
Technical and commercial leadership in solar EOR could also allow Oman to tap regional and global export opportunities likely to open up in the next decade. Although the volume of EOR production in the Gulf Cooperation Council (GCC) countries outside of Oman is currently minuscule, EOR potential is estimated at 475 billion barrels of oil13. A significant proportion of this opportunity will be thermal EOR, for which solar EOR is likely to compete. The most likely immediate market for solar EOR is Kuwait, with a full-field
12 KA-CARE, Saudi Arabia’s Renewable Energy Strategy and Solar Energy Deployment.
13 Manaar Consulting: “EOR and IOR in the Middle East,” http://www.manaarco.com/images/presentations/Fleming%20Gulf%20Manaar%20EOR%20Abu%20Dhabi%20March%202013.pdf, accessed 30 October 2013.
steam injection project led by Chevron that is under development at the Wafra field in the Partitioned Neutral Zone (PNZ). The first phase of steam injection is expected to begin in 2017 and to produce up to 80,000 bbl/d with subsequent phases boosting production to more than 500,000 bbl/d. The expected thermal EOR production in this project alone is almost comparable to Oman’s current EOR production and may provide an immediate export opportunity.
Substitution of natural gas by solar EOR will contribute to reduction in emissions of CO2 and other polluting agents. Considering the volume of natural gas saved and the average emissions from burning natural gas, we estimate emission abatement of 8.1 million tons of CO2 on an annual basis in the leadership deployment scenario when the systems are fully deployed. In addition, the technology currently deployed in the pilot project by GlassPoint and PDO does not have the environmental costs normally associated with large CSP systems such as consumption of large quantities of water. Moreover, the ecological and visual impacts due to large land footprint typically caused by CSP is also limited due to the relative compactness of the technology (three times less acreage compared to standard parabolic systems) but also because it is installed in oil fields rather than pristine acreages.
At a macro level, solar EOR will improve both short-term and long-term energy security for Oman. It will reduce long-term risk of scarcity of gas, if deployed in sufficient volumes and with reasonable lead times. It will also limit the reliance on pipelines and Liquefied Natural Gas (LNG) cargoes which are subject to sudden short-term changes in availability and costs. Given Oman’s growing dependence on natural gas and its USD 60 billion LNG deal with Iran for the next 25 years, both its long-term and short-term security of energy supply require consideration. Use of solar EOR carries obvious advantages in terms of security of energy supply for Oman as it limits exposure to imports and frees up natural gas for other uses in Oman’s industrial sectors, thereby reducing the risk inherent in reliance on Iran for significant natural gas imports.
Executive summary
7Solar enhanced oil recovery An in-country value assessment for Oman
This section provides an overview of the Omani oil and gas sector; a description of the enhanced oil recovery (EOR) process and a description of the solar enhanced oil recovery (solar EOR) process and key technologies.
1Enhanced oil recovery in Oman
8 Solar enhanced oil recovery An in-country value assessment for Oman
Omani oil and gas sector Omani crude oil productionProduction of oil and gas in the Sultanate of Oman began in 1967 and the country today remains an important hydrocarbon supplier. In 2012, Oman produced 920,000 barrels per day (bbl/d) of crude oil, ranking 21st in global oil production by country14.
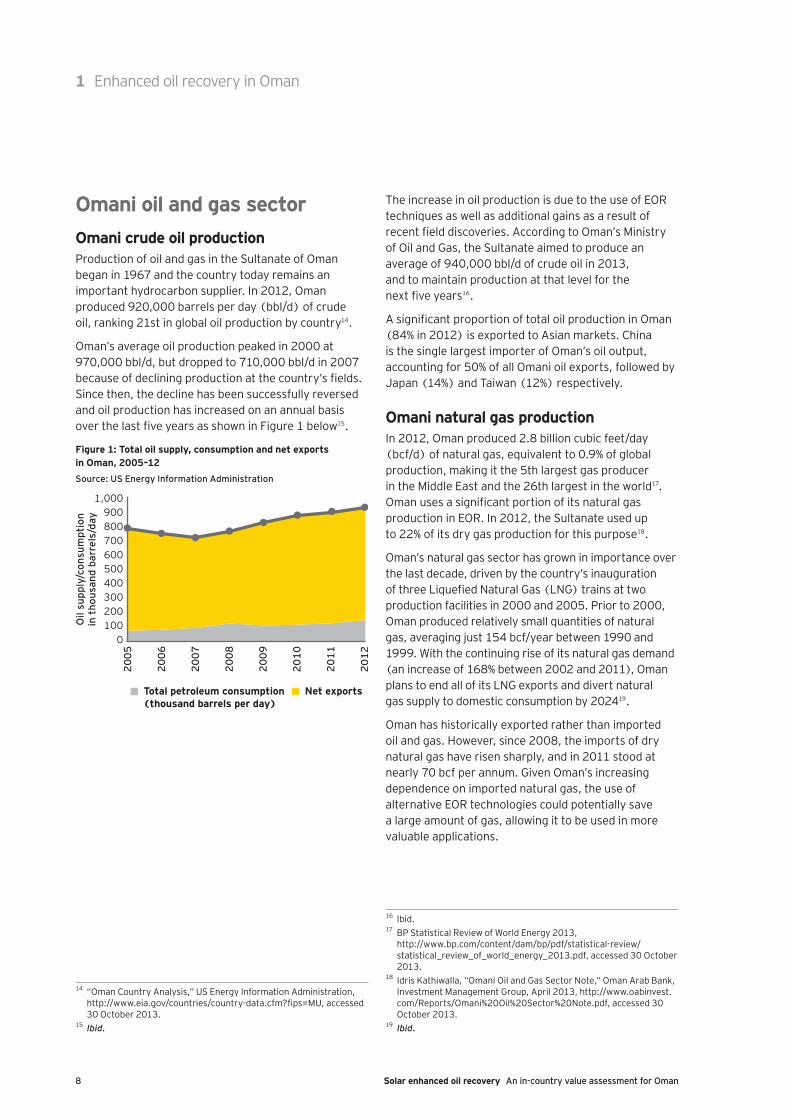
Oman’s average oil production peaked in 2000 at 970,000 bbl/d, but dropped to 710,000 bbl/d in 2007 because of declining production at the country’s fields. Since then, the decline has been successfully reversed and oil production has increased on an annual basis over the last five years as shown in Figure 1 below15.
Figure 1: Total oil supply, consumption and net exports in Oman, 2005–12Source: US Energy Information Administration
Oil
supp
ly/c
onsu
mpt
ion
in t
hous
and
barr
els/
day
0100200300400500600700800900
1,000
2005
2006
2007
2008
2009
2010
2011
2012
Total petroleum consumption(thousand barrels per day)
Net exports
14 “Oman Country Analysis,” US Energy Information Administration, http://www.eia.gov/countries/country-data.cfm?fips=MU, accessed 30 October 2013.
15 Ibid.
The increase in oil production is due to the use of EOR techniques as well as additional gains as a result of recent field discoveries. According to Oman’s Ministry of Oil and Gas, the Sultanate aimed to produce an average of 940,000 bbl/d of crude oil in 2013, and to maintain production at that level for the next five years16.
A significant proportion of total oil production in Oman (84% in 2012) is exported to Asian markets. China is the single largest importer of Oman’s oil output, accounting for 50% of all Omani oil exports, followed by Japan (14%) and Taiwan (12%) respectively.
Omani natural gas productionIn 2012, Oman produced 2.8 billion cubic feet/day (bcf/d) of natural gas, equivalent to 0.9% of global production, making it the 5th largest gas producer in the Middle East and the 26th largest in the world17. Oman uses a significant portion of its natural gas production in EOR. In 2012, the Sultanate used up to 22% of its dry gas production for this purpose18.
Oman’s natural gas sector has grown in importance over the last decade, driven by the country’s inauguration of three Liquefied Natural Gas (LNG) trains at two production facilities in 2000 and 2005. Prior to 2000, Oman produced relatively small quantities of natural gas, averaging just 154 bcf/year between 1990 and 1999. With the continuing rise of its natural gas demand (an increase of 168% between 2002 and 2011), Oman plans to end all of its LNG exports and divert natural gas supply to domestic consumption by 202419.
Oman has historically exported rather than imported oil and gas. However, since 2008, the imports of dry natural gas have risen sharply, and in 2011 stood at nearly 70 bcf per annum. Given Oman’s increasing dependence on imported natural gas, the use of alternative EOR technologies could potentially save a large amount of gas, allowing it to be used in more valuable applications.
16 Ibid.17 BP Statistical Review of World Energy 2013,
http://www.bp.com/content/dam/bp/pdf/statistical-review/statistical_review_of_world_energy_2013.pdf, accessed 30 October 2013.
18 Idris Kathiwalla, “Omani Oil and Gas Sector Note,” Oman Arab Bank, Investment Management Group, April 2013, http://www.oabinvest.com/Reports/Omani%20Oil%20Sector%20Note.pdf, accessed 30 October 2013.
19 Ibid.
1 Enhanced oil recovery in Oman
9Solar enhanced oil recovery An in-country value assessment for Oman
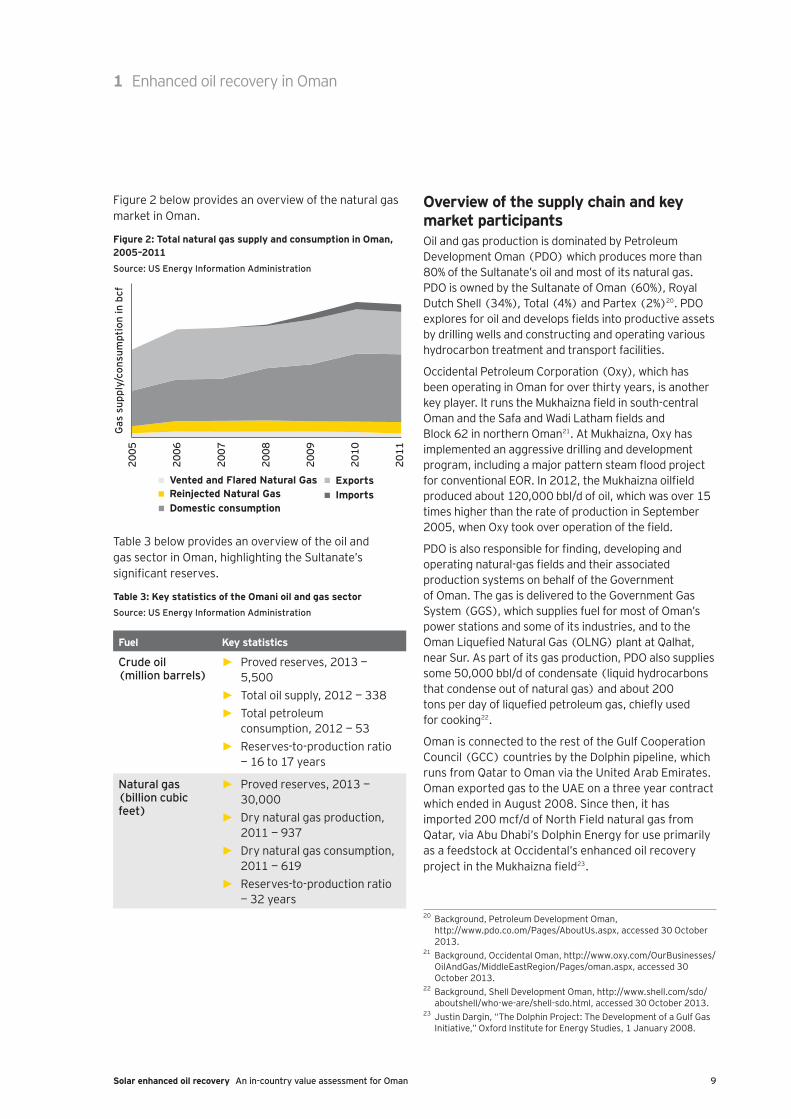
Figure 2 below provides an overview of the natural gas market in Oman.
Figure 2: Total natural gas supply and consumption in Oman, 2005–2011Source: US Energy Information Administration
2005
2006
2007
2008
2009
2010
2011
Gas
sup
ply/
cons
umpt
ion
in b
cf
Vented and Flared Natural Gas ExportsImportsReinjected Natural Gas
Domestic consumption
Table 3 below provides an overview of the oil and gas sector in Oman, highlighting the Sultanate’s significant reserves.
Table 3: Key statistics of the Omani oil and gas sectorSource: US Energy Information Administration
Fuel Key statistics
Crude oil (million barrels)
► Proved reserves, 2013 — 5,500
► Total oil supply, 2012 — 338 ► Total petroleum
consumption, 2012 — 53 ► Reserves-to-production ratio
— 16 to 17 years
Natural gas (billion cubic feet)
► Proved reserves, 2013 — 30,000
► Dry natural gas production, 2011 — 937
► Dry natural gas consumption, 2011 — 619
► Reserves-to-production ratio — 32 years
Overview of the supply chain and key market participantsOil and gas production is dominated by Petroleum Development Oman (PDO) which produces more than 80% of the Sultanate’s oil and most of its natural gas. PDO is owned by the Sultanate of Oman (60%), Royal Dutch Shell (34%), Total (4%) and Partex (2%)20. PDO explores for oil and develops fields into productive assets by drilling wells and constructing and operating various hydrocarbon treatment and transport facilities.
Occidental Petroleum Corporation (Oxy), which has been operating in Oman for over thirty years, is another key player. It runs the Mukhaizna field in south-central Oman and the Safa and Wadi Latham fields and Block 62 in northern Oman21. At Mukhaizna, Oxy has implemented an aggressive drilling and development program, including a major pattern steam flood project for conventional EOR. In 2012, the Mukhaizna oilfield produced about 120,000 bbl/d of oil, which was over 15 times higher than the rate of production in September 2005, when Oxy took over operation of the field.
PDO is also responsible for finding, developing and operating natural-gas fields and their associated production systems on behalf of the Government of Oman. The gas is delivered to the Government Gas System (GGS), which supplies fuel for most of Oman’s power stations and some of its industries, and to the Oman Liquefied Natural Gas (OLNG) plant at Qalhat, near Sur. As part of its gas production, PDO also supplies some 50,000 bbl/d of condensate (liquid hydrocarbons that condense out of natural gas) and about 200 tons per day of liquefied petroleum gas, chiefly used for cooking22.
Oman is connected to the rest of the Gulf Cooperation Council (GCC) countries by the Dolphin pipeline, which runs from Qatar to Oman via the United Arab Emirates. Oman exported gas to the UAE on a three year contract which ended in August 2008. Since then, it has imported 200 mcf/d of North Field natural gas from Qatar, via Abu Dhabi’s Dolphin Energy for use primarily as a feedstock at Occidental’s enhanced oil recovery project in the Mukhaizna field23.
20 Background, Petroleum Development Oman, http://www.pdo.co.om/Pages/AboutUs.aspx, accessed 30 October 2013.
21 Background, Occidental Oman, http://www.oxy.com/OurBusinesses/OilAndGas/MiddleEastRegion/Pages/oman.aspx, accessed 30 October 2013.
22 Background, Shell Development Oman, http://www.shell.com/sdo/aboutshell/who-we-are/shell-sdo.html, accessed 30 October 2013.
23 Justin Dargin, “The Dolphin Project: The Development of a Gulf Gas Initiative,” Oxford Institute for Energy Studies, 1 January 2008.
1 Enhanced oil recovery in Oman
10 Solar enhanced oil recovery An in-country value assessment for Oman
Oman has three liquefaction trains owned by Oman LNG and Qalhat LNG with a nameplate capacity of 10.3 million tonnes per year. However, exports have been running low in recent years averaging 8.4–8.6 million tonnes a year, down from a peak of 9.1 million tonnes in 2006. Oman LNG has experienced a more pronounced decline, with exports dropping from 6.6 million tonnes per year in 2006 to 5.4 million tonnes per year in 201124. In September 2013, the two companies merged to create Oman LNG LLC25. In 2012, Oman exported a total of 131 LNG cargoes, as well as 45 cargoes of Natural Gas Liquids (NGL’s), nearly all of which went to Japan and South Korea26.
24 Idris Kathiwalla, “Omani Oil and Gas Sector Note,” Oman Arab Bank, Investment Management Group, April 2013, http://www.oabinvest.com/Reports/Omani%20Oil%20Sector%20Note.pdf, accessed 30 October 2013.
25 ”Sultanate’s LNG Industry Enters New Era As Oman, Qalhat LNG Become One,” Oman LNG LLC, http://www.qalhatlng.com/Press%20release%20ENG.pdf accessed 30 October 2013.
26 Oman Country Analysis,” US Energy Information Administration, http://www.eia.gov/countries/country-data.cfm?fips=MU, accessed 30 October 2013.
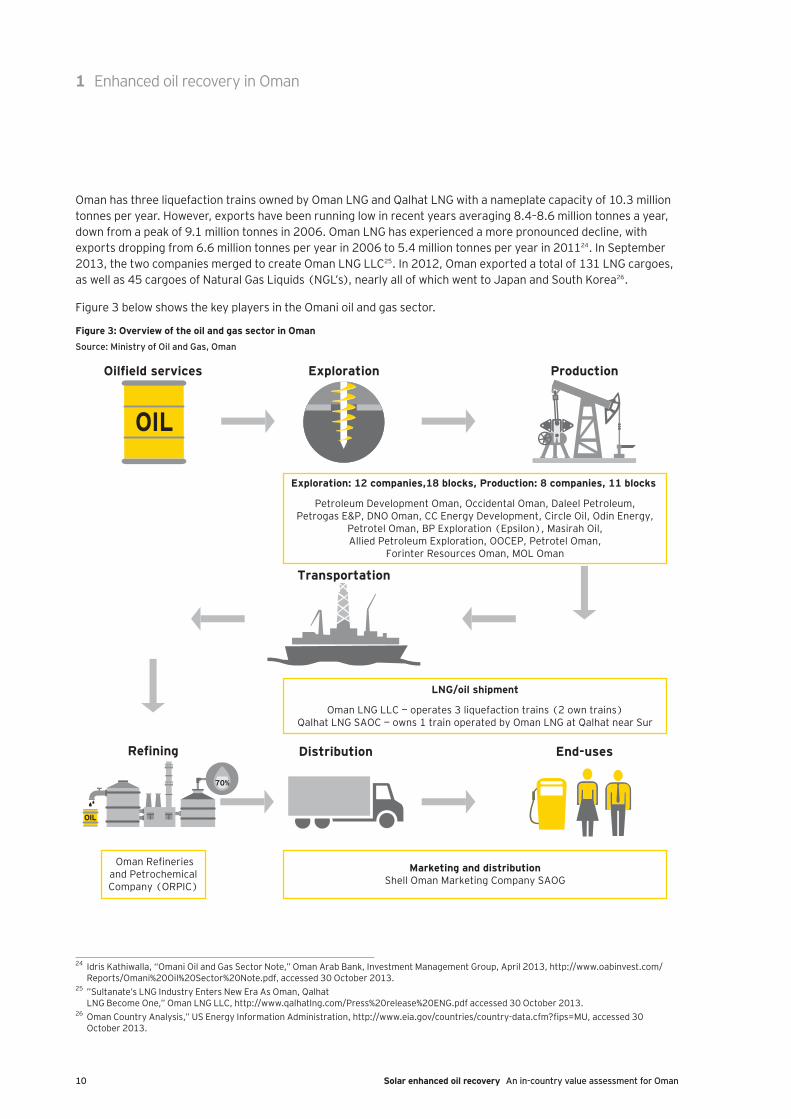
Figure 3 below shows the key players in the Omani oil and gas sector.
Figure 3: Overview of the oil and gas sector in OmanSource: Ministry of Oil and Gas, Oman
Exploration: 12 companies,18 blocks, Production: 8 companies, 11 blocks
Petroleum Development Oman, Occidental Oman, Daleel Petroleum,Petrogas E&P, DNO Oman, CC Energy Development, Circle Oil, Odin Energy,
Petrotel Oman, BP Exploration (Epsilon), Masirah Oil,Allied Petroleum Exploration, OOCEP, Petrotel Oman,
Forinter Resources Oman, MOL Oman
LNG/oil shipment
Oman LNG LLC — operates 3 liquefaction trains (2 own trains)Qalhat LNG SAOC — owns 1 train operated by Oman LNG at Qalhat near Sur
Marketing and distributionShell Oman Marketing Company SAOG
Oman Refineriesand PetrochemicalCompany (ORPIC)
Oilfield services Production
Refining
Exploration
Distribution End-uses
Transportation
OIL
70%
OIL
1 Enhanced oil recovery in Oman
11Solar enhanced oil recovery An in-country value assessment for Oman
1 Enhanced oil recovery in Oman
The Ministry of Oil and Gas (MOG) is responsible for the development and implementation of plans and policies to optimize the exploitation of oil and gas resources. Its key tasks include developing legislation, laws and regulations governing the sector, and conducting the survey of resources and marketing production on behalf of the Sultanate. It also supervises Government’s interests in companies operating in the sector and oversees all the oil and gas exploration and production (E&P) activities in the concession areas. The MOG has established ‘Petroleum Agreements’ with companies whose terms and conditions it oversees27.
Natural gas import/consumption outlookThe decline in LNG exports is partly due to the shortage of gas as well as a significant increase in domestic consumption. Oman’s natural gas consumption rose rapidly over the past decade, seeing a 135% increase between 1999 and 200928. Moreover, the composition of the end-use of gas has also changed dramatically. In 2005 more than 40% of the total production was exported in form of LNG cargoes, an additional 20% used in power generation and desalination plants and major industries and a further 16% used for oil production29. By 2011, LNG exports accounted for 24% of consumption, with industry, power generation and oil production accounting for 34%, 20% and 22% of production respectively30.
27 Ali Abdullah Al-Riyami, “Oman’s Oil and gas industry,” Ministry of Oil & Gas, Oman, http://www.jccp.or.jp/english/wp-content/uploads/s1-4_ali-presentation-4.pdf, accessed 30 October 2013.
28 Oman Country Analysis,” US Energy Information Administration, http://www.eia.gov/countries/country-data.cfm?fips=MU, accessed 30 October 2013.
29 Economist Intelligence Unit, “Oman: LNG companies merge,” October 11 2013, http://www.eiu.com/industry/article/641050248/oman-lng-companies-merge/2013-10-15, accessed 30 October 2013.
30 Idris Kathiwalla, “Omani Oil and Gas Sector Note,” Oman Arab Bank, Investment Management Group, April 2013, http://www.oabinvest.com/Reports/Omani%20Oil%20Sector%20Note.pdf, accessed 30 October 2013.
The increase in overall gas demand as well as a re-balancing towards domestic industry and power generation is expected to continue, and a shortfall in feedstock is already hampering Oman’s economic development, especially its industrial policy. Over the last four years, petrochemicals projects valued up to USD 3.49 billion have been cancelled or forestalled due to lack of guaranteed gas feedstock31. In addition there are at least 28 projects that have applied for gas allocations totalling 134 million cubic feet/day (mcf/d) which are yet to be granted32. This continuous increase in domestic demand for natural gas makes a planned roll-out of a solar EOR technology in Oman an attractive economic proposition.
Despite all these constraints, a significant gas exploration programme is currently underway. As of September 2012, an estimated USD 1.8 billion worth of major gas-‐related project work was under execution. Much of this work was related to offsetting production declines in existing fields, although there are a handful of new developments taking place as well. The most significant project is expected to be the Khazzan tight gas field, where 70–130 tcf of gas reserves are in place in reservoirs located 4 km below ground. This project is expected to cost approximately USD 15 billion over 10 years and is being developed by BP. The final investment decision will depend on the outcome of ongoing negotiations between BP and the Government of Oman.
Enhanced oil recoveryIdentifying new oil resources to meet the forecast increase in long-term global oil demand33 remains both a priority and a challenge. Given the scarcity of new oil sources, one approach is to maximize the extraction of oil from existing, maturing oilfields, particularly as mature oil fields account for an increasingly large proportion of the global oil supply. EOR in general terms refers to technologies and strategies that oil producers use to maximize the amount of oil recovered from existing reservoirs.
31 Patrick Osgood, “Oman’s great gas conundrum,” Arabian Oil & Gas, Nov 15, 2011, http://www.arabianoilandgas.com/article-9667-omans-great-gas-conundrum/#.Une1v6KBoVg, accessed 30 October 2013.
32 Kevin Baxter, “Gas shortage stalls diversification in Oman,” MEED Issue No 30 23-29, July 2010, http://www.meed.com/sectors/oil-and-gas/gas/gas-shortage-stalls-diversification-in-oman/3008041.article, accessed 30 October 2013.
33 OPEC World Oil Outlook, 2012, http://www.opec.org/opec_web/static_files_project/media/downloads/publications/WOO2012.pdf, accessed 30 October 2013.
12 Solar enhanced oil recovery An in-country value assessment for Oman
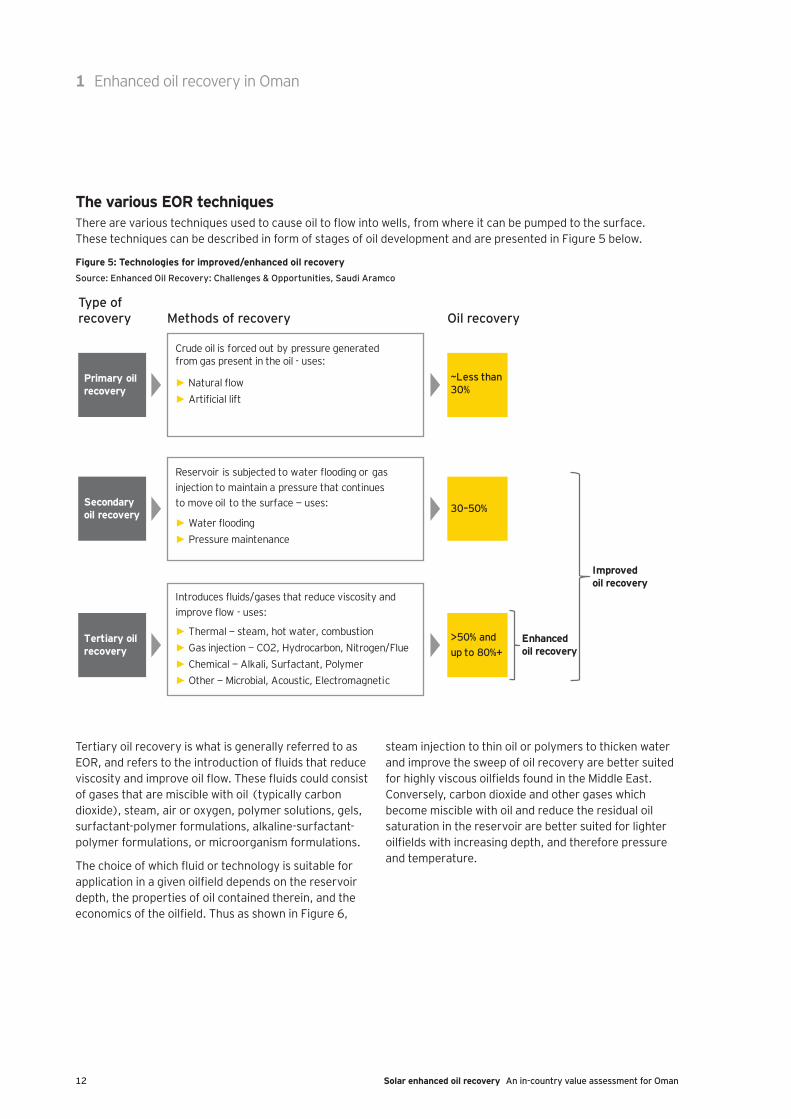
The various EOR techniquesThere are various techniques used to cause oil to flow into wells, from where it can be pumped to the surface. These techniques can be described in form of stages of oil development and are presented in Figure 5 below.
Figure 5: Technologies for improved/enhanced oil recoverySource: Enhanced Oil Recovery: Challenges & Opportunities, Saudi Aramco
Primary oil recovery
Secondaryoil recovery
Tertiary oilrecovery
Crude oil is forced out by pressure generatedfrom gas present in the oil - uses:
► Natural flow► Artificial lift
Reservoir is subjected to water flooding or gas injection to maintain a pressure that continuesto move oil to the surface − uses:
► Water flooding► Pressure maintenance
Introduces fluids/gases that reduce viscosity and improve flow - uses:
► Thermal − steam, hot water, combustion► Gas injection − CO2, Hydrocarbon, Nitrogen/Flue► Chemical − Alkali, Surfactant, Polymer► Other − Microbial, Acoustic, Electromagnetic
~Less than 30%
30–50%
>50% and up to 80%+
Type of recovery Methods of recovery Oil recovery
Enhancedoil recovery
Improvedoil recovery
1 Enhanced oil recovery in Oman
Tertiary oil recovery is what is generally referred to as EOR, and refers to the introduction of fluids that reduce viscosity and improve oil flow. These fluids could consist of gases that are miscible with oil (typically carbon dioxide), steam, air or oxygen, polymer solutions, gels, surfactant-polymer formulations, alkaline-surfactant-polymer formulations, or microorganism formulations.
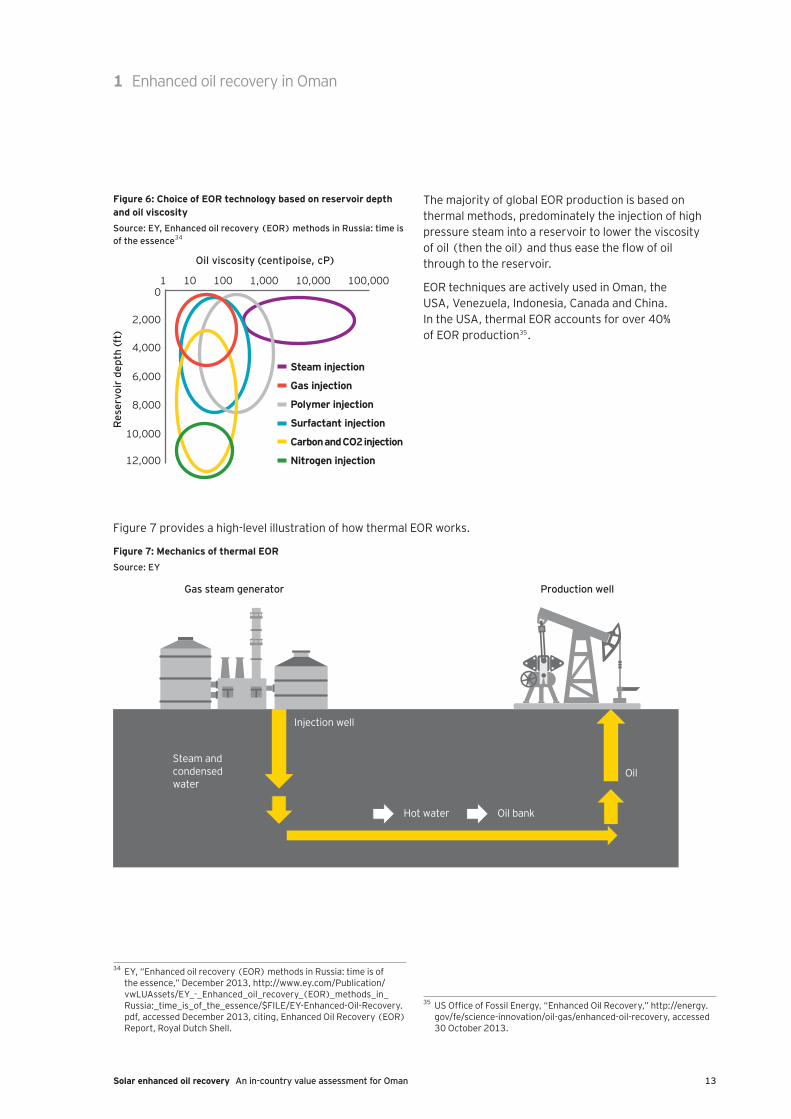
The choice of which fluid or technology is suitable for application in a given oilfield depends on the reservoir depth, the properties of oil contained therein, and the economics of the oilfield. Thus as shown in Figure 6,
steam injection to thin oil or polymers to thicken water and improve the sweep of oil recovery are better suited for highly viscous oilfields found in the Middle East. Conversely, carbon dioxide and other gases which become miscible with oil and reduce the residual oil saturation in the reservoir are better suited for lighter oilfields with increasing depth, and therefore pressure and temperature.
13Solar enhanced oil recovery An in-country value assessment for Oman
1 Enhanced oil recovery in Oman
Figure 6: Choice of EOR technology based on reservoir depth and oil viscositySource: EY, Enhanced oil recovery (EOR) methods in Russia: time is of the essence34
Res
ervo
ir d
epth
(ft)
Oil viscosity (centipoise, cP)
10
2,000
4,000
6,000
8,000
10,000
12,000
10 100 1,000 10,000 100,000
Gas injection
Steam injection
Polymer injection
Surfactant injection
Carbon and CO2 injection
Nitrogen injection
34 EY, “Enhanced oil recovery (EOR) methods in Russia: time is of the essence,” December 2013, http://www.ey.com/Publication/vwLUAssets/EY_-_Enhanced_oil_recovery_(EOR)_methods_in_Russia:_time_is_of_the_essence/$FILE/EY-Enhanced-Oil-Recovery.pdf, accessed December 2013, citing, Enhanced Oil Recovery (EOR) Report, Royal Dutch Shell.
The majority of global EOR production is based on thermal methods, predominately the injection of high pressure steam into a reservoir to lower the viscosity of oil (then the oil) and thus ease the flow of oil through to the reservoir.
EOR techniques are actively used in Oman, the USA, Venezuela, Indonesia, Canada and China. In the USA, thermal EOR accounts for over 40% of EOR production35.
35 US Office of Fossil Energy, “Enhanced Oil Recovery,” http://energy.gov/fe/science-innovation/oil-gas/enhanced-oil-recovery, accessed 30 October 2013.
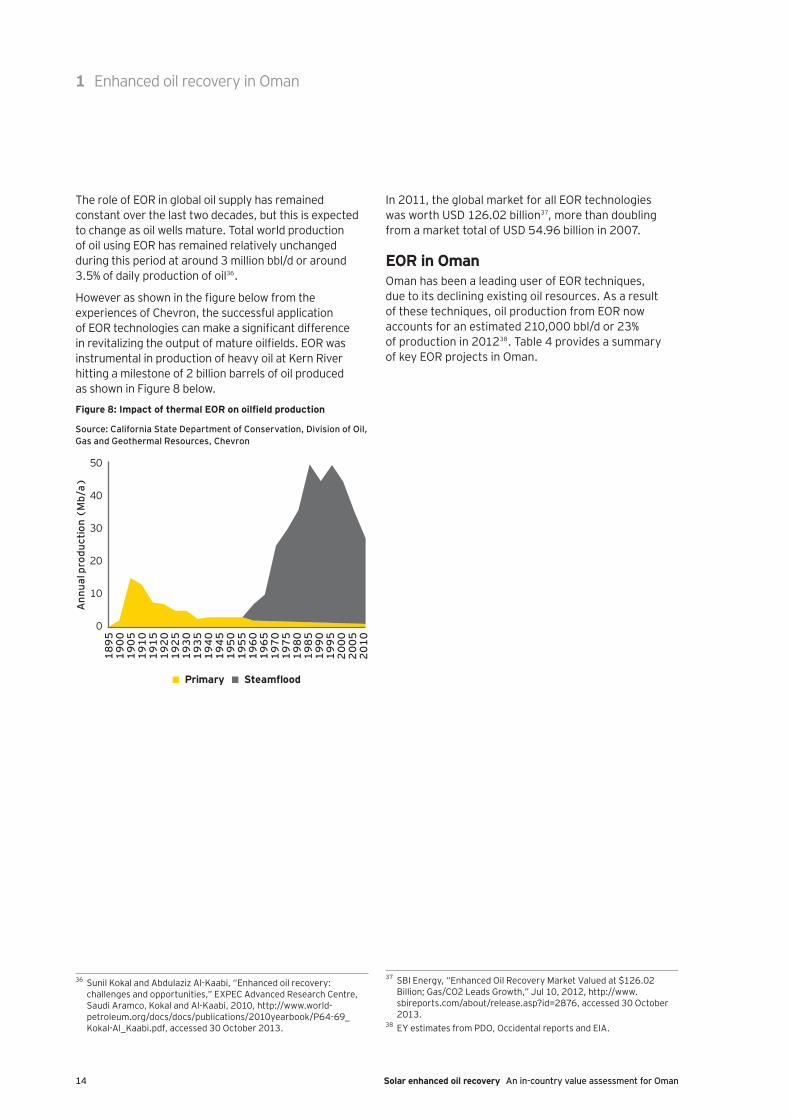
Figure 7 provides a high-level illustration of how thermal EOR works.
Figure 7: Mechanics of thermal EORSource: EY
Gas steam generator Production well
Injection well
OilSteam andcondensedwater
Hot water Oil bank
14 Solar enhanced oil recovery An in-country value assessment for Oman
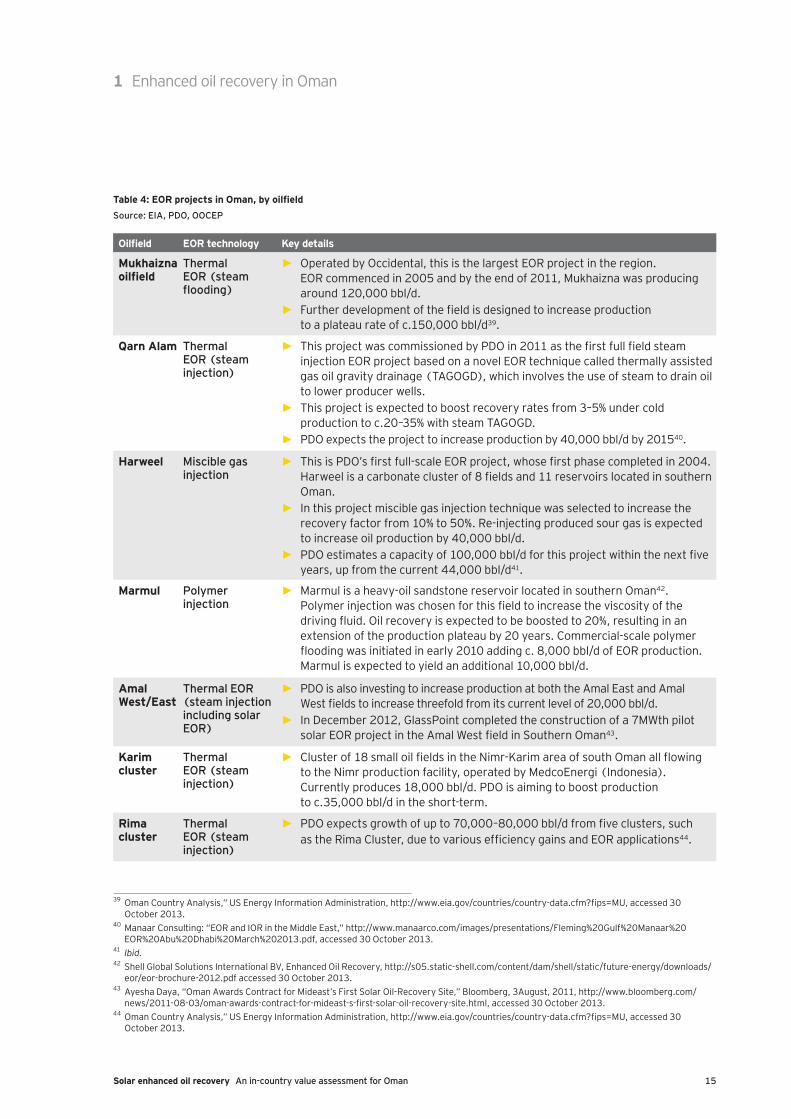
The role of EOR in global oil supply has remained constant over the last two decades, but this is expected to change as oil wells mature. Total world production of oil using EOR has remained relatively unchanged during this period at around 3 million bbl/d or around 3.5% of daily production of oil36.
However as shown in the figure below from the experiences of Chevron, the successful application of EOR technologies can make a significant difference in revitalizing the output of mature oilfields. EOR was instrumental in production of heavy oil at Kern River hitting a milestone of 2 billion barrels of oil produced as shown in Figure 8 below.
Figure 8: Impact of thermal EOR on oilfield production
Source: California State Department of Conservation, Division of Oil, Gas and Geothermal Resources, Chevron
0
10
20
30
40
50
1895
1900
1905
1910
1915
1920
1925
1930
1935
1940
1945
1950
1955
1960
1965
1970
1975
1980
1985
1990
1995
2000
2005
2010
Ann
ual p
rodu
ctio
n (M
b/a)
Primary Steamflood
36 Sunil Kokal and Abdulaziz Al-Kaabi, “Enhanced oil recovery: challenges and opportunities,” EXPEC Advanced Research Centre, Saudi Aramco, Kokal and Al-Kaabi, 2010, http://www.world-petroleum.org/docs/docs/publications/2010yearbook/P64-69_Kokal-Al_Kaabi.pdf, accessed 30 October 2013.
In 2011, the global market for all EOR technologies was worth USD 126.02 billion37, more than doubling from a market total of USD 54.96 billion in 2007.
EOR in OmanOman has been a leading user of EOR techniques, due to its declining existing oil resources. As a result of these techniques, oil production from EOR now accounts for an estimated 210,000 bbl/d or 23% of production in 201238. Table 4 provides a summary of key EOR projects in Oman.
37 SBI Energy, “Enhanced Oil Recovery Market Valued at $126.02 Billion; Gas/CO2 Leads Growth,” Jul 10, 2012, http://www.sbireports.com/about/release.asp?id=2876, accessed 30 October 2013.
38 EY estimates from PDO, Occidental reports and EIA.
1 Enhanced oil recovery in Oman
15Solar enhanced oil recovery An in-country value assessment for Oman
1 Enhanced oil recovery in Oman
Table 4: EOR projects in Oman, by oilfieldSource: EIA, PDO, OOCEP
Oilfield EOR technology Key details
Mukhaizna oilfield
Thermal EOR (steam flooding)
► Operated by Occidental, this is the largest EOR project in the region. EOR commenced in 2005 and by the end of 2011, Mukhaizna was producing around 120,000 bbl/d.
► Further development of the field is designed to increase production to a plateau rate of c.150,000 bbl/d39.
Qarn Alam Thermal EOR (steam injection)
► This project was commissioned by PDO in 2011 as the first full field steam injection EOR project based on a novel EOR technique called thermally assisted gas oil gravity drainage (TAGOGD), which involves the use of steam to drain oil to lower producer wells.
► This project is expected to boost recovery rates from 3–5% under cold production to c.20–35% with steam TAGOGD.
► PDO expects the project to increase production by 40,000 bbl/d by 201540.
Harweel Miscible gas injection
► This is PDO’s first full-scale EOR project, whose first phase completed in 2004. Harweel is a carbonate cluster of 8 fields and 11 reservoirs located in southern Oman.
► In this project miscible gas injection technique was selected to increase the recovery factor from 10% to 50%. Re-injecting produced sour gas is expected to increase oil production by 40,000 bbl/d.
► PDO estimates a capacity of 100,000 bbl/d for this project within the next five years, up from the current 44,000 bbl/d41.
Marmul Polymer injection
► Marmul is a heavy-oil sandstone reservoir located in southern Oman42. Polymer injection was chosen for this field to increase the viscosity of the driving fluid. Oil recovery is expected to be boosted to 20%, resulting in an extension of the production plateau by 20 years. Commercial-scale polymer flooding was initiated in early 2010 adding c. 8,000 bbl/d of EOR production. Marmul is expected to yield an additional 10,000 bbl/d.
Amal West/East
Thermal EOR (steam injection including solar EOR)
► PDO is also investing to increase production at both the Amal East and Amal West fields to increase threefold from its current level of 20,000 bbl/d.
► In December 2012, GlassPoint completed the construction of a 7MWth pilot solar EOR project in the Amal West field in Southern Oman43.
Karim cluster
Thermal EOR (steam injection)
► Cluster of 18 small oil fields in the Nimr-Karim area of south Oman all flowing to the Nimr production facility, operated by MedcoEnergi (Indonesia). Currently produces 18,000 bbl/d. PDO is aiming to boost production to c.35,000 bbl/d in the short-term.
Rima cluster
Thermal EOR (steam injection)
► PDO expects growth of up to 70,000–80,000 bbl/d from five clusters, such as the Rima Cluster, due to various efficiency gains and EOR applications44.
39 Oman Country Analysis,” US Energy Information Administration, http://www.eia.gov/countries/country-data.cfm?fips=MU, accessed 30 October 2013.
40 Manaar Consulting: “EOR and IOR in the Middle East,” http://www.manaarco.com/images/presentations/Fleming%20Gulf%20Manaar%20EOR%20Abu%20Dhabi%20March%202013.pdf, accessed 30 October 2013.
41 Ibid.42 Shell Global Solutions International BV, Enhanced Oil Recovery, http://s05.static-shell.com/content/dam/shell/static/future-energy/downloads/
eor/eor-brochure-2012.pdf accessed 30 October 2013.43 Ayesha Daya, “Oman Awards Contract for Mideast’s First Solar Oil-Recovery Site,” Bloomberg, 3August, 2011, http://www.bloomberg.com/
news/2011-08-03/oman-awards-contract-for-mideast-s-first-solar-oil-recovery-site.html, accessed 30 October 2013.44 Oman Country Analysis,” US Energy Information Administration, http://www.eia.gov/countries/country-data.cfm?fips=MU, accessed 30
October 2013.
16 Solar enhanced oil recovery An in-country value assessment for Oman
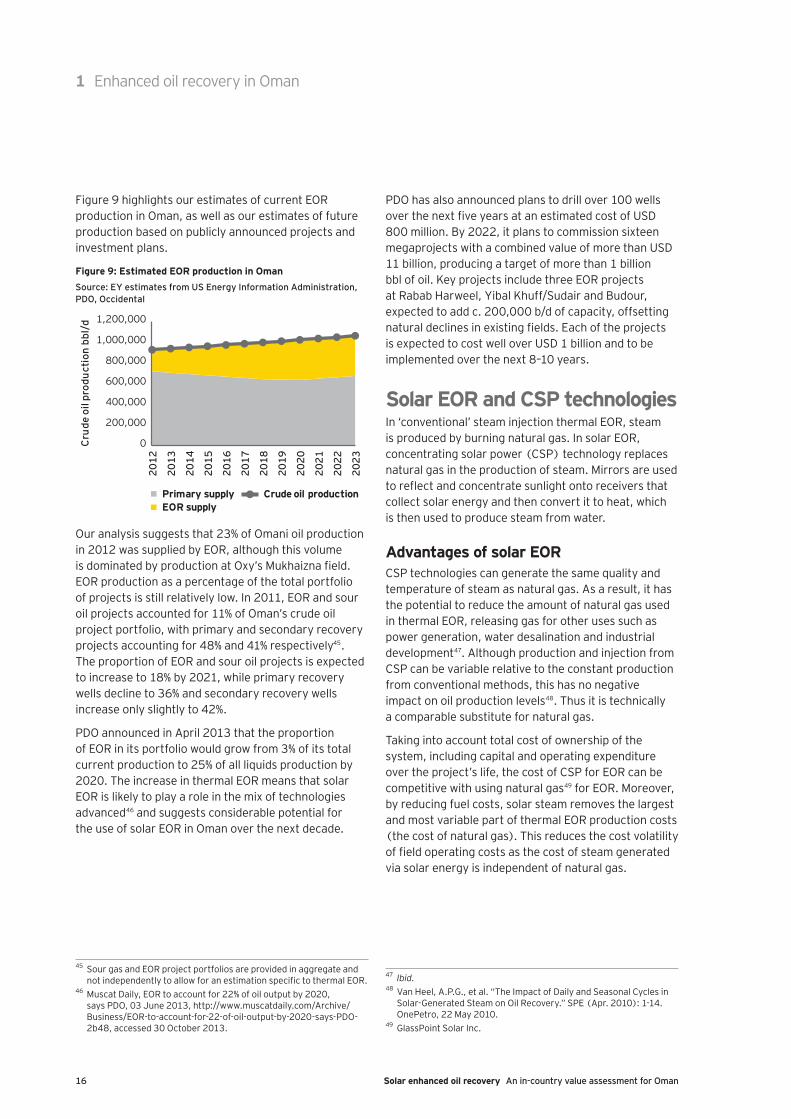
Figure 9 highlights our estimates of current EOR production in Oman, as well as our estimates of future production based on publicly announced projects and investment plans.
Figure 9: Estimated EOR production in OmanSource: EY estimates from US Energy Information Administration, PDO, Occidental
Cru
de o
il pr
oduc
tion
bbl
/d
0
200,000
400,000
600,000
800,000
1,000,000
1,200,000
2012
2013
2014
2015
2016
2017
2018
2019
2020
2021
2022
2023
Crude oil productionEOR supplyPrimary supply
Our analysis suggests that 23% of Omani oil production in 2012 was supplied by EOR, although this volume is dominated by production at Oxy’s Mukhaizna field. EOR production as a percentage of the total portfolio of projects is still relatively low. In 2011, EOR and sour oil projects accounted for 11% of Oman’s crude oil project portfolio, with primary and secondary recovery projects accounting for 48% and 41% respectively45. The proportion of EOR and sour oil projects is expected to increase to 18% by 2021, while primary recovery wells decline to 36% and secondary recovery wells increase only slightly to 42%.
PDO announced in April 2013 that the proportion of EOR in its portfolio would grow from 3% of its total current production to 25% of all liquids production by 2020. The increase in thermal EOR means that solar EOR is likely to play a role in the mix of technologies advanced46 and suggests considerable potential for the use of solar EOR in Oman over the next decade.
45 Sour gas and EOR project portfolios are provided in aggregate and not independently to allow for an estimation specific to thermal EOR.
46 Muscat Daily, EOR to account for 22% of oil output by 2020, says PDO, 03 June 2013, http://www.muscatdaily.com/Archive/Business/EOR-to-account-for-22-of-oil-output-by-2020-says-PDO-2b48, accessed 30 October 2013.
PDO has also announced plans to drill over 100 wells over the next five years at an estimated cost of USD 800 million. By 2022, it plans to commission sixteen megaprojects with a combined value of more than USD 11 billion, producing a target of more than 1 billion bbl of oil. Key projects include three EOR projects at Rabab Harweel, Yibal Khuff/Sudair and Budour, expected to add c. 200,000 b/d of capacity, offsetting natural declines in existing fields. Each of the projects is expected to cost well over USD 1 billion and to be implemented over the next 8–10 years.
Solar EOR and CSP technologiesIn ‘conventional’ steam injection thermal EOR, steam is produced by burning natural gas. In solar EOR, concentrating solar power (CSP) technology replaces natural gas in the production of steam. Mirrors are used to reflect and concentrate sunlight onto receivers that collect solar energy and then convert it to heat, which is then used to produce steam from water.
Advantages of solar EORCSP technologies can generate the same quality and temperature of steam as natural gas. As a result, it has the potential to reduce the amount of natural gas used in thermal EOR, releasing gas for other uses such as power generation, water desalination and industrial development47. Although production and injection from CSP can be variable relative to the constant production from conventional methods, this has no negative impact on oil production levels48. Thus it is technically a comparable substitute for natural gas.
Taking into account total cost of ownership of the system, including capital and operating expenditure over the project’s life, the cost of CSP for EOR can be competitive with using natural gas49 for EOR. Moreover, by reducing fuel costs, solar steam removes the largest and most variable part of thermal EOR production costs (the cost of natural gas). This reduces the cost volatility of field operating costs as the cost of steam generated via solar energy is independent of natural gas.
47 Ibid.48 Van Heel, A.P.G., et al. “The Impact of Daily and Seasonal Cycles in
Solar-Generated Steam on Oil Recovery.” SPE (Apr. 2010): 1-14. OnePetro, 22 May 2010.
49 GlassPoint Solar Inc.
1 Enhanced oil recovery in Oman
17Solar enhanced oil recovery An in-country value assessment for Oman
1 Enhanced oil recovery in Oman
CSP infrastructure can also be installed in oilfields with limited availability of natural gas, thus providing a way to create and inject steam for EOR with no capital investment in gas infrastructure which would add considerable cost to a thermal EOR project.
Once commissioned, solar steam generators can produce at predictable and low operations cost for as long as thirty years providing certainty on the cost of steam. In addition, because solar EOR has minimal operating expenses, developers could benefit from steaming wells for a longer period of time than if gas-fired steam was used.
Experiences in solar EORIn 1983, Atlantic Richfield Company (ARCO)’s renewables arm, ARCO Solar, constructed a solar steam generation pilot using central tower technology in Taft, California. The system generated 1MW of thermal energy during peak operating conditions. Though technically feasible, the system was not cost-effective and was not replicated. The ARCO pilot was the first time solar steam was applied to facilitate heavy oil recovery50.
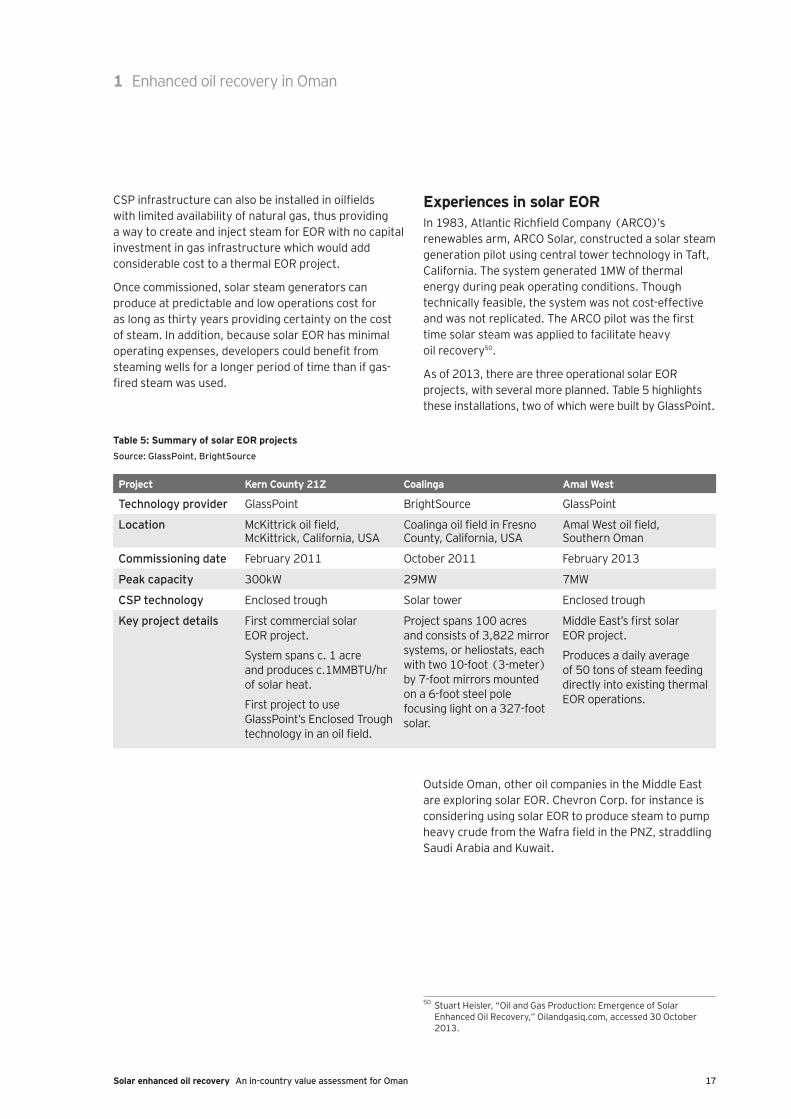
As of 2013, there are three operational solar EOR projects, with several more planned. Table 5 highlights these installations, two of which were built by GlassPoint.
50 Stuart Heisler, “Oil and Gas Production: Emergence of Solar Enhanced Oil Recovery,” Oilandgasiq.com, accessed 30 October 2013.
Table 5: Summary of solar EOR projectsSource: GlassPoint, BrightSource
Project Kern County 21Z Coalinga Amal West
Technology provider GlassPoint BrightSource GlassPoint
Location McKittrick oil field, McKittrick, California, USA
Coalinga oil field in Fresno County, California, USA
Amal West oil field, Southern Oman
Commissioning date February 2011 October 2011 February 2013
Peak capacity 300kW 29MW 7MW
CSP technology Enclosed trough Solar tower Enclosed trough
Key project details First commercial solar EOR project.
System spans c. 1 acre and produces c.1MMBTU/hr of solar heat.
First project to use GlassPoint’s Enclosed Trough technology in an oil field.
Project spans 100 acres and consists of 3,822 mirror systems, or heliostats, each with two 10-foot (3-meter) by 7-foot mirrors mounted on a 6-foot steel pole focusing light on a 327-foot solar.
Middle East’s first solar EOR project.
Produces a daily average of 50 tons of steam feeding directly into existing thermal EOR operations.
Outside Oman, other oil companies in the Middle East are exploring solar EOR. Chevron Corp. for instance is considering using solar EOR to produce steam to pump heavy crude from the Wafra field in the PNZ, straddling Saudi Arabia and Kuwait.
18 Solar enhanced oil recovery An in-country value assessment for Oman
1 Enhanced oil recovery in Oman
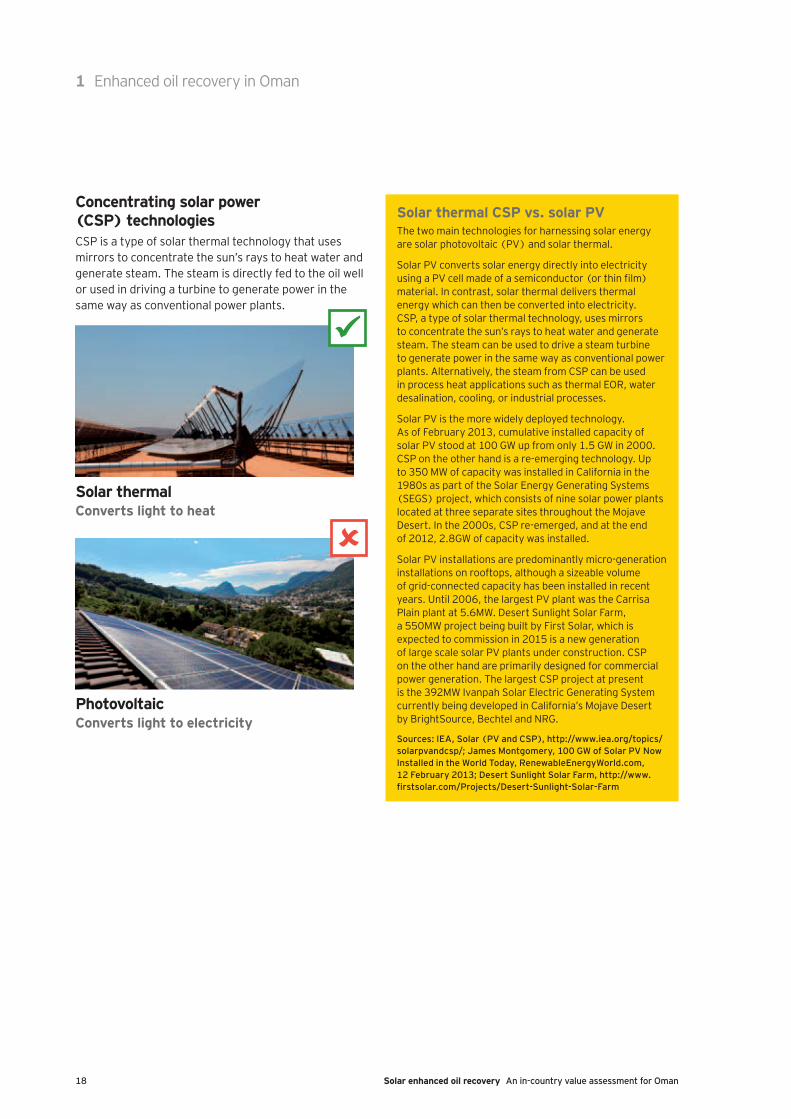
Concentrating solar power (CSP) technologiesCSP is a type of solar thermal technology that uses mirrors to concentrate the sun’s rays to heat water and generate steam. The steam is directly fed to the oil well or used in driving a turbine to generate power in the same way as conventional power plants.
Solar thermalConverts light to heat
PhotovoltaicConverts light to electricity
Solar thermal CSP vs. solar PVThe two main technologies for harnessing solar energy are solar photovoltaic (PV) and solar thermal.
Solar PV converts solar energy directly into electricity using a PV cell made of a semiconductor (or thin film) material. In contrast, solar thermal delivers thermal energy which can then be converted into electricity. CSP, a type of solar thermal technology, uses mirrors to concentrate the sun’s rays to heat water and generate steam. The steam can be used to drive a steam turbine to generate power in the same way as conventional power plants. Alternatively, the steam from CSP can be used in process heat applications such as thermal EOR, water desalination, cooling, or industrial processes.
Solar PV is the more widely deployed technology. As of February 2013, cumulative installed capacity of solar PV stood at 100 GW up from only 1.5 GW in 2000. CSP on the other hand is a re-emerging technology. Up to 350 MW of capacity was installed in California in the 1980s as part of the Solar Energy Generating Systems (SEGS) project, which consists of nine solar power plants located at three separate sites throughout the Mojave Desert. In the 2000s, CSP re-emerged, and at the end of 2012, 2.8GW of capacity was installed.
Solar PV installations are predominantly micro-generation installations on rooftops, although a sizeable volume of grid-connected capacity has been installed in recent years. Until 2006, the largest PV plant was the Carrisa Plain plant at 5.6MW. Desert Sunlight Solar Farm, a 550MW project being built by First Solar, which is expected to commission in 2015 is a new generation of large scale solar PV plants under construction. CSP on the other hand are primarily designed for commercial power generation. The largest CSP project at present is the 392MW Ivanpah Solar Electric Generating System currently being developed in California’s Mojave Desert by BrightSource, Bechtel and NRG.
Sources: IEA, Solar (PV and CSP), http://www.iea.org/topics/solarpvandcsp/; James Montgomery, 100 GW of Solar PV Now Installed in the World Today, RenewableEnergyWorld.com, 12 February 2013; Desert Sunlight Solar Farm, http://www.firstsolar.com/Projects/Desert-Sunlight-Solar-Farm
19Solar enhanced oil recovery An in-country value assessment for Oman
1 Enhanced oil recovery in Oman
CSP is commercially proven in power generation with an installed capacity of 2.8 GW at the end of 201251. There are four main variants of CSP technologies, three of which to date are being adapted to produce steam for solar EOR. These are:
► Solar tower
► Linear Fresnel
► Stirling dish
► Parabolic trough
These are described briefly below.
Solar tower technologyIn the solar tower design, an array of flat, movable mirrors (heliostats) follow the movement of the sun throughout the day. Solar energy is reflected from the mirrors onto a solar receiver at the top of a tower. The receiver is used to directly or indirectly heat a boiler filled with water.
The main developers of this technology include BrightSource, Abengoa Solar, eSolar, SolarReserve and Torresol.
Linear Fresnel collector technologyLinear Fresnel collectors are similar to parabolic trough collectors, but use a series of long flat, or slightly curved, mirrors placed at different angles to concentrate the sunlight on either side of a fixed receiver (located several metres above the primary mirror field). Each line of mirrors is equipped with a single-axis tracking system and is optimized individually to ensure that sunlight is always concentrated on the fixed receiver. The receiver consists of a long, selectively-coated absorber tube. Major technology developers include Areva and Novatec.
51 Schlumberger Energy Institute, Concentrating Solar Power, June 2013, http://www.sbc.slb.com/SBCInstitute/Publications/~/media/Files/SBC%20Energy%20Institute/SBC%20Energy%20Institute_Solar_Factbook_Jun%202013.ashx, accessed 30 October 2013.
Stirling dish technologyStirling dish system consists of a parabolic dish shaped concentrator (like a satellite dish) that reflects direct solar irradiation onto a receiver at the focal point of the dish. The receiver may be a Stirling engine (dish/engine systems) or a micro-turbine. Stirling dish systems require the sun to be tracked in two axes, but the high energy concentration onto a single point can yield very high temperatures. As a result, they are capable of very high efficiencies (up to 30%). Typical sizes range from 5 to 50kW which make them modular and highly scalable from cumulative several MW to hundreds of MWs depending on need. Unlike other CSP technologies, they use mechanical energy rather, than producing steam to produce electricity and are therefore unable to serve the thermal EOR application. Stirling dish systems are also yet to be deployed at any scale.
Parabolic trough collector technologyParabolic trough collectors (PTC) consist of solar collectors (mirrors), heat receivers and support structures. The parabolic-shaped mirrors are constructed by forming a sheet of reflective material into a parabolic shape that concentrates incoming sunlight onto a central receiver tube at the focal line of the collector. The main technology developers include Flagsol, Solar Millennium, Abengoa Solar and Aries Solar to name a few.
20 Solar enhanced oil recovery An in-country value assessment for Oman
1 Enhanced oil recovery in Oman
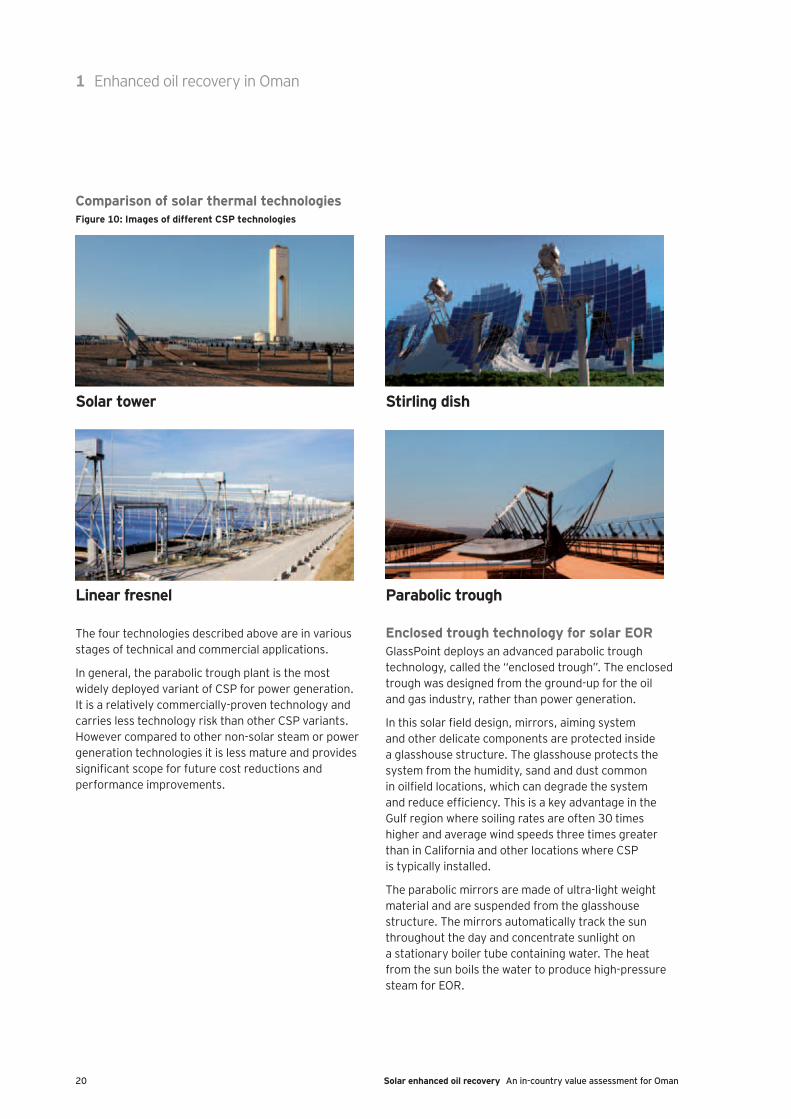
Comparison of solar thermal technologiesFigure 10: Images of different CSP technologies
Solar tower Stirling dish
Linear fresnel Parabolic trough
The four technologies described above are in various stages of technical and commercial applications.
In general, the parabolic trough plant is the most widely deployed variant of CSP for power generation. It is a relatively commercially-proven technology and carries less technology risk than other CSP variants. However compared to other non-solar steam or power generation technologies it is less mature and provides significant scope for future cost reductions and performance improvements.
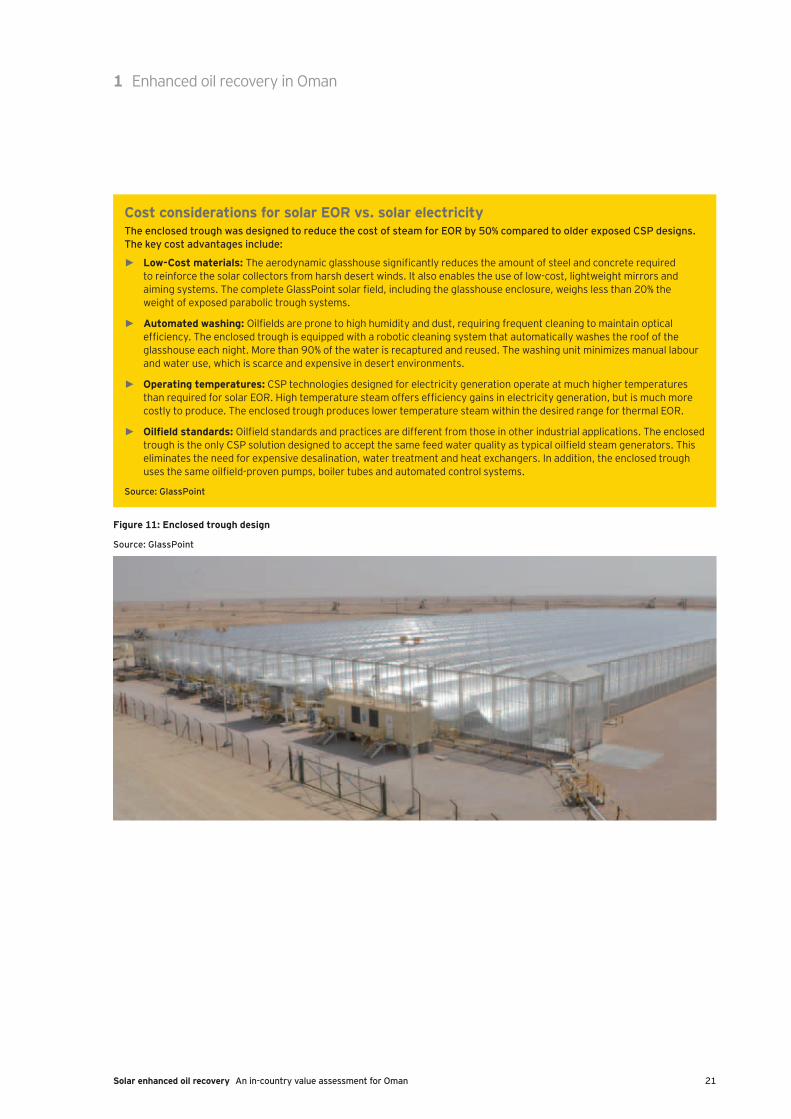
Enclosed trough technology for solar EORGlassPoint deploys an advanced parabolic trough technology, called the “enclosed trough”. The enclosed trough was designed from the ground-up for the oil and gas industry, rather than power generation.
In this solar field design, mirrors, aiming system and other delicate components are protected inside a glasshouse structure. The glasshouse protects the system from the humidity, sand and dust common in oilfield locations, which can degrade the system and reduce efficiency. This is a key advantage in the Gulf region where soiling rates are often 30 times higher and average wind speeds three times greater than in California and other locations where CSP is typically installed.
The parabolic mirrors are made of ultra-light weight material and are suspended from the glasshouse structure. The mirrors automatically track the sun throughout the day and concentrate sunlight on a stationary boiler tube containing water. The heat from the sun boils the water to produce high-pressure steam for EOR.
21Solar enhanced oil recovery An in-country value assessment for Oman
1 Enhanced oil recovery in Oman
Cost considerations for solar EOR vs. solar electricityThe enclosed trough was designed to reduce the cost of steam for EOR by 50% compared to older exposed CSP designs. The key cost advantages include:
► Low-Cost materials: The aerodynamic glasshouse significantly reduces the amount of steel and concrete required to reinforce the solar collectors from harsh desert winds. It also enables the use of low-cost, lightweight mirrors and aiming systems. The complete GlassPoint solar field, including the glasshouse enclosure, weighs less than 20% the weight of exposed parabolic trough systems.
► Automated washing: Oilfields are prone to high humidity and dust, requiring frequent cleaning to maintain optical efficiency. The enclosed trough is equipped with a robotic cleaning system that automatically washes the roof of the glasshouse each night. More than 90% of the water is recaptured and reused. The washing unit minimizes manual labour and water use, which is scarce and expensive in desert environments.
► Operating temperatures: CSP technologies designed for electricity generation operate at much higher temperatures than required for solar EOR. High temperature steam offers efficiency gains in electricity generation, but is much more costly to produce. The enclosed trough produces lower temperature steam within the desired range for thermal EOR.
► Oilfield standards: Oilfield standards and practices are different from those in other industrial applications. The enclosed trough is the only CSP solution designed to accept the same feed water quality as typical oilfield steam generators. This eliminates the need for expensive desalination, water treatment and heat exchangers. In addition, the enclosed trough uses the same oilfield-proven pumps, boiler tubes and automated control systems.
Source: GlassPoint
Figure 11: Enclosed trough design
Source: GlassPoint
22 Solar enhanced oil recovery An in-country value assessment for Oman
1 Enhanced oil recovery in Oman
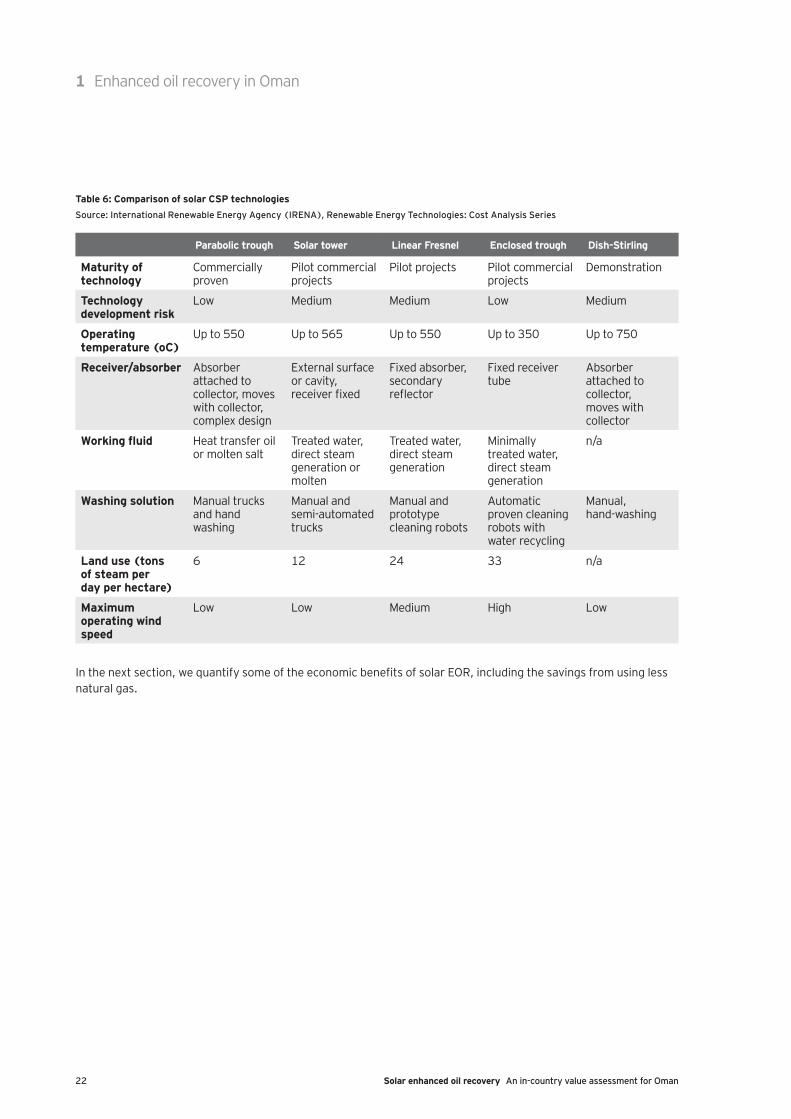
Table 6: Comparison of solar CSP technologiesSource: International Renewable Energy Agency (IRENA), Renewable Energy Technologies: Cost Analysis Series
Parabolic trough Solar tower Linear Fresnel Enclosed trough Dish-Stirling
Maturity of technology
Commercially proven
Pilot commercial projects
Pilot projects Pilot commercial projects
Demonstration
Technology development risk
Low Medium Medium Low Medium
Operating temperature (oC)
Up to 550 Up to 565 Up to 550 Up to 350 Up to 750
Receiver/absorber Absorber attached to collector, moves with collector, complex design
External surface or cavity, receiver fixed
Fixed absorber, secondary reflector
Fixed receiver tube
Absorber attached to collector, moves with collector
Working fluid Heat transfer oil or molten salt
Treated water, direct steam generation or molten
Treated water, direct steam generation
Minimally treated water, direct steam generation
n/a
Washing solution Manual trucks and hand washing
Manual and semi-automated trucks
Manual and prototype cleaning robots
Automatic proven cleaning robots with water recycling
Manual, hand-washing
Land use (tons of steam per day per hectare)
6 12 24 33 n/a
Maximum operating wind speed
Low Low Medium High Low
In the next section, we quantify some of the economic benefits of solar EOR, including the savings from using less natural gas.
23Solar enhanced oil recovery An in-country value assessment for Oman
2Contribution to the Omani economy
This section provides our analysis of the domestic economic impact of solar EOR for the Sultanate over the period 2014–23.
24 Solar enhanced oil recovery An in-country value assessment for Oman
MethodologyThe full benefits that solar EOR deployment will generate for the Omani economy can be estimated by calculating the Direct, Indirect and Induced effects, as defined below:
► The Direct effect of solar EOR providers’ activities, i.e., their contribution to the Omani Gross Domestic Product (Gross Value Added or “GVA”) and the jobs it creates.
► The Indirect effect on GVA and employment arising from solar EOR providers’ demand for goods and services along its supply chain in Oman. Indirect employment impact arising from industrial jobs created as part of projects using diverted gas saved through solar EOR substitution is presented separately.
► The Induced effect arising from solar EOR provider and their suppliers’ employees in Oman spending a share of their income on the consumption of goods and services in the wider Omani economy. Effects are also induced from the private consumption generated by employees hired as part of the industrial projects that would be enabled by the gas savings generated by solar EOR substitution.
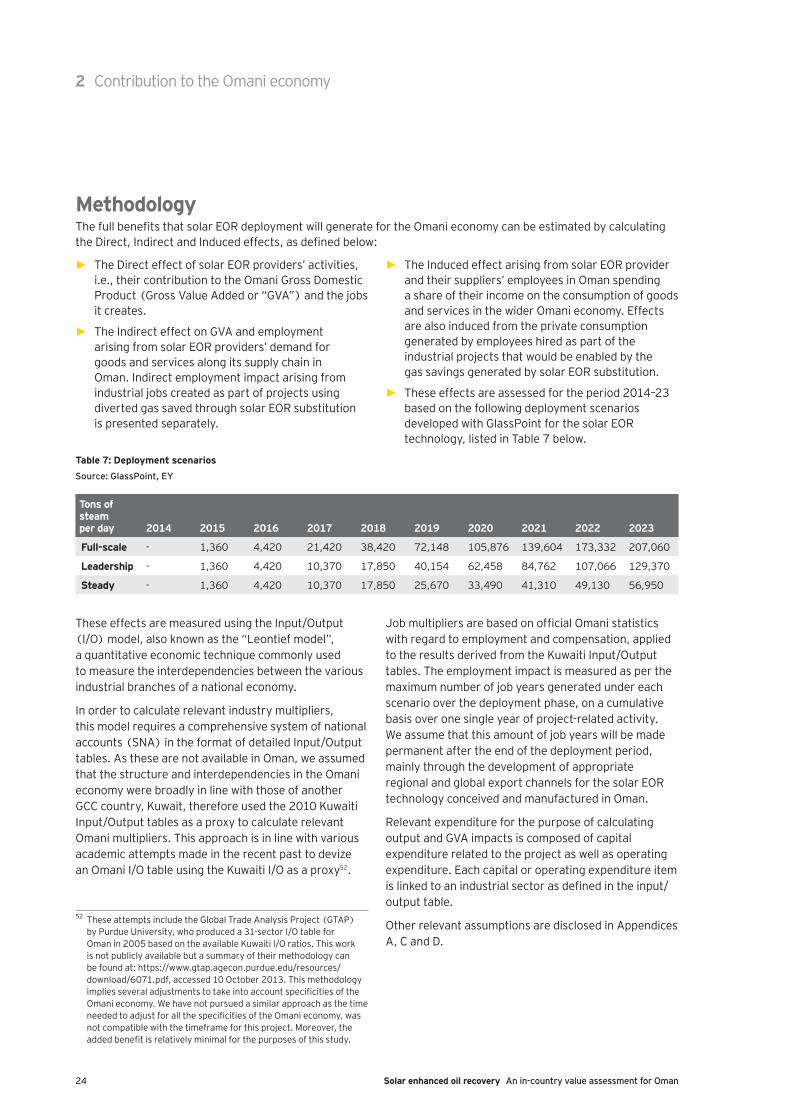
► These effects are assessed for the period 2014–23 based on the following deployment scenarios developed with GlassPoint for the solar EOR technology, listed in Table 7 below.
Table 7: Deployment scenariosSource: GlassPoint, EY
Tons of steam per day 2014 2015 2016 2017 2018 2019 2020 2021 2022 2023
Full-scale - 1,360 4,420 21,420 38,420 72,148 105,876 139,604 173,332 207,060
Leadership - 1,360 4,420 10,370 17,850 40,154 62,458 84,762 107,066 129,370
Steady - 1,360 4,420 10,370 17,850 25,670 33,490 41,310 49,130 56,950
These effects are measured using the Input/Output (I/O) model, also known as the “Leontief model”, a quantitative economic technique commonly used to measure the interdependencies between the various industrial branches of a national economy.
In order to calculate relevant industry multipliers, this model requires a comprehensive system of national accounts (SNA) in the format of detailed Input/Output tables. As these are not available in Oman, we assumed that the structure and interdependencies in the Omani economy were broadly in line with those of another GCC country, Kuwait, therefore used the 2010 Kuwaiti Input/Output tables as a proxy to calculate relevant Omani multipliers. This approach is in line with various academic attempts made in the recent past to devize an Omani I/O table using the Kuwaiti I/O as a proxy52.
52 These attempts include the Global Trade Analysis Project (GTAP) by Purdue University, who produced a 31-sector I/O table for Oman in 2005 based on the available Kuwaiti I/O ratios. This work is not publicly available but a summary of their methodology can be found at: https://www.gtap.agecon.purdue.edu/resources/download/6071.pdf, accessed 10 October 2013. This methodology implies several adjustments to take into account specificities of the Omani economy. We have not pursued a similar approach as the time needed to adjust for all the specificities of the Omani economy, was not compatible with the timeframe for this project. Moreover, the added benefit is relatively minimal for the purposes of this study.
Job multipliers are based on official Omani statistics with regard to employment and compensation, applied to the results derived from the Kuwaiti Input/Output tables. The employment impact is measured as per the maximum number of job years generated under each scenario over the deployment phase, on a cumulative basis over one single year of project-related activity. We assume that this amount of job years will be made permanent after the end of the deployment period, mainly through the development of appropriate regional and global export channels for the solar EOR technology conceived and manufactured in Oman.
Relevant expenditure for the purpose of calculating output and GVA impacts is composed of capital expenditure related to the project as well as operating expenditure. Each capital or operating expenditure item is linked to an industrial sector as defined in the input/output table.
Other relevant assumptions are disclosed in Appendices A, C and D.
2 Contribution to the Omani economy
25Solar enhanced oil recovery An in-country value assessment for Oman
2 Contribution to the Omani economy
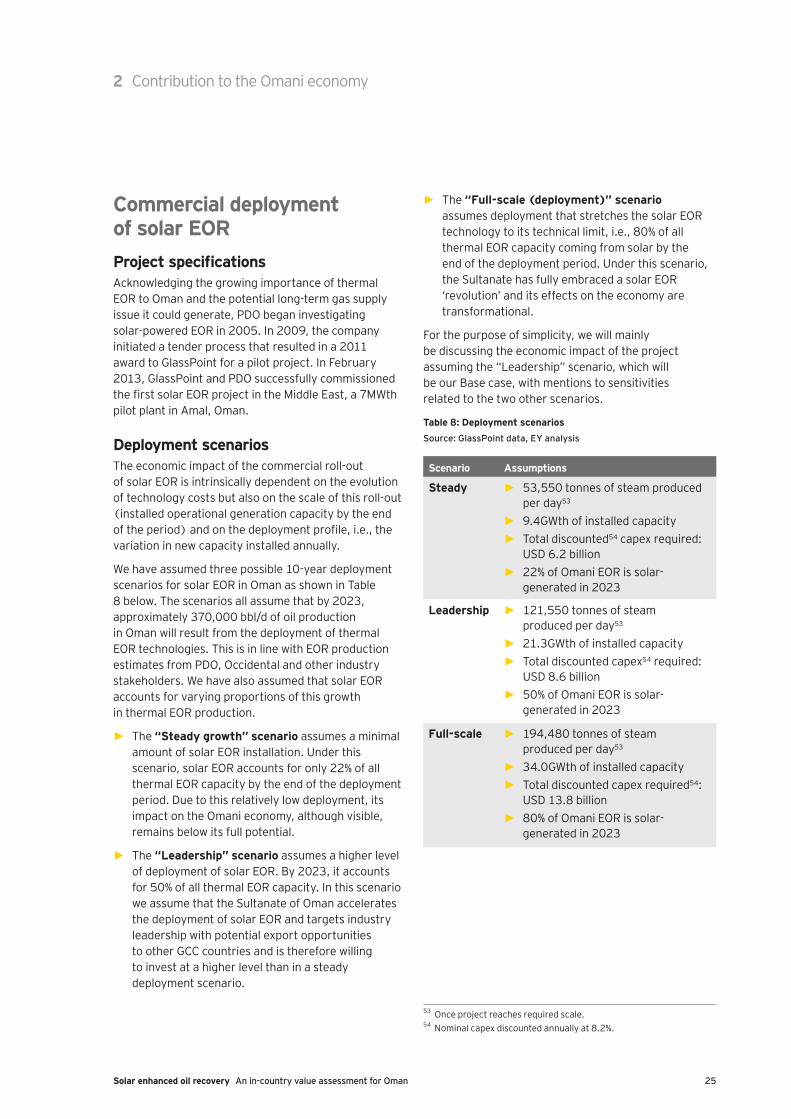
Commercial deployment of solar EORProject specificationsAcknowledging the growing importance of thermal EOR to Oman and the potential long-term gas supply issue it could generate, PDO began investigating solar-powered EOR in 2005. In 2009, the company initiated a tender process that resulted in a 2011 award to GlassPoint for a pilot project. In February 2013, GlassPoint and PDO successfully commissioned the first solar EOR project in the Middle East, a 7MWth pilot plant in Amal, Oman.
Deployment scenariosThe economic impact of the commercial roll-out of solar EOR is intrinsically dependent on the evolution of technology costs but also on the scale of this roll-out (installed operational generation capacity by the end of the period) and on the deployment profile, i.e., the variation in new capacity installed annually.
We have assumed three possible 10-year deployment scenarios for solar EOR in Oman as shown in Table 8 below. The scenarios all assume that by 2023, approximately 370,000 bbl/d of oil production in Oman will result from the deployment of thermal EOR technologies. This is in line with EOR production estimates from PDO, Occidental and other industry stakeholders. We have also assumed that solar EOR accounts for varying proportions of this growth in thermal EOR production.
► The “Steady growth” scenario assumes a minimal amount of solar EOR installation. Under this scenario, solar EOR accounts for only 22% of all thermal EOR capacity by the end of the deployment period. Due to this relatively low deployment, its impact on the Omani economy, although visible, remains below its full potential.
► The “Leadership” scenario assumes a higher level of deployment of solar EOR. By 2023, it accounts for 50% of all thermal EOR capacity. In this scenario we assume that the Sultanate of Oman accelerates the deployment of solar EOR and targets industry leadership with potential export opportunities to other GCC countries and is therefore willing to invest at a higher level than in a steady deployment scenario.
► The “Full-scale (deployment)” scenario assumes deployment that stretches the solar EOR technology to its technical limit, i.e., 80% of all thermal EOR capacity coming from solar by the end of the deployment period. Under this scenario, the Sultanate has fully embraced a solar EOR ‘revolution’ and its effects on the economy are transformational.
For the purpose of simplicity, we will mainly be discussing the economic impact of the project assuming the “Leadership” scenario, which will be our Base case, with mentions to sensitivities related to the two other scenarios.
Table 8: Deployment scenariosSource: GlassPoint data, EY analysis
Scenario Assumptions
Steady ► 53,550 tonnes of steam produced per day53
► 9.4GWth of installed capacity ► Total discounted54 capex required:
USD 6.2 billion ► 22% of Omani EOR is solar-
generated in 2023
Leadership ► 121,550 tonnes of steam produced per day53
► 21.3GWth of installed capacity ► Total discounted capex54 required:
USD 8.6 billion ► 50% of Omani EOR is solar-
generated in 2023
Full-scale ► 194,480 tonnes of steam produced per day53
► 34.0GWth of installed capacity ► Total discounted capex required54:
USD 13.8 billion ► 80% of Omani EOR is solar-
generated in 2023
53 Once project reaches required scale.54 Nominal capex discounted annually at 8.2%.
26 Solar enhanced oil recovery An in-country value assessment for Oman
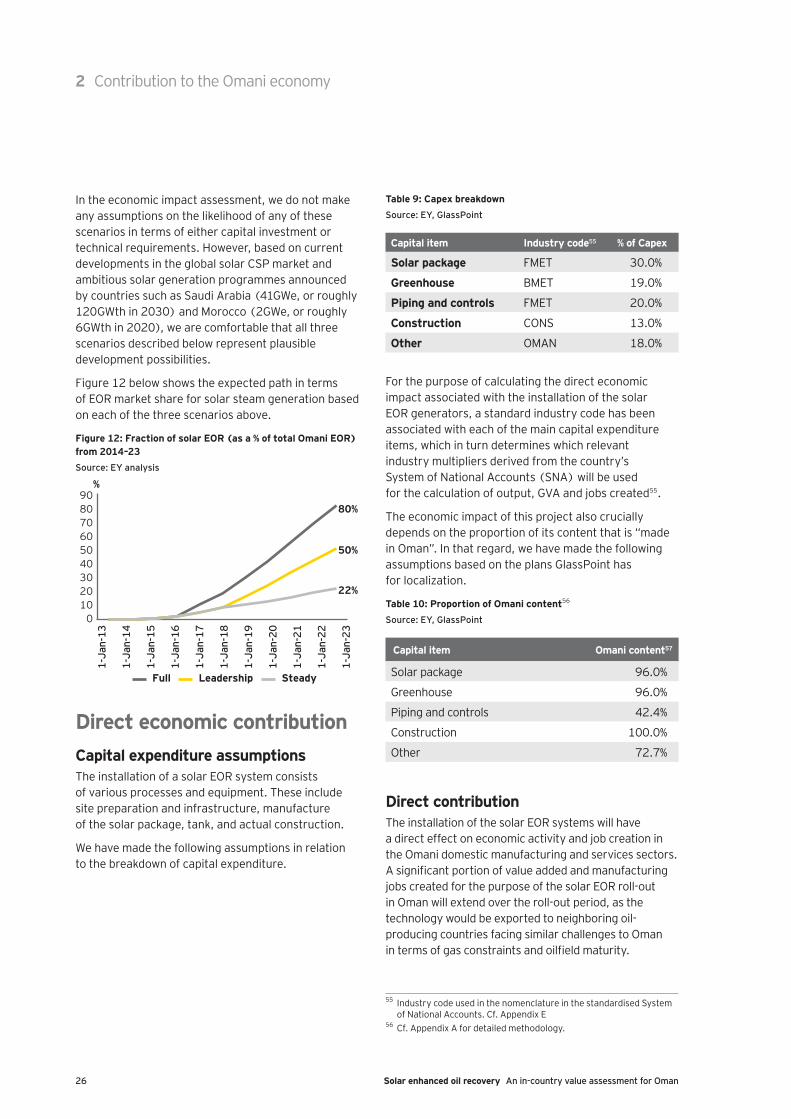
In the economic impact assessment, we do not make any assumptions on the likelihood of any of these scenarios in terms of either capital investment or technical requirements. However, based on current developments in the global solar CSP market and ambitious solar generation programmes announced by countries such as Saudi Arabia (41GWe, or roughly 120GWth in 2030) and Morocco (2GWe, or roughly 6GWth in 2020), we are comfortable that all three scenarios described below represent plausible development possibilities.
Figure 12 below shows the expected path in terms of EOR market share for solar steam generation based on each of the three scenarios above.
Figure 12: Fraction of solar EOR (as a % of total Omani EOR) from 2014–23Source: EY analysis
80%
50%
22%
1-Ja
n-13
1-Ja
n-14
1-Ja
n-15
1-Ja
n-16
1-Ja
n-17
1-Ja
n-18
1-Ja
n-19
1-Ja
n-20
1-Ja
n-21
1-Ja
n-22
1-Ja
n-23
0102030405060708090
%
Full Leadership Steady
Direct economic contributionCapital expenditure assumptionsThe installation of a solar EOR system consists of various processes and equipment. These include site preparation and infrastructure, manufacture of the solar package, tank, and actual construction.
We have made the following assumptions in relation to the breakdown of capital expenditure.
Table 9: Capex breakdownSource: EY, GlassPoint
Capital item Industry code55 % of Capex
Solar package FMET 30.0%
Greenhouse BMET 19.0%
Piping and controls FMET 20.0%
Construction CONS 13.0%
Other OMAN 18.0%
For the purpose of calculating the direct economic impact associated with the installation of the solar EOR generators, a standard industry code has been associated with each of the main capital expenditure items, which in turn determines which relevant industry multipliers derived from the country’s System of National Accounts (SNA) will be used for the calculation of output, GVA and jobs created55.
The economic impact of this project also crucially depends on the proportion of its content that is “made in Oman”. In that regard, we have made the following assumptions based on the plans GlassPoint has for localization.
Table 10: Proportion of Omani content56
Source: EY, GlassPoint
Capital item Omani content57
Solar package 96.0%
Greenhouse 96.0%
Piping and controls 42.4%
Construction 100.0%
Other 72.7%
Direct contributionThe installation of the solar EOR systems will have a direct effect on economic activity and job creation in the Omani domestic manufacturing and services sectors. A significant portion of value added and manufacturing jobs created for the purpose of the solar EOR roll-out in Oman will extend over the roll-out period, as the technology would be exported to neighboring oil-producing countries facing similar challenges to Oman in terms of gas constraints and oilfield maturity.
55 Industry code used in the nomenclature in the standardised System of National Accounts. Cf. Appendix E
56 Cf. Appendix A for detailed methodology.
2 Contribution to the Omani economy
27Solar enhanced oil recovery An in-country value assessment for Oman
2 Contribution to the Omani economy
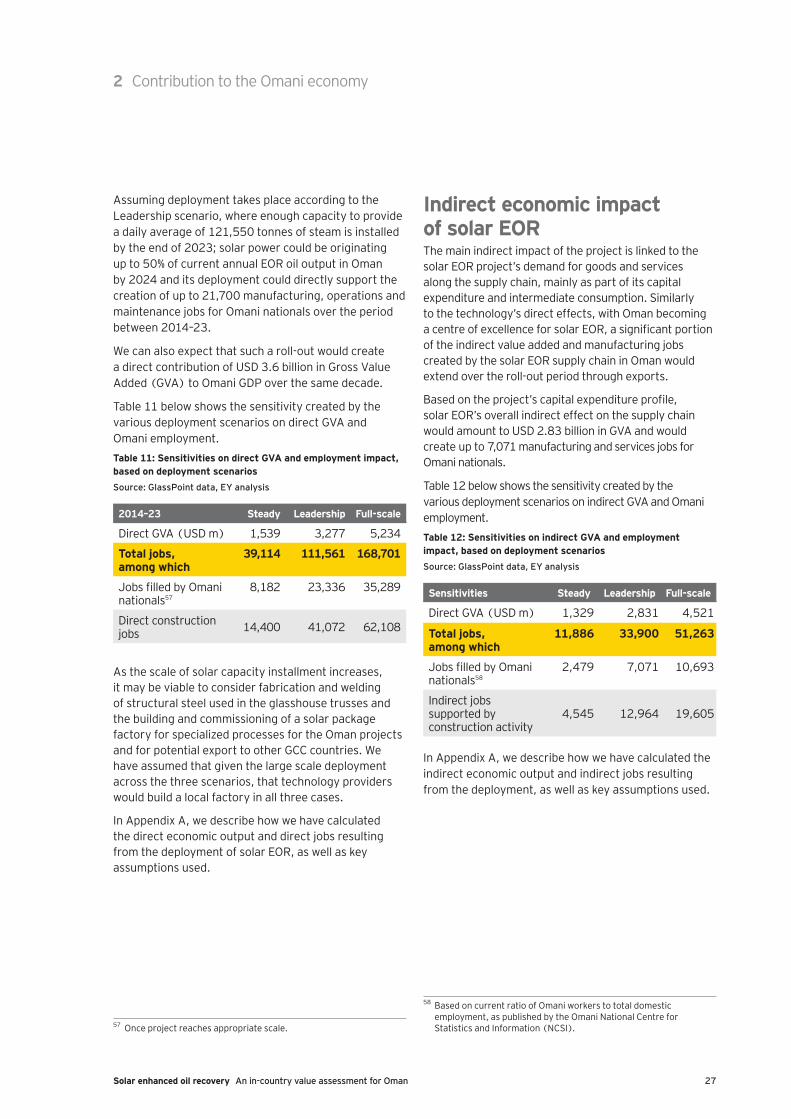
Assuming deployment takes place according to the Leadership scenario, where enough capacity to provide a daily average of 121,550 tonnes of steam is installed by the end of 2023; solar power could be originating up to 50% of current annual EOR oil output in Oman by 2024 and its deployment could directly support the creation of up to 21,700 manufacturing, operations and maintenance jobs for Omani nationals over the period between 2014–23.
We can also expect that such a roll-out would create a direct contribution of USD 3.6 billion in Gross Value Added (GVA) to Omani GDP over the same decade.
Table 11 below shows the sensitivity created by the various deployment scenarios on direct GVA and Omani employment.Table 11: Sensitivities on direct GVA and employment impact, based on deployment scenariosSource: GlassPoint data, EY analysis
2014–23 Steady Leadership Full-scale
Direct GVA (USD m) 1,539 3,277 5,234
Total jobs, among which
39,114 111,561 168,701
Jobs filled by Omani nationals57
8,182 23,336 35,289
Direct construction jobs 14,400 41,072 62,108
As the scale of solar capacity installment increases, it may be viable to consider fabrication and welding of structural steel used in the glasshouse trusses and the building and commissioning of a solar package factory for specialized processes for the Oman projects and for potential export to other GCC countries. We have assumed that given the large scale deployment across the three scenarios, that technology providers would build a local factory in all three cases.
In Appendix A, we describe how we have calculated the direct economic output and direct jobs resulting from the deployment of solar EOR, as well as key assumptions used.
57 Once project reaches appropriate scale.
Indirect economic impact of solar EORThe main indirect impact of the project is linked to the solar EOR project’s demand for goods and services along the supply chain, mainly as part of its capital expenditure and intermediate consumption. Similarly to the technology’s direct effects, with Oman becoming a centre of excellence for solar EOR, a significant portion of the indirect value added and manufacturing jobs created by the solar EOR supply chain in Oman would extend over the roll-out period through exports.
Based on the project’s capital expenditure profile, solar EOR’s overall indirect effect on the supply chain would amount to USD 2.83 billion in GVA and would create up to 7,071 manufacturing and services jobs for Omani nationals.
Table 12 below shows the sensitivity created by the various deployment scenarios on indirect GVA and Omani employment.Table 12: Sensitivities on indirect GVA and employment impact, based on deployment scenariosSource: GlassPoint data, EY analysis
Sensitivities Steady Leadership Full-scale
Direct GVA (USD m) 1,329 2,831 4,521
Total jobs, among which
11,886 33,900 51,263
Jobs filled by Omani nationals58
2,479 7,071 10,693
Indirect jobs supported by construction activity
4,545 12,964 19,605
In Appendix A, we describe how we have calculated the indirect economic output and indirect jobs resulting from the deployment, as well as key assumptions used.
58 Based on current ratio of Omani workers to total domestic employment, as published by the Omani National Centre for Statistics and Information (NCSI).
28 Solar enhanced oil recovery An in-country value assessment for Oman
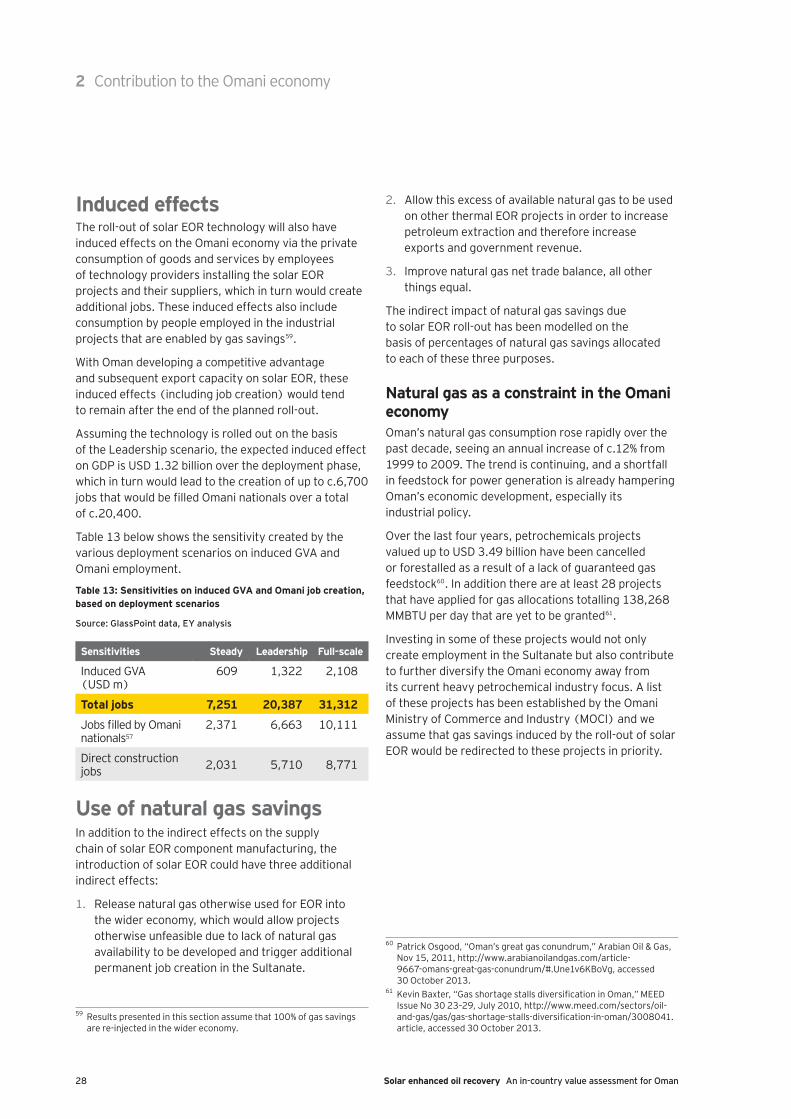
Induced effectsThe roll-out of solar EOR technology will also have induced effects on the Omani economy via the private consumption of goods and services by employees of technology providers installing the solar EOR projects and their suppliers, which in turn would create additional jobs. These induced effects also include consumption by people employed in the industrial projects that are enabled by gas savings59.
With Oman developing a competitive advantage and subsequent export capacity on solar EOR, these induced effects (including job creation) would tend to remain after the end of the planned roll-out.
Assuming the technology is rolled out on the basis of the Leadership scenario, the expected induced effect on GDP is USD 1.32 billion over the deployment phase, which in turn would lead to the creation of up to c.6,700 jobs that would be filled Omani nationals over a total of c.20,400.
Table 13 below shows the sensitivity created by the various deployment scenarios on induced GVA and Omani employment.
Table 13: Sensitivities on induced GVA and Omani job creation, based on deployment scenarios
Source: GlassPoint data, EY analysis
Sensitivities Steady Leadership Full-scale
Induced GVA (USD m)
609 1,322 2,108
Total jobs 7,251 20,387 31,312
Jobs filled by Omani nationals57
2,371 6,663 10,111
Direct construction jobs 2,031 5,710 8,771
Use of natural gas savingsIn addition to the indirect effects on the supply chain of solar EOR component manufacturing, the introduction of solar EOR could have three additional indirect effects:
1. Release natural gas otherwise used for EOR into the wider economy, which would allow projects otherwise unfeasible due to lack of natural gas availability to be developed and trigger additional permanent job creation in the Sultanate.
59 Results presented in this section assume that 100% of gas savings are re-injected in the wider economy.
2. Allow this excess of available natural gas to be used on other thermal EOR projects in order to increase petroleum extraction and therefore increase exports and government revenue.
3. Improve natural gas net trade balance, all other things equal.
The indirect impact of natural gas savings due to solar EOR roll-out has been modelled on the basis of percentages of natural gas savings allocated to each of these three purposes.
Natural gas as a constraint in the Omani economyOman’s natural gas consumption rose rapidly over the past decade, seeing an annual increase of c.12% from 1999 to 2009. The trend is continuing, and a shortfall in feedstock for power generation is already hampering Oman’s economic development, especially its industrial policy.
Over the last four years, petrochemicals projects valued up to USD 3.49 billion have been cancelled or forestalled as a result of a lack of guaranteed gas feedstock60. In addition there are at least 28 projects that have applied for gas allocations totalling 138,268 MMBTU per day that are yet to be granted61.
Investing in some of these projects would not only create employment in the Sultanate but also contribute to further diversify the Omani economy away from its current heavy petrochemical industry focus. A list of these projects has been established by the Omani Ministry of Commerce and Industry (MOCI) and we assume that gas savings induced by the roll-out of solar EOR would be redirected to these projects in priority.
60 Patrick Osgood, “Oman’s great gas conundrum,” Arabian Oil & Gas, Nov 15, 2011, http://www.arabianoilandgas.com/article-9667-omans-great-gas-conundrum/#.Une1v6KBoVg, accessed 30 October 2013.
61 Kevin Baxter, “Gas shortage stalls diversification in Oman,” MEED Issue No 30 23–29, July 2010, http://www.meed.com/sectors/oil-and-gas/gas/gas-shortage-stalls-diversification-in-oman/3008041.article, accessed 30 October 2013.
2 Contribution to the Omani economy
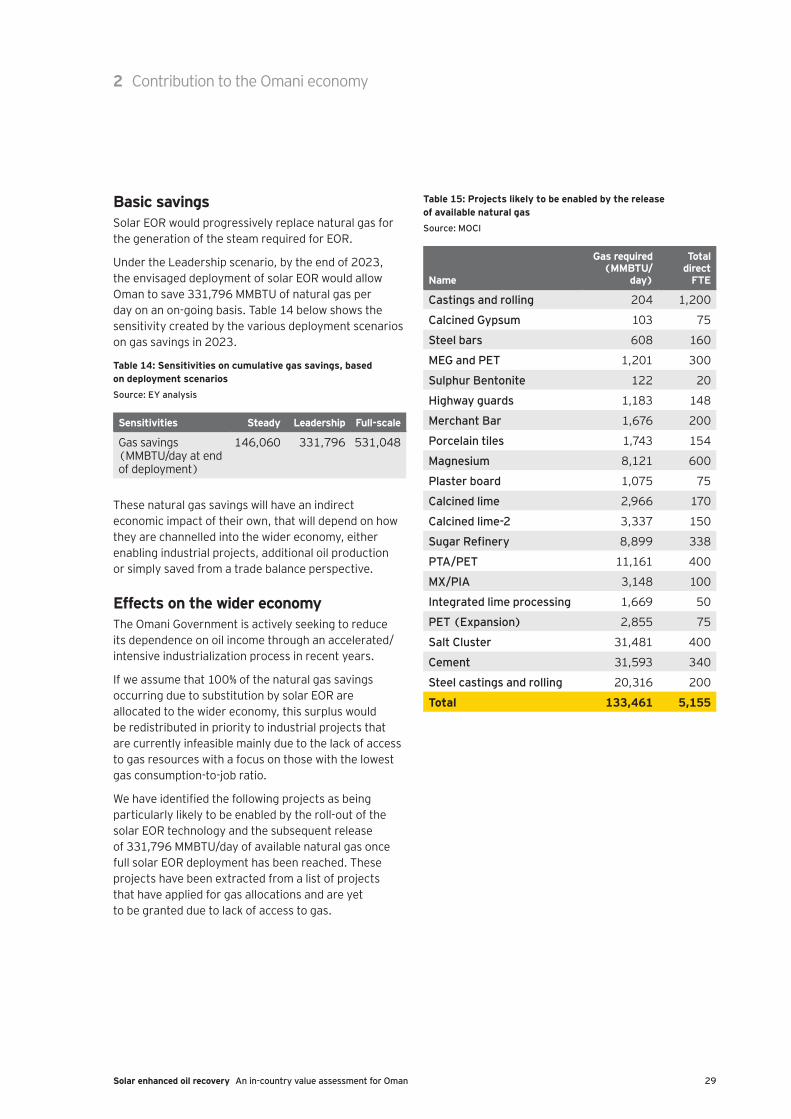
29Solar enhanced oil recovery An in-country value assessment for Oman
Basic savingsSolar EOR would progressively replace natural gas for the generation of the steam required for EOR.
Under the Leadership scenario, by the end of 2023, the envisaged deployment of solar EOR would allow Oman to save 331,796 MMBTU of natural gas per day on an on-going basis. Table 14 below shows the sensitivity created by the various deployment scenarios on gas savings in 2023.
Table 14: Sensitivities on cumulative gas savings, based on deployment scenariosSource: EY analysis
Sensitivities Steady Leadership Full-scale
Gas savings (MMBTU/day at end of deployment)
146,060 331,796 531,048
These natural gas savings will have an indirect economic impact of their own, that will depend on how they are channelled into the wider economy, either enabling industrial projects, additional oil production or simply saved from a trade balance perspective.
Effects on the wider economyThe Omani Government is actively seeking to reduce its dependence on oil income through an accelerated/intensive industrialization process in recent years.
If we assume that 100% of the natural gas savings occurring due to substitution by solar EOR are allocated to the wider economy, this surplus would be redistributed in priority to industrial projects that are currently infeasible mainly due to the lack of access to gas resources with a focus on those with the lowest gas consumption-to-job ratio.
We have identified the following projects as being particularly likely to be enabled by the roll-out of the solar EOR technology and the subsequent release of 331,796 MMBTU/day of available natural gas once full solar EOR deployment has been reached. These projects have been extracted from a list of projects that have applied for gas allocations and are yet to be granted due to lack of access to gas.
Table 15: Projects likely to be enabled by the release of available natural gasSource: MOCI
Name
Gas required (MMBTU/
day)
Total direct
FTE
Castings and rolling 204 1,200
Calcined Gypsum 103 75
Steel bars 608 160
MEG and PET 1,201 300
Sulphur Bentonite 122 20
Highway guards 1,183 148
Merchant Bar 1,676 200
Porcelain tiles 1,743 154
Magnesium 8,121 600
Plaster board 1,075 75
Calcined lime 2,966 170
Calcined lime-2 3,337 150
Sugar Refinery 8,899 338
PTA/PET 11,161 400
MX/PIA 3,148 100
Integrated lime processing 1,669 50
PET (Expansion) 2,855 75
Salt Cluster 31,481 400
Cement 31,593 340
Steel castings and rolling 20,316 200
Total 133,461 5,155
2 Contribution to the Omani economy
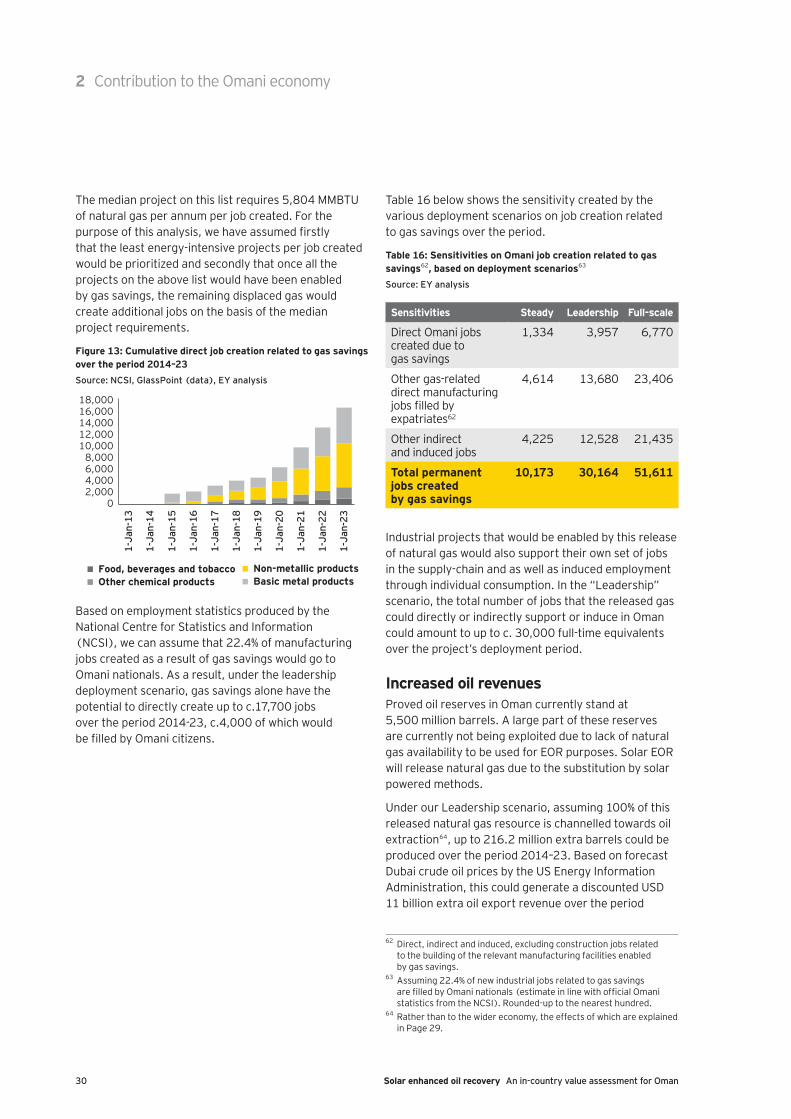
30 Solar enhanced oil recovery An in-country value assessment for Oman
2 Contribution to the Omani economy
The median project on this list requires 5,804 MMBTU of natural gas per annum per job created. For the purpose of this analysis, we have assumed firstly that the least energy-intensive projects per job created would be prioritized and secondly that once all the projects on the above list would have been enabled by gas savings, the remaining displaced gas would create additional jobs on the basis of the median project requirements.
Figure 13: Cumulative direct job creation related to gas savings over the period 2014–23Source: NCSI, GlassPoint (data), EY analysis
1-Ja
n-15
1-Ja
n-16
1-Ja
n-13
1-Ja
n-14
1-Ja
n-17
1-Ja
n-18
1-Ja
n-19
1-Ja
n-20
1-Ja
n-21
1-Ja
n-22
1-Ja
n-23
02,0004,0006,0008,000
10,00012,00014,00016,00018,000
Food, beverages and tobaccoOther chemical products
Non-metallic productsBasic metal products
Based on employment statistics produced by the National Centre for Statistics and Information (NCSI), we can assume that 22.4% of manufacturing jobs created as a result of gas savings would go to Omani nationals. As a result, under the leadership deployment scenario, gas savings alone have the potential to directly create up to c.17,700 jobs over the period 2014-23, c.4,000 of which would be filled by Omani citizens.
Table 16 below shows the sensitivity created by the various deployment scenarios on job creation related to gas savings over the period.
Table 16: Sensitivities on Omani job creation related to gas savings62, based on deployment scenarios63
Source: EY analysis
Sensitivities Steady Leadership Full-scale
Direct Omani jobs created due to gas savings
1,334 3,957 6,770
Other gas-related direct manufacturing jobs filled by expatriates62
4,614 13,680 23,406
Other indirect and induced jobs
4,225 12,528 21,435
Total permanent jobs created by gas savings
10,173 30,164 51,611
Industrial projects that would be enabled by this release of natural gas would also support their own set of jobs in the supply-chain and as well as induced employment through individual consumption. In the “Leadership” scenario, the total number of jobs that the released gas could directly or indirectly support or induce in Oman could amount to up to c. 30,000 full-time equivalents over the project’s deployment period.
Increased oil revenuesProved oil reserves in Oman currently stand at 5,500 million barrels. A large part of these reserves are currently not being exploited due to lack of natural gas availability to be used for EOR purposes. Solar EOR will release natural gas due to the substitution by solar powered methods.
Under our Leadership scenario, assuming 100% of this released natural gas resource is channelled towards oil extraction64, up to 216.2 million extra barrels could be produced over the period 2014–23. Based on forecast Dubai crude oil prices by the US Energy Information Administration, this could generate a discounted USD 11 billion extra oil export revenue over the period
62 Direct, indirect and induced, excluding construction jobs related to the building of the relevant manufacturing facilities enabled by gas savings.
63 Assuming 22.4% of new industrial jobs related to gas savings are filled by Omani nationals (estimate in line with official Omani statistics from the NCSI). Rounded-up to the nearest hundred.
64 Rather than to the wider economy, the effects of which are explained in Page 29.
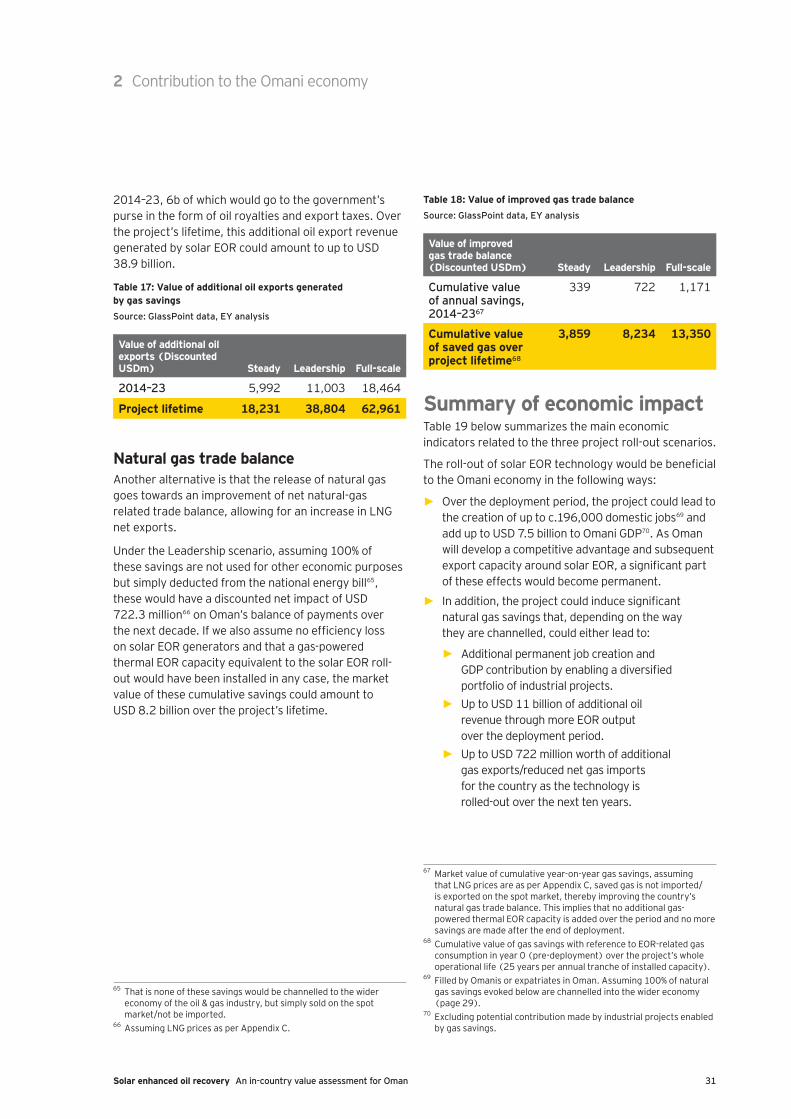
31Solar enhanced oil recovery An in-country value assessment for Oman
2014–23, 6b of which would go to the government’s purse in the form of oil royalties and export taxes. Over the project’s lifetime, this additional oil export revenue generated by solar EOR could amount to up to USD 38.9 billion.
Table 17: Value of additional oil exports generated by gas savingsSource: GlassPoint data, EY analysis
Value of additional oil exports (Discounted USDm) Steady Leadership Full-scale
2014–23 5,992 11,003 18,464
Project lifetime 18,231 38,804 62,961
Natural gas trade balanceAnother alternative is that the release of natural gas goes towards an improvement of net natural-gas related trade balance, allowing for an increase in LNG net exports.
Under the Leadership scenario, assuming 100% of these savings are not used for other economic purposes but simply deducted from the national energy bill65, these would have a discounted net impact of USD 722.3 million66 on Oman’s balance of payments over the next decade. If we also assume no efficiency loss on solar EOR generators and that a gas-powered thermal EOR capacity equivalent to the solar EOR roll-out would have been installed in any case, the market value of these cumulative savings could amount to USD 8.2 billion over the project’s lifetime.
65 That is none of these savings would be channelled to the wider economy of the oil & gas industry, but simply sold on the spot market/not be imported.
66 Assuming LNG prices as per Appendix C.
Table 18: Value of improved gas trade balanceSource: GlassPoint data, EY analysis
Value of improved gas trade balance (Discounted USDm) Steady Leadership Full-scale
Cumulative value of annual savings, 2014–2367
339 722 1,171
Cumulative value of saved gas over project lifetime68
3,859 8,234 13,350
Summary of economic impactTable 19 below summarizes the main economic indicators related to the three project roll-out scenarios.
The roll-out of solar EOR technology would be beneficial to the Omani economy in the following ways:
► Over the deployment period, the project could lead to the creation of up to c.196,000 domestic jobs69 and add up to USD 7.5 billion to Omani GDP70. As Oman will develop a competitive advantage and subsequent export capacity around solar EOR, a significant part of these effects would become permanent.
► In addition, the project could induce significant natural gas savings that, depending on the way they are channelled, could either lead to:
► Additional permanent job creation and GDP contribution by enabling a diversified portfolio of industrial projects.
► Up to USD 11 billion of additional oil revenue through more EOR output over the deployment period.
► Up to USD 722 million worth of additional gas exports/reduced net gas imports for the country as the technology is rolled-out over the next ten years.
67 Market value of cumulative year-on-year gas savings, assuming that LNG prices are as per Appendix C, saved gas is not imported/is exported on the spot market, thereby improving the country’s natural gas trade balance. This implies that no additional gas-powered thermal EOR capacity is added over the period and no more savings are made after the end of deployment.
68 Cumulative value of gas savings with reference to EOR-related gas consumption in year 0 (pre-deployment) over the project’s whole operational life (25 years per annual tranche of installed capacity).
69 Filled by Omanis or expatriates in Oman. Assuming 100% of natural gas savings evoked below are channelled into the wider economy (page 29).
70 Excluding potential contribution made by industrial projects enabled by gas savings.
2 Contribution to the Omani economy
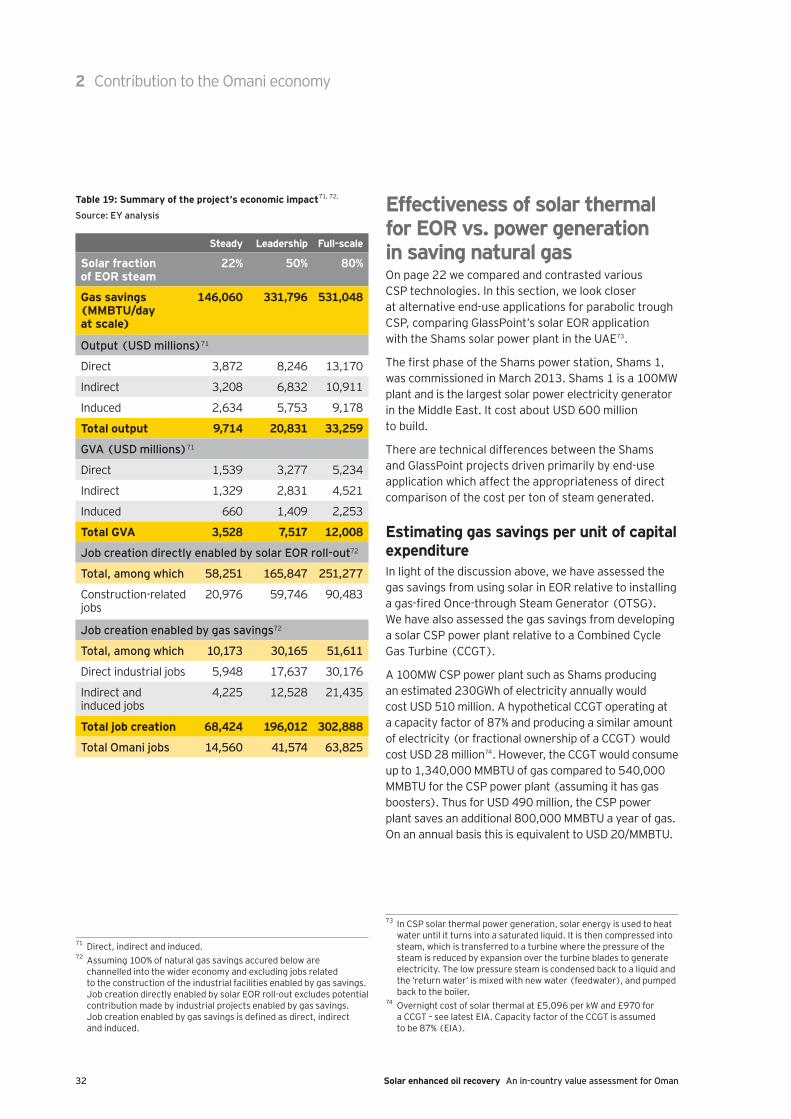
32 Solar enhanced oil recovery An in-country value assessment for Oman
Table 19: Summary of the project’s economic impact71, 72,
Source: EY analysis
Steady Leadership Full-scale
Solar fraction of EOR steam
22% 50% 80%
Gas savings (MMBTU/day at scale)
146,060 331,796 531,048
Output (USD millions)71
Direct 3,872 8,246 13,170
Indirect 3,208 6,832 10,911
Induced 2,634 5,753 9,178
Total output 9,714 20,831 33,259
GVA (USD millions)71
Direct 1,539 3,277 5,234
Indirect 1,329 2,831 4,521
Induced 660 1,409 2,253
Total GVA 3,528 7,517 12,008
Job creation directly enabled by solar EOR roll-out72
Total, among which 58,251 165,847 251,277
Construction-related jobs
20,976 59,746 90,483
Job creation enabled by gas savings72
Total, among which 10,173 30,165 51,611
Direct industrial jobs 5,948 17,637 30,176
Indirect and induced jobs
4,225 12,528 21,435
Total job creation 68,424 196,012 302,888
Total Omani jobs 14,560 41,574 63,825
71 Direct, indirect and induced.72 Assuming 100% of natural gas savings accured below are
channelled into the wider economy and excluding jobs related to the construction of the industrial facilities enabled by gas savings. Job creation directly enabled by solar EOR roll-out excludes potential contribution made by industrial projects enabled by gas savings. Job creation enabled by gas savings is defined as direct, indirect and induced.
Effectiveness of solar thermal for EOR vs. power generation in saving natural gasOn page 22 we compared and contrasted various CSP technologies. In this section, we look closer at alternative end-use applications for parabolic trough CSP, comparing GlassPoint’s solar EOR application with the Shams solar power plant in the UAE73.
The first phase of the Shams power station, Shams 1, was commissioned in March 2013. Shams 1 is a 100MW plant and is the largest solar power electricity generator in the Middle East. It cost about USD 600 million to build.
There are technical differences between the Shams and GlassPoint projects driven primarily by end-use application which affect the appropriateness of direct comparison of the cost per ton of steam generated.
Estimating gas savings per unit of capital expenditureIn light of the discussion above, we have assessed the gas savings from using solar in EOR relative to installing a gas-fired Once-through Steam Generator (OTSG). We have also assessed the gas savings from developing a solar CSP power plant relative to a Combined Cycle Gas Turbine (CCGT).
A 100MW CSP power plant such as Shams producing an estimated 230GWh of electricity annually would cost USD 510 million. A hypothetical CCGT operating at a capacity factor of 87% and producing a similar amount of electricity (or fractional ownership of a CCGT) would cost USD 28 million74. However, the CCGT would consume up to 1,340,000 MMBTU of gas compared to 540,000 MMBTU for the CSP power plant (assuming it has gas boosters). Thus for USD 490 million, the CSP power plant saves an additional 800,000 MMBTU a year of gas. On an annual basis this is equivalent to USD 20/MMBTU.
73 In CSP solar thermal power generation, solar energy is used to heat water until it turns into a saturated liquid. It is then compressed into steam, which is transferred to a turbine where the pressure of the steam is reduced by expansion over the turbine blades to generate electricity. The low pressure steam is condensed back to a liquid and the ‘return water’ is mixed with new water (feedwater), and pumped back to the boiler.
74 Overnight cost of solar thermal at £5,096 per kW and £970 for a CCGT – see latest EIA. Capacity factor of the CCGT is assumed to be 87% (EIA).
2 Contribution to the Omani economy
33Solar enhanced oil recovery An in-country value assessment for Oman
In contrast, a solar EOR steam generator producing 5,820,000 MMBTU of steam output per year would cost approximately USD 660 million without consuming any gas. An OTSG with a similar output of steam would cost USD 72 million and consume approximately 6,840,000 MMBTU of gas per year. Thus for USD 586 million, the solar EOR unit saves an additional 6,840,000 MMBTU of gas annually, which is equivalent to USD 3.40/MMBTU.
When the two above scenarios are compared, investing in solar EOR saves up to six times as much gas per unit of capital expenditure compared to a CSP power plant, that is USD 3.4 per MMBTU as opposed to USD 20 per MMBTU of gas.
Skill development and innovationThe deployment of solar EOR provides an opportunity to develop skills of wider economic benefit to Oman. The scale of the project would expose local engineers to solar technology and its supply chain, enabling them to bridge skills from the existing oil and gas base in Oman and to widen their expertise to a potentially fast-growing strategic industry.
Solar experience would also transfer to other uses — for instance power generation, desalination and process steam, creating cross-technologically skilled local workforce.
Examples of ways in which the fledgling solar EOR sector could contribute to the development of innovation and skills in Oman include:
► Establishing an industry-university partnership, e.g., with the Sultan Qaboos University and/or endowing a professorship — industry-university partnerships are widely developed in the US and Europe. Such a partnership could fund research into areas such as subsurface effects and behavior of solar steam at rock model, lab and simulator level; understanding of local environmental conditions and solar energy and primary research in materials, durability, construction methods. Moreover, endowing a chair at the Sultan Qaboos University would provide a focal point for solar EOR related research and raise the visibility of solar EOR related research in Oman. Examples of successful programmes include current research programme on microbial EOR at the Sultan Qaboos University. Local researchers from the Department of Biology College of Science and the Petroleum and Chemical
Engineering Department, College of Engineering received a USD1 m grant and have been leading an international research programme investigating the possibility of using Microbiological process to enhance oil recovery75.
► Establishing and managing a corporate staff development program with PDO and other potential clients — formal staff development programs would serve PDO’s internal needs in thermal recovery field design, project study, facilities design and field operations. It would also bring “best practices” together with international thermal experts.
► Establishing and managing a corporate staff development programme to serve the solar EOR Oman supply chain. This would serve any factories opened in Oman and improve the quality of production establishment and project execution within Oman.
Solar EOR provides an opportunity for industry-leading innovation in Oman. Strategic efforts in that direction could transform Oman into a major renewable energy hub within the Gulf region and the “solar EOR revolution” — if embraced — could bring tangible benefits comparable — if not superior to — those of large-scale projects such as Masdar City in the UAE or the K.A.CARE procurement in Saudi Arabia.
At a time when Oman’s most prominent neighbors are investing significant amounts of capital in energy efficiency with a view to transition from the old commodity-based model into full-fledged knowledge economies, the “solar EOR revolution” provides an opportunity to shape Oman’s future in a sustainable, yet distinctive way.
75 Microbial EOR Project, Sultan Qaboos University, http://www.squ.edu.om/tabid/5835/language/en-US/Default.aspx, accessed 30 October 2013.
2 Contribution to the Omani economy
34 Solar enhanced oil recovery An in-country value assessment for Oman
3Security of energy supply, EOR potential and environmental impacts
In this section we discuss: ► The potential EOR production in the region ► The potential for technology exports for Oman ► The environmental benefits of solar EOR ► The security of energy supply impacts of solar EOR on Oman
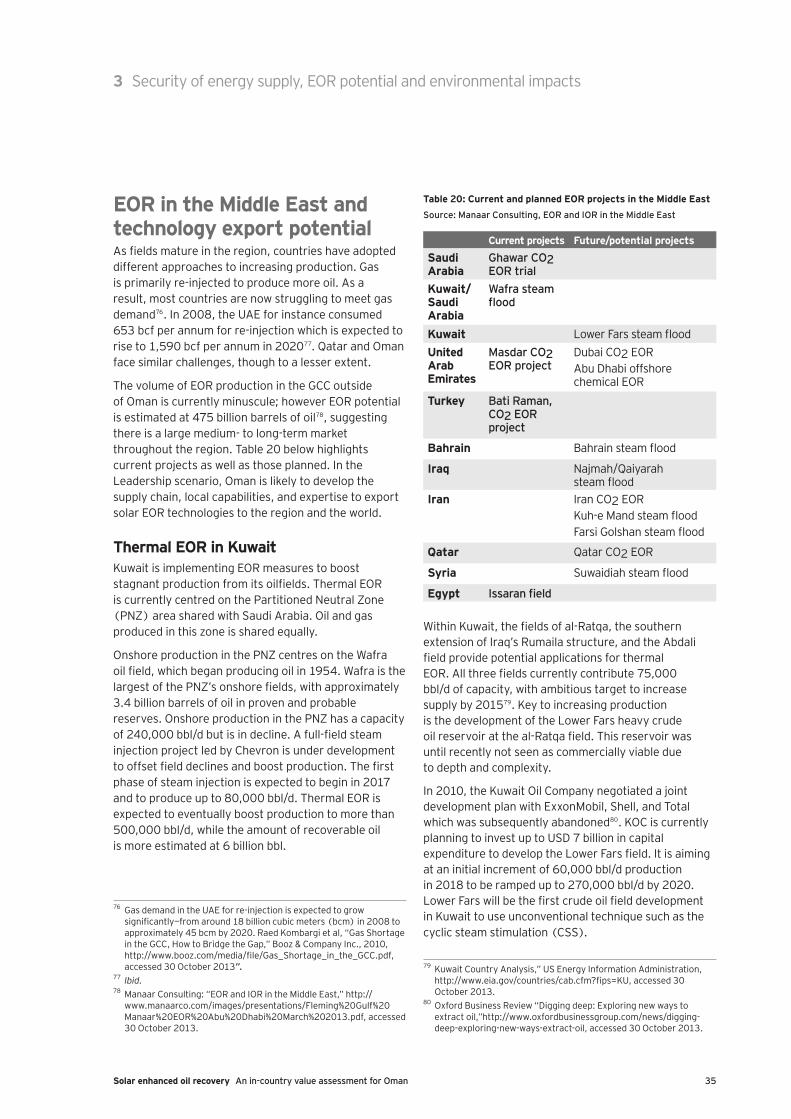
35Solar enhanced oil recovery An in-country value assessment for Oman
3 Security of energy supply, EOR potential and environmental impacts
EOR in the Middle East and technology export potentialAs fields mature in the region, countries have adopted different approaches to increasing production. Gas is primarily re-injected to produce more oil. As a result, most countries are now struggling to meet gas demand76. In 2008, the UAE for instance consumed 653 bcf per annum for re-injection which is expected to rise to 1,590 bcf per annum in 202077. Qatar and Oman face similar challenges, though to a lesser extent.
The volume of EOR production in the GCC outside of Oman is currently minuscule; however EOR potential is estimated at 475 billion barrels of oil78, suggesting there is a large medium- to long-term market throughout the region. Table 20 below highlights current projects as well as those planned. In the Leadership scenario, Oman is likely to develop the supply chain, local capabilities, and expertise to export solar EOR technologies to the region and the world.
Thermal EOR in KuwaitKuwait is implementing EOR measures to boost stagnant production from its oilfields. Thermal EOR is currently centred on the Partitioned Neutral Zone (PNZ) area shared with Saudi Arabia. Oil and gas produced in this zone is shared equally.
Onshore production in the PNZ centres on the Wafra oil field, which began producing oil in 1954. Wafra is the largest of the PNZ’s onshore fields, with approximately 3.4 billion barrels of oil in proven and probable reserves. Onshore production in the PNZ has a capacity of 240,000 bbl/d but is in decline. A full-field steam injection project led by Chevron is under development to offset field declines and boost production. The first phase of steam injection is expected to begin in 2017 and to produce up to 80,000 bbl/d. Thermal EOR is expected to eventually boost production to more than 500,000 bbl/d, while the amount of recoverable oil is more estimated at 6 billion bbl.
76 Gas demand in the UAE for re-injection is expected to grow significantly—from around 18 billion cubic meters (bcm) in 2008 to approximately 45 bcm by 2020. Raed Kombargi et al, “Gas Shortage in the GCC, How to Bridge the Gap,” Booz & Company Inc., 2010, http://www.booz.com/media/file/Gas_Shortage_in_the_GCC.pdf, accessed 30 October 2013”.
77 Ibid.78 Manaar Consulting: “EOR and IOR in the Middle East,” http://
www.manaarco.com/images/presentations/Fleming%20Gulf%20Manaar%20EOR%20Abu%20Dhabi%20March%202013.pdf, accessed 30 October 2013.
Table 20: Current and planned EOR projects in the Middle EastSource: Manaar Consulting, EOR and IOR in the Middle East
Current projects Future/potential projects
Saudi Arabia
Ghawar CO2 EOR trial
Kuwait/ Saudi Arabia
Wafra steam flood
Kuwait Lower Fars steam floodUnited Arab Emirates
Masdar CO2 EOR project
Dubai CO2 EORAbu Dhabi offshore chemical EOR
Turkey Bati Raman, CO2 EOR project
Bahrain Bahrain steam flood
Iraq Najmah/Qaiyarah steam flood
Iran Iran CO2 EORKuh-e Mand steam floodFarsi Golshan steam flood
Qatar Qatar CO2 EOR
Syria Suwaidiah steam flood
Egypt Issaran field
Within Kuwait, the fields of al-Ratqa, the southern extension of Iraq’s Rumaila structure, and the Abdali field provide potential applications for thermal EOR. All three fields currently contribute 75,000 bbl/d of capacity, with ambitious target to increase supply by 201579. Key to increasing production is the development of the Lower Fars heavy crude oil reservoir at the al-Ratqa field. This reservoir was until recently not seen as commercially viable due to depth and complexity.
In 2010, the Kuwait Oil Company negotiated a joint development plan with ExxonMobil, Shell, and Total which was subsequently abandoned80. KOC is currently planning to invest up to USD 7 billion in capital expenditure to develop the Lower Fars field. It is aiming at an initial increment of 60,000 bbl/d production in 2018 to be ramped up to 270,000 bbl/d by 2020. Lower Fars will be the first crude oil field development in Kuwait to use unconventional technique such as the cyclic steam stimulation (CSS).
79 Kuwait Country Analysis,” US Energy Information Administration, http://www.eia.gov/countries/cab.cfm?fips=KU, accessed 30 October 2013.
80 Oxford Business Review “Digging deep: Exploring new ways to extract oil,”http://www.oxfordbusinessgroup.com/news/digging-deep-exploring-new-ways-extract-oil, accessed 30 October 2013.
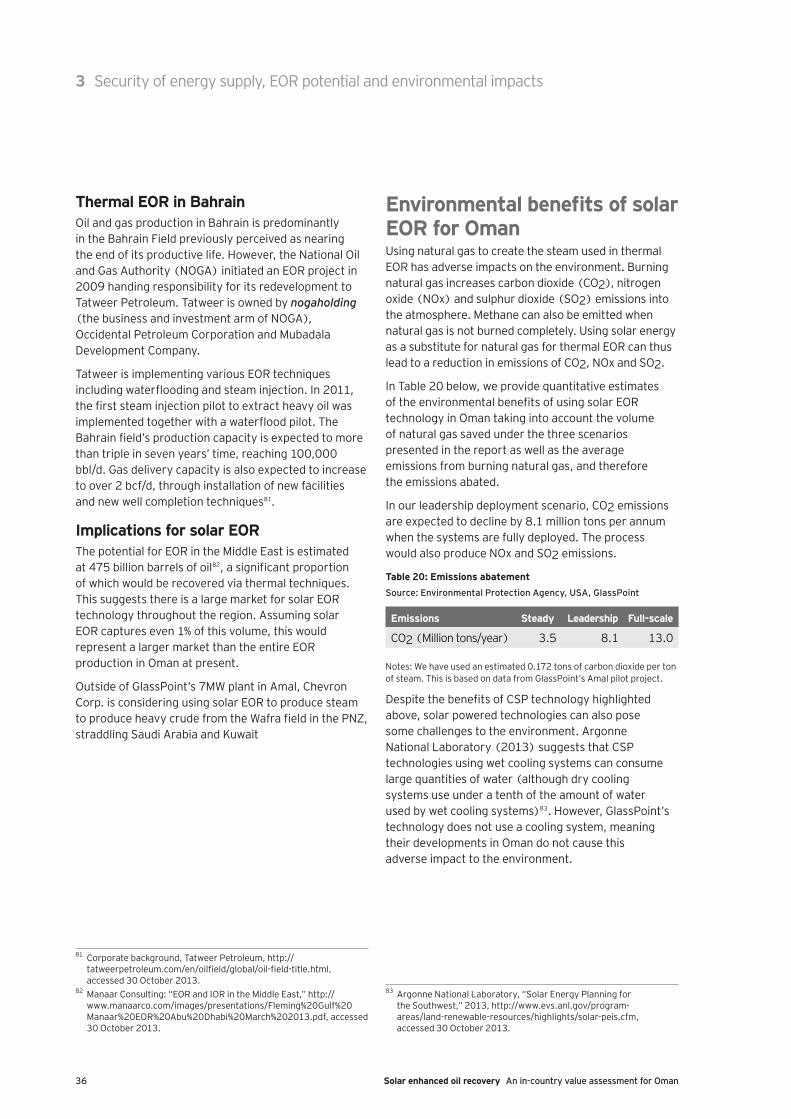
36 Solar enhanced oil recovery An in-country value assessment for Oman
Thermal EOR in BahrainOil and gas production in Bahrain is predominantly in the Bahrain Field previously perceived as nearing the end of its productive life. However, the National Oil and Gas Authority (NOGA) initiated an EOR project in 2009 handing responsibility for its redevelopment to Tatweer Petroleum. Tatweer is owned by nogaholding (the business and investment arm of NOGA), Occidental Petroleum Corporation and Mubadala Development Company.
Tatweer is implementing various EOR techniques including waterflooding and steam injection. In 2011, the first steam injection pilot to extract heavy oil was implemented together with a waterflood pilot. The Bahrain field’s production capacity is expected to more than triple in seven years’ time, reaching 100,000 bbl/d. Gas delivery capacity is also expected to increase to over 2 bcf/d, through installation of new facilities and new well completion techniques81.
Implications for solar EORThe potential for EOR in the Middle East is estimated at 475 billion barrels of oil82, a significant proportion of which would be recovered via thermal techniques. This suggests there is a large market for solar EOR technology throughout the region. Assuming solar EOR captures even 1% of this volume, this would represent a larger market than the entire EOR production in Oman at present.
Outside of GlassPoint’s 7MW plant in Amal, Chevron Corp. is considering using solar EOR to produce steam to produce heavy crude from the Wafra field in the PNZ, straddling Saudi Arabia and Kuwait
81 Corporate background, Tatweer Petroleum, http://tatweerpetroleum.com/en/oilfield/global/oil-field-title.html, accessed 30 October 2013.
82 Manaar Consulting: “EOR and IOR in the Middle East,” http://www.manaarco.com/images/presentations/Fleming%20Gulf%20Manaar%20EOR%20Abu%20Dhabi%20March%202013.pdf, accessed 30 October 2013.
Environmental benefits of solar EOR for OmanUsing natural gas to create the steam used in thermal EOR has adverse impacts on the environment. Burning natural gas increases carbon dioxide (CO2), nitrogen oxide (NOx) and sulphur dioxide (SO2) emissions into the atmosphere. Methane can also be emitted when natural gas is not burned completely. Using solar energy as a substitute for natural gas for thermal EOR can thus lead to a reduction in emissions of CO2, NOx and SO2.
In Table 20 below, we provide quantitative estimates of the environmental benefits of using solar EOR technology in Oman taking into account the volume of natural gas saved under the three scenarios presented in the report as well as the average emissions from burning natural gas, and therefore the emissions abated.
In our leadership deployment scenario, CO2 emissions are expected to decline by 8.1 million tons per annum when the systems are fully deployed. The process would also produce NOx and SO2 emissions.
Table 20: Emissions abatementSource: Environmental Protection Agency, USA, GlassPoint
Emissions Steady Leadership Full-scale
CO2 (Million tons/year) 3.5 8.1 13.0
Notes: We have used an estimated 0.172 tons of carbon dioxide per ton of steam. This is based on data from GlassPoint’s Amal pilot project.
Despite the benefits of CSP technology highlighted above, solar powered technologies can also pose some challenges to the environment. Argonne National Laboratory (2013) suggests that CSP technologies using wet cooling systems can consume large quantities of water (although dry cooling systems use under a tenth of the amount of water used by wet cooling systems)83. However, GlassPoint’s technology does not use a cooling system, meaning their developments in Oman do not cause this adverse impact to the environment.
83 Argonne National Laboratory, “Solar Energy Planning for the Southwest,” 2013, http://www.evs.anl.gov/program-areas/land-renewable-resources/highlights/solar-peis.cfm, accessed 30 October 2013.
3 Security of energy supply, EOR potential and environmental impacts
37Solar enhanced oil recovery An in-country value assessment for Oman
3 Security of energy supply, EOR potential and environmental impacts
Use of CSP technologies may also have potentially significant impacts on ecological, visual and cultural resources in the region of operation. For example, use of solar energy powered systems precludes use of land within the project footprint, whilst the removal of vegetation can also lead to damage to biological soil crusts. However, given the oil field desert locations where solar EOR would be installed in Oman, these impacts are likely to be minimal.
Security of supply benefits of solar EOR for OmanThe International Energy Agency (IEA) defines energy security for a country as being the uninterrupted availability of energy sources at affordable prices84. This is particularly important in the Middle East given a number of ongoing conflicts and sanctions in parts of the region. Quantification of the benefits from a secure energy supply is difficult, but there are clear benefits to Oman from using solar energy for EOR rather than natural gas.
There are two types of energy security: long-term and short-term. Long-term security of energy supply is mainly linked to timely investments to supply energy in line with economic developments and environmental needs. This relates to absolute scarcity — potential exhaustion of resources such as oil and gas. By contrast, short-term security of energy supply focuses on the ability of the energy system to react promptly to sudden changes in the supply-demand balance.
Reliance on imported natural gas creates significant short-term vulnerabilities. This relates to relative scarcity, measuring temporary absence of resources, such as those caused by missing supply capacity. A single measure of energy security requires consideration of both absolute and relative scarcity of energy supply. Given Oman’s growing dependence on natural gas and its USD 60 billion LNG deal with Iran for the next 25 years, both its long-term and short-term security of energy supply require consideration85.
84 International Energy Agency (IEA), “Energy Security,” http://www.iea.org/topics/energysecurity/, accessed 30 October 2013.
85 Daniel Fineren, “Oman signs MoU to import Iranian gas,” Reuters, 27 Aug 2013, http://uk.reuters.com/article/2013/08/27/uk-iran-oman-idUKBRE97Q0EE20130827, accessed 30 October 2013.
Oman imported nearly 200 billion cubic meters of gas between 2008 and 2011 due to increasing demand from its industrial and domestic sectors. These imports were mainly through the Dolphin pipeline from Qatar. The World Bank’s Worldwide Governance Indicators (WGI) rank each country by political stability and an absence of violence/terrorism, reflecting perceptions of the likelihood that the government will be destabilized or overthrown by unconstitutional or violent means, including politically motivated violence and terrorism86. Qatar was ranked 92 in 2012 (a higher ranking means greater stability), suggesting it is one of the most politically stable countries in the world. However, Oman’s reliance on Iran following the aforementioned LNG deal will pose more significant challenges on this front, as Iran is ranked 10 in the WGI rankings, suggesting it is one of the most politically volatile countries in the world.
Given the context above, use of solar EOR carries obvious advantages in terms of security of energy supply for Oman. Using solar power rather than natural gas for oil recovery can free up natural gas for other uses in Oman’s industrial sectors, in turn reducing the risk inherent in reliance on Iran for significant natural gas imports.
86 World Bank’s Worldwide Governance Indicators, 2013, http://info.worldbank.org/governance/wgi/index.aspx#home, accessed 30 October 2013.
38 Solar enhanced oil recovery An in-country value assessment for Oman
bbl/d Barrels per day
bbl Barrel
BTU British Thermal Unit
bcf Billion cubic feet
cf Cubic feet
CSP Concentrated Solar Power
EOR Enhanced Oil Recovery
E&P Exploration and Production
FTE Full-time equivalent
GCC Gulf Cooperation Council
GDP Gross Domestic Product
GVA Gross Value Added
IEA International Energy Agency
I/O Input/Output
LNG Liquefied Natural Gas
mcf Million cubic feet
MMBTU Millions of British Thermal Units
MOCI Ministry of Commerce and Industry (Oman)
MOG Ministry of Oil and Gas (Oman)
MOSES Model of Short-Term Energy Security
MPC Marginal Propensity to Consume
NCSI National Centre for Statistics and Information (Oman)
OMR Omani Rial
ORPIC Oman Oil Refineries and Petroleum Industries Company
PDO Petroleum Development Oman
SBSSG Standard Block Solar Steam Generator
SOM Shell Oman Marketing
SNA System of National Accounts
TAGOGD Thermally Assisted Gas Oil Gravity Drainage
Glossary
39Solar enhanced oil recovery An in-country value assessment for Oman
Appendices

40 Solar enhanced oil recovery An in-country value assessment for Oman
AAppendixMethodology
The full benefits that solar EOR deployment will generate for the Omani economy can be estimated by calculating the Direct, Indirect and Induced effects, as defined below:
► The Direct effect of solar EOR providers’ activities, i.e., their contribution to the Omani Gross Domestic Product (GVA) and the jobs it creates.
► The Indirect effect arising from solar EOR providers’ demand for goods and services along its supply chain in Oman.
► The Induced effect arising from solar EOR provider and their suppliers’ employees in Oman spending a share of their income on the consumption of goods and services in the wider Omani economy.
The figure below summarizes our assessment methodology.
Figure 14: Overview of our methodology for economic impact assessmentsSource: EY
Inputs Allocation Multiplier calculations Outputs
Economicactivity
Contributionto GDP
Gross valueadded
Localpurchases
Imports
Compensation ofemployees
Indirect multipliers
Induced multipliers
Demand
Consumption
Indirect GVA
Induced GVA
Direct
Indirect
Induced
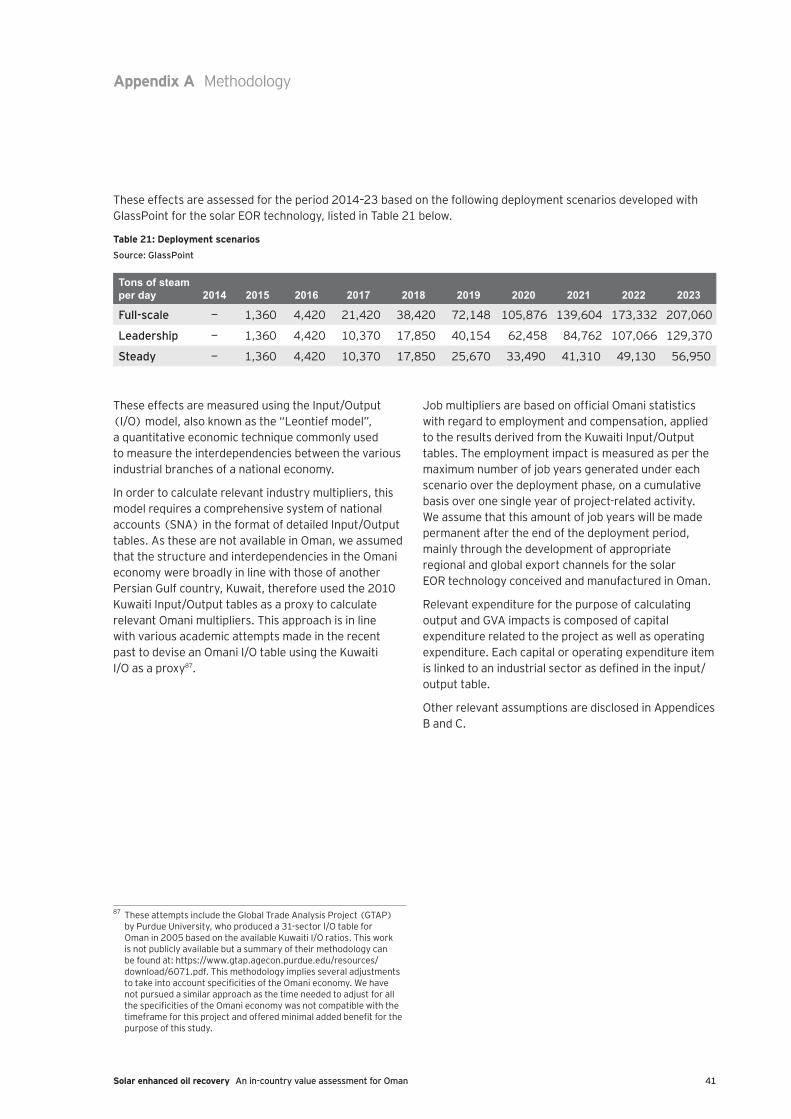
41Solar enhanced oil recovery An in-country value assessment for Oman
These effects are measured using the Input/Output (I/O) model, also known as the “Leontief model”, a quantitative economic technique commonly used to measure the interdependencies between the various industrial branches of a national economy.
In order to calculate relevant industry multipliers, this model requires a comprehensive system of national accounts (SNA) in the format of detailed Input/Output tables. As these are not available in Oman, we assumed that the structure and interdependencies in the Omani economy were broadly in line with those of another Persian Gulf country, Kuwait, therefore used the 2010 Kuwaiti Input/Output tables as a proxy to calculate relevant Omani multipliers. This approach is in line with various academic attempts made in the recent past to devise an Omani I/O table using the Kuwaiti I/O as a proxy87.
87 These attempts include the Global Trade Analysis Project (GTAP) by Purdue University, who produced a 31-sector I/O table for Oman in 2005 based on the available Kuwaiti I/O ratios. This work is not publicly available but a summary of their methodology can be found at: https://www.gtap.agecon.purdue.edu/resources/download/6071.pdf. This methodology implies several adjustments to take into account specificities of the Omani economy. We have not pursued a similar approach as the time needed to adjust for all the specificities of the Omani economy was not compatible with the timeframe for this project and offered minimal added benefit for the purpose of this study.
Job multipliers are based on official Omani statistics with regard to employment and compensation, applied to the results derived from the Kuwaiti Input/Output tables. The employment impact is measured as per the maximum number of job years generated under each scenario over the deployment phase, on a cumulative basis over one single year of project-related activity. We assume that this amount of job years will be made permanent after the end of the deployment period, mainly through the development of appropriate regional and global export channels for the solar EOR technology conceived and manufactured in Oman.
Relevant expenditure for the purpose of calculating output and GVA impacts is composed of capital expenditure related to the project as well as operating expenditure. Each capital or operating expenditure item is linked to an industrial sector as defined in the input/output table.
Other relevant assumptions are disclosed in Appendices B and C.
These effects are assessed for the period 2014–23 based on the following deployment scenarios developed with GlassPoint for the solar EOR technology, listed in Table 21 below.
Table 21: Deployment scenariosSource: GlassPoint
Tons of steam per day 2014 2015 2016 2017 2018 2019 2020 2021 2022 2023
Full-scale — 1,360 4,420 21,420 38,420 72,148 105,876 139,604 173,332 207,060
Leadership — 1,360 4,420 10,370 17,850 40,154 62,458 84,762 107,066 129,370
Steady — 1,360 4,420 10,370 17,850 25,670 33,490 41,310 49,130 56,950
Appendix A Methodology
42 Solar enhanced oil recovery An in-country value assessment for Oman
Oil and gas exploration in OmanNearly all of Oman’s oil production comes from the Oman Basin, which spans most of the country. There are also a few small fields in the northern exclave on the Musandam Peninsula, all of which are located offshore. In November 2012, the first offshore production in the country occurred in Block 8 off the coast of the Musandam Peninsula88.
As of 2013, there are E&P activities occurring in 28 exploration blocks. Oman anticipates awarding 2 onshore exploration blocks in late 2013, and plans to put another 7 blocks (4 onshore and 3 offshore) to tender in the near future. Recent exploration developments likely to affect future oil production include Circle Oil’s announcement in January 2013 of a 7 billion barrel find in Block 52 (offshore) and Occidental Petroleum’s announcement in March 2013 that Block 53 could contain hundreds of millions of barrels of oil89.
88 US Energy Information Administration, Oman Report October 2013.89 Ibid.
Over the next five years, PDO intends to drill 100 wells at an estimated cost of USD 800 million. By 2022, it plans to commission sixteen megaprojects with a combined value of more than USD 11 billion, producing a target of more than 1 billion bbl of oil. Key projects include three EOR projects at Rabab Harweel, Yibal Khuff/Sudair and Budour, expected to add c. 200,000 b/d of capacity, offsetting natural declines in existing fields. Each of the projects is expected to cost well over USD 1 billion and to be implemented over the next 8–10 years.
Similar levels of investment are expected for natural gas. As of September 2012, an estimated USD 1.8 billion worth of major gas-related project work was under execution. Much of this work was related to offsetting production declines in existing fields, although there are a handful of new developments taking place as well. The most significant project is expected to be the Khazzan tight gas field, where some 70–130 tcf of gas reserves are in place in reservoirs located 4 km below ground. This project is expected to cost c. USD 15 billion over 10 years and is being developed by BP. The final investment decision will depend on the outcome of ongoing negotiations between BP and the Government of Oman.
Appendix A Methodology
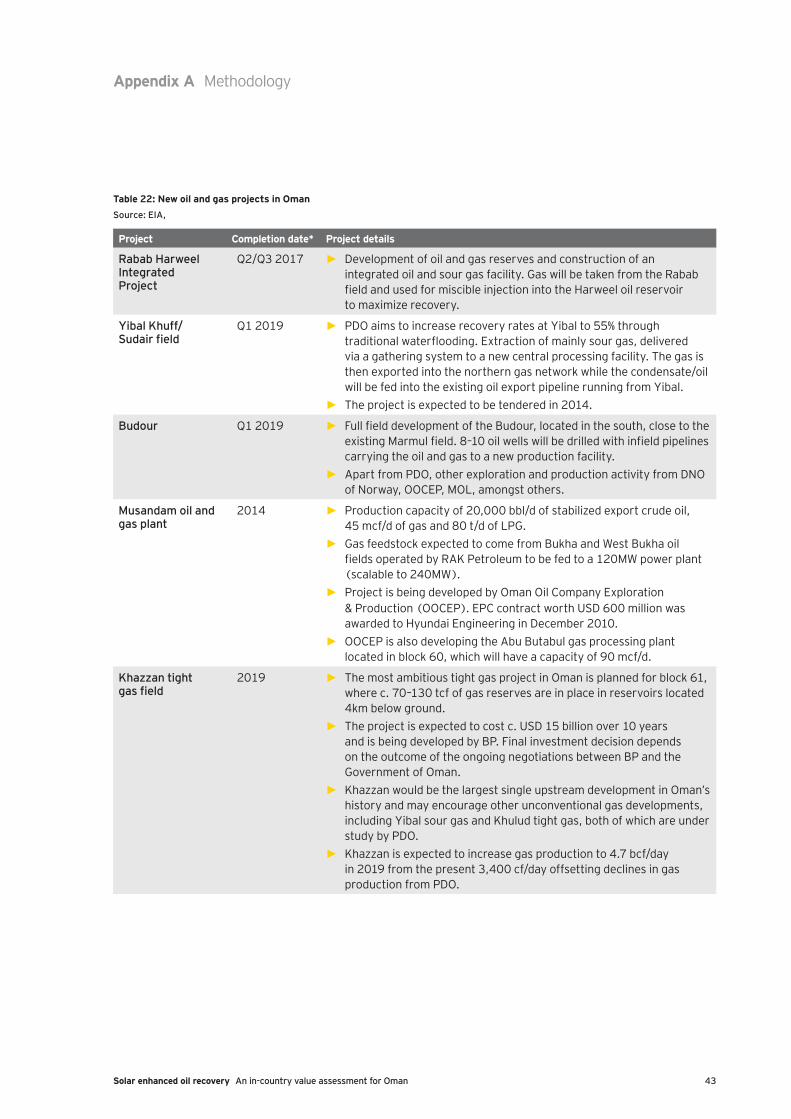
43Solar enhanced oil recovery An in-country value assessment for Oman
Appendix A Methodology
Table 22: New oil and gas projects in OmanSource: EIA,
Project Completion date* Project details
Rabab Harweel Integrated Project
Q2/Q3 2017 ► Development of oil and gas reserves and construction of an integrated oil and sour gas facility. Gas will be taken from the Rabab field and used for miscible injection into the Harweel oil reservoir to maximize recovery.
Yibal Khuff/Sudair field
Q1 2019 ► PDO aims to increase recovery rates at Yibal to 55% through traditional waterflooding. Extraction of mainly sour gas, delivered via a gathering system to a new central processing facility. The gas is then exported into the northern gas network while the condensate/oil will be fed into the existing oil export pipeline running from Yibal.
► The project is expected to be tendered in 2014.
Budour Q1 2019 ► Full field development of the Budour, located in the south, close to the existing Marmul field. 8–10 oil wells will be drilled with infield pipelines carrying the oil and gas to a new production facility.
► Apart from PDO, other exploration and production activity from DNO of Norway, OOCEP, MOL, amongst others.
Musandam oil and gas plant
2014 ► Production capacity of 20,000 bbl/d of stabilized export crude oil, 45 mcf/d of gas and 80 t/d of LPG.
► Gas feedstock expected to come from Bukha and West Bukha oil fields operated by RAK Petroleum to be fed to a 120MW power plant (scalable to 240MW).
► Project is being developed by Oman Oil Company Exploration & Production (OOCEP). EPC contract worth USD 600 million was awarded to Hyundai Engineering in December 2010.
► OOCEP is also developing the Abu Butabul gas processing plant located in block 60, which will have a capacity of 90 mcf/d.
Khazzan tight gas field
2019 ► The most ambitious tight gas project in Oman is planned for block 61, where c. 70–130 tcf of gas reserves are in place in reservoirs located 4km below ground.
► The project is expected to cost c. USD 15 billion over 10 years and is being developed by BP. Final investment decision depends on the outcome of the ongoing negotiations between BP and the Government of Oman.
► Khazzan would be the largest single upstream development in Oman’s history and may encourage other unconventional gas developments, including Yibal sour gas and Khulud tight gas, both of which are under study by PDO.
► Khazzan is expected to increase gas production to 4.7 bcf/day in 2019 from the present 3,400 cf/day offsetting declines in gas production from PDO.
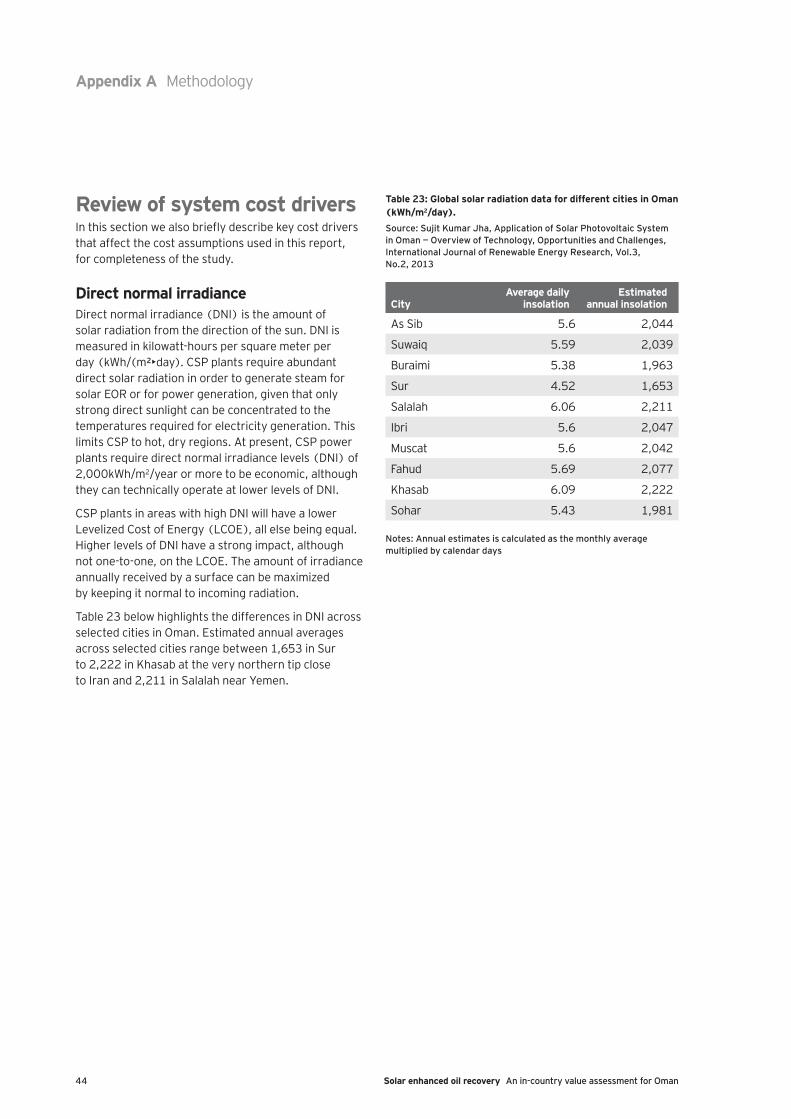
44 Solar enhanced oil recovery An in-country value assessment for Oman
Review of system cost driversIn this section we also briefly describe key cost drivers that affect the cost assumptions used in this report, for completeness of the study.
Direct normal irradianceDirect normal irradiance (DNI) is the amount of solar radiation from the direction of the sun. DNI is measured in kilowatt-hours per square meter per day (kWh/(m²•day). CSP plants require abundant direct solar radiation in order to generate steam for solar EOR or for power generation, given that only strong direct sunlight can be concentrated to the temperatures required for electricity generation. This limits CSP to hot, dry regions. At present, CSP power plants require direct normal irradiance levels (DNI) of 2,000kWh/m2/year or more to be economic, although they can technically operate at lower levels of DNI.
CSP plants in areas with high DNI will have a lower Levelized Cost of Energy (LCOE), all else being equal. Higher levels of DNI have a strong impact, although not one-to-one, on the LCOE. The amount of irradiance annually received by a surface can be maximized by keeping it normal to incoming radiation.
Table 23 below highlights the differences in DNI across selected cities in Oman. Estimated annual averages across selected cities range between 1,653 in Sur to 2,222 in Khasab at the very northern tip close to Iran and 2,211 in Salalah near Yemen.
Table 23: Global solar radiation data for different cities in Oman (kWh/m2/day).Source: Sujit Kumar Jha, Application of Solar Photovoltaic System in Oman — Overview of Technology, Opportunities and Challenges, International Journal of Renewable Energy Research, Vol.3, No.2, 2013
CityAverage daily
insolationEstimated
annual insolation
As Sib 5.6 2,044
Suwaiq 5.59 2,039
Buraimi 5.38 1,963
Sur 4.52 1,653
Salalah 6.06 2,211
Ibri 5.6 2,047
Muscat 5.6 2,042
Fahud 5.69 2,077
Khasab 6.09 2,222
Sohar 5.43 1,981
Notes: Annual estimates is calculated as the monthly average multiplied by calendar days
Appendix A Methodology
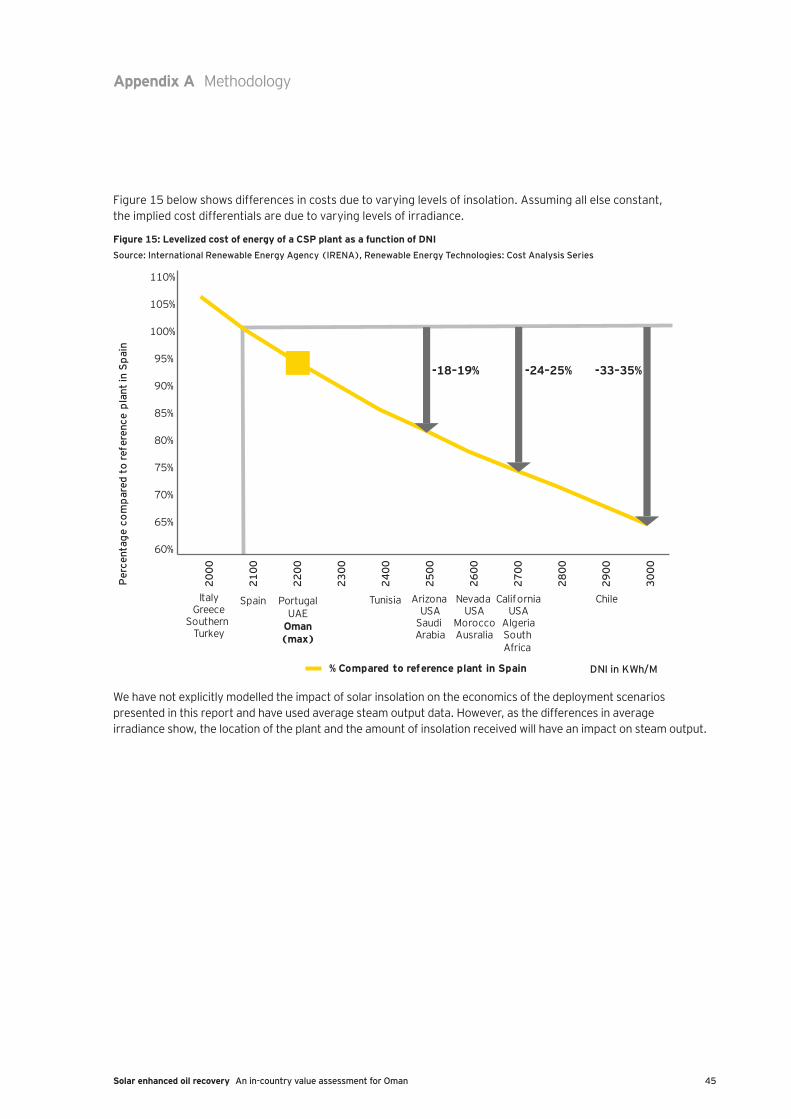
45Solar enhanced oil recovery An in-country value assessment for Oman
Appendix A Methodology
Figure 15 below shows differences in costs due to varying levels of insolation. Assuming all else constant, the implied cost differentials are due to varying levels of irradiance.
Figure 15: Levelized cost of energy of a CSP plant as a function of DNISource: International Renewable Energy Agency (IRENA), Renewable Energy Technologies: Cost Analysis Series
Per
cent
age
com
pare
d to
refe
renc
e pl
ant i
n Sp
ain
DNI in KWh/M% Compared to reference plant in Spain
60%
65%
70%
75%
80%
85%
90%
95%
100%
105%
110%
2000
2100
2200
2300
2400
2500
2600
2700
2800
2900
3000
ItalyGreece
Southern Turkey
Spain Tunisia Arizona USA
Saudi Arabia
Nevada USA
MoroccoAusralia
CaliforniaUSA
AlgeriaSouthAfrica
Chile
-24–25%-18–19% -33–35%
PortugalUAE
Oman(max)
We have not explicitly modelled the impact of solar insolation on the economics of the deployment scenarios presented in this report and have used average steam output data. However, as the differences in average irradiance show, the location of the plant and the amount of insolation received will have an impact on steam output.
46 Solar enhanced oil recovery An in-country value assessment for Oman
BAppendixSources
► UK Department of Energy and Climate Change (DECC)
► International Energy Agency, World Energy Outlook
► International Monetary Fund
► World Bank
► Ministry of Oil and Gas, Oman
► Ministry of Commerce and Industry, Oman
► National Centre for Statistics and Information (NCSI), Oman
► Central Statistical Bureau, Kuwait
► US Energy Information Administration
► US Bureau of Fossil Energy
► Oxford Economics
► Booz
► SBI Reports
► XE.com
► Global Trade Analysis Project (GTAP), Purdue University
► Enhanced Oil Recovery: Challenges and Opportunities, Saudi-Aramco, World Petroleum Council, Kokal and Al-Kaabi, 2010
► IHS Global Insight
► Argonne National Laboratory
► Oil and Gas iQ (www.oilandgasiq.com)
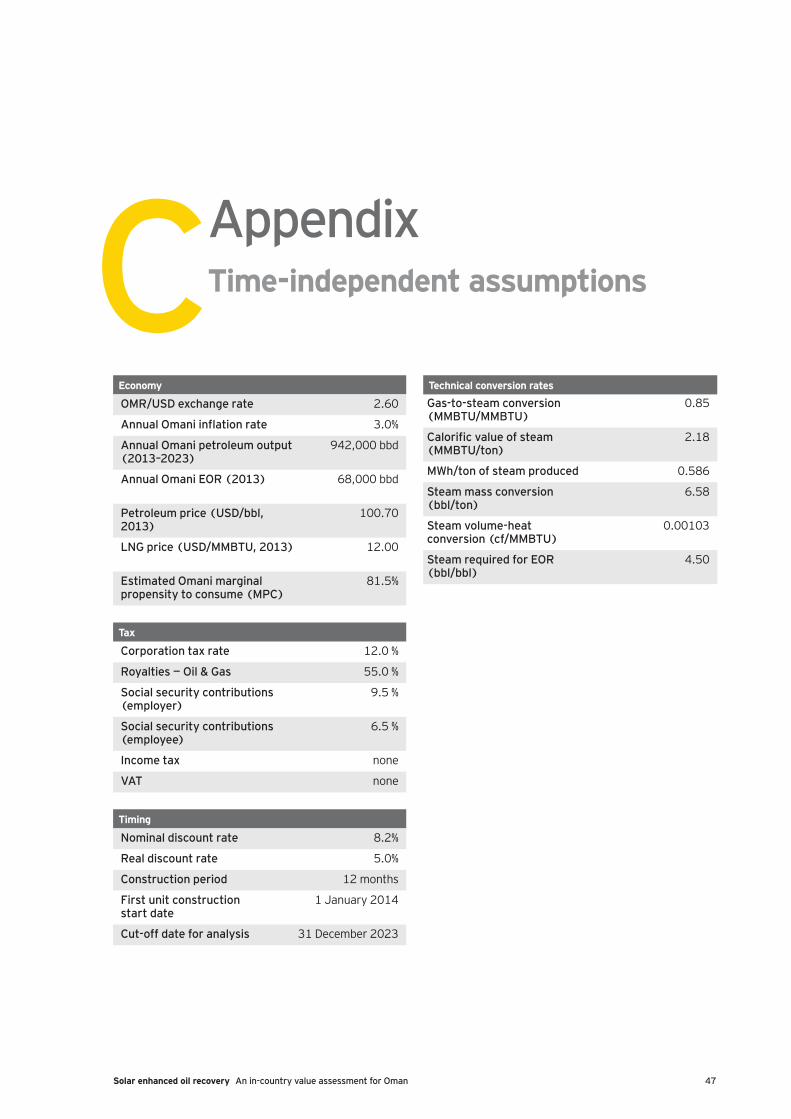
47Solar enhanced oil recovery An in-country value assessment for Oman
CAppendixTime-independent assumptions
Economy
OMR/USD exchange rate 2.60
Annual Omani inflation rate 3.0%
Annual Omani petroleum output (2013–2023)
942,000 bbd
Annual Omani EOR (2013) 68,000 bbd
Petroleum price (USD/bbl, 2013)
100.70
LNG price (USD/MMBTU, 2013) 12.00
Estimated Omani marginal propensity to consume (MPC)
81.5%
Tax
Corporation tax rate 12.0 %
Royalties — Oil & Gas 55.0 %
Social security contributions (employer)
9.5 %
Social security contributions (employee)
6.5 %
Income tax none
VAT none
Timing
Nominal discount rate 8.2%
Real discount rate 5.0%
Construction period 12 months
First unit construction start date
1 January 2014
Cut-off date for analysis 31 December 2023
Technical conversion rates
Gas-to-steam conversion (MMBTU/MMBTU)
0.85
Calorific value of steam (MMBTU/ton)
2.18
MWh/ton of steam produced 0.586
Steam mass conversion (bbl/ton)
6.58
Steam volume-heat conversion (cf/MMBTU)
0.00103
Steam required for EOR (bbl/bbl)
4.50
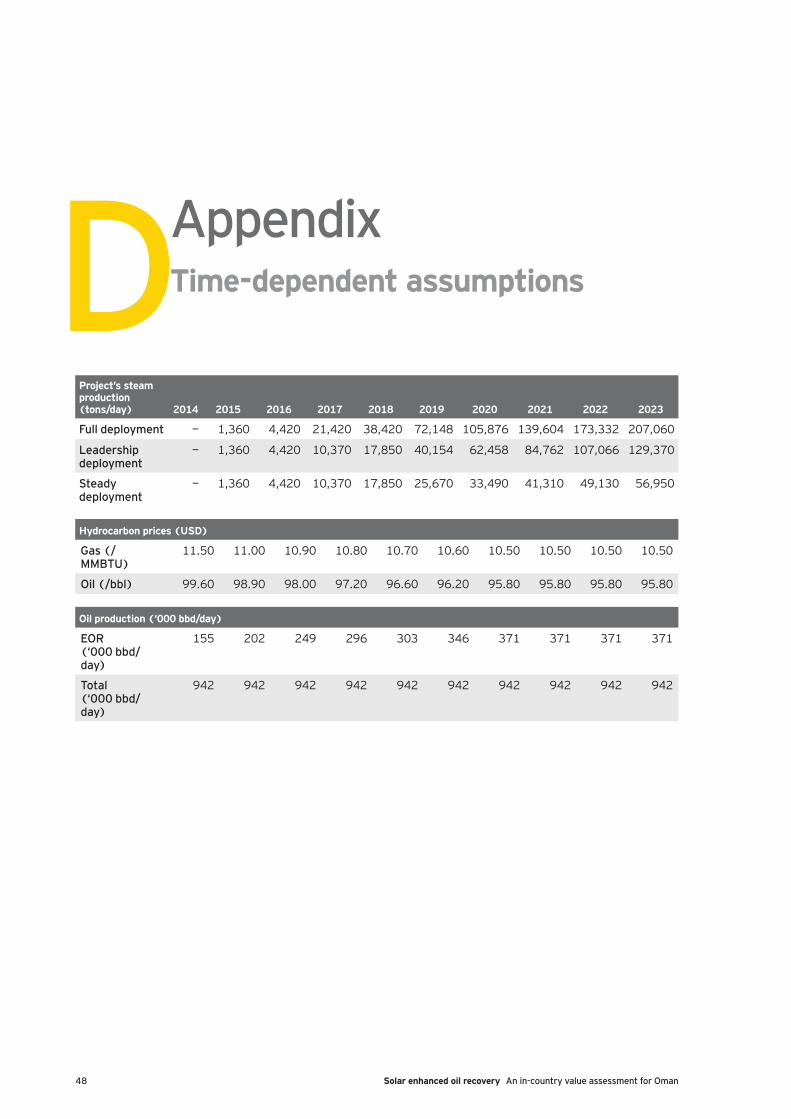
48 Solar enhanced oil recovery An in-country value assessment for Oman
DAppendixTime-dependent assumptions
Project’s steam production (tons/day) 2014 2015 2016 2017 2018 2019 2020 2021 2022 2023
Full deployment — 1,360 4,420 21,420 38,420 72,148 105,876 139,604 173,332 207,060
Leadership deployment
— 1,360 4,420 10,370 17,850 40,154 62,458 84,762 107,066 129,370
Steady deployment
— 1,360 4,420 10,370 17,850 25,670 33,490 41,310 49,130 56,950
Hydrocarbon prices (USD)
Gas (/MMBTU)
11.50 11.00 10.90 10.80 10.70 10.60 10.50 10.50 10.50 10.50
Oil (/bbl) 99.60 98.90 98.00 97.20 96.60 96.20 95.80 95.80 95.80 95.80
Oil production (‘000 bbd/day)
EOR (‘000 bbd/day)
155 202 249 296 303 346 371 371 371 371
Total (‘000 bbd/day)
942 942 942 942 942 942 942 942 942 942
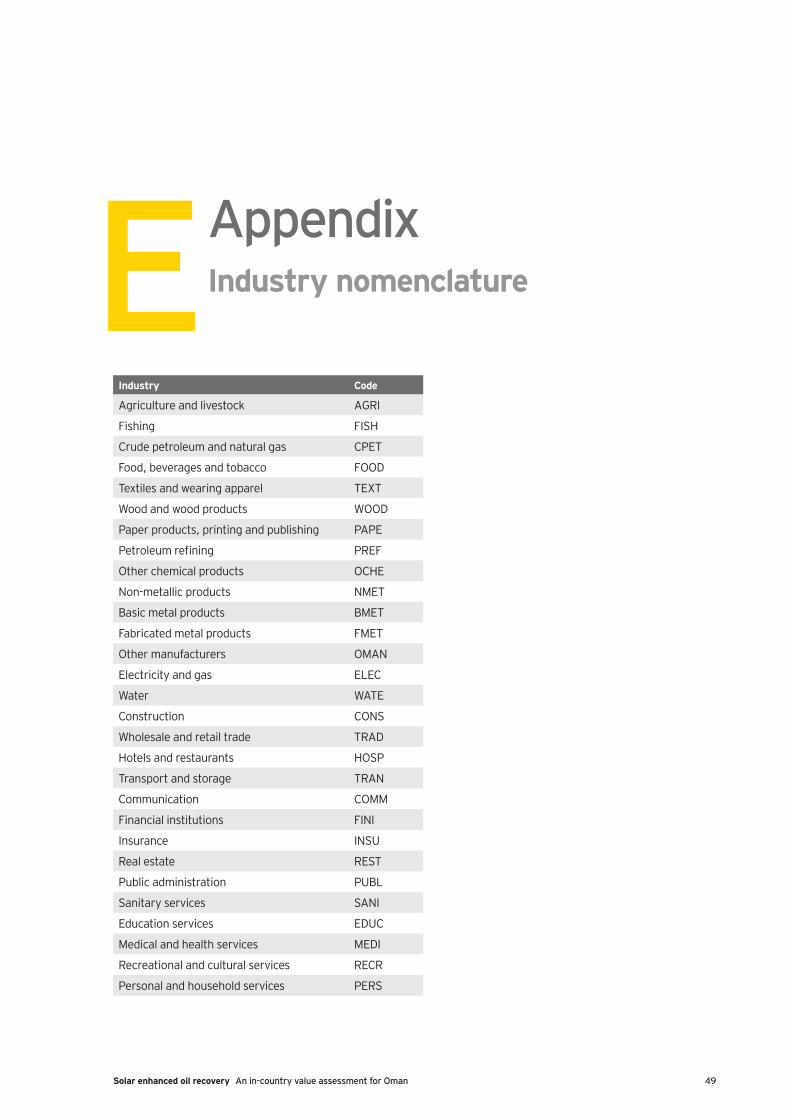
49Solar enhanced oil recovery An in-country value assessment for Oman
EAppendixIndustry nomenclature
Industry Code
Agriculture and livestock AGRI
Fishing FISH
Crude petroleum and natural gas CPET
Food, beverages and tobacco FOOD
Textiles and wearing apparel TEXT
Wood and wood products WOOD
Paper products, printing and publishing PAPE
Petroleum refining PREF
Other chemical products OCHE
Non-metallic products NMET
Basic metal products BMET
Fabricated metal products FMET
Other manufacturers OMAN
Electricity and gas ELEC
Water WATE
Construction CONS
Wholesale and retail trade TRAD
Hotels and restaurants HOSP
Transport and storage TRAN
Communication COMM
Financial institutions FINI
Insurance INSU
Real estate REST
Public administration PUBL
Sanitary services SANI
Education services EDUC
Medical and health services MEDI
Recreational and cultural services RECR
Personal and household services PERS

50 Solar enhanced oil recovery An in-country value assessment for Oman
Notes
.....................................................................................................................................................
.....................................................................................................................................................
.....................................................................................................................................................
.....................................................................................................................................................
.....................................................................................................................................................
.....................................................................................................................................................
.....................................................................................................................................................
.....................................................................................................................................................
.....................................................................................................................................................
.....................................................................................................................................................
.....................................................................................................................................................
.....................................................................................................................................................
.....................................................................................................................................................
.....................................................................................................................................................
.....................................................................................................................................................
.....................................................................................................................................................
.....................................................................................................................................................
.....................................................................................................................................................
.....................................................................................................................................................

EY | Assurance | Tax | Transactions | Advisory
About EYEY is a global leader in assurance, tax, transaction and advisory services. The insights and quality services we deliver help build trust and confidence in the capital markets and in economies the world over. We develop outstanding leaders who team to deliver on our promises to all of our stakeholders. In so doing, we play a critical role in building a better working world for our people, for our clients and for our communities.
EY refers to the global organization, and may refer to one or more, of the member firms of Ernst & Young Global Limited, each of which is a separate legal entity. Ernst & Young Global Limited, a UK company limited by guarantee, does not provide services to clients. For more information about our organization, please visit ey.com.
Ernst & Young LLPThe UK firm Ernst & Young LLP is a limited liability partnership registered in England and Wales with registered number OC300001 and is a member firm of Ernst & Young Global Limited.
Ernst & Young LLP, 1 More London Place, London, SE1 2AF.
© 2014 Ernst & Young LLP. Published in the UK. All Rights Reserved.
ED None
1379460.indd (UK) 01/14. Artwork by Creative Services Group Design.
In line with EY’s commitment to minimise its impact on the environment, this document has been printed on paper with a high recycled content.
Information in this publication is intended to provide only a general outline of the subjects covered. It should neither be regarded as comprehensive nor sufficient for making decisions, nor should it be used in place of professional advice. Ernst & Young LLP accepts no responsibility for any loss arising from any action taken or not taken by anyone using this material.
ey.com/uk