Embed Size (px)
DESCRIPTION
Oil recovery
Citation preview
Cartography of oil reserves and recovery factors of petroleum reservoirs
- IOR/EOR methods
to increase ultimate recovery
G. Renard – R. Vially - J-F. Argillier
© IF
P
G. Renard – R. Vially – J-F. Argilllier IFP Energies nouvelles 2
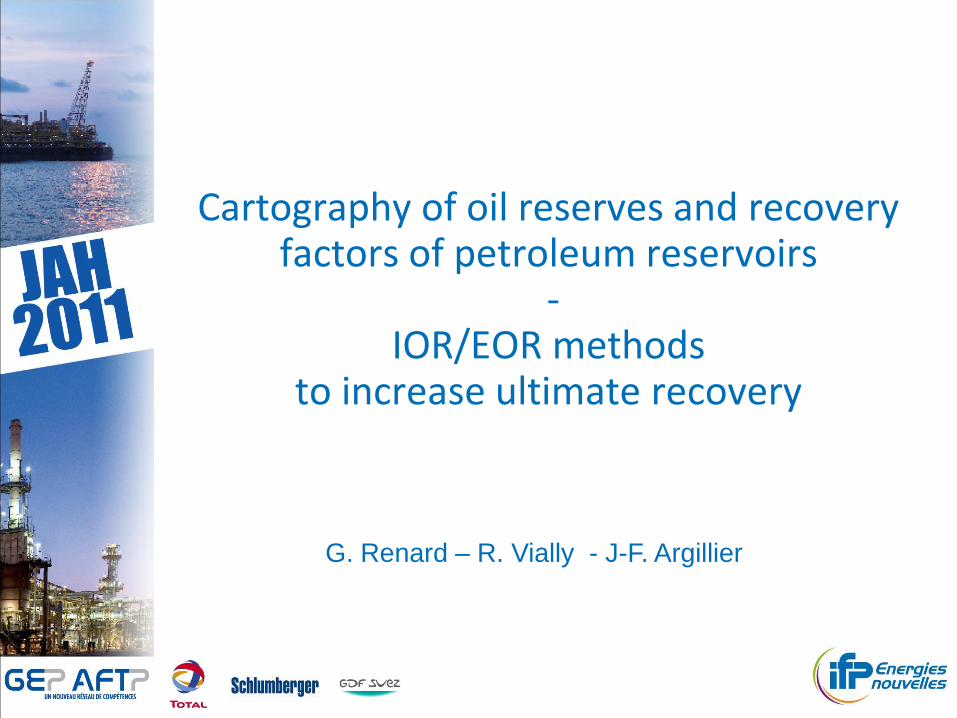
Proved Oil Reserves (2009)
Total with oil sands : 1517 Gb
© IF
P
G. Renard – R. Vially – J-F. Argilllier IFP Energies nouvelles 3
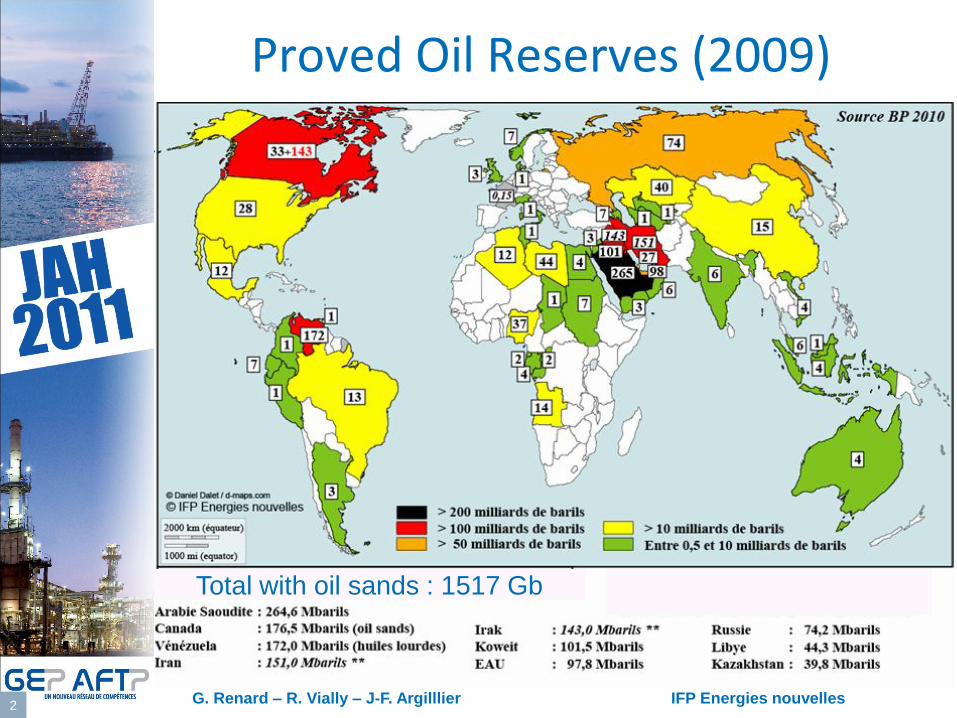
Oil recovery
•
•
Natural drainage
Conventional oil recovery
Steam
In situ combustion
Primary
Recovery Pumping/ Gas lift /
horizontal drilling
N2 Alkaline
Foam •
Borregales 1977
© IF
P
G. Renard – R. Vially – J-F. Argilllier IFP Energies nouvelles 4
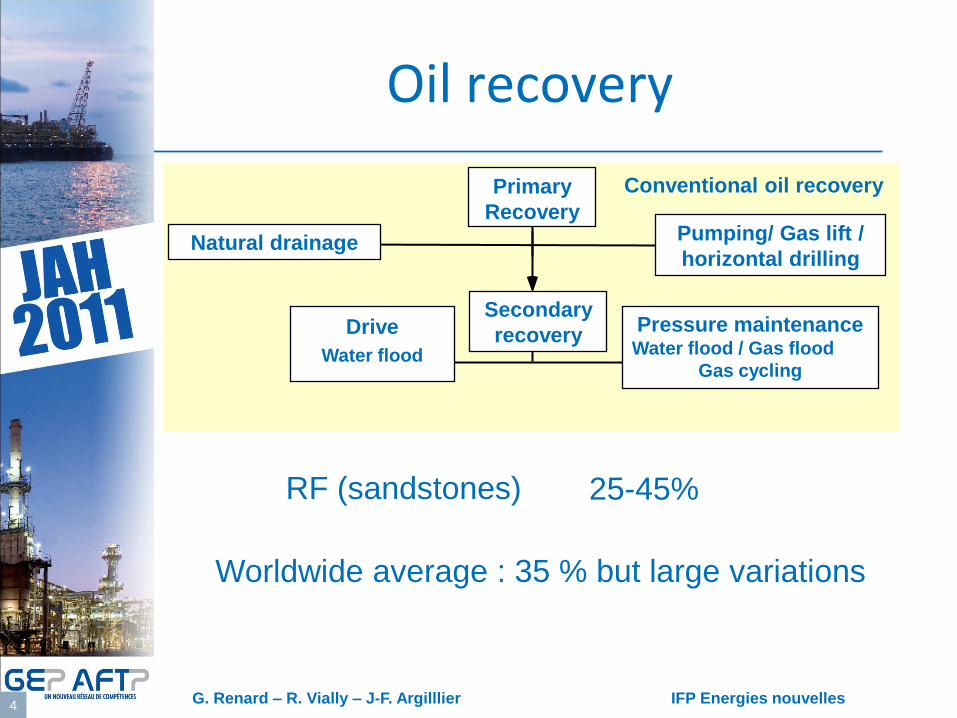
Oil recovery
Natural drainage
Conventional oil recovery Primary
Recovery Pumping/ Gas lift /
horizontal drilling
Pressure maintenance Water flood / Gas flood
Gas cycling
Secondary
recovery Drive
Water flood
RF (sandstones) 25-45%
Worldwide average : 35 % but large variations
© IF
P
G. Renard – R. Vially – J-F. Argilllier IFP Energies nouvelles 5
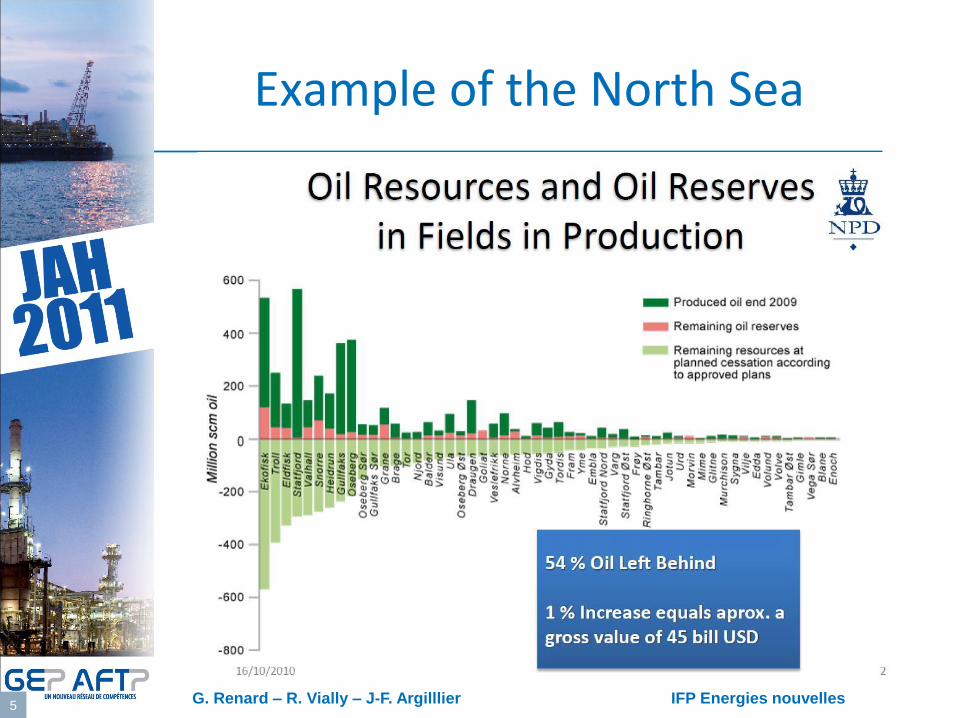
Example of the North Sea
© IF
P
G. Renard – R. Vially – J-F. Argilllier IFP Energies nouvelles 6
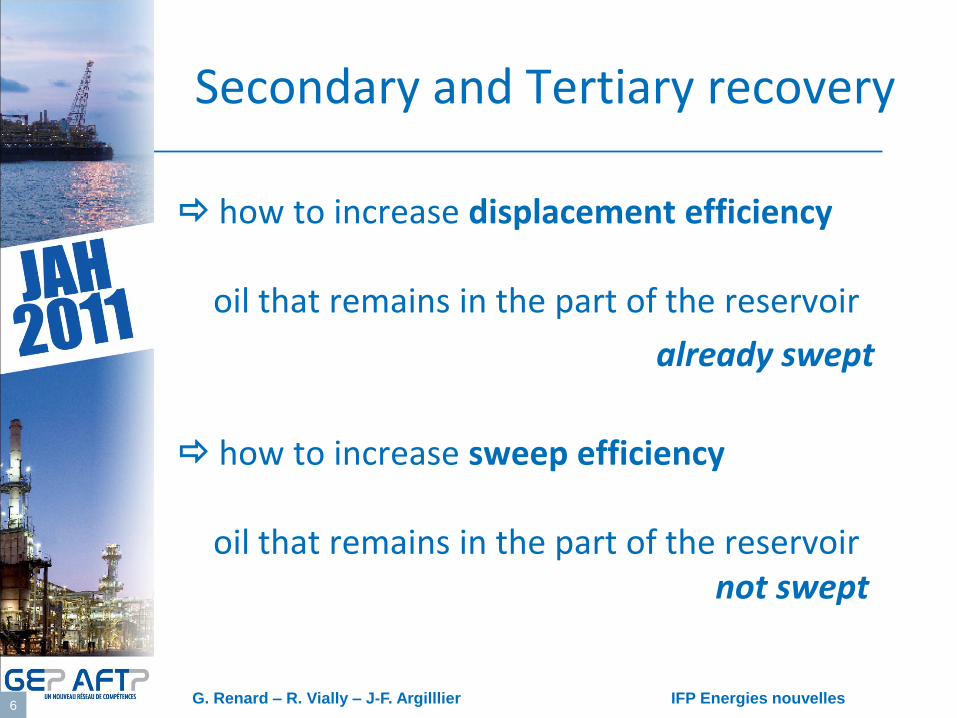
Secondary and Tertiary recovery
how to increase displacement efficiency oil that remains in the part of the reservoir
already swept
how to increase sweep efficiency oil that remains in the part of the reservoir not swept
© IF
P
G. Renard – R. Vially – J-F. Argilllier IFP Energies nouvelles 7
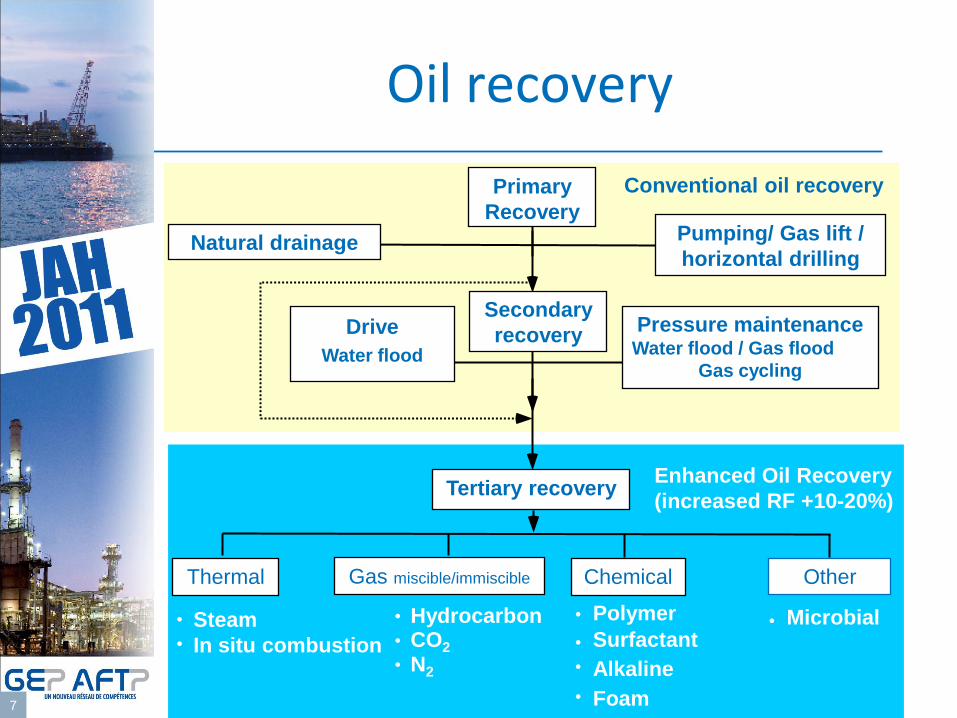
Oil recovery
Thermal Gas miscible/immiscible
•
•
•
•
•
• •
•
Natural drainage
Tertiary recovery Enhanced Oil Recovery
(increased RF +10-20%)
Conventional oil recovery
Steam
In situ combustion
Hydrocarbon
Primary
Recovery Pumping/ Gas lift /
horizontal drilling
Pressure maintenance Water flood / Gas flood
Gas cycling
Secondary
recovery
Other Chemical
CO2
N2
Polymer
Surfactant
Alkaline
Drive
Water flood
• Microbial
Foam •
© IF
P
G. Renard – R. Vially – J-F. Argilllier IFP Energies nouvelles 8
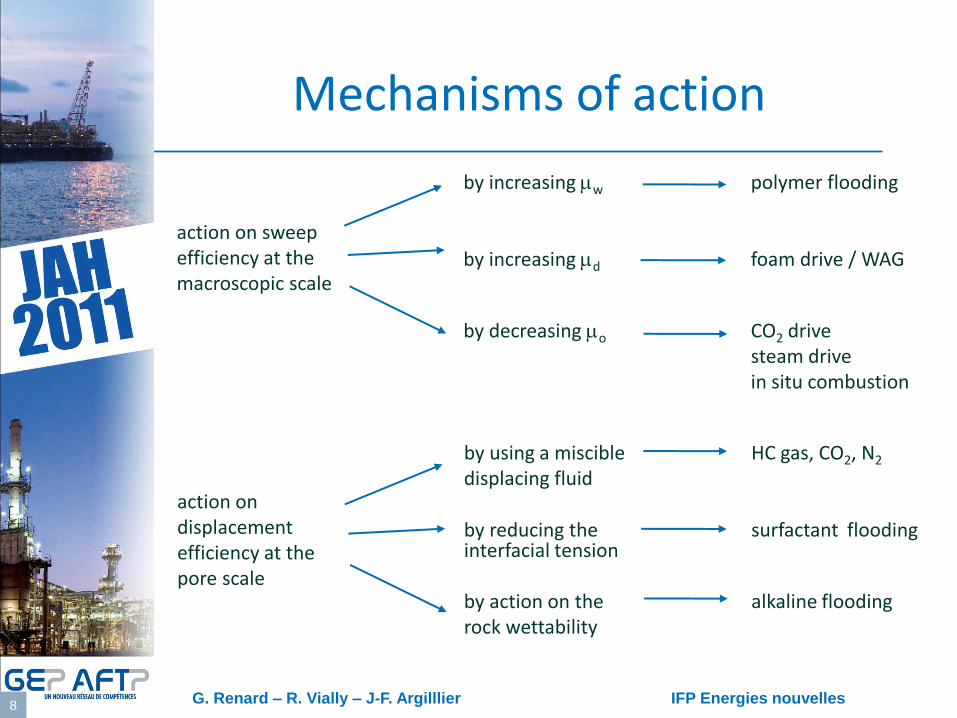
Mechanisms of action
by increasing w polymer flooding
by increasing d foam drive / WAG
by decreasing o CO2 drive steam drive in situ combustion
action on sweep efficiency at the macroscopic scale
by using a miscible HC gas, CO2, N2
displacing fluid by reducing the surfactant flooding
interfacial tension by action on the alkaline flooding rock wettability
action on displacement efficiency at the pore scale
© IF
P
G. Renard – R. Vially – J-F. Argilllier IFP Energies nouvelles 9
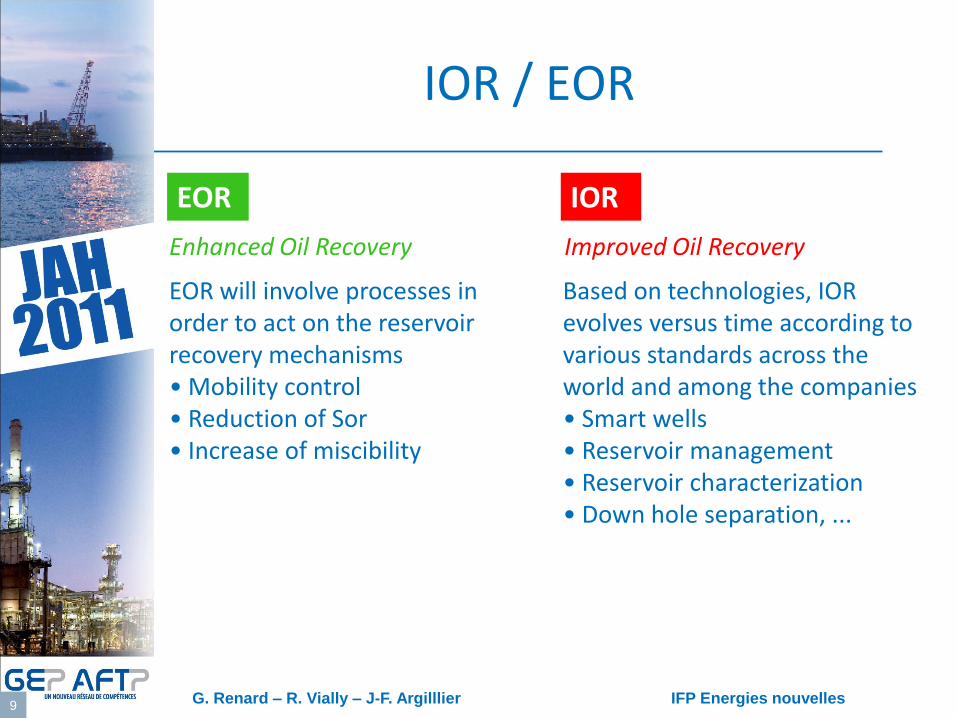
IOR / EOR
EOR will involve processes in order to act on the reservoir recovery mechanisms • Mobility control • Reduction of Sor • Increase of miscibility
Based on technologies, IOR evolves versus time according to various standards across the world and among the companies • Smart wells • Reservoir management • Reservoir characterization • Down hole separation, ...
IOR EOR
Enhanced Oil Recovery Improved Oil Recovery
© IF
P
G. Renard – R. Vially – J-F. Argilllier IFP Energies nouvelles 10
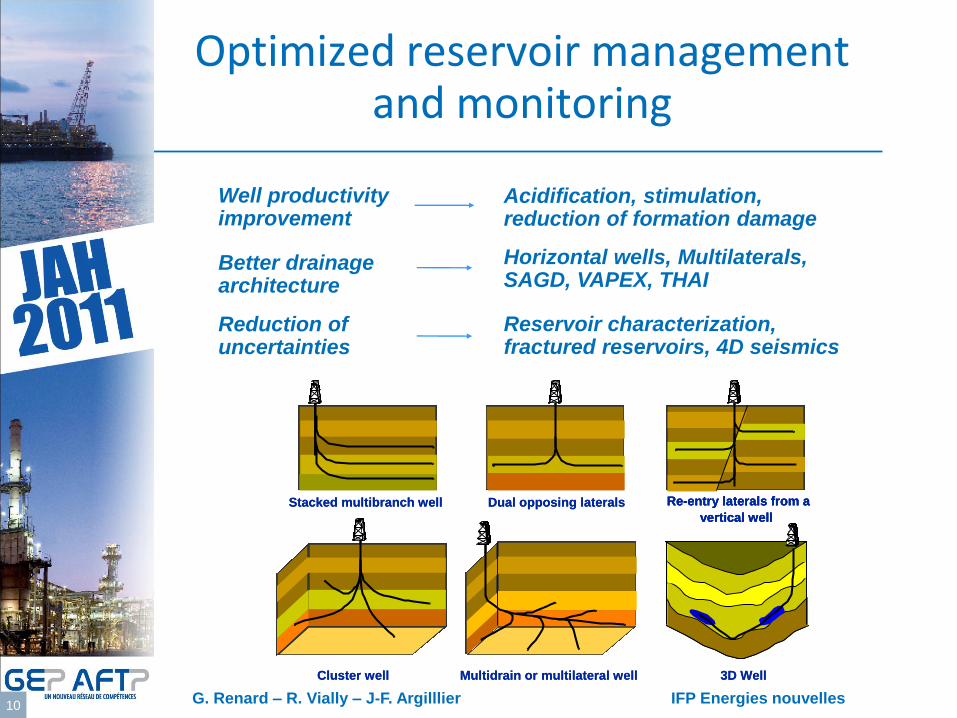
Optimized reservoir management and monitoring
Better drainage architecture
Acidification, stimulation, reduction of formation damage
Reduction of uncertainties
Reservoir characterization, fractured reservoirs, 4D seismics
Well productivity improvement
Horizontal wells, Multilaterals, SAGD, VAPEX, THAI
Re-entry laterals from a
vertical well
Dual opposing laterals
Multidrain or multilateral well 3D WellCluster well
Stacked multibranch well Re-entry laterals from a
vertical well
Re-entry laterals from a
vertical well
Dual opposing laterals
Multidrain or multilateral well 3D WellCluster well
Stacked multibranch well
© IF
P
G. Renard – R. Vially – J-F. Argilllier IFP Energies nouvelles 11
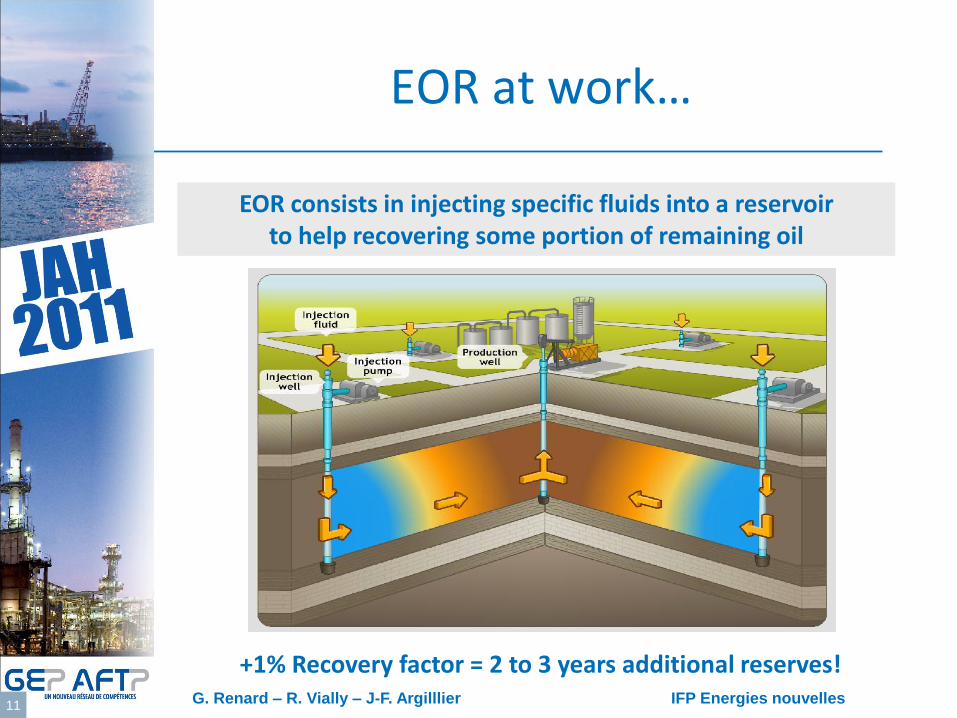
EOR at work…
EOR consists in injecting specific fluids into a reservoir to help recovering some portion of remaining oil
+1% Recovery factor = 2 to 3 years additional reserves!
© IF
P
G. Renard – R. Vially – J-F. Argilllier IFP Energies nouvelles 12
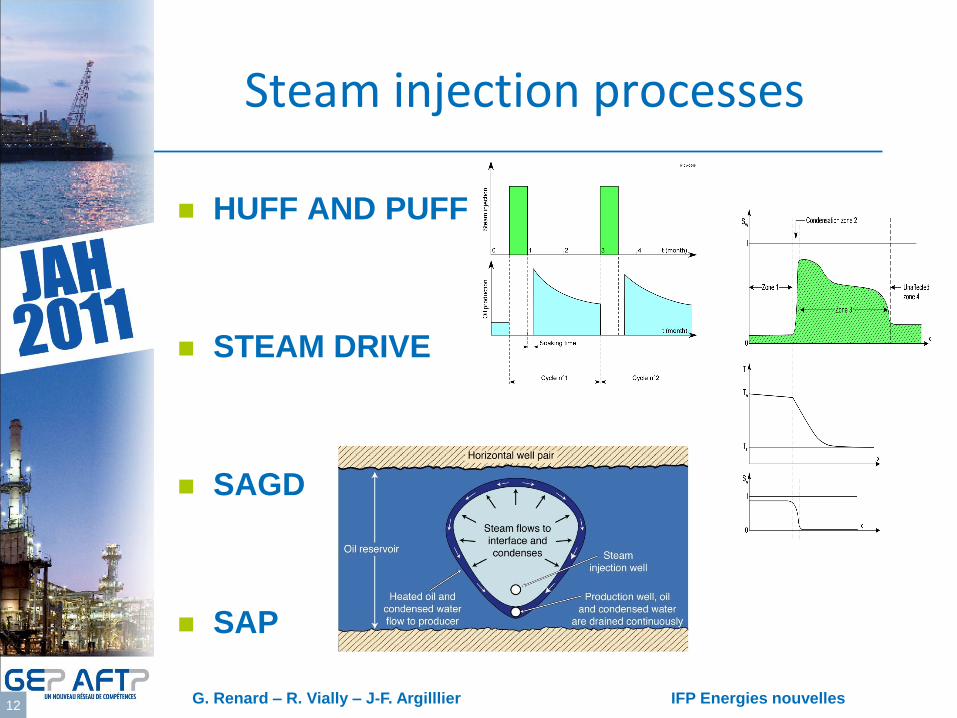
Steam injection processes
HUFF AND PUFF
STEAM DRIVE
SAGD
SAP
© IF
P
G. Renard – R. Vially – J-F. Argilllier IFP Energies nouvelles 13
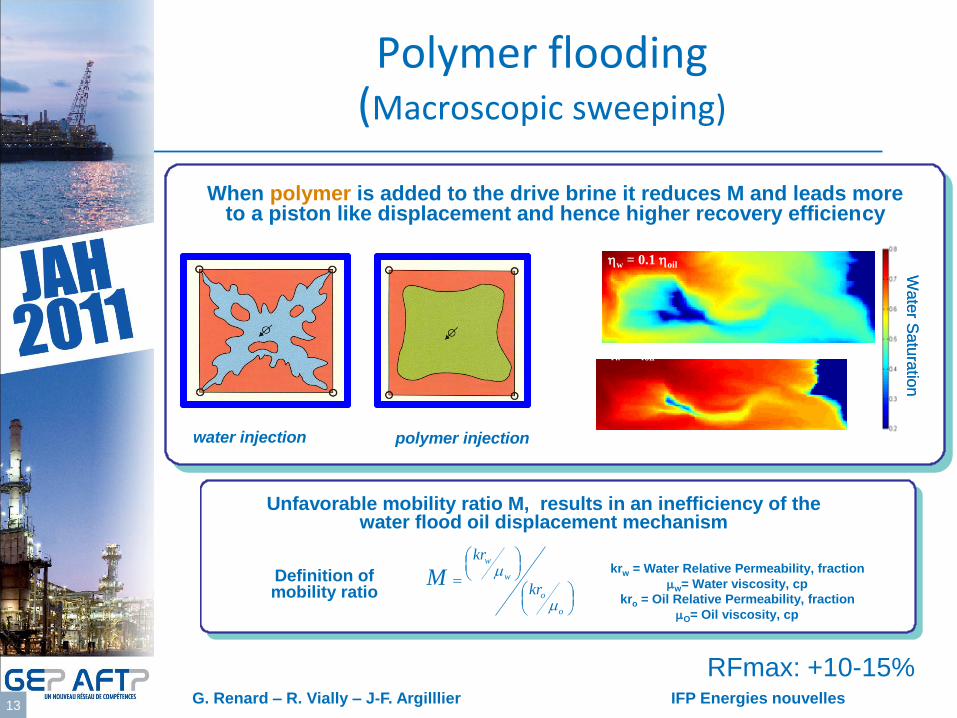
Polymer flooding (Macroscopic sweeping)
Unfavorable mobility ratio M, results in an inefficiency of thewater flood oil displacement mechanism
o
o
w
w
kr
kr
M
Definition of mobility ratio
krw = Water Relative Permeability, fraction
w= Water viscosity, cp
kro = Oil Relative Permeability, fraction
O= Oil viscosity, cp
When polymer is added to the drive brine it reduces M and leads more to a piston like displacement and hence higher recovery efficiency
Wate
r Satu
ratio
n
w = oil
w = 0.1 oil Wate
r Satu
ratio
n
w = oil
w = 0.1 oil
water injection polymer injection
RFmax: +10-15%
© IF
P
G. Renard – R. Vially – J-F. Argilllier IFP Energies nouvelles 14
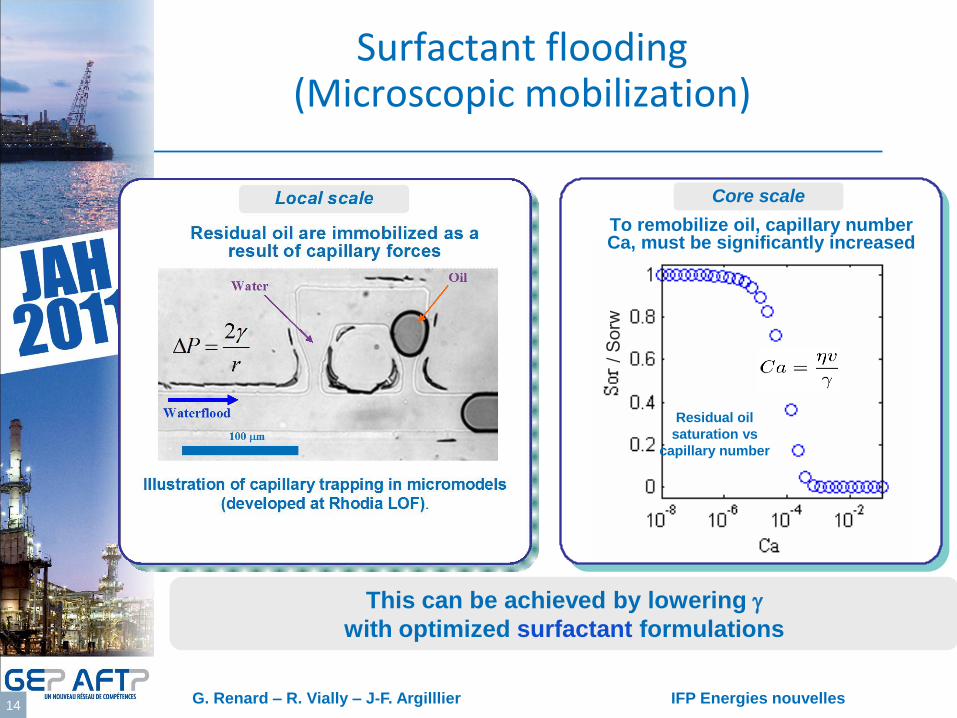
Surfactant flooding (Microscopic mobilization)
Residual oil
saturation vs
capillary number
To remobilize oil, capillary number Ca, must be significantly increased
Core scale
/ S
orw
This can be achieved by lowering g
with optimized surfactant formulations
© IF
P
G. Renard – R. Vially – J-F. Argilllier IFP Energies nouvelles 15
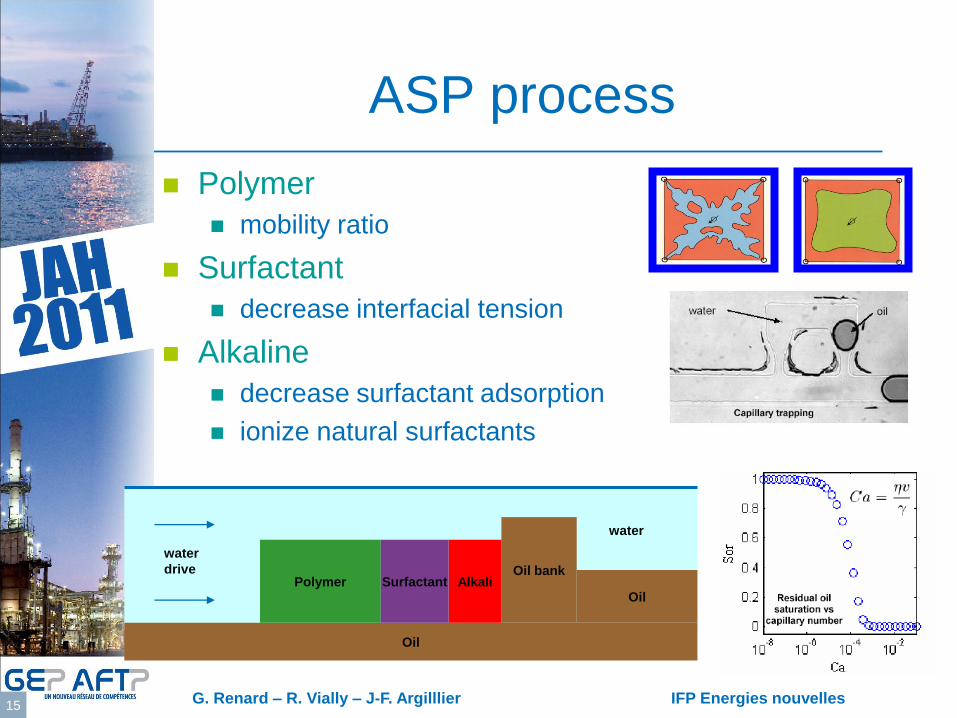
ASP process
Polymer
mobility ratio
Surfactant
decrease interfacial tension
Alkaline
decrease surfactant adsorption
ionize natural surfactants
Water
Oil
Oil bank
Oil Polymer Alkali Surfactant
water
water
drive
© IF
P
G. Renard – R. Vially – J-F. Argilllier IFP Energies nouvelles 16
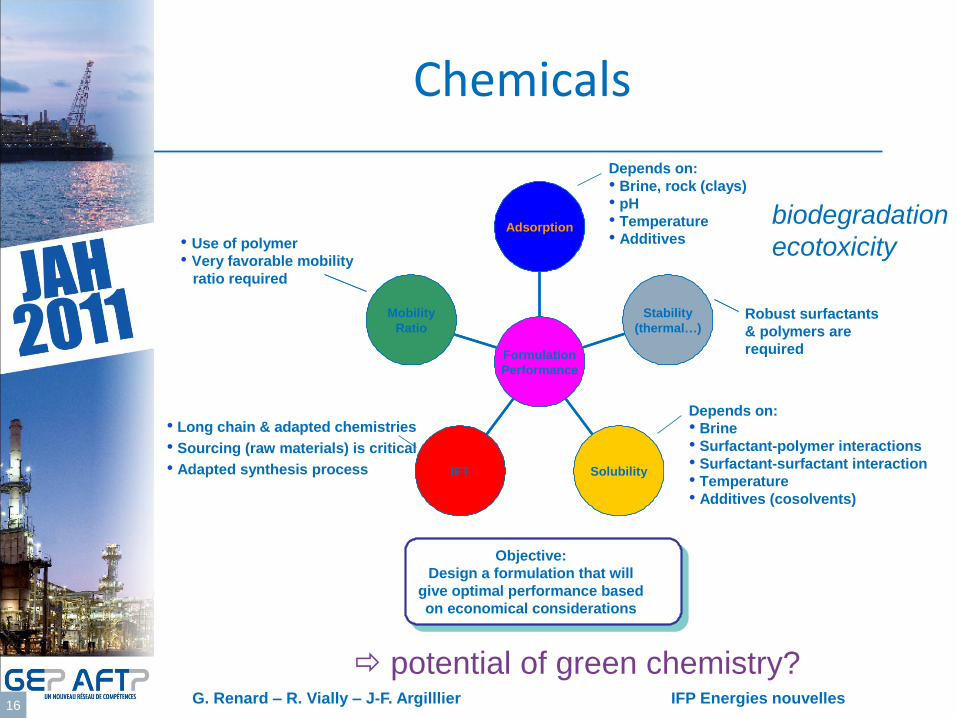
Chemicals
Mobility
Ratio
IFT Solubility
Stability
(thermal…)
Adsorption
Formulation
Performance
Mobility
Ratio
IFT Solubility
Stability
(thermal…)
Adsorption
Formulation
Performance
• Use of polymer
• Very favorable mobility
ratio required
• Long chain & adapted chemistries
• Sourcing (raw materials) is critical
• Adapted synthesis process
Depends on:
• Brine, rock (clays)
• pH
• Temperature
• Additives
Robust surfactants
& polymers are
required
Depends on:
• Brine
• Surfactant-polymer interactions
• Surfactant-surfactant interaction
• Temperature
• Additives (cosolvents)
Objective:
Design a formulation that will
give optimal performance based
on economical considerations
potential of green chemistry?
biodegradation
ecotoxicity
© IF
P
G. Renard – R. Vially – J-F. Argilllier IFP Energies nouvelles 17
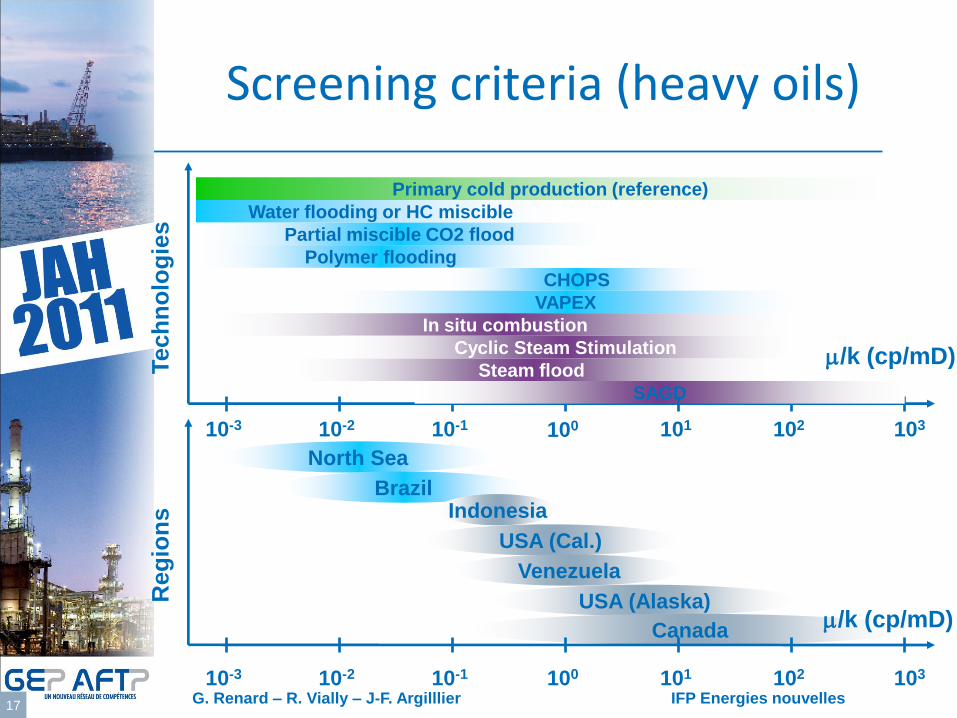
Screening criteria (heavy oils)
North Sea
Brazil Indonesia
USA (Cal.)
Venezuela
USA (Alaska)
Canada
Water flooding or HC miscible
Polymer flooding
Partial miscible CO2 flood
SAGD
Steam flood
In situ combustion
Cyclic Steam Stimulation /k (cp/mD)
Primary cold production (reference)
CHOPS
VAPEX
10-3 10-2 10-1 102 103 101
10-3 10-2 10-1 100 102 103 101
Tech
no
log
ies
R
eg
ion
s
100
/k (cp/mD)
© IF
P
G. Renard – R. Vially – J-F. Argilllier IFP Energies nouvelles 18
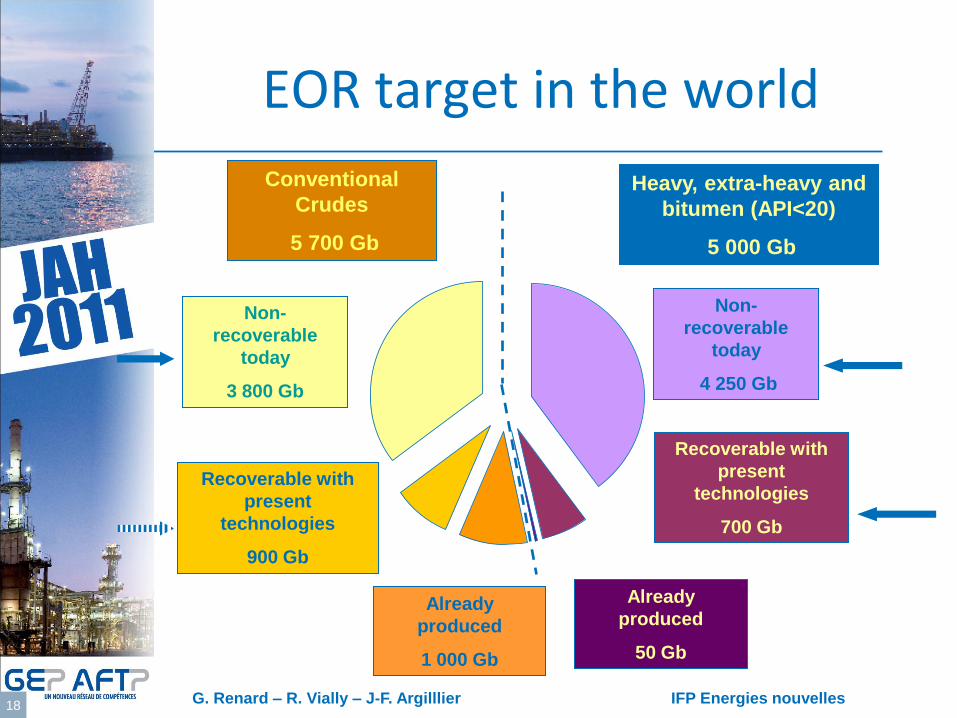
Heavy, extra-heavy and
bitumen (API<20)
5 000 Gb
Conventional
Crudes
5 700 Gb
Already
produced
1 000 Gb
Recoverable with
present
technologies
900 Gb
Non-
recoverable
today
3 800 Gb
Already
produced
50 Gb
Recoverable with
present
technologies
700 Gb
Non-
recoverable
today
4 250 Gb
EOR target in the world
© IF
P
G. Renard – R. Vially – J-F. Argilllier IFP Energies nouvelles 19
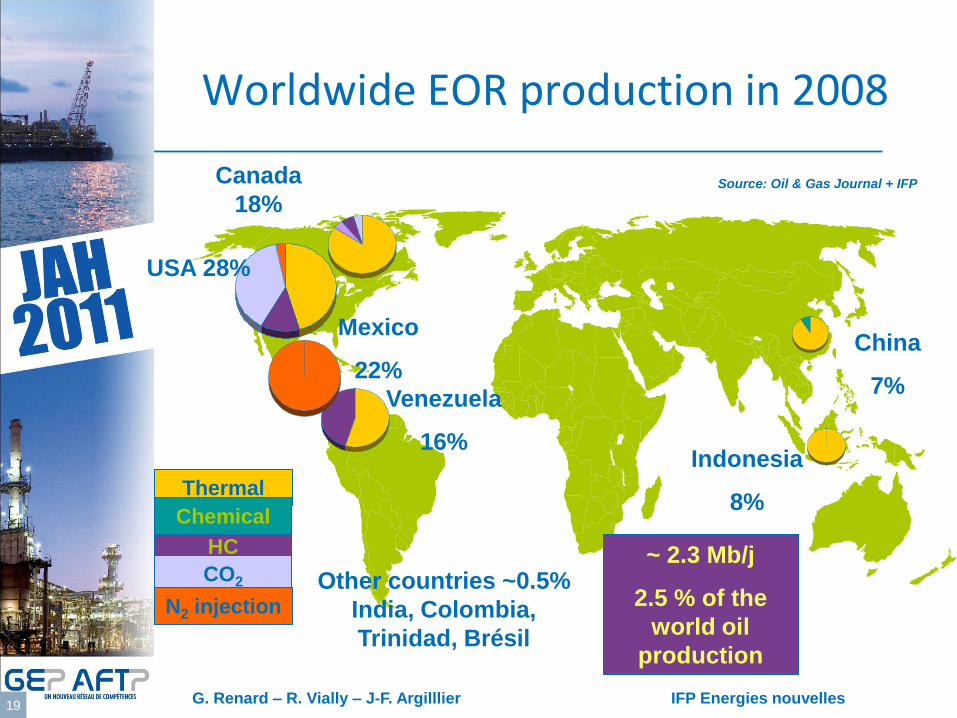
Worldwide EOR production in 2008
Thermal
HC
injection CO2
injection
Chemical
N2 injection
~ 2.3 Mb/j
2.5 % of the
world oil
production
Canada
18%
Venezuela
16%
China
7%
Indonesia
8%
Other countries ~0.5%
India, Colombia,
Trinidad, Brésil
Source: Oil & Gas Journal + IFP
Mexico
22%
USA 28%
© IF
P
G. Renard – R. Vially – J-F. Argilllier IFP Energies nouvelles 20
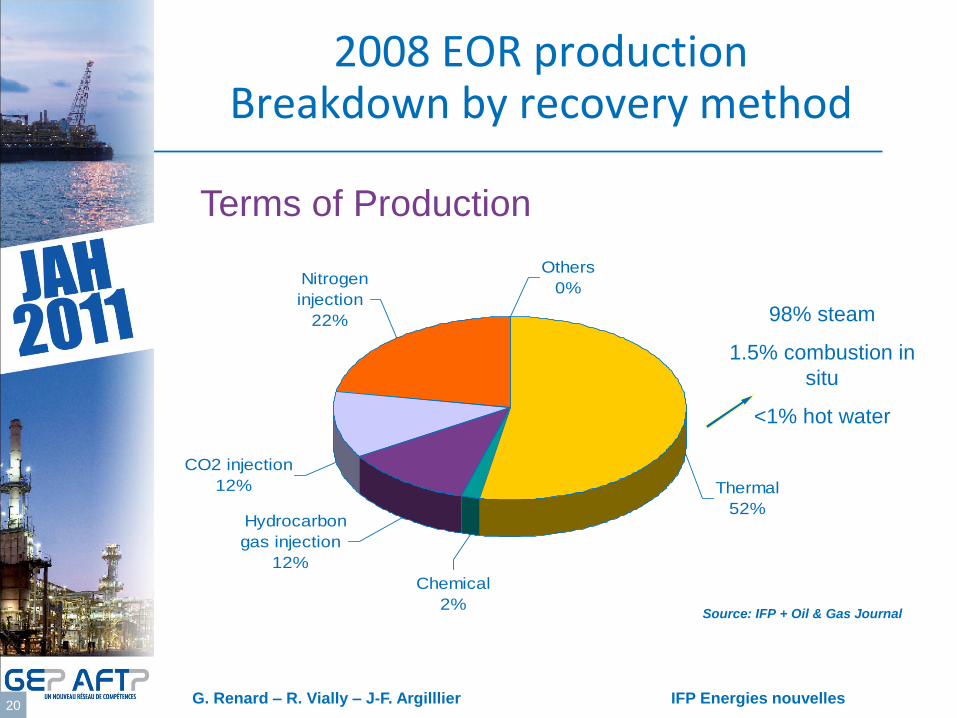
2008 EOR production Breakdown by recovery method
Nitrogen
injection
22%
Thermal
52%
CO2 injection
12%
Hydrocarbon
gas injection
12%
Others
0%
Chemical
2%
98% steam
1.5% combustion in
situ
<1% hot water
Source: IFP + Oil & Gas Journal
Terms of Production
© IF
P
G. Renard – R. Vially – J-F. Argilllier IFP Energies nouvelles 21
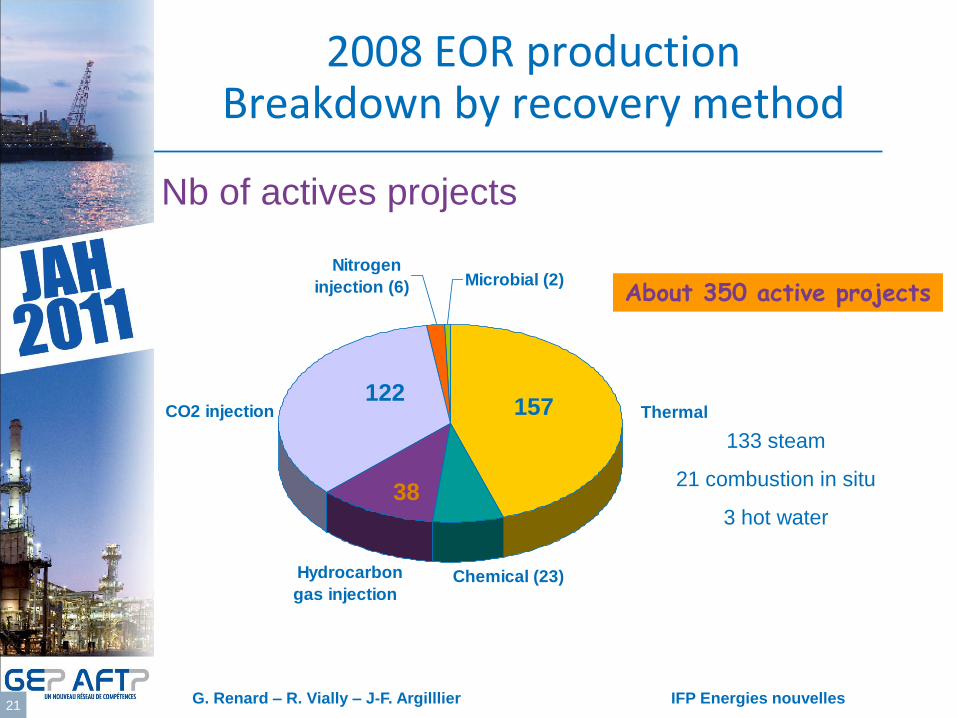
2008 EOR production Breakdown by recovery method
Nitrogen
injection (6)
Thermal CO2 injection
Hydrocarbon
gas injection
Microbial (2)
Chemical (23)
133 steam
21 combustion in situ
3 hot water
157
38
122
About 350 active projects
Nb of actives projects
© IF
P
G. Renard – R. Vially – J-F. Argilllier IFP Energies nouvelles 22
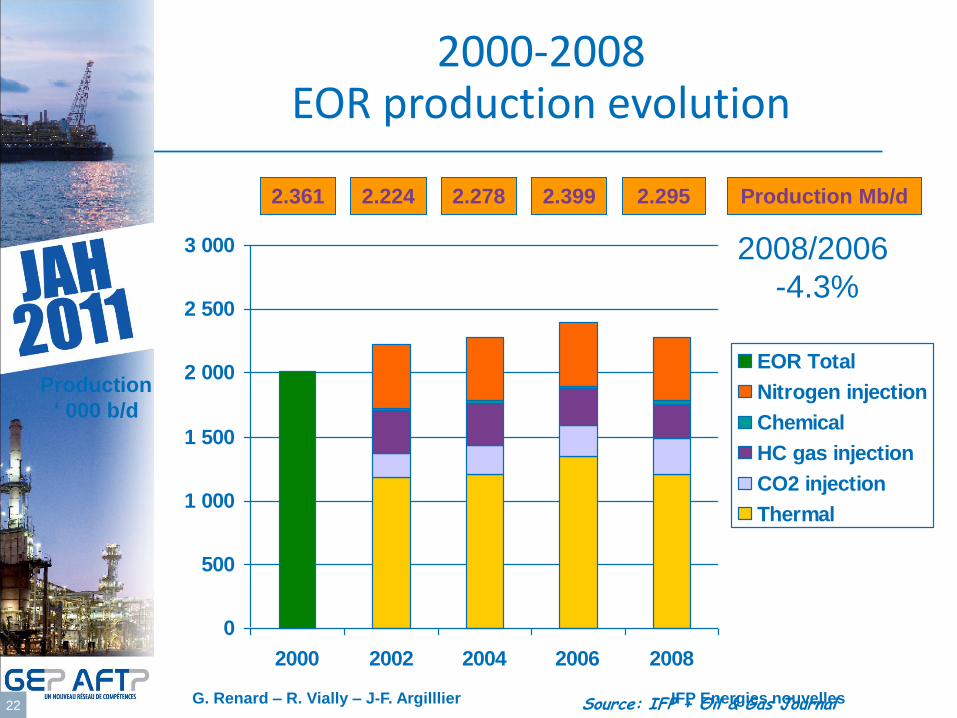
0
500
1 000
1 500
2 000
2 500
3 000
2000 2002 2004 2006 2008
EOR Total
Nitrogen injection
Chemical
HC gas injection
CO2 injection
Thermal
Production Mb/d
Production
‘ 000 b/d
2.361 2.224 2.399 2.295
Source: IFP + Oil & Gas Journal
2000-2008 EOR production evolution
2.278
2008/2006
-4.3%
© IF
P
G. Renard – R. Vially – J-F. Argilllier IFP Energies nouvelles 23
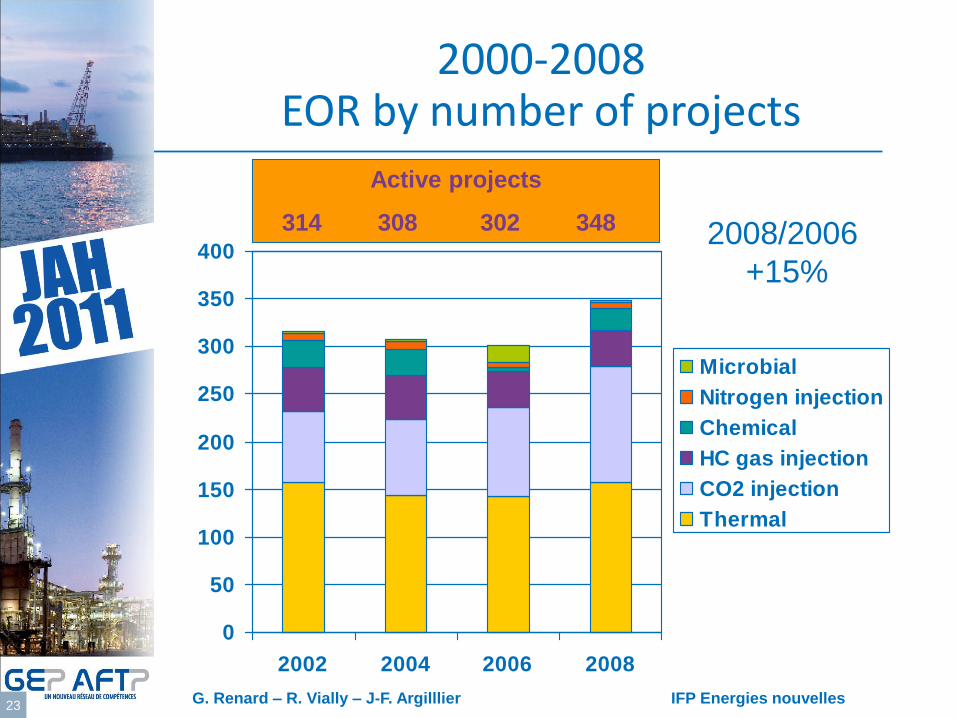
Active projects
314 308 302 348
0
50
100
150
200
250
300
350
400
2002 2004 2006 2008
Microbial
Nitrogen injection
Chemical
HC gas injection
CO2 injection
Thermal
2000-2008 EOR by number of projects
2008/2006
+15%
© IF
P
G. Renard – R. Vially – J-F. Argilllier IFP Energies nouvelles 24
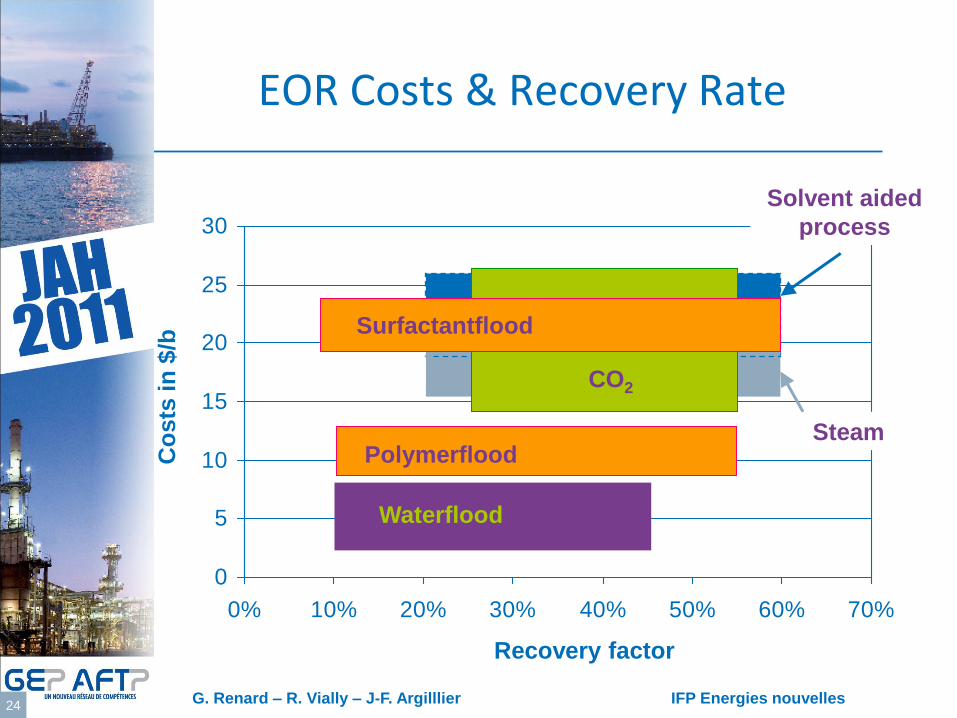
EOR Costs & Recovery Rate
0
5
10
15
20
25
30
0% 10% 20% 30% 40% 50% 60% 70%
Polymerflood
Surfactantflood
Recovery factor
Co
sts
in
$/b
Waterflood
CO2
Solvent aided
process
Steam
© IF
P
G. Renard – R. Vially – J-F. Argilllier IFP Energies nouvelles 25
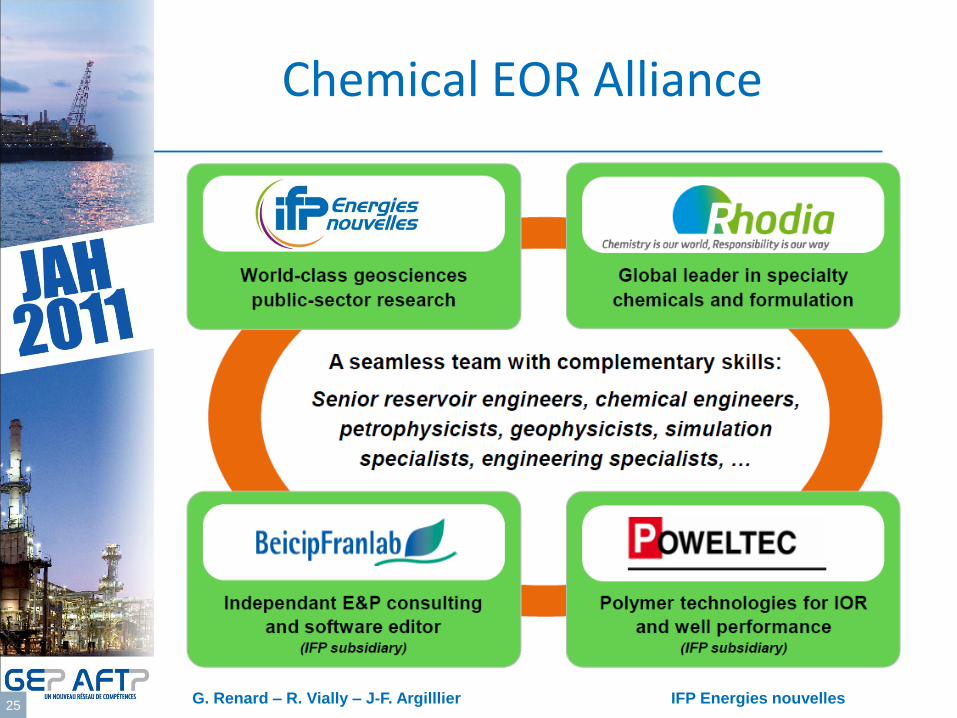
Chemical EOR Alliance
© IF
P
G. Renard – R. Vially – J-F. Argilllier IFP Energies nouvelles 26
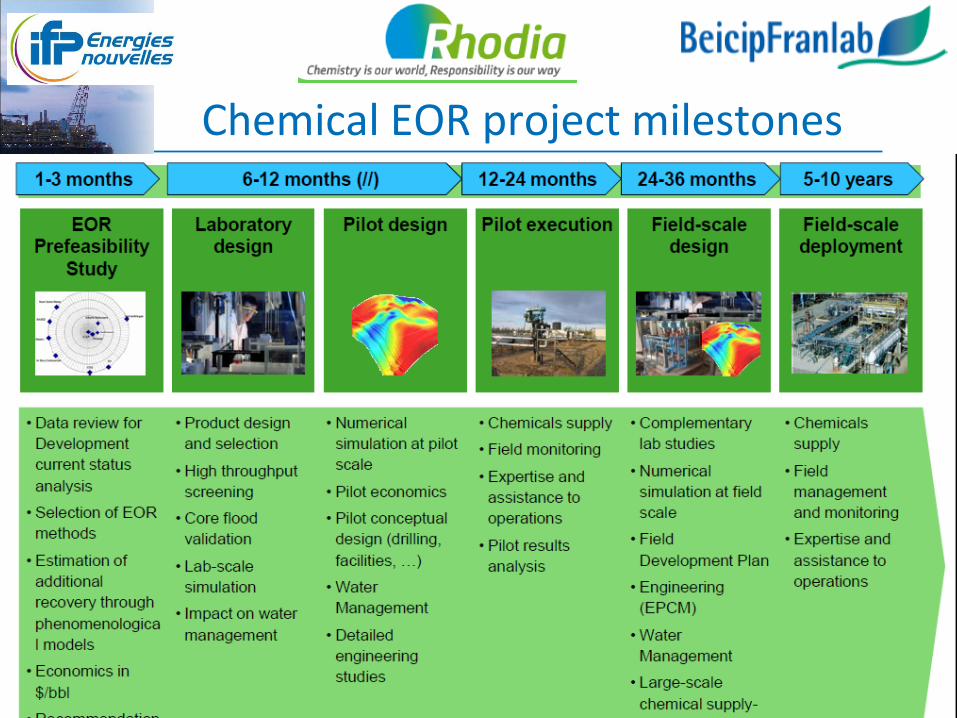
Chemical EOR project milestones
© IF
P
G. Renard – R. Vially – J-F. Argilllier IFP Energies nouvelles 27
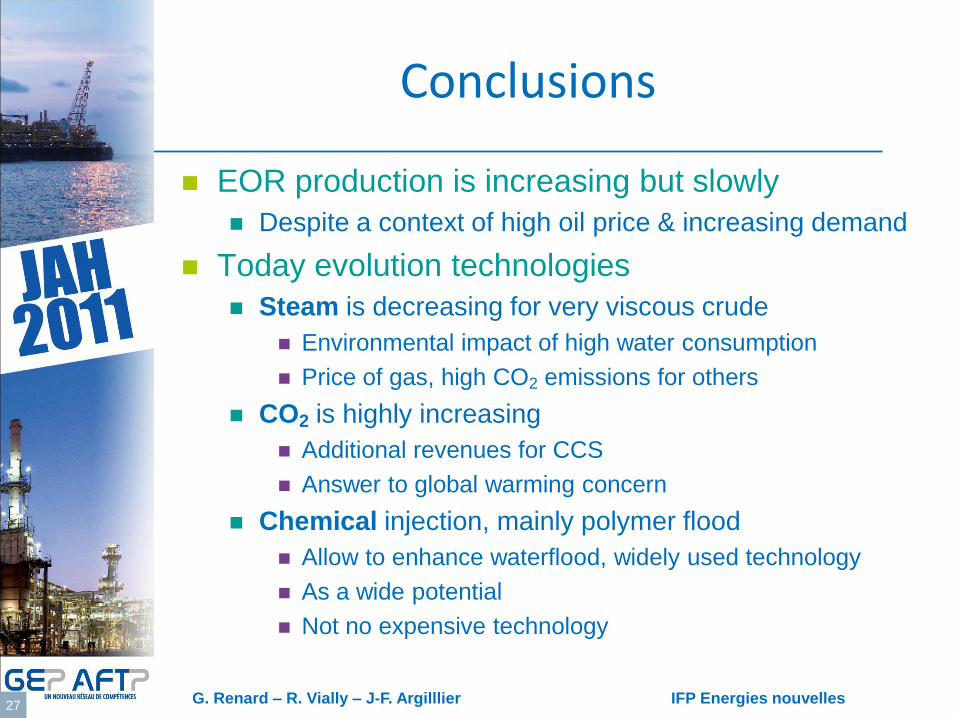
Conclusions
EOR production is increasing but slowly
Despite a context of high oil price & increasing demand
Today evolution technologies
Steam is decreasing for very viscous crude
Environmental impact of high water consumption
Price of gas, high CO2 emissions for others
CO2 is highly increasing
Additional revenues for CCS
Answer to global warming concern
Chemical injection, mainly polymer flood
Allow to enhance waterflood, widely used technology
As a wide potential
Not no expensive technology