Embed Size (px)
Citation preview

u
- SOLAR ENERGY WHITE PAPER - WHERE WE ARE NOW AND WHAT’S AHEAD
A summary provided by Platinum Sponsor Natcore Technology, Inc.
Dr. Dennis J. Flood, CTO Presented at New Orleans Investment Conference
October 24, 2012

INTRODUCTION A report published in June , 2012, from the International Renewable Energy Agency (IREC was officially founded in 2011 by the United Nations and presently comprised of 101 member countries including The United States, with 58 new membership applications in progress) provided the following snapshot of solar energy as of early 2012.

International Renewable Energy Agency, June 2012
The Interstate Renewable Energy Council here in the US provided this summary from their August 2012 report:
“Solar markets are booming in the United States due to falling photovoltaic prices, strong consumer demand, and financial incentives from the federal government, states and utilities. Photovoltaic trends: 1. The capacity of photovoltaic (PV) installations completed in 2011 doubled compared to the capacity installed in 2010. 2. PV capacity installed in 2011 more than doubled for larger systems in the utility sector and the non-residential sector. Residential capacity installed in 2011 grew by 24% compared with 2010. State renewable portfolio requirements are an important reason for the large growth in the utility sector. 3. The amount of PV capacity installed in Arizona, California, Hawaii, New Jersey, New Mexico and New York in 2011 was at least double the capacity installed in each state in 2010. California remains the largest U.S. market, with about 29% of the U.S. capacity installed in 2011. This is consistent with California’s market share in 2010, but represents a significant drop in market share from the 68% recorded five years earlier, in 2006.”
Interstate Renewable Energy Council, Inc. (IREC), August 2012 Bullet #3 above provides an insight into how fast the PV market is growing. California’s market is the largest in the US and is growing at an amazing rate. The 2011 cumulative installed system capacity in California is over 4 times the cumulative total for 2006. Even more astounding, the cumulative installed capacity in the entire country is about 10 times larger than it was in 2006, including the amazing growth in California. While no one expects such a torrid pace to be maintained into the future, the long term trend is for double digit growth for a good long while. It is clear to objective observers and proponents alike that energy from solar cells and panels is fast becoming a viable economic alternative to the conventional sources of energy we have all become accustomed to use. What can be confusing to the casual observer, and even to the interested potential customer, is what appears to be a bewildering assortment of technologies from which to choose. This White Paper will provide a brief description of those technologies that are commercially available along with a summary of market projections both globally and for the United States. A top level view of the various technologies and their pros and cons is all that can be provided here. A set of references is provided at the end of the White Paper for further, more in-depth study. SOLAR PANEL TECHNOLOGIES

A snapshot of current solar cell technologies is given in Table 1. A glossary of the terms used there can be found at the end of the White Paper.
Table 1. Summary of current PV technologies available on the world market as of the end of 2011.
TECHNOLOGY PRO CON Concentrator PV Highest efficiency option – mid
30% Space PV heritage – triple junction cell
Highest cost per watt Mechanically complex Thermal management problems Long term reliability of optics

Figure 1 shows a type of concentrator array (called a minicassegrainian) that uses a double mirror setup to focus the sun’s rays by several hundred times. Focusing the light to a small area allows the solar cell to be smaller. If properly designed and thermally protected so they do not overheat in the intense light, these small cells can generate even more power than a conventional silicon cell that is the same size as the concentrator element being used and cost about as much. The additional complexity of the concentrator element and the thermal management subsystem behind the cell adds back some cost, however.
Limited to high solar flux regions
C-‐Silicon
Mature, well-‐accepted technology Large market share Well-‐established CAPEX Turnkey manufacturing Well-‐understood paths to panel
improvements
Commercial cell maximum efficiency limited to low 20% range,
Dependent on bulk silicon supply & cost
Highly competitive commodity market
Poly-‐Silicon
Mature, well-‐accepted technology Comparable market share to C-‐Silicon Well-‐established CAPEX Turnkey manufacturing Lower wafer cost than C-‐Si Well-‐understood paths to panel
improvements
Lower efficiency than C-‐Silicon Dependent on bulk silicon supply & cost
Balance of system costs higher Highly competitive commodity market
CIGS
Flexible Panel Rigid Panel
Superior W/KG (flexible panels) Efficiency potential equal to poly-‐
Si Low material costs Potentially lowest cost in high
volume production Flexible or rigid substrate
Production cell efficiencies well below expected practical limits
CAPEX higher than silicon cells Price/watt still too high Niche markets (BIPV, rooftops,
standalone systems) Higher BOS cost
CdTe
Theoretical maximum efficiency material
Large players (GE, First Solar) Multiple markets –Utility, BIPV,
Rooftop, standalone Low panel cost
Production cell efficiencies well below expected practical limits
Tellurium, Indium supply issues Cd disposal Higher BOS cost Not allowed in Japanese market
Organic PV (OPV)
Roll-‐to-‐roll processing Low cost materials Flexible modules
Low efficiency (single digits) Unstable cell material Poor product lifetime (<5 years) No solutions to problems in sight

Figure 1a. Concentrator arrays must have accurate double axis tracking capability to follow the sun as it moves across the sky.
Figure 1b. Optical elements must have very precisely formed shapes and be held rigidly in place to avoid defocussing the sun.
Other versions of concentrating arrays use a special lens known as a Fresnel concentrator, but they have the same issues as the double mirror arrays shown above. The primary motivation for developing this technology is that although the cells are made of very costly materials, they are very small and end up costing about as much per watt of output as a standard silicon cell that is the same size as the optical element doing the concentration. The challenges are to 1) increase the efficiency of the small area cells; 2) lower the cost of the concentrator elements, and 3) lower the cost of the array mounting and tracking system by enough so that with all three items taken together the system can produce electricity at competitive prices. The workhorses of the solar photovoltaic market are single crystal (c-silicon) and multi or polycrystalline silicon (m or p-silicon) cells and panels. Both cell types are shown in Figure 2 and are very similar in
Figure 2. The two types of silicon solar cells in use today.
structure, with the exception that c-silicon cells always have the corners missing because they are sliced from round cylinders of pure silicon while the m-silicon cells are made from square cross-section bricks of less refined silicon. As a result, c-silicon cells are more efficient than m-silicon solar cells but also cost a bit more. If panel cost is more important than performance for a given solar power system, m-silicon
Solar cell
Secondary mirror Light path

cells and panels are chosen. If it is the opposite, then c-silicon cells and panels are chosen. There is room in the market for both types and it is split roughly evenly between them, with variations in which type is used more from year to year. Thin film solar cells hold out the promise of providing the same amount of output power as standard silicon cells while using less material for active region of the cell. Many other materials absorb sunlight more strongly than silicon with the result that thinner layers of those materials can be used to capture the same amount of light. A standard silicon solar cell in today’s market is about 150 microns thick. Two materials that have the same theoretical efficiency potential as silicon but can be less than one-tenth as thick are the two element material, cadmium telluride or CdTe, and a four element material, copper indium gallium diselenide or CuInxGa(1-x)Se2 (commonly called CIGS).
Figure 3a. Schematic of a CIGS solar cell.
Figure 3b. Example of a flexible CIGS solar panel.
CIGS thin film cells are made in a variety of ways and can be manufactured on rigid glass panels, metal sheets and even plastic sheets. They presently have efficiencies lower than either of the two silicon cells types and are still more expensive to manufacture. As a result they have not yet captured a significant market share. A considerable amount of cost reduction, coupled with efficiency improvement, must still be achieved for the technology to do so. CdTe thin film cells are comparable to CIGS cells in theoretical performance but commercial cells are still well below such levels. Both cell types can rival commercial silicon cell efficiencies, but both are
Figure 4. Cross-section of a typical CdTe thin film solar cell. Note that the glass is on top of the active layers, a configuration required by the manufacturing process.
well below that level of performance. CdTe solar panels are commercially available with efficiencies around 12%, and at present are made using thermal-vacuum processing on glass panels. Figure 4 shows the cross-section of a typical CdTe solar cell. CdTe panels have costs that are very competitive with silicon solar cell panels, but have only about two-thirds their efficiency. They are primarily used in large commercial array installations where the cost of land is not a major factor in the array price, since it takes

about 50% more CdTe panels (and therefore more land) to produce the same amount of output as a silicon array. Nonetheless the economics often work out and annual production of CdTe panels has exceeded one gigawatt (one billion watts) in recent years. One other thin film solar cell that is commercially available for large scale applications is made from amorphous silicon. It is fundamentally quite different from both c-silicon and m-silicon. Amorphous silicon panels are typically in the 7% to 9% efficiency range, with little hope for improvement without a significant increase in cost that would make them non-competitive with standard silicon cells. It is also produced by thermal vacuum processes and can be produced on glass or flexible stainless steel sheets. Amorphous silicon on flexible stainless has found a niche market in building applications where its flexibility can be used to advantage in architectural design. Amorphous silicon can also be made semitransparent and the panel can be used as a window where the loss of efficiency for doing so is not a concern. Figure 5a shows a typical panel made on a glass plate and 5b shows a roofing shingle with an embedded amorphous silicon panel.
Figure 5a. Typical amorphous silicon on glass solar panel.
Figure 5b. Amorphous silicon roofing shingle. Roofing shingle panel efficiencies are typically under 5% but have architectural appeal compared to a standard solar panel on a rooftop.
Organic solar cells are composed of organic or polymer materials (such as organic polymers or small organic molecules). They are inexpensive, but not very efficient. They are emerging as a niche technology, but their future development is not clear. Their success in recent years has been due to many significant improvements that have led to higher efficiencies. Organic PV module efficiencies are now in the range 4% to 5% for commercial systems and 6% to 8% in the laboratory. In addition to the low efficiency, a major challenge for organic solar cells is their instability over time. Organic cell production uses high-speed and low temperature roll-to-roll manufacturing processes and standard printing technologies. As a result, organic solar cells may be able to compete with other PV technologies in some applications, because manufacturing costs are continuing to decline. Organic cells can be applied to plastic sheets in a manner similar to the printing and coating industries, meaning that organic solar cells are lightweight and flexible, making them ideal for mobile applications and for fitting to a variety of uneven surfaces. This makes them particularly useful for portable applications, a first target market for this technology. Potential uses include battery chargers for mobile phones, laptops, radios, flashlights, toys and almost any hand-held device that uses a battery. A cell type not listed in Table 1 is the so-called dye sensitized solar cell. Dye-‐sensitized solar cells use photo-electrochemical solar cells, which are based on semiconductor structures formed between a photo-sensitised anode and an electrolyte. In a typical DSSC, the semiconductor nanocrystals serve as antennae that harvest the sunlight (photons) and the dye molecule is responsible for the charge separation. It is unique in that it mimics natural photosynthesis (Grätzel, 1991). These cells are attractive because they use low-cost materials and are simple to manufacture. They release electrons from, for example, titanium dioxide covered by a light absorbing pigment. However, their performance can degrade over time with
exposure to UV light and the use of a liquid electrolyte can be problematic when there is a risk of freezing. MARKET PROJECTIONS We will focus initially on the US market, now considered to be on the verge of becoming the largest market for solar panel and array installations around the globe. Figure 6 shows the acceleration in added
Figure 6. Cumulative U.S. grid tied solar installations
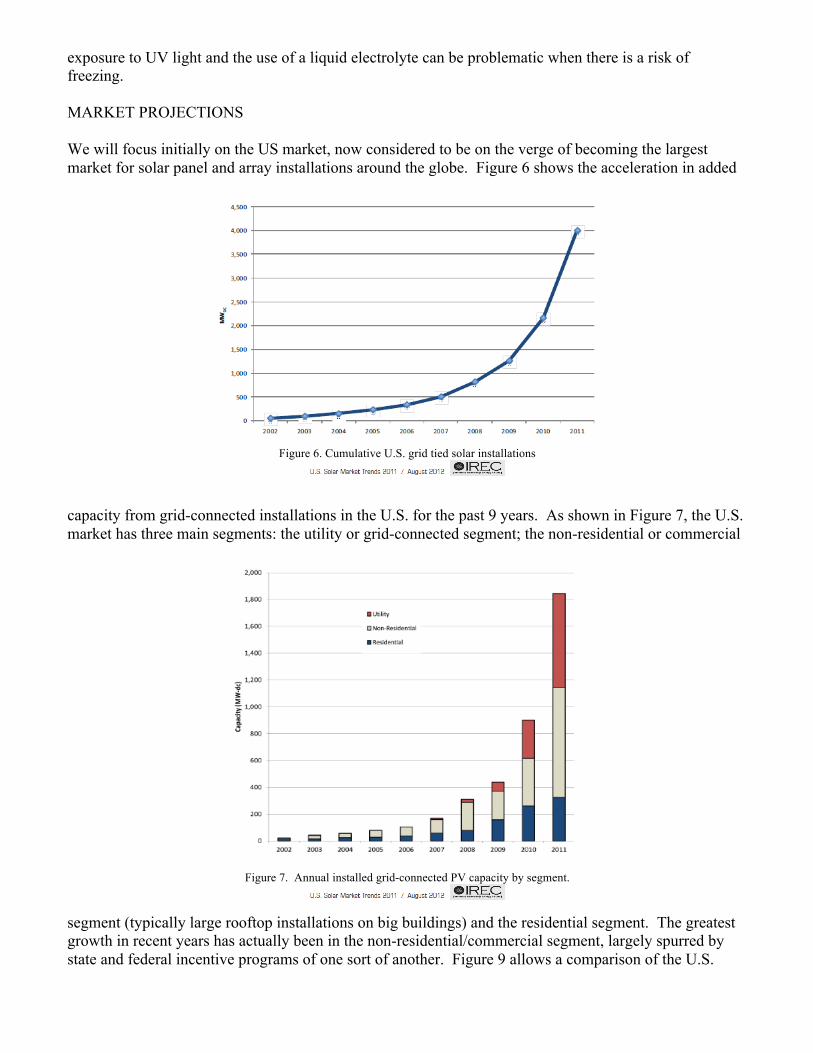
capacity from grid-connected installations in the U.S. for the past 9 years. As shown in Figure 7, the U.S. market has three main segments: the utility or grid-connected segment; the non-residential or commercial
Figure 7. Annual installed grid-connected PV capacity by segment.
segment (typically large rooftop installations on big buildings) and the residential segment. The greatest growth in recent years has actually been in the non-residential/commercial segment, largely spurred by state and federal incentive programs of one sort of another. Figure 9 allows a comparison of the U.S.

Figure 9. Total global cumulative solar installations.
market overall with the total global market. The potential demand in the U.S. is estimated by several market analysts to reach or exceed 14% of total global demand over the next few years. According to the European Photovoltaic Industry Association (EPIA) expectations are that total global cumulative installations by 2016 will be somewhere between about 200GW and about 350GW. That would imply that the U.S. cumulative installed capacity would be in the range from about 28GW to about 50GW, between a 7-fold and 12-fold increase over 2011 levels. CONCLUSION The opportunity for growth in the global photovoltaic solar energy sector over the next decade or more is substantial, with the United States market alone estimated to grow to 7 to 10 times its current levels in just the next 5 years or so. Most of this growth will be fueled by silicon solar cell technology. The silicon solar cell segment of that market can be expected to generate revenues in the range of $14B to $25B in that time frame, assuming an average price for the cells is about $0.50 per watt of output power, a not unreasonable target.