Embed Size (px)
Citation preview
IntCal04 Radiocarbon dating calibration www.BillHowell.ca Page 1 of 36
Solar activity, climate and history over the last 7 ky using Charvatova's hypothesis and radiocarbon dating curvesBill Howell, 25Jun08
Abstract
IntCal04 Radiocarbon dating calibration www.BillHowell.ca Page 2 of 36
Copyright © 2008 All content is owned by William Neil Howell, except when otherwise specified.Note: presumably the following graphs belong to the publishers of their respective papers.
Charvatova's graphs - Figures 1a,b; 2a,b (I have redone the graphs)Ian Wilson's graphs -
Permission is granted to copy, distribute and/or modify this image under either: The GNU Free Documentation License; with no Invariant Sections, Front-Cover Texts, or Back-Cover Texts.
Creative Commons Attribution-Noncommercial-Share Alike 3.0 Unported License.
It is expected that reusers of this webpage will:• Acknowledge William Neil Howell and/or the specific author of content or images on this page as indicated, as the
source of the image.• Provide a link or reference back to this specific page.• Allow any modifications made to the content to also be reused under the terms of one or both of the licenses noted
above.
Versions:25Jun08 initial, incomplete, uncorrected draft
Cleanup items:...Search & Replace Chavatova -> CharvátováIncomplete references, double check references and several dataNeural network component not done
endpage
IntCal04 Radiocarbon dating calibration www.BillHowell.ca Page 3 of 36
1. Introduction
Soon after Samuel Heinrich Schwabe (1789-1875) discovered the decadal sunspot cycle approximately 150 years ago or so, Johann Rudolf Wolf (1816-1893) proposed that the cycle was the result of sun-planetary motion [Charbonneau 2002]. Having noticed the similarity in periodicities of the sunspot cycle with geomgnetic activity, he then formulated a theory on the assumption that each planet affected solar activity in proportion to its gravitational pull on the sun, with of course Jupiter dominating the effect. Since that time, many scientists have tried to relate solar activity cycles (typically suspots) to planetary motions, but these efforts have had limited success [Charbonneau 2002]. In these theories, the cumulative effect of all planets, moons and asteroids is often described in terms of the relative motions between the sun and the center of mass of the solar center (barycenter), referred to in this paper as "Solar Inertial Motions" (SIM).
Numerous causative links have been proposed for a solar activity-planetary motion correlation, including changing accelerations of the sun (Lanscheit , etc tc), tidal motions causing turbulence between layers within the sun, and ???, and possbily geomagnetic influences?. In a later section, recent work [Wilson Jul08] is shown that relates the asymmetry of SIM, to the Earth's Lenght Of Day (LOD) variations, then to the Pacific Decadal Osicillations and ENSO, which might be considered asa semi-physics based model. However, these physics based models have fallen short of satisfactory success. [Charvatova etal ???] also came to this conclusion after trying to relate solar acceleration to solar activity. Instead, they concluded that the matching of SIM to solar activity periodicities is best explained by "phase synchronization, as SIM was influencing solar activity in a somewhat indirect and subtle fashion, rather driving it directly. This situation is quite similar to the results for glaciations and deglaciations of [Tziperman, Raymo, Huybers, Wunsch 2006], who suggested that phase synchronisation between Milankovic forcing and glaciation cycles could explain the occasional "reversed timing" between the phenomena. Again, the problem with glaciation cycles is that the dominant theory of Milankovic forcing doesn't quite explain the data. (Note that [Veiser etal ???] have also proposed that glaciation cycles may be the result of galactic ray variations, which themselves have also been linked to solar activity (and other variables) [Howell 2007abc].
This introductory section provides the context for Charvatova's hypothesis that one might compare solar activity and solar-affected processes over periods of similar SIM. This concept is then extended to millennium scale comparisons, with a focus on standard calibration series for radiocarbon dating as a proxy for solar activity, then to climate and finally historical contexts.
1.1 Charvatovan analysis of Solar Inertial Motions
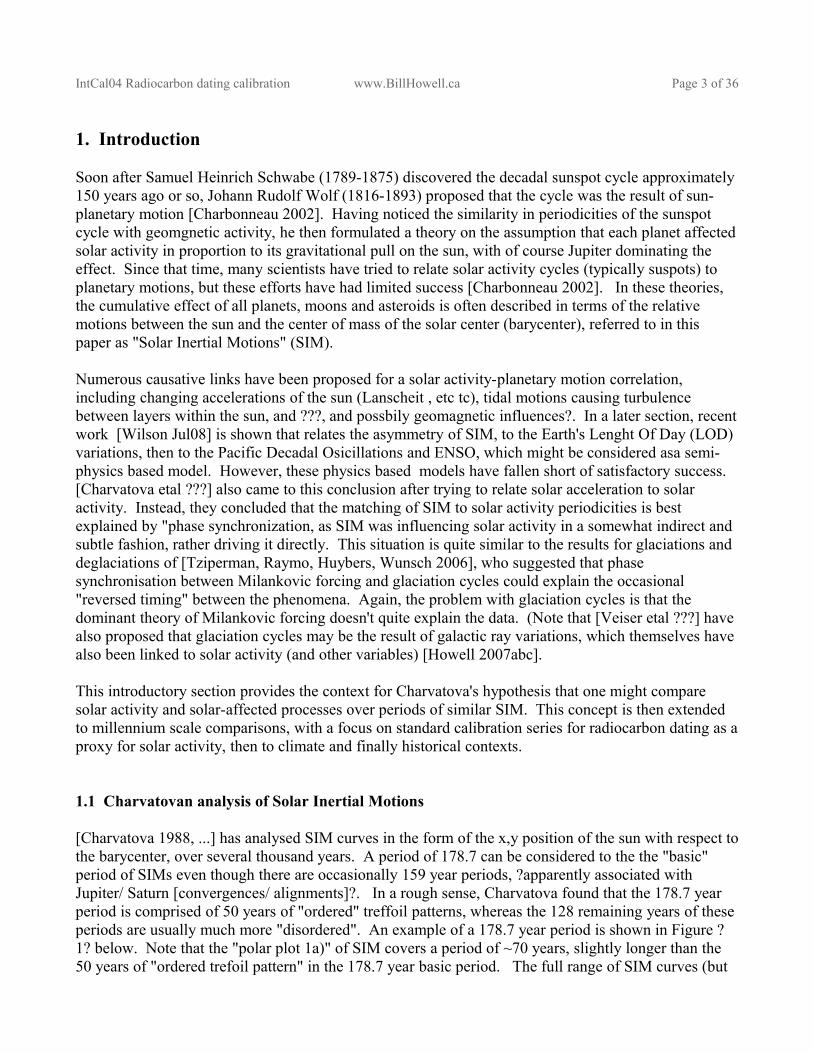
[Charvatova 1988, ...] has analysed SIM curves in the form of the x,y position of the sun with respect to the barycenter, over several thousand years. A period of 178.7 can be considered to the the "basic" period of SIMs even though there are occasionally 159 year periods, ?apparently associated with Jupiter/ Saturn [convergences/ alignments]?. In a rough sense, Charvatova found that the 178.7 year period is comprised of 50 years of "ordered" treffoil patterns, whereas the 128 remaining years of these periods are usually much more "disordered". An example of a 178.7 year period is shown in Figure ?1? below. Note that the "polar plot 1a)" of SIM covers a period of ~70 years, slightly longer than the 50 years of "ordered trefoil pattern" in the 178.7 year basic period. The full range of SIM curves (but
IntCal04 Radiocarbon dating calibration www.BillHowell.ca Page 4 of 36
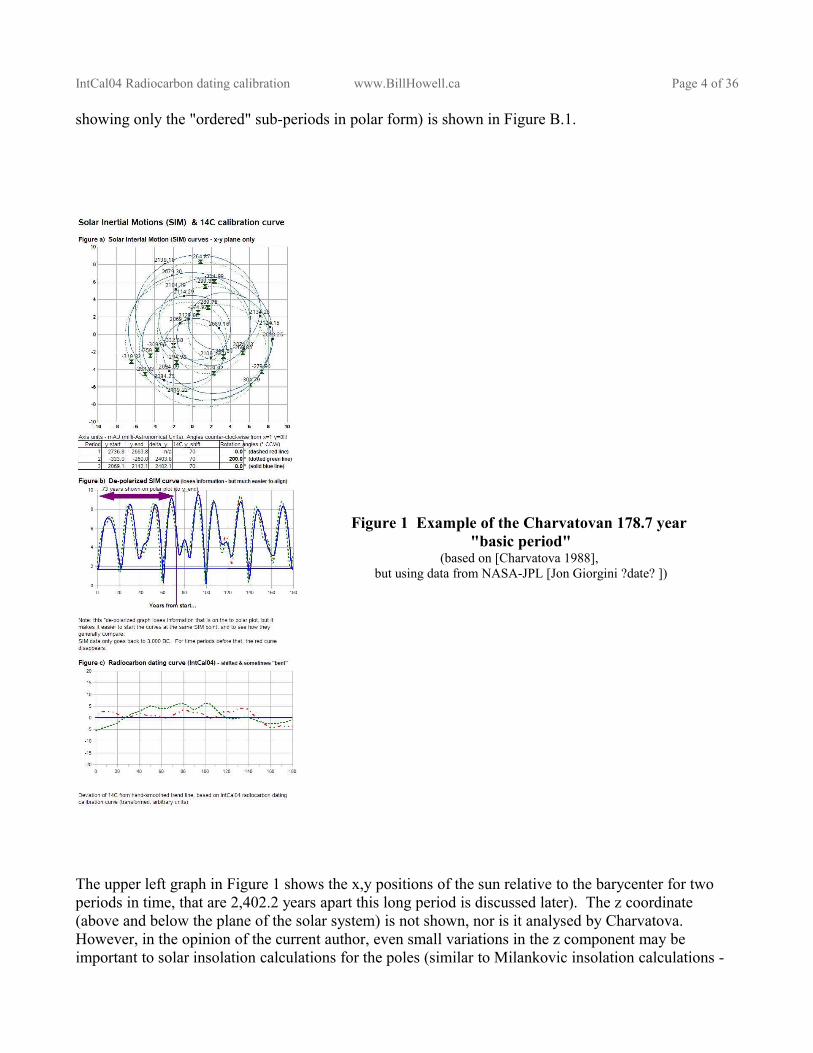
showing only the "ordered" sub-periods in polar form) is shown in Figure B.1.
Figure 1 Example of the Charvatovan 178.7 year "basic period"
(based on [Charvatova 1988], but using data from NASA-JPL [Jon Giorgini ?date? ])
The upper left graph in Figure 1 shows the x,y positions of the sun relative to the barycenter for two periods in time, that are 2,402.2 years apart this long period is discussed later). The z coordinate (above and below the plane of the solar system) is not shown, nor is it analysed by Charvatova. However, in the opinion of the current author, even small variations in the z component may be important to solar insolation calculations for the poles (similar to Milankovic insolation calculations -
IntCal04 Radiocarbon dating calibration www.BillHowell.ca Page 5 of 36
but on much shorter timescales [Howell 2007]). Only the 50 years of "ordered" treffoil behaviour are shown.
Another, simpler, representation of SIM curves is shown in the middle graph (Figure 1.c), which merely shows the sun-barycenter distance based on the x and y coordinates. A third period, starting 2,402.2 years earlier than the next, is shown in red, although the curves overlap so much that the differences are minor and hard to see. While not as informative as the first graph, it makes it much easier to quickly align and compare time series, and to properly read the start and end dates of each period. The bottom graph in the figure shows the "unaltered" carbon 14 residuals (the difference between 1000 year filtered data, and the 14C delta at a particular date). More discussion of the radiocarbon data appears in later sections. For further details including spreadsheet models and graphs, see [Howell 2008a,b].
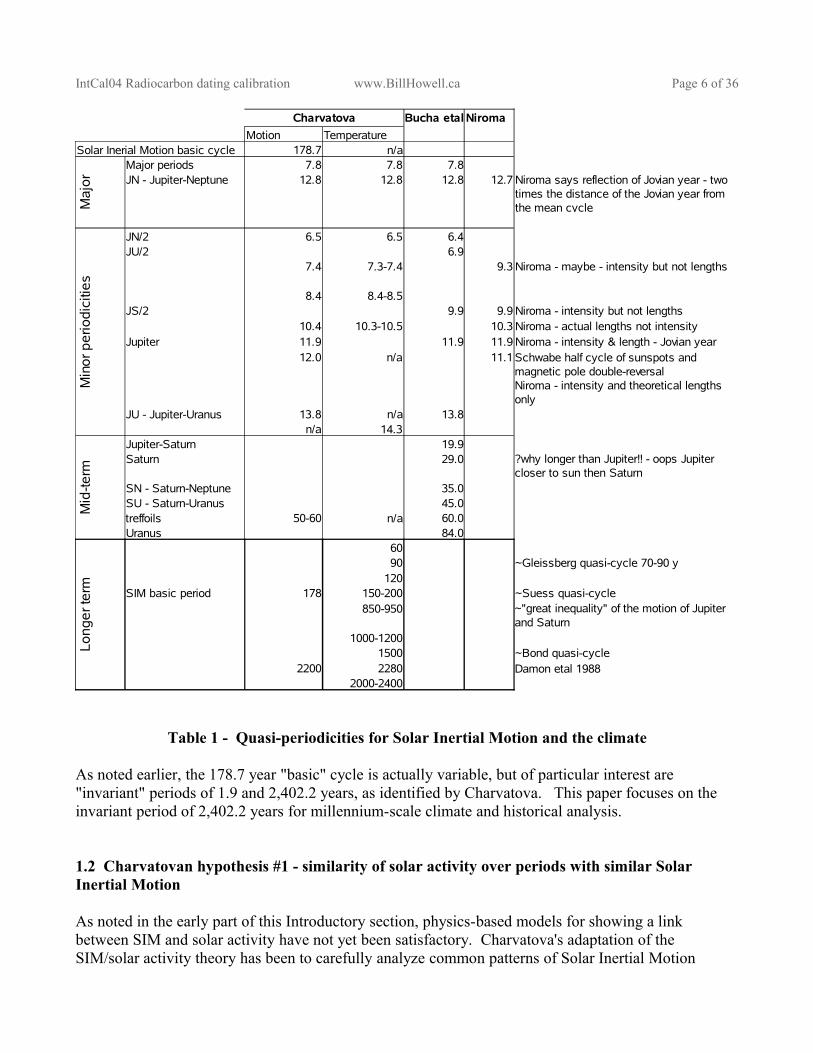
While the 178.7 year "basic Charvatovan" period is crucial for mid-term solar activity comparisons and Sun -> Earth interactions such as climate, it has already been clearly established [Charvatova refs, others??] that the SIM motions possess other periodicities, many of which match dominant spectral signals in the climate records, from 1.9 years through to the 1,500 year Bond cycle, and the 2-2.4 ky Daemon cycle. This is summarized in Table 1 below.
IntCal04 Radiocarbon dating calibration www.BillHowell.ca Page 6 of 36
Table 1 - Quasi-periodicities for Solar Inertial Motion and the climate
As noted earlier, the 178.7 year "basic" cycle is actually variable, but of particular interest are "invariant" periods of 1.9 and 2,402.2 years, as identified by Charvatova. This paper focuses on the invariant period of 2,402.2 years for millennium-scale climate and historical analysis.
1.2 Charvatovan hypothesis #1 - similarity of solar activity over periods with similar Solar Inertial Motion
As noted in the early part of this Introductory section, physics-based models for showing a link between SIM and solar activity have not yet been satisfactory. Charvatova's adaptation of the SIM/solar activity theory has been to carefully analyze common patterns of Solar Inertial Motion
Motion Temperature178.7
Maj
or
Major periods 7.8 7.8 7.8JN - Jupiter-Neptune 12.8 12.8 12.8 12.7
JN/2 6.5 6.5 6.4JU/2 6.9
7.4 7.3-7.4 9.3
8.4 8.4-8.5JS/2 9.9 9.9
10.4 10.3-10.5 10.3Jupiter 11.9 11.9 11.9
12.0 11.1
JU - Jupiter-Uranus 13.8 13.814.3
Mid
-term
Jupiter-Saturn 19.9Saturn 29.0
SN - Saturn-Neptune 35.0SU - Saturn-Uranus 45.0
50-60 60.0Uranus 84.0
Long
er te
rm
6090
120SIM basic period 178 150-200
850-950
1000-12001500 ~Bond quasi-cycle
2200 22802000-2400
Charvatova Bucha etal Niroma
Solar Inerial Motion basic cycle n/a
Niroma says reflection of Jovian year - two times the distance of the Jovian year from the mean cycle
Min
or p
erio
dici
ties
Niroma - maybe - intensity but not lengths
Niroma - intensity but not lengthsNiroma - actual lengths not intensityNiroma - intensity & length - Jovian year
n/a Schwabe half cycle of sunspots and magnetic pole double-reversalNiroma - intensity and theoretical lengths only
n/an/a
?why longer than Jupiter!! - oops Jupiter closer to sun then Saturn
treffoils n/a
~Gleissberg quasi-cycle 70-90 y
~Suess quasi-cycle~"great inequality" of the motion of Jupiter and Saturn
Damon etal 1988
IntCal04 Radiocarbon dating calibration www.BillHowell.ca Page 7 of 36
(SIM), specifically the motions of the sun around the barycenter of the solar system, and to relate them to solar activity for periods of similar SIM. The approach therefore becomes one more of pattern matching, and it can readily accommodate a variety of physical mechanisms which may later explain the phenomenon. Thus, one can maintain "multiple conflicting hypothesis" and avoid putting too much faith any one hypothesis. The current author prefers to retain conflicting hypothesis even when they are less able to explain the data at hand, again as a means to retain toolsets, and to avoid collapsing into belief systems.
Charvatova's approach of comparing solar activity for similar periods of SIM bypasses the limitations of current physics-based models of the SIM effect, allowing:
● a relationship to be established between "sufficiently long" periods of "similar" SIM and the corresponding solar activity
● (hopefully) extended forecast horizons for solar activity on the centenary-to-millenial time scales. To illustrate, the maximum forecast horizon for solar activity today is roughly 4 years, based on the Lyapunov exponent and fractal dimension of the yearly sunspot series [Carlo Francesco Morabito 2005], and this assumes that the sun doesn't change its state or phase in the interim. Unfortunately, the sun changes state or phase quite often, on the scale of several decades or at most 128 years. On the other hand, there is some hope that "approximate forecasts" on the order of 5,000 years might be possible by applying Charvatova's approach. (This is my hope, and it is only a hope).
● a "data framework" (as opposed to a framework of principles of fundamental physics) for developing better, working physics-based models of solar activity,
● the "subtraction" of the effect of SIM on solar activity, in order to estimate the influence of other variables or processes on solar activity.
Charvatova's hypothesis regarding SIM and solar activity (beyond phase synchronisation, as mentioned earlier), is that "sufficiently long" periods of "similar" SIM, would have "similar" solar activity behaviour. There may be "boundary effects" for some time after entering similar SIM periods, due to dissimilar preceding periods. Note that this is an approximation that depends on:
● some measure of similarity, both for SIM and solar activity curves (they are never exactly the same);
● other influences on solar activity not "blocking out" the signal due to SIM. It is important to note that the suggestion that SIM somehow influences solar activity DOES NOT imply other factors aren't important, perhaps even more important. It also means that the model will have "apparent noise" caused by the influence of non-SIM factors.
Charvatova developed this hypothesis on the basis on analysis of annual sunspot data since the early 1700's. But regular sunspot data only goes back to ~1700, and is of good quality/ completeness only after ?~1850?. Over this period of 300 years there are only one-and a half pairs of "similar" 178.7 year base periods, giving us a very limited basis of comparison for confirming the hypothesis of a SIM influence over solar activity (for example, possibly through phase synchronisation). Furthermore, while the SIM curves are similar, they are not exactly the same, and they enter these periods from different "disordered periods", perhaps explaining phase differences at the outset due to lag effects.
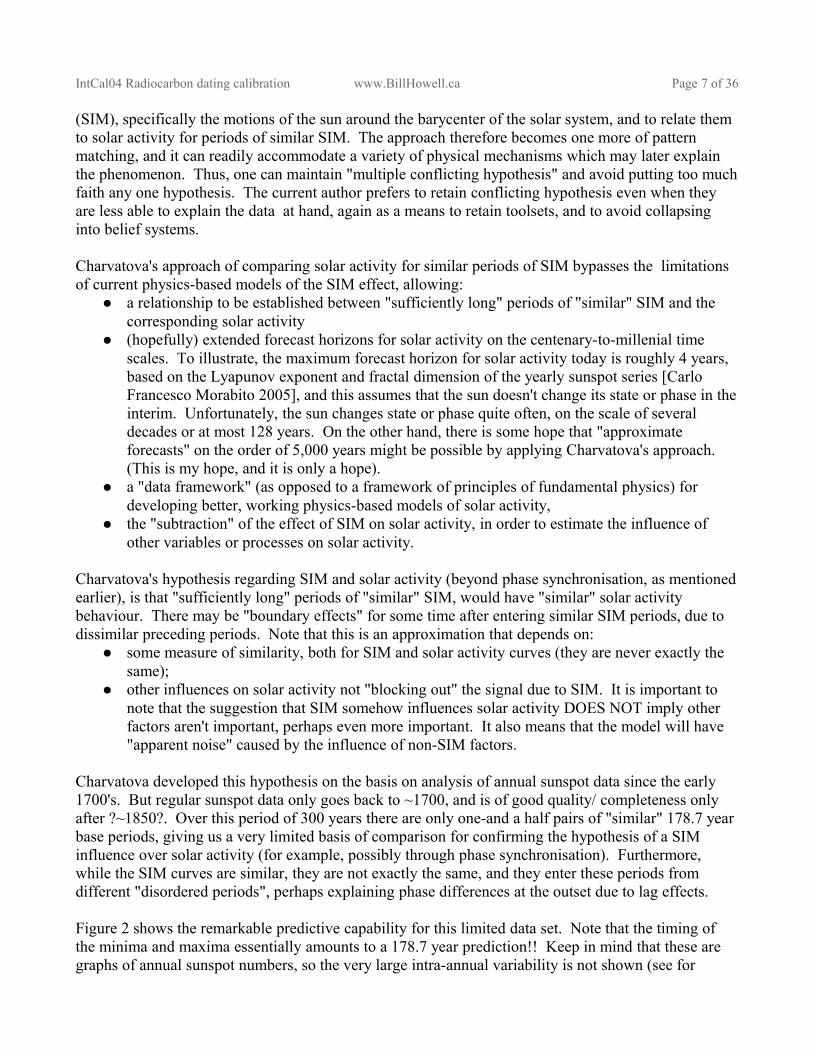
Figure 2 shows the remarkable predictive capability for this limited data set. Note that the timing of the minima and maxima essentially amounts to a 178.7 year prediction!! Keep in mind that these are graphs of annual sunspot numbers, so the very large intra-annual variability is not shown (see for
IntCal04 Radiocarbon dating calibration www.BillHowell.ca Page 8 of 36
example [Crouch, Charbonneau, Beaubien, Paquin-Ricard 2007]). Also keep in mind that some of the misfit in Figure 2a is likely due to relatively poor quality/ incomplete data in the early years before 1850. Also keep in mind that we only have one and a half examples over a very short time sapn of a couple of hundred years, which is hardly a test of Charvatova's hypothesis (or any climate theory).
a) 1728-1777 and 1906-1956
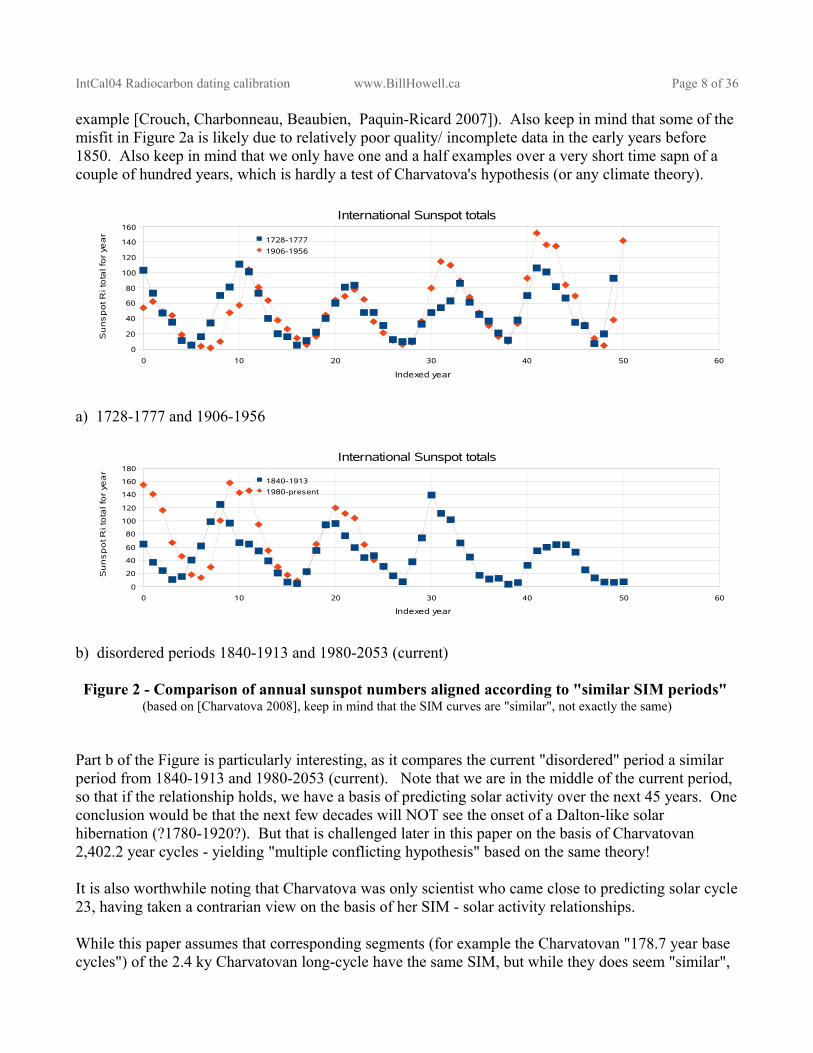
b) disordered periods 1840-1913 and 1980-2053 (current)
Figure 2 - Comparison of annual sunspot numbers aligned according to "similar SIM periods" (based on [Charvatova 2008], keep in mind that the SIM curves are "similar", not exactly the same)
Part b of the Figure is particularly interesting, as it compares the current "disordered" period a similar period from 1840-1913 and 1980-2053 (current). Note that we are in the middle of the current period, so that if the relationship holds, we have a basis of predicting solar activity over the next 45 years. One conclusion would be that the next few decades will NOT see the onset of a Dalton-like solar hibernation (?1780-1920?). But that is challenged later in this paper on the basis of Charvatovan 2,402.2 year cycles - yielding "multiple conflicting hypothesis" based on the same theory!
It is also worthwhile noting that Charvatova was only scientist who came close to predicting solar cycle 23, having taken a contrarian view on the basis of her SIM - solar activity relationships.
While this paper assumes that corresponding segments (for example the Charvatovan "178.7 year base cycles") of the 2.4 ky Charvatovan long-cycle have the same SIM, but while they does seem "similar",
0 10 20 30 40 50 600
20
40
60
80
100
120
140
160International Sunspot totals
1728-17771906-1956
Indexed year
Su
nsp
ot R
i to
tal f
or y
ea
r
0 10 20 30 40 50 600
20
40
60
80
100
120
140
160
180International Sunspot totals
1840-19131980-present
Indexed year
Su
ns
po
t Ri t
ota
l fo
r ye
ar
IntCal04 Radiocarbon dating calibration www.BillHowell.ca Page 9 of 36
they are not the same. Indeed, Charvatova has pointed out that some "base cycles" are ?159 years? rather than 178.7 years in length (this occurs ?4 or 5 times out of 12 over the course of the 2.4 ky quai-period).
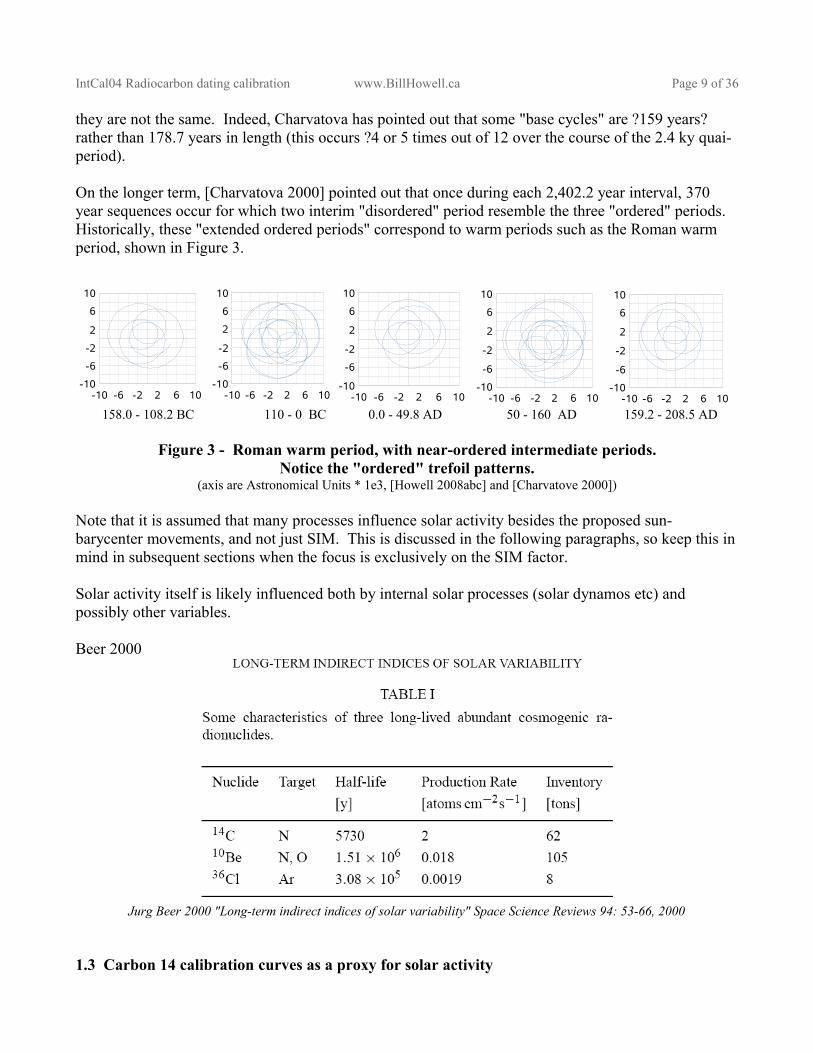
On the longer term, [Charvatova 2000] pointed out that once during each 2,402.2 year interval, 370 year sequences occur for which two interim "disordered" period resemble the three "ordered" periods. Historically, these "extended ordered periods" correspond to warm periods such as the Roman warm period, shown in Figure 3.
158.0 - 108.2 BC 110 - 0 BC 0.0 - 49.8 AD 50 - 160 AD 159.2 - 208.5 AD
Figure 3 - Roman warm period, with near-ordered intermediate periods.Notice the "ordered" trefoil patterns.
(axis are Astronomical Units * 1e3, [Howell 2008abc] and [Charvatove 2000])
Note that it is assumed that many processes influence solar activity besides the proposed sun-barycenter movements, and not just SIM. This is discussed in the following paragraphs, so keep this in mind in subsequent sections when the focus is exclusively on the SIM factor.
Solar activity itself is likely influenced both by internal solar processes (solar dynamos etc) and possibly other variables.
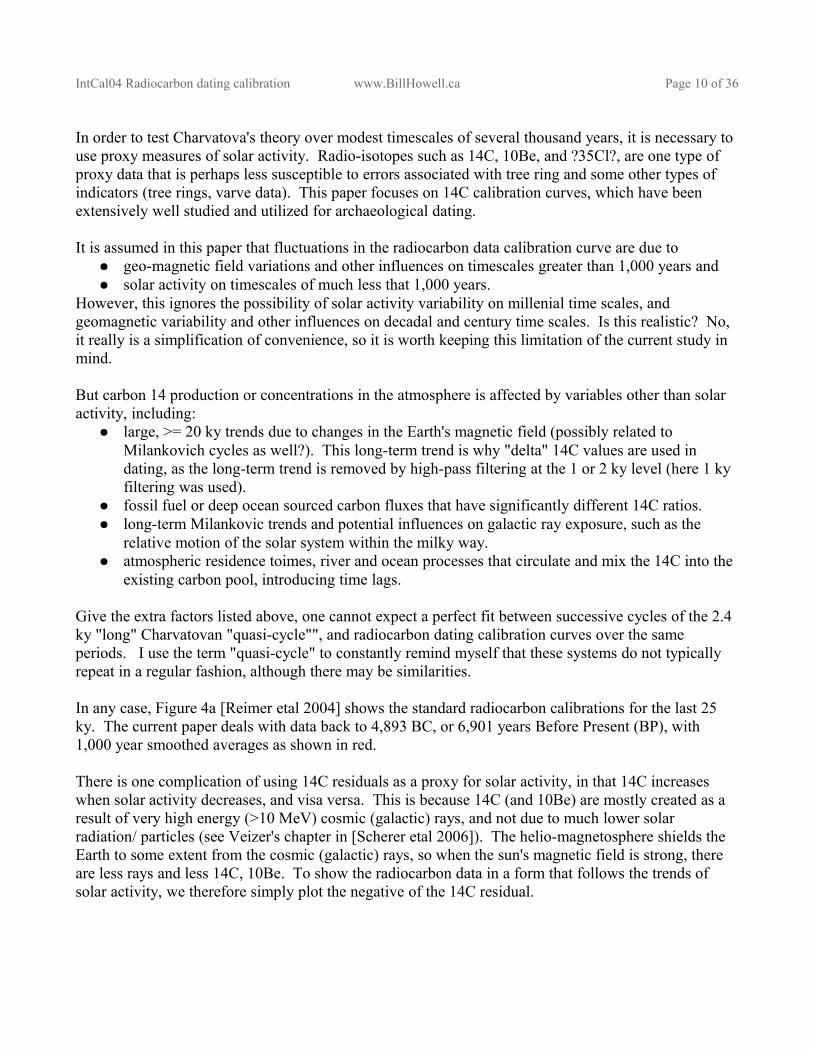
Beer 2000
Jurg Beer 2000 "Long-term indirect indices of solar variability" Space Science Reviews 94: 53-66, 2000
1.3 Carbon 14 calibration curves as a proxy for solar activity
-10 -6 -2 2 6 10-10
-6
-2
2
610
-10 -6 -2 2 6 10-10
-6-2
2
6
10
-10 -6 -2 2 6 10-10
-6
-2
2
6
10
-10 -6 -2 2 6 10-10
-6
-2
2
6
10
-10 -6 -2 2 6 10-10
-6
-2
2
6
10
IntCal04 Radiocarbon dating calibration www.BillHowell.ca Page 10 of 36
In order to test Charvatova's theory over modest timescales of several thousand years, it is necessary to use proxy measures of solar activity. Radio-isotopes such as 14C, 10Be, and ?35Cl?, are one type of proxy data that is perhaps less susceptible to errors associated with tree ring and some other types of indicators (tree rings, varve data). This paper focuses on 14C calibration curves, which have been extensively well studied and utilized for archaeological dating.
It is assumed in this paper that fluctuations in the radiocarbon data calibration curve are due to ● geo-magnetic field variations and other influences on timescales greater than 1,000 years and● solar activity on timescales of much less that 1,000 years.
However, this ignores the possibility of solar activity variability on millenial time scales, and geomagnetic variability and other influences on decadal and century time scales. Is this realistic? No, it really is a simplification of convenience, so it is worth keeping this limitation of the current study in mind.
But carbon 14 production or concentrations in the atmosphere is affected by variables other than solar activity, including:
● large, >= 20 ky trends due to changes in the Earth's magnetic field (possibly related to Milankovich cycles as well?). This long-term trend is why "delta" 14C values are used in dating, as the long-term trend is removed by high-pass filtering at the 1 or 2 ky level (here 1 ky filtering was used).
● fossil fuel or deep ocean sourced carbon fluxes that have significantly different 14C ratios.● long-term Milankovic trends and potential influences on galactic ray exposure, such as the
relative motion of the solar system within the milky way.● atmospheric residence toimes, river and ocean processes that circulate and mix the 14C into the
existing carbon pool, introducing time lags.
Give the extra factors listed above, one cannot expect a perfect fit between successive cycles of the 2.4 ky "long" Charvatovan "quasi-cycle"", and radiocarbon dating calibration curves over the same periods. I use the term "quasi-cycle" to constantly remind myself that these systems do not typically repeat in a regular fashion, although there may be similarities.
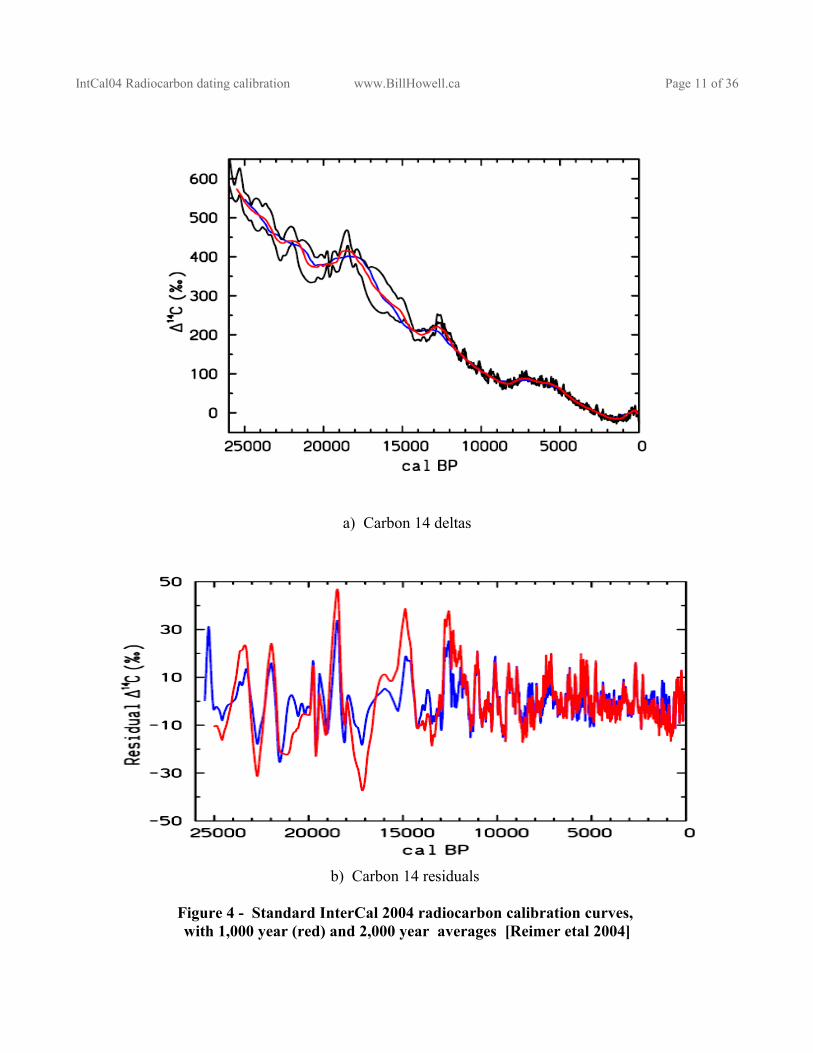
In any case, Figure 4a [Reimer etal 2004] shows the standard radiocarbon calibrations for the last 25 ky. The current paper deals with data back to 4,893 BC, or 6,901 years Before Present (BP), with 1,000 year smoothed averages as shown in red.
There is one complication of using 14C residuals as a proxy for solar activity, in that 14C increases when solar activity decreases, and visa versa. This is because 14C (and 10Be) are mostly created as a result of very high energy (>10 MeV) cosmic (galactic) rays, and not due to much lower solar radiation/ particles (see Veizer's chapter in [Scherer etal 2006]). The helio-magnetosphere shields the Earth to some extent from the cosmic (galactic) rays, so when the sun's magnetic field is strong, there are less rays and less 14C, 10Be. To show the radiocarbon data in a form that follows the trends of solar activity, we therefore simply plot the negative of the 14C residual.
IntCal04 Radiocarbon dating calibration www.BillHowell.ca Page 11 of 36
a) Carbon 14 deltas
b) Carbon 14 residuals
Figure 4 - Standard InterCal 2004 radiocarbon calibration curves, with 1,000 year (red) and 2,000 year averages [Reimer etal 2004]
IntCal04 Radiocarbon dating calibration www.BillHowell.ca Page 12 of 36
Using the background from this introductory section, a central objective of this paper is to extend the data support of Charvatova's hypothesis over ~7 ky by using radiocarbon dating calibration results for the three most recent Charvatovan 2.4 ky "quasi-cycles", and to discuss the results in terms of their potential relevance to solar activity, climate (global temperatures), and to the history of civilisations, the latter in a very general sense.
1.4 Beryllium 10 calibration curves as a proxy for solar activity
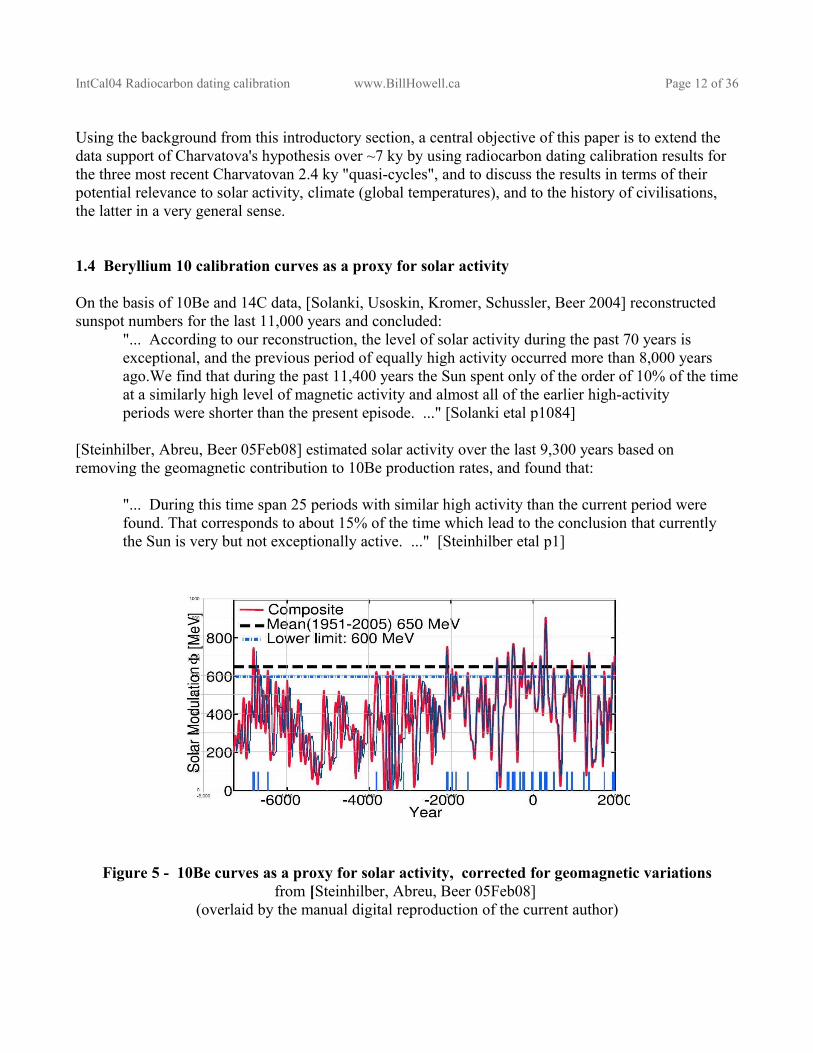
On the basis of 10Be and 14C data, [Solanki, Usoskin, Kromer, Schussler, Beer 2004] reconstructed sunspot numbers for the last 11,000 years and concluded:
"... According to our reconstruction, the level of solar activity during the past 70 years is exceptional, and the previous period of equally high activity occurred more than 8,000 yearsago.We find that during the past 11,400 years the Sun spent only of the order of 10% of the time at a similarly high level of magnetic activity and almost all of the earlier high-activityperiods were shorter than the present episode. ..." [Solanki etal p1084]
[Steinhilber, Abreu, Beer 05Feb08] estimated solar activity over the last 9,300 years based on removing the geomagnetic contribution to 10Be production rates, and found that:
"... During this time span 25 periods with similar high activity than the current period were found. That corresponds to about 15% of the time which lead to the conclusion that currently the Sun is very but not exceptionally active. ..." [Steinhilber etal p1]
Figure 5 - 10Be curves as a proxy for solar activity, corrected for geomagnetic variationsfrom [Steinhilber, Abreu, Beer 05Feb08]
(overlaid by the manual digital reproduction of the current author)
IntCal04 Radiocarbon dating calibration www.BillHowell.ca Page 13 of 36
Based on their results, a comparative plot of the long Charvatovan periods is shown in Figure A.1 and A.2 in Appendix A alongside 14C curves.
2. Solar Inertial Motion periods and solar activity on the millenial scale
2.1 InterCal 2004 carbon 14 calibration data - comparing 2,402.2-year periods
The initial approach for identifying similar SIM periods in the radiocarbon residual data is quite simple:
1. Identify a "marker" on the "simplified" SIM curve (Figure 1c) that occurs close to the onset of one of the "extended ordered SIM periods" (historical warms periods. These started at roughly 4,963.8 BC, 2,560.0 BC, and 157.93 BC (the latter being the onset of the Roman Warm Period).
2. Plot the negative of the 1,000 year averaged residual radiocarbon calibration data for each 2,402.2 year period starting in each case with the dates obtained in step 1. This is the "time folding or stacking" step for generating comparisons.
The initial "pure time folding" result for all three 2.4 ky periods is shown in Figure A.1, along with the "simplified" SIM curve, and temperature profiles that will be discussed in the next section. There is "somewhat" of a match between , but it is not very convincing. There are several implementation details worthy of mention (for full details refer to the data and formulas in the spreadsheet on the website [Howell 2008bc]).
● The 1,000 year time averaging tends to "depress" high solar activity periods of long duration, especially for the "extended order SIM" periods (or extended warm periods). In effect, the vertical "midpoint" of the radiocarbon data is distorted for different sections of each 2.4 ky period.
● ???
The next step, labelled "time bending, or time chopping" was implemented as a simple means of better aligning the time series. A contiguous segment of 125 years (strangely similar to the typical 128 year duration of the disordered part of the basic 178.7 year SIM period) was removed from the radiocarbon dating data near the end of the period starting in 4,983 BC. This has NOT been justified, although it is possible that a 125 year deletion over ~7,000 years (2 Charvatovan long cycles) could be explained by:
● errors in the sun-barycenter calculations - there seemed to be small (1- 5 year?) differences between Charvatova's numbers and the NASA-JPL calculations, but perhaps BOTH have a bias and therefore a 125 year error over ~4,800 years.
● double-summer or double-winter years - Is it possible that seasonal reversals of temperatures and/or preciptiation/ flooding are severe enough to give the appearance of two years when only one year has passed? Over 7,000 years, perhaps that has occurred ~125 times?
The results of the simple, combined "time folding and time bending" are shown in Figure A.2.c (it is best to print this figure out on at least 11 inch by 17 inch paper to properly see the writing and graphs). In spite of the known simplifications of the concept, the visual fit is surprisingly good (to me, anyways). Without an independent base of comparison (such as 10Be time folded and bent), and with no intention of frivolously optimizing the fit, and because extra data transformations are still needed (in
IntCal04 Radiocarbon dating calibration www.BillHowell.ca Page 14 of 36
particular some means of adjusting the vertical scale within the 2.4 ky periods to better reflect absolute levels of 14C residuals) no statistical estimates of fit were generated at this point of development. As will be noted in a subsequent section, there are much bigger questions to answer on longer timescales!
If we simply focus on the similarities between the three 2.4 ky periods, then several observations stand out in Figure A.2.c:
1. While there is considerable similarity between the 2.4 ky periods, there are also important differences in timing, magnitudes and even basic behaviour. The cycles certainly do not repeat exactly. Therefore, on the scale of the long 2,402.2 year Charvatovan period, the Charvatovan hypothesis #1 ("sufficiently long" periods of similar SIM curves, would have similar solar activity curves) is only somewhat correct (keeping this analysis qualitative at this stage of the analysis).
2. Over the 2,402.2 year periods, there seems to be an increasing amplification of solar variability. As there don't "appear" to be obvious trends in the SIM curves to explain this, so the first assumption is that they may be due to an underlying period of internal solar activity, although it is of course possible that other factors external to the sun could drive the increasing instability of solar activity. This trend is discussed in more detail in "Sub-section 2.3 Implications for models of solar physics".
3. The Charvatovan hypothesis #1 does NOT work in a gross sense for the basic 178.7 year periods, but there may still be some applicability for the "mid to fine" structure of the 14C curves over the 2.4 ky periods, or for decades to centuries (relative movements), thereby preserving some of the SIM signal in the solar activity curve (this has yet to be verified).
4. Earlier attempts to classify periods of history by the behaviour of the proxy solar activity data were problematic (see [Howell 2007abc]), as it is difficult to define fuzzy descriptors for somewhat chaotic series. Even so, the simple 4-fuzzy-class system used in [Howell 2007] does seem to have at least some relevance to Figure A.2.c (in crude terms: smoothies, rocky roads, scorchers and freezers). With the time series shown in Figure A.2.c, descriptions are easier, especially in terms of intra-period progressions that are easily identifiable.
5. The coincidence of major "solar hibernations" towards the end of the 4,963.8 BC and 2,560.0 BC periods of 2.4 ky are quite suggestive for the near future of current solar activity and climate (remember that the timing of the period starting in 4,963.8 BC was arbitrarily shifted by time bending, so the very close apparent coincidence is illusory). Since ?2002?, a number of solar physicists have been warning of an imminent "solar hibernation" in cycle 24 or 25 based on very short term (recent decadal) predictors of various sorts. However, please note that only Charvatova seems to have correctly predicted cycle 23, and that historically models that work for a cycle or so have failed in subsequent cycles. In ~May 2007, most people who predict solar activity made projections for cycle 24, which is just starting. A year later, almost all of them are completely wrong (realizing that short term variations weren't really the objective, but still the errors are "astronomical", pun intended). In essence, there is a great deal of uncertainty.
In section ???, it was noted that comparison of the current disordered period with the corresponding SIM period of ??? would lead us to believe that a solar hibernation is NOT imminent. But the longer term perspective says the opposite, albeit with a +- 100 year or so uncertainty over timing. That is why the comment was made about "multiple conflicting hypothesis" arising from the same Charvatovan hypothesis. It is very important not to believe too strongly in any idea, and it will probably take decades to prove out the Charvatovan hypothesis or other theories.
IntCal04 Radiocarbon dating calibration www.BillHowell.ca Page 15 of 36
To the extent that one component of solar activity is sunspot activity, another x-ray, and yet another total irradiance, coronal mass ejections and so on, and knowing that the components., we must keep in mind that 14C cannot fully characterize solar activity, and therefore neither can it fully characterize all solar-driven or solar-affected processes. For example, non-melanoma skin cancer in Australia correlates well with the UV portion of the solar spectrum which is highest approximately in phase with total solar irradiance [ref - Carter in Towoomba, Australia?]. However, cloud cover increases as overall solar activity decreases, as the helio-magnetosphere is generally lower, and more galactic/cosmic rays get through to the atmosphere and increase cloud cover.
While the results infer some kind of relationship between SIM and solar activity, as noted at the beginning of the Introductory section, this does not necessarily imply a direct causal relationship. A phase synchronization relationship is another possibility. The physical mechanism(s) of interaction are also not elucidated by the results, although gravitation effects such as tidal-like motions in the sun, and geomagnetic effects may be involved singly or in combinations.
Furthermore, perhaps in the future a great deal more can be gleaned from the IntCal04 calibration curve:
● longer term trends in solar activity - as opposed to the decal to centennial scale variations dealt wth in this paper. There is no reason to believe that solar activity variations don't occur over all time scales, and one might interpret the 10Be variations over 200 ky as being indicative of such changes [Veizer ?date?], and therefore being a major cause of glaciations. See also Christl, M., A. Mangini, S. Holzka¨mper, and C. Spo¨ tl (2004), Evidence for a link between the flux of galactic cosmic rays and Earth’s climate during the past 200,000 years, J. Atmos. Sol. Terr. Phys., 66(3), 313– 322.
● longer-term trends with geomagnetic, galactic ray, and "internal" solar processes, by subtracting an estimate of the short-term (< 1,000 years) solar activity ;
● Pre-cambrian geological varve (mud-layer) data has already been used by [Eric Wan ?2002?] for training a model that could handle modern sunspot data. Thus, Charvatova's model may allow accurate estimates of solar activity and climate trends etc in the past based on general planetary motion, and conversely, ancient data may be used to calibrate astronomical models!!
● Perhaps the Chavatovan theory will provide another "quasi-absolute" time-scale to help better calibrate 14C dating. Perhaps this could extend the accuracy down towards +- 1 year, especially by utiising long series of annual data to provide a "signature that fits only one portion of the radiocarbon graph in the vicinity of the dating.
No doubt the approach described here of "folding and bending" the radiocarbon dating calibration curve has been attempted many times before. Spectral analysis results provide some confirmation of a 2,400 year cycle [Vasiliev, Dergachev 2002], but previous results showing the super-position of the actual calibration data have not yet been obtained by the present author. I suspect there will be several papers from decades ago that show this period. Certainly there are many studies that have yielded a 1,500 year cycle, as described by (see [Singer 2007] for many climate datasets, references, ???). The latter reference notes that ?? initially obtained a 2,400 y cycle, that was later corrected to 1,500 y. (?Is there something wrong with the new toolsets for spectral analysis?).
In summary, results so far do not provide accurate modelling of long-term (7 ky) 14C calibration data. There certainly appears to be a degree of similarity between all three of the 2,402.2 year cycles, but the
IntCal04 Radiocarbon dating calibration www.BillHowell.ca Page 16 of 36
"time chopping" operation is of course anomalous. Still, there is a great deal of room to improve on these initial and very approximate results.
2.2 Breaking the illusion of regular astronomical cycles - Yet again
In spite of the nice visual correlation of the "time folding rearrangement" of the 3 most recent Charvatovan 2.4 ky "quasi-cycles" of the radiocarbon calibration data, it turns out that this does NOT extend into the past, as can easily be seen by looking at the full radiocarbon dating curves in Figure 4. The entire InterCal 2004 radiocarbon calibration curve is plotted using a 6 ky "quasi-cycle" in Figure 4.
Very casually, by inspection, thee seems to by a ~6 ky cycle to the data, and
By inspection of Figure ??, it seems that we are about to enter the transition into a new 6 ky period, with the potential for very large changes in the "behaviour" of the radiocarbon curve, and hence presumably of solar activity as well. In spite of that, the fit is surprisingly good (to me, anyways).
2.3 Implications for models of solar physics
selecting between alternatives as in [Charbonneau ?year?].
3. Solar inertial motions and climate on the millenial scale
This section applies the Charvatovan hypothesis for solar activity to climate modelling. But before proceeding with this line of reasoning, it is appropriate to clarify the context given that the vast majority of scientists have been very strong adherents, and often proponents, of the:
Kyoto Premise - that anthropogenic Green House Gases (GHGs) [have, are, will have] a catastrophic impact on the climate, ergo the environment, ergo mankind.
3.1 A basis for climate modelling that ignores CO2 variability above 40-60 ppm
In order to understand the context of this section, it is important to understand that the current author has never subscribed to the "Kyoto Premise" - that anthropogenic Green House Gases [have, are, will have] a catastrophic impact on the environment, ergo the climate, ergo mankind. Instead, it seems that all climate models that work over time periods exceeding the "General Circulation Models"
IntCal04 Radiocarbon dating calibration www.BillHowell.ca Page 17 of 36
applicability of perhaps 10 days to several weeks (they are essentially weather predictors, and have massively failed on the scale of less than a decade), must account for the sun and astronomy first and foremost.
POSTULATE: The Climate postulate underlying this paper, is that to a very good first approximation:
1. There is one and only one PRIMARY DRIVER of climate and climate change - the sun and the variability of its output (irradiance of various sorts, helio-magnetic field, coronal mass ejections, X-Rays etc, etc). How much of the solar variability is due to processes internal to the sun versus the influence of external "mediators" (described below) is unknown.
2. MEDIATORS significantly affect the level, timing and distribution of solar insolation reaching all regions of Earth. In this context, "significant" is taken in the sense of identifying the major factors influencing solar insolation. It does NOT imply that one can discern a statistically significant signal of a factor in solar insolation values on Earth, no matter how minor that may be. Generally, mediators will have a strong "non-passive" signal in the climate record. In this author's opinion, this (non-comprehensive) list includes Solar Inertial Motion (SIM), galactic rays, Earth orbitals and axis [obliquity / precession], geomagnetic index as "active factors", and cloud and ice cover. as "intermediate variables". However, the list is not necessarily exhaustive nor rigorous. The expression "active factor" implies that there is some degree of independence in the behaviour of the variable. Note that some of the "active factors" may also be "intermediate variables, as they might have dependencies on other (or secondary etc) mediators.
3. CLIMATE RESERVOIRS, notably the ocean and glaciers, may modulate climate changes for thousands to tens of thousands of years. They both also have a clear signal on regional climate over years and decades.
4. INDICATOR variables are mostly considered to be the result of climate or solar activity variability, rather than to be a driver of climate change although their variability may have a minor effect. However, small drivers that do not rank as significant are also lassified in this group. In no particular order, the "indicator variables" include Green House Gases (GHGs - essentially the result of water vapour, as CO2 is relatively insignificant in spite of its current popularity), particulates (volcanoes, anthropogenic etc), and many other variables.
5. The FAILURE of the "Kyoto Premise" - which is the presumption that anthropogenic Green House Gases (GHGs) [have, are, will have] a catastrophic impact on the climate, ergo the environment, ergo mankind. Clearly this runs counter to the strong and long-established beliefs of the vast majority of scientists, so to re-emphasize this point:
Data at all timescales less than a few million years suggest that CO2 is essentially a time-lagged, fuzzy thermometer. It is not a significant driver of climate, and the failures of the "Kyoto Premise" theory across its entire "rational" are well documented. To cite only a few examples of key failures of the CO2 theme: CO2 as the dominant GHG (it's certainly not), the "hockey stick" graphs of temperature and CO2 (thrown out, and about to be thrown out, respectively), the ice-core inverted cause-and-effect (T drive CO2, high CO2 levels during interglacials were apparently thrown out), and the failure of the General Circulation Models to model the past, let alone predict any further than a few weeks into the future (omissions or down-tuned major parameters, as well as up-tuned CO2 factors are legion in these models).
A very recent paper by [Chilingar, Khilyuk, Sorokhtin Jan08] , suggests that a doubling of CO2 would result in an insignificant 0.01°C global temperature rise, whereas "large
IntCal04 Radiocarbon dating calibration www.BillHowell.ca Page 18 of 36
increases" (eg a CO2 dominant atmosphere) would result in a DECREASE in global temperatures! This is due to the dominant effect of convection, over diffusion and radiation. Although the paper is new and debate will be played out over some time, in the current author's view, in spite of some gaps and approximations, it is alreay better formulated than any "CO2 GHG effect" paper that I have read (among many for example, many ascribe the H2O GHG effect to CO2 without even realizing it).
INSERT graph of ??? - global T at high [CO2]
The "Kyoto Premise" theory is much more a belief system of scientists than any kind of rational construct.
As will be discussed in more detail in subsection 3.4, [Perry ???] shows that regional climates on the decades-to-centuries scale are well described by only 4 time-lag adjusted variables (the first four below) to which I have added glaciation:
1. total solar irradiance (which I will modify to "top-of-the-clouds" solar insolation)2. galactic cosmic rays3. geomagnetic index4. ocean currents 5. glaciation
However , this paper only really includes:1. total solar irradiance (insolation via astronomical movements is NOT included in this paper -
see my previous papers on glaciation and Holocene climate which hopefully will be integrated at some future time)
2. geomagnetic index (confounded with solar activity in the isotopic data)The other variables are essentially taken as constants.
Whereas for estimating solar activity over time, attempts were made to remove the geomagnetic component from the 14C and 10Be series, for the purposes of climate we will want to "add back" the geomagnetic variations, but perhaps not to the same extent as the solar signal. One reason for this is that galactic-ray induced clouds appear to be a key climate modifier, and both geomagnetics and solar activity will have an effect. Keep in mind that each of those factors will influence many other climate affecting variables in addition to the galactic ray / cloud effect.
Note that in spite of the comments regarding the failure of the "Kyoto Premise", the current author's stylistic approach is to maintain "multiple conflicting hypothesis" even where these cannot be substantiated or even where they have been substantially discredited. As noted earlier in this paper, the intent is to avoid a myopic focus on favoured theories, and to potentially benefit from usable aspects of any theory, irrespective of whether it is favoured or not. This is especially important with complex systems, or those that have not been thoroughly characterized or understood., which certainly describes climate change. It is the diversity of the collection of hypothesis that is important.
As such, it is expected that the Postulate stated above is only one of very many that should be retained and considered, including the "Kyoto Premise" itself, even though the current author believes that the Kyoto Premise is contradicted by data on all fronts.
IntCal04 Radiocarbon dating calibration www.BillHowell.ca Page 19 of 36
3.2 Extension of Charvatovan "SIM matching of periods" to other solar-related processes, such as climateClimate is the results of many variables and processes, of which solar activity is only one, albeit THE dominant one (more of this in sub-section 3.2). A great deal of work over centuries (perhaps thousands of years if one considers the work of ancients, and the extent to which they studied what was, for many ancient societies, the dominant god or one of the top gods) has linked solar activity and other astronomical processes to climate, agriculture, flooding etc. So perhaps it is natural to progress:
From: Solar Inertial Motions (SIM) -> model/predict -> solar activity; To : solar activity -> model/predict -> climate.
Of course, each step above involves many other variables and processes. For most climate modeling/ prediction, and for ultimate comprehensive understanding, this multi-step, phenomenological approach may be most appropriate.
However, for systems " further downstream" from the sun (for example, solar activity -> climate -> history; or solar activity -> Pacific Decadal Oscillation -> global climate or fish stocks), we may decide that a multi-step phenomenological route lacks sufficient accuracy or understanding at each step, or that physics based models introduce too much error, too many biases, or are too immature to be reliable. In that case, it may be much better to simple input solar activity directly into a model of the "further downstream" process, together with inputs from the intermediate process (for example, well defined climate variables).
Likewise, different aspects of solar activity may each have a multitude of effects on many different process (Earth or elsewhere). Notable solar activity components include:
● frequency bands like IR, UV, X-Ray; particles in solar wind or Coronal Mass Ejections (CME); helio-magnetosphere; etc, etc
● Solar Inertial Motion (gravitation/ tidal pull; accelerations)Other astronomical processes that "mediate" solar activity include:
● Milankovic cycles: Earth orbital eccentricity/ tilt, axis obliquity/ precession; ● Possibly galactic ray variations due to varying supernova activity, and the exposure variations
due to motions of the solar system in the Milky Way.
Finally, in the sense of "Ockham's razor" whereby the simplest sufficient explanation is preferred, while it may be nice to have a complete phenomenological description of intermediate variables, a direct model of solar activity influence on another variable may be just as accurate, but far simpler and much easier to verify, and will therefore be preferable.
So while we may wish use both approaches to modeling, is is useful to clearly state the second, less obvious approach:
Charvatovan hypothesis #2 - When solar variability has a dominant or distinct influence on a system, then its effect on the system over a period of time might be estimated by matching the Solar Inertial Motion (SIM) during that period to another period for which the system behaviour is known.
IntCal04 Radiocarbon dating calibration www.BillHowell.ca Page 20 of 36
Climate is only one example where we can apply this approach. Note that the hypothesis must be realistic - for complex non-linear systems it may be very difficult or impossible to allocate the solar influence on a system that responds to many variables. Furthermore, when solar activity is not a dominant factor, by mixing several complicated forcing functions we will end up with a series that never repeats. In other words one may have to wait far longer than the data series for a pattern of interest to recur.
Section 2 makes it clear that SIM does NOT uniquely determine solar activity. Similarly, even if the solar activity over two "sufficiently long" periods is exactly the same, that does not mean that the climate would follow the same trends over the same time. Solar activity probably has has lag effects over many timescales [ref?], and we know that to be the case with climate as well. Examples of important "climate reservoirs" that cause important lag effects over decades to millenia are ocean currents and glaciation (see Section 3.1 below for well-known ocean current lags). Therefore, as an example, if we "time fold and bend" climate variables over 2,402.2 year periods as we have done to a solar activity proxy in Section 2, there is absolutely no guarantee that the initial state of the climate system at the start of each period bears any resemblance to its state at the beginning of other 2,402.2 year periods. This is because time lags on tens and hundreds of thousands of years occur with glaciations and interglacial periods, and shorter term time lags are also present.
Another BIG issue to consider are known Milankovic climate forcings - which may change considerably overa period of 7,000 years.
But are the starting points of each period "similar enough" for some climate modelling purposes, especially for the last 7 ky? Or do "relative changes" still reflect changes in solar activity? In other words, to what extent can the Charvatovan hypothesis for a similarity in 14C curves over time periods with similar SIM curves be extended to climate? That question is addressed in this section for two dominant climate systems.
Note that there is no attempt in this paper to address climate prior to 7 ky ago, as per the comments in section 2.2 regarding the limits of the current SIM-solar activity relationship. However, some comments on Holocene climate can be found in [Howell 2007abc], but that work is incomplete.
3.3 Holocene period temperature records
As mentioned in the last sub-section, note that a time period of 7,000 years, as covered by this analysis, implies significant changes in Milankovic-type climate forcing!!
IntCal04 Radiocarbon dating calibration www.BillHowell.ca Page 21 of 36
3.4 Time-lag shifted global average temperatures
The dominant basis for most recent climate-related papers has been the "anthropogenic Green-House Gas" (GHG) theory, which has enjoyed the support of the vast majority of scientists over the last 10 or 20 years. Modeling is typically carried out using very large General (or Global) Circulation Models (GCMs). While GCMs have been very successful at weather forecasting perhaps out to a far as six weeks, they have a log way to go before they can adequately model past climate, let alone provide reliable decade-long forecasts. This is well illustrated by the consistent and catastrophic failure of the UN IPCC forecasts over the last 10 to 20 years [references ...].
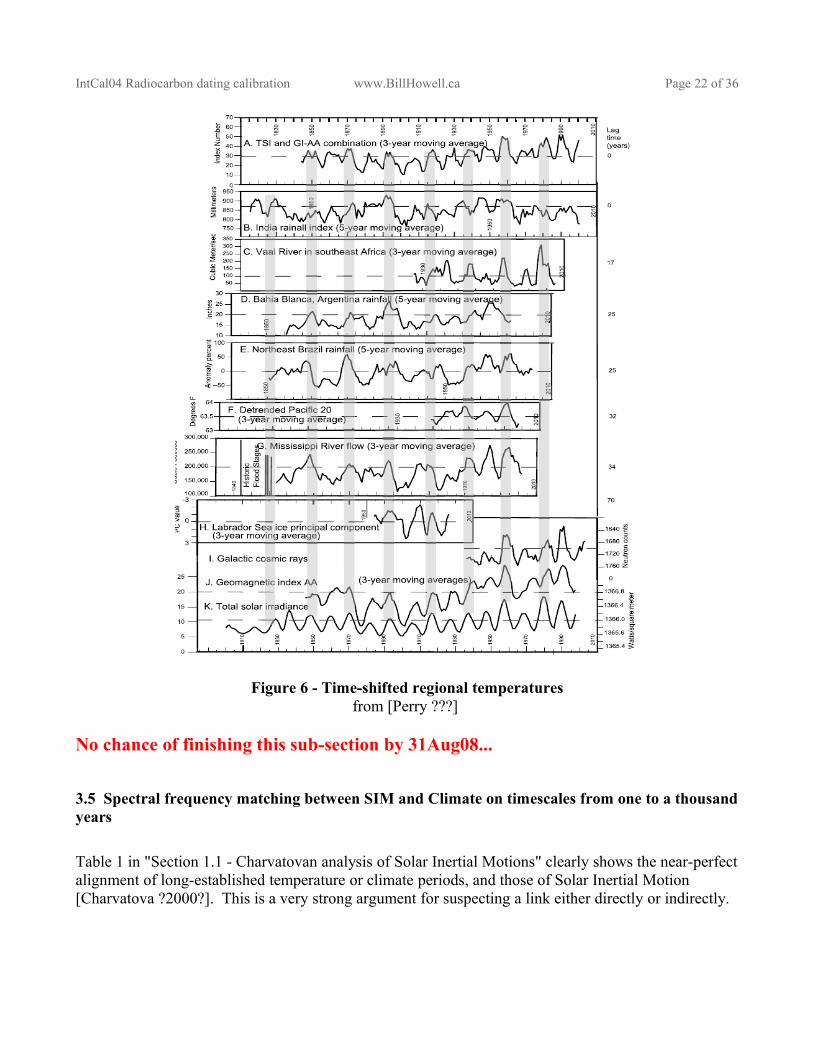
As described in sub-section 3.1, and illustrated in Figure 6, [Perry's ] shows that regional time-lag adjusted temperatures are well predicted by only 4 variables:
1. total solar irradiance 2. galactic cosmic rays3. geomagnetic index4. ocean currents
As a first step in illustrating point #1 above, by following the results of [Perry 2007] a different definition of temperature is adopted - that of "regional time lag adjusted average global temperature" (T_lag_avg). What one wishes to do with an average has a lot to do with how the average should defined, and to clearly illustrate the role of the sun, this very simple adjustment is used.
Temperature estimates from a variety of regional time series are shown in Figure ???. The results are ???.... [Howell to be seen, if I get that far in time...]
The proposed T_lag_avg is not a "physical quantity" like the normal global average temperature, and it is much more model-concept and parameter dependant. However, the intent here is to make the solar role more obvious, and to some extent the concept is well-illustrated by [Perry 2007], from whom the following illustration is taken. This is the best short term (decades to centuries) climate model that the current author is aware of, and it is similar to work by [Patterson etal ??], and [van der Merwe, Bailey etal ??].
IntCal04 Radiocarbon dating calibration www.BillHowell.ca Page 22 of 36
Figure 6 - Time-shifted regional temperaturesfrom [Perry ???]
No chance of finishing this sub-section by 31Aug08...
3.5 Spectral frequency matching between SIM and Climate on timescales from one to a thousand years
Table 1 in "Section 1.1 - Charvatovan analysis of Solar Inertial Motions" clearly shows the near-perfect alignment of long-established temperature or climate periods, and those of Solar Inertial Motion [Charvatova ?2000?]. This is a very strong argument for suspecting a link either directly or indirectly.
IntCal04 Radiocarbon dating calibration www.BillHowell.ca Page 23 of 36
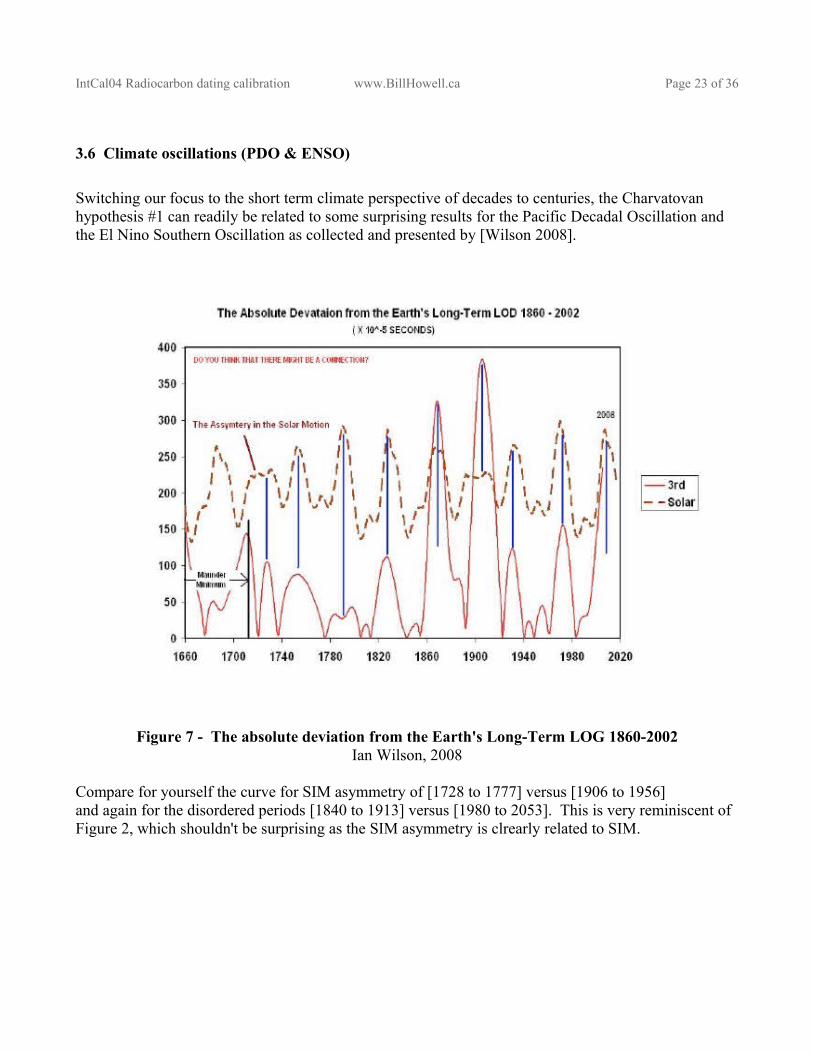
3.6 Climate oscillations (PDO & ENSO)
Switching our focus to the short term climate perspective of decades to centuries, the Charvatovan hypothesis #1 can readily be related to some surprising results for the Pacific Decadal Oscillation and the El Nino Southern Oscillation as collected and presented by [Wilson 2008].
Figure 7 - The absolute deviation from the Earth's Long-Term LOG 1860-2002Ian Wilson, 2008
Compare for yourself the curve for SIM asymmetry of [1728 to 1777] versus [1906 to 1956]and again for the disordered periods [1840 to 1913] versus [1980 to 2053]. This is very reminiscent of Figure 2, which shouldn't be surprising as the SIM asymmetry is clrearly related to SIM.
IntCal04 Radiocarbon dating calibration www.BillHowell.ca Page 24 of 36
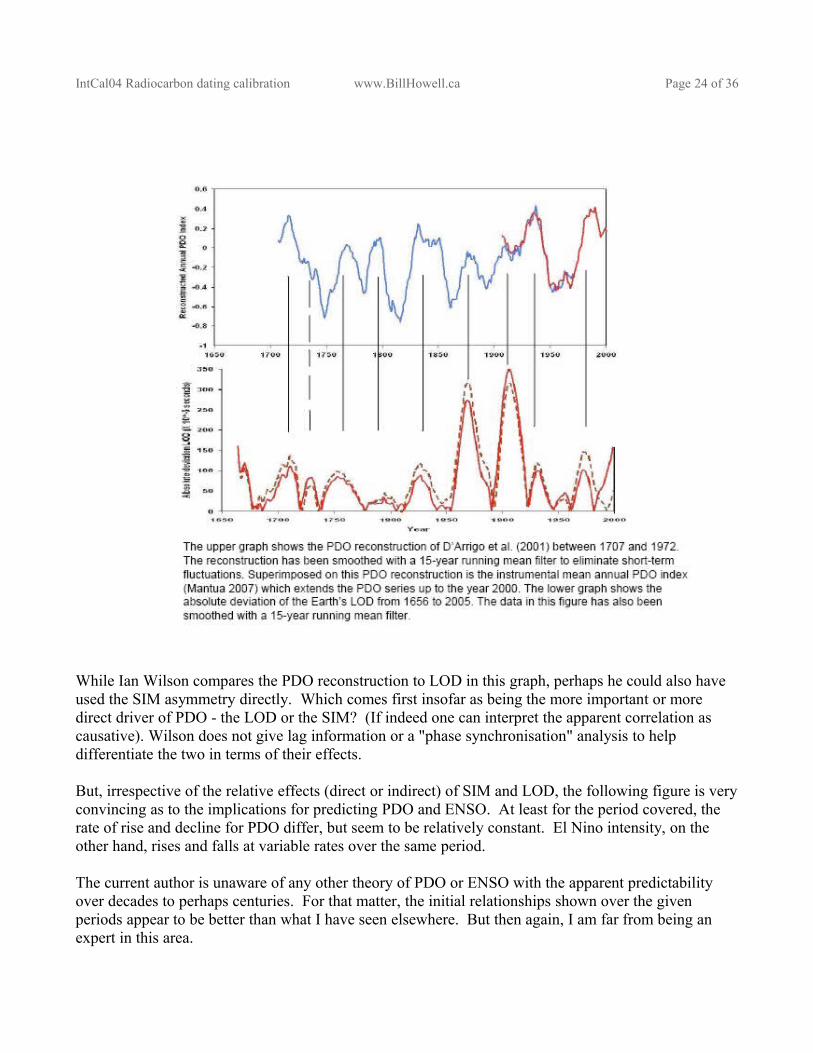
While Ian Wilson compares the PDO reconstruction to LOD in this graph, perhaps he could also have used the SIM asymmetry directly. Which comes first insofar as being the more important or more direct driver of PDO - the LOD or the SIM? (If indeed one can interpret the apparent correlation as causative). Wilson does not give lag information or a "phase synchronisation" analysis to help differentiate the two in terms of their effects.
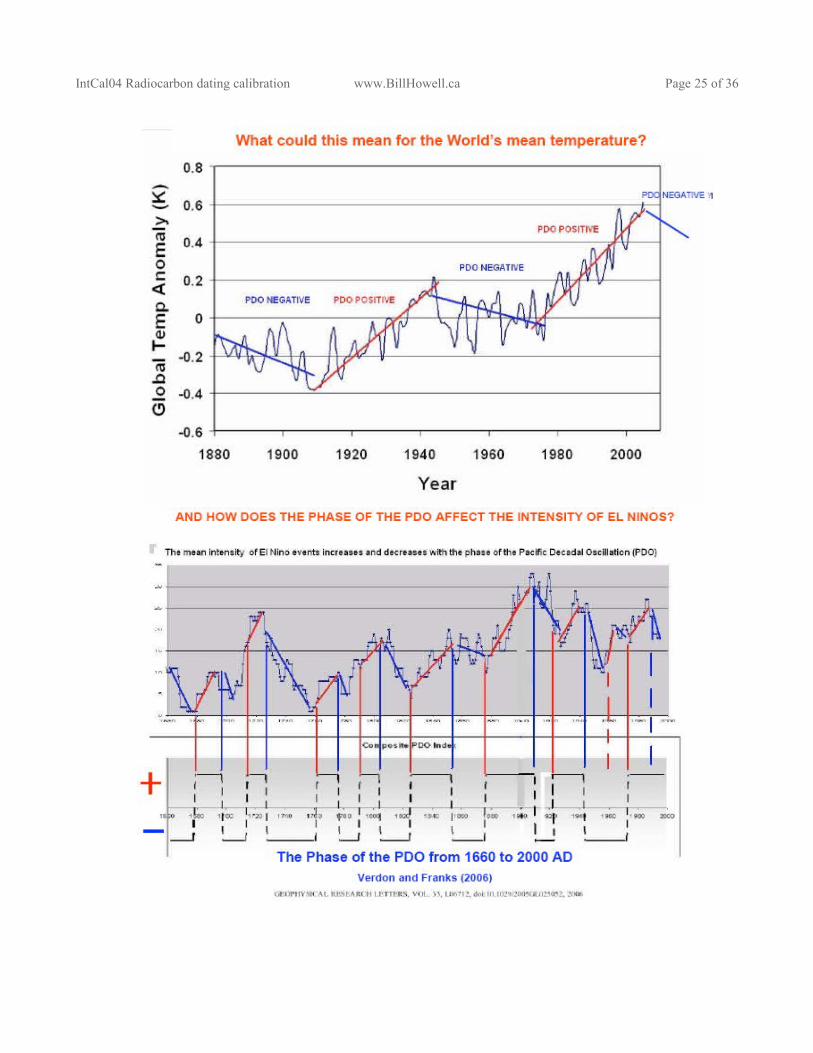
But, irrespective of the relative effects (direct or indirect) of SIM and LOD, the following figure is very convincing as to the implications for predicting PDO and ENSO. At least for the period covered, the rate of rise and decline for PDO differ, but seem to be relatively constant. El Nino intensity, on the other hand, rises and falls at variable rates over the same period.
The current author is unaware of any other theory of PDO or ENSO with the apparent predictability over decades to perhaps centuries. For that matter, the initial relationships shown over the given periods appear to be better than what I have seen elsewhere. But then again, I am far from being an expert in this area.
IntCal04 Radiocarbon dating calibration www.BillHowell.ca Page 25 of 36
IntCal04 Radiocarbon dating calibration www.BillHowell.ca Page 26 of 36
3.7 Battle of the climate cycles - 2,402.2 years versus 1,500 years, or both cycles plus others
Perhaps by now you expect my personal conclusion - retain them all, at the very least under the guise of "multiple conflicting hypothesis".
3.8 Climate forecast for the next 3,000 yearsTo the extent that the Postulate in subsection 3.1 may be correct (and it is at best only an approximation), and assuming that the Charvatovan SIM-solar acivty then a natural question is to what extent
Limit - accuracy of SIM calculations (Milankovic -> 40 or 50 My (Laskar))In spite of the
Forecast - should be regional, given divergence of local trends, and great differences in variances, precipitation changes, ocean currents and winds. BUT "on average", a global signal can be useful.
Approach - do a 2,402.2 year-long forecast, and take the first 200 years.
Fun comment - look at the end of Scenario #3. The "dive" in solar activity suggested by the 2.4 ky cycle is extreme, as compared to the relatively mild dip one might expect by comparing with SIM movements in the latter half of the 1800's. Don't get too excited by the timing (basically right now??) as its probably not so accurate...
4. Historical comparisons and implications
A major impetus for this paper is ongoing (and very incomplete) work on an analysis of history. There are several potential implications for the
1. better accuracy with radiocarbon dating -
2. detection of a "solar signal" in the course of history, however subtle. This includes the rise and fall of civilisations, the growth or decline of science, architecture, and the arts, and the onset of calamities (eg drought, famine, crop diseases and pests, pandemics, and war).
3. some forecasting ability - with implications for the future on timescales up to perhaps several thousand years. In the realm of climate change, this would be a huge improvement over the
IntCal04 Radiocarbon dating calibration www.BillHowell.ca Page 27 of 36
extremely poor modelling and forecasting available from state-of-the-art General Circulation Models (GCMs), which are essentially weather (not climate) models for up to 10 days or perhaps several weeks.
The work is not sufficiently advanced at this time to demonstrate whether or not "time folding and bending using Charvatova's hypothesis for solar activity" will really work, or help with the three points above. However, initial results are quite encouraging.
It is Point #2 "detection of a solar signal
5. Next steps
● critical assessment of potential errors and simplifications in the InterCal04 14C curves● search for "raw" 10Be" series underlying the work of [Usoskin etal ???] and [Beer 2008]. Data
processing may have affected the usable signal.● check for better similarity-matching of 178.7 year periods...● use of Tapping's relations for sunspots, F10.7, and total solar insolation● comparison of solar activity to ● towards a +- 1 year error in 14C dating by using fine-resolution 14C series over 200 years?● For climate, provide models for the other two major factors:○ geomagnetics○ cosmic rays (this may be very difficult for decades through millenial time scales
endsection
IntCal04 Radiocarbon dating calibration www.BillHowell.ca Page 28 of 36
References (what a mess - needs to be completed and rearranged!
1. http://www.billhowell.ca/Pandemics, health, and the Sun/_Pandemics, health, and the sun.html2. www.billhowell.ca/Climate and sun/Howell - Glaciation models for the last 6 million years.pdf3. Bill Howell 2007 "A Preliminary note on Holocene climate" 27pp www.billhowell.ca/Climate and sun/Howell 2007 -
A Preliminary note on Holocene climate.pdf4. Donna Howell, Neil Howell, Irene Howell, Bill Howell May07 "Howell - Mega-Life, Mega-Death and the Sun, the
rise and fall of civilisations.pdf" 73pp www.BillHowell.ca\Civilisations and sun\Howell - Mega-Life, Mega-Death and the Sun, the rise and fall of civilisations.pdf
5. Howell 2006 - Ring around the rosies6. William Neil Howell Jun08 draft "An Independent Verification of Ivanka Charvátová's Solar Inertial Motion (SIM)
Curves" (unpublished) 15Jun08 www.BillHowell.ca/Solar modeling and forecasting/Charvatova related files/Howell - solar inertial motion - NASA-JPL versus Charvatova.pdf
7. Douglas V. Hoyt, Kenneth H. Schatten "The role of the sun in climate change" Oxford University Press, Oxford UK, 1997, 279pp – superb background book
8. Willie W-H Soon, S.H. Yaskell "The Maunder Minimum and the variable sun-earth connection" World Scientific Publ, Signapore, 2003 278pp
9. Scherer, Veizer, Shaviv et.al. 2006 "Interstellar-Terrestrial relations: variable cosmic environemnts, the dynamic heliosphere, and their imprints on terrestrial archives and climate" Kluwer Academic Publishers, Netherlands, 2006 ~163pp. Space Science Reviews 127/1-4, 327-465.
10. Rhodes W. Fairbridge ?year? "The Solar Jerk, The King-Hele Cycle, and the Challenge to Climate Science" 21st Century Science and Technology Magazine
11. W J R Alexander, F Bailey, D B Bredenkamp, A van der Merwe and N Willemse 2007 "Linkages between solar activity, climate predictability and water resource development" Journal of the South African Institution of Civil Engineering, Volume 32 49 Number 2 June 2007
12. Ken Gregory Aug07 "Climate Change Science" http://members.shaw.ca/sch25/FOS/Climate_Change_Science.html13. Madhav L Khandekar "Questioning the Global Warming Science: An Annotated bibliography of recent peer-reviewed
papers" 32pp www.friendsofscience.org/documents/Madhav bibliography LONG VERSION Feb 6-07.pdf14. Arthur B. Robinson, Noah E. Robinson, Willie Soon 2007 "Environmental Effects of Increased Atmospheric Carbon
Dioxide" Journal of Amer ican Physi cians and Surgeons (2007) 12, 79-9015. John McLean "El Nino, El Nina shift in 1976, Ignoring a Natural Event to Blame Humans" October 200716. Steven R. Hare, Nathan J. Mantua 22Mar01 "An historical narrative on the Pacific Decadal Oscillation, interdecadal
climate variability and ecosystem impacts" 20th NE Pacific Pink and Chum workshop. Seattle, WA, 22 March 2001 www.iphc.washington.edu/Staff/hare/html/papers/pcworkshop/pcworkshop.pdf
17. Joe D'Aleo 28Apr08 "Relationship of the PDO to El Nino and La Nina Frequency: EL NINO dominance since the late 1970s explained" Universal Time www.intellicast.com/Community/Content.aspx?a=126
18. Ian Wilson Jul08 "Which came first: The chicken or the egg? (Length of Day & PDO, NAO)" lecture to the Lavoisier Group
19. Debret etal 2007 "The origin of the 1500-year climate cycles in Holocene North-Atlantic records" Clim. Past, 3, 569-575, 2007 www.clim-past.net/3/569/2007/
20. A.D. Crouch, P. Charbonneau, G. Beaubien, and D. Paquin-Ricard 2007 "A Physical Model For The Total Solar Irradiance" Département de Physique, Université de Montréal, Astrophysical Journal ?2008?
21. Paul Charbonneau 2002 "The rise and fall of the first sunspot model" JHA xxxiii Science History Publications Ltd. - Provided by the NASA Astrophysics data system
22. Ivanka Charvátová "The solar motion and the variability of solar activity" Adv. Space Res., 8, (7) 147-150, 1988.23. Ivanka Charvátová, Jaroslav Strestik 2004 "Periodicities between 6 and 16 years in surface air temperature in possible
relation to solar inertial motion" Journal of Atmospheric and Solar-Terrestrial Physics 66 (2004) pp219-22724. Ivanka Charvátová 1989 "On the relation between Solar motion and solar activity in the years 1730-80 and 1910-60
AD" Bull. Astron. Inst. Czechosl. 41 (1990), 200-20425. I. Charvátová 1990 "The relations between solar motion and solar variability" Bulletin Astonomical Institure of
Cechoslovakia v41 (1990) pp56-5926. Paluš, M., Kurths, J., Schwarz, U., Seehafer, N., Novotná, D. and Charvátová, I., 2007 The solar activity cycle is
weakly synchronized with the solar inertial motion, Physics Letters A, 365, 421-428, doi: 10.1016/j.physleta.
IntCal04 Radiocarbon dating calibration www.BillHowell.ca Page 29 of 36
2007.01.039.27. I. Charvátová Nov08 "Long-term predictive assessments of solar and geomagnetic activities made on the basis of the
close similarity between the solar inertial motions in the intervals 1840-1905 and 1980-2045" New Astron. (2008), doi:10.1016/j.newast.2008.04.005
28. J. Richard Fisher 2000 "Glish Client for Computing Positions of Planets, Pulsar Pulse Delays, LST, Precession, Nutation and Aberration" http://www.cv.nrao.edu/~rfisher/Glish/solar_system.html
29. Richard Fisher 1997 "Description of JPL Solar System Ephemeris" http://www.cv.nrao.edu/~rfisher/Ephemerides/ephem_descr.html ftp://ssd.jpl.nasa.gov/pub/eph/export
30. E.M. Standish 2006 "JPL Planetary Ephemeris DE414" ftp://ssd.jpl.nasa.gov/pub/eph/export/DE414/de414iom.pdf31. ftp://ssd.jpl.nasa.gov/pub/eph/export/ascii/32. Marc Buie 2003 "GETEPH" http://www.lowell.edu/~buie/idl/geteph.html33. Steve Moshier 2004 "DE118i.ARC - N-body numerical integration of the Sun, Earth, Moon, and planets"
http://www.moshier.net/ssystem.html34. http://www.alcyone-ephemeris.info/35. Theodor Landscheidt "Solar System Barycenter Ephemeris - Jon Giorgini of JPL calcs"
http://landscheidt.auditblogs.com/6000-year-ephemeris36. http://www.orbitsimulator.com/gravity/articles/what.html 37. Jon Giorgini ?date? "Sun-barycenter movements effect on the Earth-sun distance" NASA JPL Ephemeris data by
Horizons On-Line Ephemeris System, [email protected] http://ssd.jpl.nasa.gov/ 38. Timo Niroma "One possible explanation for the cyclicity in the Sun" http://personal.inet.fi/tiede/tilmari/sunspots.html39. Ivanka Charvátová 2000 "Can origin of the 2400-year cycle of solar activity be caused by solar inertial motion?" Ann.
Geophysicae 18, 399±405 (2000) EGS ± Springer-Verlag 200040. Milan Palu, Jürgen Kurths, Udo Schwarz, Norbert Seehafer, Dagmar Novotná, Ivanka Charvátová 2007 "The solar
activity cycle is weakly synchronized with the solar inertial motion" Physics Letters A 365 (2007) 421-42841. K. Scherer, J. Beer, T. Borrmann, L. Desorgher, E. Fluckiger, H.-J. Fahr, S.E.S. Ferreira, U.W. Langner, M.S.
Potgieter, B. Heber, J. Masarik, N. Shaviv, J. Veizer. 2006 "Interstellar-Terrestrial relations: variable cosmic environments, the dynamic heliosphere, and their imprints on terrestrial archives and climate" Kluwer Academic Publishers, Netherlands, 2006 ~163pp
42. Charles A. Perry 2007 "Evidence for a physical linkage between galactic cosmic rays and regional climate time series" Advances in Space Research, Volume 40, Issue 3, 2007, Pages 353-364
43. Peter Huybers, Eli Tziperman 2007 in press "Integrated summer insolation forcing and 40,000 year glacial cycles: the perspective from an icesheet & energy-balance model" draft Feb07, Paleoceanography, VOL. , XXXX, DOI:10.1029/
44. William Herschel (1801). “Observations Tending to Investigate the Nature of the Sun, in Order to Find the Causes and Symptoms of its Variable Emission of Light and Heat ...” Philosophical Transactions of the Royal Society of London vol91, pp. 261-331.
45. S.S. Vasiliev, V.A. Dergachev 2002 "The ~2400-year cycle in atmospheric radiocarbon concentration: bispectrum of 14C data over the last 8000 years" Annales Geophysicae (2002) 20: 115-120 European Geophysical Society
46. Willie Soon 2007 "Implications of the secondary role of carbon dioxide and methane forcing in climate change: past, present, and future" Physical Geography, 2007 v28n2 pp97-125
47. D. Koutsoyiannis, N. Mamassis, A. Christofides, A. Efstratiadis, S.M. Papalexiou Apr08 "Assessment of the reliability of climate predictions based on comparisons with historical time series" European Geosciences Union General Assembly 2008, Vienna, Austria, 13-18 April 2008, Session IS23: Climatic and hydrological perspectives on long-term changes
48. G.V. Chilingar, L.F. Khilyuk, O.G. Sorokhtin Jan08 "Cooling of atmosphere due to CO2 emission" Energy Sources, Part A: Recovery, Utilisation, and Environmental Effects, v30 i1 Jan08, p1-9 Authors 1,2 - Rudolph W. Gunnerman Energy & Environment Laboratory, Uof S. California, 3 - Inst of Oceanology of Russian Academy of Sciences, Moscow
49. Paula J Reimer et.al. 2004 "IntCal04: Calibration Issue" Radiocarbon, Volume 46, nr 3, 2004, Updated 30 June 2006 http://www.radiocarbon.org/IntCal04%20files/intcal04.14c
50. Anne-Elisabeth Lebatard etal 04Mar08 "Cosmogenic nuclide dating of Sahelanthropus tchadensis and Australopithecus bahrelghazali: Mio-Pliocene hominids from Chad" Proc Natl Acad Sci U S A. 2008 March 4; 105(9): 3226–3231. doi: 10.1073/pnas.0708015105. PMCID: PMC2265126 http://www.pubmedcentral.nih.gov/articlerender.fcgi?artid=2265126
51. David Jamieson, Andrew Jamieson Jul06 "Physics: Time and Archaeology" 2006 July Lecture in Physics, University of Melbourne, http://www.pnas.org/cgi/content/full/105/9/3226
52. Kerry Cupit 01Apr08 "Surface exposure cosmogenic nuclide dating" Simon Fraser University
IntCal04 Radiocarbon dating calibration www.BillHowell.ca Page 30 of 36
www.spaceman.ca/downloads/KCupit_CosmogenicDating.pdf53. F. Steinhilber, J. A. Abreu, and J. Beer 05Feb08 "Solar modulation during the Holocene" Astrophys. Space Sci.
Trans., 4, 1-6, 2008 www.eawag.ch/organisation/abteilungen/surf/publikationen/2008_steinhilber54. EPICA 800 ky deuterium Temperature estimates, World Data Center for Paleoclimatology, Boulder
www.swivel.com/data_sets/show/101592855.
Radiocarbon dating calibration www.BillHowell.ca Page 31 of 36
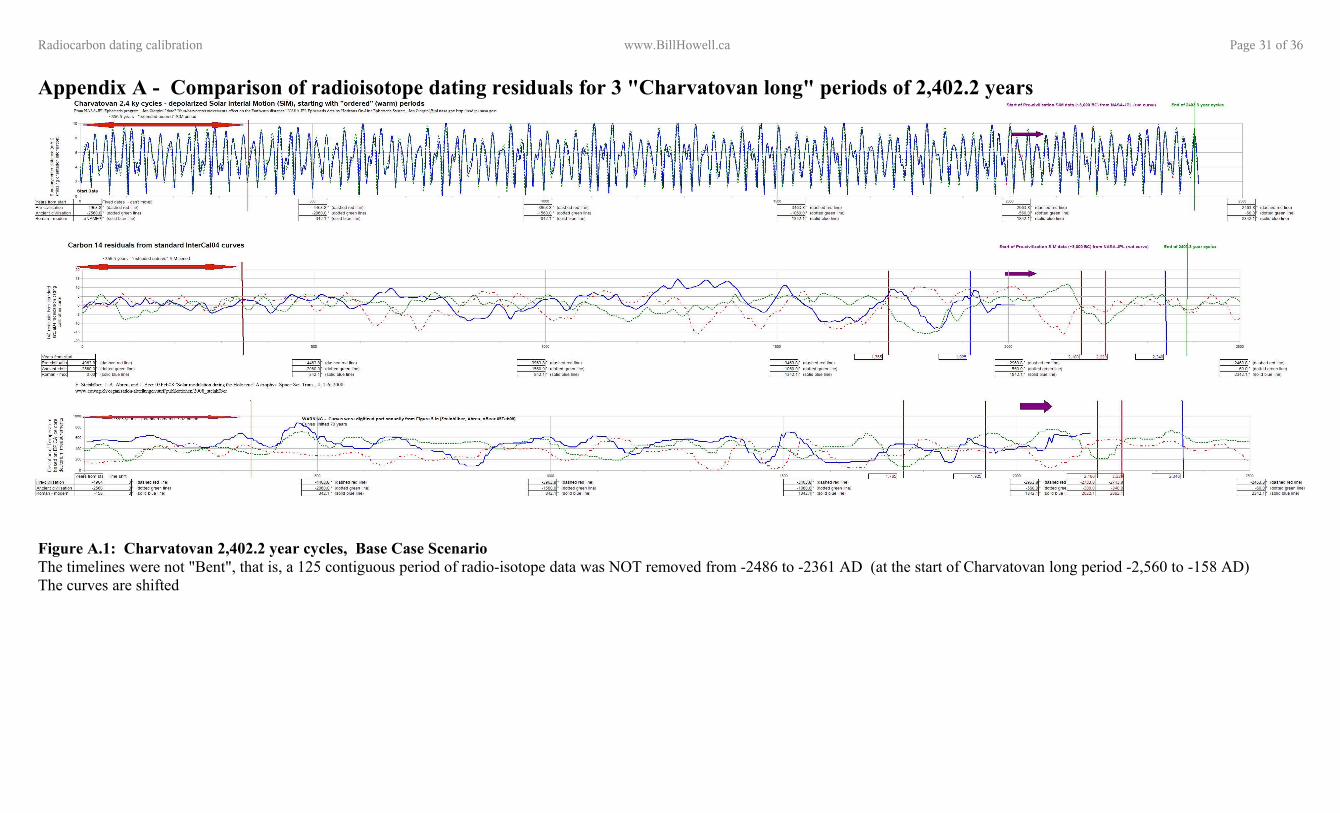
Appendix A - Comparison of radioisotope dating residuals for 3 "Charvatovan long" periods of 2,402.2 years
Figure A.1: Charvatovan 2,402.2 year cycles, Base Case ScenarioThe timelines were not "Bent", that is, a 125 contiguous period of radio-isotope data was NOT removed from -2486 to -2361 AD (at the start of Charvatovan long period -2,560 to -158 AD)The curves are shifted
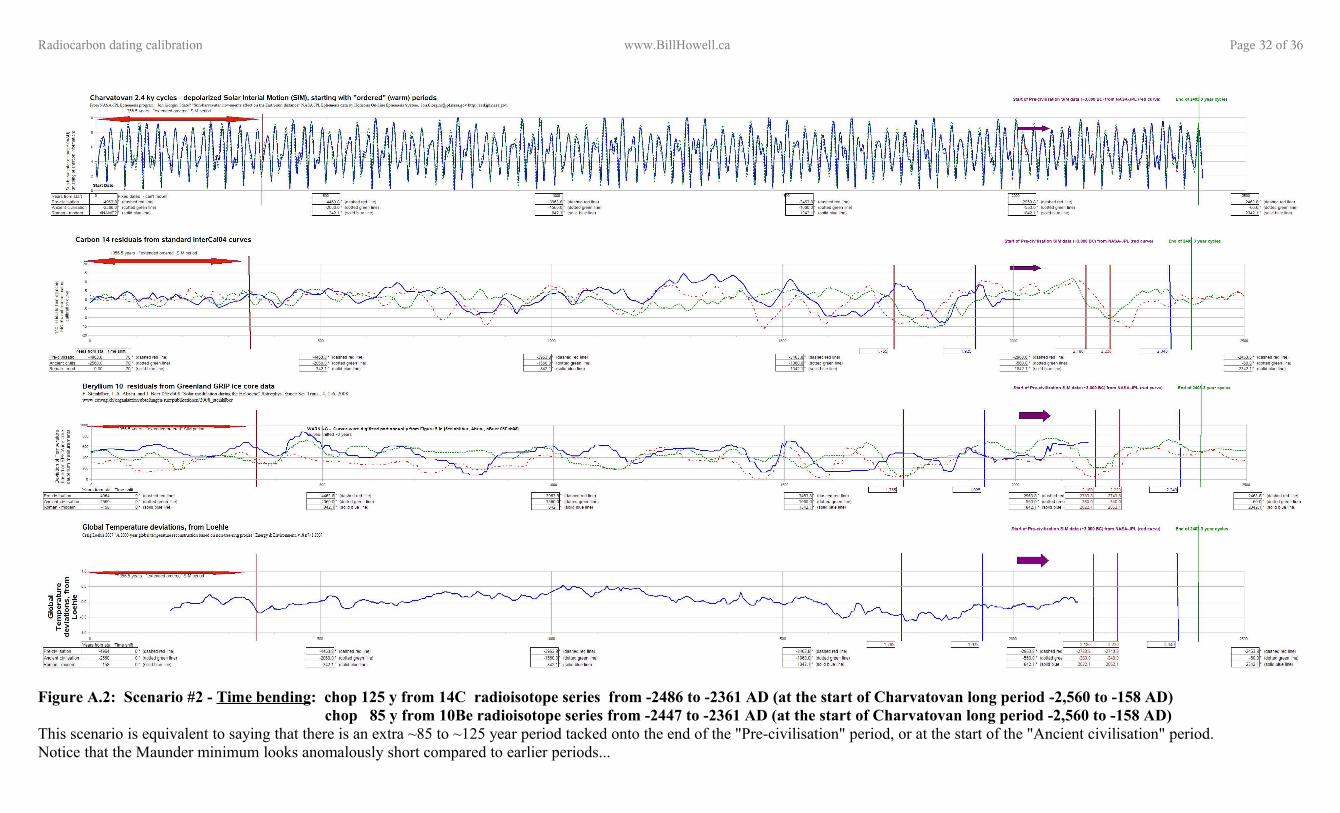
Radiocarbon dating calibration www.BillHowell.ca Page 32 of 36
Figure A.2: Scenario #2 - Time bending: chop 125 y from 14C radioisotope series from -2486 to -2361 AD (at the start of Charvatovan long period -2,560 to -158 AD) chop 85 y from 10Be radioisotope series from -2447 to -2361 AD (at the start of Charvatovan long period -2,560 to -158 AD)
This scenario is equivalent to saying that there is an extra ~85 to ~125 year period tacked onto the end of the "Pre-civilisation" period, or at the start of the "Ancient civilisation" period.Notice that the Maunder minimum looks anomalously short compared to earlier periods...
Radiocarbon dating calibration www.BillHowell.ca Page 33 of 36
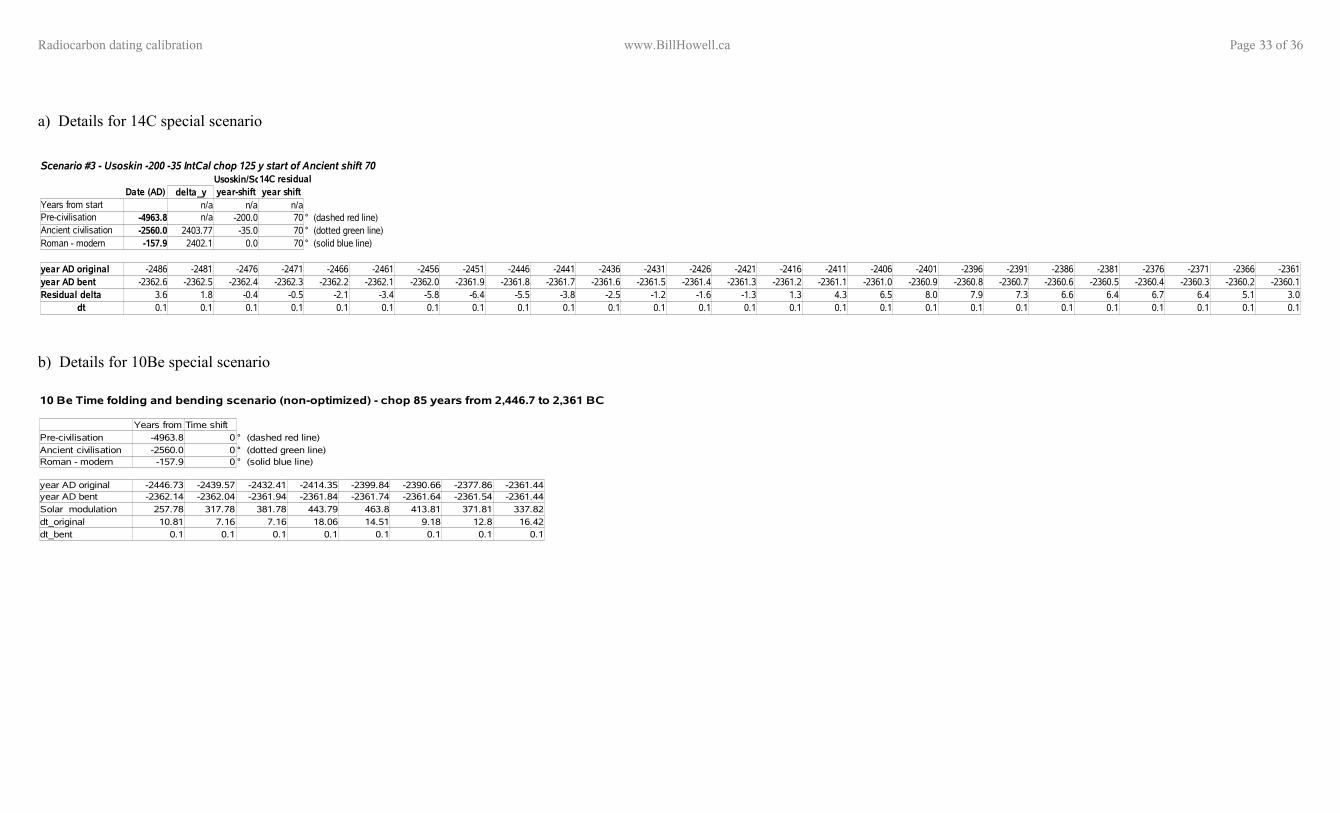
a) Details for 14C special scenario
b) Details for 10Be special scenario
14C residualDate (AD) year-shift year shift
Years from start-4963.8 -200.0 70 ° (dashed red line)-2560.0 2403.77 -35.0 70 ° (dotted green line)
Roman - modern -157.9 2402.1 0.0 70 ° (solid blue line)
year AD original -2486 -2481 -2476 -2471 -2466 -2461 -2456 -2451 -2446 -2441 -2436 -2431 -2426 -2421 -2416 -2411 -2406 -2401 -2396 -2391 -2386 -2381 -2376 -2371 -2366 -2361year AD bent -2362.6 -2362.5 -2362.4 -2362.3 -2362.2 -2362.1 -2362.0 -2361.9 -2361.8 -2361.7 -2361.6 -2361.5 -2361.4 -2361.3 -2361.2 -2361.1 -2361.0 -2360.9 -2360.8 -2360.7 -2360.6 -2360.5 -2360.4 -2360.3 -2360.2 -2360.1Residual delta 3.6 1.8 -0.4 -0.5 -2.1 -3.4 -5.8 -6.4 -5.5 -3.8 -2.5 -1.2 -1.6 -1.3 1.3 4.3 6.5 8.0 7.9 7.3 6.6 6.4 6.7 6.4 5.1 3.0
0.1 0.1 0.1 0.1 0.1 0.1 0.1 0.1 0.1 0.1 0.1 0.1 0.1 0.1 0.1 0.1 0.1 0.1 0.1 0.1 0.1 0.1 0.1 0.1 0.1 0.1
Scenario #3 - Usoskin -200 -35 IntCal chop 125 y start of Ancient shift 70Usoskin/Solanki
delta_yn/a n/a n/a
Pre-civilisation n/aAncient civilisation
dt
10 Be Time folding and bending scenario (non-optimized) - chop 85 years from 2,446.7 to 2,361 BC
Years from startTime shift-4963.8 0 ° (dashed red line)-2560.0 0 ° (dotted green line)
Roman - modern -157.9 0 ° (solid blue line)
year AD original -2446.73 -2439.57 -2432.41 -2414.35 -2399.84 -2390.66 -2377.86 -2361.44year AD bent -2362.14 -2362.04 -2361.94 -2361.84 -2361.74 -2361.64 -2361.54 -2361.44Solar modulation 257.78 317.78 381.78 443.79 463.8 413.81 371.81 337.82
10.81 7.16 7.16 18.06 14.51 9.18 12.8 16.420.1 0.1 0.1 0.1 0.1 0.1 0.1 0.1
Pre-civilisationAncient civilisation
dt_originaldt_bent
Radiocarbon dating calibration www.BillHowell.ca Page 34 of 36
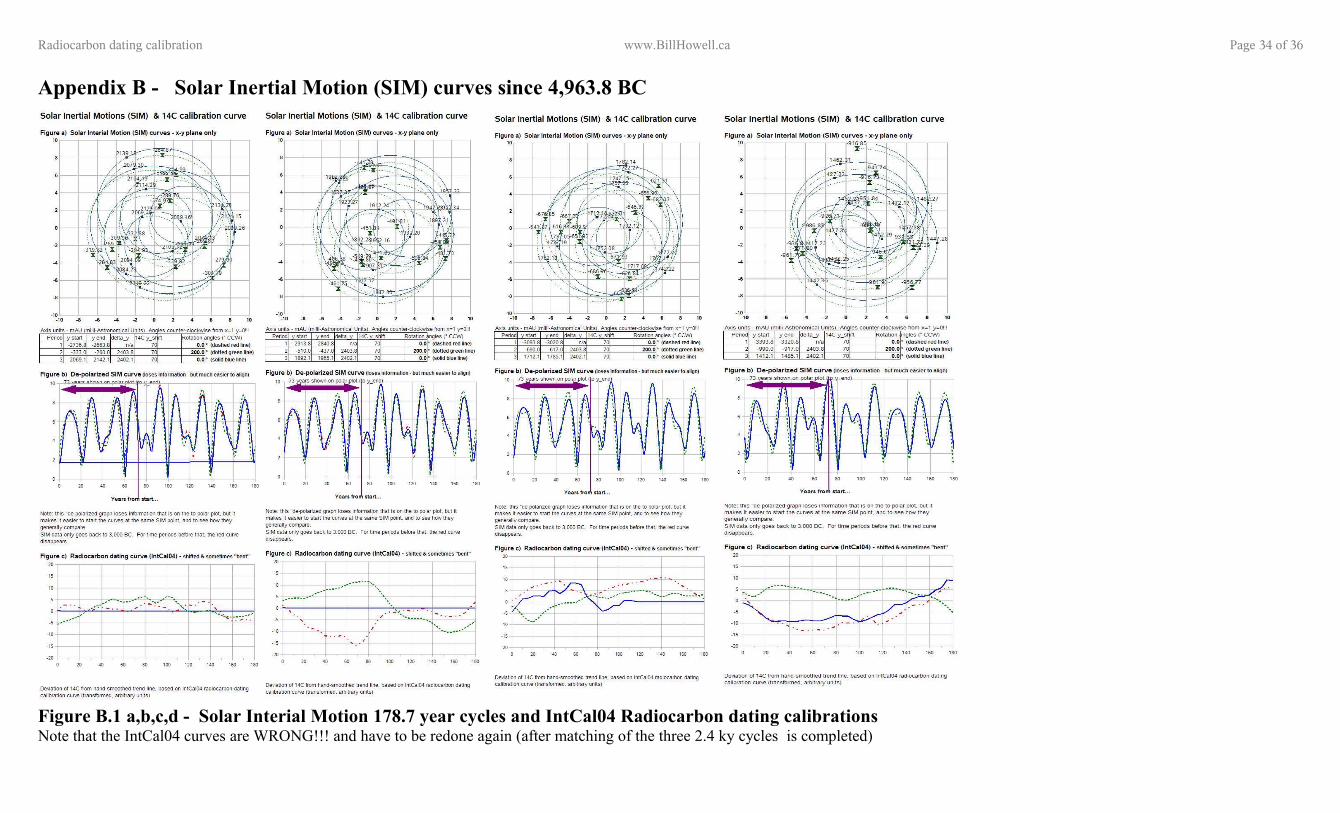
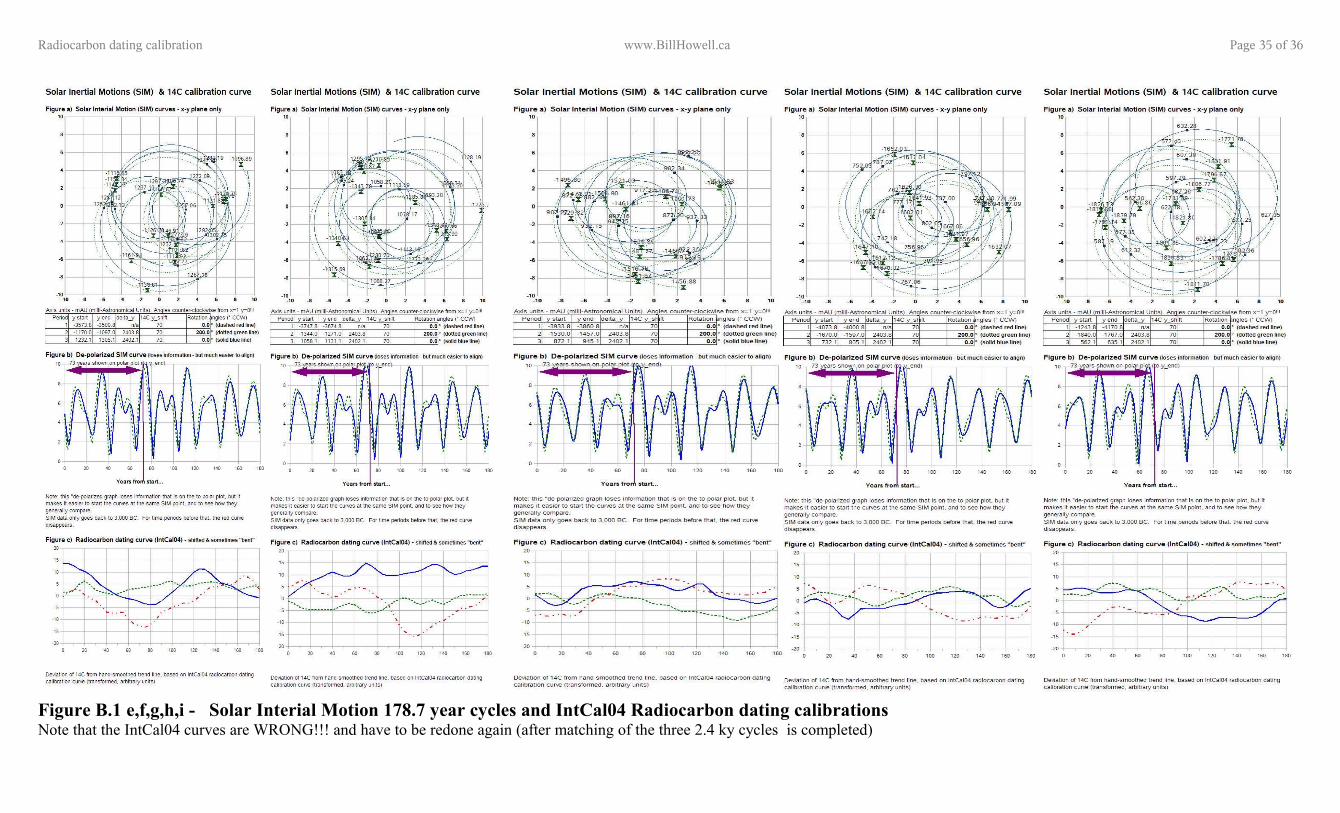
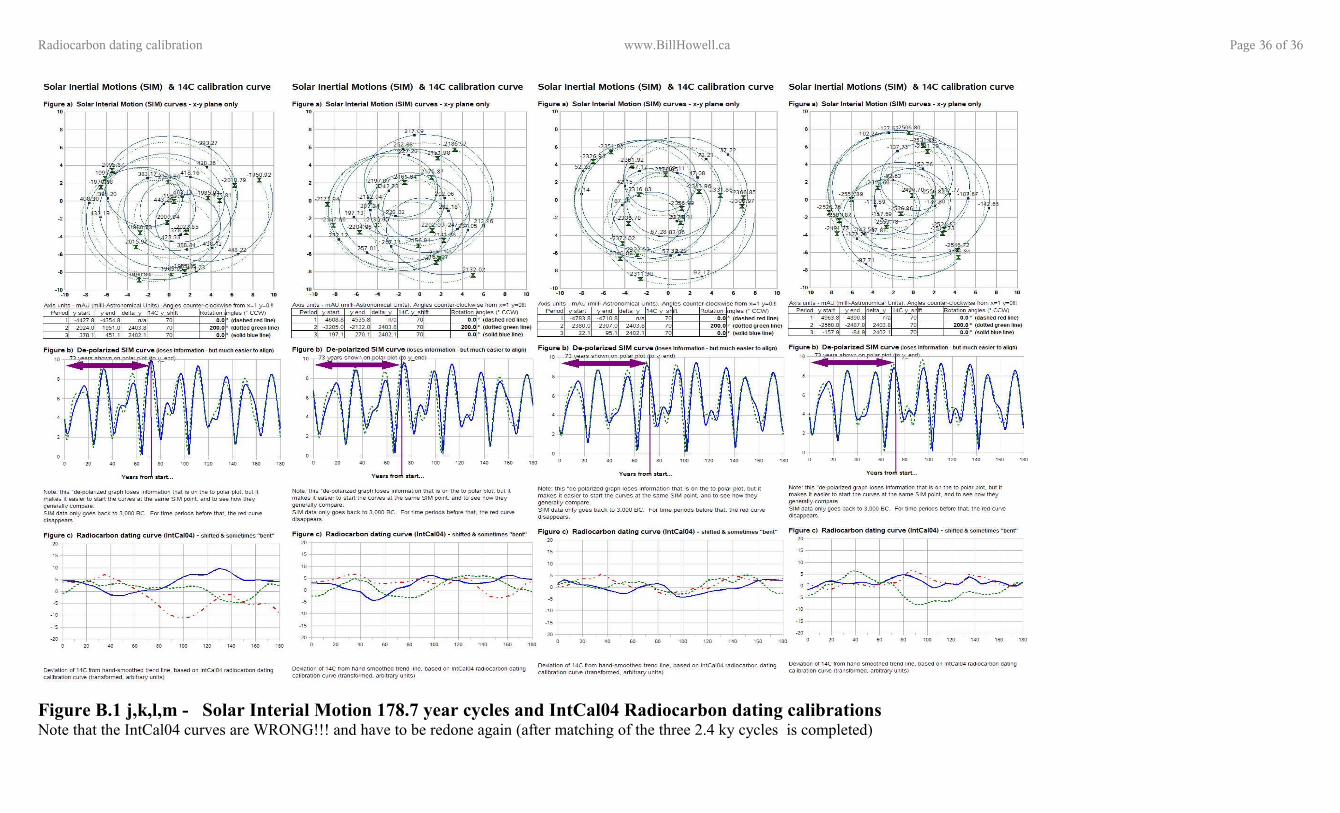
Appendix B - Solar Inertial Motion (SIM) curves since 4,963.8 BC
Figure B.1 a,b,c,d - Solar Interial Motion 178.7 year cycles and IntCal04 Radiocarbon dating calibrationsNote that the IntCal04 curves are WRONG!!! and have to be redone again (after matching of the three 2.4 ky cycles is completed)
Radiocarbon dating calibration www.BillHowell.ca Page 35 of 36
Figure B.1 e,f,g,h,i - Solar Interial Motion 178.7 year cycles and IntCal04 Radiocarbon dating calibrationsNote that the IntCal04 curves are WRONG!!! and have to be redone again (after matching of the three 2.4 ky cycles is completed)
Radiocarbon dating calibration www.BillHowell.ca Page 36 of 36
Figure B.1 j,k,l,m - Solar Interial Motion 178.7 year cycles and IntCal04 Radiocarbon dating calibrationsNote that the IntCal04 curves are WRONG!!! and have to be redone again (after matching of the three 2.4 ky cycles is completed)