Embed Size (px)
Citation preview
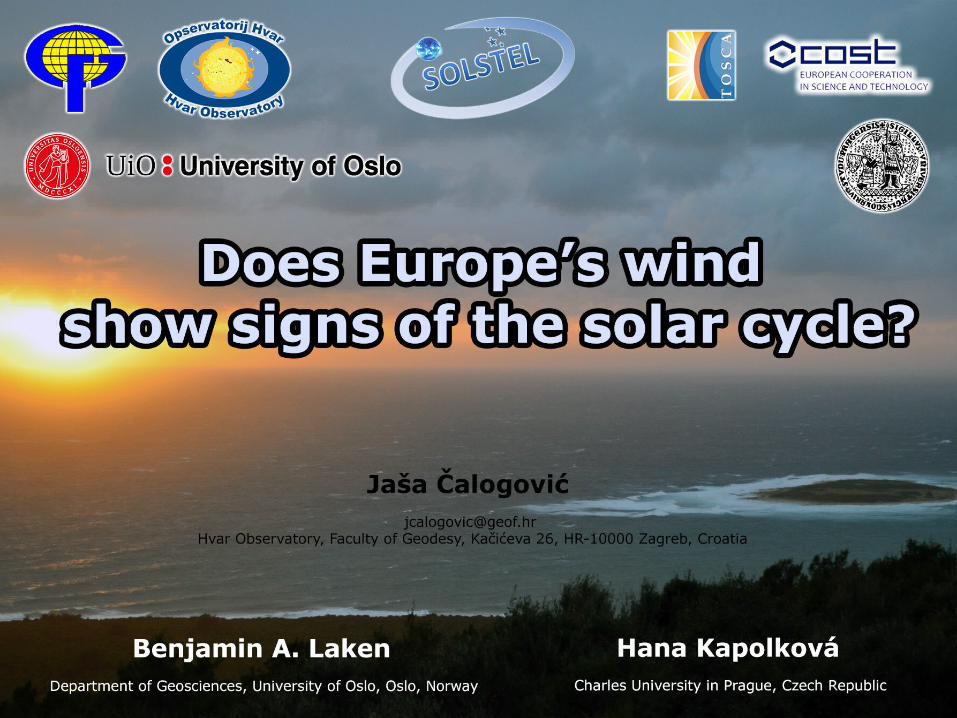
Kodera & Kuroda , 2002
Theoretical solar influence on climate
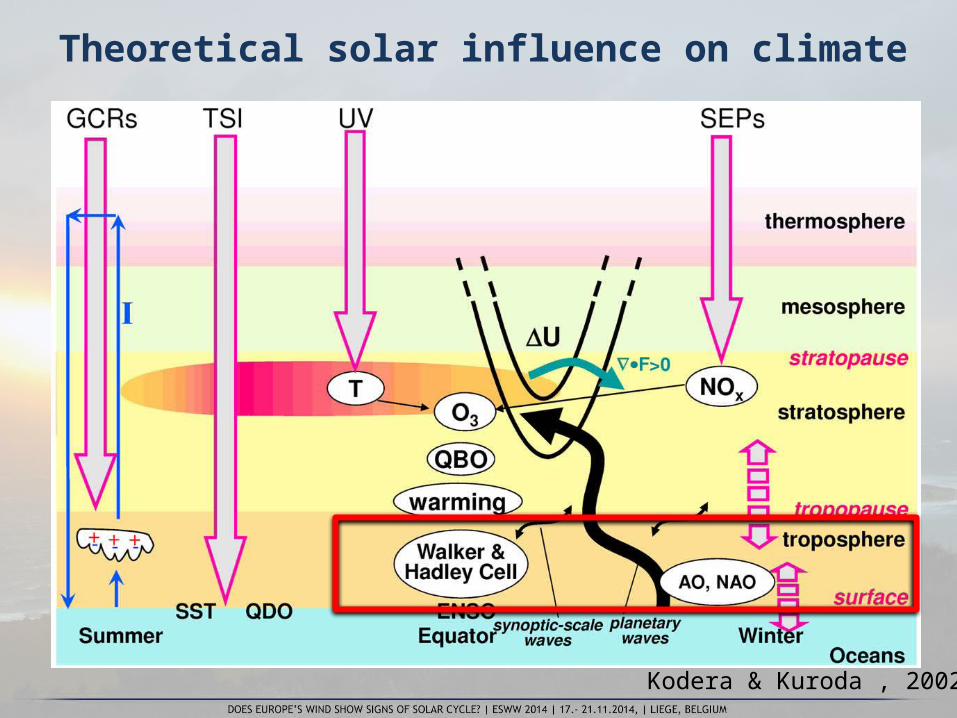
Some evidence of a tropospheric response to the 11-year solar cycle
Solar signal in tropospheric temperature, humidity, sea level pressure, geopotential height, and tropospheric circulation patterns (eg. Gleisner and Thejll, 2003; Kuroda and Kodera, 2005; Coughlin and Tung, 2004;
Dima et al., 2005; Huth et al., 2008)
• Strong solar signal in mid-latitude cyclonic activity• Solar signals can be lost due to spatial & temporal
averaging
Gle
isne
r and
The
jll, 2
003
Coug
hlin
and
Tun
g, 2
004
Fourth mode of geopotential height
Base
d on
NCE
P/N
CAR
rean
alys
is d
ata
Identification of solar—terrestrial links has many issues
• Despite much research large uncertainty still remains• Exact (amplifying) mechanisms linking solar activity to
climate are still poorly understood not always possible to even evaluate them
• Most studies are purely statistical tests of significance may be accompanied by ambiguities (data selection, treatment, methods and assumptions). Vulnerable to autocorrelations, smoothing, human bias and post-hoc hypotheses.
• Such difficulties in relation to solar—terrestrial field described by Pittock 1979, 1978
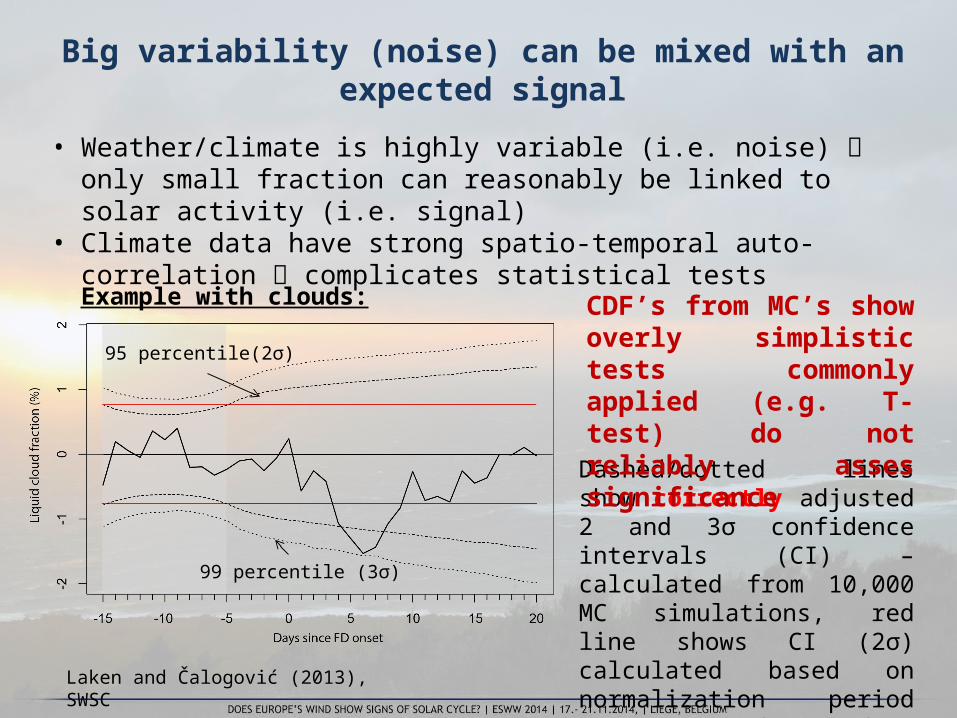
Big variability (noise) can be mixed with an expected signal
Laken and Čalogović (2013), SWSC
Dashed/dotted lines show correctly adjusted 2 and 3σ confidence intervals (CI) – calculated from 10,000 MC simulations, red line shows CI (2σ) calculated based on normalization period assuming that data aren’t temporally auto-correlated.
95 percentile(2σ)
99 percentile (3σ)
CDF’s from MC’s show overly simplistic tests commonly applied (e.g. T-test) do not reliably asses significance
• Weather/climate is highly variable (i.e. noise) only small fraction can reasonably be linked to solar activity (i.e. signal)
• Climate data have strong spatio-temporal auto-correlation complicates statistical tests
Example with clouds:
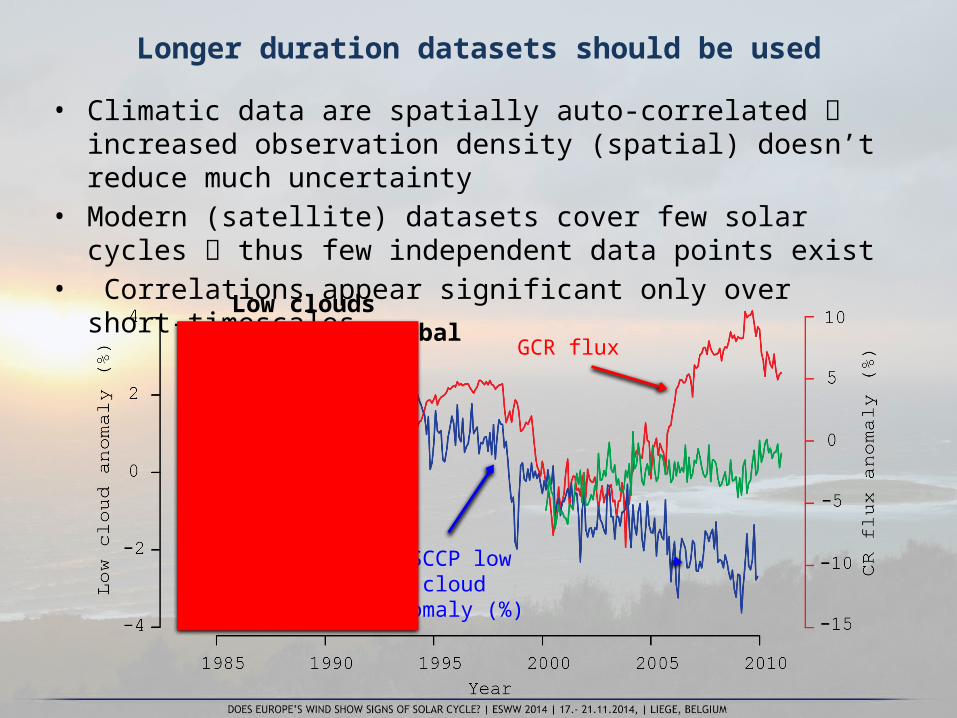
Longer duration datasets should be used
• Climatic data are spatially auto-correlated increased observation density (spatial) doesn’t reduce much uncertainty
• Modern (satellite) datasets cover few solar cycles thus few independent data points exist
• Correlations appear significant only over short-timescales
GCR flux
ISCCP low cloud anomaly (%)
Low clouds (<3.2km), global
If some climate signal is found - it should be properly attributed to solar forcing
• Other external and internal factors influencing the climate parameters should be identified eg. attribution by multiple regression or models (if possible)
• Last few solar cycles coincidentally match with strong volcanic eruptions (volcanic forcing)
Open-access coding solution
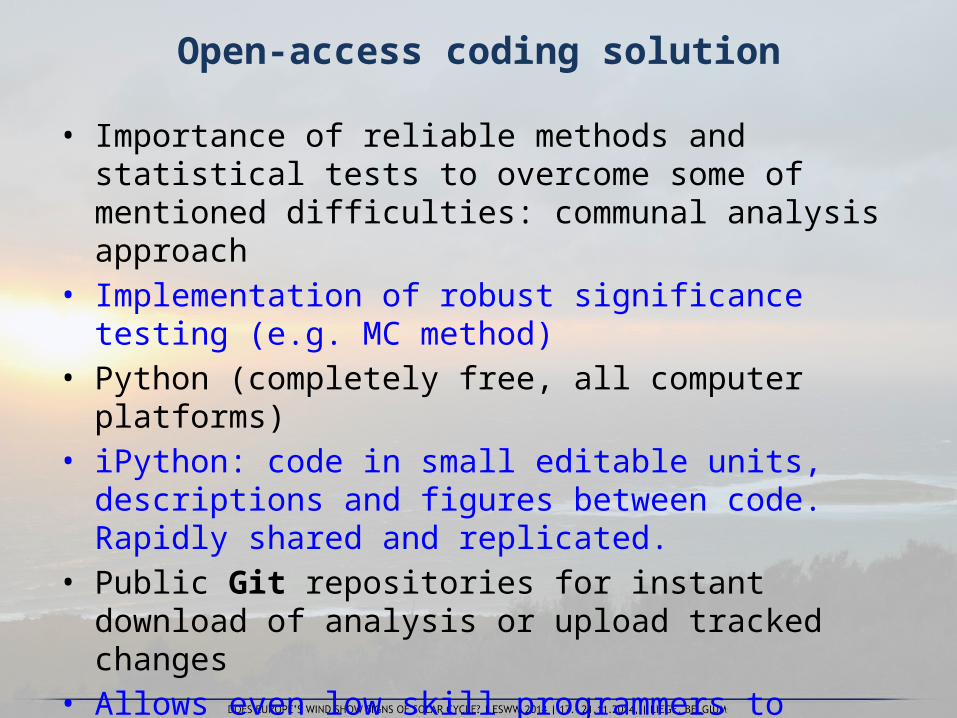
• Importance of reliable methods and statistical tests to overcome some of mentioned difficulties: communal analysis approach
• Implementation of robust significance testing (e.g. MC method)
• Python (completely free, all computer platforms)• iPython: code in small editable units, descriptions and figures
between code. Rapidly shared and replicated.• Public Git repositories for instant download of analysis or
upload tracked changes• Allows even low skill programmers to follow the analysis.
Viewed online, any system (only internet browser needed)• Using FigShare (DOI number) code can be added as
supplement to publications
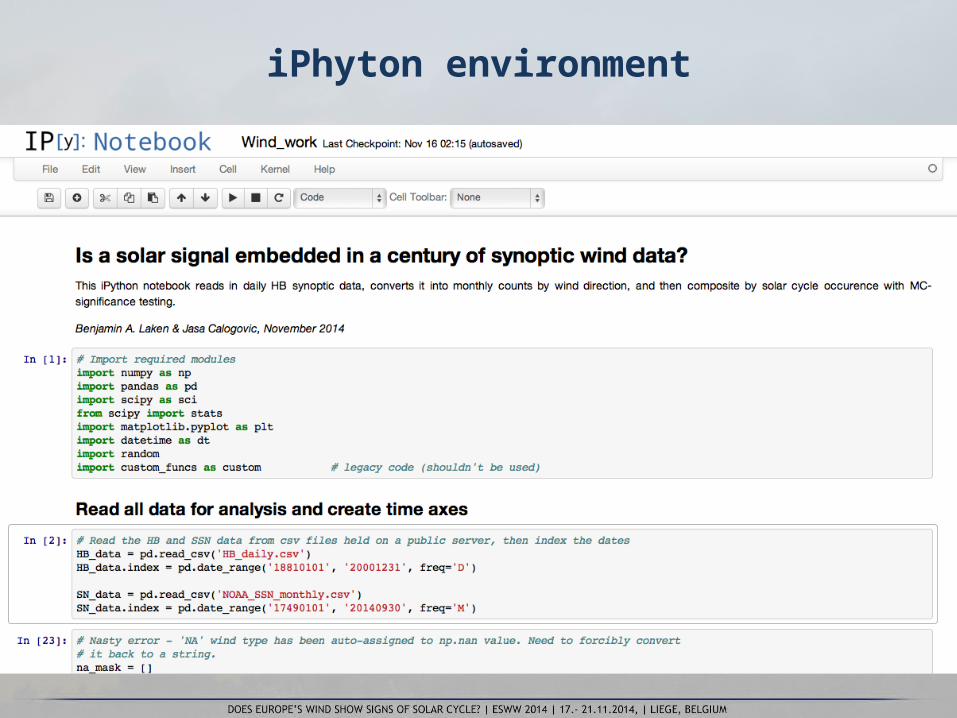
iPhyton environment
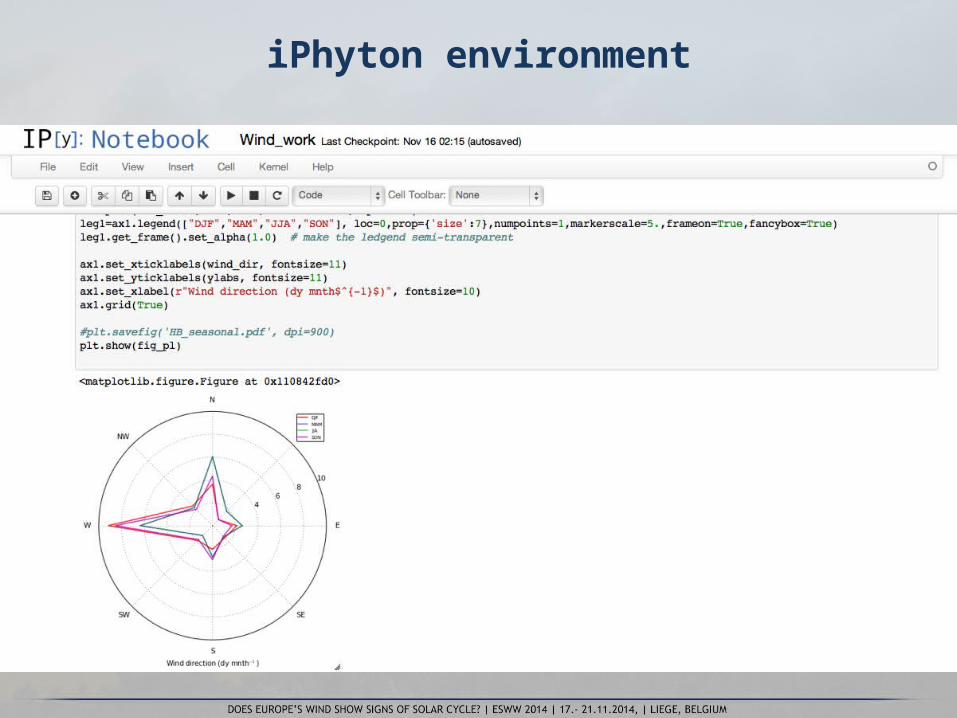
iPhyton environment
Hess and Brezowsky (HB) data
• Catalogue of synoptic conditions: 29 types, defined by the position of major pressure, direction of airflow, and (anti)cyclonicity
• Data regularly updated and several times revised• Concentrating on Central Germany: strong spatial
autocorrelation = HB indicative of conditions over Central Europe
• Data extend back to 1881 covers more than 11 solar cycles!
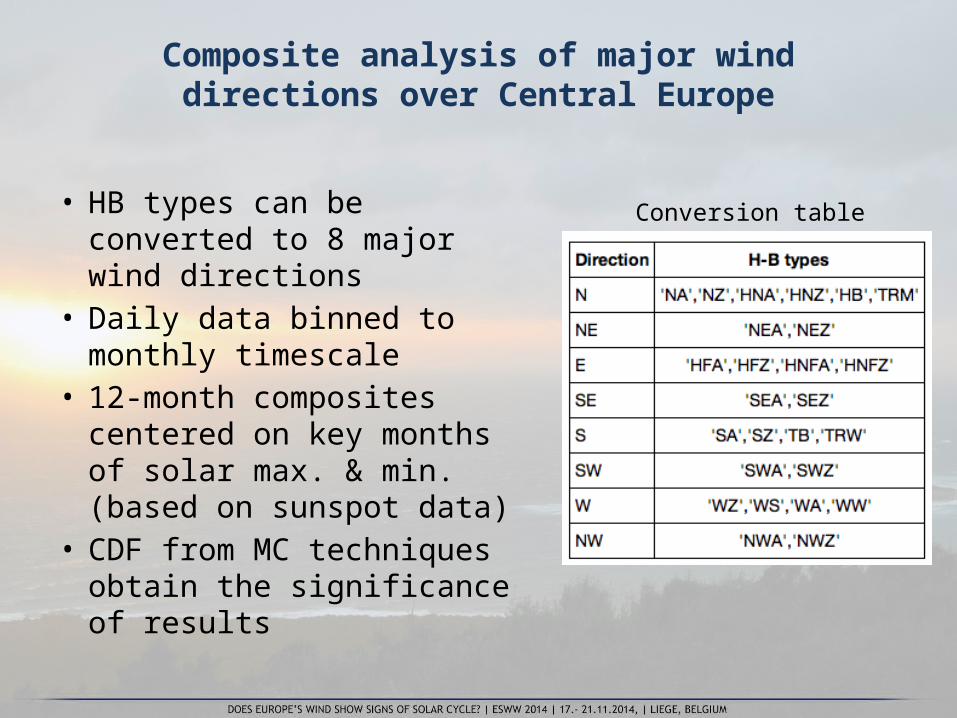
Composite analysis of major wind directions over Central Europe
• HB types can be converted to 8 major wind directions
• Daily data binned to monthly timescale
• 12-month composites centered on key months of solar max. & min. (based on sunspot data)
• CDF from MC techniques obtain the significance of results
Conversion table
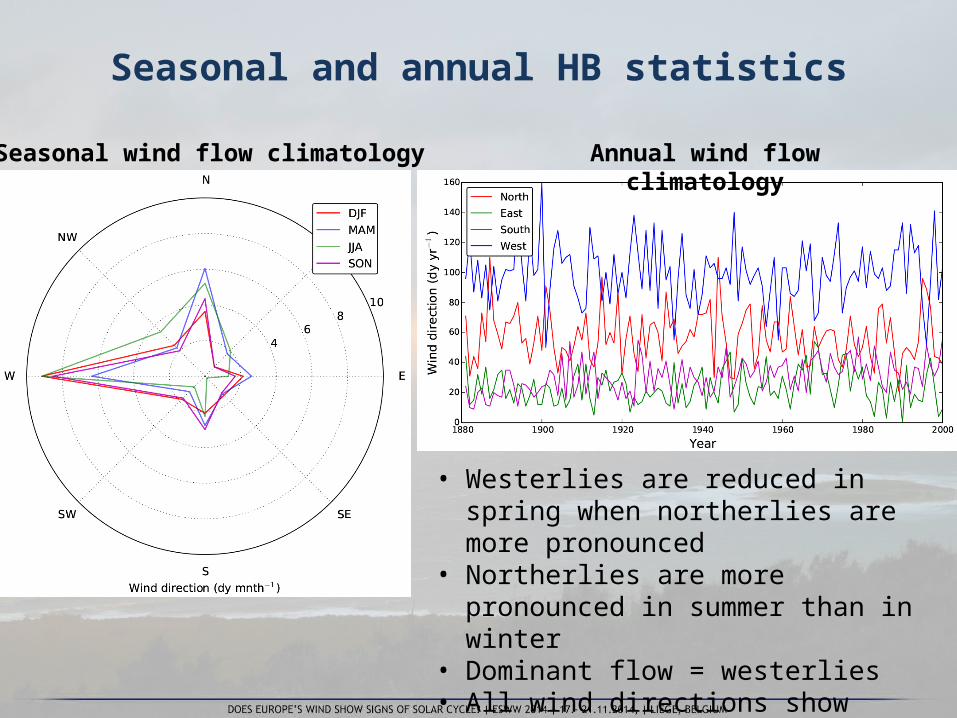
Seasonal and annual HB statistics
Seasonal wind flow climatology Annual wind flow climatology
• Westerlies are reduced in spring when northerlies are more pronounced
• Northerlies are more pronounced in summer than in winter
• Dominant flow = westerlies• All wind directions show nearly constant
long term trend (annual data)
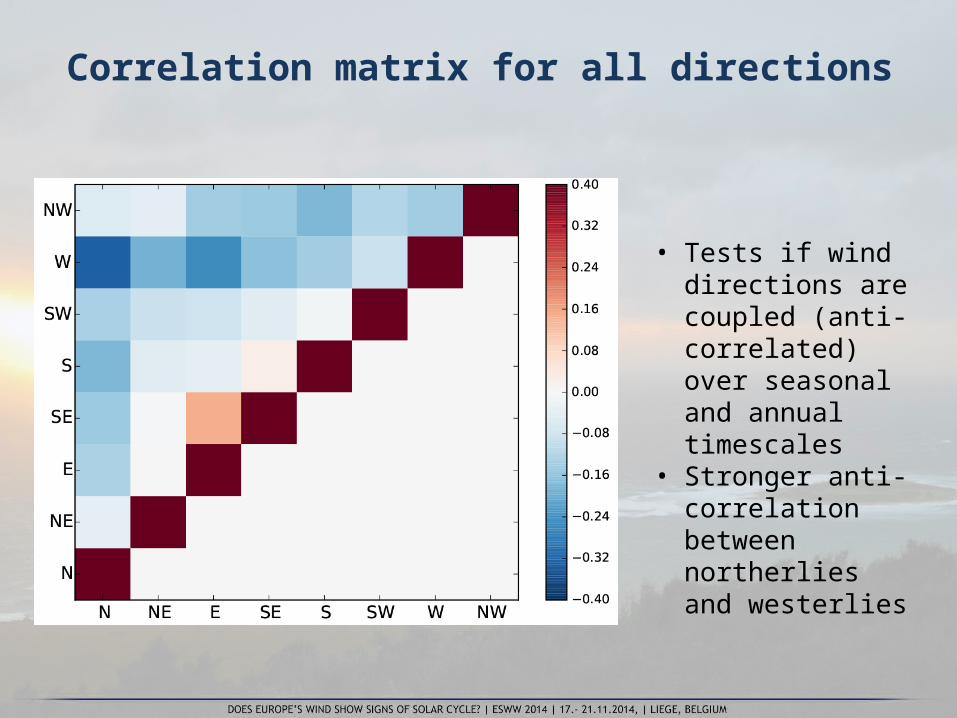
Correlation matrix for all directions
• Tests if wind directions are coupled (anti-correlated) over seasonal and annual timescales
• Stronger anti-correlation between northerlies and westerlies

Results
slides removed by author, available on request as private communication
Further work and improvements
• Implementation of various lags• Test the response to other climate forcings (eg.
volcanic forcing)• Extension of analysis to other climatological long
record datasets (eg. Europe, North America, ship records)
• Preparation of iPython notebook scripts to be more easily readable and usable
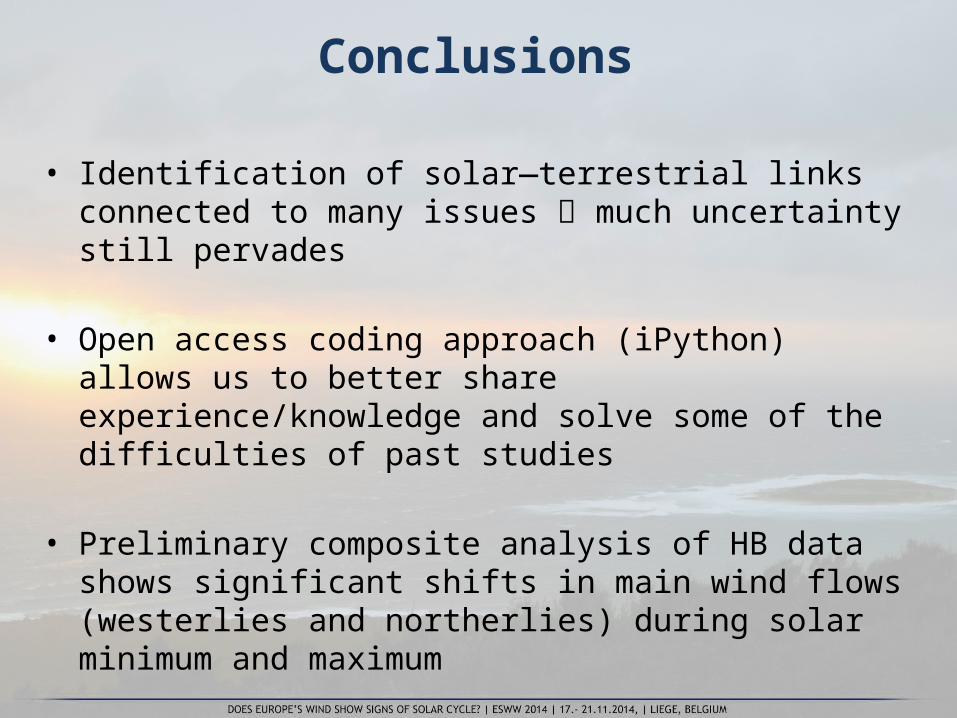
• Identification of solar—terrestrial links connected to many issues much uncertainty still pervades
• Open access coding approach (iPython) allows us to better share experience/knowledge and solve some of the difficulties of past studies
• Preliminary composite analysis of HB data shows significant shifts in main wind flows (westerlies and northerlies) during solar minimum and maximum
Conclusions
Thank you!
This work received support from SOLSTEL (HRZZ project 6212) and the European COST Action ES1005 (TOSCA).


![Shobogenzo - Terebess Hungária Kft. honlapja, … · Shobogenzo Takashi James Kodera ... [A study of the spiritual history of Japan] (1925). ... tique of Heidegger's Sein und ^eit](https://img.pdfslide.us/doc/110x75/5b5d06027f8b9ad21d8d50c5/shobogenzo-terebess-hungaria-kft-honlapja-shobogenzo-takashi-james-kodera.jpg)