Embed Size (px)
Citation preview

Next Generation of Residue and
Compaction Management Tools:
Vertical Tillage and Strip Tillage
Jodi DeJong-Hughes
Extension Educator Soils and Crops
507-337-2816, [email protected]

Erosion• Length of flat field (wind)
• Steepness of slope (water)
• Intensity of tillage
• Residue levels
Courtesy of Dorian Gatchell
The
next
day

Residue
• Residue is the single
most important factor
influencing soil loss!
• Residue Coverage
– protects soil from raindrop impact
– decreases soil detachment
– decreases soil crusting and sealing
– decreases velocity of surface water
– increases infiltration
How Much Residue is Enough?Wind Erosion
Adapted from Bilbro and Fryrear, 1994
0
0.2
0.4
0.6
0.8
1
0 20 40 60 80 100
Soil Cover (%)
Fra
cti
on
of
Ba
re S
oil
Ero
sio
n
Adapted from Dickey at al., 1984
Water Erosion

Skogstad Fields – Cyrus, MN
• Looking at water, wind and tillage erosion
• Long term MBP field
Lindstrom et al, USDA-ARS in Morris

Erosion at Skogstad Sitenet deposition
net soil loss-60
-50
-40
-30
-20
-10
0
10
20
30
40
50
Tillage Erosion (tons/ha/yr)
Water erosion (tons/ha/year)
net deposition
net soil loss-30
-25
-20
-15
-10
-5
0
5
10
15
20
25
30
35
40
45
50
Net soil loss by
tillage erosion
exceeded 27 T/ac/yr
Water erosion
resulted in net soil
loss <9 T/ac/yr
Lindstrom et al, USDA-ARS in Morris

2003 Wheat Yield (bushels per acre)
46
48
50
52
54
56
58
60
62
64
66
68
70
72
74
76
78
80
82
84
86
88
90
Variation in Crop Yield
Lindstrom et al, USDA-ARS in Morris

Variation in Topography
AGVISE Soil Testing Lab

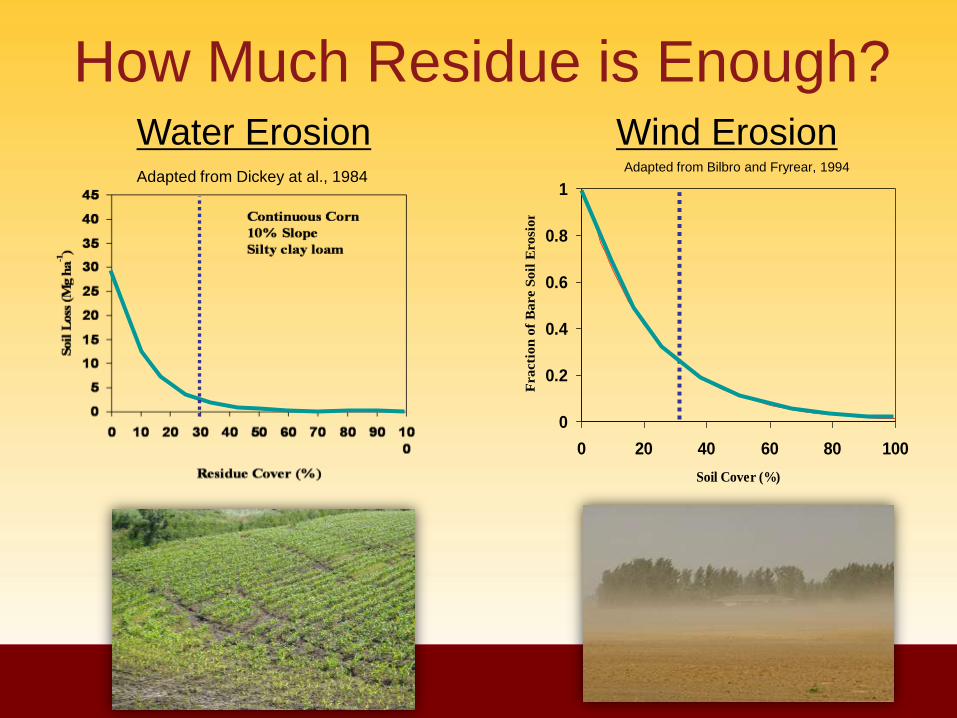
Soil Compaction
Soil compaction occurs when soil
particles are pressed together, reducing
pore space between the particles
Photo courtesy of National Soil Dynamic
Laboratory, USDA, Auburn, AL.
Soil Compaction
Soil Particles
Water
Air
Uncompacted Compacted
Compaction
Yie
ldWet Season
Dry Season

Soil Compaction - Causes
• Field equipment
• Working soil too wet
– Water acts as a
lubricant
• Livestock
• Minimal crop rotation
• Aggressive tillage

Types of Compaction
Remember:
PSI = surface and depth of compaction
Axle Load = depth of compaction

Strip Tillage
• Loosens the soil in the row 7-10” wide while maintaining residue between the rows
• Builds organic matter and soil structure
• Less energy required and less erosion than conventional systems

Strip Till Management
• Tile drainage is beneficial
• Have a ST rep or experienced strip tiller on speed dial
• Planting directly on the bermis essential
• Soil will ‘mellow’ in 3-4 yrs, but increased water infiltration will be immediate
Committed Sales Rep

Tillage Comparison Study
• Three replications
• Corn following soybeans
• 10 sites in 2004 and 2005
• Four tillage treatments:
– No Till (NT)
– Strip Till (ST)
– Spring cultivation (OP)
– Fall chisel plow with
Spring cultivation (CP+)
DeJong-Hughes, et al.

Residue Cover
Average for UMN sites only. Residue counts taken after planting.
NT ST OP CP+
Resid
ue C
over
(%)
80
60
40
20
0
30%
54
65
4549
30 27
22 21
2004
2005

Residue Cover
Tillage 2004 2005 Range
No-till 54.1 64.7 30 - 90
Strip-till 44.7 49.1 21 - 69
One-Pass 29.9 27.4 11 - 54
Chisel+ 21.7 20.6 4 - 44
• Some producers did not have residue managers
on their planter
• Previous tillage was different (NT to Disc-ripped)
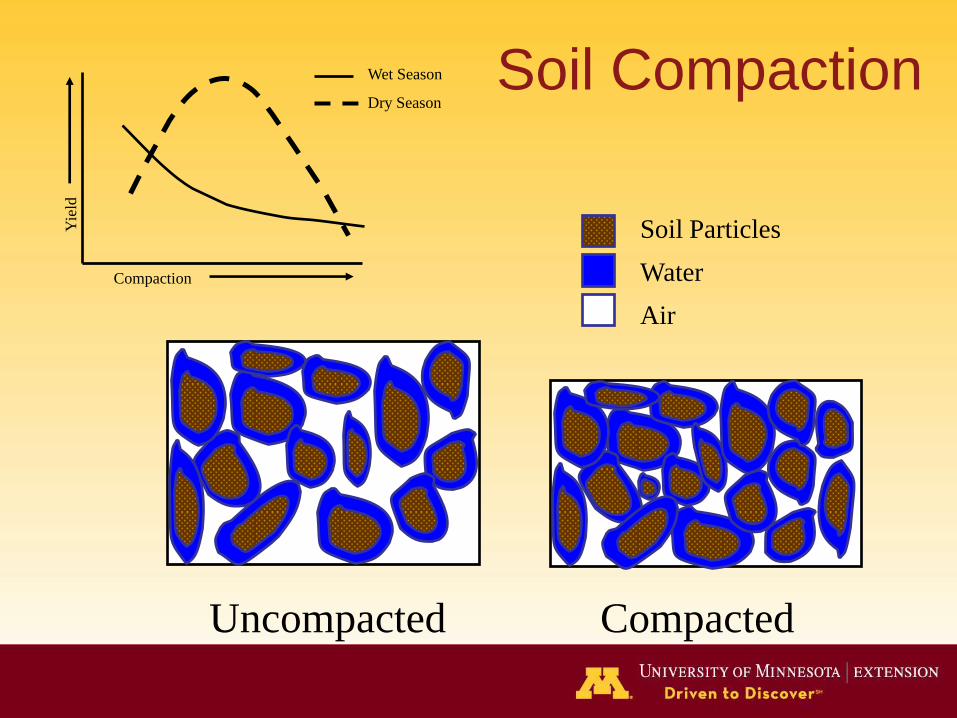
Corn Grain Yields
NT ST OP CP+
Yie
ld (
bu
/acre
)
220
200
180
160
140
168
196
175
202
174
197
177
201
2004
2005
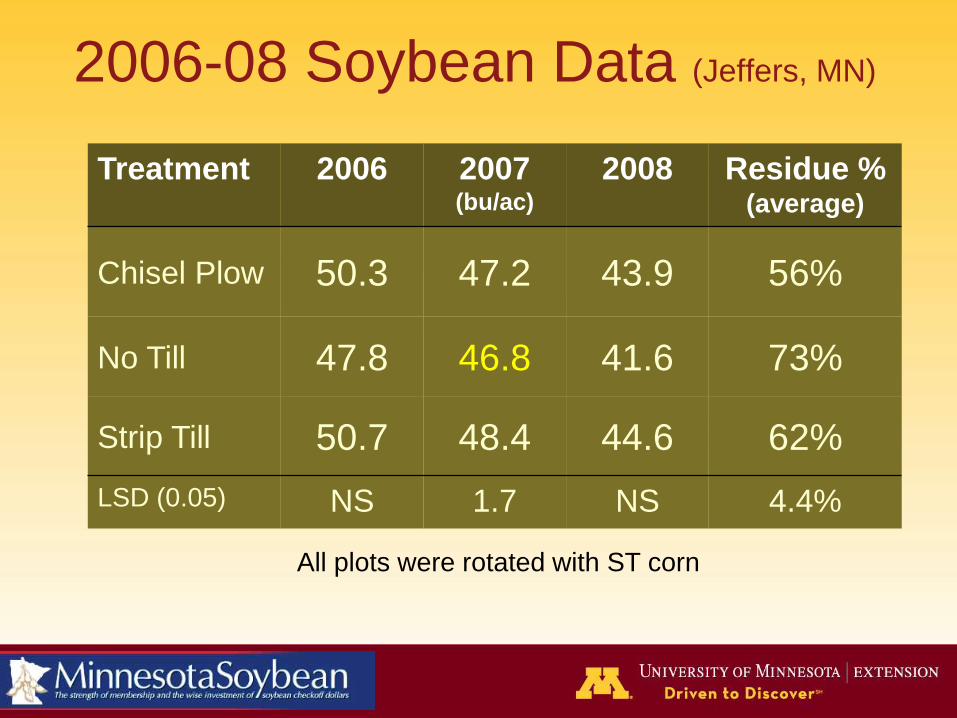
2006-08 Soybean Data (Jeffers, MN)
Treatment 2006 2007(bu/ac)
2008 Residue %(average)
Chisel Plow 50.3 47.2 43.9 56%
No Till 47.8 46.8 41.6 73%
Strip Till 50.7 48.4 44.6 62%
LSD (0.05) NS 1.7 NS 4.4%
All plots were rotated with ST corn

2007 and 2009 Corn Data (Jeffers, MN)
Previous
Treatment
Yield (bu/ac) Residue
2007 2009 Average
ST - Corn
CP-SB 175.4 182.0 54%
ST- Corn
NT– SB 169.4 176.7 62%
ST- Corn
ST- SB 167.0 176.2 60%
LSD (0.05) NS NS

1st Year Corn Yields (bu/ac) 2008
100
120
140
160
180
200
220
ST
DR/CP
MBP
*Holloway had a 2nd light tillage pass in the spring
All are NS
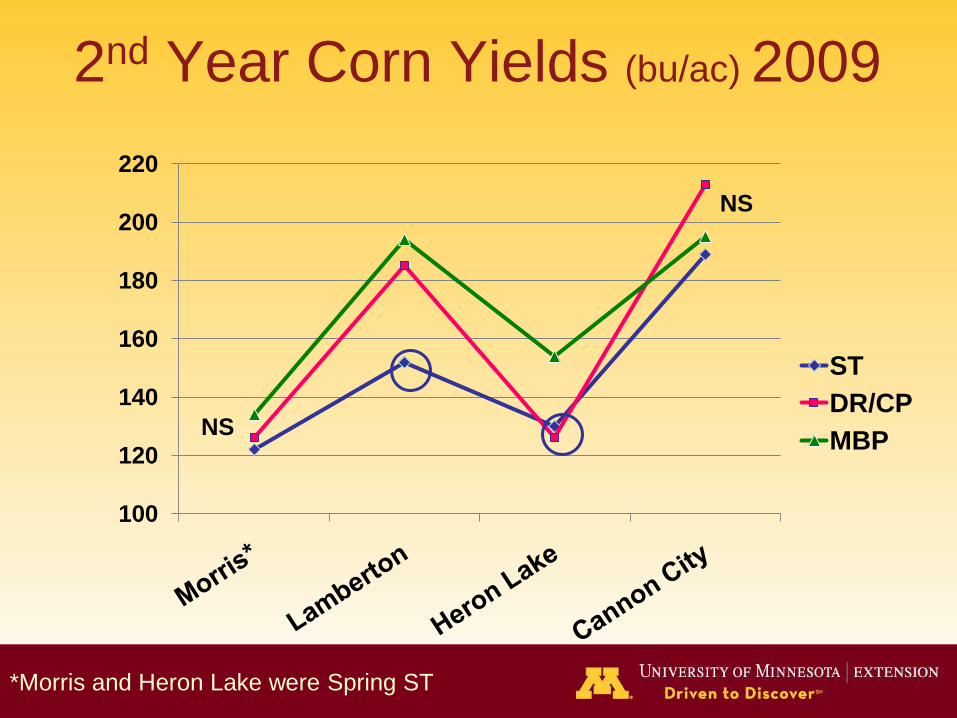
2nd Year Corn Yields (bu/ac) 2009
100
120
140
160
180
200
220
ST
DR/CP
MBP
*Morris and Heron Lake were Spring ST
NS
NS

Boyd 22” Rows - Tillage Yields
Residue(%)
Height(inches)
Population(plants/ac)
Yield(bu/ac)
Strip Till 77% 14.8 b 27,200 b 123.2 b
ST + Spring
Salford RTS
54% 18.4 a 30,370 a 131.3 a
DMI + Spring
Cultivation
39% 18.1a 29,240 b ----
MBP + Spring
Cultivation
13% 21.5 a 32,050 a ----
LSD (0.05) 13 3.9 2,690 7.7
Planted 34,000

Salford RTS

3rd Year Corn Yields (bu/ac) 2010
100
120
140
160
180
200
220
CPDR
MP
ST
NS
NS
*Morris and Cannon City had secondary coulter pass
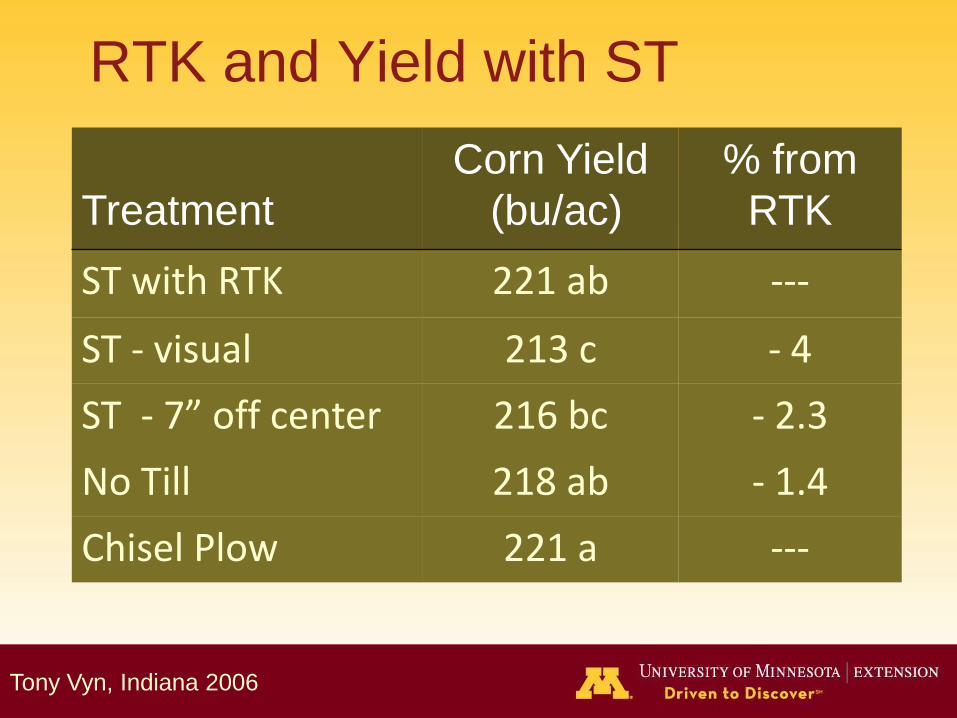
RTK and Yield with ST
Treatment
Corn Yield
(bu/ac)
% from
RTK
ST with RTK 221 ab ---
ST - visual 213 c - 4
ST - 7” off center 216 bc - 2.3
No Till 218 ab - 1.4
Chisel Plow 221 a ---
Tony Vyn, Indiana 2006

Holloway Soil Temps Corn on Corn
40
50
60
70
80
90
23 24 25 26 27 28 29 30 31
Date
Te
mp
era
tu
re
(F
)
ST- In Row Disk Rip
ST- Btwn Row MBP
DeJong-Hughes, Lamb, Stahl, Miller
Date Planted
30” row spacing

Morris Soil Temps Corn on Corn
50
55
60
65
70
75
80
85
90
22 23 24 25 26 27 28 29 30 31
Date
Tem
peratu
re (
F)
ST- In Row Disk Rip ST- Btw n Row MBP
DeJong-Hughes, Lamb, Stahl, Miller
Date Planted
30” row spacing

Strip Till C-C Soil Temps
In-row vs. Between-the-row
505560657075808590
22 23 24 25 26 27 28 29 30 31
ST- In Row ST- Btwn Row
DeJong-Hughes, Lamb, Stahl, Miller
30” row spacing
15 degrees

Where to Try Strip Till
• Where you suspect a hard pan
• To maintain and/or build organic matter
• On well drained soil
• To improve water infiltration/structure
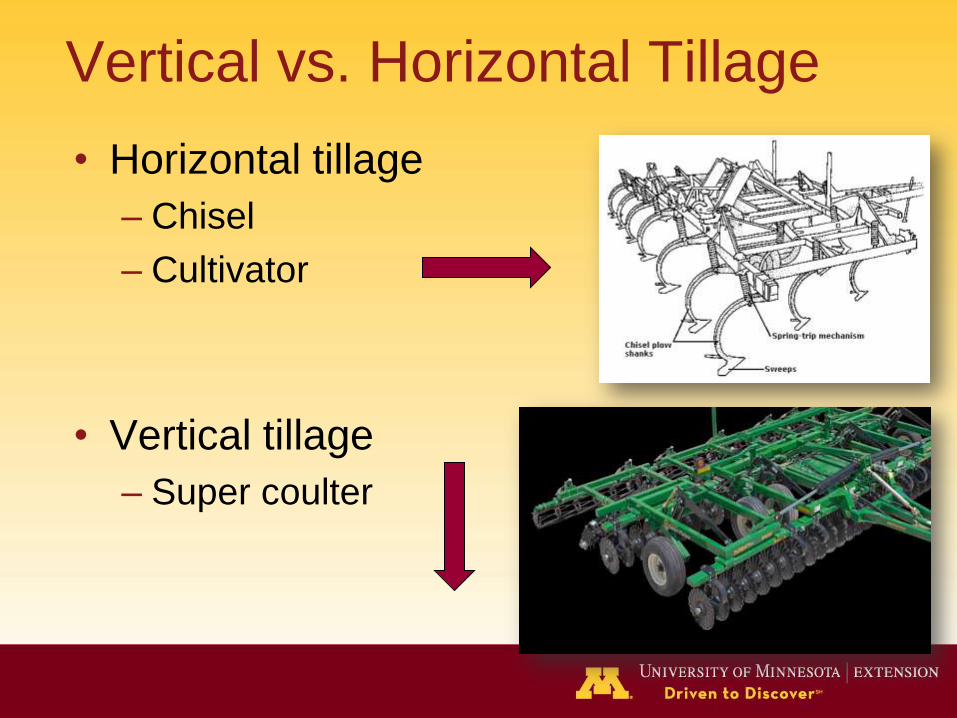
Vertical vs. Horizontal Tillage
• Horizontal tillage
– Chisel
– Cultivator
• Vertical tillage
– Super coulter

Vertical Tillage
• Shallow tillage 1-3”
• Drive 7-10 mph
• Incorporates a little
residue, nutrients,
lime, and manure
• Chops and sizes
residue. Prepares the
seedbed.

Vertical Tillage
• Vertical till is still in its
research infancy
• Less aggressive
implements have more
weed pressure
• Usually 2 passes in wet
spring will get you in the
field

UW Discovery Farms
• Great Plains Turbo Till– Rolling spike harrow and reel rear attachment
• Summers Super Coulter– Rolling spike and reel
• 2 gangs of non-concave
blades, 10” apart offset
with 2nd gang
K. Klingberb and C. Weisenbeck

UW Discovery Farms
• 40% of soil was tilled with first set of
coulters (2 out of 5”)
• 60% of soil was tilled with the rear
attachments (3 out of 5”)
• Majority of old corn
roots were left intact

UW Discovery Farms
• Disturbance level varied with:
– Soil type
– Attachments
– Depth
– Speed
• 2nd pass with VT was very similar in
disturbance to disking with field cultivation

UMN Research
• Near Clarkfield and Carlisle MN
• Tillage research looking at the depth and
aggressiveness of tillage
– Clarkfield: Wishek, DMI, ST, and VT
– Carlisle: VT, ST, Field Cultivation (wet fall)
DMI Ripper Salford RTS Elmer’s ST Wishek Disk

2010 Soybean Data - Clarkfield
Tillage Treatment
Residue
(%)
Population
(plants/ac)
Yield
(bu/ac)
F - ST
S - coulter pass61 148,800 58.0
FS - Salford RTS 58 153,700 59.9
F - Wishek disk
S - field cultivator41 143,300 56.7
F - DMI
S - field cultivator54 153,200 57.1
LSD (0.05) 8.9 NS NS
DeJong-Hughes, J. Coulter
Only 1 year of data

2010 Corn Data - Clarkfield
Tillage Treatment
Residue
(%)
Population
(plants/ac)
Height
(inches)
Yield
(bu/ac)
F - ST
S - coulter pass36 32,200 10.6 156.6 ab
FS - Salford RTS 30 32,800 11.1 162.9 a
F - CP
S - field cultivator30 31,900 10.7 152.2 b
LSD (0.05) NS NS NS 7.1
DeJong-Hughes, J. Coulter
Only 1 year of data

2010 Corn Data - Carlisle
Tillage Treatment
Population
(plants/ac)
Height
(inches)
Moisture
(%)
Corn Yield
(bu/ac)
S - Field cultivator 33,800 11.2 14.6 179.2 a
F - ST
S - Coulter pass33,200 10.7 14.1 178.2 a
S - Gates Magnum
Coulter – 0o31,800 8.4 16.1 167.0 b
S - Gates Magnum
Coulter – 7.5o31,500 9.7 15.0 170.7 b
LSD (0.05) NS 1.2 1.1 7.1
DeJong-Hughes, J. Coulter
Only 1 year of data

One Year Summary
• Watch your weeds
• RTK is important with ST
• Residue management starts with the combine
• We’ll watch residue build-up over time

Kansas State 2009 Research
• Treatments:
– Case True Tandem 330 Turbo
(vertical till)
– Long term no-till
• Applied 6.4” of water/hour
• Did not incorporate P and K
Pressley et al.

Vertical Tillage Pilot Study
Physical Properties VT NTp-value,
t-test**
Bulk density (g cm-3) 0-2” 1.13 1.21 0.08
2-4” 1.29 1.30 NS
Infiltration (mm hr-1)* 21.4 44.0 0.04
Yield (bu/ac) 67.1 65.9 NS
This field had beautiful soil properties to begin with - NT since
the 1980’s. No density increase below the depth of tillage (2”)
Pressley, KSU, 2009

Where to Try Vertical Tillage
• Good at sizing residue and introducing air to a
shallow depth
– Wet springs
– When fall tillage was not completed
– Sands that need to have some tillage
– Not beneficial on long-term NT fields
– Decrease residue build-up
• Leaves 50-60% residue = good on slopes and
all soil types
• Shallow tillage = works well with rotational tillage

Summary
• All tillage systems have their strengths and
weaknesses.
– Adjust tillage for soil type, slope, rotation, …
• Rotational tillage may work best if you have
multiple soil types
• Have a Plan B