Embed Size (px)
Citation preview
www.labsmartservices.com.au
Soils 2015 (57)
PROFICIENCY TESTING
PROGRAM REPORT
Accredited for compliance with ISO/IEC 17026
Copyright: LabSmart Services Pty Ltd
Soils Proficiency Testing Program - 2015(57)
Copyright: LabSmart Services Report V1 - June 2015 Page 1 of 37
Report This report is available on the LabSmart Services website. The issue of this proficiency report was authorised by Peter Young, Director, LabSmart Services Pty Ltd, June 2015. Contact Details
Email: [email protected] Mobile: 0432 767 706 Fax: (03) 8888 4987
Program Coordinator The program coordinator for this program was Peter Young, Director, LabSmart Services Pty Ltd. Contact Details
Email: [email protected] Mobile: 0432 767 706 Fax: (03) 8888 4987
Accredited Proficiency Testing Provider LabSmart Services is accredited by NATA to ISO/IEC 17043, Conformity assessment – General requirements for proficiency testing. Accreditation number 19235. The accreditation provides additional assurance to participants of the quality and importance we place on our proficiency testing programs. LabSmart Services As well as proficiency testing programs LabSmart Services also offers a wide range of other services including consultancy, training and nuclear gauge calibration. Please see our website for further details.
www.labsmartservices.com.au Copyright This work is copyright. No part of this publication may be reproduced in any form, transmitted or stored in any repository (e.g. mechanical, digital, electronic or photographic) without prior written permission of LabSmart Services Pty Ltd. Please contact LabSmart Services should you wish to reproduce any part of this report. Z-Score Summary Z-score summary for this program issued 11 June 2015 Amendment History Reports may be downloaded from the LabSmart Services website. Version 1 – Issued 23 June 2015
Soils Proficiency Testing Program - 2015(57)
Copyright: LabSmart Services Report V1 - June 2015 Page 2 of 37
CONTENTS PAGE 1. Program aim
4
2. How well did we perform?
2.1 Identified Outliers 2.2 Review of performance 2.3 Overall Performance
4
4 6
3. Technical comment
7
4. Less than 75 µm (Washed) 4.1 Z-Scores 4.2 Z-Scores Graph
12
12 13
5. Particle size distribution
5.1 Z-scores (% Passing) 5.2 Z-score graph for 2.36 mm sieve 5.3 Z-score graph for 1.18 mm sieve 5.4 Z-score graph for 600 μm sieve 5.5 Z-score graph for 425 μm sieve 5.6 Z-score graph for 300 μm sieve 5.7 Z-score graph for 150 μm sieve 5.8 Z-score graph for 75 μm sieve
14
14 16 17 18 19 20 21 22
6. Moisture content 6.1 Z-Scores 6.2 Z-Scores Graph
24
24 25
7. Program overview
7.1 Program Design 7.2 Sample Preparation 7.3 Packaging and Instructions 7.4 Quarantine 7.5 Despatch 7.6 Homogeneity Testing 7.7 Participation 7.8 Statistics
26
26 28 28 28 30 30 30 30
Appendix A Instructions for testers Appendix B Results log Appendix C Participant results
32
34
36
Soils Proficiency Testing Program - 2015(57)
Copyright: LabSmart Services Report V1 - June 2015 Page 3 of 37
1. Program Aim The proficiency program was conducted in April 2015 with participants throughout Australia. The program involved the performance of AS 1289 3.6.1, Determination of the particle size distribution of a soil and AS 1289 2.1.1, Determination of the moisture content of a soil – Oven drying method. The program provides feedback and confidence to the construction materials testing industry regarding the competency of participants (and the industry) to perform this test. Each participant’s performance is statistically assessed and used as a measure of competency relative to all those who participated. In order to provide useful feedback to participants regarding the potential sources of variation and assess the accuracy of results submitted, additional information was collected and reviewed. This report has been prepared using a robust statistical approach. In addition data has been reviewed for consistency before use and additional feedback regarding aspects of the test provided. 2. How well did we perform? 2.1 Identified Outliers Material less than 75 μm (washed) results are shown in section 4. The results of the statistical analysis of participant’s PSD results are detailed in section 5.1. Z-score graphs for each fraction are shown in sections 5.2 to 5.8. Moisture content results are detailed in section 6. Outliers were classified as z-scores where the z-score value was greater than 3 or less than -3. It is recommended that laboratories with outliers investigate their performance of the test. Those laboratories with z-scores approaching 3 may also wish to review their testing methodology. A z-score result close to zero indicates strong consensus with respect to all other participating laboratories (i.e. median) and is a very satisfactory outcome. Generally z-scores that are outside -2.0 to 2.0 should be reviewed. This program recommends those participants that lie outside the range -2.75 to 2.75 in particular need to review their results. Participants where it is recommended that they investigate or review their results based on their z-scores are shown in Table 2.1.
Soils Proficiency Testing Program - 2015(57)
Copyright: LabSmart Services Report V1 - June 2015 Page 4 of 37
Test Investigate Review
Less than 75 µm (by washing) Z6, S4 -
Particle size distribution (% Passing)
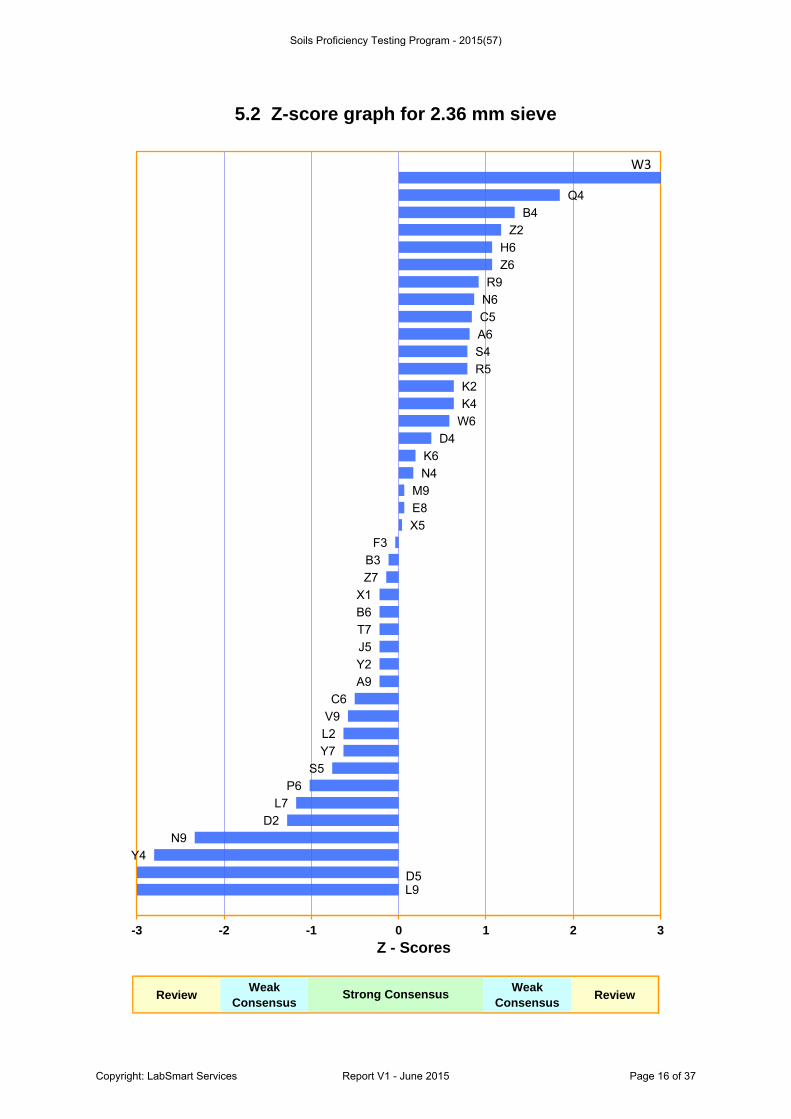
2.36 mm Y2, K4, W3, L9, D5 Y4
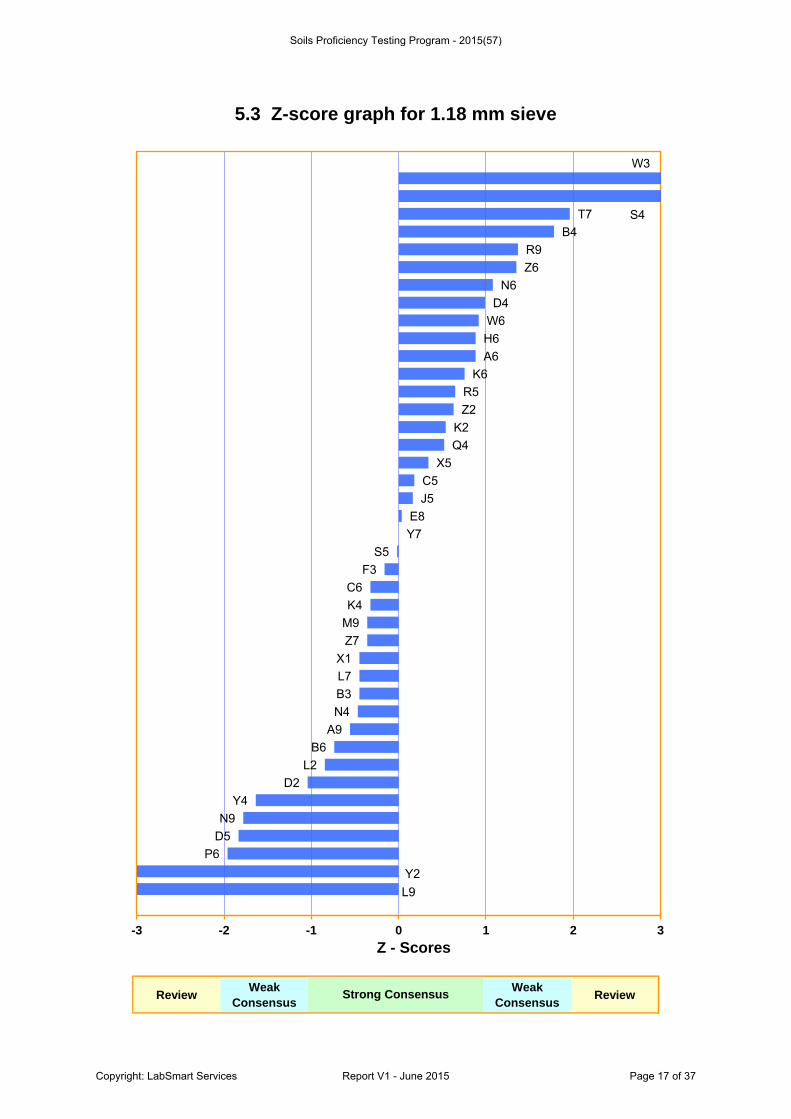
1.18 mm Y2, K4, W3, L9, D5, S4 -
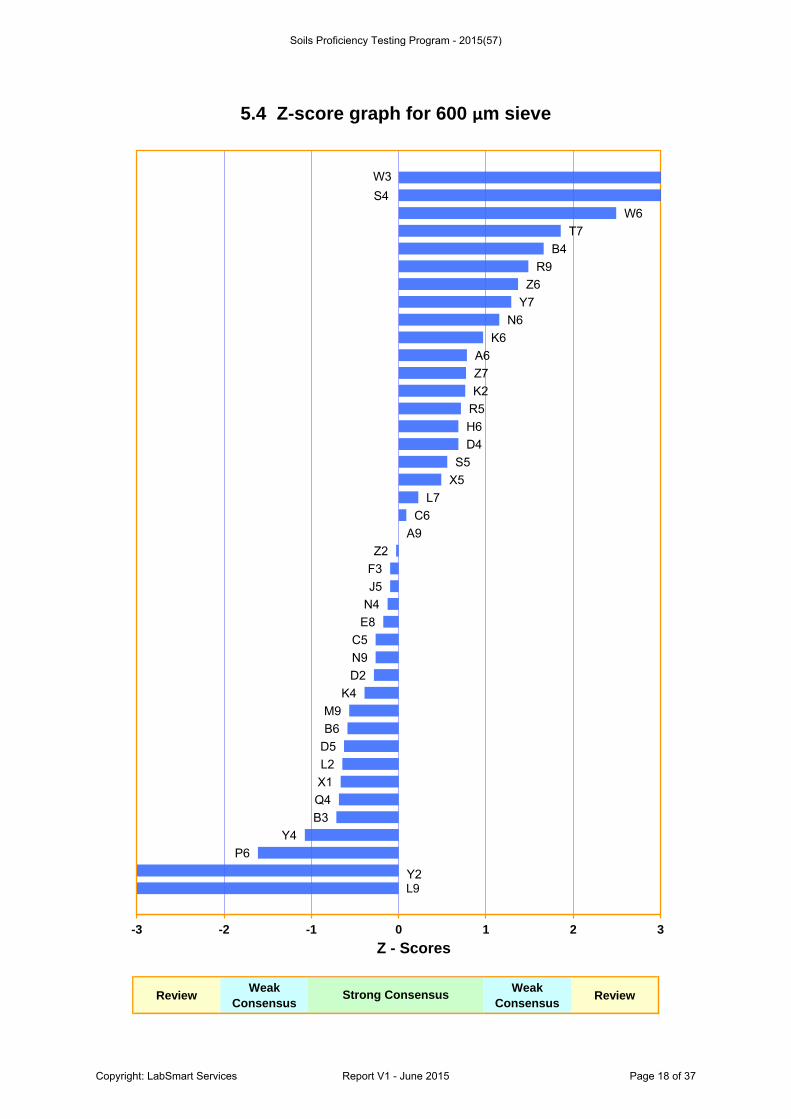
600 μm Y2, K4, W3, L9, D5, S4 -
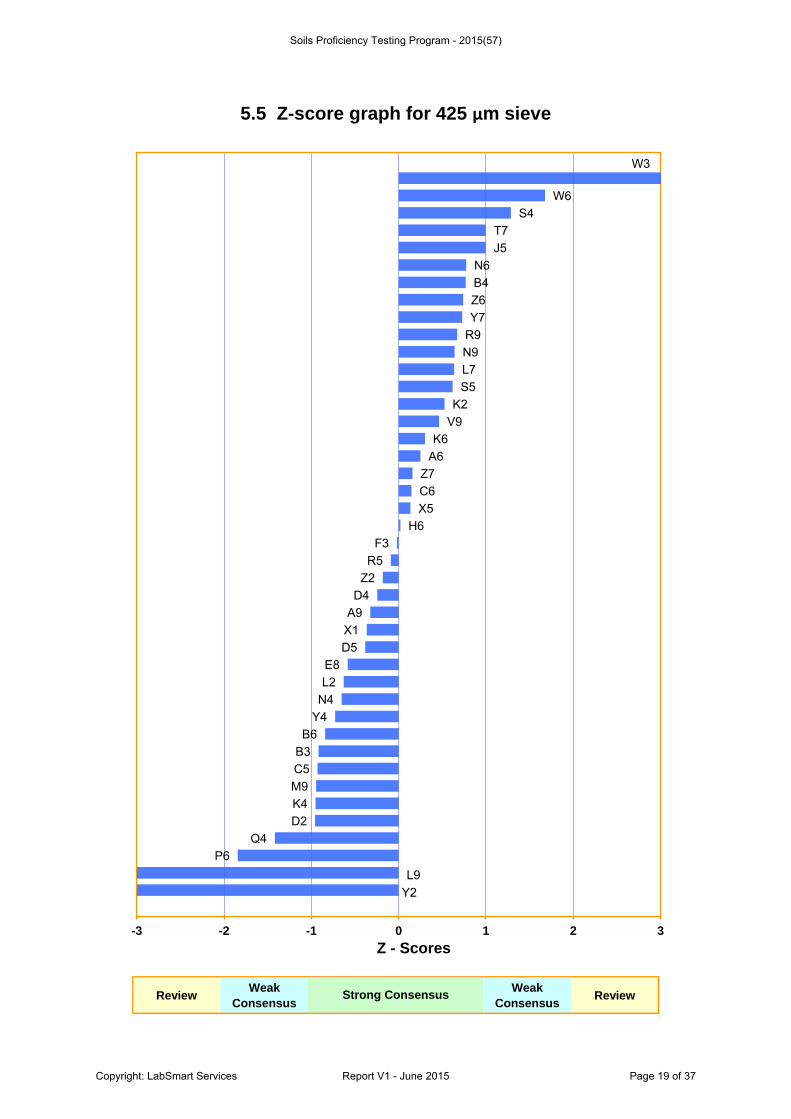
425 μm K4, W3, L9, D5 -
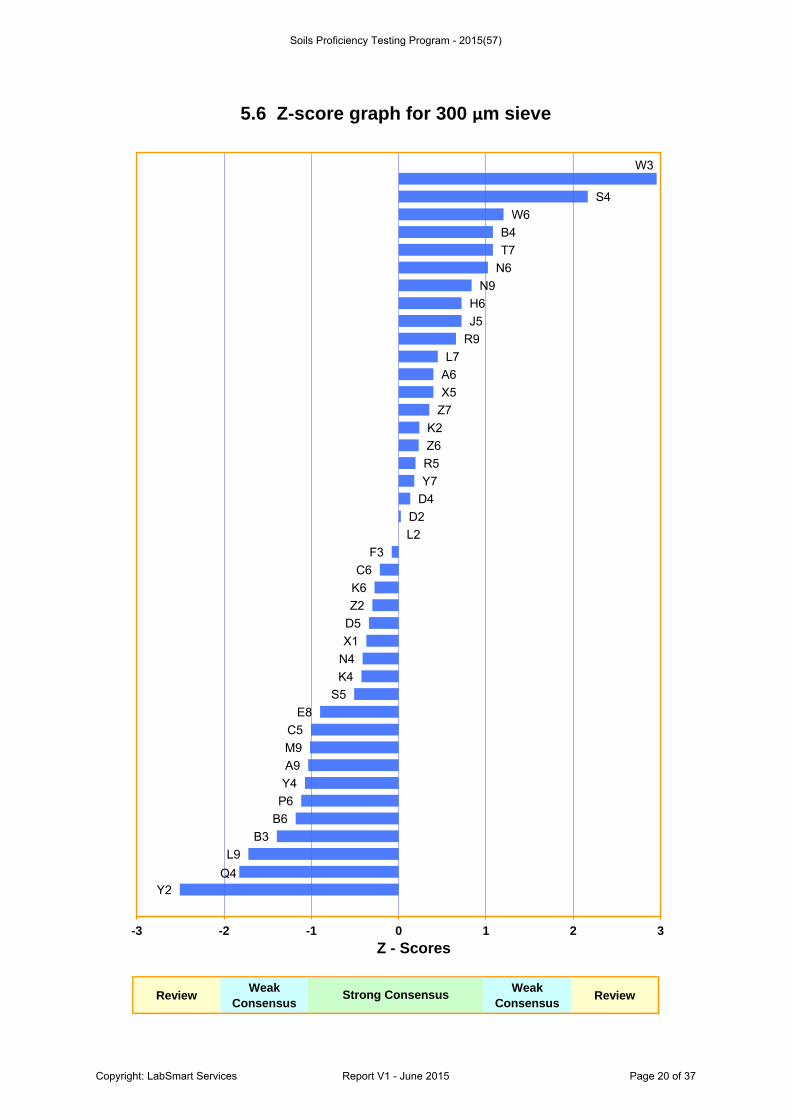
300 μm K4, W3, D5 -
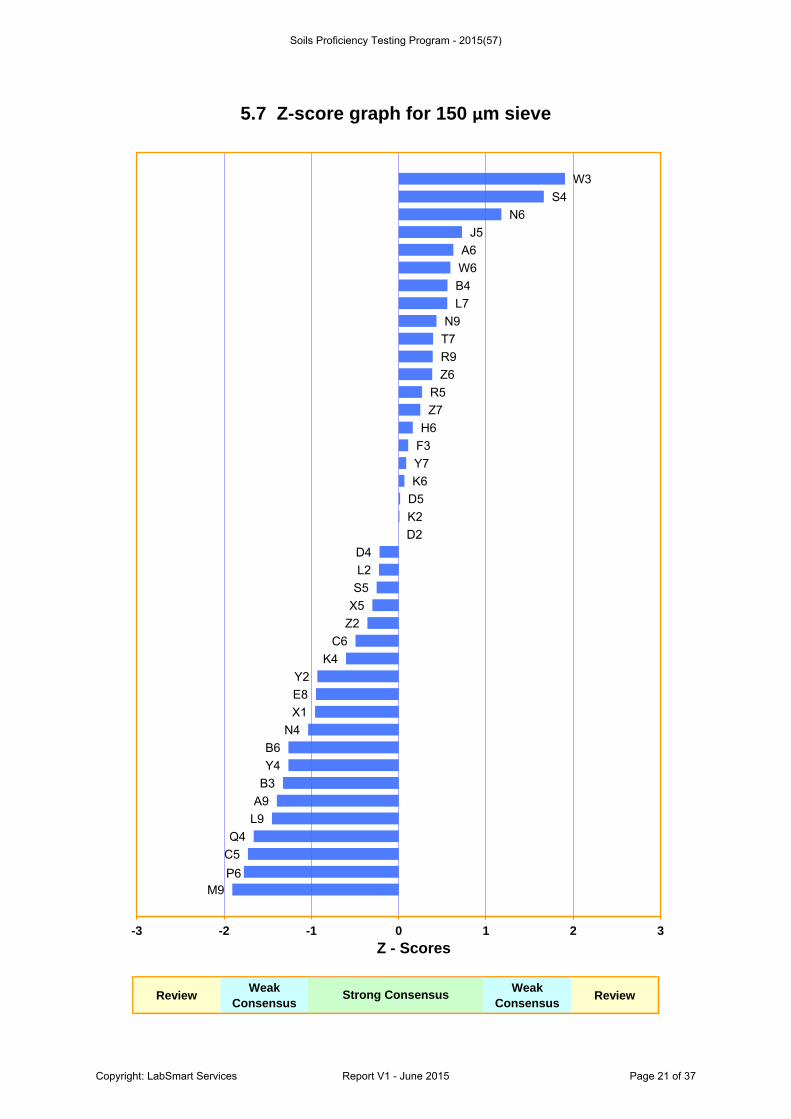
150 μm K4, W3, D5 -
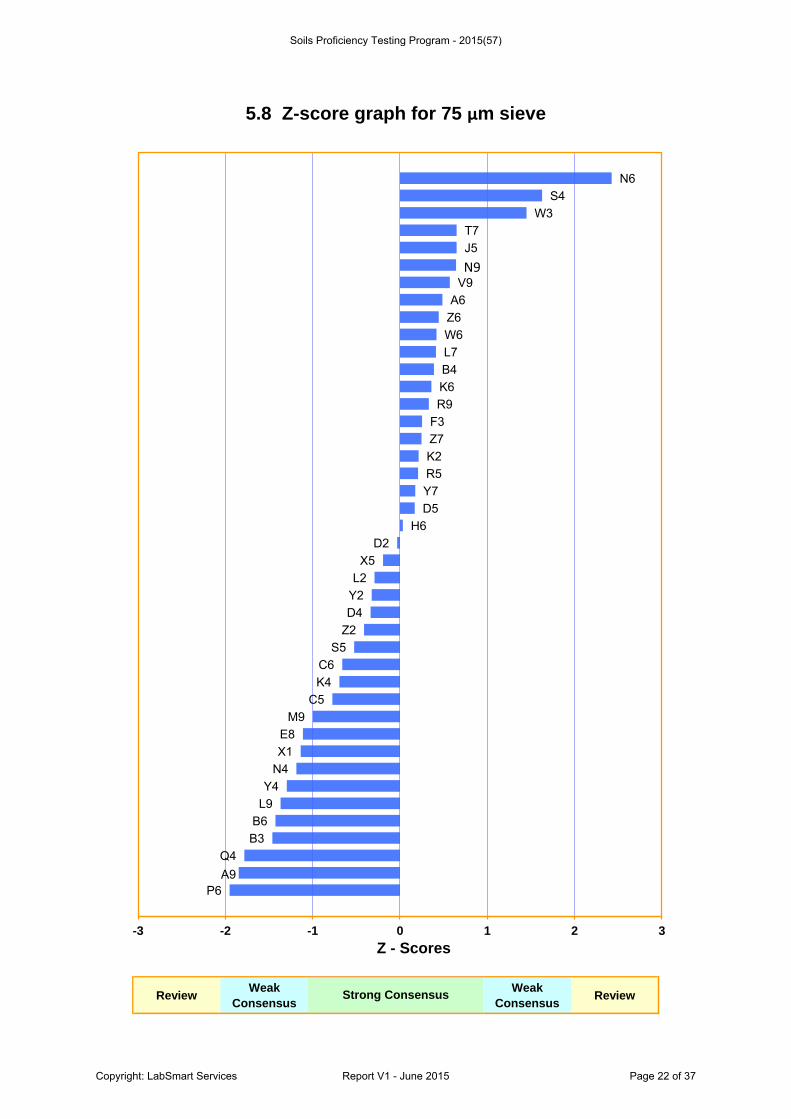
75 μm K4, W3, D5 -
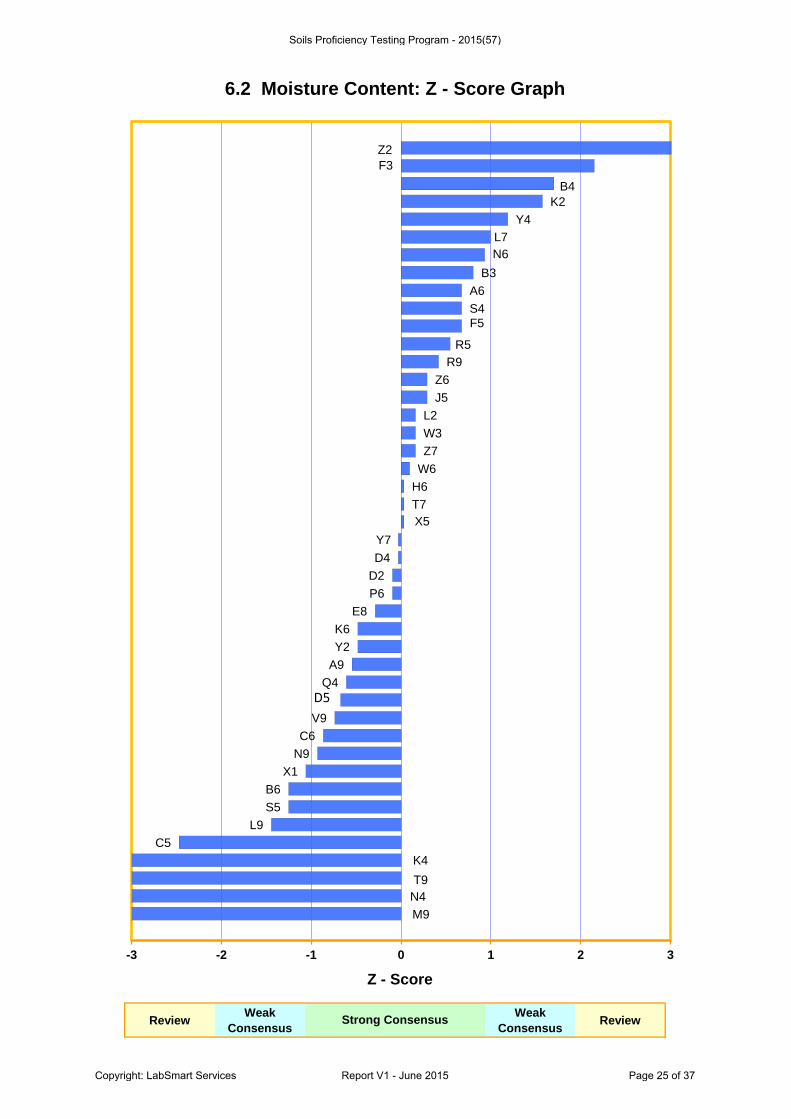
Moisture content K4, N4, T9, Z2, M9 -
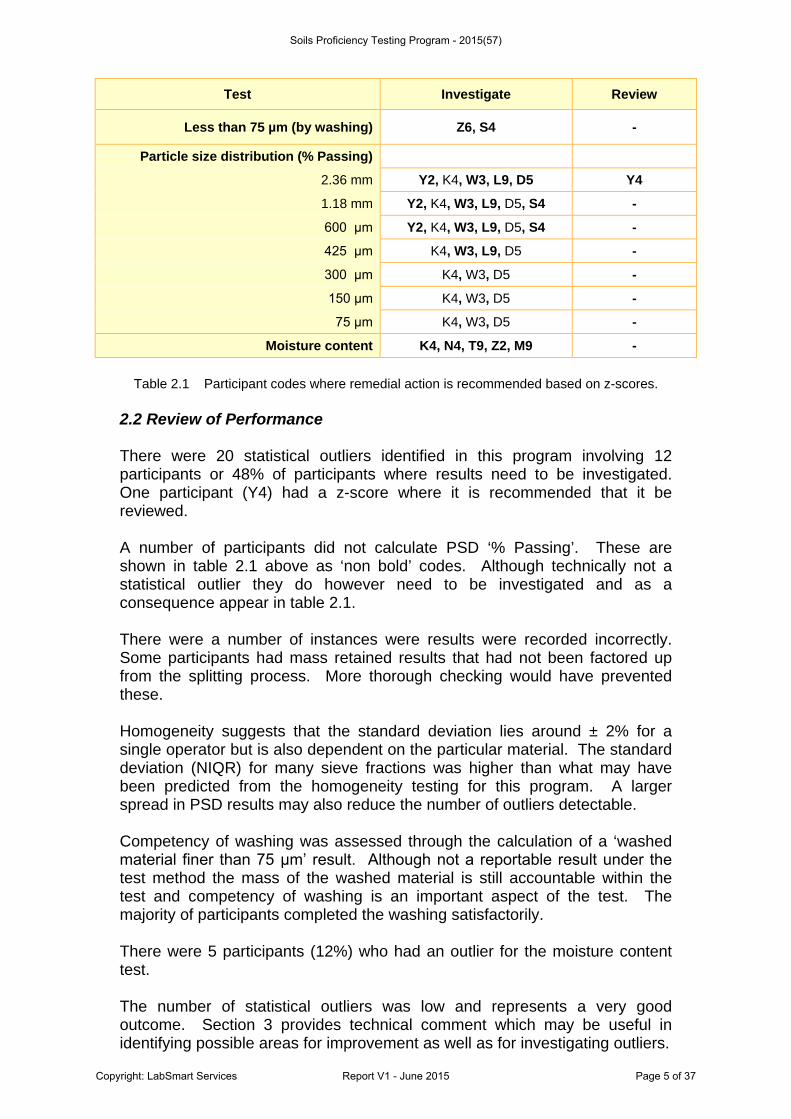
Table 2.1 Participant codes where remedial action is recommended based on z-scores. 2.2 Review of Performance There were 20 statistical outliers identified in this program involving 12 participants or 48% of participants where results need to be investigated. One participant (Y4) had a z-score where it is recommended that it be reviewed. A number of participants did not calculate PSD ‘% Passing’. These are shown in table 2.1 above as ‘non bold’ codes. Although technically not a statistical outlier they do however need to be investigated and as a consequence appear in table 2.1. There were a number of instances were results were recorded incorrectly. Some participants had mass retained results that had not been factored up from the splitting process. More thorough checking would have prevented these. Homogeneity suggests that the standard deviation lies around ± 2% for a single operator but is also dependent on the particular material. The standard deviation (NIQR) for many sieve fractions was higher than what may have been predicted from the homogeneity testing for this program. A larger spread in PSD results may also reduce the number of outliers detectable. Competency of washing was assessed through the calculation of a ‘washed material finer than 75 μm’ result. Although not a reportable result under the test method the mass of the washed material is still accountable within the test and competency of washing is an important aspect of the test. The majority of participants completed the washing satisfactorily. There were 5 participants (12%) who had an outlier for the moisture content test. The number of statistical outliers was low and represents a very good outcome. Section 3 provides technical comment which may be useful in identifying possible areas for improvement as well as for investigating outliers.
Soils Proficiency Testing Program - 2015(57)
Copyright: LabSmart Services Report V1 - June 2015 Page 5 of 37
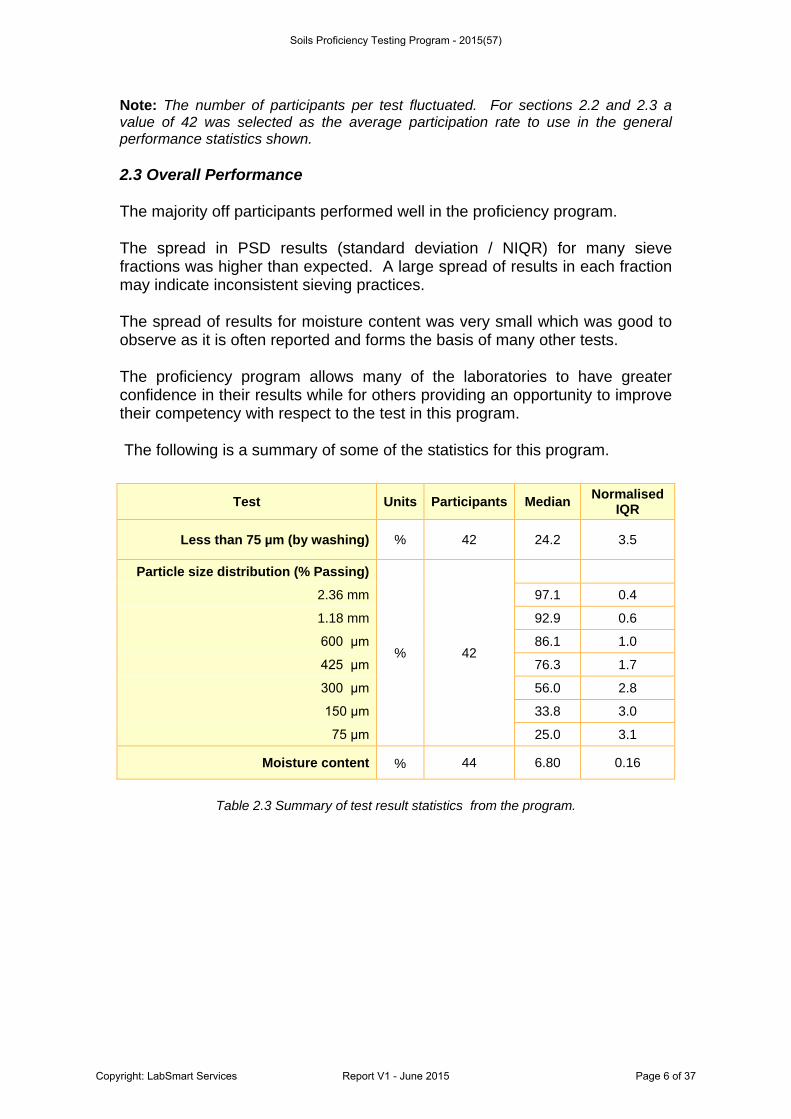
Note: The number of participants per test fluctuated. For sections 2.2 and 2.3 a value of 42 was selected as the average participation rate to use in the general performance statistics shown. 2.3 Overall Performance The majority off participants performed well in the proficiency program. The spread in PSD results (standard deviation / NIQR) for many sieve fractions was higher than expected. A large spread of results in each fraction may indicate inconsistent sieving practices. The spread of results for moisture content was very small which was good to observe as it is often reported and forms the basis of many other tests. The proficiency program allows many of the laboratories to have greater confidence in their results while for others providing an opportunity to improve their competency with respect to the test in this program. The following is a summary of some of the statistics for this program.
Test Units Participants Median Normalised IQR
Less than 75 µm (by washing) % 42 24.2 3.5
Particle size distribution (% Passing)
% 42
2.36 mm 97.1 0.4
1.18 mm 92.9 0.6
600 μm 86.1 1.0
425 μm 76.3 1.7
300 μm 56.0 2.8
150 μm 33.8 3.0
75 μm 25.0 3.1
Moisture content % 44 6.80 0.16
Table 2.3 Summary of test result statistics from the program.
Soils Proficiency Testing Program - 2015(57)
Copyright: LabSmart Services Report V1 - June 2015 Page 6 of 37
3 Technical comment Please note that the feedback in this section is aimed at providing information that can assist participants and laboratories to improve laboratory operations. All participants identified below are considered to have successfully completed the program unless otherwise identified in section 2. Each submission was assessed in order to provide additional feedback to participants. The data submitted on the program log sheet should be in agreement with the results provided. In other words the mass retained value should match the report % passing value. Much of the technical comment deals with inconsistencies around the submitted data. Many of the results submitted by participants (Appendix C) were checked and in many cases recalculated. In checking participant’s data it is often difficult to determine exactly what may be incorrect. The following comments should be taken as guide towards reviewing submitted results. Incorrect results do not necessarily mean they will be an outlier. Many of the participants identified below may not have shown up as outliers but the results may still be incorrect. In particular those with outliers or those that are mentioned on more than one occasion below would benefit from reviewing their results. Start Mass Participants were asked to use a 400g sample. Nominating a start mass helps ensure that participants are not disadvantaged through the use of too little material or too much. Too small a subsample is less forgiving should there be any separation in the material being sampled. The following participants used material that was either less than 350g or greater than 450g. V9, D5, H6, B4, X1 Cumulative results (mass or %) This was on the results log sheet in previous programs. It helped us provide feedback and with checking to verify the main data results, mass retained and mass passing. Very few either used this column or correctly completed the column so this information is no longer requested although there is space on the form for this information. Sieving a ‘split’ sub-sample The sieving method refers to AS 1289.1.1 for the appropriate sample size. In this case for a material with a maximum particle size of 2.36 mm the minimum sample size is 200g.
Soils Proficiency Testing Program - 2015(57)
Copyright: LabSmart Services Report V1 - June 2015 Page 7 of 37
Participants using a either the 300 or 200 mm diameter sieve would have needed to sieve the fine fraction in two possibly three passes to avoid overloading the sieves (300, 150 & 75 μm, depending on starting mass used). Alternatively the sample could have been split. The test method does not indicate when it is appropriate to split a sample. Most laboratories used 200mm sieves and split the sample (Appendix C) as this is the most efficient sieving approach (time). It may not necessarily be the most accurate approach. Splitting could under some situations decrease the overall accuracy if there has been a significant loss of material (or gain). In any sieving operation the smaller the amount of material sieved the greater the effect any loss or gain has on the final result. If a subsample was used, involving only the fractions less than 2.36, then the factor should have been calculated as follows: Factor = Dry Washed Mass – Mass retained on 2.36mm sieve Mass of split subsample Some participants indicated that a 200mm diameter sieve was used but it was not split i.e. sieved over a number of passes. A number of participants had mass retained results that had not been factored up (J5, T7, K6, N6, S4). Further checking of these results was not possible. Calculation of percent passing The following participant’s appeared to have used the incorrect start mass to calculate ‘% passing’. J5, T7, K6, S4, R9, C5, M9 The calculation of percent passing was checked by recalculating from the submitted ‘mass retained’ data for each fraction. Results that differed by more than 0.5 % were identified. The following participant’s ‘% passing’ results did not match those recalculated from the submitted ‘mass retained’ values. In some cases this may be as a result of not recording on the log sheet the ‘factored up’ masses correctly. J5, T7, Y4, K6, S5, S4, R9, C5, M9 Percent Passing the 75 μm sieve The calculation of percent passing the 75 μm sieve was checked by recalculating from the submitted ‘mass retained’ data for each fraction. Results that differed by more than 0.5 % were identified but these may have been due to incorrect start mass etc. Participants shown above need to also check their ‘% passing’ the 75 μm sieve calculation.
Soils Proficiency Testing Program - 2015(57)
Copyright: LabSmart Services Report V1 - June 2015 Page 8 of 37
Check Sums
AS 1289 3.6.1, Clause 5.4(b) (i) Note 3 indicates that the sieved fractions plus washed material and pan should equal the starting mass to within ± 1 % retained. The ‘mass retained’ results were used to check how well participants met this requirement. The majority of participants were below the 1% which was a good outcome. Participants Y2 had more than 1 % unaccounted and should check their result. A number of other participants (see those identified under % Passing) that had submitted incorrect data may also be outside the expected 1%. Incomplete sieving This is not easy to identify with this sample. Generally results where the ‘% passing’ at the larger sized sieves is high and the ‘% passing’ on the smaller sized sieves is low compared to the median values may indicate incomplete sieving. Some participants fit this profile and need to review their results. Washing It is important that laboratories can wash a sample thoroughly and not loose material. The particle size distribution test method asks for the washed and unwashed masses to be recorded but does not specifically calculate the amount of material washed out of the sample. However it is relevant to include the mass of the material obtained from the washing process in the ‘check sum’ determination. For this proficiency program the calculation of a ‘washed - less than 75 μm’ result has been used as a measure of competency in regards to washing. Section 4 details the statistical analysis performed on participant’s results. There were two outliers (Z6 and S4) that need to investigate the result obtained. Overall, washing by the majority of participants was very good. Although the estimated standard deviation is around 3.5% it is considered reasonable for material containing a large amount of fine material. Calculation of washed material less than 75 μm The ‘percent passing 75 μm’ calculation from the washing stage (Section 4) was checked using the submitted mass values. Results that differed by more than 0.5 % were identified. Participant’s (Y2, J5, S5, F3) ‘% passing’ results did not match the submitted ‘start mass’ and ‘dry washed mass’ values. Two participants (Z6, S4) could not be checked due to incorrect data. Incomplete washing The amount of material left in the pan after sieving can be used as an indication of how well the washing process has been performed. Some of the material can break down during sieving. There was a large amount of fine material in this sample and incomplete washing meant higher pan weights.
Soils Proficiency Testing Program - 2015(57)
Copyright: LabSmart Services Report V1 - June 2015 Page 9 of 37
Based on the homogeneity data the material also broke down. Around 2% can be attributed to material breaking down while sieving. Most participants performed the washing process well. Participant’s ‘wash % finer than 75 um’’ result minus the ‘% passing the 75 um sieve’ were generally around the 2 %. A number of participants report no material retained in the pan (N9, S5, B4, L2, and W6). This would be highly unlikely for this material. Decimal places used The decimal places used indicates broadly the accuracy and is related to the LOP. Understanding what is required and reporting on the log sheet correctly indicates a reasonable understanding of the test method. Around 24% either did not record or did not know their balances LOP. The proficiency program requested results to be recorded to two decimal places (nearest 0.01) on the log sheet where possible. If you have a balance that reads only to 0.1g then the nearest 0.1g is reasonable. The proficiency program requests results to 0.01 where it is possible as it helps improve the quality of the feedback that can be given. Less than 14% reported to the nearest 0.01g however only 33% indicated balance LOP was 0.5g. There was a random change in the number of decimal places reported within many of the participant’s set of results. The most common were:
• Start mass to 1 decimal place the rest of the weights to 2 decimal places • Weights to 1 decimal place while ‘% passing’ was to 2 decimal places • Dropped numbers, most likely zeros at end of a number
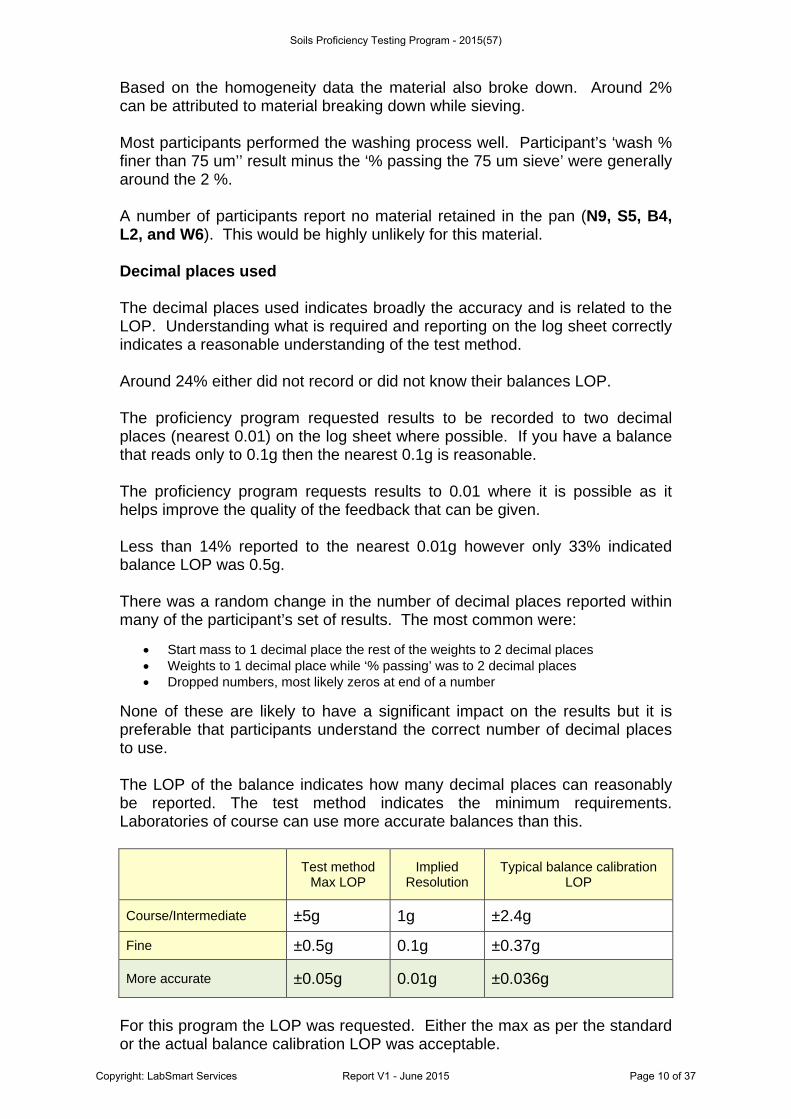
None of these are likely to have a significant impact on the results but it is preferable that participants understand the correct number of decimal places to use. The LOP of the balance indicates how many decimal places can reasonably be reported. The test method indicates the minimum requirements. Laboratories of course can use more accurate balances than this.
Test method Max LOP
Implied Resolution
Typical balance calibration LOP
Course/Intermediate ±5g 1g ±2.4g
Fine ±0.5g 0.1g ±0.37g
More accurate ±0.05g 0.01g ±0.036g
For this program the LOP was requested. Either the max as per the standard or the actual balance calibration LOP was acceptable.
Soils Proficiency Testing Program - 2015(57)
Copyright: LabSmart Services Report V1 - June 2015 Page 10 of 37
A number of participants would benefit from reviewing this aspect of the test. Moisture content Sample B was double bagged and each bag heat sealed. None of the participants indicated a problem with sealing of the sample B received. Any loss of moisture during transit was therefore very unlikely. All results except for three (N4, T9, M9) showed moisture content on the high side of that expected. Participants had a choice of testing the whole of sample B for moisture or taking a subsample. Most chose to use the whole sample with approximately 24% opting to use a sub sample. The wet mass of the sample was requested on the log sheet (Appendix C). The mass of the sample B was accurately known. A large number of participants recorded a weight greater than the sample that was sent. It raises the possibility that some participants may have used sample A to determine the moisture content by mistake? The following participants should check the start mass that was used. N4, P6, T9, F5, B4, L2 Those participants with outliers (K4, N4, T9, Z2, M9) need to check the calculation process.
Soils Proficiency Testing Program - 2015(57)
Copyright: LabSmart Services Report V1 - June 2015 Page 11 of 37
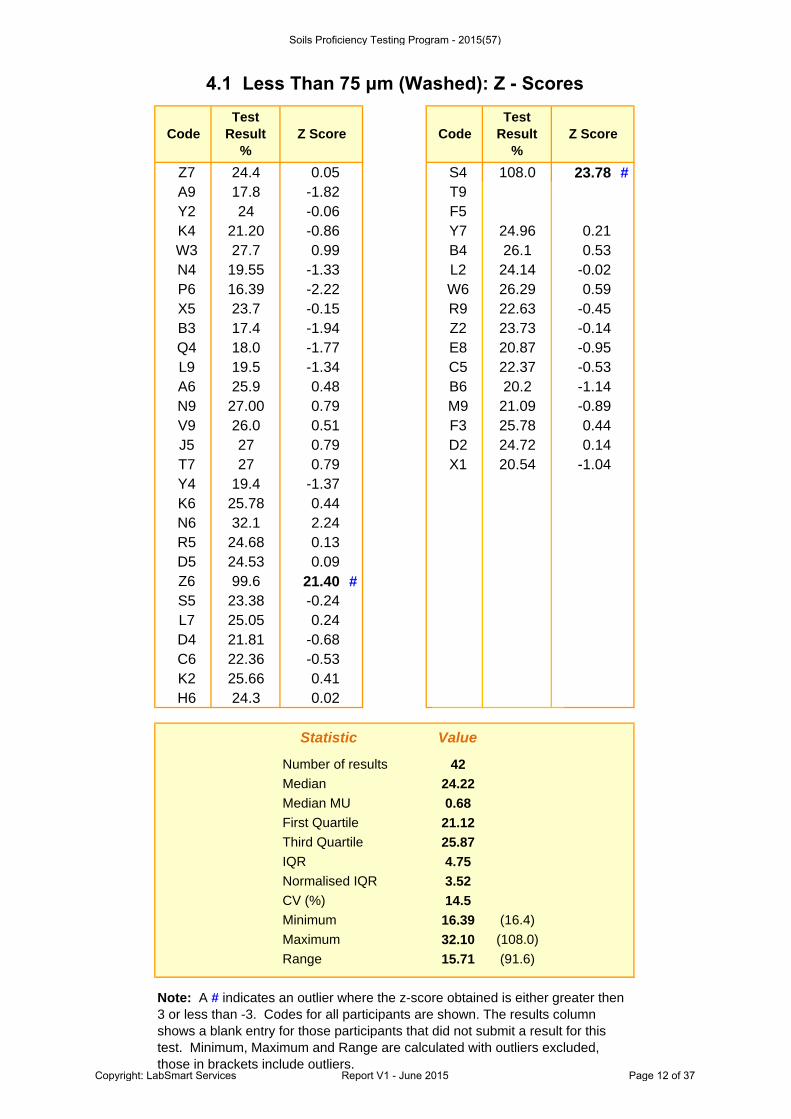
Z7 24.4 0.05 S4 108.0 23.78 #A9 17.8 -1.82 T9Y2 24 -0.06 F5K4 21.20 -0.86 Y7 24.96 0.21W3 27.7 0.99 B4 26.1 0.53N4 19.55 -1.33 L2 24.14 -0.02P6 16.39 -2.22 W6 26.29 0.59X5 23.7 -0.15 R9 22.63 -0.45B3 17.4 -1.94 Z2 23.73 -0.14Q4 18.0 -1.77 E8 20.87 -0.95L9 19.5 -1.34 C5 22.37 -0.53A6 25.9 0.48 B6 20.2 -1.14N9 27.00 0.79 M9 21.09 -0.89V9 26.0 0.51 F3 25.78 0.44J5 27 0.79 D2 24.72 0.14T7 27 0.79 X1 20.54 -1.04Y4 19.4 -1.37K6 25.78 0.44N6 32.1 2.24R5 24.68 0.13D5 24.53 0.09Z6 99.6 21.40 #S5 23.38 -0.24L7 25.05 0.24D4 21.81 -0.68C6 22.36 -0.53K2 25.66 0.41H6 24.3 0.02
Number of results 42Median 24.22Median MU 0.68First Quartile 21.12Third Quartile 25.87IQR 4.75Normalised IQR 3.52CV (%) 14.5Minimum 16.39 (16.4)Maximum 32.10 (108.0)Range 15.71 (91.6)
Note: A # indicates an outlier where the z-score obtained is either greater then 3 or less than -3. Codes for all participants are shown. The results column shows a blank entry for those participants that did not submit a result for this test. Minimum, Maximum and Range are calculated with outliers excluded, those in brackets include outliers.
4.1 Less Than 75 μm (Washed): Z - Scores
CodeTest
Result %
Z Score CodeTest
Result %
Z Score
Statistic Value
Soils Proficiency Testing Program - 2015(57)
Copyright: LabSmart Services Report V1 - June 2015 Page 12 of 37
Review Weak Consensus
Weak Consensus Review
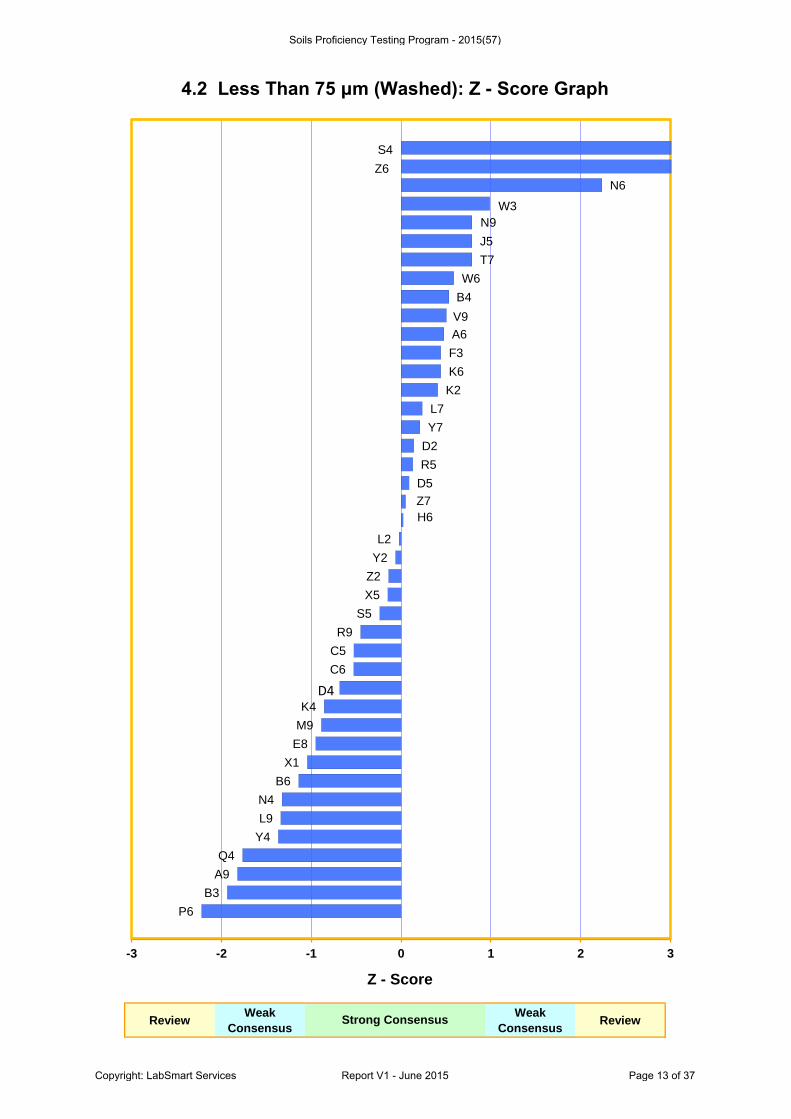
4.2 Less Than 75 μm (Washed): Z - Score Graph
Strong Consensus
P6 B3
A9 Q4
Y4 L9 N4
B6 X1
E8 M9 K4
H6
C6 C5 R9
S5 X5 Z2 Y2 L2
Z7 D5 R5 D2 Y7 L7
K2 K6 F3 A6
B4 W6
T7 J5
W3
V9
N6 Z6
-3 -2 -1 0 1 2 3
Z - Score
S4
N9
D4
Soils Proficiency Testing Program - 2015(57)
Copyright: LabSmart Services Report V1 - June 2015 Page 13 of 37
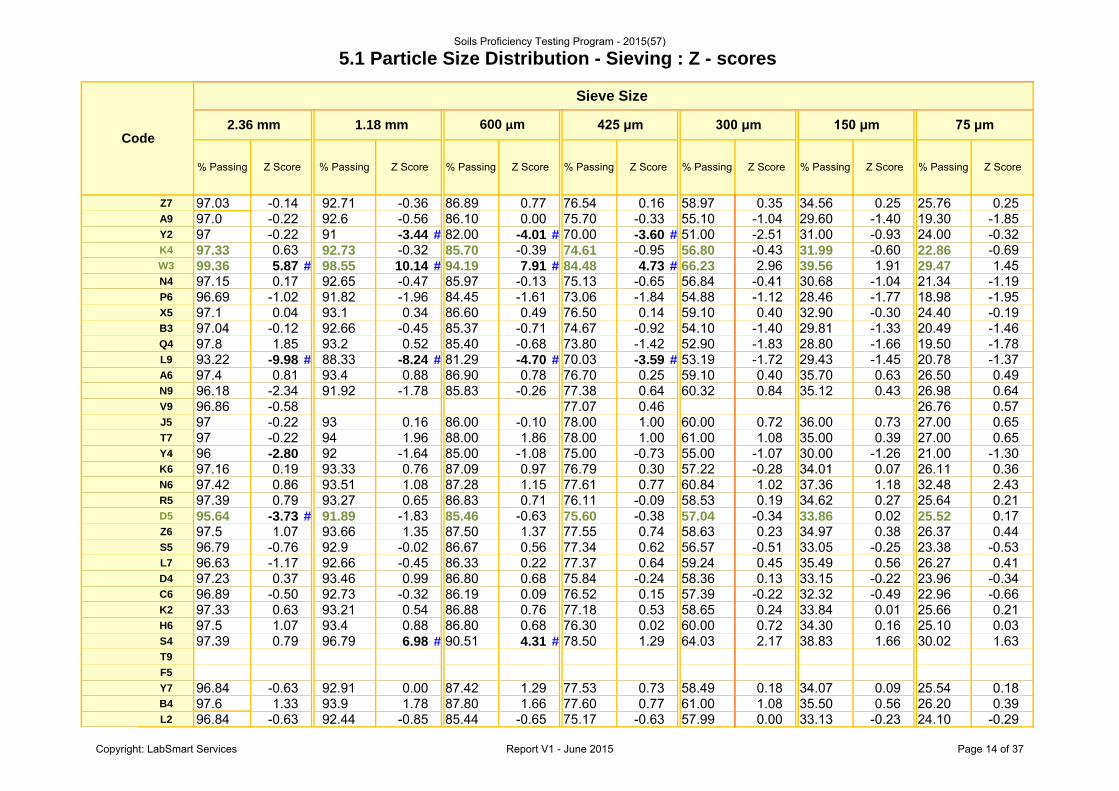
Z7 97.03 -0.14 92.71 -0.36 86.89 0.77 76.54 0.16 58.97 0.35 34.56 0.25 25.76 0.25A9 97.0 -0.22 92.6 -0.56 86.10 0.00 75.70 -0.33 55.10 -1.04 29.60 -1.40 19.30 -1.85Y2 97 -0.22 91 -3.44 # 82.00 -4.01 # 70.00 -3.60 # 51.00 -2.51 31.00 -0.93 24.00 -0.32K4 97.33 0.63 92.73 -0.32 85.70 -0.39 74.61 -0.95 56.80 -0.43 31.99 -0.60 22.86 -0.69W3 99.36 5.87 # 98.55 10.14 # 94.19 7.91 # 84.48 4.73 # 66.23 2.96 39.56 1.91 29.47 1.45N4 97.15 0.17 92.65 -0.47 85.97 -0.13 75.13 -0.65 56.84 -0.41 30.68 -1.04 21.34 -1.19P6 96.69 -1.02 91.82 -1.96 84.45 -1.61 73.06 -1.84 54.88 -1.12 28.46 -1.77 18.98 -1.95X5 97.1 0.04 93.1 0.34 86.60 0.49 76.50 0.14 59.10 0.40 32.90 -0.30 24.40 -0.19B3 97.04 -0.12 92.66 -0.45 85.37 -0.71 74.67 -0.92 54.10 -1.40 29.81 -1.33 20.49 -1.46Q4 97.8 1.85 93.2 0.52 85.40 -0.68 73.80 -1.42 52.90 -1.83 28.80 -1.66 19.50 -1.78L9 93.22 -9.98 # 88.33 -8.24 # 81.29 -4.70 # 70.03 -3.59 # 53.19 -1.72 29.43 -1.45 20.78 -1.37A6 97.4 0.81 93.4 0.88 86.90 0.78 76.70 0.25 59.10 0.40 35.70 0.63 26.50 0.49N9 96.18 -2.34 91.92 -1.78 85.83 -0.26 77.38 0.64 60.32 0.84 35.12 0.43 26.98 0.64V9 96.86 -0.58 77.07 0.46 26.76 0.57J5 97 -0.22 93 0.16 86.00 -0.10 78.00 1.00 60.00 0.72 36.00 0.73 27.00 0.65T7 97 -0.22 94 1.96 88.00 1.86 78.00 1.00 61.00 1.08 35.00 0.39 27.00 0.65Y4 96 -2.80 92 -1.64 85.00 -1.08 75.00 -0.73 55.00 -1.07 30.00 -1.26 21.00 -1.30K6 97.16 0.19 93.33 0.76 87.09 0.97 76.79 0.30 57.22 -0.28 34.01 0.07 26.11 0.36N6 97.42 0.86 93.51 1.08 87.28 1.15 77.61 0.77 60.84 1.02 37.36 1.18 32.48 2.43R5 97.39 0.79 93.27 0.65 86.83 0.71 76.11 -0.09 58.53 0.19 34.62 0.27 25.64 0.21D5 95.64 -3.73 # 91.89 -1.83 85.46 -0.63 75.60 -0.38 57.04 -0.34 33.86 0.02 25.52 0.17Z6 97.5 1.07 93.66 1.35 87.50 1.37 77.55 0.74 58.63 0.23 34.97 0.38 26.37 0.44S5 96.79 -0.76 92.9 -0.02 86.67 0.56 77.34 0.62 56.57 -0.51 33.05 -0.25 23.38 -0.53L7 96.63 -1.17 92.66 -0.45 86.33 0.22 77.37 0.64 59.24 0.45 35.49 0.56 26.27 0.41D4 97.23 0.37 93.46 0.99 86.80 0.68 75.84 -0.24 58.36 0.13 33.15 -0.22 23.96 -0.34C6 96.89 -0.50 92.73 -0.32 86.19 0.09 76.52 0.15 57.39 -0.22 32.32 -0.49 22.96 -0.66K2 97.33 0.63 93.21 0.54 86.88 0.76 77.18 0.53 58.65 0.24 33.84 0.01 25.66 0.21H6 97.5 1.07 93.4 0.88 86.80 0.68 76.30 0.02 60.00 0.72 34.30 0.16 25.10 0.03S4 97.39 0.79 96.79 6.98 # 90.51 4.31 # 78.50 1.29 64.03 2.17 38.83 1.66 30.02 1.63T9
F5
Y7 96.84 -0.63 92.91 0.00 87.42 1.29 77.53 0.73 58.49 0.18 34.07 0.09 25.54 0.18B4 97.6 1.33 93.9 1.78 87.80 1.66 77.60 0.77 61.00 1.08 35.50 0.56 26.20 0.39L2 96.84 -0.63 92.44 -0.85 85.44 -0.65 75.17 -0.63 57.99 0.00 33.13 -0.23 24.10 -0.29
Sieve Size
% Passing
5.1 Particle Size Distribution - Sieving : Z - scores
2.36 mm 1.18 mm 600 μm 425 μm 300 μm 150 μm 75 μm
Z Score Z Score % Passing Z Score % Passing Z Score Z Score% Passing% PassingZ Score Z Score % Passing% Passing
Code
Soils Proficiency Testing Program - 2015(57)
Copyright: LabSmart Services Report V1 - June 2015 Page 14 of 37
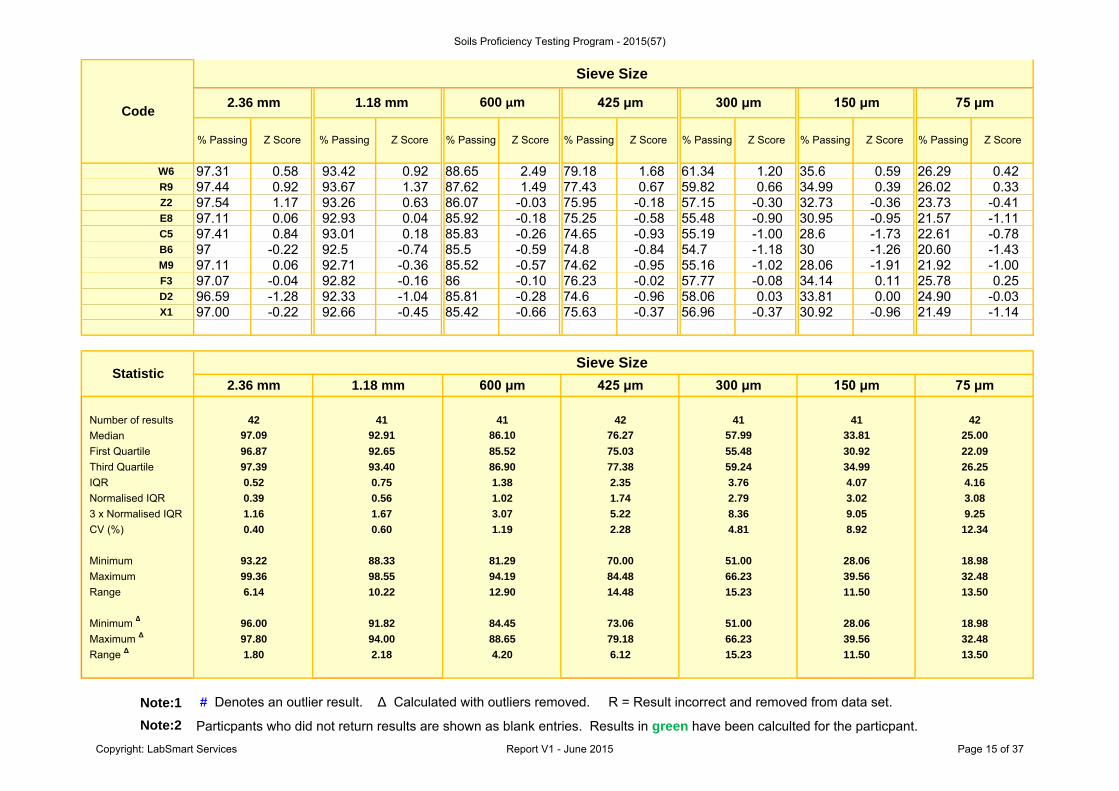
W6 97.31 0.58 93.42 0.92 88.65 2.49 79.18 1.68 61.34 1.20 35.6 0.59 26.29 0.42R9 97.44 0.92 93.67 1.37 87.62 1.49 77.43 0.67 59.82 0.66 34.99 0.39 26.02 0.33Z2 97.54 1.17 93.26 0.63 86.07 -0.03 75.95 -0.18 57.15 -0.30 32.73 -0.36 23.73 -0.41E8 97.11 0.06 92.93 0.04 85.92 -0.18 75.25 -0.58 55.48 -0.90 30.95 -0.95 21.57 -1.11C5 97.41 0.84 93.01 0.18 85.83 -0.26 74.65 -0.93 55.19 -1.00 28.6 -1.73 22.61 -0.78B6 97 -0.22 92.5 -0.74 85.5 -0.59 74.8 -0.84 54.7 -1.18 30 -1.26 20.60 -1.43M9 97.11 0.06 92.71 -0.36 85.52 -0.57 74.62 -0.95 55.16 -1.02 28.06 -1.91 21.92 -1.00F3 97.07 -0.04 92.82 -0.16 86 -0.10 76.23 -0.02 57.77 -0.08 34.14 0.11 25.78 0.25D2 96.59 -1.28 92.33 -1.04 85.81 -0.28 74.6 -0.96 58.06 0.03 33.81 0.00 24.90 -0.03X1 97.00 -0.22 92.66 -0.45 85.42 -0.66 75.63 -0.37 56.96 -0.37 30.92 -0.96 21.49 -1.14
Note:1
Note:2
12.34
18.98
8.92
28.06
42
3.07
1.19
81.29
42
25.00
22.09
26.25
4.16
3.08
9.25
14.48
39.56
11.50
41
94.19
76.27
75.03
77.38
2.35
1.74
5.22
2.28
70.00
86.10
85.52
86.90
33.81
30.92
34.99
4.07
3.02
9.05
1.38
1.02
Sieve Size
2.36 mm 600 μm 75 μm425 μm 300 μm 150 μm
Sieve Size
2.36 mm 1.18 mm 600 μm 425 μm
1.18 mm
41
92.91
92.65
93.40
0.75
0.56
1.67
0.60
42
97.09
75 μm
% Passing Z Score
4.20
Range
Median First Quartile Third Quartile IQR Normalised IQR
12.90
99.36
6.14
3 x Normalised IQR CV (%)
Range Δ Maximum Δ Minimum Δ 96.00
97.80
Z Score
1.80
91.82
94.00
2.18
98.55
88.33
Maximum
73.06
79.18
6.12
Minimum
96.87
97.39
0.52
0.39
1.16
0.40
88.65
Particpants who did not return results are shown as blank entries. Results in green have been calculted for the particpant.
# Denotes an outlier result. Δ Calculated with outliers removed. R = Result incorrect and removed from data set.
32.48
13.50
41
57.99
55.48
59.24
3.76
2.79
8.36
4.81
51.00
51.00
66.23
15.23
28.06
39.56
11.50
93.22
32.48
13.50
41
18.98
66.23
15.2310.22
84.48
Statistic
Number of results
84.45
Code300 μm 150 μm
% Passing Z Score % Passing Z Score % Passing Z Score % Passing Z Score % Passing Z Score % Passing
Soils Proficiency Testing Program - 2015(57)
Copyright: LabSmart Services Report V1 - June 2015 Page 15 of 37
ReviewWeak
Consensus
Weak
ConsensusReview
5.2 Z-score graph for 2.36 mm sieve
Strong Consensus
Y4 N9
D2 L7
P6 S5
Y7 L2 V9 C6
A9 Y2 J5 T7 B6 X1
Z7 B3
F3 X5 E8 M9
N4 K6
D4 W6 K4 K2
R5 S4 A6 C5 N6 R9
Z6 H6
Z2 B4
Q4
L9
-3 -2 -1 0 1 2 3
Z - Scores
W3
D5
Soils Proficiency Testing Program - 2015(57)
Copyright: LabSmart Services Report V1 - June 2015 Page 16 of 37
ReviewWeak
Consensus
Weak
ConsensusReview
5.3 Z-score graph for 1.18 mm sieve
Strong Consensus
P6 D5 N9
Y4 D2
L2 B6
A9 N4 B3 L7 X1
Z7 M9 K4 C6
F3 S5
Y7 E8
J5 C5
X5 Q4 K2
Z2 R5
K6 A6 H6 W6 D4
N6 Z6 R9
B4 T7
W3
-3 -2 -1 0 1 2 3
Z - Scores
S4
L9 Y2
Soils Proficiency Testing Program - 2015(57)
Copyright: LabSmart Services Report V1 - June 2015 Page 17 of 37
ReviewWeak
Consensus
Weak
ConsensusReview
5.4 Z-score graph for 600 μm sieve
Strong Consensus
P6 Y4
B3 Q4 X1 L2 D5 B6 M9
K4 D2 N9 C5
E8 N4 J5 F3 Z2
A9 C6
L7 X5 S5
D4 H6 R5 K2 Z7 A6
K6 N6
Y7 Z6
R9 B4
T7 W6
W3
-3 -2 -1 0 1 2 3
Z - Scores
S4
L9 Y2
Soils Proficiency Testing Program - 2015(57)
Copyright: LabSmart Services Report V1 - June 2015 Page 18 of 37
ReviewWeak
Consensus
Weak
ConsensusReview
5.5 Z-score graph for 425 μm sieve
Strong Consensus
P6 Q4
D2 K4 M9 C5 B3 B6
Y4 N4 L2 E8
D5 X1 A9 D4
Z2 R5
F3 H6
X5 C6 Z7
A6 K6
V9 K2
S5 L7 N9 R9 Y7 Z6 B4 N6
J5 T7
S4 W6
W3
-3 -2 -1 0 1 2 3
Z - Scores
Y2 L9
Soils Proficiency Testing Program - 2015(57)
Copyright: LabSmart Services Report V1 - June 2015 Page 19 of 37
ReviewWeak
Consensus
Weak
ConsensusReview
5.6 Z-score graph for 300 μm sieve
Strong Consensus
Y2 Q4 L9
B3 B6 P6 Y4 A9 M9 C5
E8 S5
K4 N4 X1 D5 Z2 K6 C6
F3 L2 D2
D4 Y7 R5 Z6 K2
Z7 X5 A6 L7
R9 J5 H6
N9 N6 T7 B4
W6 S4
W3
-3 -2 -1 0 1 2 3
Z - Scores
Soils Proficiency Testing Program - 2015(57)
Copyright: LabSmart Services Report V1 - June 2015 Page 20 of 37
ReviewWeak
Consensus
Weak
ConsensusReview
5.7 Z-score graph for 150 μm sieve
Strong Consensus
M9 P6 C5 Q4
L9 A9 B3 Y4 B6
N4 X1 E8 Y2
K4 C6
Z2 X5 S5 L2 D4
D2 K2 D5 K6 Y7 F3 H6
Z7 R5
Z6 R9 T7 N9
L7 B4 W6 A6
J5 N6
S4 W3
-3 -2 -1 0 1 2 3
Z - Scores
Soils Proficiency Testing Program - 2015(57)
Copyright: LabSmart Services Report V1 - June 2015 Page 21 of 37
ReviewWeak
Consensus
Weak
ConsensusReview
5.8 Z-score graph for 75 μm sieve
Strong Consensus
P6 A9 Q4
B3 B6 L9 Y4
N4 X1 E8
M9 C5
K4 C6
S5 Z2 D4 Y2 L2
X5 D2
H6 D5 Y7 R5 K2 Z7 F3 R9 K6 B4 L7 W6 Z6 A6
V9
J5 T7
W3 S4
N6
-3 -2 -1 0 1 2 3
Z - Scores
N9
Soils Proficiency Testing Program - 2015(57)
Copyright: LabSmart Services Report V1 - June 2015 Page 22 of 37

This page has been left blank intentionally.
Soils Proficiency Testing Program - 2015(57)
Copyright: LabSmart Services Report V1 - June 2015 Page 23 of 37
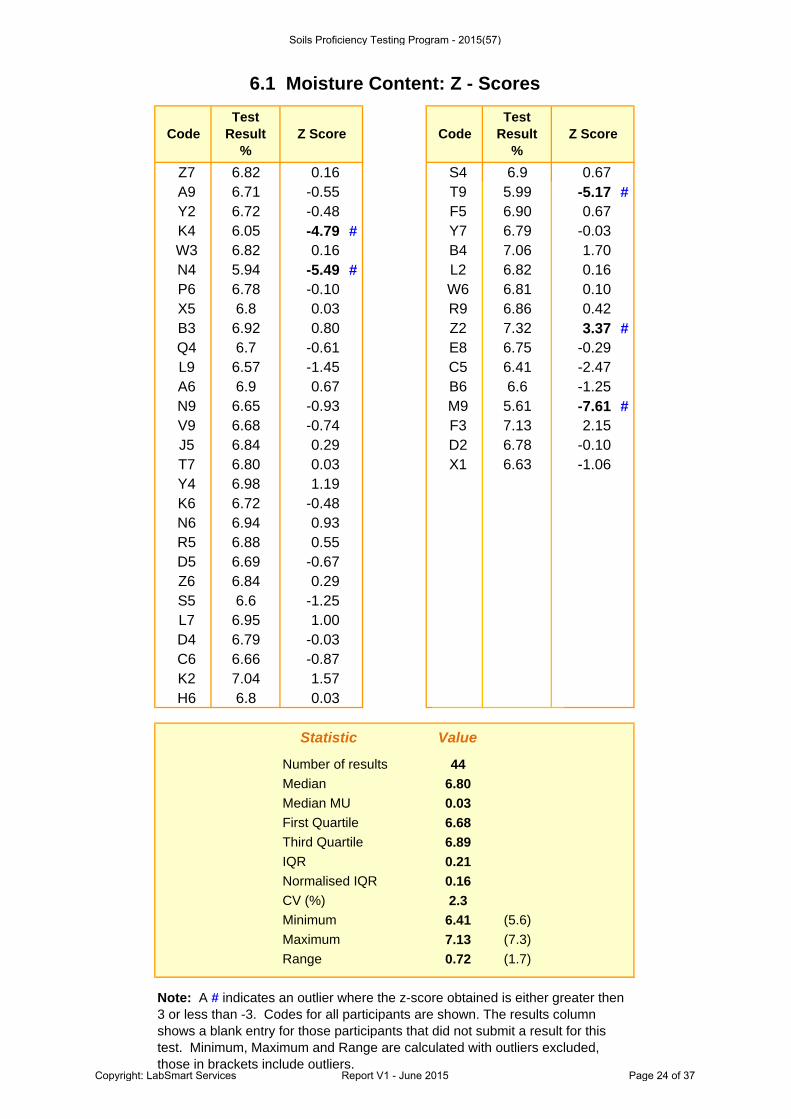
Z7 6.82 0.16 S4 6.9 0.67A9 6.71 -0.55 T9 5.99 -5.17 #Y2 6.72 -0.48 F5 6.90 0.67K4 6.05 -4.79 # Y7 6.79 -0.03W3 6.82 0.16 B4 7.06 1.70N4 5.94 -5.49 # L2 6.82 0.16P6 6.78 -0.10 W6 6.81 0.10X5 6.8 0.03 R9 6.86 0.42B3 6.92 0.80 Z2 7.32 3.37 #Q4 6.7 -0.61 E8 6.75 -0.29L9 6.57 -1.45 C5 6.41 -2.47A6 6.9 0.67 B6 6.6 -1.25N9 6.65 -0.93 M9 5.61 -7.61 #V9 6.68 -0.74 F3 7.13 2.15J5 6.84 0.29 D2 6.78 -0.10T7 6.80 0.03 X1 6.63 -1.06Y4 6.98 1.19K6 6.72 -0.48N6 6.94 0.93R5 6.88 0.55D5 6.69 -0.67Z6 6.84 0.29S5 6.6 -1.25L7 6.95 1.00D4 6.79 -0.03C6 6.66 -0.87K2 7.04 1.57H6 6.8 0.03
Number of results 44Median 6.80Median MU 0.03First Quartile 6.68Third Quartile 6.89IQR 0.21Normalised IQR 0.16CV (%) 2.3Minimum 6.41 (5.6)Maximum 7.13 (7.3)Range 0.72 (1.7)
Note: A # indicates an outlier where the z-score obtained is either greater then 3 or less than -3. Codes for all participants are shown. The results column shows a blank entry for those participants that did not submit a result for this test. Minimum, Maximum and Range are calculated with outliers excluded, those in brackets include outliers.
6.1 Moisture Content: Z - Scores
CodeTest
Result %
Z Score CodeTest
Result %
Z Score
Statistic Value
Soils Proficiency Testing Program - 2015(57)
Copyright: LabSmart Services Report V1 - June 2015 Page 24 of 37
Review Weak Consensus
Weak Consensus Review
6.2 Moisture Content: Z - Score Graph
Strong Consensus
C5 L9
S5 B6
X1 N9 C6
V9
Y7
Q4 A9 Y2 K6
E8 P6 D2 D4
X5 T7 H6 W6 Z7 W3 L2
J5 Z6
R9
F5 S4 A6
B3
L7
R5
Y4 K2
B4
F3
-3 -2 -1 0 1 2 3
Z - Score
Z2
T9
N6
M9 N4
K4
D5
Soils Proficiency Testing Program - 2015(57)
Copyright: LabSmart Services Report V1 - June 2015 Page 25 of 37
7. Program Overview 7.1 Program Design The proficiency program consisted of two soil samples marked ‘Sample A’ and ‘Sample B’. Design The program is held annually. The test requires a minimum skill level. Adherence to the test method is essential for consistent test results. It is expected that the material selected for these tests will present a reasonable assessment of the overall competency of the tester and industry performance. The program was designed to provide technical feedback regarding performance as well as possible improvements in performance. Further considerations involving the design of the program are detailed below. Sample A - PSD The sieving determination has been designed to allow accurate comparisons between laboratories to be made. The sample used contains sufficient material at each fraction size to produce a result suitable for comparative purposes. The number of significant places that results are required to be submitted has been increased to facilitate comparison. The test method allows for a moisture correction to be performed. For this program it was desirable to focus as much as possible on the sieving outcome. As a consequence the material was dried prior to commencement by each participant to eliminate any variability due to a moisture correction. The sieving standard does not cover material passing the 75 μm sieve as it is covered by the hydrometer test. It is however desirable to record this information. It allows “check sums” to be performed on the sieving analysis and also as a measure as to how well the washing operation may have been performed. A sample was selected to ensure there was overloading of some sieves to simulate typical sieving operations and to fully cover the PSD process. The sample size was restricted to a set starting mass to reduce the variability associated with variable sample size. Unaccounted material losses or gains (lost material, binding, material break down etc.) have a greater effect the smaller the sample size. Laboratories performance is based on the ‘% passing’ results.
Soils Proficiency Testing Program - 2015(57)
Copyright: LabSmart Services Report V1 - June 2015 Page 26 of 37
Sample B – Moisture Content Moisture content is a common test performed by soil laboratories. Samples of accurately known moisture were provided to ensure that homogeneity would be satisfactory for the program. The theoretical moisture content was 6.44 ± 0.09 %. Homogeneity samples were tested to ensure integrity of the samples sent and validate the theoretical moisture content. A variation larger than the theoretical is expected due experimental error e.g. incomplete drying etc. Role of Proficiency Testing The determination of outliers is an important task of this proficiency program. A secondary function is to provide feedback that can help those with outliers identify possible areas to investigate as well as assist all participants to improve. This information also helps with identifying any random or systematic errors associated with the test methodology. Proficiency testing enables participants to measure competency against others. It is also a measure of staff performance and the equipment used. Next to measurement uncertainty it is the next most useful tool a laboratory has in better understanding the performance of a test. In addition to the statistics, proficiency programs often obtain other information that is not normally available to a laboratory. It allows for a better understanding of the testing and can provide information that can lead to improvements in the testing process or test method. Participant Assessment Assessment of each participant is based on a z-score that is related to the program consensus value (median) and compliance to proficiency program requirements including the correct calculation of results. Reporting of Outliers - Z-Scores Summary A “Z-Scores Summary” is issued soon after the majority of results are received. This gives participants early feedback as to any program outliers. The summary is available on the LabSmart Services website up until the final report is issued. The final report contains detailed technical feedback regarding the performance of tests. Additional Information Requested This program requested additional information as detailed in Appendix C not usually reported. The additional information is however consistent with the performance of the test and the records the test method requires laboratories to maintain. The additional information is used to interpret participant’s performance and assist with providing technical comment including feedback on outliers and possible participant improvement.
Soils Proficiency Testing Program - 2015(57)
Copyright: LabSmart Services Report V1 - June 2015 Page 27 of 37
Participants results were analysed as received regardless of whether there were more or less significant figures than the number requested by the program. Data Checks As observed in other proficiency programs ‘operator errors’ often creep into the result calculation process. Assessment of participants data was incorporated into this program to ensure data was comparable. 7.2 Sample Preparation Sample A - PSD Sample A consisted of approximately 3.5 kg of a dark moist soil. Samples for the program were drawn and packaged from a single, well mixed, lot. Ten samples were drawn evenly spaced throughout the lot for homogeneity testing. Each participant received randomly drawn samples from the remainder. A unique participation code was assigned to each sample. Each sample was placed in a plastic bag and heat sealed. Sample B – Moisture Content Sample B consisted of approximately 1 kg of a dark soil. A single lot of bulk sample was oven dried and well mixed. A fixed weight was added to a sample bag. A known amount of water was added to each sample. Bags were immediately heat sealed placed into a second bag and heat sealed again. Ten samples were drawn evenly spaced throughout the lot for homogeneity testing. Each participant received randomly drawn samples from the remainder. A unique participation code was assigned to each sample. Sample A and B were packed into a sturdy box prior to dispatch. 7.3 Packaging and Instructions Each participant received two sealed plastic bags of soil with a combined weight of approximately 4.5 kg. Laboratories were instructed to test according to the nominated test method and report to the accuracy indicated on the ‘results log’ sheet. See ‘Appendix A’ for a copy of the instructions issued to participants and ‘Appendix B’ for the log sheet used. 7.4 Quarantine Samples sent to Western Australia are subject to quarantine regulations that require treatment of the soil prior to sending. Samples sent were heat treated and had quarantine paperwork enclosed. Sample A was sent wet to all other States but dry to WA. A separate note was enclosed for WA participants advising that dry material is more prone to separation during transit. A separate note was enclosed advising on what additional steps were needed to test this material.
Soils Proficiency Testing Program - 2015(57)
Copyright: LabSmart Services Report V1 - June 2015 Page 28 of 37
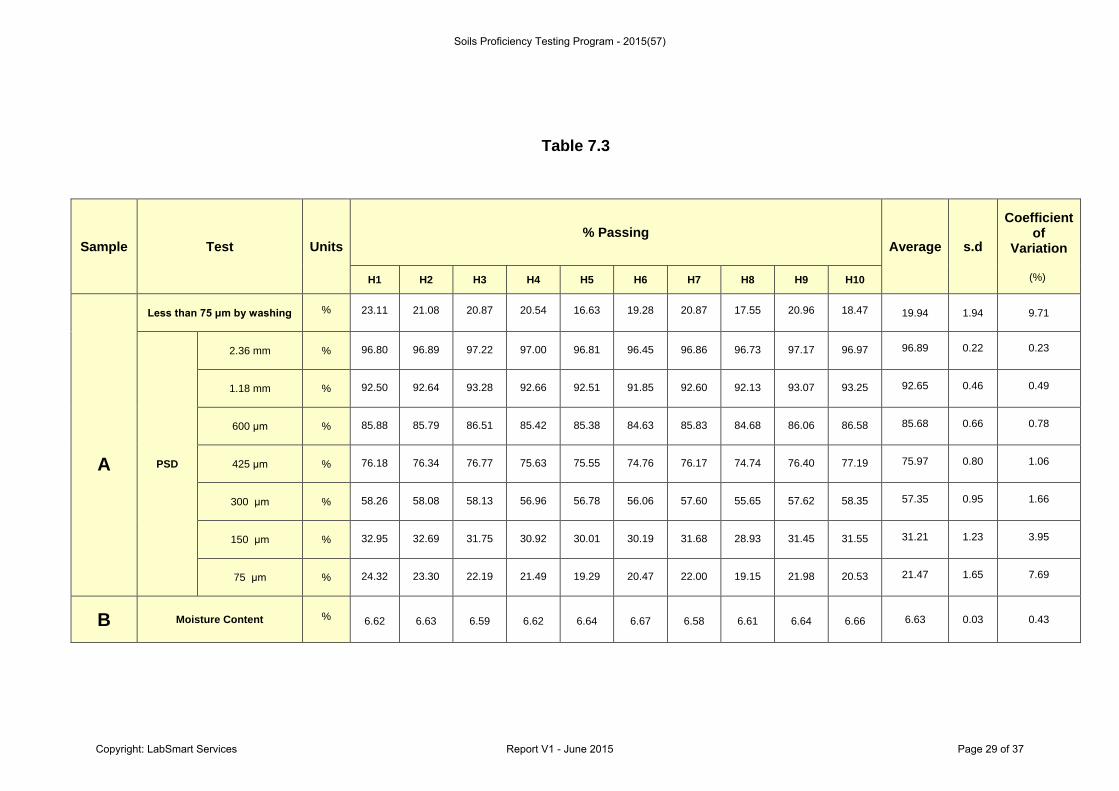
Table 7.3
Sample Test Units % Passing
Average s.d
Coefficient of
Variation
(%) H1 H2 H3 H4 H5 H6 H7 H8 H9 H10
Less than 75 μm by washing % 23.11 21.08 20.87 20.54 16.63 19.28 20.87 17.55 20.96 18.47 19.94 1.94 9.71
A PSD
2.36 mm % 96.80 96.89 97.22 97.00 96.81 96.45 96.86 96.73 97.17 96.97 96.89 0.22 0.23
1.18 mm % 92.50 92.64 93.28 92.66 92.51 91.85 92.60 92.13 93.07 93.25 92.65 0.46 0.49
600 μm % 85.88 85.79 86.51 85.42 85.38 84.63 85.83 84.68 86.06 86.58 85.68 0.66 0.78
425 μm % 76.18 76.34 76.77 75.63 75.55 74.76 76.17 74.74 76.40 77.19 75.97 0.80 1.06
300 μm % 58.26 58.08 58.13 56.96 56.78 56.06 57.60 55.65 57.62 58.35 57.35 0.95 1.66
150 μm % 32.95 32.69 31.75 30.92 30.01 30.19 31.68 28.93 31.45 31.55 31.21 1.23 3.95
75 μm % 24.32 23.30 22.19 21.49 19.29 20.47 22.00 19.15 21.98 20.53 21.47 1.65 7.69
B Moisture Content % 6.62 6.63 6.59 6.62 6.64 6.67 6.58 6.61 6.64 6.66 6.63 0.03 0.43
Soils Proficiency Testing Program - 2015(57)
Copyright: LabSmart Services Report V1 - June 2015 Page 29 of 37
7.5 Despatch Samples were dispatched via courier 25 March 2015. 7.6 Homogeneity Testing Samples for homogeneity testing were packed in the same way as those for participants. The homogeneity samples were tested by a NATA accredited laboratory. To approximate the same conditions the same instructions were given to the laboratory performing the homogeneity testing. Analysis of the homogeneity PSD testing results (Table 7.3) indicate that the variability associated with the proficiency samples is satisfactory. This provides confidence that any outliers identified in the program represent statistically valid outliers. 7.7 Participation Forty-two participants from around Australia entered the program. Participants were requested to returned results by the 17 April 2015. Additional time was given to laboratories to return their results log. Some participants only provided partial results for ‘Sample A’ and ‘Sample B’. 7.8 Statistics Z-Scores were calculated and used to assess the variability of each participant relative to the consensus median. A corresponding z-score graph was produced for each test. See section 4, 5 & 6. The use of median and quartiles reduces the effect that outliers have on the statistics and other influences. As a consequence z-scores provide a more realistic or robust method of assessment. Some results were reported by participants to more decimal places than requested as part of the proficiency program and by others to fewer decimal places. In all instances test results have been used as submitted by participants. Checks were undertaken to ensure the data calculated matched that reported by the participant and that the appropriate corrections had been applied if required. If inconsistencies were identified the data was removed but the discrepancy highlighted. A z-score is one way of measuring the degree of consensus with respect to the grouped test results. A z-scores of one in this report is approximate to one standard deviation. For each test a z-score graph is shown. Use the graph to visually check statistically how you compare to other participants. The following bar (Figure 5.2) is shown at the bottom of each graph. This helps to quickly visualize where each participant’s results falls.
Soils Proficiency Testing Program - 2015(57)
Copyright: LabSmart Services Report V1 - June 2015 Page 30 of 37
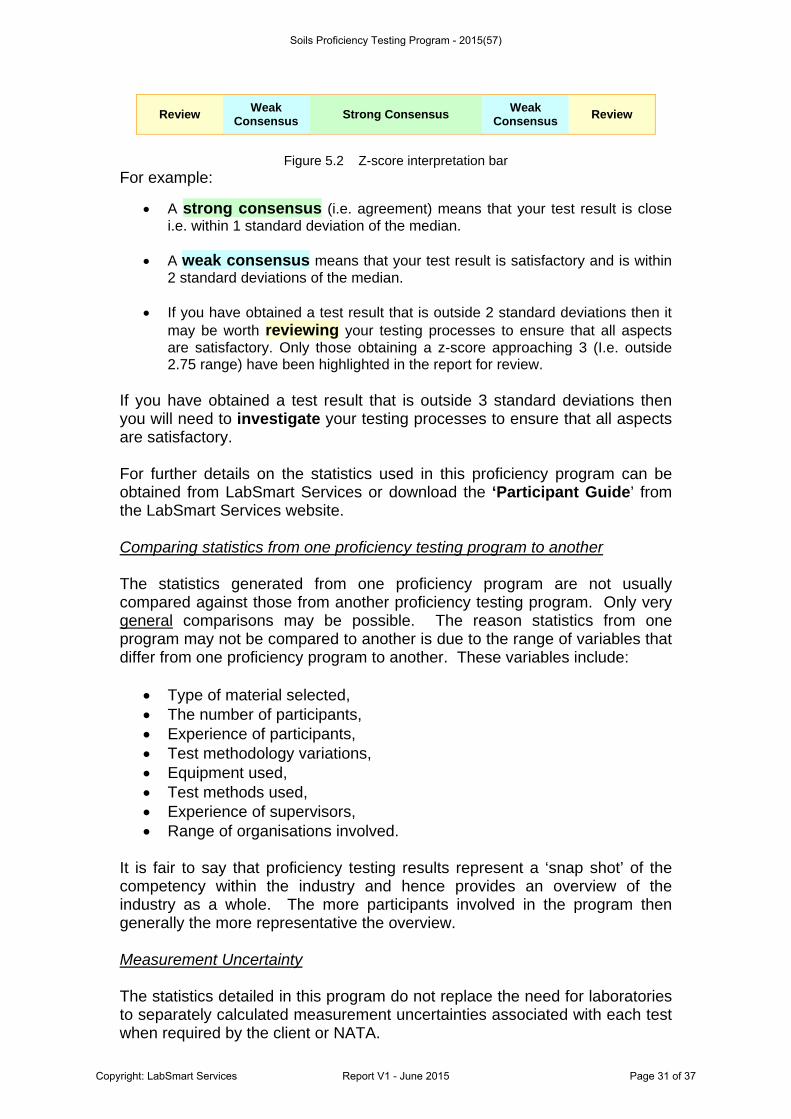
Review Weak Consensus Strong Consensus Weak
Consensus Review
Figure 5.2 Z-score interpretation bar
For example:
• A strong consensus (i.e. agreement) means that your test result is close i.e. within 1 standard deviation of the median.
• A weak consensus means that your test result is satisfactory and is within
2 standard deviations of the median.
• If you have obtained a test result that is outside 2 standard deviations then it may be worth reviewing your testing processes to ensure that all aspects are satisfactory. Only those obtaining a z-score approaching 3 (I.e. outside 2.75 range) have been highlighted in the report for review.
If you have obtained a test result that is outside 3 standard deviations then you will need to investigate your testing processes to ensure that all aspects are satisfactory. For further details on the statistics used in this proficiency program can be obtained from LabSmart Services or download the ‘Participant Guide’ from the LabSmart Services website. Comparing statistics from one proficiency testing program to another The statistics generated from one proficiency program are not usually compared against those from another proficiency testing program. Only very general comparisons may be possible. The reason statistics from one program may not be compared to another is due to the range of variables that differ from one proficiency program to another. These variables include:
• Type of material selected, • The number of participants, • Experience of participants, • Test methodology variations, • Equipment used, • Test methods used, • Experience of supervisors, • Range of organisations involved.
It is fair to say that proficiency testing results represent a ‘snap shot’ of the competency within the industry and hence provides an overview of the industry as a whole. The more participants involved in the program then generally the more representative the overview. Measurement Uncertainty The statistics detailed in this program do not replace the need for laboratories to separately calculated measurement uncertainties associated with each test when required by the client or NATA.
Soils Proficiency Testing Program - 2015(57)
Copyright: LabSmart Services Report V1 - June 2015 Page 31 of 37
ABN 60 144 733 282
LabSmart Services
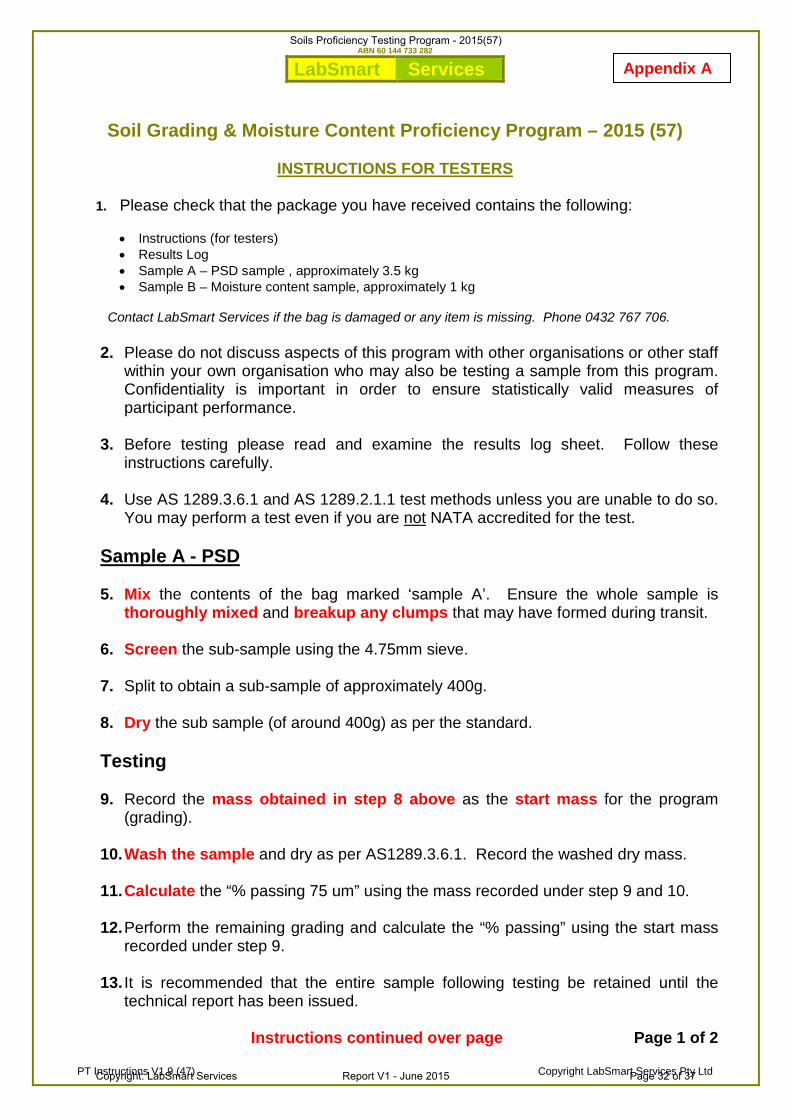
Soil Grading & Moisture Content Proficiency Program – 2015 (57)
INSTRUCTIONS FOR TESTERS
1. Please check that the package you have received contains the following: • Instructions (for testers) • Results Log • Sample A – PSD sample , approximately 3.5 kg • Sample B – Moisture content sample, approximately 1 kg
Contact LabSmart Services if the bag is damaged or any item is missing. Phone 0432 767 706.
2. Please do not discuss aspects of this program with other organisations or other staff
within your own organisation who may also be testing a sample from this program. Confidentiality is important in order to ensure statistically valid measures of participant performance.
3. Before testing please read and examine the results log sheet. Follow these
instructions carefully.
4. Use AS 1289.3.6.1 and AS 1289.2.1.1 test methods unless you are unable to do so. You may perform a test even if you are not NATA accredited for the test.
Sample A - PSD
5. Mix the contents of the bag marked ‘sample A’. Ensure the whole sample is
thoroughly mixed and breakup any clumps that may have formed during transit. 6. Screen the sub-sample using the 4.75mm sieve.
7. Split to obtain a sub-sample of approximately 400g.
8. Dry the sub sample (of around 400g) as per the standard.
Testing
9. Record the mass obtained in step 8 above as the start mass for the program (grading).
10. Wash the sample and dry as per AS1289.3.6.1. Record the washed dry mass.
11. Calculate the “% passing 75 um” using the mass recorded under step 9 and 10.
12. Perform the remaining grading and calculate the “% passing” using the start mass
recorded under step 9.
13. It is recommended that the entire sample following testing be retained until the technical report has been issued.
Instructions continued over page Page 1 of 2
PT Instructions V1.9 (47) Copyright LabSmart Services Pty Ltd
Appendix A
Soils Proficiency Testing Program - 2015(57)
Copyright: LabSmart Services Report V1 - June 2015 Page 32 of 37
Sample B – Moisture Content
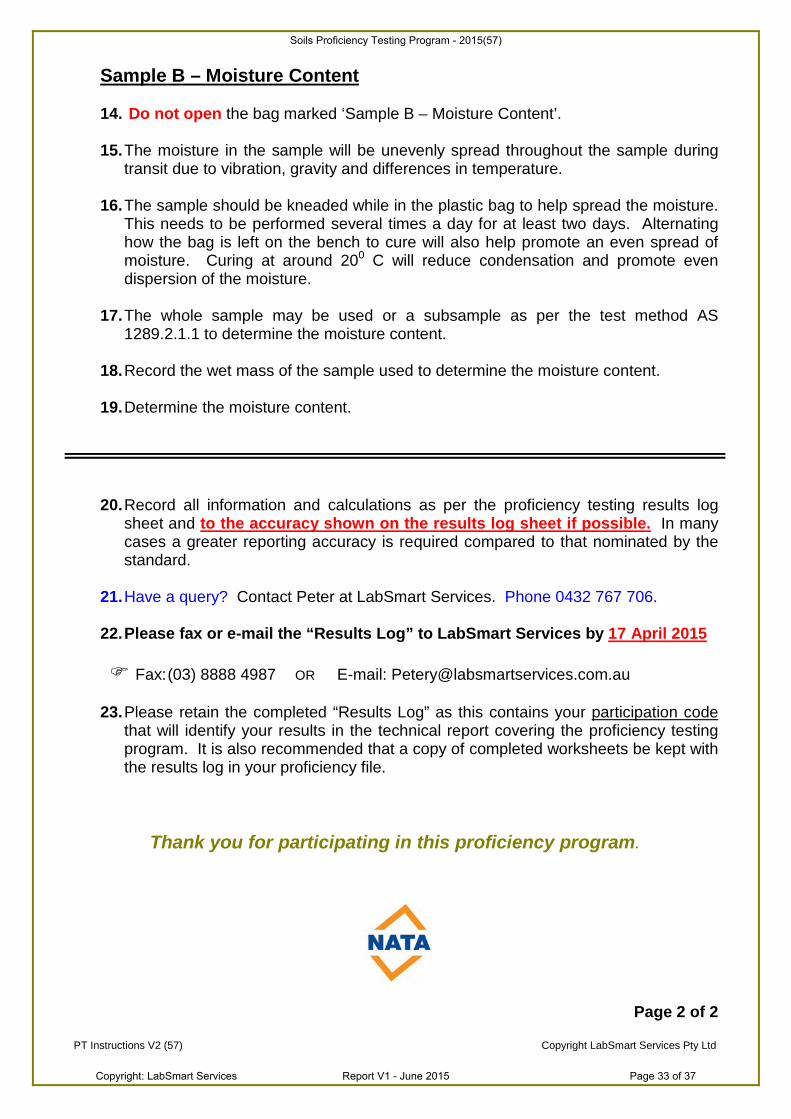
14. Do not open the bag marked ‘Sample B – Moisture Content’. 15. The moisture in the sample will be unevenly spread throughout the sample during
transit due to vibration, gravity and differences in temperature.
16. The sample should be kneaded while in the plastic bag to help spread the moisture. This needs to be performed several times a day for at least two days. Alternating how the bag is left on the bench to cure will also help promote an even spread of moisture. Curing at around 200 C will reduce condensation and promote even dispersion of the moisture.
17. The whole sample may be used or a subsample as per the test method AS
1289.2.1.1 to determine the moisture content.
18. Record the wet mass of the sample used to determine the moisture content.
19. Determine the moisture content.
20. Record all information and calculations as per the proficiency testing results log sheet and to the accuracy shown on the results log sheet if possible. In many cases a greater reporting accuracy is required compared to that nominated by the standard.
21. Have a query? Contact Peter at LabSmart Services. Phone 0432 767 706.
22. Please fax or e-mail the “Results Log” to LabSmart Services by 17 April 2015 Fax: (03) 8888 4987 OR E-mail: [email protected]
23. Please retain the completed “Results Log” as this contains your participation code
that will identify your results in the technical report covering the proficiency testing program. It is also recommended that a copy of completed worksheets be kept with the results log in your proficiency file.
Thank you for participating in this proficiency program.
Page 2 of 2
PT Instructions V2 (57) Copyright LabSmart Services Pty Ltd
Soils Proficiency Testing Program - 2015(57)
Copyright: LabSmart Services Report V1 - June 2015 Page 33 of 37
LabSmart Services
Soil Grading & Moisture Proficiency Program – 2015 (57)
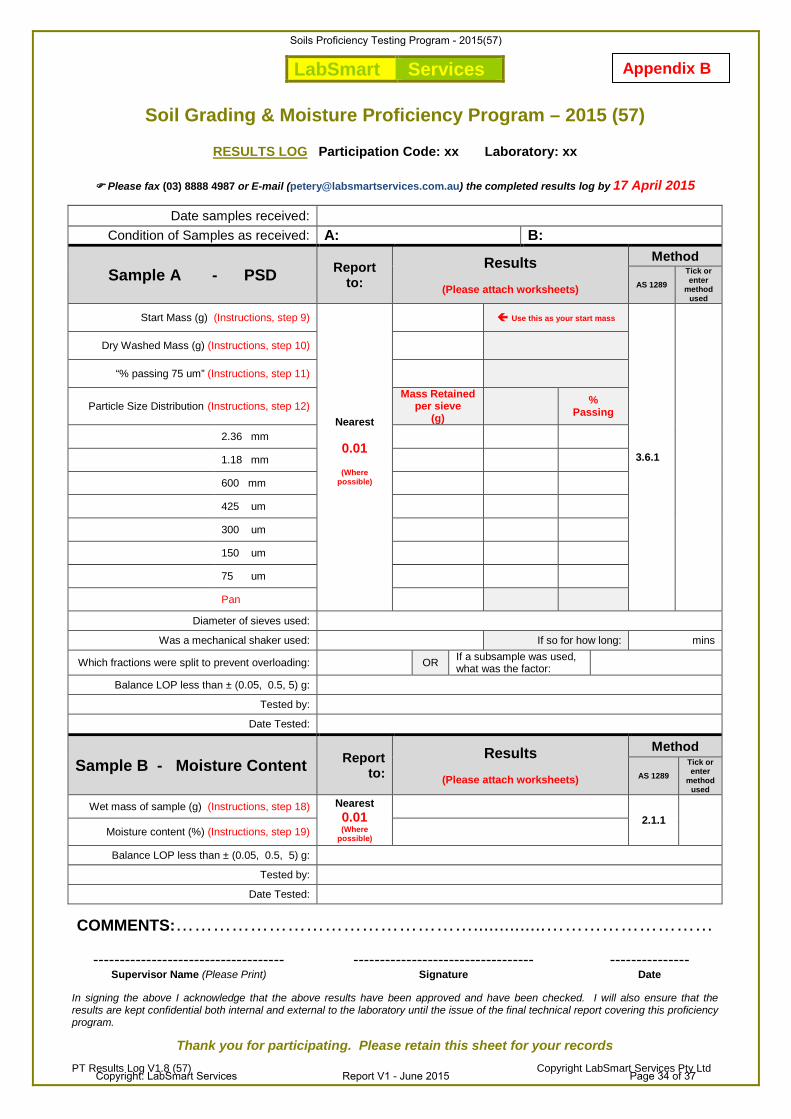
RESULTS LOG Participation Code: xx Laboratory: xx
Please fax (03) 8888 4987 or E-mail ([email protected]) the completed results log by 17 April 2015
Date samples received: Condition of Samples as received: A: B:
Sample A - PSD Report to:
Results
(Please attach worksheets)
Method
AS 1289 Tick or enter
method used
Start Mass (g) (Instructions, step 9)
Nearest
0.01
(Where possible)
Use this as your start mass
3.6.1
Dry Washed Mass (g) (Instructions, step 10)
“% passing 75 um” (Instructions, step 11)
Particle Size Distribution (Instructions, step 12) Mass Retained
per sieve (g)
% Passing
2.36 mm 1.18 mm 600 mm 425 um
300 um
150 um
75 um
Pan
Diameter of sieves used: Was a mechanical shaker used: If so for how long: mins
Which fractions were split to prevent overloading: OR If a subsample was used, what was the factor:
Balance LOP less than ± (0.05, 0.5, 5) g: Tested by:
Date Tested:
Sample B - Moisture Content Report to:
Results
(Please attach worksheets)
Method
AS 1289 Tick or enter
method used
Wet mass of sample (g) (Instructions, step 18) Nearest 0.01 (Where
possible)
2.1.1
Moisture content (%) (Instructions, step 19)
Balance LOP less than ± (0.05, 0.5, 5) g: Tested by:
Date Tested:
COMMENTS:…………………………………………..............………………………
------------------------------------ ---------------------------------- --------------- Supervisor Name (Please Print) Signature Date
In signing the above I acknowledge that the above results have been approved and have been checked. I will also ensure that the results are kept confidential both internal and external to the laboratory until the issue of the final technical report covering this proficiency program.
Thank you for participating. Please retain this sheet for your records
PT Results Log V1.8 (57) Copyright LabSmart Services Pty Ltd
Appendix B
Soils Proficiency Testing Program - 2015(57)
Copyright: LabSmart Services Report V1 - June 2015 Page 34 of 37
This page has been left blank intentionally.
Soils Proficiency Testing Program - 2015(57)
Copyright: LabSmart Services Report V1 - June 2015 Page 35 of 37
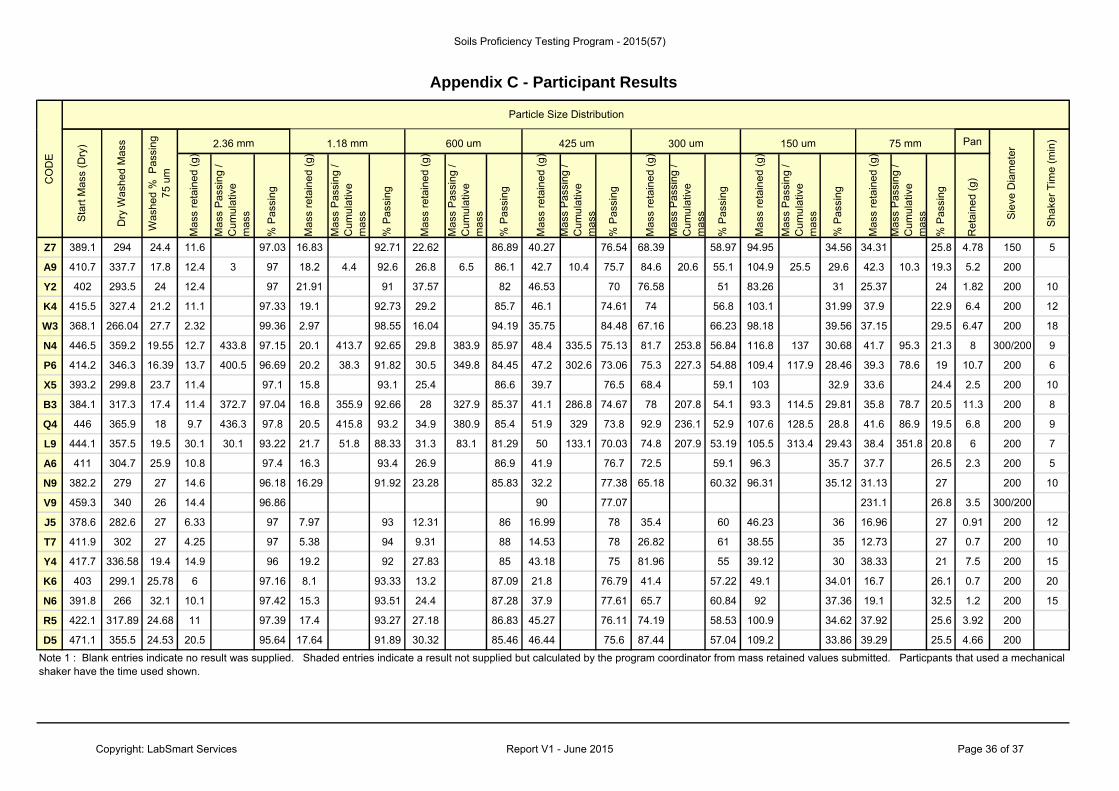
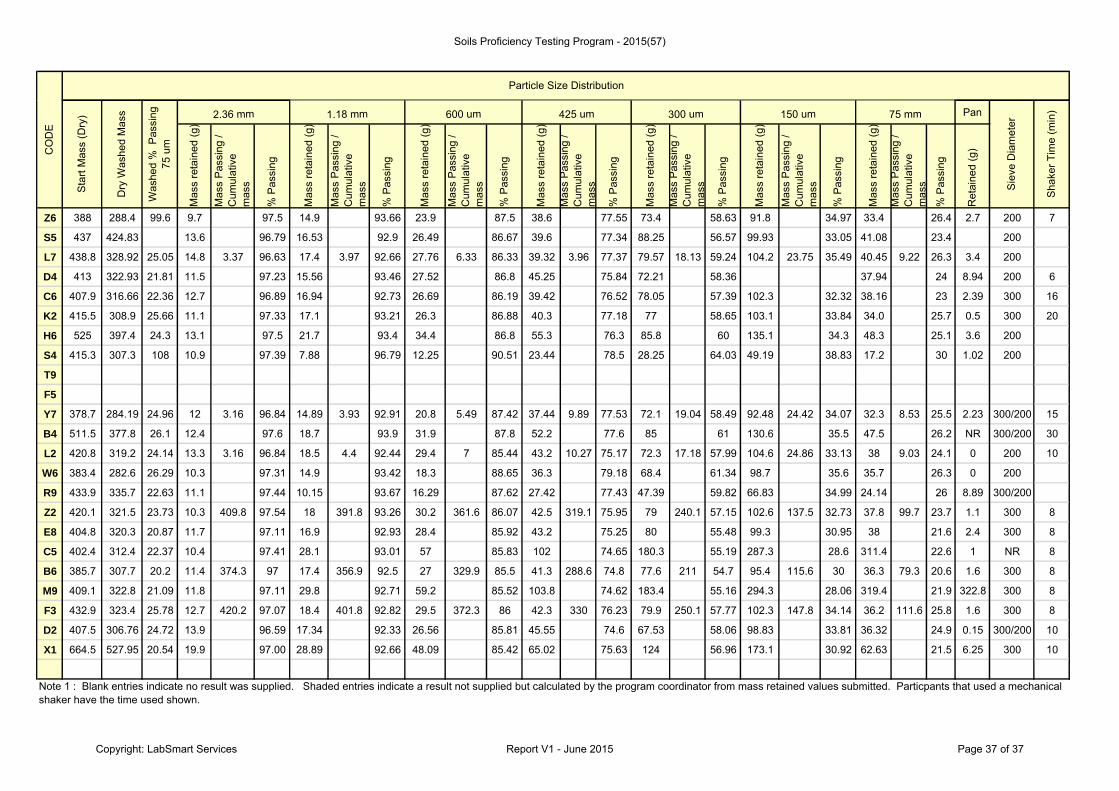
Appendix C - Participant Results
CO
DE
Particle Size Distribution
2.36 mm 1.18 mm 600 um 425 um 300 um 150 um 75 mmW
ashe
d %
Pas
sing
75
um
Dry
Was
hed
Mas
s
Sta
rt M
ass
(Dry
)
Sie
ve D
iam
eter
Sha
ker T
ime
(min
)Pan
Mas
s re
tain
ed (g
)
Mas
s P
assi
ng /
Cum
ulat
ive
mas
s
% P
assi
ng
Mas
s re
tain
ed (g
)
Mas
s P
assi
ng /
Cum
ulat
ive
mas
s
% P
assi
ng
Mas
s re
tain
ed (g
)
Mas
s P
assi
ng /
Cum
ulat
ive
mas
s
% P
assi
ng
Mas
s re
tain
ed (g
)
Mas
s P
assi
ng /
Cum
ulat
ive
mas
s
% P
assi
ng
Mas
s re
tain
ed (g
)
Mas
s P
assi
ng /
Cum
ulat
ive
mas
s
% P
assi
ng
Mas
s re
tain
ed (g
)
Mas
s P
assi
ng /
Cum
ulat
ive
mas
s
% P
assi
ng
Mas
s re
tain
ed (g
)
Mas
s P
assi
ng /
Cum
ulat
ive
mas
s
% P
assi
ng
Ret
aine
d (g
)
Z7 389.1 294 24.4 11.6 97.03 16.83 92.71 22.62 86.89 40.27 76.54 68.39 58.97 94.95 34.56 34.31 25.8 4.78 150 5
A9 410.7 337.7 17.8 12.4 3 97 18.2 4.4 92.6 26.8 6.5 86.1 42.7 10.4 75.7 84.6 20.6 55.1 104.9 25.5 29.6 42.3 10.3 19.3 5.2 200
Y2 402 293.5 24 12.4 97 21.91 91 37.57 82 46.53 70 76.58 51 83.26 31 25.37 24 1.82 200 10
K4 415.5 327.4 21.2 11.1 97.33 19.1 92.73 29.2 85.7 46.1 74.61 74 56.8 103.1 31.99 37.9 22.9 6.4 200 12
W3 368.1 266.04 27.7 2.32 99.36 2.97 98.55 16.04 94.19 35.75 84.48 67.16 66.23 98.18 39.56 37.15 29.5 6.47 200 18
N4 446.5 359.2 19.55 12.7 433.8 97.15 20.1 413.7 92.65 29.8 383.9 85.97 48.4 335.5 75.13 81.7 253.8 56.84 116.8 137 30.68 41.7 95.3 21.3 8 300/200 9
P6 414.2 346.3 16.39 13.7 400.5 96.69 20.2 38.3 91.82 30.5 349.8 84.45 47.2 302.6 73.06 75.3 227.3 54.88 109.4 117.9 28.46 39.3 78.6 19 10.7 200 6
X5 393.2 299.8 23.7 11.4 97.1 15.8 93.1 25.4 86.6 39.7 76.5 68.4 59.1 103 32.9 33.6 24.4 2.5 200 10
B3 384.1 317.3 17.4 11.4 372.7 97.04 16.8 355.9 92.66 28 327.9 85.37 41.1 286.8 74.67 78 207.8 54.1 93.3 114.5 29.81 35.8 78.7 20.5 11.3 200 8
Q4 446 365.9 18 9.7 436.3 97.8 20.5 415.8 93.2 34.9 380.9 85.4 51.9 329 73.8 92.9 236.1 52.9 107.6 128.5 28.8 41.6 86.9 19.5 6.8 200 9
L9 444.1 357.5 19.5 30.1 30.1 93.22 21.7 51.8 88.33 31.3 83.1 81.29 50 133.1 70.03 74.8 207.9 53.19 105.5 313.4 29.43 38.4 351.8 20.8 6 200 7
A6 411 304.7 25.9 10.8 97.4 16.3 93.4 26.9 86.9 41.9 76.7 72.5 59.1 96.3 35.7 37.7 26.5 2.3 200 5
N9 382.2 279 27 14.6 96.18 16.29 91.92 23.28 85.83 32.2 77.38 65.18 60.32 96.31 35.12 31.13 27 200 10
V9 459.3 340 26 14.4 96.86 90 77.07 231.1 26.8 3.5 300/200
J5 378.6 282.6 27 6.33 97 7.97 93 12.31 86 16.99 78 35.4 60 46.23 36 16.96 27 0.91 200 12
T7 411.9 302 27 4.25 97 5.38 94 9.31 88 14.53 78 26.82 61 38.55 35 12.73 27 0.7 200 10
Y4 417.7 336.58 19.4 14.9 96 19.2 92 27.83 85 43.18 75 81.96 55 39.12 30 38.33 21 7.5 200 15
K6 403 299.1 25.78 6 97.16 8.1 93.33 13.2 87.09 21.8 76.79 41.4 57.22 49.1 34.01 16.7 26.1 0.7 200 20
N6 391.8 266 32.1 10.1 97.42 15.3 93.51 24.4 87.28 37.9 77.61 65.7 60.84 92 37.36 19.1 32.5 1.2 200 15
R5 422.1 317.89 24.68 11 97.39 17.4 93.27 27.18 86.83 45.27 76.11 74.19 58.53 100.9 34.62 37.92 25.6 3.92 200
D5 471.1 355.5 24.53 20.5 95.64 17.64 91.89 30.32 85.46 46.44 75.6 87.44 57.04 109.2 33.86 39.29 25.5 4.66 200
Note 1 : Blank entries indicate no result was supplied. Shaded entries indicate a result not supplied but calculated by the program coordinator from mass retained values submitted. Particpants that used a mechanical shaker have the time used shown.
CO
DE
2.36 mm 1.18 mm 600 um 425 um 300 um 150 um 75 mmW
ashe
d %
Pas
sing
75
um
Dry
Was
hed
Mas
s
Sta
rt M
ass
(Dry
)
Sie
ve D
iam
eter
Sha
ker T
ime
(min
)
Soils Proficiency Testing Program - 2015(57)
Copyright: LabSmart Services Report V1 - June 2015 Page 36 of 37
CO
DE
Particle Size DistributionS
tart
Mas
s (D
ry)
Dry
Was
hed
Mas
s
Was
hed
% P
assi
ng
75 u
m
2.36 mm 1.18 mm 600 um 425 um 300 um 150 um 75 mm
Sie
ve D
iam
eter
Sha
ker T
ime
(min
)Pan
Mas
s re
tain
ed (g
)
Mas
s P
assi
ng /
Cum
ulat
ive
mas
s
% P
assi
ng
Mas
s re
tain
ed (g
)
Mas
s P
assi
ng /
Cum
ulat
ive
mas
s
% P
assi
ng
Mas
s re
tain
ed (g
)
Mas
s P
assi
ng /
Cum
ulat
ive
mas
s
% P
assi
ng
Mas
s re
tain
ed (g
)
Mas
s P
assi
ng /
Cum
ulat
ive
mas
s
% P
assi
ng
Mas
s re
tain
ed (g
)
Mas
s P
assi
ng /
Cum
ulat
ive
mas
s
% P
assi
ng
Mas
s re
tain
ed (g
)
Mas
s P
assi
ng /
Cum
ulat
ive
mas
s
% P
assi
ng
Mas
s re
tain
ed (g
)
Mas
s P
assi
ng /
Cum
ulat
ive
mas
s
% P
assi
ng
Ret
aine
d (g
)
Z6 388 288.4 99.6 9.7 97.5 14.9 93.66 23.9 87.5 38.6 77.55 73.4 58.63 91.8 34.97 33.4 26.4 2.7 200 7
S5 437 424.83 13.6 96.79 16.53 92.9 26.49 86.67 39.6 77.34 88.25 56.57 99.93 33.05 41.08 23.4 200
L7 438.8 328.92 25.05 14.8 3.37 96.63 17.4 3.97 92.66 27.76 6.33 86.33 39.32 3.96 77.37 79.57 18.13 59.24 104.2 23.75 35.49 40.45 9.22 26.3 3.4 200
D4 413 322.93 21.81 11.5 97.23 15.56 93.46 27.52 86.8 45.25 75.84 72.21 58.36 37.94 24 8.94 200 6
C6 407.9 316.66 22.36 12.7 96.89 16.94 92.73 26.69 86.19 39.42 76.52 78.05 57.39 102.3 32.32 38.16 23 2.39 300 16
K2 415.5 308.9 25.66 11.1 97.33 17.1 93.21 26.3 86.88 40.3 77.18 77 58.65 103.1 33.84 34.0 25.7 0.5 300 20
H6 525 397.4 24.3 13.1 97.5 21.7 93.4 34.4 86.8 55.3 76.3 85.8 60 135.1 34.3 48.3 25.1 3.6 200
S4 415.3 307.3 108 10.9 97.39 7.88 96.79 12.25 90.51 23.44 78.5 28.25 64.03 49.19 38.83 17.2 30 1.02 200
T9
F5
Y7 378.7 284.19 24.96 12 3.16 96.84 14.89 3.93 92.91 20.8 5.49 87.42 37.44 9.89 77.53 72.1 19.04 58.49 92.48 24.42 34.07 32.3 8.53 25.5 2.23 300/200 15
B4 511.5 377.8 26.1 12.4 97.6 18.7 93.9 31.9 87.8 52.2 77.6 85 61 130.6 35.5 47.5 26.2 NR 300/200 30
L2 420.8 319.2 24.14 13.3 3.16 96.84 18.5 4.4 92.44 29.4 7 85.44 43.2 10.27 75.17 72.3 17.18 57.99 104.6 24.86 33.13 38 9.03 24.1 0 200 10
W6 383.4 282.6 26.29 10.3 97.31 14.9 93.42 18.3 88.65 36.3 79.18 68.4 61.34 98.7 35.6 35.7 26.3 0 200
R9 433.9 335.7 22.63 11.1 97.44 10.15 93.67 16.29 87.62 27.42 77.43 47.39 59.82 66.83 34.99 24.14 26 8.89 300/200
Z2 420.1 321.5 23.73 10.3 409.8 97.54 18 391.8 93.26 30.2 361.6 86.07 42.5 319.1 75.95 79 240.1 57.15 102.6 137.5 32.73 37.8 99.7 23.7 1.1 300 8
E8 404.8 320.3 20.87 11.7 97.11 16.9 92.93 28.4 85.92 43.2 75.25 80 55.48 99.3 30.95 38 21.6 2.4 300 8
C5 402.4 312.4 22.37 10.4 97.41 28.1 93.01 57 85.83 102 74.65 180.3 55.19 287.3 28.6 311.4 22.6 1 NR 8
B6 385.7 307.7 20.2 11.4 374.3 97 17.4 356.9 92.5 27 329.9 85.5 41.3 288.6 74.8 77.6 211 54.7 95.4 115.6 30 36.3 79.3 20.6 1.6 300 8
M9 409.1 322.8 21.09 11.8 97.11 29.8 92.71 59.2 85.52 103.8 74.62 183.4 55.16 294.3 28.06 319.4 21.9 322.8 300 8
F3 432.9 323.4 25.78 12.7 420.2 97.07 18.4 401.8 92.82 29.5 372.3 86 42.3 330 76.23 79.9 250.1 57.77 102.3 147.8 34.14 36.2 111.6 25.8 1.6 300 8
D2 407.5 306.76 24.72 13.9 96.59 17.34 92.33 26.56 85.81 45.55 74.6 67.53 58.06 98.83 33.81 36.32 24.9 0.15 300/200 10
X1 664.5 527.95 20.54 19.9 97.00 28.89 92.66 48.09 85.42 65.02 75.63 124 56.96 173.1 30.92 62.63 21.5 6.25 300 10
Note 1 : Blank entries indicate no result was supplied. Shaded entries indicate a result not supplied but calculated by the program coordinator from mass retained values submitted. Particpants that used a mechanical shaker have the time used shown.
CO
DE
Sta
rt M
ass
(Dry
)
Dry
Was
hed
Mas
s
Was
hed
% P
assi
ng
75 u
m
2.36 mm 1.18 mm 600 um 425 um 300 um 150 um 75 mm
Sie
ve D
iam
eter
Sha
ker T
ime
(min
)
Soils Proficiency Testing Program - 2015(57)
Copyright: LabSmart Services Report V1 - June 2015 Page 37 of 37