Embed Size (px)
Citation preview
Plant and Soil 253: 479–492, 2003.© 2003 Kluwer Academic Publishers. Printed in the Netherlands.
479
Soil-productivity relationships and organic matter turnover in drytropical forests of the Florida Keys
M.S. Ross1,4, C.L. Coultas2 & Y.P. Hsieh3
1Associate Research Scientist, Florida International University, Miami, FL, USA. 2Professor, Florida A &M University, Tallahassee, FL, USA, retired. 3Professor, Florida A & M University, Tallahassee, FL, USA.4Corresponding author∗
Received 14 June 2002. Accepted in revised form 30 January 2003
Key words: aboveground production, Carbonate islands, Histosols, limestone bedrock, nutrient cycling, tropicalhardwood hammocks
Abstract
Soils and aboveground production in five types of upland forest in the Florida Keys were examined. Throughoutthe habitat gradient represented by these forest types, the soils were predominantly shallow and organic, formingin place directly on the limestone bedrock. However, the well-drained soils in the most productive broadleavedforests were deep enough to qualify as Histosols (Folists). Soils decreased in electrical conductivity and increasedin nutrient content with increasing aboveground production. At 3–12 Mg ha−1 yr−1, production was within therange reported for dry tropical forests. Measured rates of decomposition were moderate or fast, and estimates ofthe organic C turnover of several soils based on their bomb radiocarbon signature were 100 years or less. In the faceof these rapid turnover rates, we attribute the development of organic soils to the absence of mineral residues fromweathering of the underlying limestone bedrock. Fast turnover of organic matter, and rapid and efficient cycling ofnutrients are necessary to sustain the high production rates obtained on these shallow organic soils.
Introduction
Among the remarkable aspects of Florida Keys ter-restrial ecosystems are the variety and stature of theforest communities that may be supported on very thinsoils. A soil survey conducted in 1987 by the SoilConservation Service of the Department of Agricul-ture categorized soils of Florida Keys into 17 series(USDA, 1995). Several of these soil series occurred inupland settings, i.e., sites that typically do not floodexcept during major storm events. The most commonwere Pennekamp silt loam (8 cm of black muck overl2 cm of dark gray marl over limestone), Matecumbemuck (15 cm of black muck over limestone), Saddle-bunch silt (13 cm of grayish-brown marl over 30 cm oflight gray marl over limestone), and Keyvaca silt loam(10 cm of dark brown gravelly marl over limestone).Florida Keys upland soils can also be divided intofour categories on the basis of their dominant constitu-
∗ FAX No: 305-348-4096. E-mail: [email protected]
ent, i.e., rocky soils, organic soils, fine mineral soils(marls), and coarse mineral soils (carbonitic sands).With few exceptions, these soils are <20 cm in depthand lack strong horizonation. The plant communitiesthat occupy them include open slash pine (Pinus el-liottii var densa) forests or denser forests comprisedprimarily of broadleaved tree species of West Indianorigin. The latter are known locally as tropical hard-wood hammocks. Among the thirteen Ecological SiteUnits defined by Ross et al. (1992), the upland ortransitional units exhibited a broad range in structuralcharacteristics, e.g., in basal area (20–40 m2 ha−1)and canopy height (6–13 m). The authors attributedthis variation in part to differences in soil characterist-ics. In this paper, we explore further the relationshipsbetween these diverse tropical forests and the proper-ties of their thin soils, especially the carbon (C) andnutrient cycles by which the plant communities aresustained.
480
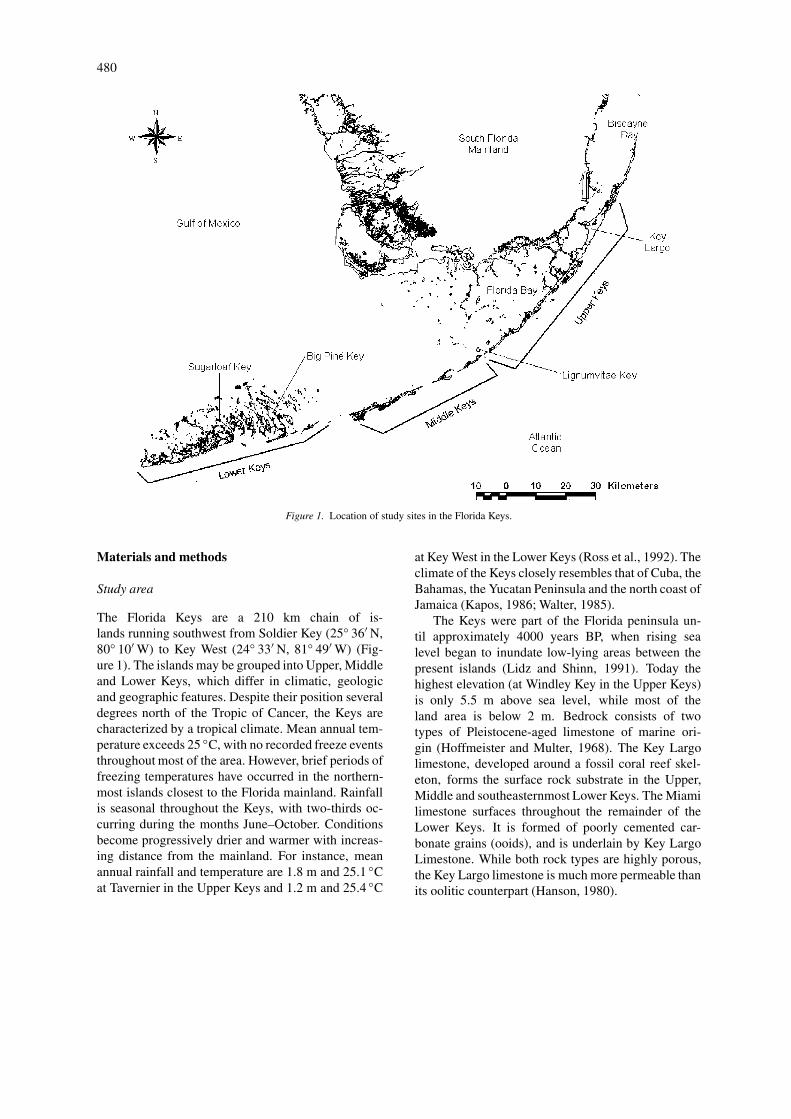
Figure 1. Location of study sites in the Florida Keys.
Materials and methods
Study area
The Florida Keys are a 210 km chain of is-lands running southwest from Soldier Key (25◦ 36′ N,80◦ 10′ W) to Key West (24◦ 33′ N, 81◦ 49′ W) (Fig-ure 1). The islands may be grouped into Upper, Middleand Lower Keys, which differ in climatic, geologicand geographic features. Despite their position severaldegrees north of the Tropic of Cancer, the Keys arecharacterized by a tropical climate. Mean annual tem-perature exceeds 25 ◦C, with no recorded freeze eventsthroughout most of the area. However, brief periods offreezing temperatures have occurred in the northern-most islands closest to the Florida mainland. Rainfallis seasonal throughout the Keys, with two-thirds oc-curring during the months June–October. Conditionsbecome progressively drier and warmer with increas-ing distance from the mainland. For instance, meanannual rainfall and temperature are 1.8 m and 25.1 ◦Cat Tavernier in the Upper Keys and 1.2 m and 25.4 ◦C
at Key West in the Lower Keys (Ross et al., 1992). Theclimate of the Keys closely resembles that of Cuba, theBahamas, the Yucatan Peninsula and the north coast ofJamaica (Kapos, 1986; Walter, 1985).
The Keys were part of the Florida peninsula un-til approximately 4000 years BP, when rising sealevel began to inundate low-lying areas between thepresent islands (Lidz and Shinn, 1991). Today thehighest elevation (at Windley Key in the Upper Keys)is only 5.5 m above sea level, while most of theland area is below 2 m. Bedrock consists of twotypes of Pleistocene-aged limestone of marine ori-gin (Hoffmeister and Multer, 1968). The Key Largolimestone, developed around a fossil coral reef skel-eton, forms the surface rock substrate in the Upper,Middle and southeasternmost Lower Keys. The Miamilimestone surfaces throughout the remainder of theLower Keys. It is formed of poorly cemented car-bonate grains (ooids), and is underlain by Key LargoLimestone. While both rock types are highly porous,the Key Largo limestone is much more permeable thanits oolitic counterpart (Hanson, 1980).
481
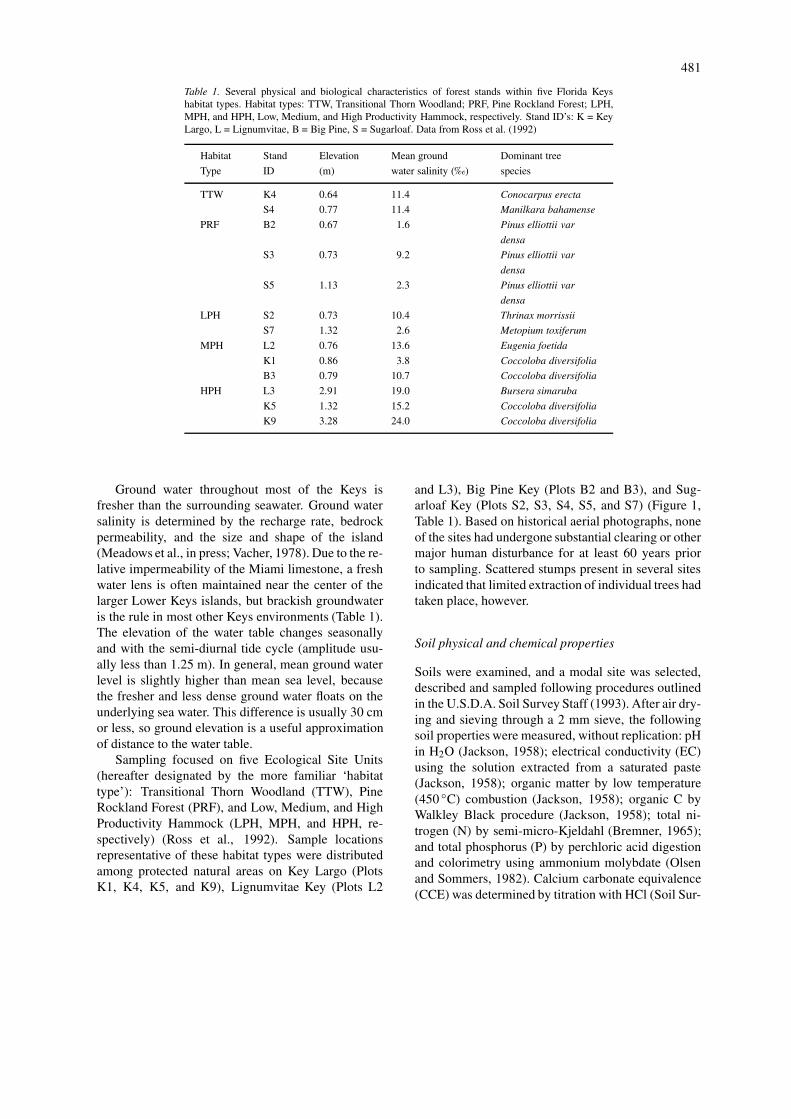
Table 1. Several physical and biological characteristics of forest stands within five Florida Keyshabitat types. Habitat types: TTW, Transitional Thorn Woodland; PRF, Pine Rockland Forest; LPH,MPH, and HPH, Low, Medium, and High Productivity Hammock, respectively. Stand ID’s: K = KeyLargo, L = Lignumvitae, B = Big Pine, S = Sugarloaf. Data from Ross et al. (1992)
Habitat Stand Elevation Mean ground Dominant tree
Type ID (m) water salinity (‰) species
TTW K4 0.64 11.4 Conocarpus erecta
S4 0.77 11.4 Manilkara bahamense
PRF B2 0.67 1.6 Pinus elliottii var
densa
S3 0.73 9.2 Pinus elliottii var
densa
S5 1.13 2.3 Pinus elliottii var
densa
LPH S2 0.73 10.4 Thrinax morrissii
S7 1.32 2.6 Metopium toxiferum
MPH L2 0.76 13.6 Eugenia foetida
K1 0.86 3.8 Coccoloba diversifolia
B3 0.79 10.7 Coccoloba diversifolia
HPH L3 2.91 19.0 Bursera simaruba
K5 1.32 15.2 Coccoloba diversifolia
K9 3.28 24.0 Coccoloba diversifolia
Ground water throughout most of the Keys isfresher than the surrounding seawater. Ground watersalinity is determined by the recharge rate, bedrockpermeability, and the size and shape of the island(Meadows et al., in press; Vacher, 1978). Due to the re-lative impermeability of the Miami limestone, a freshwater lens is often maintained near the center of thelarger Lower Keys islands, but brackish groundwateris the rule in most other Keys environments (Table 1).The elevation of the water table changes seasonallyand with the semi-diurnal tide cycle (amplitude usu-ally less than 1.25 m). In general, mean ground waterlevel is slightly higher than mean sea level, becausethe fresher and less dense ground water floats on theunderlying sea water. This difference is usually 30 cmor less, so ground elevation is a useful approximationof distance to the water table.
Sampling focused on five Ecological Site Units(hereafter designated by the more familiar ‘habitattype’): Transitional Thorn Woodland (TTW), PineRockland Forest (PRF), and Low, Medium, and HighProductivity Hammock (LPH, MPH, and HPH, re-spectively) (Ross et al., 1992). Sample locationsrepresentative of these habitat types were distributedamong protected natural areas on Key Largo (PlotsK1, K4, K5, and K9), Lignumvitae Key (Plots L2
and L3), Big Pine Key (Plots B2 and B3), and Sug-arloaf Key (Plots S2, S3, S4, S5, and S7) (Figure 1,Table 1). Based on historical aerial photographs, noneof the sites had undergone substantial clearing or othermajor human disturbance for at least 60 years priorto sampling. Scattered stumps present in several sitesindicated that limited extraction of individual trees hadtaken place, however.
Soil physical and chemical properties
Soils were examined, and a modal site was selected,described and sampled following procedures outlinedin the U.S.D.A. Soil Survey Staff (1993). After air dry-ing and sieving through a 2 mm sieve, the followingsoil properties were measured, without replication: pHin H2O (Jackson, 1958); electrical conductivity (EC)using the solution extracted from a saturated paste(Jackson, 1958); organic matter by low temperature(450 ◦C) combustion (Jackson, 1958); organic C byWalkley Black procedure (Jackson, 1958); total ni-trogen (N) by semi-micro-Kjeldahl (Bremner, 1965);and total phosphorus (P) by perchloric acid digestionand colorimetry using ammonium molybdate (Olsenand Sommers, 1982). Calcium carbonate equivalence(CCE) was determined by titration with HCl (Soil Sur-
482
vey Staff, 1972). Extractable elements were determ-ined using ammonium bicarbonate – AB-DTPA oncalcareous soils and Mehlich 3 extractant on neutral oracidic soils (Mehlich, 1984; Soltanpour and Schwab,1977). The extracted solutions were analyzed on aJarrell-Ash model 750 ICP mass spectrometer. Bulkdensity was determined by excavating the soil withinsuccessive horizons, lining the hole with plastic, andmeasuring the volume of water required to fill eachportion of the hole. The weight of the oven-dried(70 ◦C) soil removed from each horizon was used forcalculation of bulk density. Available water was estim-ated using soil moisture pressure plates at appropriatepressures (Klute, 1965).
Decomposition and soil organic matter turnover
In May 1990, sets of three nylon [2 mm] mesh litterbags were placed at three randomly selected loca-tions on the forest floor in each of the thirteen stands.Freshly fallen or senescent leaves were collected,dried at 65 ◦C, analyzed for N and P concentration,and a weighed amount (>20 g) inserted in each bag.One bag from each group was collected, dried, andreweighed in November 1990, May 1991, and May1992, i.e., 6, 12, and 24 months after placement in thefield.
Turnover time of soil organic matter
We used bomb 14C as a tracer to infer the turnovertime of the soil organic C, according to the method ofHsieh (1993). The basis of the method is that the 14Csignature of the active soil C pool integrates the 14Cinput of the atmosphere over the past five decades, aperiod for which the trajectory of atmospheric 14C iswell known. Because the soil 14C signature is a func-tion of both turnover time and the timing of samplecollection, knowledge of the sample 14C content andits time of collection allows one to deduce the turnovertime of the carbon pool.
Air-dried soil samples from a representative subsetof sites were sieved through a 2-mm sieve to removegravel and plant tissue debris. A 10 g sample of thesieved soil was weighed into a glass beaker, followedby the addition of 10 mL increments of 2 M HCl solu-tion to remove carbonates. Increments of HCl wereadded to soil until no apparent reaction with carbon-ates was observed. The beaker was then covered witha watch glass and placed on a hot plate at 70–80 ◦Cfor 3 h. The beaker was allowed to cool to ambient
temperature overnight. If the pH of the final solutionwas greater than 2, the sequence was repeated until pH2 was reached. The acidified soil samples were washedtwice with 20 mL distilled water by centrifugation anddried at 60 ◦C. The prepared sample was sent to theNSF/AMS facility at the University of Arizona for14C dating analysis. The 14C was reported as percentmodern (i.e., 1950) C (pmC) after correcting for 13Ccontent. All 14C values were greater than 100 pmC,indicating significant incorporation of bomb carbon inthe soil organic matter since 1950.
Forest structure and production
We estimated three elements of forest stature (can-opy height, basal area, and total tree biomass) andtwo components of aboveground production (annuallitterfall and tree biomass increment).
Estimates of tree biomass, basal area, and canopyheight were based on trees within a single 600 m2
(10 × 60 m) plot located within relatively homogen-eous vegetation representative of each site (Ross etal., 1992). The species and diameter at breast height(1.45 m above the ground) of all stems >2.54 cmdiameter were recorded in the spring of 1989. Basalarea was calculated on the basis of all measured trees,but total tree biomass was estimated by applying pub-lished regression equations to trees over 5 cm diameteronly. For broad-leaved species we used a generalequation developed by Brown et al. (1989) for drytropical forests. For pines, we used an equation de-veloped for Pinus elliottii throughout its range byClark and Taras (1976). Palm species (Thrinax radi-ata, Thrinax morrissii, and Coccothrinax argentata),which represented 0–33% of stand basal area, were notincluded in biomass calculations because no publishedregression equations were available. Canopy heightestimates were based on the total height of all trees>10 cm DBH, measured with a telescoping heightpole. Mean canopy height was defined as the modal(50th percentile) tree height within this distribution.
Estimation of tree biomass increment was basedon regular monitoring of radial growth. During thefall of 1989 aluminum band dendrometers (Liming,1957) were established at 1.45 m height on a smallsubsample of each abundant canopy species per plot.Diameter growth was monitored monthly on a totalof l08 trees through December 1992. Using the re-gression equations described above, we determinedinitial biomass, final biomass, and mean annual bio-mass growth for each sample tree. Mean growth rates

483
Table 2. Some physical and chemical properties of upland soils in Florida Keys. OM=organic matter; OC=organiccarbon; EC= electrical conductivity; CCE=calcium carbonate equivalent; BD=bulk density. This determination wasperformed only if the soil sample effervesced with 10% HCL; – = no data
Vegetation Site Depth pH OM OC Total N Total P EC CCE BD
type (cm) (%) (%) (%) (ppm) (mS cm−1) (%) (g cm−3)
TTW K4 0-5 – 72.6 18.9 0.98 344 22.0 – 0.14
5–12 – 57.4 18.0 0.90 722 31.0 – 0.35
S4 0–7 7.9 33.1 12.1 0.63 440 20.0 31.8 –
PRF B2 0-5 8.0 19.8 15.7 0.37 325 3.8 57.0 –
5–10 8.1 14.7 8.0 0.40 272 3.2 >62 –
S3 0–3 6.2 85.3 24.9 0.87 475 6.2 – –
3–12 7.7 22.0 12.2 0.37 205 12.4 51.5 –
S5 0–7 7.9 36.7 17.5 0.62 337 20.0 35.4 –
LPH S2 0–5 6.0 86.8 24.0 1.40 – 4.9 – 0.06
5-10 7.7 28.7 10.8 0.5 – 18.0 55.9 0.61
S7 0–5 6.7 87.7 23.5 1.28 221 4.9 – 0.06
5–14 7.4 65.3 19.6 1.10 828 7.2 17.4 0.61
MPH B3 0–5 7.4 74.4 27.0 1.32 1760 1.9 – 0.35
5–14 7.7 62.4 20.1 1.24 3220 2.6 28.8 0.48
L2 0–5 6.8 80.8 26.1 1.30 744 8.0 – 0.12
5-10 7.4 54.3 18.7 1.22 1840 18.0 – 0.50
K1 0–7 6.7 77.5 19.3 1.21 181 5.0 – 0.10
7–12 – – – – – – – –
HPH K5 0–10 7.3 78.8 23.4 1.30 503 2.0 – 0.13
K9 0–7 7.6 76.1 22.7 1.39 378 1.4 – –
7–18 7.6 68.3 23.2 1.32 1100 1.5 – –
L3 0–5 7.6 72.6 25.1 1.42 1060 1.2 – 0.16
5–10 7.5 59.2 24.5 0.36 1810 2.2 30.4 0.57
were calculated by species in each stand, and ap-plied to the initial stand tables on a species-specificbasis. Dendrometer design allowed detection of dia-meter changes as small as 0.2 mm, but did not enablesampling of several important understory tree speciesthat never attained the minimum diameter of 10 cm.Species present in the stand but not represented in thedendrometer sample were assigned the mean growthrate of all species. The method does not account for in-growth into the tree stratum, and assumes that all treessurvived the three-year period. Since leaf populationstend to reach an asymptote early in stand develop-ment (e.g., Covington and Aber, 1980), tree incrementcalculated in this way is primarily wood production.
Litter production estimates were based on leaves,small twigs, and reproductive parts collected in three1 × 1 m litter traps per plot over the period December1989–November 1991. A stratified random processwas used to determine trap locations. Accumulatedmaterial was collected at two-month intervals, thendried at 65 ◦C for 48 h before weighing.
Results
Soil physical and chemical properties
Most upland soils in the Florida Keys develop onflat (0–1%) surfaces, and are shallow (<20 cm) overlimestone except above occasional small sink-holes.Due to the uneven limestone surface, micro-relief issubstantial. The large volume of medium and finelive roots, the presence of limestone gravel, and thepatchy exposure of limestone bedrock further reducethe effective volume of these thin soils.
Soil profiles from our thirteen study sites are de-scribed in the Appendix. The soils in all five habitattypes are similar in that they are thin and includeorganic horizons with or without marl. The organicmaterials have negligible fiber content. The soil sur-face is usually covered with 2–5 cm of undecomposedorganic material (leaves and stems). Soils are deepestin the hammock forest types, and thinnest in the TTWand PRF units. There are extensive areas in the latter
484
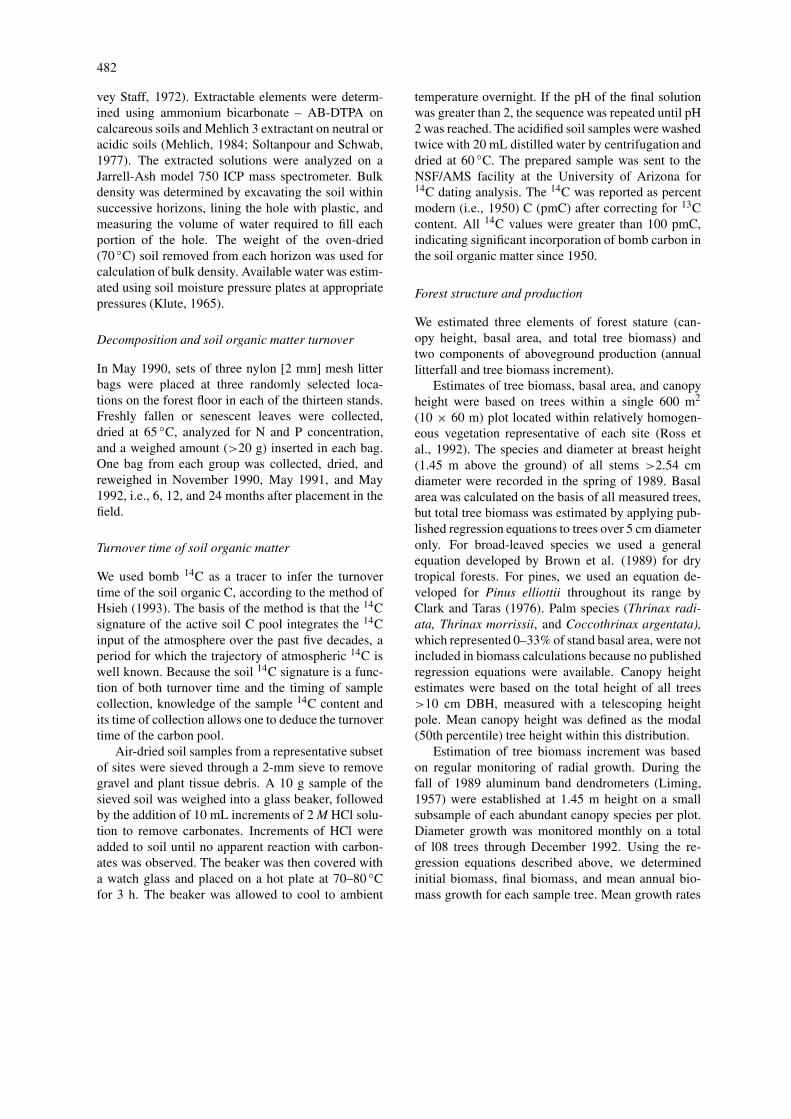
Table 3. Extractable nutrients from some soils of the uplands in the Florida Keys and adequacy for agronomic crops.Extractants: M = Mehlich III; A = AB – DTPA; Ca and Mg concentrations are meaningless for AB-DTPA extractant.Availability or sufficiency levels of Ca, Mg, K, or P are indicated by H (high), M (medium) and L (low) for agronomiccrops
Habitat Location Depth Extractant∗ Ca Mg K P
Type (cm) —(‰ or mg dm−3 with Mehlich III)—
TTW K4 0-5 A – – 252 H 11 H
5–12 A – – 433 H 19 H
S4 0–7 A – – 287 H 11 H
PRF B2 0–5 A – – 34 L 6 M
5–10 A – – 40 L 8 H
S3 0–3 M 2410 H 886 H 120 H 17 M
3–12 A – – 163 H 8 M
S5 0–7 A – – 78 M –
LPH S7 0–5 M 2780 H 1170 H 254 H 19 H
5–14 A – – 183 H 10 H
MPH B3 0–5 M 6130 H 1260 H 127 H 6 L
5–14 A – – 55 L 8 H
L2 0–5 M 3160 H 1400 H 156 H 28 M
5–10 M 6610 H 2440 H 400 H 45 M
K1 0–7 M 3560 H 1280 H 233 H 6 L
7–12 A – –
HPH K5 0–10 M 5790 H 1150 H 115 H 23 M
K9 0–7 M 8500 H 629 H 124 H 26 M
7–18 M 11400 H 719 H 127 H 30 M
L3 0–5 M 8240 H 726 H 147 H 26 M
5–10 A – – 62 M 14 H
two types where little or no soil is present and trees arerooted in fissures in the limestone. This is particularlyevident on Big Pine and Sugarloaf Keys, where slashpine has made fair growth in a soil-less environment.
Some physical and chemical properties of the soilsare presented in Table 2. Soil reaction in most soils isnear neutral, though pH 8 is approached in some marlhorizons. Soils in the three hammock types have thehighest organic matter content as well as the highestconcentration of N and P. Organic matter content isinversely related to bulk density. Where little CaCO3is present, most organic horizons have a bulk densityaround 0.1 g cm−3. Soils high in marl have a bulkdensity of 0.5 g cm−3 or higher. Electrical conduct-ivity of the soil solution is generally lowest in MPHand HPH hammocks (1.2-5.0 mS cm−1, but 18.0 inL2 (5–10 cm)), intermediate in LPH and PRF (3.2–20.0 mS cm−1), and highest in TTW soils (20–31mS cm−1). Electrical conductivity is directly related tosalt content; 4 mS cm−1 is considered a saline soil andis harmful to most agronomic crops (USDA, 1954).
Soil testing is not widely used for determiningnutrient deficiencies in forest crops (Pritchett, 1979).With the exceptions listed below, the concentrationsof extractable Ca, Mg, K, and P presented in Table 3indicate that these elements would be adequate for ag-ronomic crops (J.B. Jones, pers. comm.; Soltenpourand Schwab, 1997; Sims and Johnson, 1991). Inad-equate K is indicated at sites B2 and in the subsoil ofB3, and inadequate P at B2 and B3 (surface) and K1.
Soil moisture at field capacity (−0.033 MPa) andpermanent wilting point (−1.5 Mpa) was determinedon three soil horizons: an organic soil with no CaCO3;a soil with 62% organic matter and 29% CaCO3; anda soil with 24% organic matter and >60% CaCO3.Available moisture (difference between moisture con-tent at field capacity and permanent wilting) was112%, 40%, and 22% of dry soil weight, respect-ively. However, adjusting for bulk density and gravelcontent, there was little difference in water-holdingcapacity among these soils; assuming a 10 cm soilthickness, total water storage capacity was 1.45 cm
485
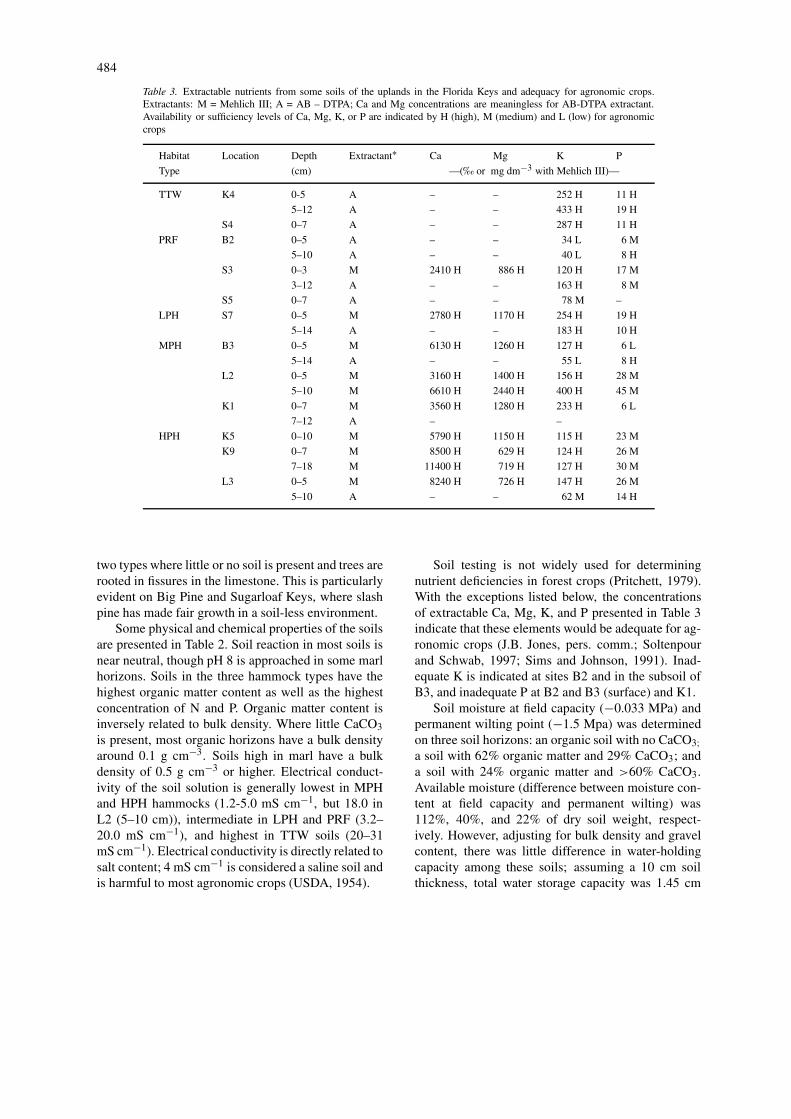
Table 4. Measures of structure and productivity for 5 vegetation types: Transitional Thorn Woodland(TTW); Pine Rockland Forest (PRF); Low, Medium and High Productivity Hammock (LPH, MPH, andHPH, respectively)
Vegetation Location Canopy Basal area Total tree Annual Annual
Type Height (m) (m2 ha−1) biomass litterfall wood production
(Mg ha−1) (Mg ha−1) (Mg ha−1)
TTW K4 4 4.4 4.7 2.9 –
S4 5 14.4 35.4 4.26 0.38
PRF B2 12 12.1 47.5 2.76 3.05
S3 10 21.0 39.6 2.24 3.31
S5 12 15.2 33.8 2.17 3.32
LPH S2 5 22.2 45.3 5.73 2.04
S7 6 24.3 102.0 5.01 1.76
MPH B3 8 32.5 109.0 7.99 2.96
L2 8 15.0 27.4 5.61 2.60
K1 8 27.5 75.7 5.31 2.05
HPH K5 13 35.8 136.0 7.35 5.02
K9 10 33.9 120.0 6.85 4.29
L3 8 39.4 163.0 6.79 3.27
in the highly organic soil, 1.54 cm in the soil withintermediate organic matter content, and 1.51 cm inthe soil with highest carbonate content.
Forest structure and production
The dominant species in each habitat type are listedin Table 1. Forest structure varied widely among sites,with canopy height ranging from 4 to 13 m, basal areafrom 4 to 39 m2 ha−1, and tree biomass from 5 to 163t ha−1 (Table 4). Stand basal areas generally followedthe sequence TTW < PRF< LPH < MPH < HPH.Canopy heights also followed the same order, witha single exception: the PRF canopy was taller thanthat of all other units except HPH, which was aboutthe same. Habitat types were not clearly distinguishedon the basis of stand biomass, except that HPH wasconsistently the highest.
Annual litterfall and wood production (biomass in-crement) both varied considerably, with the formerranging from 2.9 to 7.4 Mg ha−1 yr−1, and the latterfrom 0.4 to 5.0 Mg ha−1 yr−1. Litter production ex-ceeded wood production by substantial margins in allstands except the three PRF sites. Total (wood + litter)annual production was less than 6 Mg ha−1 yr−1 inTTW and PRF sites, but exceeded 7 Mg ha−1 yr−1
in all LPH, MPH, and HPH stands. The highest pro-ductivity observed was 12.4 Mg ha−1 yr−1 at HPH siteK5.
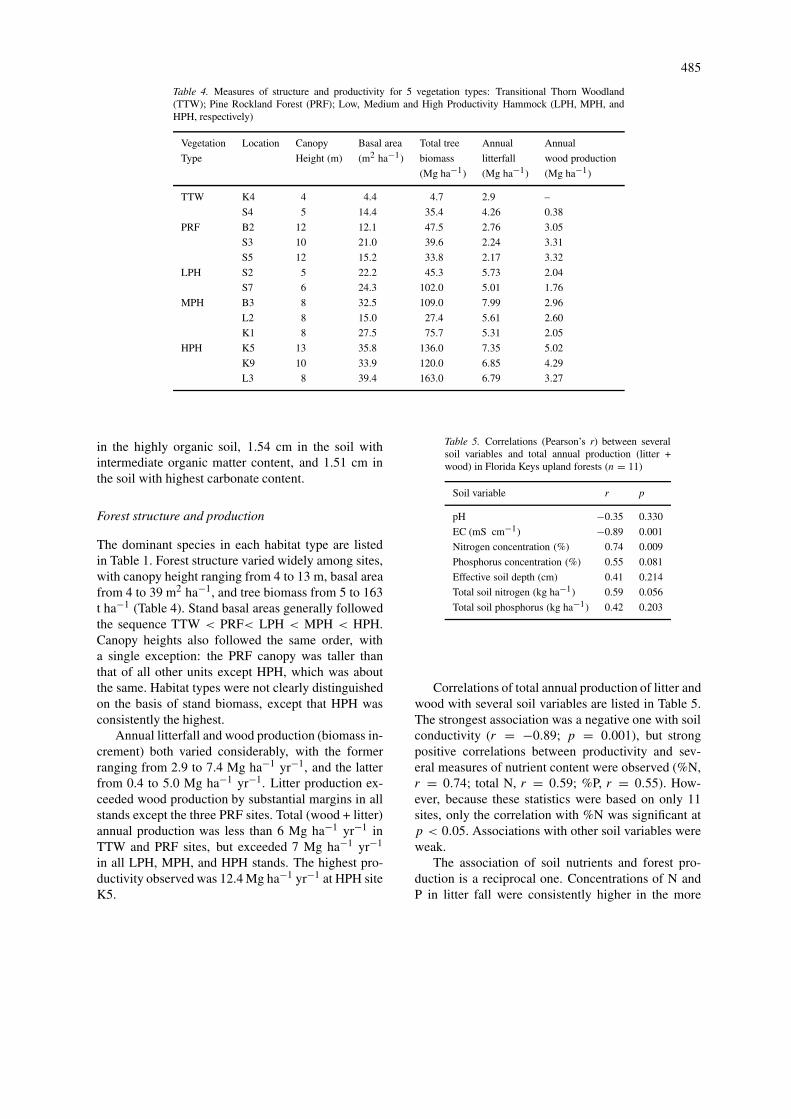
Table 5. Correlations (Pearson’s r) between severalsoil variables and total annual production (litter +wood) in Florida Keys upland forests (n = 11)
Soil variable r p
pH −0.35 0.330
EC (mS cm−1) −0.89 0.001
Nitrogen concentration (%) 0.74 0.009
Phosphorus concentration (%) 0.55 0.081
Effective soil depth (cm) 0.41 0.214
Total soil nitrogen (kg ha−1) 0.59 0.056
Total soil phosphorus (kg ha−1) 0.42 0.203
Correlations of total annual production of litter andwood with several soil variables are listed in Table 5.The strongest association was a negative one with soilconductivity (r = −0.89; p = 0.001), but strongpositive correlations between productivity and sev-eral measures of nutrient content were observed (%N,r = 0.74; total N, r = 0.59; %P, r = 0.55). How-ever, because these statistics were based on only 11sites, only the correlation with %N was significant atp < 0.05. Associations with other soil variables wereweak.
The association of soil nutrients and forest pro-duction is a reciprocal one. Concentrations of N andP in litter fall were consistently higher in the more
486
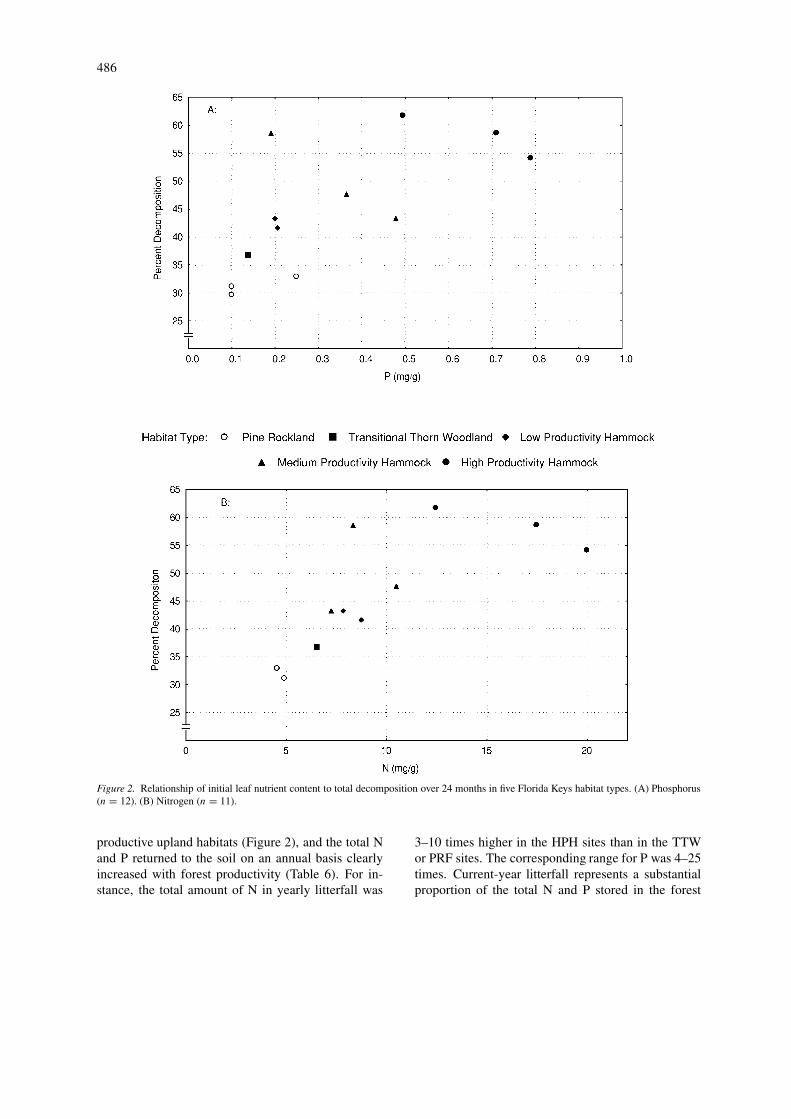
Figure 2. Relationship of initial leaf nutrient content to total decomposition over 24 months in five Florida Keys habitat types. (A) Phosphorus(n = 12). (B) Nitrogen (n = 11).
productive upland habitats (Figure 2), and the total Nand P returned to the soil on an annual basis clearlyincreased with forest productivity (Table 6). For in-stance, the total amount of N in yearly litterfall was
3–10 times higher in the HPH sites than in the TTWor PRF sites. The corresponding range for P was 4–25times. Current-year litterfall represents a substantialproportion of the total N and P stored in the forest
487
floor, ranging as high as 6% for N (plot S7), and 5%for P (plot K5) (Table 6). Assuming that the source ofmost soil N and P is litterfall, minimum estimates ofN and P turnover times are therefore of the order of 20years.
Decomposition and soil organic matter turnover
Measured litter decomposition ranged from 18% to52% during the first year the newly senesced mater-ial was exposed to field conditions, and from 30 to62% after two years (Figure 2). Decomposition wasmost rapid in the HPH, MPH, and LPH habitat types.The slow decomposition observed in the TTW andPRF types was associated with litter N concentrations<7 mg g−1 dry weight and litter P concentrations<0.25 mg g−1 (Figure 2).
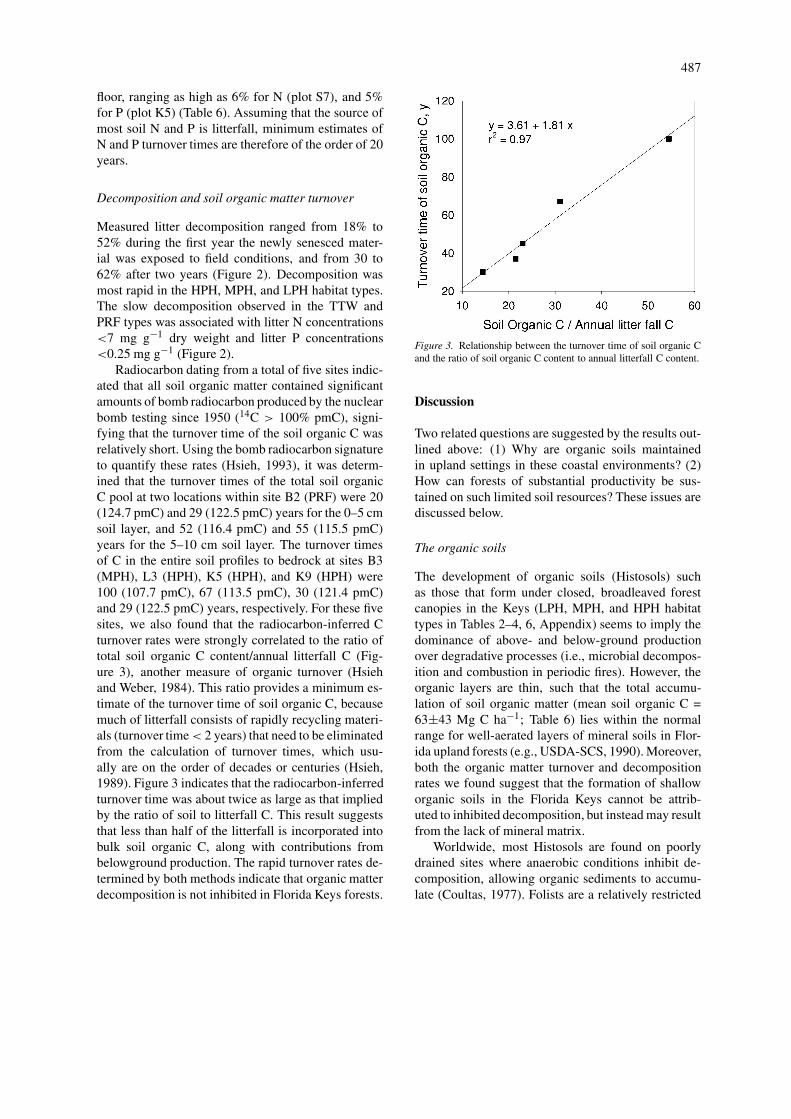
Radiocarbon dating from a total of five sites indic-ated that all soil organic matter contained significantamounts of bomb radiocarbon produced by the nuclearbomb testing since 1950 (14C > 100% pmC), signi-fying that the turnover time of the soil organic C wasrelatively short. Using the bomb radiocarbon signatureto quantify these rates (Hsieh, 1993), it was determ-ined that the turnover times of the total soil organicC pool at two locations within site B2 (PRF) were 20(124.7 pmC) and 29 (122.5 pmC) years for the 0–5 cmsoil layer, and 52 (116.4 pmC) and 55 (115.5 pmC)years for the 5–10 cm soil layer. The turnover timesof C in the entire soil profiles to bedrock at sites B3(MPH), L3 (HPH), K5 (HPH), and K9 (HPH) were100 (107.7 pmC), 67 (113.5 pmC), 30 (121.4 pmC)and 29 (122.5 pmC) years, respectively. For these fivesites, we also found that the radiocarbon-inferred Cturnover rates were strongly correlated to the ratio oftotal soil organic C content/annual litterfall C (Fig-ure 3), another measure of organic turnover (Hsiehand Weber, 1984). This ratio provides a minimum es-timate of the turnover time of soil organic C, becausemuch of litterfall consists of rapidly recycling materi-als (turnover time < 2 years) that need to be eliminatedfrom the calculation of turnover times, which usu-ally are on the order of decades or centuries (Hsieh,1989). Figure 3 indicates that the radiocarbon-inferredturnover time was about twice as large as that impliedby the ratio of soil to litterfall C. This result suggeststhat less than half of the litterfall is incorporated intobulk soil organic C, along with contributions frombelowground production. The rapid turnover rates de-termined by both methods indicate that organic matterdecomposition is not inhibited in Florida Keys forests.
Figure 3. Relationship between the turnover time of soil organic Cand the ratio of soil organic C content to annual litterfall C content.
Discussion
Two related questions are suggested by the results out-lined above: (1) Why are organic soils maintainedin upland settings in these coastal environments? (2)How can forests of substantial productivity be sus-tained on such limited soil resources? These issues arediscussed below.
The organic soils
The development of organic soils (Histosols) suchas those that form under closed, broadleaved forestcanopies in the Keys (LPH, MPH, and HPH habitattypes in Tables 2–4, 6, Appendix) seems to imply thedominance of above- and below-ground productionover degradative processes (i.e., microbial decompos-ition and combustion in periodic fires). However, theorganic layers are thin, such that the total accumu-lation of soil organic matter (mean soil organic C =63±43 Mg C ha−1; Table 6) lies within the normalrange for well-aerated layers of mineral soils in Flor-ida upland forests (e.g., USDA-SCS, 1990). Moreover,both the organic matter turnover and decompositionrates we found suggest that the formation of shalloworganic soils in the Florida Keys cannot be attrib-uted to inhibited decomposition, but instead may resultfrom the lack of mineral matrix.
Worldwide, most Histosols are found on poorlydrained sites where anaerobic conditions inhibit de-composition, allowing organic sediments to accumu-late (Coultas, 1977). Folists are a relatively restricted

488
Table 6. Estimated organic C, total N and P content in soil and litterfall (SOC, soil N and P are adjusted forvolume, gravel, and soil-less areas). – indicates missing data
Habitat Site Soil Depth SOC Soil N Soil P Litter C Litter N Litter P
Type (cm) (Mg ha−1) (kg ha−1) (kg ha−1 yr−1)
TTW K4 12 51.1 1.60 166 1160 16.8 0.58
S4 7 30.5 1.10 77 1613 28 0.60
PRF B2 10 25.4 1.79 188 1104 12.6 0.70
S3 12 52.1 1.85 132 896 – –
S5 7 49.5 1.89 107 868 10.8 0.22
LPH S7 14 26.7 0.79 320 2004 49.6 1.20
MPH B3 14 174.0 6.13 1360 3196 39.0 1.00
K1 – – – – 2124 57.6 3.84
L2 10 94.6 3.04 403 – 44.0 1.00
HPH K5 10 42.3 1.69 65 2940 84.3 3.33
K9 18 58.8 2.94 175 2740 140.6 5.85
L3 10 84.4 4.22 510 2716 119.0 4.83
group of organic soils found in well-drained sites inhumid climates from the Tropics to high latitudes(Coultas, 1977). In the United States, Folists withslightly lower pH than those found in the Florida Keysare reported from tropical environments in Hawaii,where the Kona and Honokohau series develop overhard volcanic rock (USDA, 2000). Kona soils formunder forest cover on relatively steep slopes (2–40%)at high elevations (>500 m). Soils of the Honoka-hau series typically occupy more xeric sites at lowerelevation, under grass cover. In contrast, the Folistswe describe from the Florida Keys develop in placeon coralline or oolitic limestone bedrock. The lime-stone is 99% calcium carbonate and leaves almost noresidual mineral material upon dissolution, a processthat is accelerated by tree roots through bioturbationand the production of organic acids (Duever et al.,1986). Saharan dust reaches the Keys via high el-evation air currents (Prospero and Nees, 1986), butoutside of some local depressions, these materialsdo not accumulate to a significant degree in the soilmatrix.
Estimated rates of production and decompositionin Florida Keys hammocks are similar to values repor-ted for other dry tropical forests, where organic soilsare the exception. Litter production estimates in thethree Florida Keys hammock types (mean = 6.3 Mgha−1 yr−1; Table 4) lie within the range of values re-ported from 34 dry tropical forests (range = 1.5–12.6Mg ha−1 yr−1; mean = 4.81 Mg ha−1 yr−1; Martinez-Yrizar, 1995). Lugo and Murphy (1986) observed a
decomposition rate of 41.3% per year at a dry forest atGuanica, Puerto Rico. This rate translates to roughly65% decomposition over 24 months, which is slightlyfaster than observed litter decomposition rates in therelatively productive HPH and MPH types in the Keys(44–62%; Figure 2).
The litter decomposition rates cited above arebased on short-term studies that assess the decom-position of only the least refractory element of theorganic material that reaches the forest floor. For in-stance, Minderman (1968) found that the bulk of soilorganic matter in a mor soil in Holland was com-prised of a small portion of total litterfall, i.e., lessthan 25%. Our results from the Florida Keys suggestthat less than half of litterfall became incorporated intosoil organic C (Figure 3). In the dry tropical forestswe studied, these bulk materials provided a mean Cturnover time of 51 ± 11 (1 S.E.) years, as determ-ined by the bomb radiocarbon signature (Hsieh, 1993).This rapid turnover of organic C implies that FloridaKeys soils lack the stable soil organic C pool (turnovertime ≥ 103 years) usually observed in mineral soils(Hsieh, 1992), and is not consistent with the viewthat organic soils develop only where decomposition isslow. Organo-mineral association is believed to be theprimary mechanism by which organic carbon turnoveris extended beyond several hundred years (Adu andOades, 1978; Hassink, 1992).
The presence of organic soils in the hardwoodhammocks of the Keys also attests to the low fre-quency of fire in these forests. However, once ignited
489
by lightning or human sources, fires may smolderfor months in cavities within the limestone bedrock,emerging when conditions warrant to consume or-ganic material accumulated over many years. Carefulinspection of old aerial photographs indicated that,among the sites we sampled, only those in the PRFhabitat type had burned during the last half century ormore. The short turnover time of organic C in eventhe PRF soils, however, implies that the stock maybe rebuilt within a time scale of several decades to acentury.
Soil limitation of forest production
Though based on a small sample of Florida Keysforests, the correlations listed in Table 5 suggest acovariation of above-ground production with severalfundamental soil resources, especially the size of thesoil N pool. Furthermore, the association of decom-position rate with habitat type (Figure 2) suggests thatthese relationships may also extend to soil microbialprocesses. However, distinguishing cause and effectin the soil vs. vegetation relationship is not obvious,especially in light of the youth and thinness of thesoil organic matter. The more productive forests returnmore nutrients and organic matter to the soil, enhan-cing the resources available to them and amplifyingtheir relative productivity.
Several external factors may set the parameters ofthe cycle described above. The most productive forestsare situated at relatively high elevations in the interiorof the small islands, where they are least likely to beinundated by spring tides or storm surges. Salts depos-ited during these events may remain in place for longperiods, with negative impacts on growth (Table 5).Although one might expect high groundwater salinityto negatively affect productivity, this apparently doesnot apply to Keys forests more than about two metersabove sea level . In fact, our data (Table 1) show thatthe very productive HPH forests of the Upper Keyshad the highest groundwater salinity (average 19 ‰),while the less productive PRF type of the Lower Keyshad the lowest (average 4 ‰).
In view of the limited soil resources available, re-cycling processes must be extremely efficient, andlosses of water and nutrients through runoff or leach-ing must be small in order to sustain the high ratesof production attained in the three Florida Keys ham-mock types (Table 4) in comparison to many other drytropical forests (Murphy and Lugo, 1986). Economiccycling of water is particularly critical. For instance,
if evapotranspiration is conservatively assumed to be0.25 cm/day (e.g., Dolan et al., 1984; German, 2000),and, as our analyses indicate, a typical soil profileof 10 cm depth holds about 1.5 cm of available wa-ter, then it follows that rainless periods as short asone week may exhaust the soil moisture storage ca-pacity. One mechanism that clearly limits water lossis uptake by the dense root mat that typically formsnear the soil surface in these stands . Moreover, undersome conditions, soil water and nutrient pools may besupplemented by condensation of water vapor on leafsurfaces, or by rewetting of the soil during peaks inthe tidally-driven ground water cycle. Root penetra-tion into the porous limestone has been observed, andcould indicate that trees obtain substantial quantitiesof both nutrients and water from the aquifer. Evidencefor this can be seen on Big Pine Key, where slash pinesgrowing directly on limestone bedrock can maintainreasonable growth rates, though in very open stands.In contrast, hammock species in the Florida Keys arereported to utilize soil water exclusively, based oncomparisons of the isotopic content of plant water toalternative water sources (Ish-Shalom-Gordon et al.,1992).
Conclusions
The tropical forests of the Florida Keys are supportedby thin organic soils developed directly on limestonebedrock. These well-drained organic soils differ frompoorly-drained Histosols in their limited depth and intheir rate of organic matter turnover, which by sev-eral measures is extremely fast. Forest production onsuch sites appears to depend on a fine balance betweenaccretionary and degradational processes. On the onehand, sustained production requires that soil volumebe sufficient to maintain adequate water supplies. Con-versely, our estimates of nitrogen and phosphoruspools make clear that plant demands can only be met ifmineralization is rapid, especially since organic formsdominate the soil nutrient pool. For forest productionto be sustained in such an ecosystem, it also appearsthat nutrient cycling must be extremely efficient, i.e.,there can be little leaching beyond the rooting zone.Maintenance of the very diverse forests that grow onthe most productive Keys soils may depend on a con-tinuation of this efficiency in the face of threats suchas forest fragmentation and sea level rise (Ross et al.,1994; Strong and Bancroft, 1994).
490
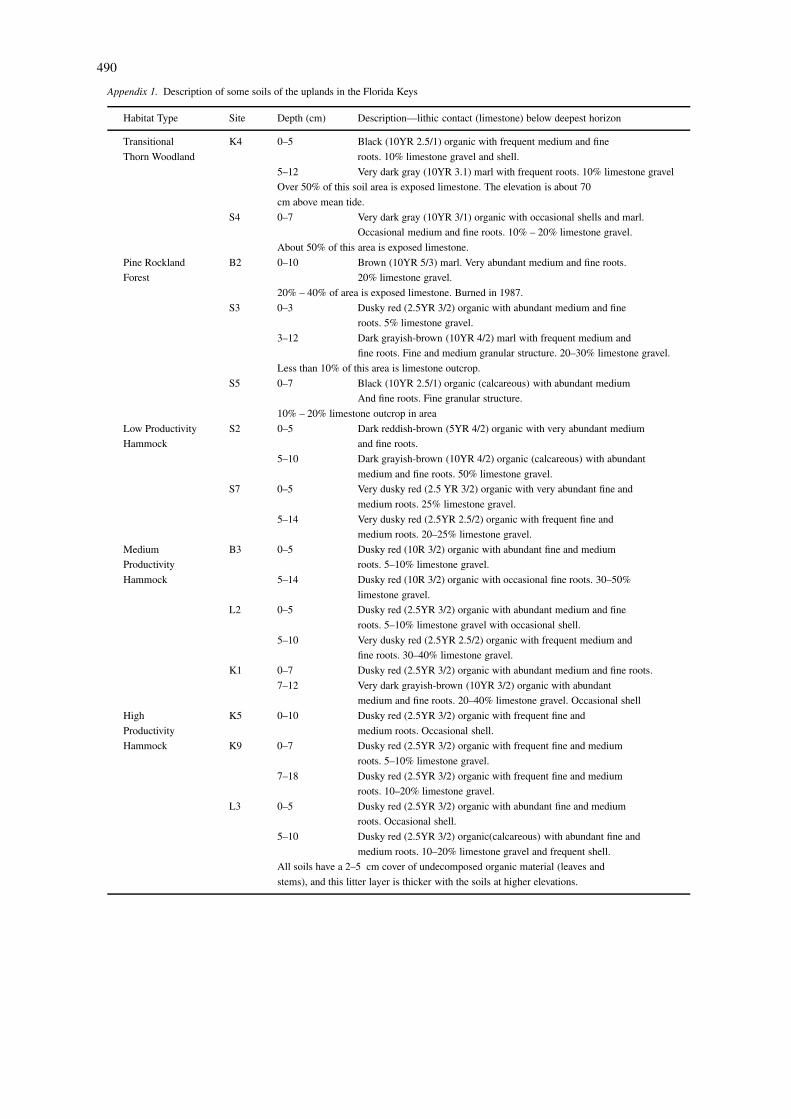
Appendix 1. Description of some soils of the uplands in the Florida Keys
Habitat Type Site Depth (cm) Description—lithic contact (limestone) below deepest horizon
Transitional K4 0–5 Black (10YR 2.5/1) organic with frequent medium and fine
Thorn Woodland roots. 10% limestone gravel and shell.
5–12 Very dark gray (10YR 3.1) marl with frequent roots. 10% limestone gravel
Over 50% of this soil area is exposed limestone. The elevation is about 70
cm above mean tide.
S4 0–7 Very dark gray (10YR 3/1) organic with occasional shells and marl.
Occasional medium and fine roots. 10% – 20% limestone gravel.
About 50% of this area is exposed limestone.
Pine Rockland B2 0–10 Brown (10YR 5/3) marl. Very abundant medium and fine roots.
Forest 20% limestone gravel.
20% – 40% of area is exposed limestone. Burned in 1987.
S3 0–3 Dusky red (2.5YR 3/2) organic with abundant medium and fine
roots. 5% limestone gravel.
3–12 Dark grayish-brown (10YR 4/2) marl with frequent medium and
fine roots. Fine and medium granular structure. 20–30% limestone gravel.
Less than 10% of this area is limestone outcrop.
S5 0–7 Black (10YR 2.5/1) organic (calcareous) with abundant medium
And fine roots. Fine granular structure.
10% – 20% limestone outcrop in area
Low Productivity S2 0–5 Dark reddish-brown (5YR 4/2) organic with very abundant medium
Hammock and fine roots.
5–10 Dark grayish-brown (10YR 4/2) organic (calcareous) with abundant
medium and fine roots. 50% limestone gravel.
S7 0–5 Very dusky red (2.5 YR 3/2) organic with very abundant fine and
medium roots. 25% limestone gravel.
5–14 Very dusky red (2.5YR 2.5/2) organic with frequent fine and
medium roots. 20–25% limestone gravel.
Medium B3 0–5 Dusky red (10R 3/2) organic with abundant fine and medium
Productivity roots. 5–10% limestone gravel.
Hammock 5–14 Dusky red (10R 3/2) organic with occasional fine roots. 30–50%
limestone gravel.
L2 0–5 Dusky red (2.5YR 3/2) organic with abundant medium and fine
roots. 5–10% limestone gravel with occasional shell.
5–10 Very dusky red (2.5YR 2.5/2) organic with frequent medium and
fine roots. 30–40% limestone gravel.
K1 0–7 Dusky red (2.5YR 3/2) organic with abundant medium and fine roots.
7–12 Very dark grayish-brown (10YR 3/2) organic with abundant
medium and fine roots. 20–40% limestone gravel. Occasional shell
High K5 0–10 Dusky red (2.5YR 3/2) organic with frequent fine and
Productivity medium roots. Occasional shell.
Hammock K9 0–7 Dusky red (2.5YR 3/2) organic with frequent fine and medium
roots. 5–10% limestone gravel.
7–18 Dusky red (2.5YR 3/2) organic with frequent fine and medium
roots. 10–20% limestone gravel.
L3 0–5 Dusky red (2.5YR 3/2) organic with abundant fine and medium
roots. Occasional shell.
5–10 Dusky red (2.5YR 3/2) organic(calcareous) with abundant fine and
medium roots. 10–20% limestone gravel and frequent shell.
All soils have a 2–5 cm cover of undecomposed organic material (leaves and
stems), and this litter layer is thicker with the soils at higher elevations.
491
Acknowledgements
We wish to recognize that the National Audubon So-ciety provided much of the financial support for thisstudy. Joe O’Brien, Pablo Ruiz, and Josh Waltersmade important contributions to the success of the pro-ject in the field and/or in the lab. This is SoutheastEnvironmental Research Center Contribution #193.
References
Adu J K and Oades J M 1978 Physical factors affecting decompos-ition of organic materials in soil aggregates. Soil Biol. Biochem.10, 109–115.
Bremner J M 1965 Total nitrogen. In Methods of Soil Analysis,Part 2. Ed. C A Black. pp. 1149–1179. American Society ofAgronomy, Madison, WI.
Brown S, Gillespie A J R and Lugo A E 1989 Biomass estimationmethods for tropical forests with applications to forest inventorydata. For. Sci. 38, 881–902.
Clark A III and Taras M A 1976 Comparison of abovegroundbiomass of the four major southern pines. For. Prod. J. 26, 25–29.
Coultas C L 1977 Soils of the Apalachicola National Forest wet-lands. Part 2: cypress and gum swamps. Soil and Crop Sci. Soc.of FL. Proc. 37, 154–159.
Covington W W and Aber J D 1980 Leaf production during second-ary succession in northern hardwoods. Ecology 61, 200–204.
Dolan T J, Hermann A J, Bayley S E and Zoltek J Jr 1984 Evapo-transpiration of a Florida, USA, freshwater wetland. J. Hydrol.74, 355–371.
Duever M J, Carlson J E, Meeder J F, Duever L C, Gunderson LH, Riopelle L A, Alexander T R, Myers R L and Spangler D P1986 The Big Cypress National Preserve. Research Report No.8, National Audubon Society, New York. 455 pp.
German E R 2000 Regional evaluation of evapotranspiration in theEverglades. US Geological Survey Water Resources Investiga-tions Report 00–4217. Tallahassee, FL, USA.
Hanson C E 1980 The freshwater resources of Big Pine Key. USDepartment of the Interior Geologic Survey. Open file report 80–447.
Hassink J 1992 Effects of soil texture and structure on C and Nmineralization in grassland soils. Biol. Fert. Soils 14, 126–134.
Hoffmeister J D and Multer H G 1968 Geology and origin of theFlorida Keys. Geol. Soc. Am. Bull. 79, 1487–1502.
Hsieh Y P 1989 Dynamics of soil organic matter formation in crop-lands – conceptual analysis. Sci. Total Environ. 81/82, 381–390.
Hsieh Y P 1992 Pool size and mean age of the stable soil organiccarbon in croplands. Soil Sci. Soc. Am. J. 56, 460–464.
Hsieh Y P 1993 The radiocarbon signatures of turnover ratesin active soil organic carbon pools.Soil Sci. Soc. Am. J. 57,1020–1022.
Hsieh Y P and Weber O J 1984 Net aerial primary production anddynamics of organic matter formation in a tidal marsh ecosystem.Soil Sci. Soc. Am. J. 48, 65–72.
Ish-Shalom-Gordon N, Sternberg L, Ross M S, O’Brien J J andFlynn L J 1992 Water utilization of tropical hardwood hammocksof the Lower Florida Keys. Oecologia 92, 108–112.
Jackson ML 1958 Soil Chemical Analysis. Prentice-Hall, Inc.Englewood Cliffs, N.J.
Kapos V 1986 Dry limestone forests of Jamaica. In Forests of Ja-maica. Eds. D A Thompson, D K Bretting and M Humphreys.pp. 49–58. Jamaican Society of Scientists and Technologists,Kingston, Jamaica.
Klute A 1965 Water capacity. In Methods of Soil Analysis, Part 1.Ed. C A Black. pp. 274–277. Amer. Soc. of Agronomy, Madison,WI.
Lidz B H and Shinn E A 1991 Paleoshorelines, reefs, and a risingsea: South Florida, U.S.A. J. Coast. Res. 7, 203–229.
Liming F G 1957 Homemade dendrometers. J. For. 55, 575–577.Lugo A E and P G Murphy 1986 Nutrient dynamics of a Puerto
Rican subtropical dry forest. J. Trop. Ecol. 2, 55–72.Martinez-Yrizar A 1995 Biomass distribution and primary pro-
ductivity of tropical dry forests. In Seasonally Dry TropicalForests. Eds. S H Bullock, H A Mooney and E Medina. pp.326–345. Cambridge University Press, Cambridge, UK.
Meadows D G, Caballero J P, Kruse S E, Vacher H L and Ross MS In press Variation of salinity in brackish-water lenses of twoFlorida Keys. J. Coast. Res.
Mehlich A 1984 Mehlich III soil extractant, a modification of Meh-lich II extractant. Comm. Soil Sci. Plant Anal. 15, 1409–1416.
Minderman G 1968 Addition, decomposition and accumulation oforganic matter in forests. J. Ecol. 56, 355–362.
Murphy P G and Lugo A E 1986 Ecology of tropical dry forest.Annu. Rev. Ecol. Syst. 17, 67–88.
Olsen J R and Sommers L E 1982 Phosphorus. In Methods of SoilAnalysis, Part 2. Eds. R H Miller and D R Sommers. pp. 403–430. Amer. Soc. Agron., Madison, WI.
Pritchett W L 1979 Properties and management of forest soils.Wiley, New York. 500 pp.
Prospero J M and Nees R T 1986 Impact of the North Africandrought and El Nino on mineral dust in the Barbados trade winds.Nature 320, 735–738.
Ross M S, O’Brien J J and Flynn L J 1992 Ecological site clas-sification of Florida Keys terrestrial habitats. Biotropica 24,488–502.
Ross M S, O’Brien J J and Sternberg L 1994 Sea level rise andthe reduction in pine forests in the Florida Keys. Ecol. App. 4,144–156.
Sims J T and Johnson GV 1991 Micro-nutrient soil tests. In Mi-cronutrients in Agriculture. Book Series no. 4. Eds. J Mortvedt,F R Cox, L M Shuman and B M Welch. pp. 427–476. Soil Sci.Soc. of Amer., Madison, WI.
Soltanpour P N and Schwab A P 1977 A new soil test for simultan-eous extraction of micro-and macro-nutrients in alkaline soils.Comm. Soil Sci. Plant Anal. 8, 195–207.
Soil Survey Division, NRCS, U.S. Dept. of Agriculture 2000Soil series description of Kona and Honokohau series. USDA,Washington, D.C.
Soil Survey Staff 1972 Procedures for collection of soil samplesand methods of analysis for soil survey. Soil Survey Investiga-tion Report, No.1. USDA. Soil Conservation Service, U.S. Govt.Printing Office. Washington, D.C.
Strong A M and Bancroft G T 1994 Patterns of deforestation andfragmentation of seasonal deciduous and mangrove forests in theUpper Florida Keys. Bull. Mar. Sci. 54, 795–804.
U. S. Dept. Agriculture, NRCS 1995 Soil survey of Monroe County,Keys Area, Florida. Supt. of Documents, Washiington, D.C.
U.S. Department of Agriculture, NRCS 2000 Kona series, Honoko-hau series. www.statlab.iastate.edu. Ames, Ia.
U.S. Dept. of Agriculture, Salinity Lab Staff 1954 Diagnosis andimprovement of saline and alkali soils. U.S. Supt of Documents,Washington, D.C.

492
U.S. Dept. Agriculture, Soil Survey Staff 1975 Soil taxonomy:A basic system of classification for making and interpretingsoil surveys. Handbook no. 436. U.S. Govt. Printing Office,Washington. D.C.
U.S. Dept. of Agriculture Soil Conservation Service 1990 Soil Sur-vey of Polk County FL. U.S. Govt. Printing Office. Washington,D.C.
U.S. Dept. Agriculture, Soil Survey Staff 1993 Soil Survey Manual.Supt. of Documents, Washington, D.C.
Vacher H L 1978 Hydrogeology of Bermuda – significance ofacross-the-island permeability. J. Hydrol. 39, 376–426.
Walter H 1985 Vegetation of the Earth and ecological systems of thegeo-biosphere. Springer-Verlag New York Inc., Secaucus, NJ,USA.
Section editor: R. Merckx