Embed Size (px)
Citation preview
NATURAL RESOURCES CONSERVATION SERVICE
EDGE-OF-FIELD WATER QUALITY MONITORING
SYSTEM INSTALLATION
CONSERVATION ACTIVITY
(Code 202)
DEFINITION
This conservation activity standard addresses the system installation associated with edge-of-field water quality monitoring.
PURPOSE
Provide criteria for the installation of water quality monitoring system necessary to collect data for:
o Evaluating conservation practice effectiveness
o Field scale model validation
o On-farm adaptive management
CONDITIONS WHERE THE CONSERVATION ACTIVITY APPLIES
This conservation activity applies to all land uses where conservation practices are or will be addressing surface and subsurface drainage water quality, and there is a need to determine the effects and performance of applied conservation practices. The pollutant(s) to be measured at the edge-of-field must be tied to a water quality constituent of concern for the associated receiving stream or water body. This ties the resource concern back to the planning process and promotes a systems approach to conservation.
GENERAL CRITERIA
This document provides criteria to install the system that allows for data collection within an acceptable level of uncertainty (see Table 2). This standard is applicable when used in conjunction with Edge-of-Field Water Quality Monitoring activity standard 201. This standard can be used independently with approval from the National Water Quality Specialist.
System Design
The system scenario outlined in Edge-of-Field Water Quality Monitoring – Data Collection and Evaluation (201) is considered the “typical system” designed to meet the stated purposes of edge-of-field water quality monitoring. Event Mean Concentration (EMC) and accurate flow (discharge) measurements are required for each runoff event. All systems must be capable of sampling runoff events throughout the year. The typical system specifications listed in Table 1
NRCS – October 1, 2012 Page 1
and described subsequently meet the requirements for two types of edge-of-field monitoring: surface runoff sites (Figure 1), and sites with subsurface drainage (Figure 2).
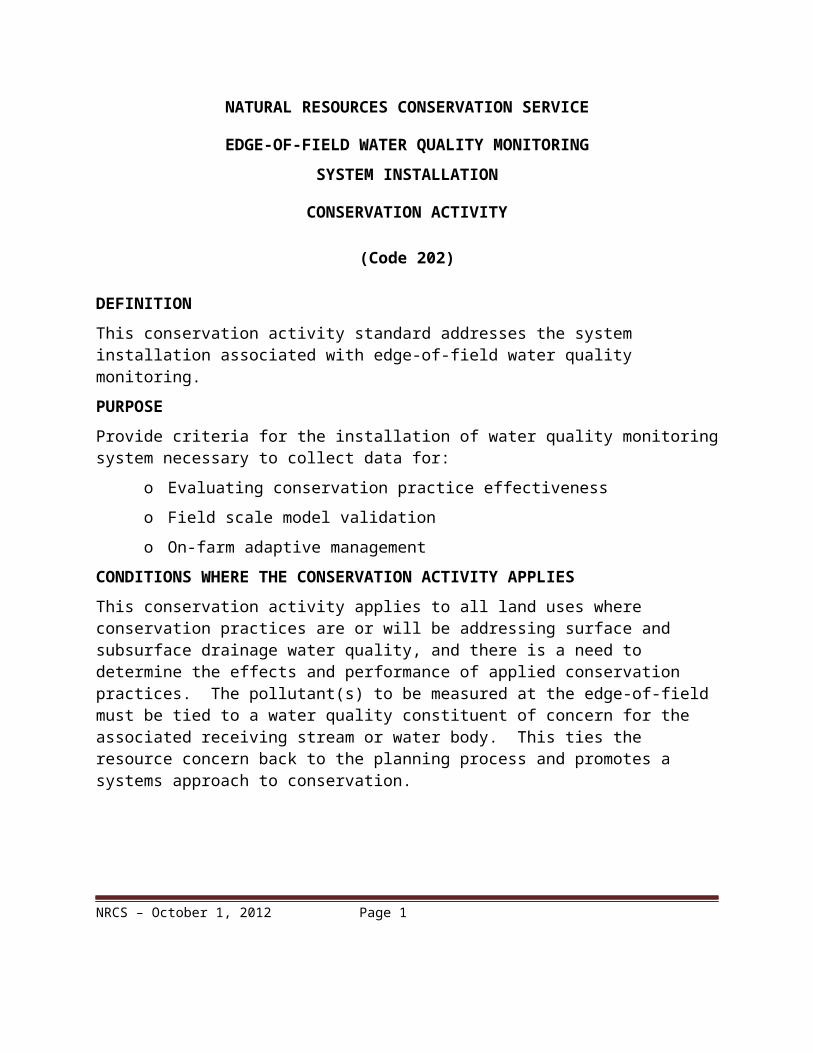
Table 1. Equipment and installation required for a typical system design (2 monitoring systems for load comparisons).
Equipment QuantityPre-calibrated flow control structurea 2Depth (stage) sensor and cork gauge 2Area velocity flow meterb 2Rain gauge (1 tipping bucket and 1 standard)c 2 eachAutomated sampler with bottles and tubing 2Power source (solar panel, controller, and batteries) 2Equipment shelter 2Communications device (cell phone, radio) d 2Enclosure with propane heate 2Miscellaneous (connectors, cables, platform materials)
a Use smaller structures in drainage pipe flow scenarios. b Necessary in drainage pipe flow conditions and may be necessary in low gradient surface runoff areas with the potential for submerged flow.c A tipping bucket and standard rain gauge is required at each monitored field unless fields are adjacent to provide precipitation amount and intensity data.d Optional feature valuable for monitoring flow conditions and confirming event occurrence at remote sites. e Enclosure such as a calf hut with a propane heater will likely be necessary for year round sampling in northern sites.
The NRCS National Water Quality Specialist must review and approve system designs that fall outside of the typical system. Any designs submitted for review must include an analysis to show that the maximum acceptable uncertainty (Table 2) are not exceeded. Use the analysis method outlined by Harmel et. al. (2006a, 2009) (NEMI USDA HWQ1) .
NRCS – October 1, 2012 Page 2
Figure 2: Subsurface tile drainage pipe with Thel-Mar coumpound weir.
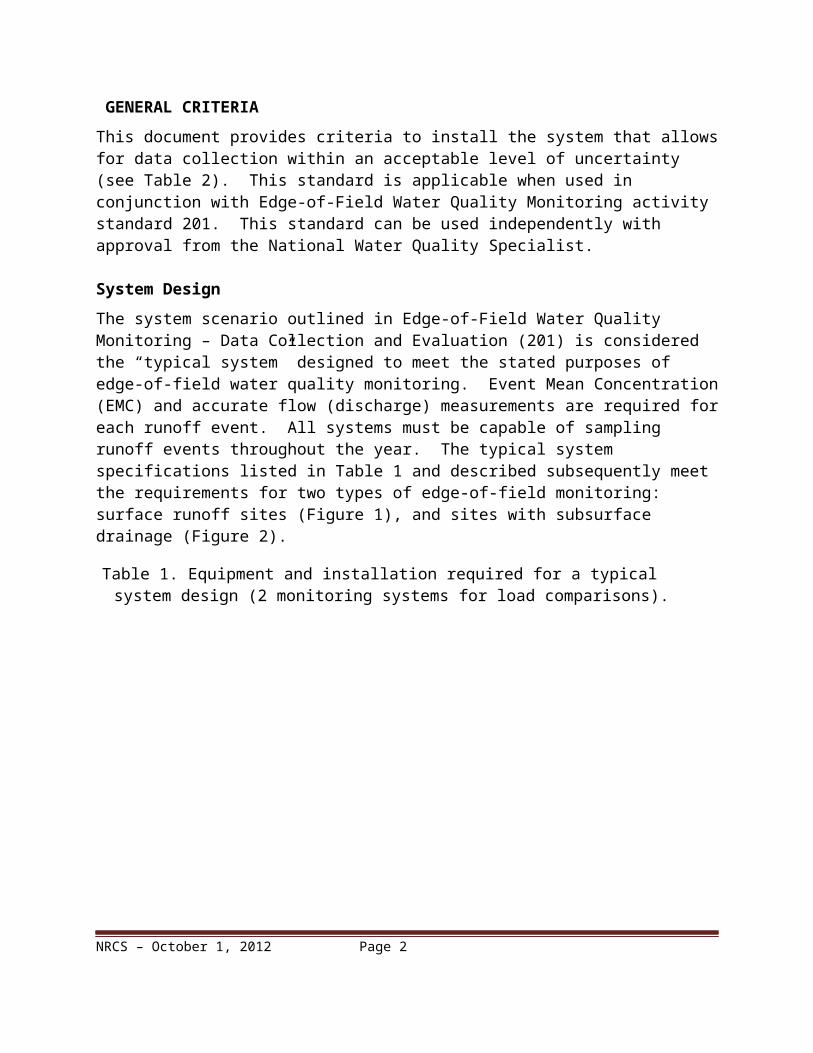
Figure 1: Edge-of-field surface runoff site with a 2.5 foot H-flume
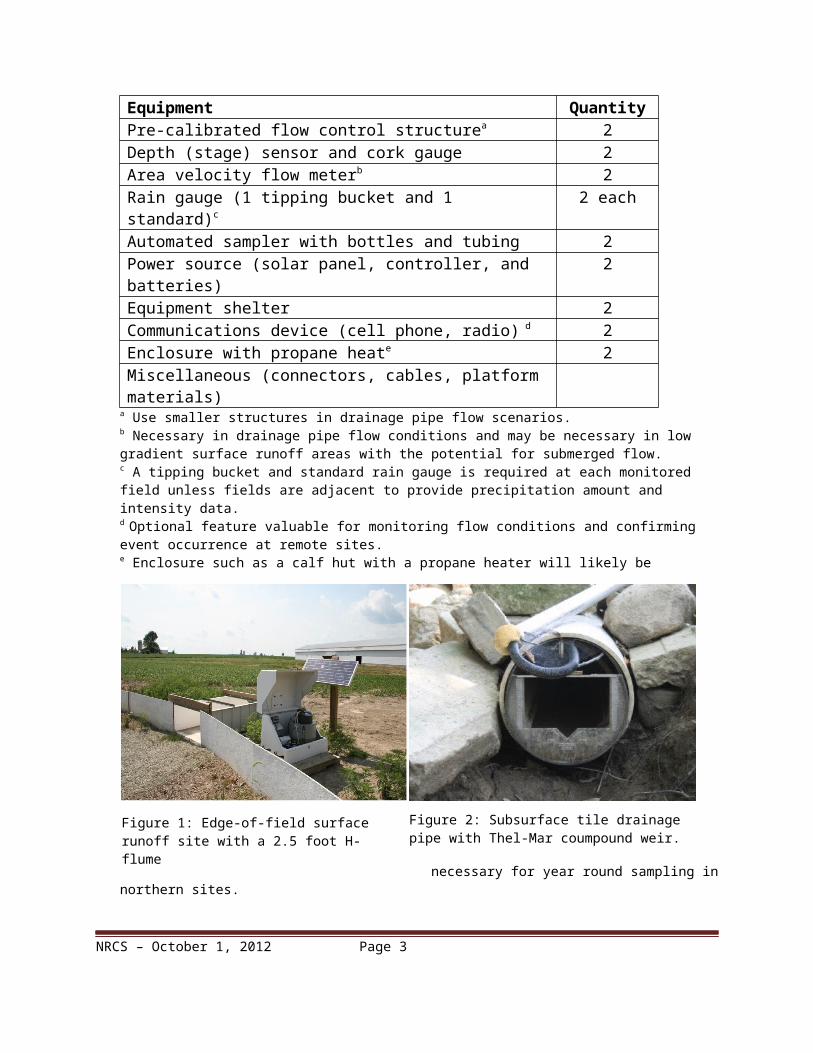
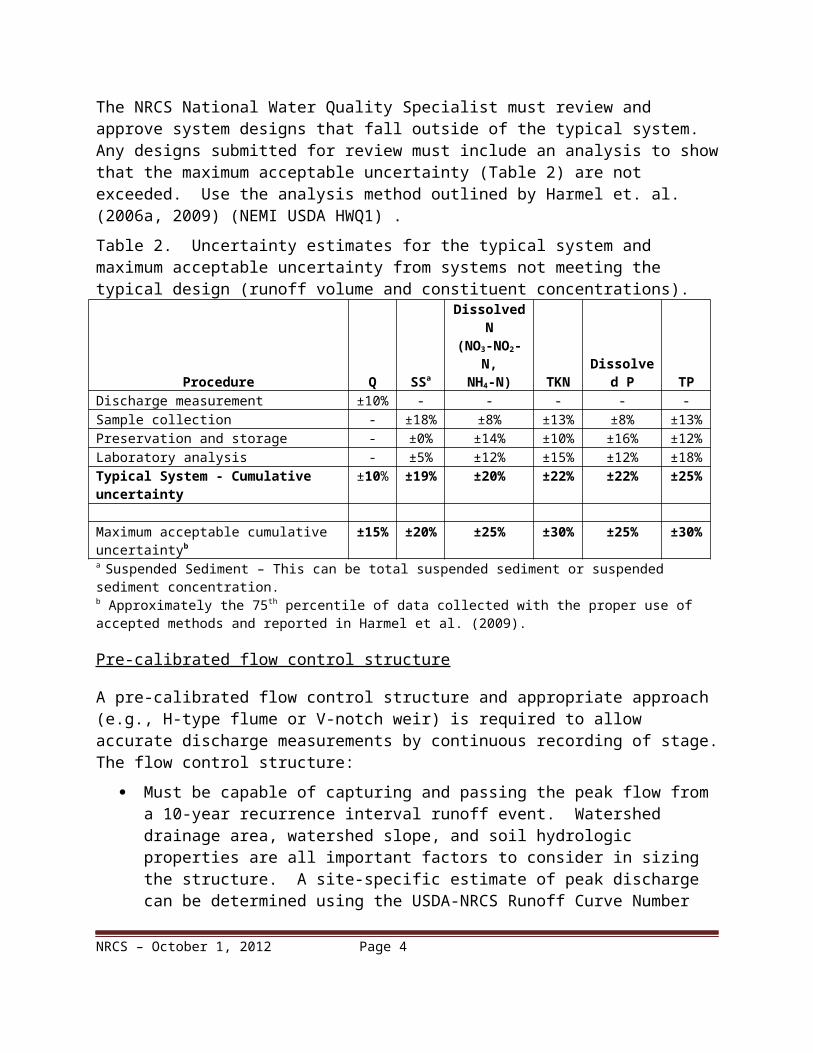
Table 2. Uncertainty estimates for the typical system and maximum acceptable uncertainty from systems not meeting the typical design (runoff volume and constituent concentrations).
Procedure Q SSa
Dissolved N(NO3-NO2-N,
NH4-N) TKNDissolved
P TPDischarge measurement ±10% - - - - -Sample collection - ±18% ±8% ±13% ±8% ±13%Preservation and storage - ±0% ±14% ±10% ±16% ±12%Laboratory analysis - ±5% ±12% ±15% ±12% ±18%Typical System - Cumulative uncertainty ±10% ±19% ±20% ±22% ±22% ±25%
Maximum acceptable cumulative uncertaintyb ±15%
±20% ±25% ±30% ±25% ±30%
a Suspended Sediment – This can be total suspended sediment or suspended sediment concentration.b Approximately the 75th percentile of data collected with the proper use of accepted methods and reported in Harmel et al. (2009).
Pre-calibrated flow control structure
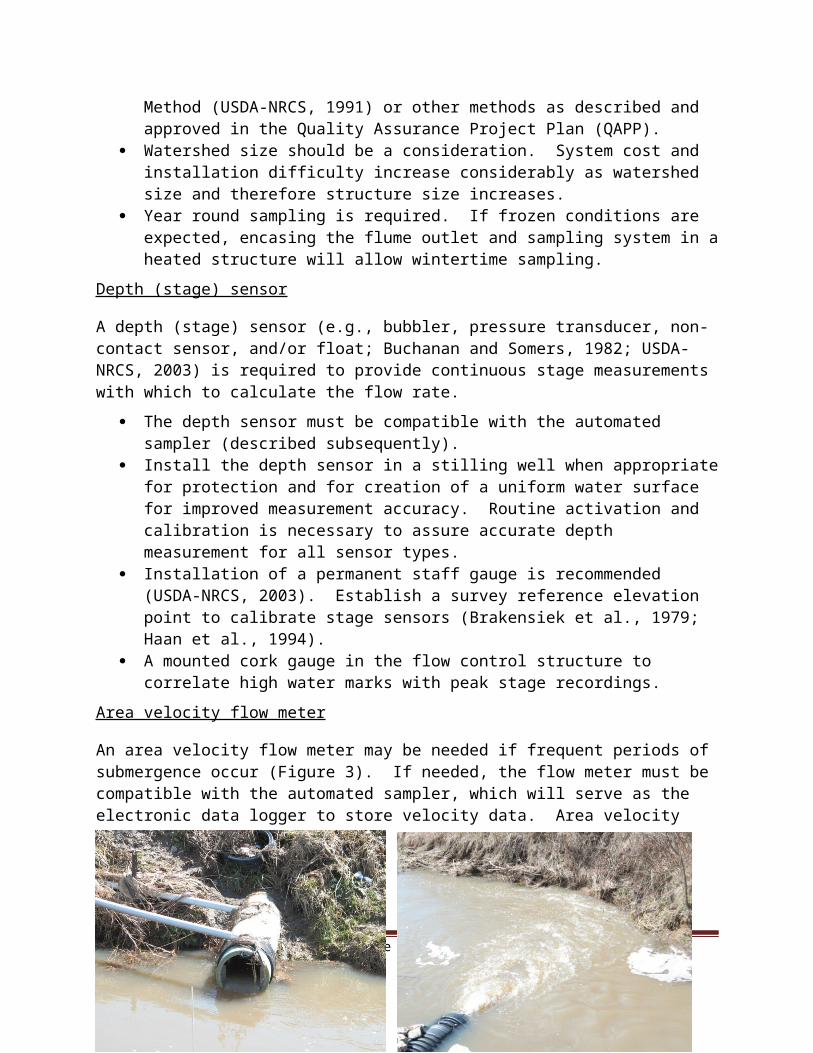
A pre-calibrated flow control structure and appropriate approach (e.g., H-type flume or V-notch weir) is required to allow accurate discharge measurements by continuous recording of stage. The flow control structure:
Must be capable of capturing and passing the peak flow from a 10-year recurrence interval runoff event. Watershed drainage area, watershed slope, and soil hydrologic properties are all important factors to consider in sizing the structure. A site-specific estimate of peak discharge can be determined using the USDA-NRCS Runoff Curve Number Method (USDA-NRCS, 1991) or other methods as described and approved in the Quality Assurance Project Plan (QAPP).
Watershed size should be a consideration. System cost and installation difficulty increase considerably as watershed size and therefore structure size increases.
Year round sampling is required. If frozen conditions are expected, encasing the flume outlet and sampling system in a heated structure will allow wintertime sampling.
Depth (stage) sensor
A depth (stage) sensor (e.g., bubbler, pressure transducer, non-contact sensor, and/or float; Buchanan and Somers, 1982; USDA-NRCS, 2003) is required to provide continuous stage measurements with which to calculate the flow rate.
The depth sensor must be compatible with the automated sampler (described subsequently).
Install the depth sensor in a stilling well when appropriate for protection and for creation of a uniform water surface for improved measurement accuracy. Routine activation and calibration is necessary to assure accurate depth measurement for all sensor types.
Installation of a permanent staff gauge is recommended (USDA-NRCS, 2003). Establish a survey reference elevation point to calibrate stage sensors (Brakensiek et al., 1979; Haan et al., 1994).
NRCS – October 1, 2012 Page 3
A mounted cork gauge in the flow control structure to correlate high water marks with peak stage recordings.
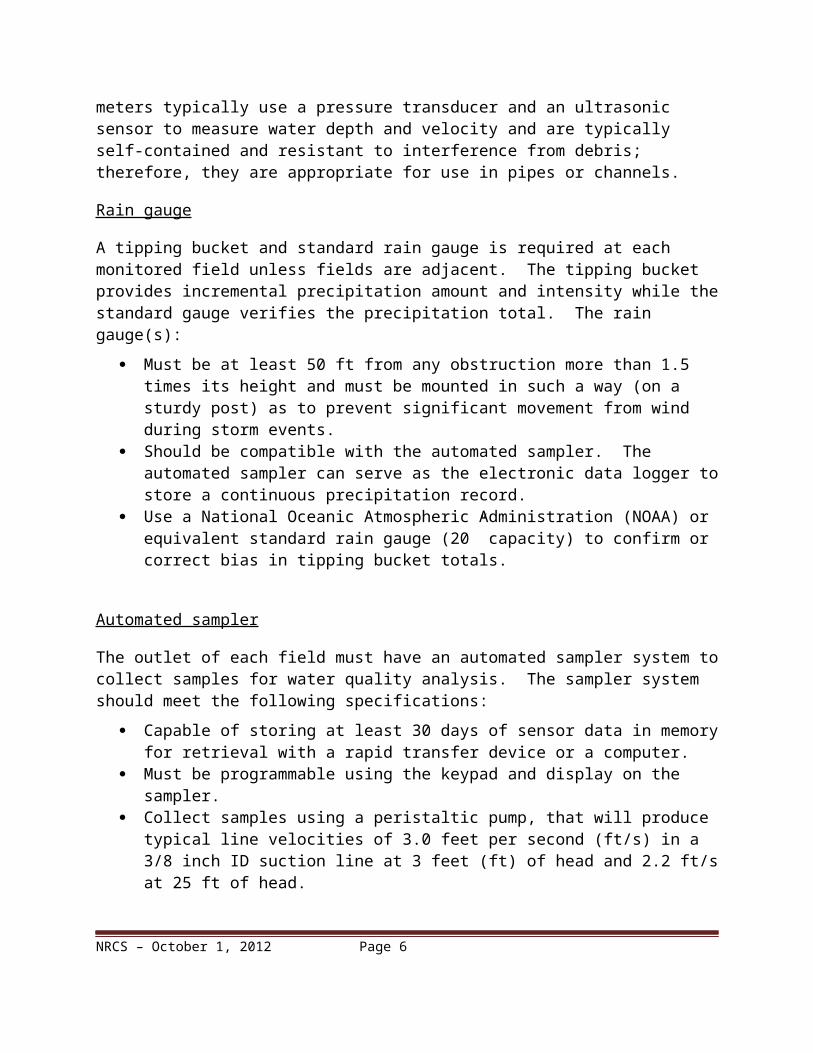
Area velocity flow meter
An area velocity flow meter may be needed if frequent periods of submergence occur (Figure 3). If needed, the flow meter must be compatible with the automated sampler, which will serve as the electronic data logger to store velocity data. Area velocity meters typically use a pressure transducer and an ultrasonic sensor to measure water depth and velocity and are typically self-contained and resistant to interference from debris; therefore, they are appropriate for use in pipes or channels.
Rain gauge
A tipping bucket and standard rain gauge is required at each monitored field unless fields are adjacent. The tipping bucket provides incremental precipitation amount and intensity while the standard gauge verifies the precipitation total. The rain gauge(s):
Must be at least 50 ft from any obstruction more than 1.5 times its height and must be mounted in such a way (on a sturdy post) as to prevent significant movement from wind during storm events.
Should be compatible with the automated sampler. The automated sampler can serve as the electronic data logger to store a continuous precipitation record.
Use a National Oceanic Atmospheric Administration (NOAA) or equivalent standard rain gauge (20” capacity) to confirm or correct bias in tipping bucket totals.
Automated sampler
The outlet of each field must have an automated sampler system to collect samples for water quality analysis. The sampler system should meet the following specifications:
NRCS – October 1, 2012 Page 4
Figure 3: Edge-of-field tile with submergence. Figure 4: Edge-of-field tile with submergence.
Capable of storing at least 30 days of sensor data in memory for retrieval with a rapid transfer device or a computer.
Must be programmable using the keypad and display on the sampler. Collect samples using a peristaltic pump, that will produce typical line velocities of 3.0
feet per second (ft/s) in a 3/8 inch ID suction line at 3 feet (ft) of head and 2.2 ft/s at 25 ft of head.
Pump must be capable of lifting a sample 28 ft and must maintain a line velocity of 2.2 ft/s without the use of a remote pump.
The sample stream must be a direct path from sample source to sample bottle. Samples must not pass through metering chambers or other diversions.
The sampler must typically deliver sample volumes with an accuracy of 10 milliliters (ml) or 10% of the programmed value, whichever is greater.
The sample volume repeatability must be 5 ml or ±5%, whichever is greater. The sampler must use a non-wetted, non-conductive detector to sense the presence of
water. The sensor must not be dependent on, or affected by the chemical or physical property of the water or its contents. The sensor must not require routine maintenance or cleaning.
The sampler must also use the following sampling components:
Flow-weighted composite sampling to obtain the EMC of the monitored constituents. The typical system will use a 16 L collection bottle. Data collectors who elect to obtain
flow-weighted samples in multiple bottles to gain information on within-event (temporal) concentration dynamics are still required to provide an EMC for each constituent in each event.
Individual sample size (200 ml) Sampling interval/pacing will be 1.27 millimeters (mm) volumetric depth
o Volumetric depth represents mean runoff depth over the entire watershed. Referring to discharge intervals in volumetric depth as opposed to volume such as m3, normalizes discharge, enabling consistent transfer of methods and results to watersheds of different sizes.
o A 1.27 mm sampling interval and a 200 ml sample size will allow for the collection of 101 mm (4 in) of runoff in a 16 L bottle.
Minimum flow rate (event sampling) threshold o Substantial uncertainty error is introduced as minimum flow thresholds are
increased Harmel et al. (2002). Therefore, minimum flow thresholds should be set such that even small events with small increases in flow depth are sampled (in other words if water is flowing at sufficient depth to submerge the sampler intake, then sample). This will ensure sampling occurs over as much of the event duration as possible.
o To prevent pump malfunction, ensure the sampler intake is completely submerged at the event-sampling threshold.
o The sampler intake should be located in the well-mixed portion of flow. o Do not use the programming option of collecting a sample each time flow rises
and/or falls past the threshold because flow fluctuation near the threshold can result in inappropriate and unnecessary samples.
NRCS – October 1, 2012 Page 5
Additional Onsite Equipment
Reliable power sourceo Electricity on site is idealo 80-120 watt solar panel to charge a deep cycle battery is an acceptable alternative
Lockable equipment shelter to protect data collection systemo Fabricated structures or commercial tool boxes are acceptable. o Attach shelter to a platform deck with lag screws or bolts and securely anchor the
deck to the ground.o Locate shelter above the highest expected flow elevation and ensure accessibility
during high flows (Haan et al., 1994; USEPA, 1997).o List livestock, rodent, and insect control measures in the QAPP.
Duplicate equipment (optional). It is important to have duplicate equipment in inventory in order to service the monitoring system during routine site visits. Proper maintenance limits data loss and equipment malfunctions (Harmel et al., 2003), which if allowed, increase the uncertainty in measured data. Suggested equipment includes but is not limited to:
o 1 automated samplero 1 depth sensoro 2 batterieso 2 extra sets of sample collection bottles (recommended for periods with frequent
events). Tools and supplies
o Water jug large enough to fill the stilling basin for depth calibrationo Ruler or tape to measure flow depth if structure does not have a staff gaugeo Maintenance check list and log
Required Reporting
All items submitted to the NRCS field office should be in electronic format following the naming conventions outlined in Appendix A. Required documentation includes:
Installation report (Appendix B)
NRCS – October 1, 2012 Page 6
References
Brakensiek, D.L., H.B. Osborn, and W.J. Rawls, coordinators. 1979. Field Manual for Research in Agricultural Hydrology. Agriculture Handbook No. 224. Washington, D.C.: USDA.
Buchanan, T.J., and W.P. Somers. 1982. Chapter A7: Stage measurement at gaging stations. Techniques of Water-Resources Investigations of the U.S. Geological Survey, Book 3. Washington, D.C.: USGS.
Haan, C.T., B.J. Barfield, and J.C. Hayes. 1994. Design Hydrology and Sedimentology for Small Catchments. New York, N.Y.: Academic Press.
Harmel, R.D., D.R. Smith, K.W. King, and R.M. Slade. 2009. Estimating storm discharge and water quality data uncertainty: A software tool for monitoring and modeling applications. Environ. Modeling Software 24:832-842.
Harmel, R.D., R.J. Cooper, R.M. Slade, R.L. Haney, and J.G. Arnold. 2006a. Cumulative uncertainty in measured streamflow and water quality data for small watersheds. Trans. ASABE 49(3): 689-701.
Harmel R.D., K.W. King, and R.M. Slade. 2003. Automated storm water sampling on small watersheds. Applied Eng. Agric. 19(6): 667-674.
Harmel, R.D., K.W. King, J.E. Wolfe, and H.A. Torbert. 2002. Minimum flow considerations for automated storm sampling on small watersheds. Texas J. Sci. 54(2): 177-188.
NEMI. 2012. National Environmental Methods Index: Methods and Data Comparability Board chartered under the National Water Quality Monitoring Council. Available at: http://www.nemi.gov
USDA-NRCS. 1989, revised 1990 and 1991. National Engineering Handbook, Part 650, Engineering Field Handbook, Chapter 2 Estimating Runoff and Peak Discharges. Washington, D.C. (NEH 650.02)
USDA-NRCS. 2003. Part 600: Introduction. National Water Quality Handbook. Washington, D.C. USDA-NRCS.
USEPA. 1997. Monitoring guidance for determining the effectiveness of nonpoint-source controls. EPA 841-B-96-004. Washington, D.C.: USEPA.
NRCS – October 1, 2012 Page 7
GLOSSARY
Adaptive Management
Process of adjusting management operations to achieve a future desired condition based on input gathered through monitoring or evaluation techniques.
Area Velocity MeterA device that measures both water level and flow in a channel or pipe by emitting signals and recording the time for those signals to reflect and return back to the sensor.
Automated SamplerA device used to automatically sample runoff passing through a water control structure and temporarily storing in a container until a field technician can process the sample.
BubblerA type of water level device that measures depth by estimating the pressure required to emit a “bubble”. As the water level increases, the pressure required increases.
Composite Sampling A sampling scheme where multiple samples are combine in order to comprise one representative sample.
Constituent A water quality parameter such as total nitrogen, nitrate, or soluble reactive phosphorus that is being evaluated through monitoring.
Cork Gauge
A non-recording gauge based on the “bathtub ring principle”. It consists of a PVC pipe containing a wooden dowel and granulated cork. As the water rises, so does the powdered cork. When the water goes down, the cork granules remain stuck to the wooden dowel at the level of highest water.
Data LoggerAn instrument capable of storing data generated by a measuring device and transferring the information electronically on demand to a computer.
DischargeA measurement of the volume rate of water as it flows through a given cross-sectional area (e.g. cubic feet per second). Another term used to describe stream flow.
Edge-Of-Field Monitoring
Field scale watershed monitoring involving the capture and analysis of surface and subsurface drainage. Runoff sampling occurs in the field or at the edge of a field prior to entering a defined drainage channel such as a ditch or a stream.
Event Mean A common method for reporting constituent concentrations defined
NRCS – October 1, 2012 Page 8
Concentration (EMC) as the arithmetic mean of individual sample concentrations collected on equal discharge (flow-weighted) intervals.
H-flumeA water control structure of specific design geometry capable of allowing runoff to pass through it for the purpose of measuring discharge.
Load Mass of constituent transported. The EMC multiplied by the total flow volume represents the constituent load.
Model Validation The process of verifying, through data collection and analysis, that a mathematical representation of situation approximates reality.
Nitrate Nitrogen (NO3-N)
One of many forms of nitrogen that exists in the environments. Nitrate (NO3
_) are carry a negative charge and are soluble in water. This form can be beneficially used by plants or be harmful to living organisms when concentrated in water.
Nitrite Nitrogen (NO2-N)
A relatively unstable form of nitrogen that quickly converts to nitrate in the presence of oxygen.
Peristaltic Pump A type of pump used in automatic water samplers that pumps water by using a roller on a tube to compress and pump fluid.
Pollutant A contaminant present at a concentration sufficient to cause harm to living organisms.
Pressure Transducer A type of water level device that converts pressure exerted on a mechanical membrane into a electronic signal.
Quality Assurance Project Protocol
(QAPP)
A document that describes the activities of a project involved with the acquisition of environmental information, whether generated from direct measurement activities or collected from other sources.
Recurrence Interval
The historical chance that a particular storm event can produce precipitation or runoff of a given magnitude in a given year. Recurrence interval may be expressed in percent, or in years. For example, a 5 year recurrence interval is equivalent to a 20% chance.
Soluble Reactive Phosphorus (Ortho-P)
A form of phosphorus (PO43-) that is readily soluble in water.
Staff Gauge A type of ruler used to quickly measure surface level in reservoirs, rivers, streams, irrigation channels, weirs and flumes. When used with granulated cork in a tube, this gauge has the capacity to record
NRCS – October 1, 2012 Page 9
the peak stage that occurred during a storm event. (see cork gauge)
Stage The height of the water surface at a location along a stream, river, or as runoff exits the edge of a field through a water control structure.
Standard Rain Gauge
A non-recording gauge is a Standard Rain Gauge. Typically, it is a metal cylinder with a funnel on top and a plastic measuring tube in the middle. The measuring tube can handle up to 2.00 inches of rain before overflowing into the larger outer cylinder. During the winter, the observer removes the funnel and inner tube and allows the snow to collect in the outer tube. The observer then melts the snow and measures it, getting an accurate water equivalent to report.
Stilling WellA type of structure used to measure stage that allows for water levels to equilibrate in an environment with minimal turbulence to improve the accuracy of the stage measurement.
Suspended Sediment Concentration
A laboratory procedure made by measuring the dry weight of all the sediment from a known volume of a water-sediment mixture.
Tail WaterWater located immediately below a water control or measurement structure.
Tipping Bucket
A type of automated rain gauge that has two measuring cups with a fulcrum located in between each cup. The cup automatically empties each time it fills with a calibrated (small) volume of water. During the emptying process, the alternate measuring cup is in use. The number of times that both cups are emptied is converted to an electronically measured precipitation intensity and volume.
Total Kjeldahl Nitrogen (TKN)
A laboratory measurement of the amount of organic and ammonia nitrogen components in a sample.
Total Phosphorus (TP)
A laboratory measurement of all the forms of phosphorus (i.e. organic and inorganic).
Total Suspended Solids (TSS)
Material trapped by a filter paper, including silt, decaying plant and animal matter, or wastes.
V-notch Weir A water control structure that contains an opening of 45o, 60o, 90oor 120o oriented vertically in the shape of a “V” to allow water to pass through for the purpose of measuring discharge. Discharge is determined by measuring the stage of water upstream (2 times the height of the weir notch) of the weir and converting to a flow rate using a calibration curve.
NRCS – October 1, 2012 Page 10
APPENDIX A – NAMING CONVENTIONS AND DIRECTORY STRUCTURE
Page A-1
SITE NAMING CONVENTION
STCOFIPSYR01- this is the Unique Monitoring Station ID (UMSID) ST – two digit state abbreviation COFIPS – three digit FIPS code YR – two digit year – This is the Fiscal Year the contract is approved. 01, 02, 03 etc. – number assigned by the state water quality specialist at onset of a
contract application
DIRECTORY STRUCTURE1 AND FILE NAMING CONVENTION
Field Office ServerS:\Service_Center\NRCS\Monitoring\Submitted\{Payment Year}\{UMSID}
\Installation Installation Report.xls --- install_{UMSID}.xls
Qapp.docx----QAPP_{UMSID}.docxMonitoring plan.docx-----mon_plan_{UMSID}Water Quality Operations Data.xls------WQOD_install_{UMSID}.xls
\PHOTOS0
YY_MM_DD_##_{UMSID}.jpg
\ Semi_Annual_Data Water and Flow Data.xls--------waterflow_semi_{UMSID}.xls
Checklists or Logbook.xls or .pdf------Maintenance_semi_{UMSID}.xls or .pdfWater Quality Operations Data.xls----- WQOD_semi_{UMSID}.xlsWater Quality Data.xls-------WQData_semi_{UMSID}.xlsLab Analysis Reports.pdf or .xls-------Lab_semi_{UMSID}.pdf or .xls
\PHOTOSYY_MM_DD_##_{UMSID}.jpg
\ Annual_Submittal Water and Flow Data.xls------ Waterflow_annual_{UMSID}.xls
Checklists or Logbook.xls or .pdf ---Maintenance_annual_{UMSID}.xls or .pdfWater Quality Operations Data.xls------- WQOD_annual_{UMSID}.xlsWater Quality Data.xls---- WQData_annual_{UMSID}.xlsLab Analysis Reports.pdf or .xls-------Lab_annual_{UMSID}.pdf or .xlsData Summary.docx
\PHOTOSYY_MM_DD_##_{UMSID}.jpg
\ComprehensiveReport.docx------comp_report_{UMSID}.docx
1 Monitoring data provided to NRCS contains Personally Identifiable Information (PII). At a minimum, these data must be transmitted in a zipped and password protected format. 0 Maximum allowable photo resolution is 1.9 megapixels (1600X1200). All photographs must be date stamped. Photographs will not receive automatic backup from ITS (Information Technology Services).
Page A-2
\GISDrainage Area polygon shapefile --------- da_{UMSID}Location point shapefile (UTM NAD83 ZoneXX) ------ loc_{UMSID}
State Office and National Office
The State Office and National Office directory structure will be exactly the same as the field office structure; however, there will be both a “submitted” and a “certified” folder. When the state specialist pulls data from the field office server, the data will be placed in the “submitted” directory until it can be certified and approved for payment. Upon certification, the state specialist will move all files to the “certified” folder. The state specialist will notify the National Water Quality Specialist that data are available for pick up.
S:\Service_Center\NRCS\Monitoring\Submitted\{Payment Year}\{UMSID}\
S:\Service_Center\NRCS\Monitoring\Certified\{Payment Year}\{UMSID}\
The state specialist will need to submit a permissions request for read and write access to these folders on the service center servers. The national specialist will need to have read write access to the pertinent state servers and folders.
Captioning Digital Photos Using “File Properties”
1. Start My Computer2. Select the Drive your photos are in (i.e., C, H, etc.)3. Locate the directory your photos are in4. Arrow over the file name and right click5. Select Properties6. In the General Tab, you will see
information like file name, size,and date created.
7. Select the Summary Tab (Simple view)
Page A-3
If this is not the window you see, change to simpleview.
8. This is the area to complete the necessary information.
Title – NRCS Monitoring XX (where XX is the two digit state abbreviation) Subject – Water Quality Author – Your name Keywords – monitoring, water quality, Unique Monitoring Station ID (UMSID) Comments – Details about the picture, date of picture if it is not date stamped
**Note: Be careful not to use any personally identifiable information when captioning the photo. For example do not use farm or tract number and do use participants’ name.***
Page A-4
APPENDIX B – INSTALLATION REPORT FORM
Page B-1
US DEPARTMENT OF AGRICULTURE NATURAL RESOURCES CONSERVATION SERVICE
Monitoring & Evaluation - Monitoring System Installation ReportInstructions: Complete this form for each monitoring system present following a field site to verify installation.
Site InformationLandowner: Address: Contract Number:
County: Farm #: Tract #
Monitoring System ID: GPS Coordinates: Receiving Drainage Acres:
Monitoring System
Item Description: Brand/Model NumberSerial
Number File Name of Attached Photo
I certify that to the best of my knowledge the monitoring system components itemized above are installed, operational, and conform with the latest technical guidance.
Data Install/Collector Representative Date of Installation
USDA-NRCS Field Office Representative Date of Field Visit(s):
Page B-2