Embed Size (px)
Citation preview
lable at ScienceDirect
Soil Biology & Biochemistry 88 (2015) 282e293
Contents lists avai
Soil Biology & Biochemistry
journal homepage: www.elsevier .com/locate/soi lbio
Sheep excreta cause no positive priming of peat-derived CO2 and N2Oemissions
K. Leiber-Sauheitl a, *, R. Fuß a, St. Burkart a, F. Buegger b, S. D€anicke c, U. Meyer c,K.J. Petzke d, A. Freibauer a
a Thuenen Institute of Climate-Smart Agriculture, Bundesallee 50, 38116 Braunschweig, Germanyb Helmholtz Zentrum Muenchen, Institute of Biochemical Plant Pathology, Ingolstaedter Landstr. 1, 85764 Neuherberg, Germanyc Friedrich Loeffler Institute, Institute of Animal Nutrition, Bundesallee 50, 38116 Braunschweig, Germanyd German Institute of Human Nutrition, Potsdam-Rehbruecke, Arthur-Scheunert-Allee 155, 14558 Nuthetal, Germany
a r t i c l e i n f o
Article history:Received 19 February 2015Received in revised form28 May 2015Accepted 1 June 2015Available online 16 June 2015
Keywords:PeatSheepMicrocosm experimentStable isotope tracerPriming effectsGHG emissions
* Corresponding author. Tel: þ49 (0) 531 596 2669E-mail address: [email protected] (K. Le
http://dx.doi.org/10.1016/j.soilbio.2015.06.0010038-0717/© 2015 The Authors. Published by Elsevier
a b s t r a c t
Large areas of peatlands in Germany and the Netherlands are affected by drainage and high nitrogendeposition. Sheep grazing is a common extensive management activity on drained peatlands, inparticular on nature protection areas. However, input of easily mineralisable material such as sheepexcrements could enhance degradation of soil organic carbon (Corg), thereby increasing the effect of theseecosystems on national GHG budgets. Thus, a microcosm experiment on the influence of sheep excretaon GHG emissions from a histic Gleysol with strongly degraded peat was set up. The 15N and 13C stableisotope tracer technique was used to partition sources of CO2 and N2O. Labeled sheep faeces and urinewere obtained by feeding enriched material. Undisturbed soil columns were treated with surfaceapplication of urine, faeces or mixtures of both in different label combinations to distinguish betweendirect effects and possible priming effects. Incubation was done under stable temperature and precipi-tation conditions. Fluxes as well as 15N and 13C enrichment of N2O and CO2, respectively, were measuredfor three weeks. Addition of sheep excreta increased emission of total CO2 in proportion to the addedcarbon amounts. There was no CO2 priming in the peat. No effect on CH4 and N2O was observed underthe aerobic experimental conditions. The N2OeN source shifted from peat to excreta, which indicatesnegative priming, but priming was not significant. The results indicate that sheep excreta do notsignificantly increase GHG emissions from degraded peat soils. Considering the degraded peatlandpreserving benefits, sheep grazing on peatlands affected by drainage and high nitrogen depositionshould be further promoted.© 2015 The Authors. Published by Elsevier Ltd. This is an open access article under the CC BY-NC-ND
license (http://creativecommons.org/licenses/by-nc-nd/4.0/).
1. Introduction
Sheep grazing on peatlands is a common practice (Germer,2006), which aims at maintaining grass and heath and preventinggrowth of birch and shrubbery, in particular when soils are drained.Sheep grazing preserves an open landscape, which offers habitatsand ecological niches for rare species. Moreover, it directly affectsthe greenhouse gas (GHG) balance of a peatland by plant biomassexport, CH4 emissions from enteric fermentation and GHG releasedfrom faeces or urine patches. Excreta are hotspots of biologicalactivity. In a Mongolian grassland GHG emissions (CO2, N2O, CH4)
.iber-Sauheitl).
Ltd. This is an open access article u
were 20% higher from urine and fresh faeces patches than fromunaffected soil (Ma et al., 2006).
N2O emissions on peat soils from artificial urine patches emittedmaximal 50 mg N2OeN m�2 d�1 mainly via nitrification in a studyby Koops et al. (1997). In the Netherlands 1.5e9.9% of the nitrogenin faeces and urine N input was emitted as N2O from a peatgrassland (Velthof et al., 1996). It is unknownwhether the reportedN2O fluxes originated entirely from the excreta or whether addi-tional nitrogen was mobilized from the peat soil by priming.Priming occurs if easily degradable substances added to soils acti-vate or hamper microbial activity. Positive priming increases car-bon and/or nitrogen mineralization from soil organic mattercompared to a control treatment. Negative priming reduces emis-sions and soil organic matter decomposition (Kuzyakov et al.,2000).
nder the CC BY-NC-ND license (http://creativecommons.org/licenses/by-nc-nd/4.0/).
K. Leiber-Sauheitl et al. / Soil Biology & Biochemistry 88 (2015) 282e293 283
Drainage induces peat decomposition which results in high CO2emissions (Smith and Conen, 2004). Decomposition of pure peat isslow, but in previous incubation studies (Reiche et al., 2010; Hahn-Schoefl et al., 2011) CO2 emissions drastically increasedwhen labile,energy-rich substrates were present. Again it is unknown whetherthe reported fluxes originated entirely from the labile plant-derivedmaterial mixed with the peat in the laboratory (Reiche et al., 2010;Hahn-Schoefl et al., 2011) or whether additional carbon wasmobilized from the peat soil by priming. Positive or no primingeffects have been observed in peat soil after the addition of sub-strates typical for plant debris (e.g. glucose, oxalic acid, etc.; Hamerand Marschner, 2002).
Stable isotopes (13C and/or 15N) are commonly used to studypriming effects in soil. Bol et al. (2000) traced cattle dung-derivedcarbon in a temperate grassland using 13C natural abundancemeasurements. After 150 days only around 10% of cattle dung Cremained in the upper 5 cm of soil. Angers et al. (2007) observedsignificant CO2 emissions from pig slurry but no priming effect inmineral soil. In general, very few studies have investigated primingeffects or the fate of excreta C or N and studies have exclusivelybeen performed inmineral soils (Monaghan and Barraclough,1993;Bol et al., 2000). So far, priming effects of excreta have not beenstudied in organic soils.
Sheep excreta contain active microbes, labile substances and aC/N ratio narrower than the peat. Consequently, they have a strongpotential for positive priming in peat soil. We hypothesize that
1. Sheep excreta increase emissions of CO2, CH4 and N2O from peatsoil.
2. Sheep excreta induce a positive carbon and nitrogen priming inpeat soil and trigger CO2 and N2O release from the peat.
Therefore, we studied the influence of sheep excreta on GHGemissions from a degraded peat soil using stable isotope tracers topartition sources and determine possible priming effects.
2. Material & methods
2.1. Experimental design
A microcosm study under constant temperature and moistureconditions was performed with pure peat and sheep excretaamendments to test the hypotheses. Sheep excreta were applied onthe surface of undisturbed peat columns from a nutrient-poor peatgrassland. One excretion event by one sheep was simulated bysurface application of faeces, urine, or faeces plus urine. Primingeffects and source attribution of CO2 and N2O to peat soil versusexcreta were studied by tracing 13C and 15N signals in isotopicallydouble labeled (13C and 15N) excreta. GHG emissions weremeasured for 21 days.
Seven different treatments were used in the microcosm exper-iment (Table 1). For all treatments C4 labeled excreta were appliedwith or without 15N enrichment. Pure peat columns (¼pure peat)
Table 1Overview on experimental treatments.
Treatmentsa Denomination in the text
Control 1: peat Pure peatControl 2: 14N faeces þ sand 14N faeces plus sandPeat þ 15N faeces 15N faecesPeat þ 15N urine 15N urinePeat þ 15N faeces þ 15N urine 15N faeces plus 15N urinePeat þ 14N faeces þ 15N urine 14N faeces plus 15N urinePeat þ 14N faeces þ 14N urine 14N faeces plus 14N urine
a For C: C3 signal of peat, C4 signal of faeces and urine.
were used as control columns for the background levels of CO2, N2Oand CH4 fluxes. A second control containing C4 faeces with naturalabundance 15N signature on annealed sand (¼14N faeces plus sand)was used for plausibility checks. Peat was amended with faeces orurine or both faeces and urine as combined signal using 15N faecesor 15N urine (¼15N faeces, 15N urine, 15N faeces plus 15N urine,respectively). To distinguish between faeces and urine unlabeledfaeces were combined with labeled urine (¼14N faeces plus 15Nurine). Peat amended with unlabeled 14N faeces and 14N urine(¼14N faeces plus 14N urine) served as a control treatment to checkfor eventual isotopic effects on the priming effect.
2.2. Sheep excreta labeling
For the production of double labeled excreta a male sheep washoused in a metabolism cage and fed with highly enriched 15Ntracer substance and corn silage. Corn is a C4 plant (corn silaged13C �12.5 ± 0.12‰), which results in a natural abundance 13Clabel of the corn silage compared to the peat material with itsd13C signal of C3 vegetation (peat d13C �28.1 ± 0.15‰). The dailydiet contained 2.8 kg corn silage (54.7% dry matter content), 18 gNH4Cl and 10 g urea where NH4Cl was enriched to 95% 15N. Dietenrichment was about 15 atom% 15N. After two weeks of adap-tation to the fodder combination, labeled excreta were collectedfor 10 days. Faeces and urine were collected separately two tothree times a day, bulked and frozen at �19 �C until use. At thestart of the labeling period, N-unlabeled faeces and urine werecollected from the same sheep fed with C4 corn silage and un-labeled NH4Cl.
For C and N measurement, faeces were dried at 105 �C andmeasured on an elemental analyzer LECO TruMac CN. C and N ofurine were measured in the liquid phase on an elemental analyzerLECO TruSpec CN to avoid NH3 volatilization. 15N and 13C abun-dance were measured in dried faeces and acidified urine on aThermo Fisher Scientific Delta plus with a coupled elementalanalyzer (CE Instruments FLASH EA 1112) and a Conflo II interface.
The C/N ratio of faeces was 22 in accordance with previouslyreported values (Floate and Torrance, 1970). More of the excreted Nwas found in faeces than in urine, which reflects the N-adapteddiet. Sheep faeces and urine were enriched by up to 13.2 atom% 15Nand 9.6 atom% 15N, respectively. d13C of faeces and urine showed aclear C4 signal of �13.1 ± 0.1‰ (1.09 atom% 13C) and �13.3 ± 0.2‰(1.09 atom% 13C), respectively. Further parameters are shown inTable 2. Enrichment of 15N was sufficient in both excreta to enablethe detection of priming effects during incubation.
2.3. Microcosm experiment
For the microcosm experiment intact soil cores were extractedfrom a histic Gleysol in Lower Saxony, Germany (for detailed sitedescription see Leiber-Sauheitl et al., 2014). The upper 5 cm of thesoil surface including vegetation and roots were removed to avoidexperimental artifacts due to decaying plant material. Subse-quently, 20 cm deep soil cores were extracted by hammering astainless steel sampling device enclosing a plexiglass cylinder(30 cm high, 15 cm diameter) into the soil.
In the laboratory, these undisturbed peat columns wereinstalled in a microcosm system (Hantschel et al., 1993). Theheadspace was flushed throughout the experiment with10 mL min�1 of synthetic air (20% O2, 80% N2, 400 ppb N2O). Formeasurement of flow rates, a flowmeter was switched automati-cally from one column to the next at regular intervals so that eachcolumn was measured every 12 h. N2O was included in the syn-thetic air to allow for measuring possible N2O uptake into the peatcolumn.
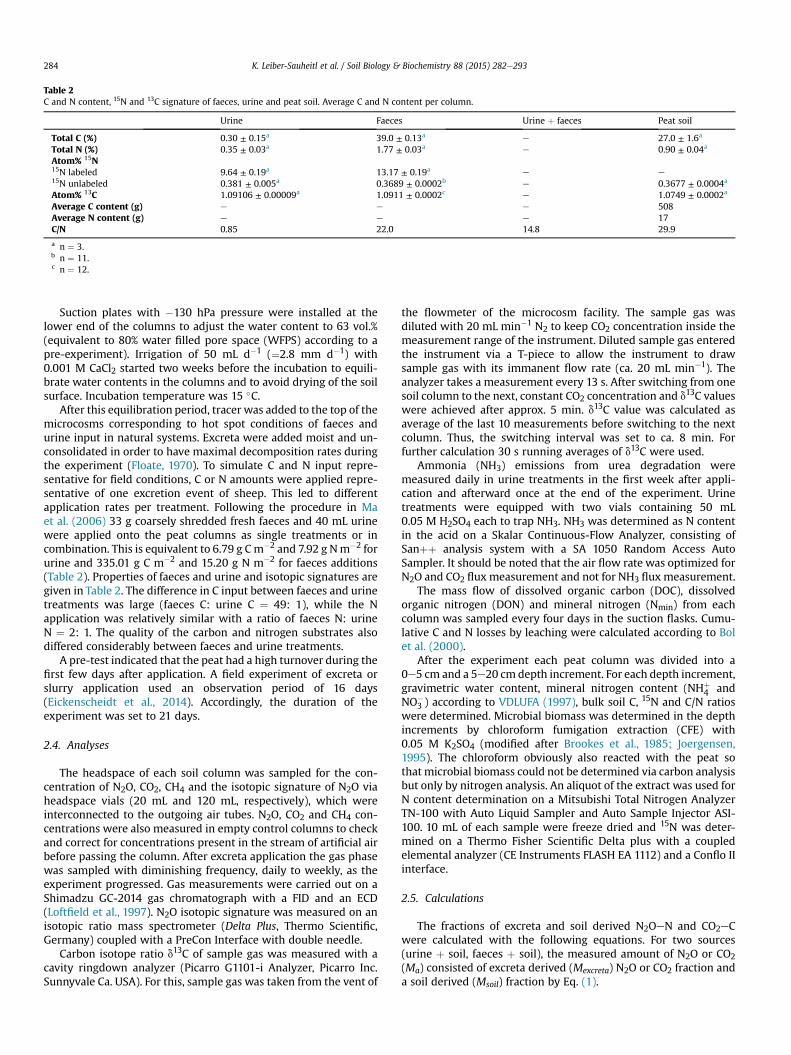
Table 2C and N content, 15N and 13C signature of faeces, urine and peat soil. Average C and N content per column.
Urine Faeces Urine þ faeces Peat soil
Total C (%) 0.30 ± 0.15a 39.0 ± 0.13a e 27.0 ± 1.6a
Total N (%) 0.35 ± 0.03a 1.77 ± 0.03a e 0.90 ± 0.04a
Atom% 15N15N labeled 9.64 ± 0.19a 13.17 ± 0.19a e e15N unlabeled 0.381 ± 0.005a 0.3689 ± 0.0002b e 0.3677 ± 0.0004a
Atom% 13C 1.09106 ± 0.00009a 1.0911 ± 0.0002c e 1.0749 ± 0.0002a
Average C content (g) e e e 508Average N content (g) e e e 17C/N 0.85 22.0 14.8 29.9
a n ¼ 3.b n ¼ 11.c n ¼ 12.
K. Leiber-Sauheitl et al. / Soil Biology & Biochemistry 88 (2015) 282e293284
Suction plates with �130 hPa pressure were installed at thelower end of the columns to adjust the water content to 63 vol.%(equivalent to 80% water filled pore space (WFPS) according to apre-experiment). Irrigation of 50 mL d�1 (¼2.8 mm d�1) with0.001 M CaCl2 started two weeks before the incubation to equili-brate water contents in the columns and to avoid drying of the soilsurface. Incubation temperature was 15 �C.
After this equilibration period, tracer was added to the top of themicrocosms corresponding to hot spot conditions of faeces andurine input in natural systems. Excreta were added moist and un-consolidated in order to have maximal decomposition rates duringthe experiment (Floate, 1970). To simulate C and N input repre-sentative for field conditions, C or N amounts were applied repre-sentative of one excretion event of sheep. This led to differentapplication rates per treatment. Following the procedure in Maet al. (2006) 33 g coarsely shredded fresh faeces and 40 mL urinewere applied onto the peat columns as single treatments or incombination. This is equivalent to 6.79 g Cm�2 and 7.92 g Nm�2 forurine and 335.01 g C m�2 and 15.20 g N m�2 for faeces additions(Table 2). Properties of faeces and urine and isotopic signatures aregiven in Table 2. The difference in C input between faeces and urinetreatments was large (faeces C: urine C ¼ 49: 1), while the Napplication was relatively similar with a ratio of faeces N: urineN ¼ 2: 1. The quality of the carbon and nitrogen substrates alsodiffered considerably between faeces and urine treatments.
A pre-test indicated that the peat had a high turnover during thefirst few days after application. A field experiment of excreta orslurry application used an observation period of 16 days(Eickenscheidt et al., 2014). Accordingly, the duration of theexperiment was set to 21 days.
2.4. Analyses
The headspace of each soil column was sampled for the con-centration of N2O, CO2, CH4 and the isotopic signature of N2O viaheadspace vials (20 mL and 120 mL, respectively), which wereinterconnected to the outgoing air tubes. N2O, CO2 and CH4 con-centrations were also measured in empty control columns to checkand correct for concentrations present in the stream of artificial airbefore passing the column. After excreta application the gas phasewas sampled with diminishing frequency, daily to weekly, as theexperiment progressed. Gas measurements were carried out on aShimadzu GC-2014 gas chromatograph with a FID and an ECD(Loftfield et al., 1997). N2O isotopic signature was measured on anisotopic ratio mass spectrometer (Delta Plus, Thermo Scientific,Germany) coupled with a PreCon Interface with double needle.
Carbon isotope ratio d13C of sample gas was measured with acavity ringdown analyzer (Picarro G1101-i Analyzer, Picarro Inc.Sunnyvale Ca. USA). For this, sample gas was taken from the vent of
the flowmeter of the microcosm facility. The sample gas wasdiluted with 20 mL min�1 N2 to keep CO2 concentration inside themeasurement range of the instrument. Diluted sample gas enteredthe instrument via a T-piece to allow the instrument to drawsample gas with its immanent flow rate (ca. 20 mL min�1). Theanalyzer takes a measurement every 13 s. After switching from onesoil column to the next, constant CO2 concentration and d13C valueswere achieved after approx. 5 min. d13C value was calculated asaverage of the last 10 measurements before switching to the nextcolumn. Thus, the switching interval was set to ca. 8 min. Forfurther calculation 30 s running averages of d13C were used.
Ammonia (NH3) emissions from urea degradation weremeasured daily in urine treatments in the first week after appli-cation and afterward once at the end of the experiment. Urinetreatments were equipped with two vials containing 50 mL0.05 M H2SO4 each to trap NH3. NH3 was determined as N contentin the acid on a Skalar Continuous-Flow Analyzer, consisting ofSanþþ analysis system with a SA 1050 Random Access AutoSampler. It should be noted that the air flow rate was optimized forN2O and CO2 fluxmeasurement and not for NH3 fluxmeasurement.
The mass flow of dissolved organic carbon (DOC), dissolvedorganic nitrogen (DON) and mineral nitrogen (Nmin) from eachcolumn was sampled every four days in the suction flasks. Cumu-lative C and N losses by leaching were calculated according to Bolet al. (2000).
After the experiment each peat column was divided into a0e5 cm and a 5e20 cm depth increment. For each depth increment,gravimetric water content, mineral nitrogen content (NHþ
4 andNO�
3 ) according to VDLUFA (1997), bulk soil C, 15N and C/N ratioswere determined. Microbial biomass was determined in the depthincrements by chloroform fumigation extraction (CFE) with0.05 M K2SO4 (modified after Brookes et al., 1985; Joergensen,1995). The chloroform obviously also reacted with the peat sothat microbial biomass could not be determined via carbon analysisbut only by nitrogen analysis. An aliquot of the extract was used forN content determination on a Mitsubishi Total Nitrogen AnalyzerTN-100 with Auto Liquid Sampler and Auto Sample Injector ASI-100. 10 mL of each sample were freeze dried and 15N was deter-mined on a Thermo Fisher Scientific Delta plus with a coupledelemental analyzer (CE Instruments FLASH EA 1112) and a Conflo IIinterface.
2.5. Calculations
The fractions of excreta and soil derived N2OeN and CO2eCwere calculated with the following equations. For two sources(urine þ soil, faeces þ soil), the measured amount of N2O or CO2(Ma) consisted of excreta derived (Mexcreta) N2O or CO2 fraction anda soil derived (Msoil) fraction by Eq. (1).
K. Leiber-Sauheitl et al. / Soil Biology & Biochemistry 88 (2015) 282e293 285
Ma ¼ Mexcreta þMsoil (1)
Ma e measured amount of N2O [mmol] or CO2 [mmol]
Mexcreta e excreta (faeces or urine) derived N2O [mmol] or CO2fraction [mmol]Msoil e soil derived N2O [mmol] or CO2 fraction [mmol]
Isotope signals of the background air (at%gas,back), of the columnheadspace (at%gas,lab) and of the added excreta (at%excreta) were usedto calculate the faeces and urine derived fractions of the N2O or CO2emissions (Amelung et al., 1999) by Eq. (2).
Mexcreta ¼ at%gas;lab � at%gas;back
at%excreta � at%gas;back�Ma (2)
at%gas,back e at% 15NeN2O or at% 13CeCO2 of background airat%gas,lab e at% 15NeN2O or at% 13CeCO2 of column headspaceat%excreta e at% 15N or at% 13CeCO2 of excreta (faeces or urine)
For three sources (urine þ faeces þ soil), the measured amountof N2O (Ma) consisted of a faeces derived (Mfaeces), a urine derived(Murine) and a soil derived (Msoil) N2O fraction. The urine derivedfraction (Murine') was calculated via the 14N faeces plus 15N urinetreatment evaluated with Eq. (3).
Msoil ¼Ma �
�at%gas;lab � at%faeces
��Murine0 �
�at%urine � at%faeces
�
at%gas;back � at%faeces(3)
Murine' e urine derived N2O fraction [mmol] determined via 14Nfaeces plus 15N urine treatment.at%faeces e at% 15N of added faeces tracerat%urine e at% 15N of added urine tracer
Priming effects for C and N were calculated as priming factors(PF; Bol et al., 2003) by Eq. (4).
PF ¼ Msoil;treat
Msoil;control(4)
Msoil, treat e soil derived CO2eC or N2OeN in treatment withexcreta applicationMsoil, control e soil derived CO2eC or N2OeN in pure peat control
2.6. Statistical analyses
All statistics were performed using R (Version 3.1.2; R CoreTeam, 2014). If not indicated differently, mean values are alwaysgiven with ±1 standard deviation. The significance limit was set to0.05. ANOVA tables were calculated for cumulated total, sourcespecific gas fluxes, extractable microbial N and Nmin. Subsequently,TukeyHSD was used to test for the treatment wise significance ofdifferences. Linear models were applied in order to determine thesignificance of the 13C enrichment of the different treatments incomparison to pure peat. Two sided t-tests of soil derived C or Nfluxes of the different treatments versus the control (¼pure peat)were performed in order to determine the significance of priming.
3. Results
3.1. Total CO2 and CH4 fluxes
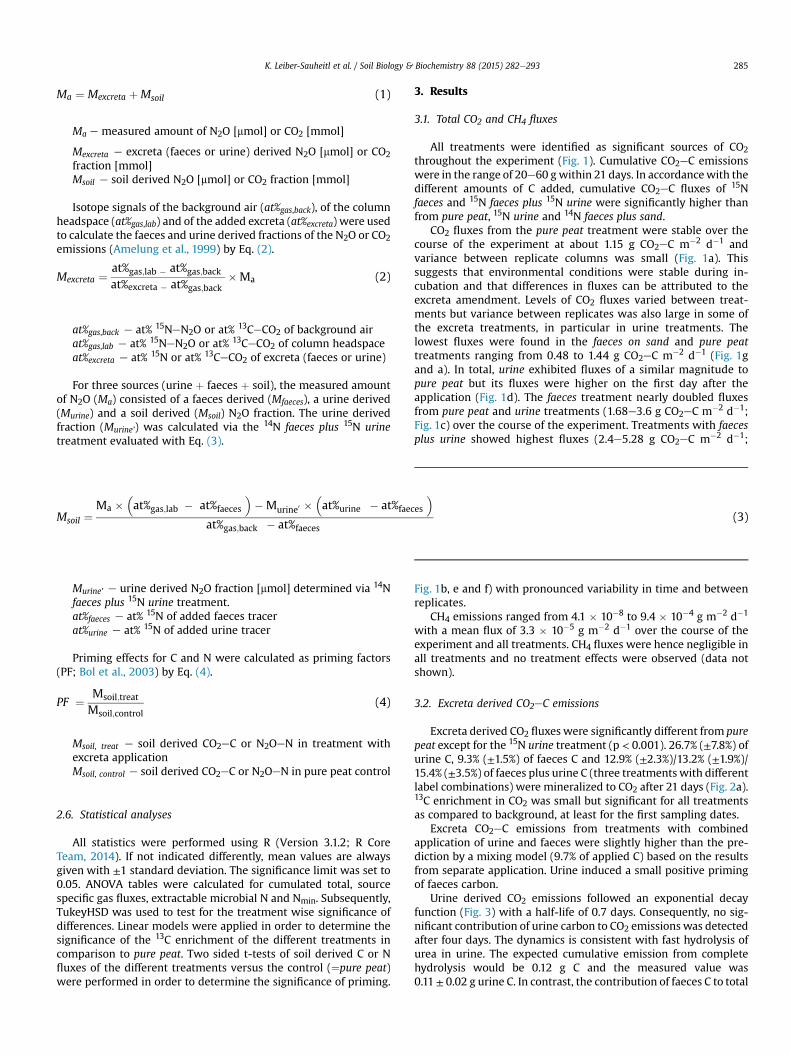
All treatments were identified as significant sources of CO2throughout the experiment (Fig. 1). Cumulative CO2eC emissionswere in the range of 20e60 gwithin 21 days. In accordancewith thedifferent amounts of C added, cumulative CO2eC fluxes of 15Nfaeces and 15N faeces plus 15N urine were significantly higher thanfrom pure peat, 15N urine and 14N faeces plus sand.
CO2 fluxes from the pure peat treatment were stable over thecourse of the experiment at about 1.15 g CO2eC m�2 d�1 andvariance between replicate columns was small (Fig. 1a). Thissuggests that environmental conditions were stable during in-cubation and that differences in fluxes can be attributed to theexcreta amendment. Levels of CO2 fluxes varied between treat-ments but variance between replicates was also large in some ofthe excreta treatments, in particular in urine treatments. Thelowest fluxes were found in the faeces on sand and pure peattreatments ranging from 0.48 to 1.44 g CO2eC m�2 d�1 (Fig. 1gand a). In total, urine exhibited fluxes of a similar magnitude topure peat but its fluxes were higher on the first day after theapplication (Fig. 1d). The faeces treatment nearly doubled fluxesfrom pure peat and urine treatments (1.68e3.6 g CO2eC m�2 d�1;Fig. 1c) over the course of the experiment. Treatments with faecesplus urine showed highest fluxes (2.4e5.28 g CO2eC m�2 d�1;
Fig. 1b, e and f) with pronounced variability in time and betweenreplicates.
CH4 emissions ranged from 4.1 � 10�8 to 9.4 � 10�4 g m�2 d�1
with a mean flux of 3.3 � 10�5 g m�2 d�1 over the course of theexperiment and all treatments. CH4 fluxes were hence negligible inall treatments and no treatment effects were observed (data notshown).
3.2. Excreta derived CO2eC emissions
Excreta derived CO2 fluxes were significantly different from purepeat except for the 15N urine treatment (p < 0.001). 26.7% (±7.8%) ofurine C, 9.3% (±1.5%) of faeces C and 12.9% (±2.3%)/13.2% (±1.9%)/15.4% (±3.5%) of faeces plus urine C (three treatments with differentlabel combinations) were mineralized to CO2 after 21 days (Fig. 2a).13C enrichment in CO2 was small but significant for all treatmentsas compared to background, at least for the first sampling dates.
Excreta CO2eC emissions from treatments with combinedapplication of urine and faeces were slightly higher than the pre-diction by a mixing model (9.7% of applied C) based on the resultsfrom separate application. Urine induced a small positive primingof faeces carbon.
Urine derived CO2 emissions followed an exponential decayfunction (Fig. 3) with a half-life of 0.7 days. Consequently, no sig-nificant contribution of urine carbon to CO2 emissions was detectedafter four days. The dynamics is consistent with fast hydrolysis ofurea in urine. The expected cumulative emission from completehydrolysis would be 0.12 g C and the measured value was0.11± 0.02 g urine C. In contrast, the contribution of faeces C to total
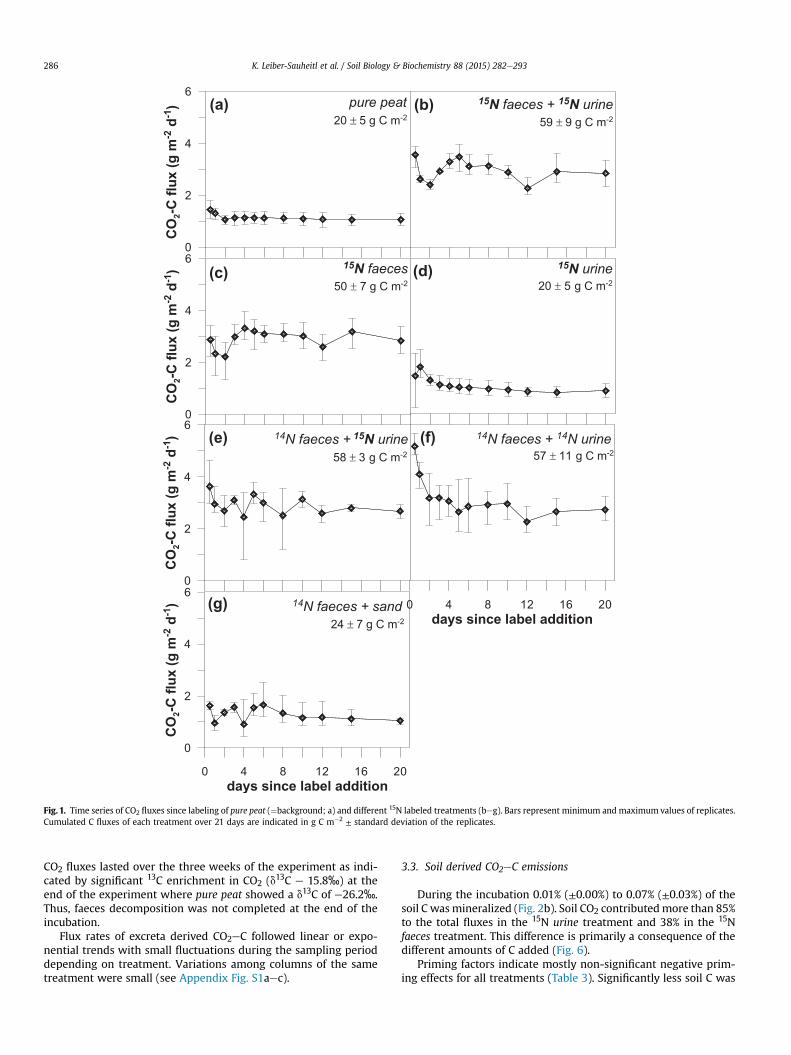
Fig. 1. Time series of CO2 fluxes since labeling of pure peat (¼background; a) and different 15N labeled treatments (beg). Bars represent minimum and maximum values of replicates.Cumulated C fluxes of each treatment over 21 days are indicated in g C m�2 ± standard deviation of the replicates.
K. Leiber-Sauheitl et al. / Soil Biology & Biochemistry 88 (2015) 282e293286
CO2 fluxes lasted over the three weeks of the experiment as indi-cated by significant 13C enrichment in CO2 (d13C e 15.8‰) at theend of the experiment where pure peat showed a d13C of e26.2‰.Thus, faeces decomposition was not completed at the end of theincubation.
Flux rates of excreta derived CO2eC followed linear or expo-nential trends with small fluctuations during the sampling perioddepending on treatment. Variations among columns of the sametreatment were small (see Appendix Fig. S1aec).
3.3. Soil derived CO2eC emissions
During the incubation 0.01% (±0.00%) to 0.07% (±0.03%) of thesoil C wasmineralized (Fig. 2b). Soil CO2 contributedmore than 85%to the total fluxes in the 15N urine treatment and 38% in the 15Nfaeces treatment. This difference is primarily a consequence of thedifferent amounts of C added (Fig. 6).
Priming factors indicate mostly non-significant negative prim-ing effects for all treatments (Table 3). Significantly less soil C was
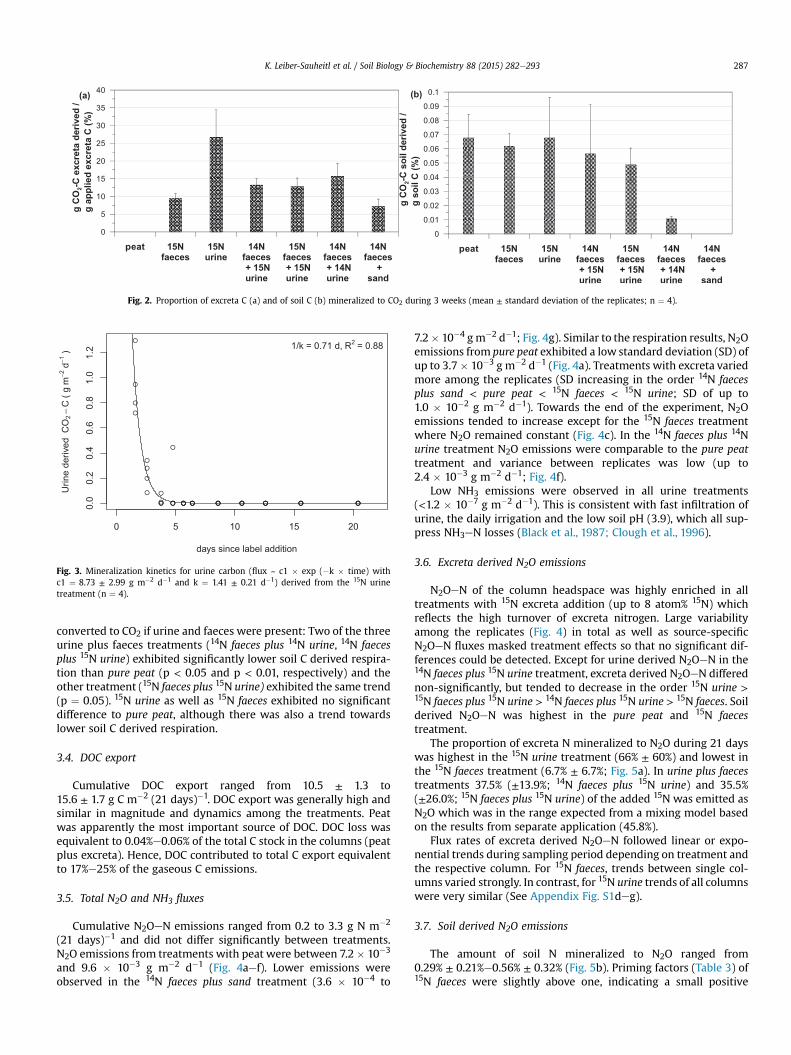
Fig. 2. Proportion of excreta C (a) and of soil C (b) mineralized to CO2 during 3 weeks (mean ± standard deviation of the replicates; n ¼ 4).
Fig. 3. Mineralization kinetics for urine carbon (flux ~ c1 � exp (�k � time) withc1 ¼ 8.73 ± 2.99 g m�2 d�1 and k ¼ 1.41 ± 0.21 d�1) derived from the 15N urinetreatment (n ¼ 4).
K. Leiber-Sauheitl et al. / Soil Biology & Biochemistry 88 (2015) 282e293 287
converted to CO2 if urine and faeces were present: Two of the threeurine plus faeces treatments (14N faeces plus 14N urine, 14N faecesplus 15N urine) exhibited significantly lower soil C derived respira-tion than pure peat (p < 0.05 and p < 0.01, respectively) and theother treatment (15N faeces plus 15N urine) exhibited the same trend(p ¼ 0.05). 15N urine as well as 15N faeces exhibited no significantdifference to pure peat, although there was also a trend towardslower soil C derived respiration.
3.4. DOC export
Cumulative DOC export ranged from 10.5 ± 1.3 to15.6 ± 1.7 g C m�2 (21 days)�1. DOC export was generally high andsimilar in magnitude and dynamics among the treatments. Peatwas apparently the most important source of DOC. DOC loss wasequivalent to 0.04%e0.06% of the total C stock in the columns (peatplus excreta). Hence, DOC contributed to total C export equivalentto 17%e25% of the gaseous C emissions.
3.5. Total N2O and NH3 fluxes
Cumulative N2OeN emissions ranged from 0.2 to 3.3 g N m�2
(21 days)�1 and did not differ significantly between treatments.N2O emissions from treatments with peat were between 7.2� 10�3
and 9.6 � 10�3 g m�2 d�1 (Fig. 4aef). Lower emissions wereobserved in the 14N faeces plus sand treatment (3.6 � 10�4 to
7.2� 10�4 g m�2 d�1; Fig. 4g). Similar to the respiration results, N2Oemissions from pure peat exhibited a low standard deviation (SD) ofup to 3.7� 10�3 g m�2 d�1 (Fig. 4a). Treatments with excreta variedmore among the replicates (SD increasing in the order 14N faecesplus sand < pure peat < 15N faeces < 15N urine; SD of up to1.0 � 10�2 g m�2 d�1). Towards the end of the experiment, N2Oemissions tended to increase except for the 15N faeces treatmentwhere N2O remained constant (Fig. 4c). In the 14N faeces plus 14Nurine treatment N2O emissions were comparable to the pure peattreatment and variance between replicates was low (up to2.4 � 10�3 g m�2 d�1; Fig. 4f).
Low NH3 emissions were observed in all urine treatments(<1.2 � 10�7 g m�2 d�1). This is consistent with fast infiltration ofurine, the daily irrigation and the low soil pH (3.9), which all sup-press NH3eN losses (Black et al., 1987; Clough et al., 1996).
3.6. Excreta derived N2O emissions
N2OeN of the column headspace was highly enriched in alltreatments with 15N excreta addition (up to 8 atom% 15N) whichreflects the high turnover of excreta nitrogen. Large variabilityamong the replicates (Fig. 4) in total as well as source-specificN2OeN fluxes masked treatment effects so that no significant dif-ferences could be detected. Except for urine derived N2OeN in the14N faeces plus 15N urine treatment, excreta derived N2OeN differednon-significantly, but tended to decrease in the order 15N urine >15N faeces plus 15N urine > 14N faeces plus 15N urine > 15N faeces. Soilderived N2OeN was highest in the pure peat and 15N faecestreatment.
The proportion of excreta N mineralized to N2O during 21 dayswas highest in the 15N urine treatment (66% ± 60%) and lowest inthe 15N faeces treatment (6.7% ± 6.7%; Fig. 5a). In urine plus faecestreatments 37.5% (±13.9%; 14N faeces plus 15N urine) and 35.5%(±26.0%; 15N faeces plus 15N urine) of the added 15N was emitted asN2O which was in the range expected from a mixing model basedon the results from separate application (45.8%).
Flux rates of excreta derived N2OeN followed linear or expo-nential trends during sampling period depending on treatment andthe respective column. For 15N faeces, trends between single col-umns varied strongly. In contrast, for 15N urine trends of all columnswere very similar (See Appendix Fig. S1deg).
3.7. Soil derived N2O emissions
The amount of soil N mineralized to N2O ranged from0.29% ± 0.21%e0.56% ± 0.32% (Fig. 5b). Priming factors (Table 3) of15N faeces were slightly above one, indicating a small positive
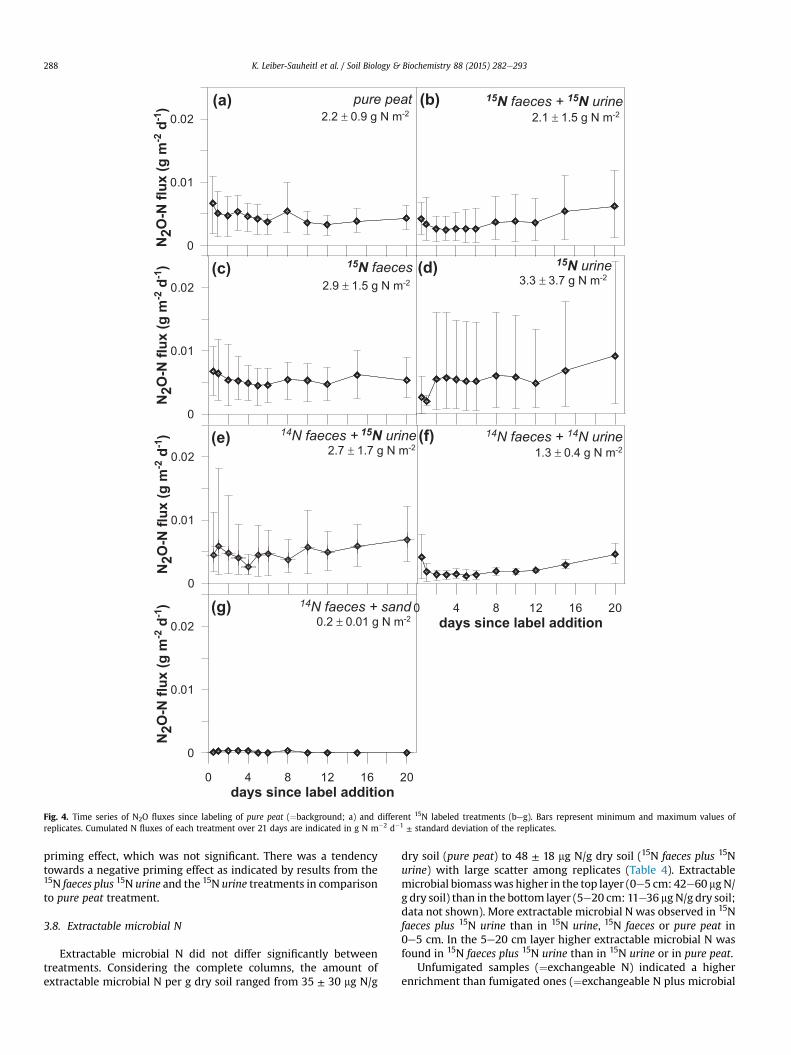
Fig. 4. Time series of N2O fluxes since labeling of pure peat (¼background; a) and different 15N labeled treatments (beg). Bars represent minimum and maximum values ofreplicates. Cumulated N fluxes of each treatment over 21 days are indicated in g N m�2 d�1 ± standard deviation of the replicates.
K. Leiber-Sauheitl et al. / Soil Biology & Biochemistry 88 (2015) 282e293288
priming effect, which was not significant. There was a tendencytowards a negative priming effect as indicated by results from the15N faeces plus 15N urine and the 15N urine treatments in comparisonto pure peat treatment.
3.8. Extractable microbial N
Extractable microbial N did not differ significantly betweentreatments. Considering the complete columns, the amount ofextractable microbial N per g dry soil ranged from 35 ± 30 mg N/g
dry soil (pure peat) to 48 ± 18 mg N/g dry soil (15N faeces plus 15Nurine) with large scatter among replicates (Table 4). Extractablemicrobial biomasswas higher in the top layer (0e5 cm: 42e60 mgN/g dry soil) than in the bottom layer (5e20 cm: 11e36 mg N/g dry soil;data not shown). More extractable microbial N was observed in 15Nfaeces plus 15N urine than in 15N urine, 15N faeces or pure peat in0e5 cm. In the 5e20 cm layer higher extractable microbial N wasfound in 15N faeces plus 15N urine than in 15N urine or in pure peat.
Unfumigated samples (¼exchangeable N) indicated a higherenrichment than fumigated ones (¼exchangeable N plus microbial
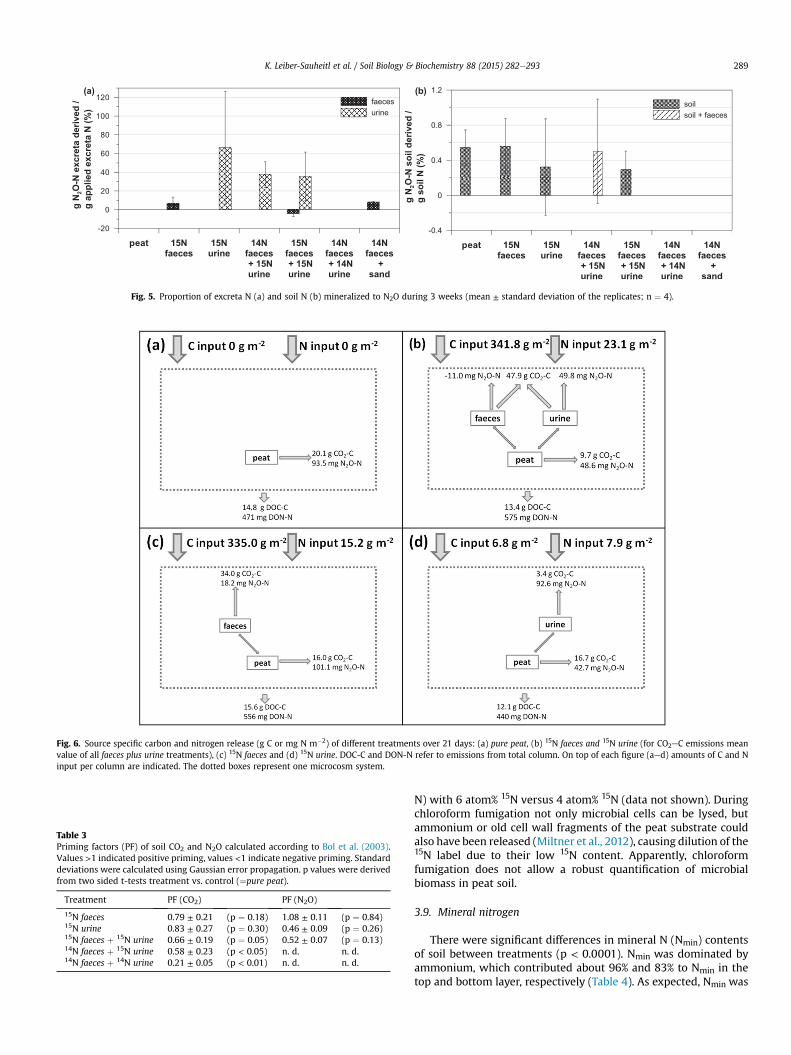
Fig. 5. Proportion of excreta N (a) and soil N (b) mineralized to N2O during 3 weeks (mean ± standard deviation of the replicates; n ¼ 4).
Fig. 6. Source specific carbon and nitrogen release (g C or mg N m�2) of different treatments over 21 days: (a) pure peat, (b) 15N faeces and 15N urine (for CO2eC emissions meanvalue of all faeces plus urine treatments), (c) 15N faeces and (d) 15N urine. DOC-C and DON-N refer to emissions from total column. On top of each figure (aed) amounts of C and Ninput per column are indicated. The dotted boxes represent one microcosm system.
Table 3Priming factors (PF) of soil CO2 and N2O calculated according to Bol et al. (2003).Values >1 indicated positive priming, values <1 indicate negative priming. Standarddeviations were calculated using Gaussian error propagation. p values were derivedfrom two sided t-tests treatment vs. control (¼pure peat).
Treatment PF (CO2) PF (N2O)
15N faeces 0.79 ± 0.21 (p ¼ 0.18) 1.08 ± 0.11 (p ¼ 0.84)15N urine 0.83 ± 0.27 (p ¼ 0.30) 0.46 ± 0.09 (p ¼ 0.26)15N faeces þ 15N urine 0.66 ± 0.19 (p ¼ 0.05) 0.52 ± 0.07 (p ¼ 0.13)14N faeces þ 15N urine 0.58 ± 0.23 (p < 0.05) n. d. n. d.14N faeces þ 14N urine 0.21 ± 0.05 (p < 0.01) n. d. n. d.
K. Leiber-Sauheitl et al. / Soil Biology & Biochemistry 88 (2015) 282e293 289
N) with 6 atom% 15N versus 4 atom% 15N (data not shown). Duringchloroform fumigation not only microbial cells can be lysed, butammonium or old cell wall fragments of the peat substrate couldalso have been released (Miltner et al., 2012), causing dilution of the15N label due to their low 15N content. Apparently, chloroformfumigation does not allow a robust quantification of microbialbiomass in peat soil.
3.9. Mineral nitrogen
There were significant differences in mineral N (Nmin) contentsof soil between treatments (p < 0.0001). Nmin was dominated byammonium, which contributed about 96% and 83% to Nmin in thetop and bottom layer, respectively (Table 4). As expected, Nmin was
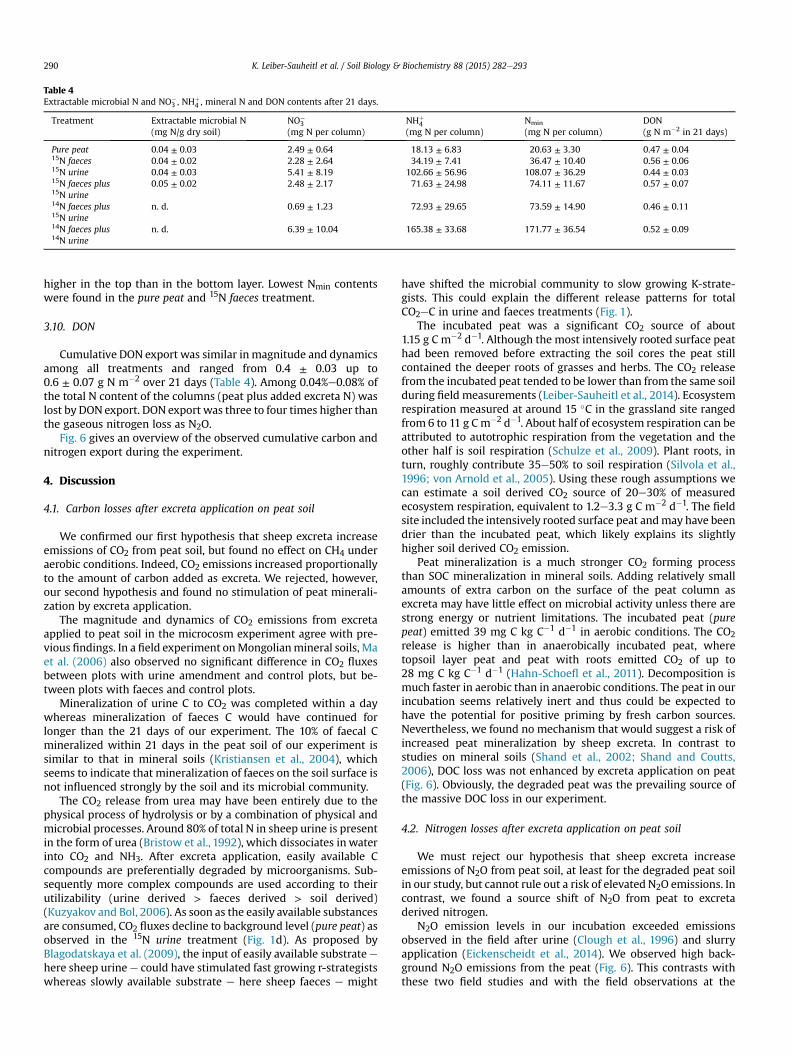
Table 4Extractable microbial N and NO�
3 , NHþ4 , mineral N and DON contents after 21 days.
Treatment Extractable microbial N(mg N/g dry soil)
NO�3
(mg N per column)NHþ
4(mg N per column)
Nmin
(mg N per column)DON(g N m�2 in 21 days)
Pure peat 0.04 ± 0.03 2.49 ± 0.64 18.13 ± 6.83 20.63 ± 3.30 0.47 ± 0.0415N faeces 0.04 ± 0.02 2.28 ± 2.64 34.19 ± 7.41 36.47 ± 10.40 0.56 ± 0.0615N urine 0.04 ± 0.03 5.41 ± 8.19 102.66 ± 56.96 108.07 ± 36.29 0.44 ± 0.0315N faeces plus15N urine
0.05 ± 0.02 2.48 ± 2.17 71.63 ± 24.98 74.11 ± 11.67 0.57 ± 0.07
14N faeces plus15N urine
n. d. 0.69 ± 1.23 72.93 ± 29.65 73.59 ± 14.90 0.46 ± 0.11
14N faeces plus14N urine
n. d. 6.39 ± 10.04 165.38 ± 33.68 171.77 ± 36.54 0.52 ± 0.09
K. Leiber-Sauheitl et al. / Soil Biology & Biochemistry 88 (2015) 282e293290
higher in the top than in the bottom layer. Lowest Nmin contentswere found in the pure peat and 15N faeces treatment.
3.10. DON
Cumulative DON export was similar in magnitude and dynamicsamong all treatments and ranged from 0.4 ± 0.03 up to0.6 ± 0.07 g N m�2 over 21 days (Table 4). Among 0.04%e0.08% ofthe total N content of the columns (peat plus added excreta N) waslost by DON export. DON export was three to four times higher thanthe gaseous nitrogen loss as N2O.
Fig. 6 gives an overview of the observed cumulative carbon andnitrogen export during the experiment.
4. Discussion
4.1. Carbon losses after excreta application on peat soil
We confirmed our first hypothesis that sheep excreta increaseemissions of CO2 from peat soil, but found no effect on CH4 underaerobic conditions. Indeed, CO2 emissions increased proportionallyto the amount of carbon added as excreta. We rejected, however,our second hypothesis and found no stimulation of peat minerali-zation by excreta application.
The magnitude and dynamics of CO2 emissions from excretaapplied to peat soil in the microcosm experiment agree with pre-vious findings. In a field experiment onMongolianmineral soils, Maet al. (2006) also observed no significant difference in CO2 fluxesbetween plots with urine amendment and control plots, but be-tween plots with faeces and control plots.
Mineralization of urine C to CO2 was completed within a daywhereas mineralization of faeces C would have continued forlonger than the 21 days of our experiment. The 10% of faecal Cmineralized within 21 days in the peat soil of our experiment issimilar to that in mineral soils (Kristiansen et al., 2004), whichseems to indicate that mineralization of faeces on the soil surface isnot influenced strongly by the soil and its microbial community.
The CO2 release from urea may have been entirely due to thephysical process of hydrolysis or by a combination of physical andmicrobial processes. Around 80% of total N in sheep urine is presentin the form of urea (Bristow et al., 1992), which dissociates in waterinto CO2 and NH3. After excreta application, easily available Ccompounds are preferentially degraded by microorganisms. Sub-sequently more complex compounds are used according to theirutilizability (urine derived > faeces derived > soil derived)(Kuzyakov and Bol, 2006). As soon as the easily available substancesare consumed, CO2 fluxes decline to background level (pure peat) asobserved in the 15N urine treatment (Fig. 1d). As proposed byBlagodatskaya et al. (2009), the input of easily available substrate ehere sheep urine e could have stimulated fast growing r-strategistswhereas slowly available substrate e here sheep faeces e might
have shifted the microbial community to slow growing K-strate-gists. This could explain the different release patterns for totalCO2eC in urine and faeces treatments (Fig. 1).
The incubated peat was a significant CO2 source of about1.15 g C m�2 d�1. Although the most intensively rooted surface peathad been removed before extracting the soil cores the peat stillcontained the deeper roots of grasses and herbs. The CO2 releasefrom the incubated peat tended to be lower than from the same soilduring field measurements (Leiber-Sauheitl et al., 2014). Ecosystemrespiration measured at around 15 �C in the grassland site rangedfrom 6 to 11 g Cm�2 d�1. About half of ecosystem respiration can beattributed to autotrophic respiration from the vegetation and theother half is soil respiration (Schulze et al., 2009). Plant roots, inturn, roughly contribute 35e50% to soil respiration (Silvola et al.,1996; von Arnold et al., 2005). Using these rough assumptions wecan estimate a soil derived CO2 source of 20e30% of measuredecosystem respiration, equivalent to 1.2e3.3 g C m�2 d�1. The fieldsite included the intensively rooted surface peat andmay have beendrier than the incubated peat, which likely explains its slightlyhigher soil derived CO2 emission.
Peat mineralization is a much stronger CO2 forming processthan SOC mineralization in mineral soils. Adding relatively smallamounts of extra carbon on the surface of the peat column asexcreta may have little effect on microbial activity unless there arestrong energy or nutrient limitations. The incubated peat (purepeat) emitted 39 mg C kg C�1 d�1 in aerobic conditions. The CO2release is higher than in anaerobically incubated peat, wheretopsoil layer peat and peat with roots emitted CO2 of up to28 mg C kg C�1 d�1 (Hahn-Schoefl et al., 2011). Decomposition ismuch faster in aerobic than in anaerobic conditions. The peat in ourincubation seems relatively inert and thus could be expected tohave the potential for positive priming by fresh carbon sources.Nevertheless, we found no mechanism that would suggest a risk ofincreased peat mineralization by sheep excreta. In contrast tostudies on mineral soils (Shand et al., 2002; Shand and Coutts,2006), DOC loss was not enhanced by excreta application on peat(Fig. 6). Obviously, the degraded peat was the prevailing source ofthe massive DOC loss in our experiment.
4.2. Nitrogen losses after excreta application on peat soil
We must reject our hypothesis that sheep excreta increaseemissions of N2O from peat soil, at least for the degraded peat soilin our study, but cannot rule out a risk of elevated N2O emissions. Incontrast, we found a source shift of N2O from peat to excretaderived nitrogen.
N2O emission levels in our incubation exceeded emissionsobserved in the field after urine (Clough et al., 1996) and slurryapplication (Eickenscheidt et al., 2014). We observed high back-ground N2O emissions from the peat (Fig. 6). This contrasts withthese two field studies and with the field observations at the
K. Leiber-Sauheitl et al. / Soil Biology & Biochemistry 88 (2015) 282e293 291
grassland site fromwhich the incubated soil originated. At this sitemean and maximum field N2O emissions were 3.4 � 10�4 g N m�2
d�1 and 2.2 � 10�3 g N m�2 d�1, respectively (Leiber-Sauheitl et al.,2014). N2O emission levels in our incubation are in the upper rangeobserved in field studies of peat grassland soils (Leppelt et al.,2014).
Acid soils like our peat soil have high N2O/N2 production ratiosand thus high potential N2O emissions (Mørkved et al., 2007; Liuet al., 2010). The peat substrate in our incubation, however, had aC/N ratio of 29, which is close to the threshold of 30e35 for verylow N2O formation (Leppelt et al., 2014). Thus, soil properties areinconclusive for explaining the relatively high N2O emission levelsin the incubation.
Nmin content in the incubation experiment exceeded the valuesfound in the field, which were almost exclusively present asammonium as well (Leiber-Sauheitl et al., 2014). Absence of plants,and consequently no plant N-uptake, might have resulted in astronger Nmin accumulation. The laboratory results highlight that apeat soil can quickly switch from low to high N2O emissions whenNmin contents rise and environmental conditions are favorable forN2O producing processes of the N cycle, such as denitrification ornitrifier denitrification.
Urine application indicated a risk of elevated N2O emissions, butthe variability in the treatments was too high for a robust state-ment. The source partitioning, however, clearly indicated a sourceshift from peat to urine in N2O formation. A similar, but less pro-nounced shift in N substrate was induced by faeces.
The fraction of N2OeN emitted per unit of applied N is defined asthe emission factor (IPCC, 2006). The source partitioning traced byisotopic label resulted in extreme emission factors, which exceeddefault emission factor of IPCC (2006) of 2% of N as N2O fromgrazing animal excreta by an order of magnitude. Field studies onmineral soils estimated an emission factor of 0.4% of N from cattledung patches and of <0.1e3.8%, with 1.5% as overall mean for urine(Oenema et al., 1997). After the application of cattle excreta to aScottish grassland on mineral soil, Bell et al. (2015) reported Nemission factors of urine (1.1%) and dung (0.2%) in summer whichwere in all experiments lower than the IPCC default of 2%. Nemission factors smaller than 1% were also found for cattle slurryapplication on organic soils (Eickenscheidt et al., 2014). This strongdiscrepancy in emission factors, however, is no contradiction. Thefield studies and the IPCC emission factors refer to apparent Napplication effects by comparing total emissions from sites withexcreta with emissions from control sites. This approach ignoresthe substrate shift from soil N to excreta N, which was the maineffect in our experiment. Calculating apparent emission factors inline with IPCC (2006) results in near zero emission factors in ourexperiment as well.
4.3. Priming effects for C and N
We reject our priming hypothesis and found instead no ornegative carbon and nitrogen priming in peat soil by sheep excreta.
CO2 from excreta was additive to CO2 from the peat with noobvious interaction. We found, however, a clear source shift fromsoil to sheep excreta. This finding contrasts with results for amineral soil. Ma et al. (2013) found a positive priming effect on soilC decomposition by sheep faeces application on two Mongoliangrassland soils. The contrasting effects could be a consequence ofdryer conditions in the Mongolian study, carbon limitation ofdecomposition or a different microbial community in the mineralsoil as opposed to the degraded peat soil in our study.
The C addition to peat soil was a mixture of pulse inputs (easilydegradable substances in faeces and urine such as urea or aminoacids) and continuous inputs (more recalcitrant substances in
faeces such as lignin) as defined by Kuzyakov (2010). In a first stepbacteria decompose easily degradable substances whereas after-ward fungi produce extracellular enzymes to degrade more stablesoil organic matter (Kuzyakov, 2010). Fungi would stimulate posi-tive priming effects while bacteria would induce no or negativepriming by preferential feeding on energy-rich substrate. Given themethodological difficulty of extracting microbes from peat soil wecould not distinguish bacteria from fungi. Nevertheless our findingssuggest that the excreta have stimulated bacterial activity, whichpreferentially fed on easily degradable substances, and bacterialnitrification and denitrification. Of course, a non-negligible numberof microorganisms were also added with the excreta, in particularwith the faeces (Kristiansen et al., 2004; Ritz et al., 2004).
4.4. Field application of lab results
Sheep grazing is often conducted on peatlands protected fornature conservationwith a low stocking density. The surface area ofa sheep faeces patch is roughly below 0.005 m2 and that of a sheepurine patch (wetted area) about 0.03 m2 (¼one excretion event;Oenema et al., 1997). A typical stocking density of 0.5 livestock unitsper hectare, equivalent to 5 ewes would result in about50 kg ha�1 a�1 of N and 750 kg ha�1 a�1 of C input by excreta(Haenel et al., 2014). During one sheep excreta application event inour experiment, 34% of N as urine and 66% as faeces were added(Table 2 and Fig. 6). Jones andWoodmansee (1979) found 70% of thetotal excreted N in urine and 30% in faeces. With a recommendedmaximal herd size of 1100 sheep (Germer, 2006), an area of 33 m2
and 5.5 m2 is covered with urine and faeces patches, respectively.Urine and faeces would affect 3.3% and 0.5% per grazed hectare,respectively. Possible, but according to our results negligiblepriming effects would be constrained to a small area.
Compaction by sheep trampling may help conserve the peat. Ina laboratory study the presence of sheep trampling led to smallerCO2 fluxes independent of the trampling intensity (Clay andWorrall, 2013). This came from the damaged vegetation and froman increase in surface bulk density which affected the connectivityof the pore space. It is to be expected that soil conditions becomemore anaerobic and therefore peat is less degraded. Soil compac-tion by trampling could, however, cause increased wetness, whichin turn may increase N2O or CH4 emissions. This was not tested inthe microcosms. Compaction mainly occurs when stocking densityis high and long periods of grazing are conducted on a grassland onwet peat soil. However, this risk is minimized by grazing recom-mendations on grasslands in nature conservation areas where lowstocking density and short periods of grazing are mandatory.
As we already indicated for priming effects low stocking den-sities minimize impact of sheep excreta to a small area. Therefore,the risk of increased N2O and CH4 emissions due to water loggingshould also be constrained to a small area. Consequently, wetnessinduced by compaction should not alter our conclusions.
Worrall and Clay (2012) have developed a model, which usessubmodels of the physical impact of grazing, biomass production,energy usage in sheep, and peat accumulation in combinationwithIPCC emission factors (IPCC, 2006) to estimate the greenhousebalance in a near-natural peatland in dependence of grazing in-tensity. They estimated an average GHG emission from the peat soilof about 166 kg CO2-eq. yr�1 ewe�1. Their results indicate that,depending on the GHG sink of the peat soil, grazing intensitiesbetween 0.2 and 1.7 ewes ha�1 can result in a neutral greenhousebalance. In Germany and the Netherlands, however, peat soils areusually drained for forage production and grazing. In such a situ-ation where peat is constantly lost by aerobic decomposition, thegreenhouse gas balance of sheep grazing on drained peat is alwaysa net CO2 source.
K. Leiber-Sauheitl et al. / Soil Biology & Biochemistry 88 (2015) 282e293292
So far, there are no comparable field experiments that wouldallow immediate conclusions for practice. Nevertheless, themechanisms and trends we observed agree with field observationson peat soils in other studies and their interpretation, but disagreewith findings in mineral soils. We therefore suggest that our lab-oratory results can be generalized for grazed peat soils.
In total, sheep grazing will slow down peat soil degradation bysmall negative carbon priming and compaction by trampling.
5. Conclusions
In the microcosm experiment, sheep excreta did enhance CO2emissions proportionally to the amount and type of C added. Incontrast, N2O and CH4 emissions were not affected by excretaaddition. Methane emissions were very small and so not relevantduring excreta decomposition. Sheep excreta caused no or smallnegative priming on peat decomposition and led to a source shift ofthe nitrogen released as N2O from peat to labile N forms in excreta.We found no mechanism that would suggest a risk of increasedpeat mineralization by sheep excreta. Sheep excreta cover a smallfraction of the grazed area and exert no or slightly negative carbonpriming. Sheep also compact the soil by trampling. Overall, sheepgrazing can be expected to slow down the degradation of drainedpeat soil.
Acknowledgments
The “Organic soils” joint research project was funded by theThuenen Institute.
We thank B. Klauke, M. Hunziger and D. Olbricht for their help inthe lab as well as A. Junghans and D. Wolters for support duringsheep labeling. Furthermore, we acknowledge the support of J. Ehe,A. Giesemann and M. Zerbian; and two anonymous reviewers fortheir instructive comments.
Appendix A. Supplementary data
Supplementary data related to this article can be found online athttp://dx.doi.org/10.1016/j.soilbio.2015.06.001.
References
Amelung, W., Bol, R., Friedrich, C., 1999. Natural 13C abundance: a tool to trace theincorporation of dung-derived carbon into soil particle-size fractions. RapidCommunications in Mass Spectrometry 13, 1291e1294.
Angers, D.A., Rochette, P., Chantigny, M.H., Lapierre, H., 2007. Use of 13C abundanceto study short-term pig slurry decomposition in the field. Soil Biology &Biochemistry 39, 1234e1237.
Bell, M.J., Rees, R.M., Cloy, J.M., Topp, C.F.E., Bagnall, A., Chadwick, D.R., 2015. Nitrousoxide emissions from cattle excreta applied to a Scottish grassland: effects ofsoil and climatic conditions and a nitrification inhibitor. Science of the TotalEnvironment 508, 343e353.
Black, A.S., Sherlock, R.R., Smith, N.P., 1987. Effect of timing of simulated rainfall onammonia volatilization from urea, applied to soil of varying moisture-content.Journal of Soil Science 38, 679e687.
Blagodatskaya, E.V., Blagodatsky, S.A., Anderson, T.H., Kuzyakov, Y., 2009. Con-trasting effects of glucose, living roots and maize straw on microbial growthkinetics and substrate availability in soil. European Journal of Soil Science 60,186e197.
Bol, R., Amelung, W., Friedrich, C., Ostle, N., 2000. Tracing dung-derived carbon intemperate grassland using 13C natural abundance measurements. Soil Biology &Biochemistry 32, 1337e1343.
Bol, R., Moering, J., Kuzyakov, Y., Amelung, W., 2003. Quantification of priming andCO2 respiration sources following slurry-C incorporation into two grasslandsoils with different C content. Rapid Communications in Mass Spectrometry 17,2585e2590.
Bristow, A.W., Whitehead, D.C., Cockburn, J.E., 1992. Nitrogenous constituents in theurine of cattle, sheep and goats. Journal of the Science of Food and Agriculture59, 387e394.
Brookes, P.C., Landman, A., Pruden, G., Jenkinson, D.S., 1985. Chloroform fumigationand the release of soil-nitrogen e a rapid direct extraction method to measuremicrobial biomass nitrogen in soil. Soil Biology & Biochemistry 17, 837e842.
Clay, G.D., Worrall, F., 2013. The response of CO2 fluxes from a peat soil to variationin simulated sheep trampling. Geoderma 197, 59e66.
Clough, T.J., Sherlock, R.R., Cameron, K.C., Ledgard, S.F., 1996. Fate of urine nitrogenon mineral and peat soils in New Zealand. Plant and Soil 178, 141e152.
Eickenscheidt, T., Heinichen, J., Augustin, J., Freibauer, A., Drosler, M., 2014. Nitrogenmineralization and gaseous nitrogen losses from waterlogged and drainedorganic soils in a black alder (Alnus glutinosa (L.) Gaertn.) forest. Biogeosciences11, 2961e2976.
Floate, M.J.S., 1970. Decomposition of organic materials from hill soils and pasturespart 4: the effects of moisture content on the mineralization of carbon nitrogenand phosphorus from plant materials and sheep faeces. Soil Biology andBiochemistry 2, 275e283.
Floate, M.J.S., Torrance, C.J., 1970. Decomposition of organic materials from hill soilsand pastures part1: incubation method for studying mineralisation of carbon,nitrogen and phosphorus. Journal of the Science of Food and Agriculture 21,116e120.
Germer, P., 2006. Regeneration des Großes Torfmoores e LIFE-Natur-Projekt(Regeneration of the Großes Torfmoor e LIFE-Nature-Project). NUA-Heft 23,80e84.
Haenel, H.-D., R€osemann, C., D€ammgen, U., Poddey, E., Freibauer, A., Wulf, S., Eurich-Menden, B., D€ohler, H., Schreiner, C., Bauer, B., Osterburg, B., 2014. Calculationsof Gaseous and Particulate Emissions from German Agriculture 1990e2012.Thünen Report 17, p. 348.
Hahn-Schoefl, M., Zak, D., Minke, M., Gelbrecht, J., Augustin, J., Freibauer, A., 2011.Organic sediment formed during inundation of a degraded fen grassland emitslarge fluxes of CH4 and CO2. Biogeosciences 8, 1539e1550.
Hamer, U., Marschner, B., 2002. Priming effects of sugars, amino acids, organic acidsand catechol on the mineralization of lignin and peat. Journal of Plant Nutritionand Soil Science 165, 261e268.
Hantschel, R.E., Flessa, H., Beese, F., 1993. An automated microcosm system forstudying soil ecological processes. Soil Science Society of America Journal 58,401e404.
IPCC, 2006. Guidelines for National Greenhouse Gas Inventories. Chapter 3:Consistent Representation of Lands, p. 42.
Joergensen, R.G., 1995. Die quantitative Bestimmung der mikrobiellen Biomasse inB€oden mit der Chloroform-Fumigations-Extraktions-Methode (The quantita-tive determination of the microbial biomass in soil by the chloroform fumi-gation extraction method), 104 ed. G€ottinger Bodenkundliche Berichte,G€ottingen.
Jones, M.B., Woodmansee, R.G., 1979. Biogeochemical cycling in annual grasslandecosystems. Botanical Review 45, 111e144.
Koops, J.G., vanBeusichem, M.L., Oenema, O., 1997. Nitrous oxide production, itssource and distribution in urine patches on grassland on peat soil. Plant and Soil191, 57e65.
Kristiansen, S.M., Brandt, M., Hansen, E.M., Magid, J., Christensen, B.T., 2004. 13Csignature of CO2 evolved from incubated maize residues and maize-derivedsheep faeces. Soil Biology & Biochemistry 36, 99e105.
Kuzyakov, Y., 2010. Priming effects: interactions between living and dead organicmatter. Soil Biology & Biochemistry 42, 1363e1371.
Kuzyakov, Y., Bol, R., 2006. Sources and mechanisms of priming effect induced intwo grassland soils amended with slurry and sugar. Soil Biology & Biochemistry38, 747e758.
Kuzyakov, Y., Friedel, J.K., Stahr, K., 2000. Review of mechanisms and quantificationof priming effects. Soil Biology & Biochemistry 32, 1485e1498.
Leiber-Sauheitl, K., Fuß, R., Voigt, C., Freibauer, A., 2014. High CO2 fluxes fromgrassland on histic Gleysol along soil carbon and drainage gradients. Bio-geosciences 11, 749e761.
Leppelt, T., Dechow, R., Gebbert, S., Freibauer, A., Lohila, A., Augustin, J., Dr€osler, M.,Fiedler, S., Glatzel, S., H€oper, H., J€arveoja, J., Lærke, P.E., Maljanen, M., Mander, Ü.,M€akiranta, P., Minkkinen, K., Ojanen, P., Regina, K., Str€omgren, M., 2014. Nitrousoxide emission budgets and land-use-driven hotspots for organic soils inEurope. Biogeosciences 11, 6595e6612.
Liu, B., Mørkved, P.T., Frostegård, Å., Bakken, L.R., 2010. Denitrification gene pools,transcription and kinetics of NO, N2O and N2 production as affected by soil pH.Fems Microbiology Ecology 72, 407e417.
Loftfield, N., Flessa, H., Augustin, J., Beese, F., 1997. Automated gas chromatographicsystem for rapid analysis of atmospheric trace gases methane, carbon dioxide,and nitrous oxide. Journal of Environmental Quality 6, 560e564.
Ma, X., Ambus, P., Wang, S., Wang, Y., Wang, C., 2013. Priming of soil carbondecomposition in two inner Mongolia grassland soils following sheep dungaddition: a study using 13C natural abundance approach. Plos One 8.
Ma, X., Wang, S., Wang, Y., Jiang, G., Nyren, P., 2006. Short-term effects of sheepexcrement on carbon dioxide, nitrous oxide and methane fluxes in typicalgrassland of inner Mongolia. New Zealand Journal of Agricultural Research 49,285e297.
Miltner, A., Bombach, P., Schmidt-Bruecken, B., Kaestner, M., 2012. SOM genesis:microbial biomass as a significant source. Biogeochemistry 111, 41e55.
Monaghan, R.M., Barraclough, D., 1993. Nitrous-oxide and dinitrogen emissionsfrom urine-affected soil under controlled conditions. Plant and Soil 151,127e138.
Mørkved, P.T., D€orsch, P., Bakken, L.R., 2007. The N2O product ratio of nitrificationand its dependence on long-term changes in soil pH. Soil Biology andBiochemistry 39, 2048e2057.
Oenema, O., Velthof, G.L., Yamulki, S., Jarvis, S.C., 1997. Nitrous oxide emissions fromgrazed grassland. Soil Use and Management 13, 288e295.

K. Leiber-Sauheitl et al. / Soil Biology & Biochemistry 88 (2015) 282e293 293
Reiche, M., Gleixner, G., Kuesel, K., 2010. Effect of peat quality on microbialgreenhouse gas formation in an acidic fen. Biogeosciences 7, 187e198.
Ritz, K., McNicol, W., Nunan, N., Grayston, S., Millard, P., Atkinson, D., Gollotte, A.,Habeshaw, D., Boag, B., Clegg, C.D., Griffiths, B.S., Wheatley, R.E., Glover, L.A.,McCaig, A.E., Prosser, J.I., 2004. Spatial structure in soil chemical and microbi-ological properties in an upland grassland. Fems Microbiology Ecology 49,191e205.
Schulze, E.D., Luyssaert, S., Ciais, P., Freibauer, A., Janssens, I.A., Soussana, J.F.,Smith, P., Grace, J., Levin, I., Thiruchittampalam, B., Heimann, M.,Dolman, A.J., Valentini, R., Bousquet, P., Peylin, P., Peters, W., Roedenbeck, C.,Etiope, G., Vuichard, N., Wattenbach, M., Nabuurs, G.J., Poussi, Z.,Nieschulze, J., Gash, J.H., CarboEurope, T., 2009. Importance of methane andnitrous oxide for Europe's terrestrial greenhouse-gas balance. Nature Geo-science 2, 842e850.
Shand, C.A., Coutts, G., 2006. The effects of sheep faeces on soil solution compo-sition. Plant and Soil 285, 135e148.
Shand, C.A., Williams, B.L., Dawson, L.A., Smith, S., Young, M.E., 2002. Sheep urineaffects soil solution nutrient composition and roots: differences between fieldand sward box soils and the effects of synthetic and natural sheep urine. SoilBiology & Biochemistry 34, 163e171.
Silvola, J., Alm, J., Ahlholm, U., Nykanen, H., Martikainen, P.J., 1996. The contributionof plant roots to CO2 fluxes from organic soils. Biology and Fertility of Soils 23,126e131.
Smith, K.A., Conen, F., 2004. Impacts of land management on fluxes of tracegreenhouse gases. Soil Use and Management 20, 255e263.
R Core Team, 2014. R: a Language and Environment for Statistical Computing. RFoundation for Statistical Computing. Version 3.1.2. Available at: http://www.R-project.org/.
VDLUFA, 1997. Bestimmung von mineralischem (Nitrat-)Stickstoff in Bodenprofilen(Nmin-Labormethode). In: VDLUFA (Ed.), Methodenbuch Teil 2, Speyer,Germany.
Velthof, G.L., Brader, A.B., Oenema, O., 1996. Seasonal variations in nitrous oxidelosses frommanaged grasslands in TheNetherlands. Plant and Soil 181, 263e274.
von Arnold, K., Nilsson, M., Hanell, B., Weslien, P., Klemedtsson, L., 2005. Fluxes ofCO2, CH4 and N2O from drained organic soils in deciduous forests. Soil Biology& Biochemistry 37, 1059e1071.
Worrall, F., Clay, G.D., 2012. The impact of sheep grazing on the carbon balance of apeatland. Science of the Total Environment 438, 426e434.