Embed Size (px)
Citation preview
18318318318318319
Journal of Uncertain SystemsVol.5, No.3, pp.183-201, 2011
Online at: www.jus.org.uk
Software Testing Effort: An Assessment Through Fuzzy Criteria Approach
Praveen Ranjan Srivastava1,*, Sirish Kumar1, A.P. Singh2, G. Raghurama3
1Computer Science & Information System Group, BITS Pilani – 333031, INDIA 2Civil Engineering Group, BITS Pilani – 333031, INDIA
3Electrical Electronics and Instrumentation Group, BITS Pilani – 333031, INDIA
Received 6 August 2009; Revised 15 March 2010
Abstract
Software Testing is an important process of software development which is performed to support and enhance reliability and quality of the software. It consists of estimating testing effort, selecting suitable test team, designing test cases, executing the software with those test cases and examining the results produced by those executions. Studies indicate that 40-50 percent of the cost of software development is devoted to testing, with the percentage for testing critical software being even higher. This paper makes an attempt to estimate reliable software testing effort using fuzzy logic. The paper deals with the features of the Software Testing Effort (STE) estimation problem by proposing a novel Fuzzy model by integrating COCOMO, fuzzy logic and weighing techniques, Test Effort Drivers (TEDs) into a single platform. In this model triangular membership functions with monotonic constraints have been chosen, which finally achieve good generalization. The proposed model is finally validated with a case study of an Organization. Another feature of the present model is that it allows for continuous rating values and therefore avoids the problem of similar projects having large variances in cost estimations. © 2011 World Academic Press, UK. All rights reserved.
Keywords: software engineering, software development effort (SDE), software testing effort (STE), line of code (LOC), confidence (C), fuzzy logic, defuzzification, test effort drivers (TEDs)
1 Introduction Software engineering is the application of a systematic, disciplined, quantifiable approach to the development, operation, and maintenance of software [39, 32]. The term software engineering first appeared in the 1968 NATO Software Engineering Conference [27]. The basic goal of software engineering is to produce software at low cost [17] with higher efficiency. Since the field is still relatively young compared to its sister fields of soft computing, there is still much work and debate around what software engineering actually is, and if it deserves the title engineering. Software development environment consists of series of phases [35] in all the phases of Software Development Life Cycle (SDLC), software testing is one of the major phases.
As such software testing is the process of validation and verification of the software product. Effective software testing will contribute to the delivery of reliable and quality oriented software product, more satisfied users, lower maintenance cost, and more accurate and reliable result in day to day working environment of software professionals. However, ineffective testing will lead to the opposite results, low quality products, unhappy users, increased maintenance costs, unreliable and inaccurate results. Hence, software testing is a necessary and important activity of software development process. Myers [24] states that “Software Testing is the process of executing a program with the intent of finding errors”. The importance of testing can be understood by the fact that “around 35% of the elapsed time and over 50% of the total cost are involved in testing programs” [14, 3, 26].
Practitioners are generally short of time or resources and tend to perceive systematic testing as not so very lucrative job. However, it affects overall software life cycle, because quality of software life cycle depend upon testing technique demanding adequate test case preparation, modeling, and documentation which make the process complicated and challenging. These impending challenges have to be addressed by researchers and practitioners working closely together by estimating the amount of effort that is required to develop user-friendly software [11, 22].
* Corresponding author. Email: [email protected] (P.R. Srivastava).
P.R. Srivastava et al.: Software Testing Effort: An Assessment Through Fuzzy Criteria Approach
184
Software Development Effort (SDE) estimation is the process of predicting the most realistic use of effort required to develop or maintain software based on incomplete, uncertain and/or noisy input [5]. Effort estimates may be used as input to project plans, iteration plans, budgets, and investment analyses, pricing processes and bidding rounds [32]. There are several models for estimating software development effort. Some of them are COnstructive COst MOdel (COCOMO), Function point analysis and so on [32, 35]. The COCOMO is an algorithmic software cost estimation model developed by Barry Boehm in 1981. This model uses a basic regression formula, with parameters that are derived from historical project data and current project characteristics. COCOMO model is the most widely used model for estimating the software development effort [6].
Once we have estimated the SDE, Software Testing Effort (STE) is estimated as 40 to 50 percent of the development effort [26, 34]. The fundamental premise here is that test engineering efforts are dependent on the time and/or cost of SDE. First, development effort is estimated using the technique discussed above and the next step is using some heuristic to predict a value next to it. This varies widely and is usually based on previous experiences. However there is no standard procedure to determine an accurate value. Therefore there is a need to provide an approximation of testing effort that acts as a valuable tool for the developers and practitioners. It becomes even more evident to estimate the testing effort accurately due to the following reasons:
Organizations have proper control over project and they can plan systematically The understanding of the product can be made more clear Estimation of testing effort determines the project feasibility in terms of budget and time constraints Testing effort estimation also helps management in taking decision for current as well as future projects It is utmost necessary to derive project schedule It enables the team leader to ascertain proper test team and its staffing Estimation helps in quantifying the impact of risks and guides the project/test manager to take suitable
decision. This paper deals with the features of the STE estimation problem by proposing a novel fuzzy model by
integrating COCOMO, fuzzy logic and weighing techniques (to account for the past experience and knowledge base which influence to software testing process), Test Effort Drivers (TEDs) into one platform. In this model triangular membership functions with monotonic constraints [16] have been chosen, which finally achieve good generalization. The proposed model is finally validated with a case study of an Organization. Another feature of the present model is that it allows for continuous rating values and therefore avoids the problem of similar projects having large variances in cost estimations. Hence, this paper tries to estimate approximate Software Testing Effort (STE) value using fuzzy logic and proposed software Test Effort Drivers (TEDs).
2 Background Work Software development is very important and necessary in today’s world in any field of applied science and technology. However, optimal software should be in such a way that it can best satisfy the constraints like cost, time, efforts and other resources. This can be achieved by formulating a systematic software development life cycle along with Software Testing Effort (STE) to ensure that above constraints can be satisfied fully before a software release. Test engineering managers use many different methods to estimate and schedule their test engineering efforts. Different organizations use different methods depending on the type of projects, the inherent risks in the project and the technologies involved into them. There has been many research on Software Testing but research on Software Testing Effort estimation has not received due attention. Estimating the cost and duration of software testing effort is a major challenge.
Presently an early prediction of STE is based on the testing metrics [13] which generally overestimate the efforts depending on the expertise of software testing team for developing the software. Halstead developed a set of metrics to measure a program module's complexity directly from source code, with emphasis on computational complexity [12]. These measures were developed as a means of determining a quantitative indication of complexity directly from the operators and operands in the module. The study evaluates overall software testing effort to be allocated for a particular module. However, it has been observed that the study overestimates analysis of software testing efforts.
The testing effort estimation using cognitive information complexity method has also been discussed by some of the researchers [22] in which the time required to comprehend software is considered to be proportional to its cognitive complexity. In this approach, an existing simple cognitive metric dealing with the important parameters of software is required for estimation of test effort which finally demonstrates how often used cyclometric number [23] test effort increases with the increase in the software complexity. Jones [18] estimated the number of test cases which can be determined by the function point’s estimate for the corresponding effort. The actual effort in person-hours was
Journal of Uncertain Systems, Vol.5, No.3, pp.183-201, 2011
185
then calculated with a conversion factor obtained from previous project data. The main disadvantage of using function points is that they require detailed requirements in advance.
Nagappan [25] proposed a metric suite which helps analyzing the software testing effort. This method based upon reliability principle and different complex variables.
In another study on Test Point Analysis, a method for estimating the effort has been emphasized to perform all functional test activities based on use case points [26]. This model estimates the effort required for all test activities together, such as defining, implementing and executing all the tests.
Jørgensen [19] mentioned effort estimation is based upon several factors like human value, project data and other resources but he does not explained how these values are help in effort estimation.
Aranha and Borba [2] proposed an estimation model for test effort which is based on the test specifications. The main drawback for this model test cases were predefined.
Xu and Rajlich [40] proposed subjective concept of debugging based upon bloom’s taxonomy. Dawson [8] proposed software test effort based on neural network concept, but main drawback of training data
set and their effectiveness. Srivastava et al. [38] have made an attempt to estimate the software testing efforts by integrating Halstead
matrices with the fuzzy logic. The fuzzy logic based model presented herein specifies each testing metric using membership values and uses fuzzy rule base for calculating various test-effort drivers. The main disadvantage of this project is source code must be available.
The major disadvantage in most of the above mentioned methods for estimating STE is that all of them require the complete source code and in very few cases required complete requirement for calculating the testing effort, but results are so much ineffective. These methods can’t be used when the project is in the initial stages.
In this paper, efforts have been made to deal with evaluation of approximate software testing effort using fuzzy logic concept by developing test effort drivers. Software development effort, testing effort and fuzzy logic concept are first introduced. Estimation of Proper Software Testing Effort (STE) using fuzzy logic, weighted mean, max-min composition, center of gravity defuzzification and Test Effort Drivers (TEDs) are discussed next. Another section illustrates a case study of proposed approach and finally conclusions have been drawn in the last section.
3 Introduction of Total Software Development Effort, Testing Effort and Fuzzy Logic
Delivery of an error free product, i.e., software within budget and schedule is the topmost priority [35] of any organization. This in turn calls for reasonably good estimates of effort, time, and cost and of course quality which effect schedule and effort. Estimation of software cost and effort are complex activity, because too many variables like people, product, project, process, technical, political, environment can affect the software effort and cost [4, 42]. Software Cost estimation, i.e., the task to calculate value of the effort and the schedule required to develop and maintain a software system is one of the most critical activities in managing software projects. Several cost estimation techniques have been developed. These techniques may be grouped into two major categories: algorithmic models and non-algorithmic models [5]. There is a set method to obtain algorithmic models. Algorithmic models are obtained from the statistical or numerical analysis of historical projects. COCOMO model is a type of algorithmic model where input is project size and an evaluation of other parameters [5]. COCOMO is one of the best documented cost-estimation models based on line of code (LOC). The initial COCOMO model gives rough estimates of given software, but its measurement is limited due to lack of various factors under different category in a project [32]. Intermediate COCOMO [5] takes these Cost Drivers into account. Intermediate COCOMO computes software development effort as function of program size and a set of "cost drivers" that include subjective assessment of product, hardware, personnel and project attributes and each with a number of subsidiaries attributes.
Each of these attributes receives a rating on a six-point scale that ranges from "very low" to "extra high" (in importance or value). The product of all effort multipliers results in an effort adjustment factor (EAF). Typical values for EAF range from 0.9 to 1.4. The Software Development effort can be calculated by using below formula [5].
( ) ibiE a KLOC EAF= ´ ´ (1)
where E is the effort applied in person-months, KLOC is the estimated number of thousands of delivered lines of code for the project, and EAF is the factor calculated above. The coefficient ai and the exponent bi depend on the structure of the organization. The table below showed the type of organization and the corresponding values of these coefficients.
P.R. Srivastava et al.: Software Testing Effort: An Assessment Through Fuzzy Criteria Approach
186
Table 1: Coefficient for COCOMO (Boehm Barry, 1981)
Type of organization Development environment ai bi
Organic Familiar 3.2 1.05 Semidetached Medium 3.0 1.12
Embedded Complex 2.8 1.20 Software Testing is a complex activity and it is important part under software development life cycle therefore
huge amount of effort is invested in testing [20]. The exact amount of Software Testing Effort (STE) is still challenge to the software organizations.
The computation of STE is not an easy task because it depends upon exact value of SDE and test effort drivers. There are two main disadvantages in calculating development effort using above COCOMO model. Firstly, the model makes an assumption on the form of the function consisting of the some known factors, and is represented by:
( ) i(b )
iE=a KLOC EAF,* * where ai represents a productivity coefficient and bi is an economies (or diseconomies) of
scale coefficient. Secondly, the model is adjusted or modified according to certain local factors. To evaluate the attributes, certain linguistic values are assigned such as ‘very low’, ‘complex’, ‘important’ and essential’. When dealing with linguistic values, imprecision, uncertainty and partial truth are inevitable. However, until now, the factors that are taken into consideration for software measurement are numbers or classical interval to represent these linguistic values. Furthermore, such transformation and representation does not copy the way in which human beings take into mind these linguistic values and as a result cannot deal with imprecision and uncertainty. To overcome these limitations, the present paper suggests the application of fuzzy logic concepts and have been described in the subsequent paragraphs.
4 Fuzzy Logic Zadeh [41] presented firstly fuzzy set theory in his seminal paper. In another definition fuzzy logic is an extension of multivalued logics [28]. More information about fuzzy set theory and fuzzy logic can be found from Klir and Folger [21], Zadeh [41], Driankov et al. [9], and Pedrycz [30]. However, certain features of fuzzy approach to represent a system behavior are given as discussed below.
Fuzzy Logic is basically a multivalued logic that allows intermediate values to be defined between conventional evaluations like yes/no, true/false, black/white, etc. Notions like rather warm or pretty cold can be formulated mathematically and processed by computers [31].
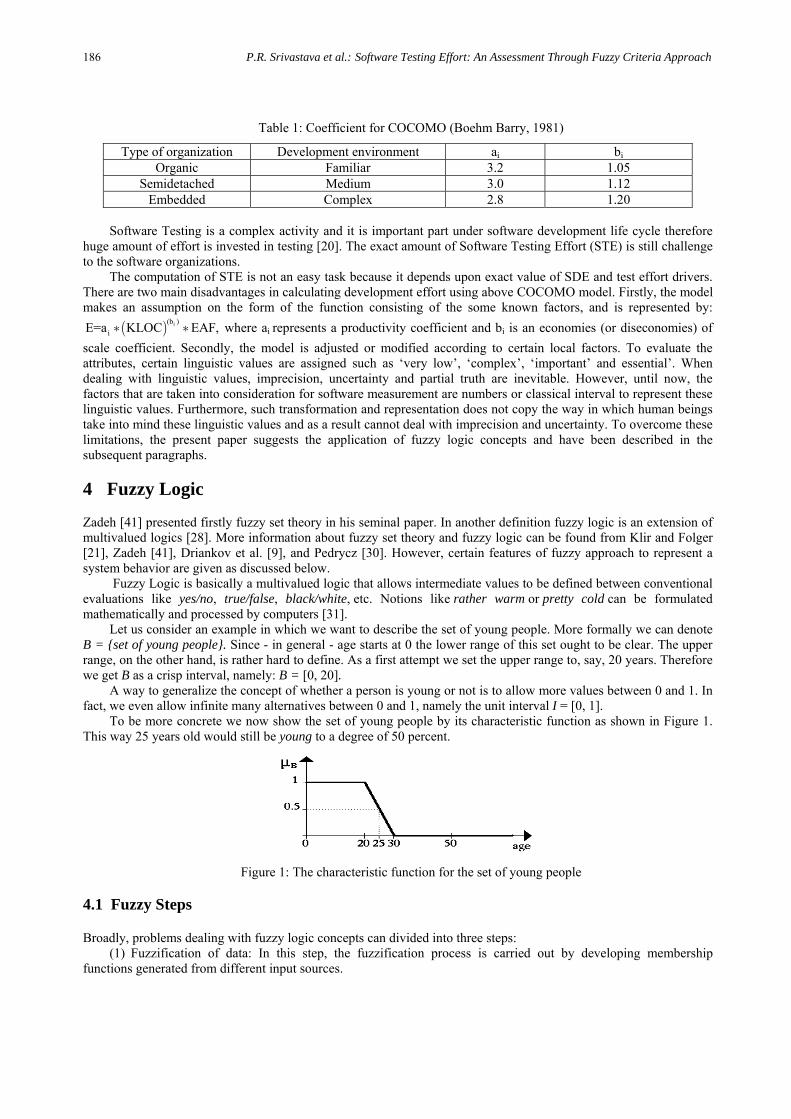
Let us consider an example in which we want to describe the set of young people. More formally we can denote B = {set of young people}. Since - in general - age starts at 0 the lower range of this set ought to be clear. The upper range, on the other hand, is rather hard to define. As a first attempt we set the upper range to, say, 20 years. Therefore we get B as a crisp interval, namely: B = [0, 20].
A way to generalize the concept of whether a person is young or not is to allow more values between 0 and 1. In fact, we even allow infinite many alternatives between 0 and 1, namely the unit interval I = [0, 1].
To be more concrete we now show the set of young people by its characteristic function as shown in Figure 1. This way 25 years old would still be young to a degree of 50 percent.
Figure 1: The characteristic function for the set of young people
4.1 Fuzzy Steps
Broadly, problems dealing with fuzzy logic concepts can divided into three steps: (1) Fuzzification of data: In this step, the fuzzification process is carried out by developing membership
functions generated from different input sources.
Journal of Uncertain Systems, Vol.5, No.3, pp.183-201, 2011
187
(2) Development of Fuzzy Rule Base: The fuzzy rule base is usually constructed from the experience of the decision maker. This phase comprises of applying the fuzzy rule base over the fuzzy input and arriving at the fuzzy output.
(3) Defuzzification of Output Data: It converts the fuzzy output into crisp output. There are several ways of defuzzification. Some of them are mean-of-maxima method, center of gravity method, modified center of gravity method, height method etc. In this paper, center of gravity technique has been used for defuzzification.
4.2 Fuzzy Rule Based System
Fuzzy linguistic descriptions are formal representation of system made through fuzzy IF-THEN rules. They encode knowledge about a system in statement of the form:
IF (xi is X1 , x2 is X2 ,……..xn is Xn) THEN (y1 is Y1, y2 is Y2,……..yn is Yn)
where linguistic variables xi, yj take the value of fuzzy sets Xi and Yj respectively. Examples are IF there is excellent software quality with a strong analyst capability THEN there must be less number of errors in the software. In this case excellent, strong, and less are fuzzy sets qualifying the variables software quality, analyst capability and number of errors respectively.
4.3 Fuzzy-to-Crisp Conversions (Defuzzification Method)
In many situations, for a system whose output is fuzzy, it is easier to take a crisps decision if the output is represented as a single scalar quantity. This conversion of a fuzzy set to single crisp value is called defuzzififcation and is the reverse process of fuzzification. Defuzzification is necessary to convert the fuzzy output into crisp output. Several methods are available in the literature [15] of which we just mention a few of widely used methods, namely Max-membership principle, Centroid Method (Center of Gravity Method), Weighted Average Method, Mean–max Membership [29].
4.4 Weighted Mean
The weighted mean or weighted average of a non-empty list of data corresponding to the set of attributes of any test effort driver [x1, x2, ..., xn] with weights [w1, w2,.., wn] and ∑wi = 1 is defined as the quantity calculated by:
n
i ii 1
n
ii 1
w xx . (2)
w
Here each “x” is a numerical value within a range of [0, 10] and each “w” within [0, 1]. So, if these terms are not within their domain, then first normalize them and then evaluate the weighted mean. The denominator of the above formula is 1.
4.5 Max-Min Composition
The max-min composition of relations of R1 and R2 denoted by MaxMin(R1,R2) is a fuzzy relation in UxW, such that for all (u, w) in UxW, MaxMin(R1,R2)(u,w)=Max(Min(R1(u,v),R2(v,w))) over all v in the set V [10, 33]. 4.6 Center of Gravity Defuzzification
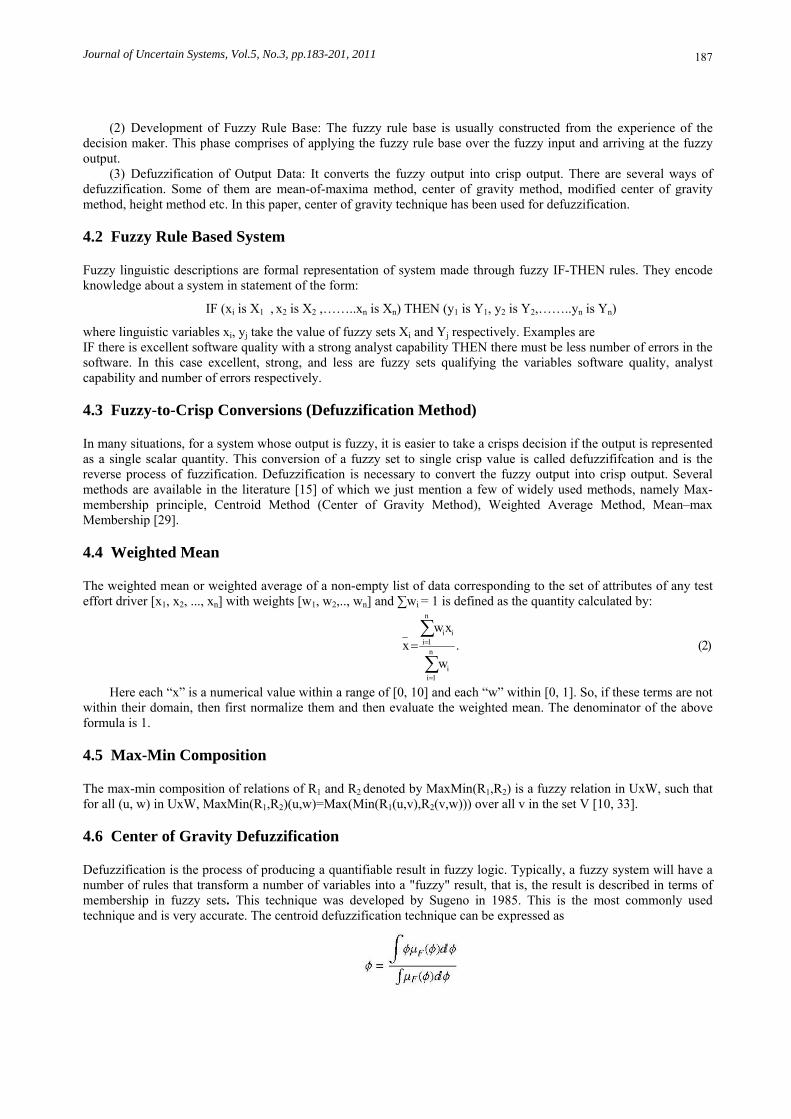
Defuzzification is the process of producing a quantifiable result in fuzzy logic. Typically, a fuzzy system will have a number of rules that transform a number of variables into a "fuzzy" result, that is, the result is described in terms of membership in fuzzy sets. This technique was developed by Sugeno in 1985. This is the most commonly used technique and is very accurate. The centroid defuzzification technique can be expressed as
P.R. Srivastava et al.: Software Testing Effort: An Assessment Through Fuzzy Criteria Approach
188
where ø is the defuzzified output, µF(ø) is the aggregated membership function and ø is the output variable [10, 33].
5 Proposed Approach for Estimating Software Testing Effort (STE) In this paper an effort has been made to compute approximate value of STE using intermediate COCOMO model and confidence level of project manager. SDE value is estimated by integrating confidence level with COCOMO model using fuzzy logic and STE is assessed accordingly. An effort has been made to identify a set of TEDs (which influence software testing process) each with a set of specific attributes that have a certain correlation with the STE. This paper quantifies exact amount proposed test TEDs values with the help of fuzzy logic. Once TEDs are quantified then approximate STE values has been calculated. In the following paragraphs basic steps of proposed STE with flow chart are first introduced. Approximate estimation of SDE values have been discussed in the next step. Important factors influencing the software testing process have been identified subsequently which finally quantify the proposed TEDs and STE.
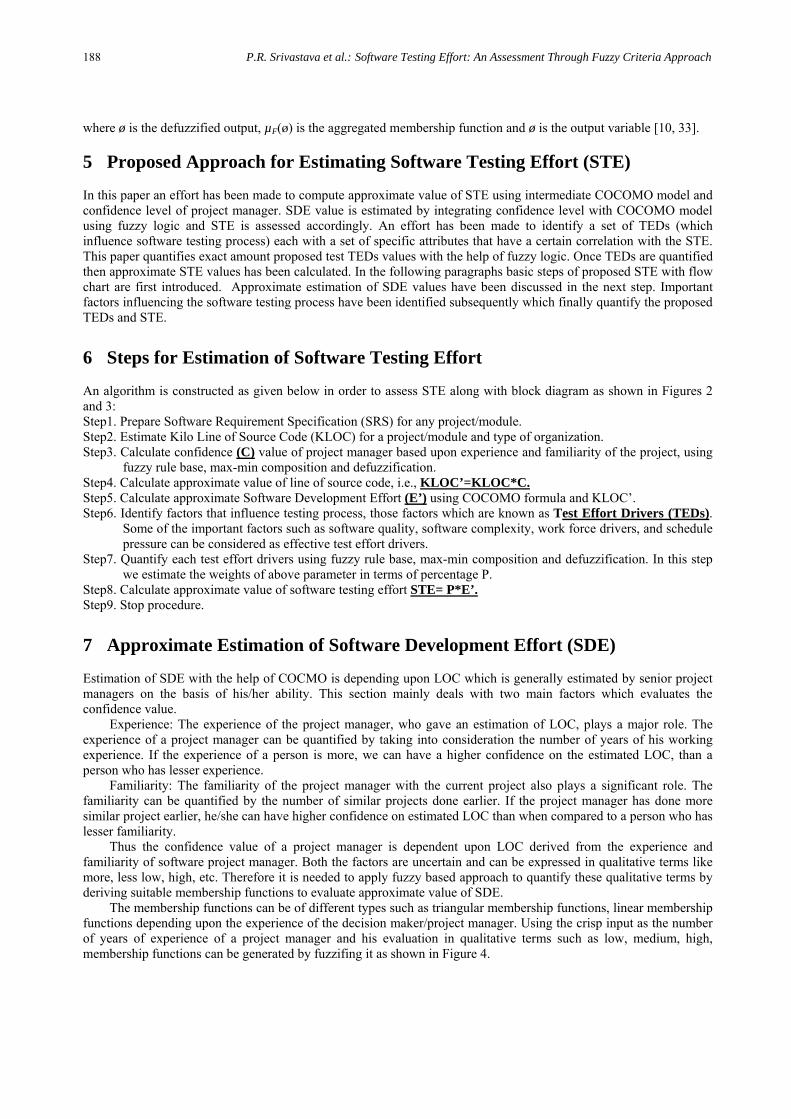
6 Steps for Estimation of Software Testing Effort An algorithm is constructed as given below in order to assess STE along with block diagram as shown in Figures 2 and 3: Step1. Prepare Software Requirement Specification (SRS) for any project/module. Step2. Estimate Kilo Line of Source Code (KLOC) for a project/module and type of organization. Step3. Calculate confidence (C) value of project manager based upon experience and familiarity of the project, using
fuzzy rule base, max-min composition and defuzzification. Step4. Calculate approximate value of line of source code, i.e., KLOC’=KLOC*C. Step5. Calculate approximate Software Development Effort (E’) using COCOMO formula and KLOC’. Step6. Identify factors that influence testing process, those factors which are known as Test Effort Drivers (TEDs).
Some of the important factors such as software quality, software complexity, work force drivers, and schedule pressure can be considered as effective test effort drivers.
Step7. Quantify each test effort drivers using fuzzy rule base, max-min composition and defuzzification. In this step we estimate the weights of above parameter in terms of percentage P.
Step8. Calculate approximate value of software testing effort STE= P*E’. Step9. Stop procedure.
7 Approximate Estimation of Software Development Effort (SDE)
Estimation of SDE with the help of COCMO is depending upon LOC which is generally estimated by senior project managers on the basis of his/her ability. This section mainly deals with two main factors which evaluates the confidence value.
Experience: The experience of the project manager, who gave an estimation of LOC, plays a major role. The experience of a project manager can be quantified by taking into consideration the number of years of his working experience. If the experience of a person is more, we can have a higher confidence on the estimated LOC, than a person who has lesser experience.
Familiarity: The familiarity of the project manager with the current project also plays a significant role. The familiarity can be quantified by the number of similar projects done earlier. If the project manager has done more similar project earlier, he/she can have higher confidence on estimated LOC than when compared to a person who has lesser familiarity.
Thus the confidence value of a project manager is dependent upon LOC derived from the experience and familiarity of software project manager. Both the factors are uncertain and can be expressed in qualitative terms like more, less low, high, etc. Therefore it is needed to apply fuzzy based approach to quantify these qualitative terms by deriving suitable membership functions to evaluate approximate value of SDE.
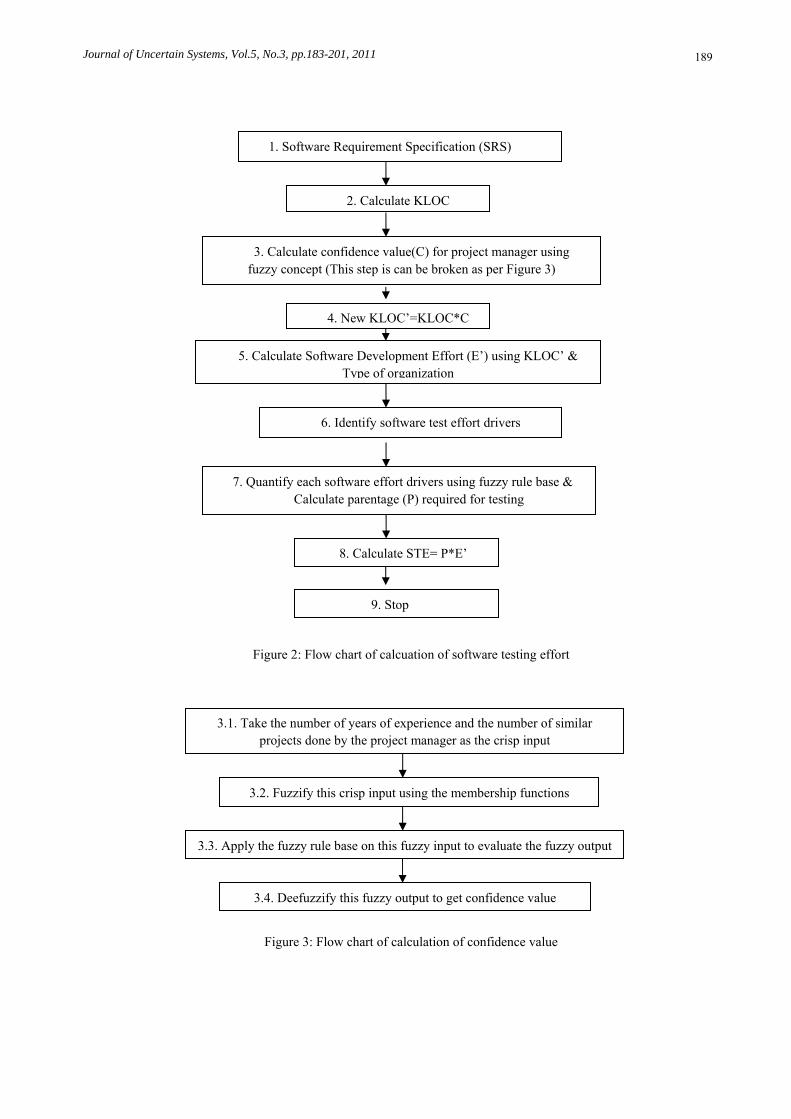
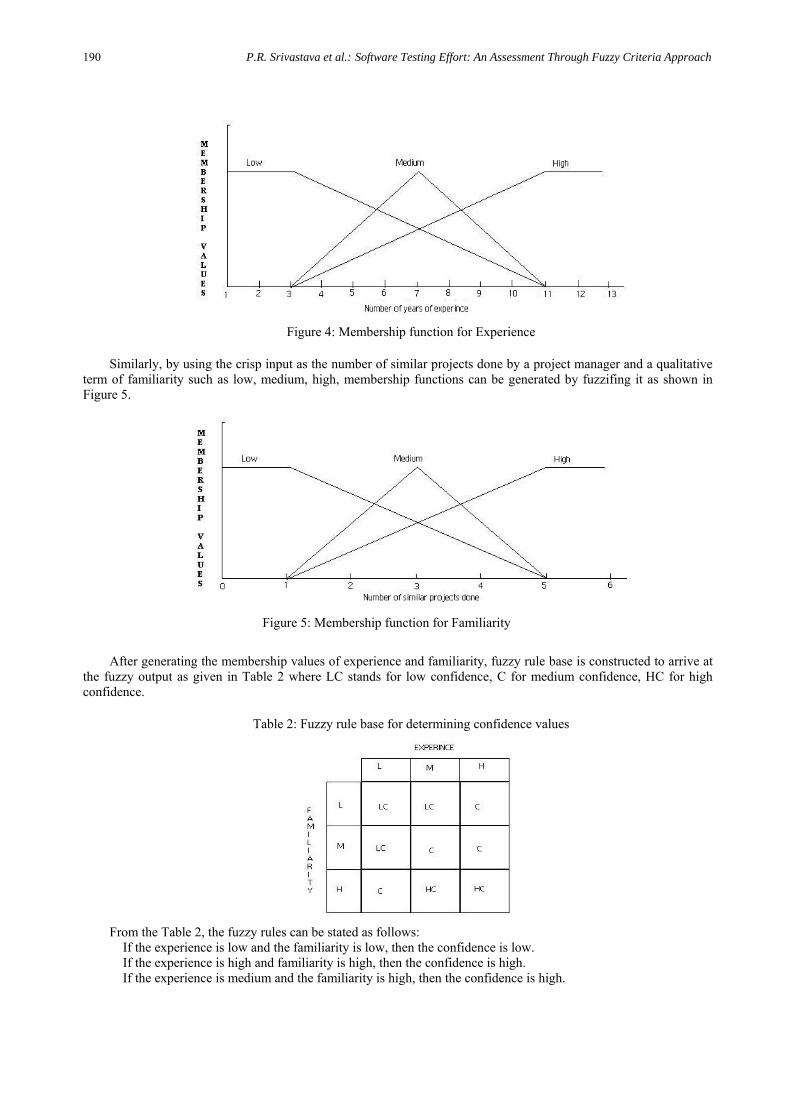
The membership functions can be of different types such as triangular membership functions, linear membership functions depending upon the experience of the decision maker/project manager. Using the crisp input as the number of years of experience of a project manager and his evaluation in qualitative terms such as low, medium, high, membership functions can be generated by fuzzifing it as shown in Figure 4.
Journal of Uncertain Systems, Vol.5, No.3, pp.183-201, 2011
189
Figure 2: Flow chart of calcuation of software testing effort
Figure 3: Flow chart of calculation of confidence value
3.1. Take the number of years of experience and the number of similar projects done by the project manager as the crisp input
3.2. Fuzzify this crisp input using the membership functions
3.3. Apply the fuzzy rule base on this fuzzy input to evaluate the fuzzy output
3.4. Deefuzzify this fuzzy output to get confidence value
2. Calculate KLOC
3. Calculate confidence value(C) for project manager using fuzzy concept (This step is can be broken as per Figure 3)
4. New KLOC’=KLOC*C
5. Calculate Software Development Effort (E’) using KLOC’ & Type of organization
6. Identify software test effort drivers
7. Quantify each software effort drivers using fuzzy rule base & Calculate parentage (P) required for testing
8. Calculate STE= P*E’
9. Stop
1. Software Requirement Specification (SRS)
P.R. Srivastava et al.: Software Testing Effort: An Assessment Through Fuzzy Criteria Approach
190
Figure 4: Membership function for Experience
Similarly, by using the crisp input as the number of similar projects done by a project manager and a qualitative
term of familiarity such as low, medium, high, membership functions can be generated by fuzzifing it as shown in Figure 5.
Figure 5: Membership function for Familiarity
After generating the membership values of experience and familiarity, fuzzy rule base is constructed to arrive at
the fuzzy output as given in Table 2 where LC stands for low confidence, C for medium confidence, HC for high confidence.
Table 2: Fuzzy rule base for determining confidence values
From the Table 2, the fuzzy rules can be stated as follows:
If the experience is low and the familiarity is low, then the confidence is low. If the experience is high and familiarity is high, then the confidence is high. If the experience is medium and the familiarity is high, then the confidence is high.
Journal of Uncertain Systems, Vol.5, No.3, pp.183-201, 2011
191
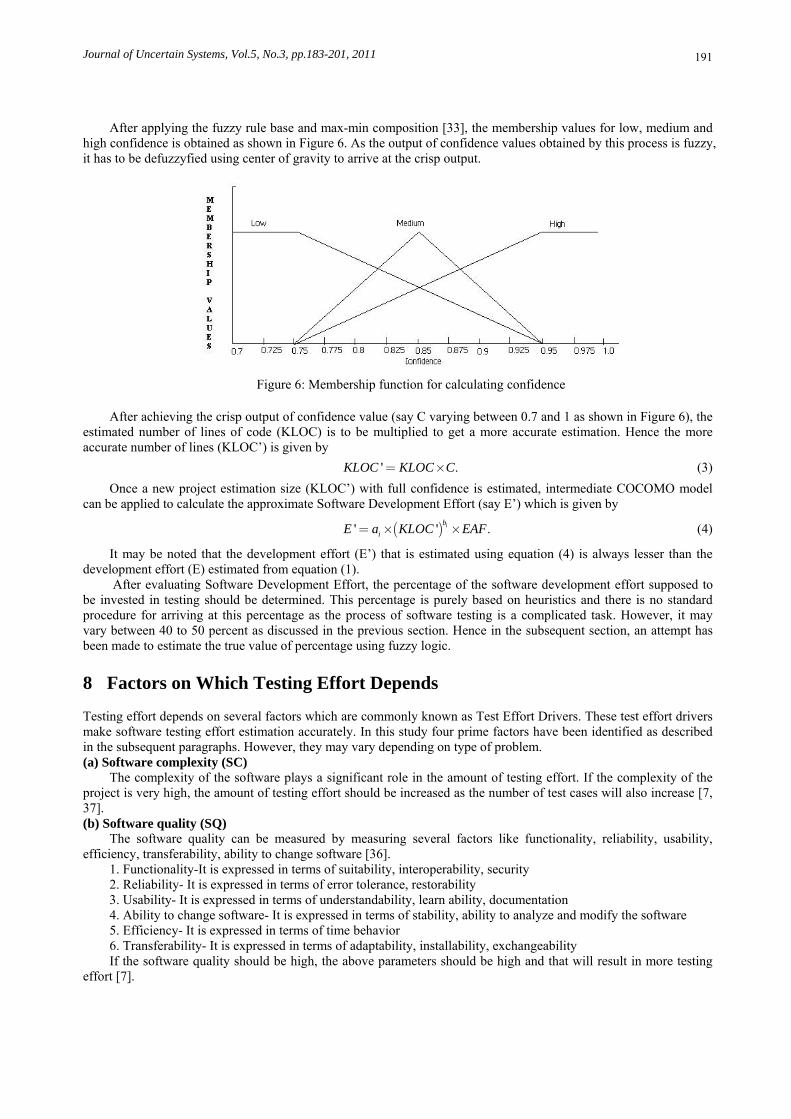
After applying the fuzzy rule base and max-min composition [33], the membership values for low, medium and high confidence is obtained as shown in Figure 6. As the output of confidence values obtained by this process is fuzzy, it has to be defuzzyfied using center of gravity to arrive at the crisp output.
Figure 6: Membership function for calculating confidence
After achieving the crisp output of confidence value (say C varying between 0.7 and 1 as shown in Figure 6), the
estimated number of lines of code (KLOC) is to be multiplied to get a more accurate estimation. Hence the more accurate number of lines (KLOC’) is given by
' .KLOC KLOC C= ´ (3)
Once a new project estimation size (KLOC’) with full confidence is estimated, intermediate COCOMO model can be applied to calculate the approximate Software Development Effort (say E’) which is given by
( )' ' .ibiE a KLOC EAF= ´ ´ (4)
It may be noted that the development effort (E’) that is estimated using equation (4) is always lesser than the development effort (E) estimated from equation (1).
After evaluating Software Development Effort, the percentage of the software development effort supposed to be invested in testing should be determined. This percentage is purely based on heuristics and there is no standard procedure for arriving at this percentage as the process of software testing is a complicated task. However, it may vary between 40 to 50 percent as discussed in the previous section. Hence in the subsequent section, an attempt has been made to estimate the true value of percentage using fuzzy logic.
8 Factors on Which Testing Effort Depends Testing effort depends on several factors which are commonly known as Test Effort Drivers. These test effort drivers make software testing effort estimation accurately. In this study four prime factors have been identified as described in the subsequent paragraphs. However, they may vary depending on type of problem. (a) Software complexity (SC)
The complexity of the software plays a significant role in the amount of testing effort. If the complexity of the project is very high, the amount of testing effort should be increased as the number of test cases will also increase [7, 37]. (b) Software quality (SQ)
The software quality can be measured by measuring several factors like functionality, reliability, usability, efficiency, transferability, ability to change software [36].
1. Functionality-It is expressed in terms of suitability, interoperability, security 2. Reliability- It is expressed in terms of error tolerance, restorability 3. Usability- It is expressed in terms of understandability, learn ability, documentation 4. Ability to change software- It is expressed in terms of stability, ability to analyze and modify the software 5. Efficiency- It is expressed in terms of time behavior 6. Transferability- It is expressed in terms of adaptability, installability, exchangeability If the software quality should be high, the above parameters should be high and that will result in more testing
effort [7].
P.R. Srivastava et al.: Software Testing Effort: An Assessment Through Fuzzy Criteria Approach
192
(c) Schedule pressure (SP) Schedule pressure (SP) is defined as the relative compression of the development schedule mandated by
management compared to the initial estimate provided by the development team based on project parameters [1]. SP= (Team Estimated cycle time-Management mandated cycle time)/team estimated cycle time. If the schedule pressure is low, then the testing effort will be more.
(d) Work force drivers (WFD) There are several work force drivers that determine the amount of testing effort. They are listed below. Tester capability Programmer capability Application domain experience-application experience Programming language experience-duration of experience with language Use of modern programming practices-use of modern practices Use of software tools-degree of dependency on external tools The summary of above proposed test effort drivers (TEDs) are given below in Table 3.
Table 3: Summary of test effort drivers
Test Effort Drivers(TEDs) Properties Software Complexity(SC) SC is directly proportional to STE.
Software Quality(SQ) SQ is directly proportional to STE. Schedule Pressure(SP) SP is inversely proportional to STE.
Work Force Drivers(WFD) WFD are directly proportional to STE. After identifying TEDs, there is need to quantify it to get exact value for the estimation of STE. The
quantification process of these drivers is explained in subsequent texts.
9 Quantification of Test Effort Drivers (TEDs) As discussed above there are four TEDs, i.e., Schedule Pressure (SP), Software Complexity (SC), Software Quality (SQ) and Work Force Effort (WFD) which are to be quantified to get appropriate value of STE.
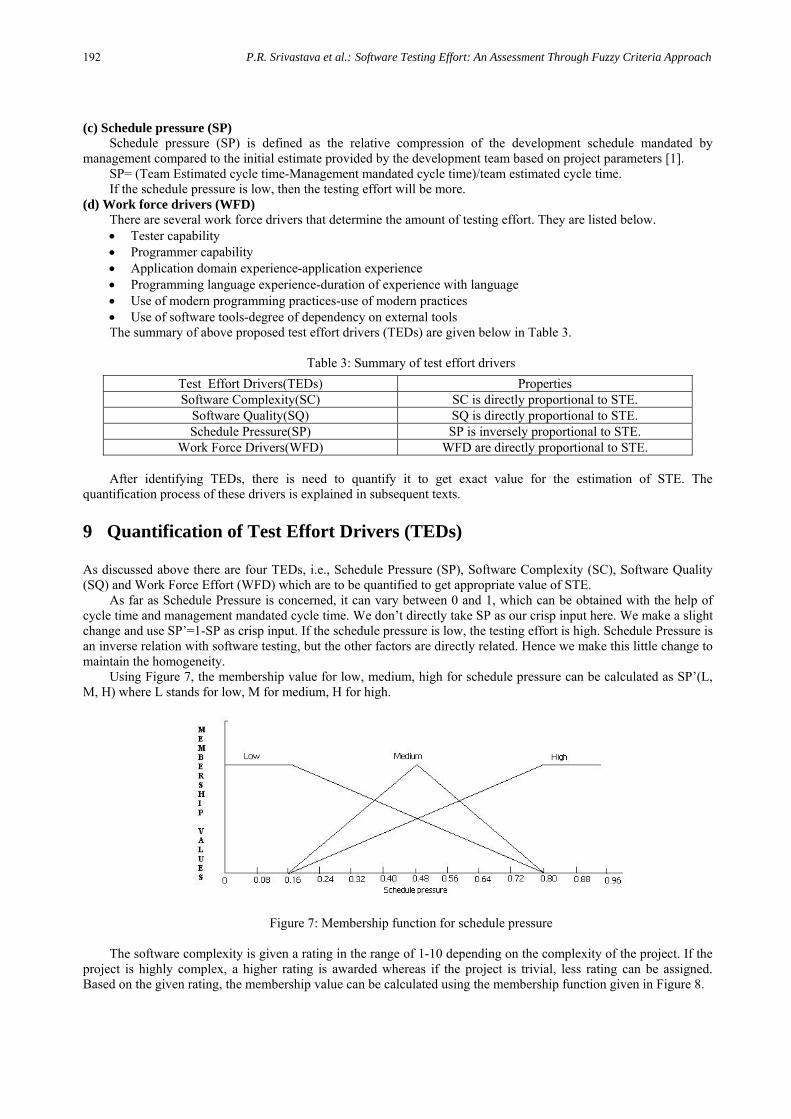
As far as Schedule Pressure is concerned, it can vary between 0 and 1, which can be obtained with the help of cycle time and management mandated cycle time. We don’t directly take SP as our crisp input here. We make a slight change and use SP’=1-SP as crisp input. If the schedule pressure is low, the testing effort is high. Schedule Pressure is an inverse relation with software testing, but the other factors are directly related. Hence we make this little change to maintain the homogeneity.
Using Figure 7, the membership value for low, medium, high for schedule pressure can be calculated as SP’(L, M, H) where L stands for low, M for medium, H for high.
Figure 7: Membership function for schedule pressure The software complexity is given a rating in the range of 1-10 depending on the complexity of the project. If the
project is highly complex, a higher rating is awarded whereas if the project is trivial, less rating can be assigned. Based on the given rating, the membership value can be calculated using the membership function given in Figure 8.
Journal of Uncertain Systems, Vol.5, No.3, pp.183-201, 2011
193
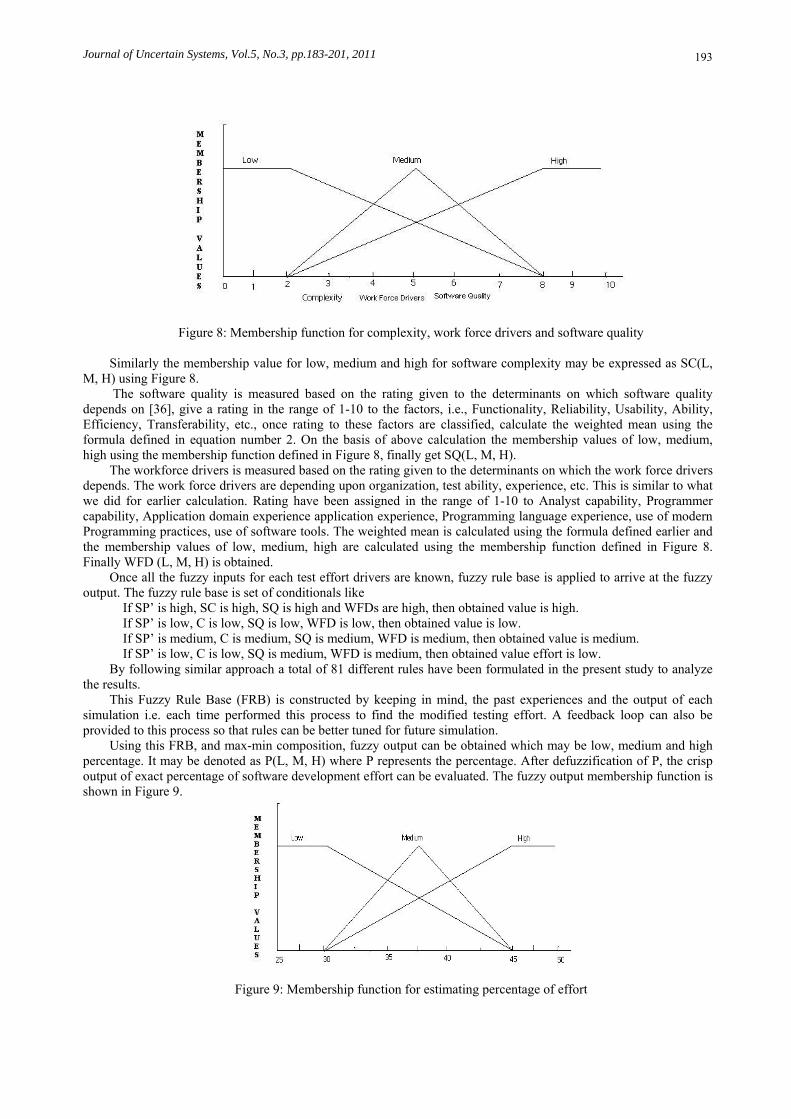
Figure 8: Membership function for complexity, work force drivers and software quality Similarly the membership value for low, medium and high for software complexity may be expressed as SC(L,
M, H) using Figure 8. The software quality is measured based on the rating given to the determinants on which software quality
depends on [36], give a rating in the range of 1-10 to the factors, i.e., Functionality, Reliability, Usability, Ability, Efficiency, Transferability, etc., once rating to these factors are classified, calculate the weighted mean using the formula defined in equation number 2. On the basis of above calculation the membership values of low, medium, high using the membership function defined in Figure 8, finally get SQ(L, M, H).
The workforce drivers is measured based on the rating given to the determinants on which the work force drivers depends. The work force drivers are depending upon organization, test ability, experience, etc. This is similar to what we did for earlier calculation. Rating have been assigned in the range of 1-10 to Analyst capability, Programmer capability, Application domain experience application experience, Programming language experience, use of modern Programming practices, use of software tools. The weighted mean is calculated using the formula defined earlier and the membership values of low, medium, high are calculated using the membership function defined in Figure 8. Finally WFD (L, M, H) is obtained.
Once all the fuzzy inputs for each test effort drivers are known, fuzzy rule base is applied to arrive at the fuzzy output. The fuzzy rule base is set of conditionals like
If SP’ is high, SC is high, SQ is high and WFDs are high, then obtained value is high. If SP’ is low, C is low, SQ is low, WFD is low, then obtained value is low. If SP’ is medium, C is medium, SQ is medium, WFD is medium, then obtained value is medium. If SP’ is low, C is low, SQ is medium, WFD is medium, then obtained value effort is low.
By following similar approach a total of 81 different rules have been formulated in the present study to analyze the results.
This Fuzzy Rule Base (FRB) is constructed by keeping in mind, the past experiences and the output of each simulation i.e. each time performed this process to find the modified testing effort. A feedback loop can also be provided to this process so that rules can be better tuned for future simulation.
Using this FRB, and max-min composition, fuzzy output can be obtained which may be low, medium and high percentage. It may be denoted as P(L, M, H) where P represents the percentage. After defuzzification of P, the crisp output of exact percentage of software development effort can be evaluated. The fuzzy output membership function is shown in Figure 9.
Figure 9: Membership function for estimating percentage of effort
P.R. Srivastava et al.: Software Testing Effort: An Assessment Through Fuzzy Criteria Approach
194
Based on experimental results, it is found that the range for the percentage of development that should be invested for testing should be 25 to 50 as shown in Figure 9. However, there is always a scope to make this range as appropriate as possible. Once the percentage is evaluated, there is need to multiply this with the development effort calculated earlier using the equation (4).
Hence the approximate software testing effort is given by
STE=P*E’
where STE represents the software testing effort, P represents the percentage and E’ is the development effort obtained earlier.
10 Case Study
The proposed case study deals with methodology discussed above to incorporate qualitative behavior of project manager occurred during the software development process. The main objective of the present case study is to evaluate approximate amount of software testing effort (STE) made during the development of software for a real project.
Project Description: If we consider one module of a project which is having user interface accepting login id and password and if
they match with the data in the database, the user is allowed to access otherwise an appropriate message should be displayed. If the member is not registered, he/she can register him/her self by clicking on the register button which displays a graphical user interface (GUI) which asks for various parameters like name, email, etc. When the user clicks on register, these data is to be updated to the database accordingly.
Solution Description: Step1: Prepare Software Requirement Specification (SRS) for module, which described under project
description. Step2: This step estimates line of source code (KLOC) for above module as well as identified type of
organization using Table 1. Step3: In this step calculate confidence value (C) for project manager. Step3.1: Suppose that this estimation is given by a person who has 8 years of experience and has done 4 similar
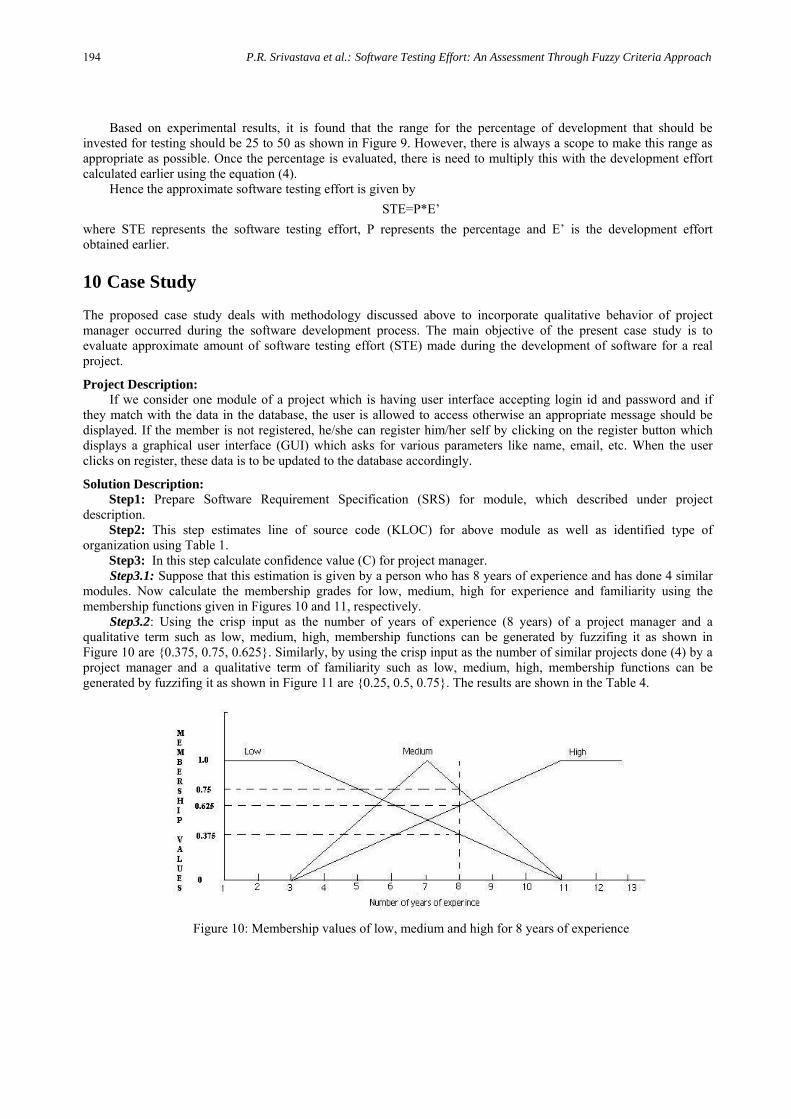
modules. Now calculate the membership grades for low, medium, high for experience and familiarity using the membership functions given in Figures 10 and 11, respectively.
Step3.2: Using the crisp input as the number of years of experience (8 years) of a project manager and a qualitative term such as low, medium, high, membership functions can be generated by fuzzifing it as shown in Figure 10 are {0.375, 0.75, 0.625}. Similarly, by using the crisp input as the number of similar projects done (4) by a project manager and a qualitative term of familiarity such as low, medium, high, membership functions can be generated by fuzzifing it as shown in Figure 11 are {0.25, 0.5, 0.75}. The results are shown in the Table 4.
Figure 10: Membership values of low, medium and high for 8 years of experience
Journal of Uncertain Systems, Vol.5, No.3, pp.183-201, 2011
195
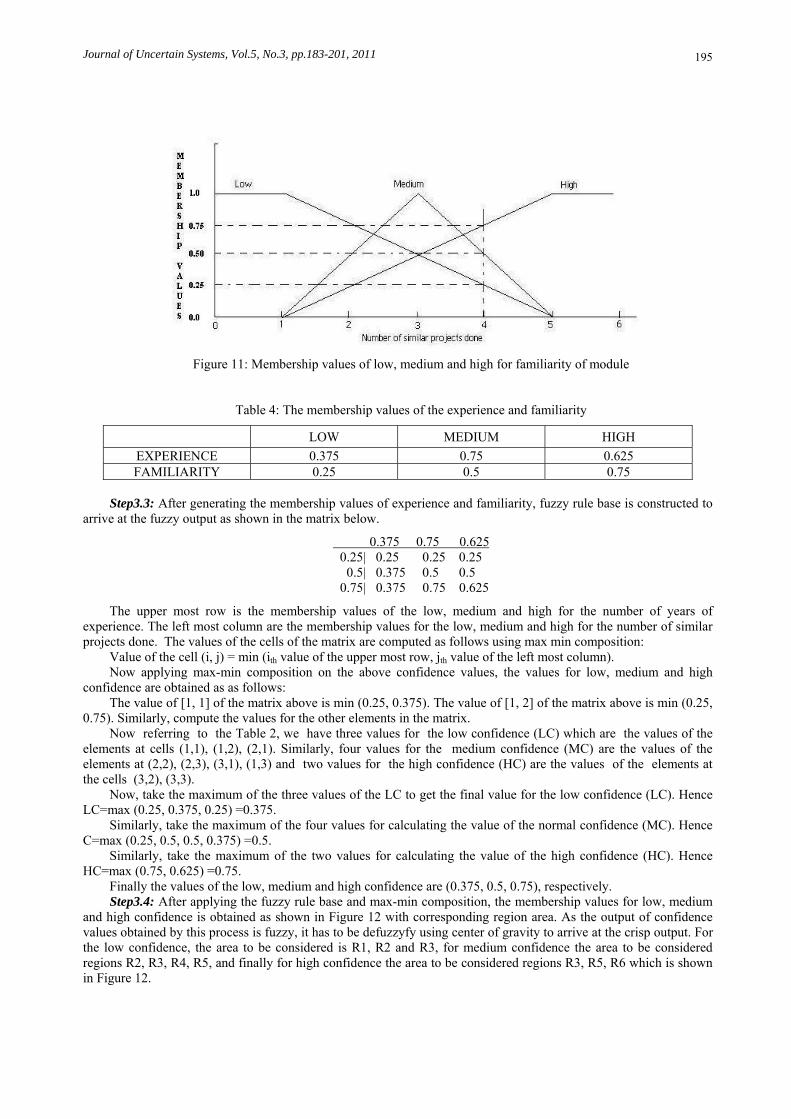
Figure 11: Membership values of low, medium and high for familiarity of module
Table 4: The membership values of the experience and familiarity
LOW MEDIUM HIGH
EXPERIENCE 0.375 0.75 0.625 FAMILIARITY 0.25 0.5 0.75
Step3.3: After generating the membership values of experience and familiarity, fuzzy rule base is constructed to
arrive at the fuzzy output as shown in the matrix below.
0.375 0.75 0.625 0.25| 0.25 0.25 0.25 0.5| 0.375 0.5 0.5
0.75| 0.375 0.75 0.625
The upper most row is the membership values of the low, medium and high for the number of years of experience. The left most column are the membership values for the low, medium and high for the number of similar projects done. The values of the cells of the matrix are computed as follows using max min composition:
Value of the cell (i, j) = min (ith value of the upper most row, jth value of the left most column). Now applying max-min composition on the above confidence values, the values for low, medium and high
confidence are obtained as as follows: The value of [1, 1] of the matrix above is min (0.25, 0.375). The value of [1, 2] of the matrix above is min (0.25,
0.75). Similarly, compute the values for the other elements in the matrix. Now referring to the Table 2, we have three values for the low confidence (LC) which are the values of the
elements at cells (1,1), (1,2), (2,1). Similarly, four values for the medium confidence (MC) are the values of the elements at (2,2), (2,3), (3,1), (1,3) and two values for the high confidence (HC) are the values of the elements at the cells (3,2), (3,3).
Now, take the maximum of the three values of the LC to get the final value for the low confidence (LC). Hence LC=max (0.25, 0.375, 0.25) =0.375.
Similarly, take the maximum of the four values for calculating the value of the normal confidence (MC). Hence C=max (0.25, 0.5, 0.5, 0.375) =0.5.
Similarly, take the maximum of the two values for calculating the value of the high confidence (HC). Hence HC=max (0.75, 0.625) =0.75.
Finally the values of the low, medium and high confidence are (0.375, 0.5, 0.75), respectively. Step3.4: After applying the fuzzy rule base and max-min composition, the membership values for low, medium
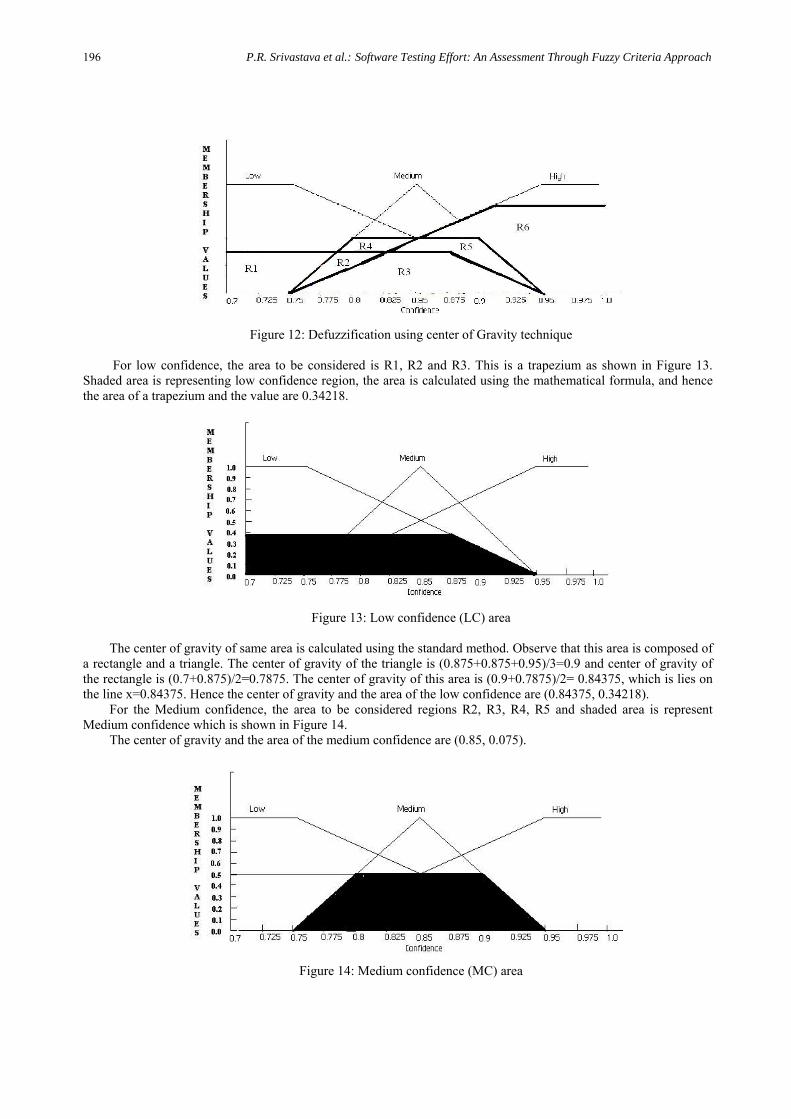
and high confidence is obtained as shown in Figure 12 with corresponding region area. As the output of confidence values obtained by this process is fuzzy, it has to be defuzzyfy using center of gravity to arrive at the crisp output. For the low confidence, the area to be considered is R1, R2 and R3, for medium confidence the area to be considered regions R2, R3, R4, R5, and finally for high confidence the area to be considered regions R3, R5, R6 which is shown in Figure 12.
P.R. Srivastava et al.: Software Testing Effort: An Assessment Through Fuzzy Criteria Approach
196
Figure 12: Defuzzification using center of Gravity technique For low confidence, the area to be considered is R1, R2 and R3. This is a trapezium as shown in Figure 13.
Shaded area is representing low confidence region, the area is calculated using the mathematical formula, and hence the area of a trapezium and the value are 0.34218.
Figure 13: Low confidence (LC) area The center of gravity of same area is calculated using the standard method. Observe that this area is composed of
a rectangle and a triangle. The center of gravity of the triangle is (0.875+0.875+0.95)/3=0.9 and center of gravity of the rectangle is (0.7+0.875)/2=0.7875. The center of gravity of this area is (0.9+0.7875)/2= 0.84375, which is lies on the line x=0.84375. Hence the center of gravity and the area of the low confidence are (0.84375, 0.34218).
For the Medium confidence, the area to be considered regions R2, R3, R4, R5 and shaded area is represent Medium confidence which is shown in Figure 14.
The center of gravity and the area of the medium confidence are (0.85, 0.075).
Figure 14: Medium confidence (MC) area
Journal of Uncertain Systems, Vol.5, No.3, pp.183-201, 2011
197
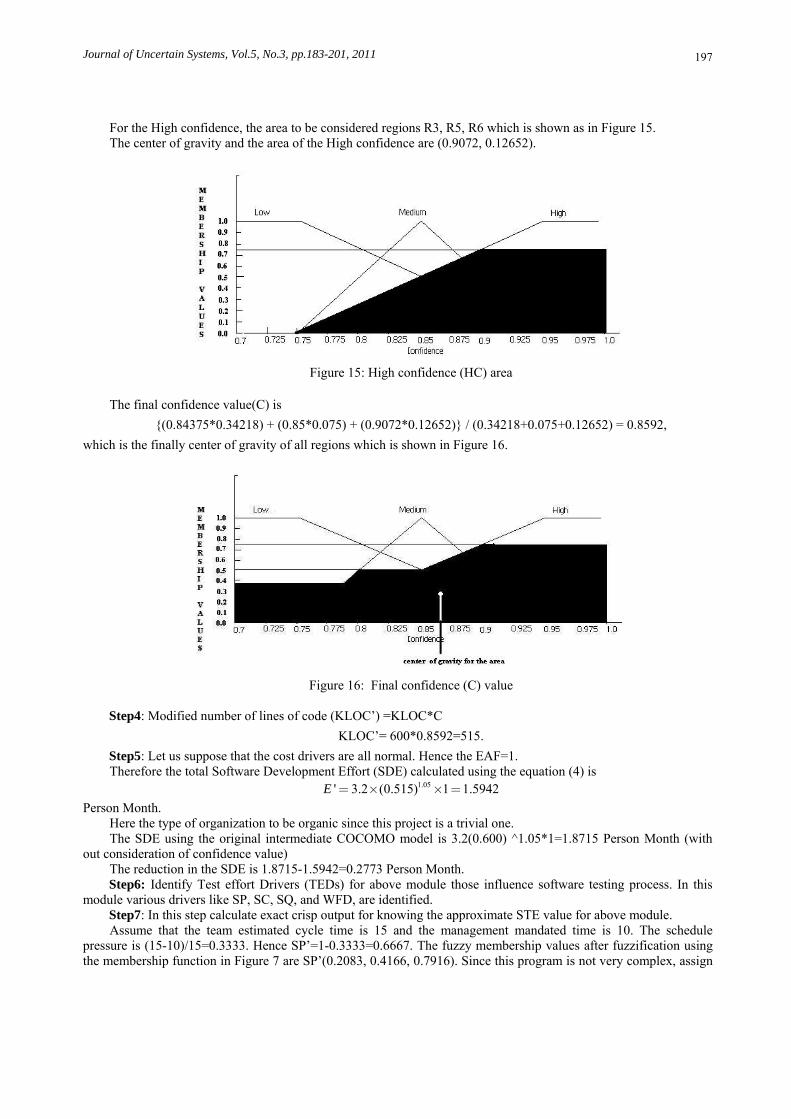
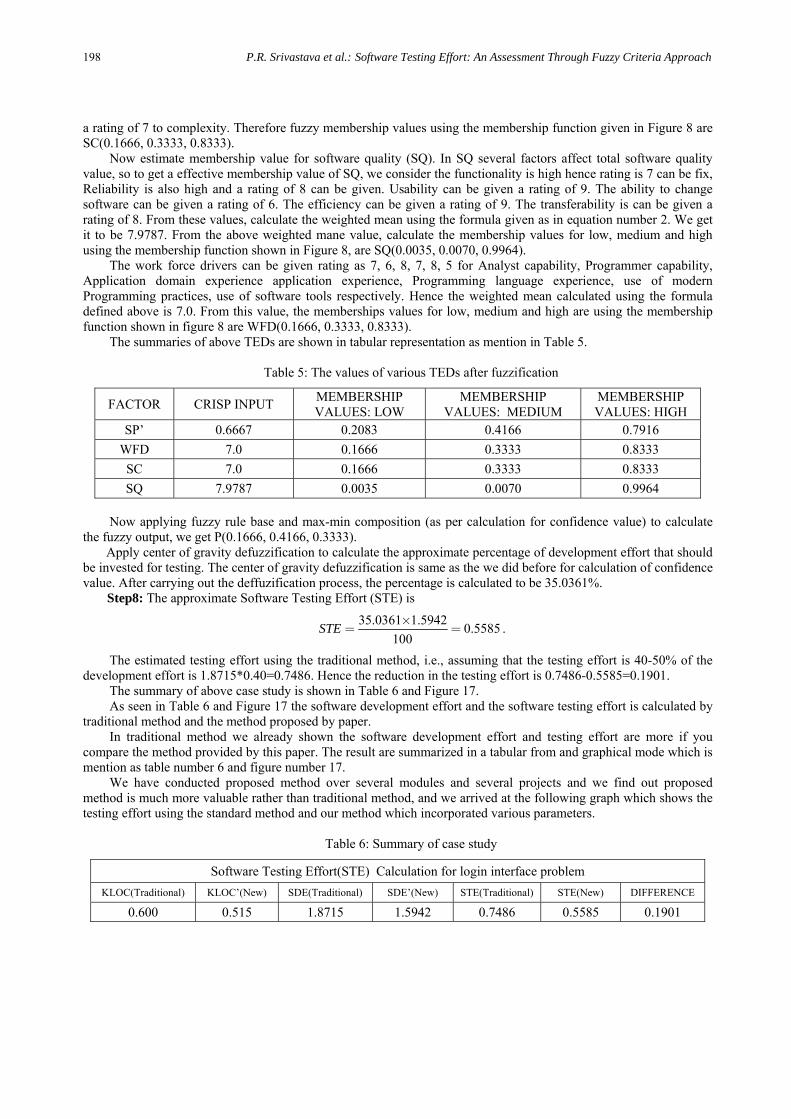
For the High confidence, the area to be considered regions R3, R5, R6 which is shown as in Figure 15. The center of gravity and the area of the High confidence are (0.9072, 0.12652).
Figure 15: High confidence (HC) area
The final confidence value(C) is
{(0.84375*0.34218) + (0.85*0.075) + (0.9072*0.12652)} / (0.34218+0.075+0.12652) = 0.8592,
which is the finally center of gravity of all regions which is shown in Figure 16.
Figure 16: Final confidence (C) value
Step4: Modified number of lines of code (KLOC’) =KLOC*C
KLOC’= 600*0.8592=515.
Step5: Let us suppose that the cost drivers are all normal. Hence the EAF=1. Therefore the total Software Development Effort (SDE) calculated using the equation (4) is
1.05' 3.2 (0.515) 1 1.5942E = ´ ´ =
Person Month. Here the type of organization to be organic since this project is a trivial one. The SDE using the original intermediate COCOMO model is 3.2(0.600) ^1.05*1=1.8715 Person Month (with
out consideration of confidence value) The reduction in the SDE is 1.8715-1.5942=0.2773 Person Month. Step6: Identify Test effort Drivers (TEDs) for above module those influence software testing process. In this
module various drivers like SP, SC, SQ, and WFD, are identified. Step7: In this step calculate exact crisp output for knowing the approximate STE value for above module. Assume that the team estimated cycle time is 15 and the management mandated time is 10. The schedule
pressure is (15-10)/15=0.3333. Hence SP’=1-0.3333=0.6667. The fuzzy membership values after fuzzification using the membership function in Figure 7 are SP’(0.2083, 0.4166, 0.7916). Since this program is not very complex, assign
P.R. Srivastava et al.: Software Testing Effort: An Assessment Through Fuzzy Criteria Approach
198
a rating of 7 to complexity. Therefore fuzzy membership values using the membership function given in Figure 8 are SC(0.1666, 0.3333, 0.8333).
Now estimate membership value for software quality (SQ). In SQ several factors affect total software quality value, so to get a effective membership value of SQ, we consider the functionality is high hence rating is 7 can be fix, Reliability is also high and a rating of 8 can be given. Usability can be given a rating of 9. The ability to change software can be given a rating of 6. The efficiency can be given a rating of 9. The transferability is can be given a rating of 8. From these values, calculate the weighted mean using the formula given as in equation number 2. We get it to be 7.9787. From the above weighted mane value, calculate the membership values for low, medium and high using the membership function shown in Figure 8, are SQ(0.0035, 0.0070, 0.9964).
The work force drivers can be given rating as 7, 6, 8, 7, 8, 5 for Analyst capability, Programmer capability, Application domain experience application experience, Programming language experience, use of modern Programming practices, use of software tools respectively. Hence the weighted mean calculated using the formula defined above is 7.0. From this value, the memberships values for low, medium and high are using the membership function shown in figure 8 are WFD(0.1666, 0.3333, 0.8333).
The summaries of above TEDs are shown in tabular representation as mention in Table 5.
Table 5: The values of various TEDs after fuzzification
FACTOR CRISP INPUT MEMBERSHIP VALUES: LOW
MEMBERSHIP VALUES: MEDIUM
MEMBERSHIP VALUES: HIGH
SP’ 0.6667 0.2083 0.4166 0.7916
WFD 7.0 0.1666 0.3333 0.8333
SC 7.0 0.1666 0.3333 0.8333
SQ 7.9787 0.0035 0.0070 0.9964 Now applying fuzzy rule base and max-min composition (as per calculation for confidence value) to calculate
the fuzzy output, we get P(0.1666, 0.4166, 0.3333). Apply center of gravity defuzzification to calculate the approximate percentage of development effort that should be invested for testing. The center of gravity defuzzification is same as the we did before for calculation of confidence value. After carrying out the deffuzification process, the percentage is calculated to be 35.0361%.
Step8: The approximate Software Testing Effort (STE) is
35.0361 1.59420.5585
100STE ´
= = .
The estimated testing effort using the traditional method, i.e., assuming that the testing effort is 40-50% of the development effort is 1.8715*0.40=0.7486. Hence the reduction in the testing effort is 0.7486-0.5585=0.1901.
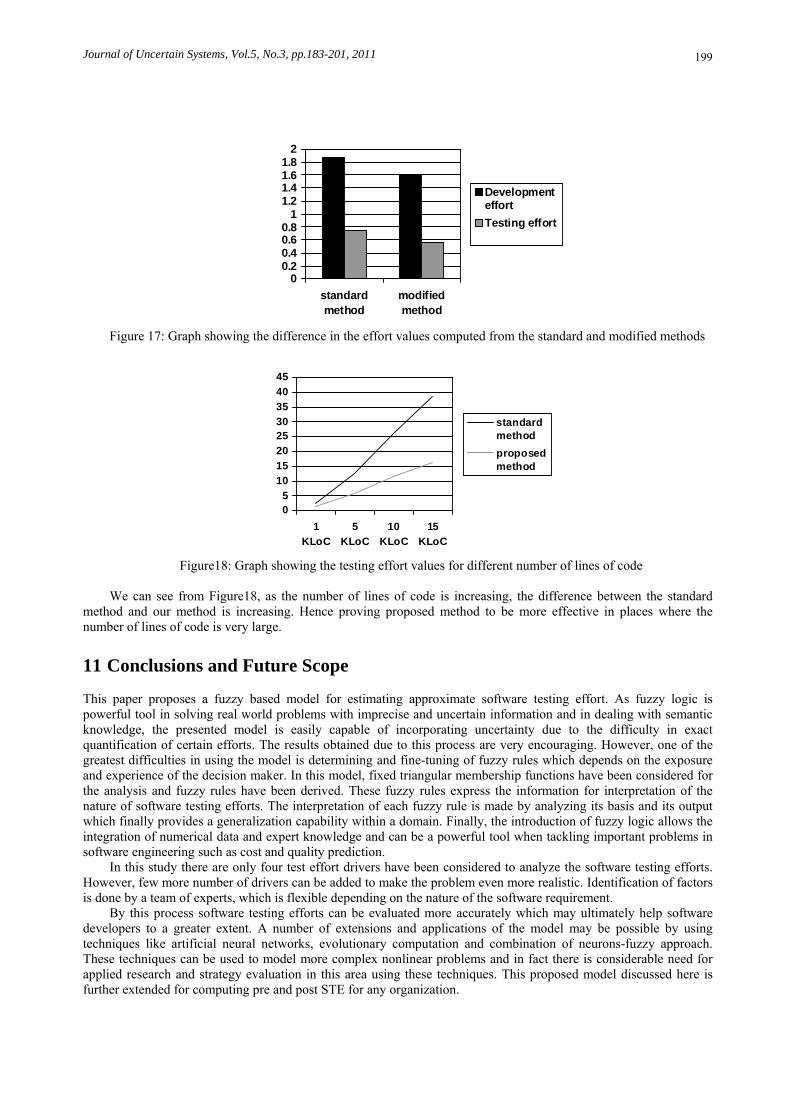
The summary of above case study is shown in Table 6 and Figure 17. As seen in Table 6 and Figure 17 the software development effort and the software testing effort is calculated by
traditional method and the method proposed by paper. In traditional method we already shown the software development effort and testing effort are more if you
compare the method provided by this paper. The result are summarized in a tabular from and graphical mode which is mention as table number 6 and figure number 17.
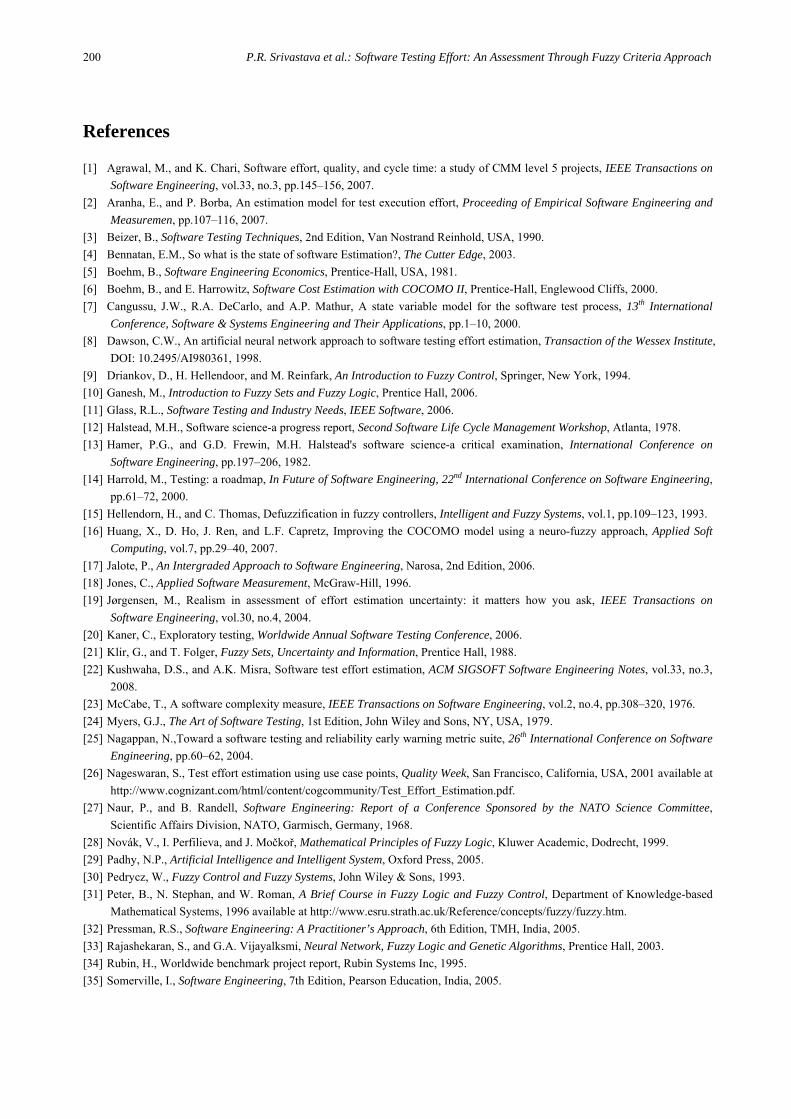
We have conducted proposed method over several modules and several projects and we find out proposed method is much more valuable rather than traditional method, and we arrived at the following graph which shows the testing effort using the standard method and our method which incorporated various parameters.
Table 6: Summary of case study
Software Testing Effort(STE) Calculation for login interface problem
KLOC(Traditional) KLOC’(New) SDE(Traditional) SDE’(New) STE(Traditional) STE(New) DIFFERENCE
0.600 0.515 1.8715 1.5942 0.7486 0.5585 0.1901
Journal of Uncertain Systems, Vol.5, No.3, pp.183-201, 2011
199
Figure 17: Graph showing the difference in the effort values computed from the standard and modified methods
Figure18: Graph showing the testing effort values for different number of lines of code We can see from Figure18, as the number of lines of code is increasing, the difference between the standard
method and our method is increasing. Hence proving proposed method to be more effective in places where the number of lines of code is very large.
11 Conclusions and Future Scope
This paper proposes a fuzzy based model for estimating approximate software testing effort. As fuzzy logic is powerful tool in solving real world problems with imprecise and uncertain information and in dealing with semantic knowledge, the presented model is easily capable of incorporating uncertainty due to the difficulty in exact quantification of certain efforts. The results obtained due to this process are very encouraging. However, one of the greatest difficulties in using the model is determining and fine-tuning of fuzzy rules which depends on the exposure and experience of the decision maker. In this model, fixed triangular membership functions have been considered for the analysis and fuzzy rules have been derived. These fuzzy rules express the information for interpretation of the nature of software testing efforts. The interpretation of each fuzzy rule is made by analyzing its basis and its output which finally provides a generalization capability within a domain. Finally, the introduction of fuzzy logic allows the integration of numerical data and expert knowledge and can be a powerful tool when tackling important problems in software engineering such as cost and quality prediction.
In this study there are only four test effort drivers have been considered to analyze the software testing efforts. However, few more number of drivers can be added to make the problem even more realistic. Identification of factors is done by a team of experts, which is flexible depending on the nature of the software requirement.
By this process software testing efforts can be evaluated more accurately which may ultimately help software developers to a greater extent. A number of extensions and applications of the model may be possible by using techniques like artificial neural networks, evolutionary computation and combination of neurons-fuzzy approach. These techniques can be used to model more complex nonlinear problems and in fact there is considerable need for applied research and strategy evaluation in this area using these techniques. This proposed model discussed here is further extended for computing pre and post STE for any organization.
05
1015202530354045
1KLoC
5KLoC
10KLoC
15KLoC
standardmethodproposedmethod
00.20.40.60.8
11.21.41.61.8
2
standardmethod
modifiedmethod
DevelopmenteffortTesting effort
P.R. Srivastava et al.: Software Testing Effort: An Assessment Through Fuzzy Criteria Approach
200
References [1] Agrawal, M., and K. Chari, Software effort, quality, and cycle time: a study of CMM level 5 projects, IEEE Transactions on
Software Engineering, vol.33, no.3, pp.145–156, 2007.
[2] Aranha, E., and P. Borba, An estimation model for test execution effort, Proceeding of Empirical Software Engineering and Measuremen, pp.107–116, 2007.
[3] Beizer, B., Software Testing Techniques, 2nd Edition, Van Nostrand Reinhold, USA, 1990.
[4] Bennatan, E.M., So what is the state of software Estimation?, The Cutter Edge, 2003.
[5] Boehm, B., Software Engineering Economics, Prentice-Hall, USA, 1981.
[6] Boehm, B., and E. Harrowitz, Software Cost Estimation with COCOMO II, Prentice-Hall, Englewood Cliffs, 2000.
[7] Cangussu, J.W., R.A. DeCarlo, and A.P. Mathur, A state variable model for the software test process, 13th International Conference, Software & Systems Engineering and Their Applications, pp.1–10, 2000.
[8] Dawson, C.W., An artificial neural network approach to software testing effort estimation, Transaction of the Wessex Institute,
DOI: 10.2495/AI980361, 1998.
[9] Driankov, D., H. Hellendoor, and M. Reinfark, An Introduction to Fuzzy Control, Springer, New York, 1994.
[10] Ganesh, M., Introduction to Fuzzy Sets and Fuzzy Logic, Prentice Hall, 2006.
[11] Glass, R.L., Software Testing and Industry Needs, IEEE Software, 2006.
[12] Halstead, M.H., Software science-a progress report, Second Software Life Cycle Management Workshop, Atlanta, 1978.
[13] Hamer, P.G., and G.D. Frewin, M.H. Halstead's software science-a critical examination, International Conference on Software Engineering, pp.197–206, 1982.
[14] Harrold, M., Testing: a roadmap, In Future of Software Engineering, 22nd International Conference on Software Engineering,
pp.61–72, 2000.
[15] Hellendorn, H., and C. Thomas, Defuzzification in fuzzy controllers, Intelligent and Fuzzy Systems, vol.1, pp.109–123, 1993.
[16] Huang, X., D. Ho, J. Ren, and L.F. Capretz, Improving the COCOMO model using a neuro-fuzzy approach, Applied Soft Computing, vol.7, pp.29–40, 2007.
[17] Jalote, P., An Intergraded Approach to Software Engineering, Narosa, 2nd Edition, 2006.
[18] Jones, C., Applied Software Measurement, McGraw-Hill, 1996.
[19] Jørgensen, M., Realism in assessment of effort estimation uncertainty: it matters how you ask, IEEE Transactions on Software Engineering, vol.30, no.4, 2004.
[20] Kaner, C., Exploratory testing, Worldwide Annual Software Testing Conference, 2006.
[21] Klir, G., and T. Folger, Fuzzy Sets, Uncertainty and Information, Prentice Hall, 1988.
[22] Kushwaha, D.S., and A.K. Misra, Software test effort estimation, ACM SIGSOFT Software Engineering Notes, vol.33, no.3,
2008.
[23] McCabe, T., A software complexity measure, IEEE Transactions on Software Engineering, vol.2, no.4, pp.308–320, 1976.
[24] Myers, G.J., The Art of Software Testing, 1st Edition, John Wiley and Sons, NY, USA, 1979.
[25] Nagappan, N.,Toward a software testing and reliability early warning metric suite, 26th International Conference on Software Engineering, pp.60–62, 2004.
[26] Nageswaran, S., Test effort estimation using use case points, Quality Week, San Francisco, California, USA, 2001 available at
http://www.cognizant.com/html/content/cogcommunity/Test_Effort_Estimation.pdf.
[27] Naur, P., and B. Randell, Software Engineering: Report of a Conference Sponsored by the NATO Science Committee,
Scientific Affairs Division, NATO, Garmisch, Germany, 1968.
[28] Novák, V., I. Perfilieva, and J. Močkoř, Mathematical Principles of Fuzzy Logic, Kluwer Academic, Dodrecht, 1999.
[29] Padhy, N.P., Artificial Intelligence and Intelligent System, Oxford Press, 2005.
[30] Pedrycz, W., Fuzzy Control and Fuzzy Systems, John Wiley & Sons, 1993.
[31] Peter, B., N. Stephan, and W. Roman, A Brief Course in Fuzzy Logic and Fuzzy Control, Department of Knowledge-based
Mathematical Systems, 1996 available at http://www.esru.strath.ac.uk/Reference/concepts/fuzzy/fuzzy.htm.
[32] Pressman, R.S., Software Engineering: A Practitioner’s Approach, 6th Edition, TMH, India, 2005.
[33] Rajashekaran, S., and G.A. Vijayalksmi, Neural Network, Fuzzy Logic and Genetic Algorithms, Prentice Hall, 2003.
[34] Rubin, H., Worldwide benchmark project report, Rubin Systems Inc, 1995.
[35] Somerville, I., Software Engineering, 7th Edition, Pearson Education, India, 2005.
Journal of Uncertain Systems, Vol.5, No.3, pp.183-201, 2011
201
[36] Srivastava, P.R., and K. Kumar, An approach toward software quality assessment, Information System, Technology and Management, Communication in Computer and Information Science Series, vol.31, pp.150–160, 2009.
[37] Srivastava, P.R., and M.P. Ray, Design and sensitivity analysis of a formal test process model, International Journal of Recent Trends in Engineering, vol.1, no.1, pp.67–72, 2009.
[38] Srivastava, P., S. Saggar, A.P. Singh, and G. Raghurama, Optimization of software testing effort using fuzzy logic,
International Journal of Computer Sciences and Engineering Systems, vol.3, no.3, pp.179–184, 2009.
[39] Thayer, R.H., IEEE Software Engineering Standards for Students, Wiley-IEEE Computer Society Press, 2007.
[40] Xu, S., and V. Rajlich, Cognitive process during program debugging, 3rd IEEE International Conference on Cognitive Informatics, pp.176–182, 2004.
[41] Zadeh, L.A., Fuzzy sets, Information and Control, vol.8, pp.338–353, 1965.
[42] http://www.csbdu.in/econtent/Software%20Engineering/Unit_II.pdf.