Embed Size (px)
Citation preview
Instruments
Software Profiling – SoSe 2013
Simon Völcker
Instruments | Software Profiling | June 3rd, 2013
2
Agenda
■ About Instruments
■ Features□ Templates for common tasks
□ Customization for not-so-common tasks
■ Demo□ Usage of Grand Central Dispatch
■ Limitations
■ Conclusion
Instruments | Software Profiling | June 3rd, 2013
3
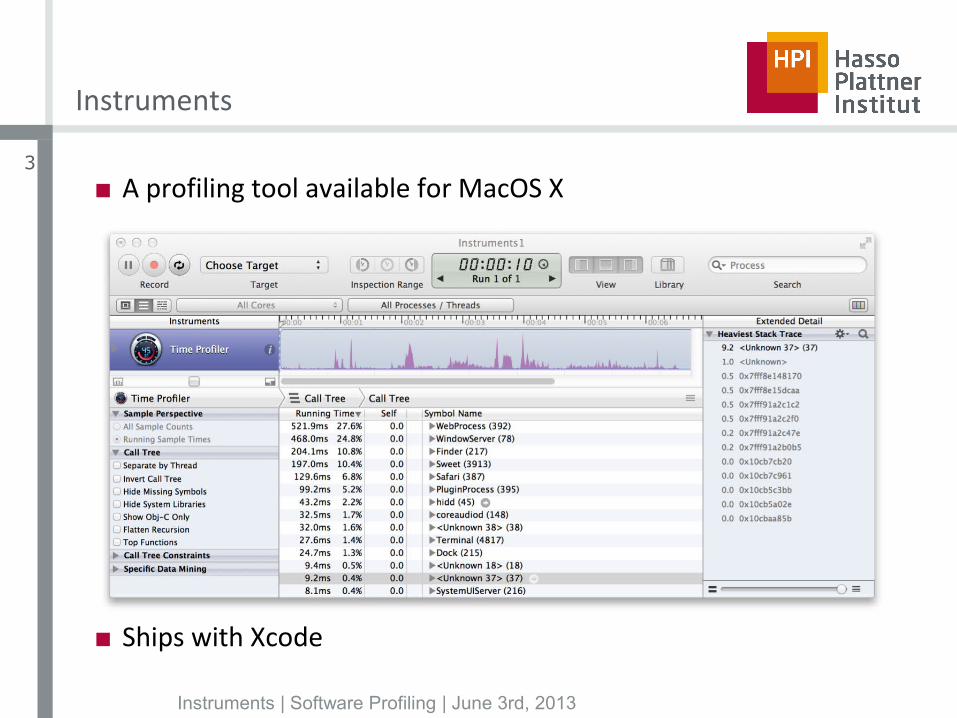
Instruments
■ A profiling tool available for MacOS X
■ Ships with Xcode
Instruments | Software Profiling | June 3rd, 2013
4
Instruments
■ Target platforms:
□ iOS, iOS Simulator, Mac OS X
■ Profiling subjects:
□ CPU activity of processes and threads
□ Memory allocation/release, GC, memory leaks
□ File reads, writes, locks
□ Network activity and traffic
□ User input events (keyboard, mouse)
□ Graphics (OpenGL)
Instruments | Software Profiling | June 3rd, 2013
5
Instruments
■ Some data is collected via DTrace
□ Ported to Mac OS in v10.5 (Leopard)
■ Recap on DTrace:
□ Presented 3 weeks ago
□ Powerful dynamic tracing framework
□ Uses probes – provider:module:function:name
□ When a probe fires, a script is run
□ Scripts usually aggregate samples and print text
Instruments | Software Profiling | June 3rd, 2013
6
■ DTrace is not available on iOS
□ Another source of data must exist
□ Sadly, no documentation on these internals
■ Profiling an iOS-App from XCode provides a hint:
□ „Build for profiling“ → Instrumentation approach
Instruments
Instruments | Software Profiling | June 3rd, 2013
7
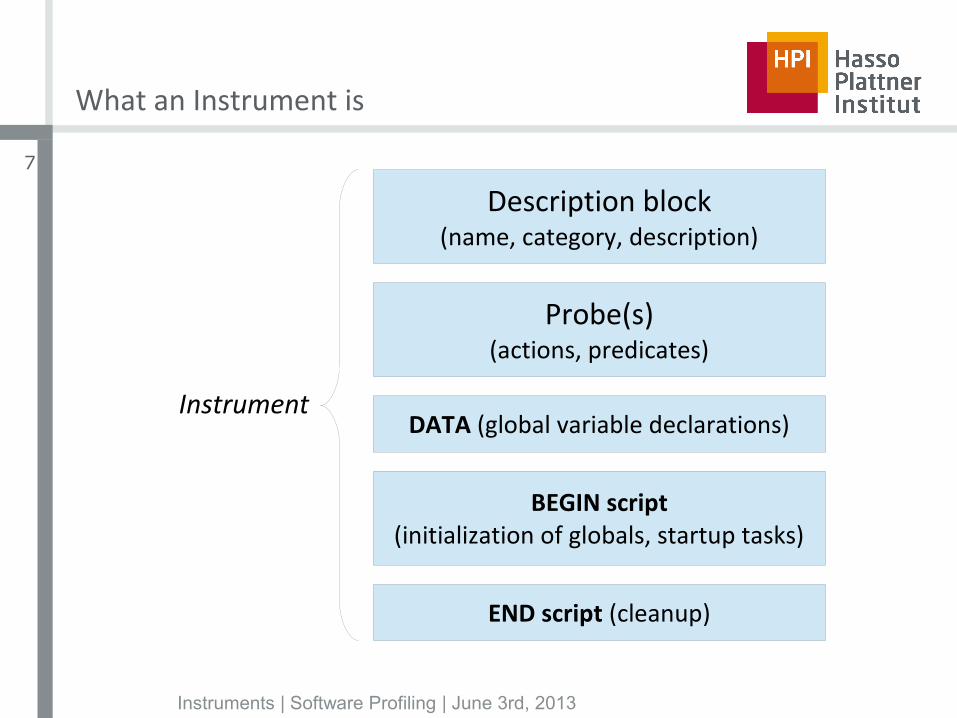
What an Instrument is
Description block(name, category, description)
Probe(s)(actions, predicates)
DATA (global variable declarations)
BEGIN script(initialization of globals, startup tasks)
END script (cleanup)
Instrument

Instruments | Software Profiling | June 3rd, 2013
8
Templates
Instruments | Software Profiling | June 3rd, 2013
9
Instruments
■ Rich Template library for common profiling Tasks
■ Grouped by category
□ Memory
□ CPU
□ I/O Activity
□ File System
□ Graphics
□ Behavior
■ Grouped by target platform
□ iOS, iOS Simulator, Mac OS X
Instruments | Software Profiling | June 3rd, 2013
10
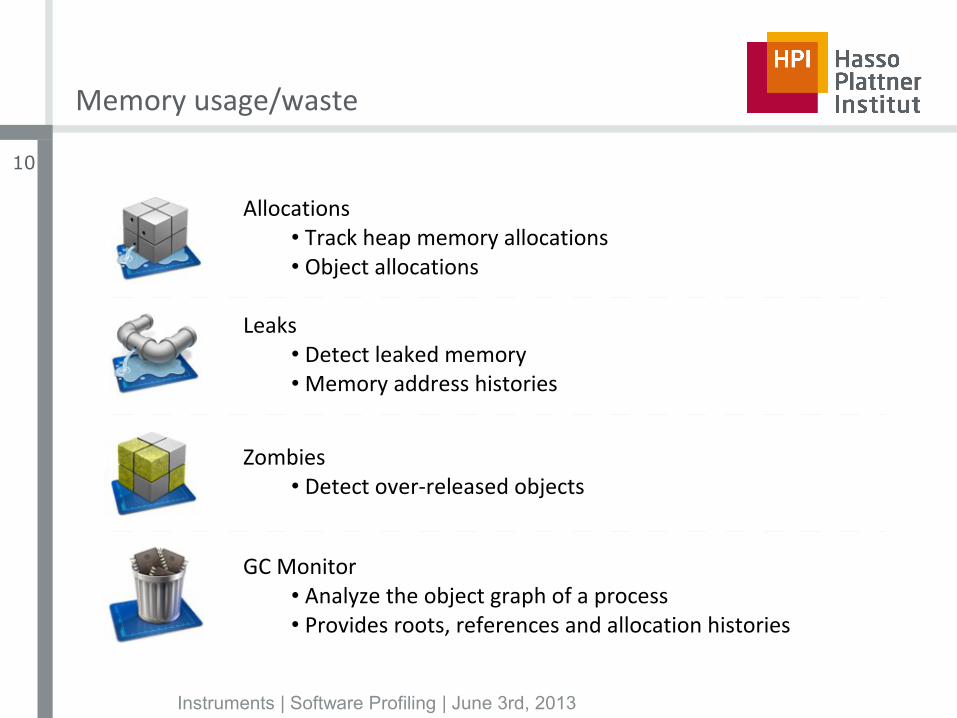
Memory usage/waste
Allocations• Track heap memory allocations• Object allocations
Leaks• Detect leaked memory• Memory address histories
Zombies• Detect over-released objects
GC Monitor• Analyze the object graph of a process• Provides roots, references and allocation histories
Instruments | Software Profiling | June 3rd, 2013
11
CPU usage
Time profiler• Sample processes in regular intervals• Low overhead
Multicore• Analyze multicore performance• Threads states, dispatch queues, block usage
Dispatch• Monitor dispatch queue activity (GCD)• Record block invocations and their duration
Instruments | Software Profiling | June 3rd, 2013
12
I/O activity + File system
File activity• Monitor file/directory activity• File open/close, permission modification• Directory creation, file moves, ...
Network• Analyze the use of TCP/IP and UDP/IP connections• Bytes sent/received; connection types, IPs• Packets, roundtrip staticstics, ...
Core data• Monitor file system activity• Fetches, cache misses, saves
Instruments | Software Profiling | June 3rd, 2013
13
Graphics
Core animation• Graphics performance (FPS)• CPU usage
OpenGL ES• Device Utilization, GL wait time• Texture count, GL context count, …• Count batches, enables, disables, flushes, GL calls
Instruments | Software Profiling | June 3rd, 2013
14
Behavior
UI Recorder• Record user interface events• Can be played back to reproduce a state
Sudden termination• Mac OS mechanism to support faster shutdown• Checks if sudden termination is supported by an app
Instruments | Software Profiling | June 3rd, 2013
15
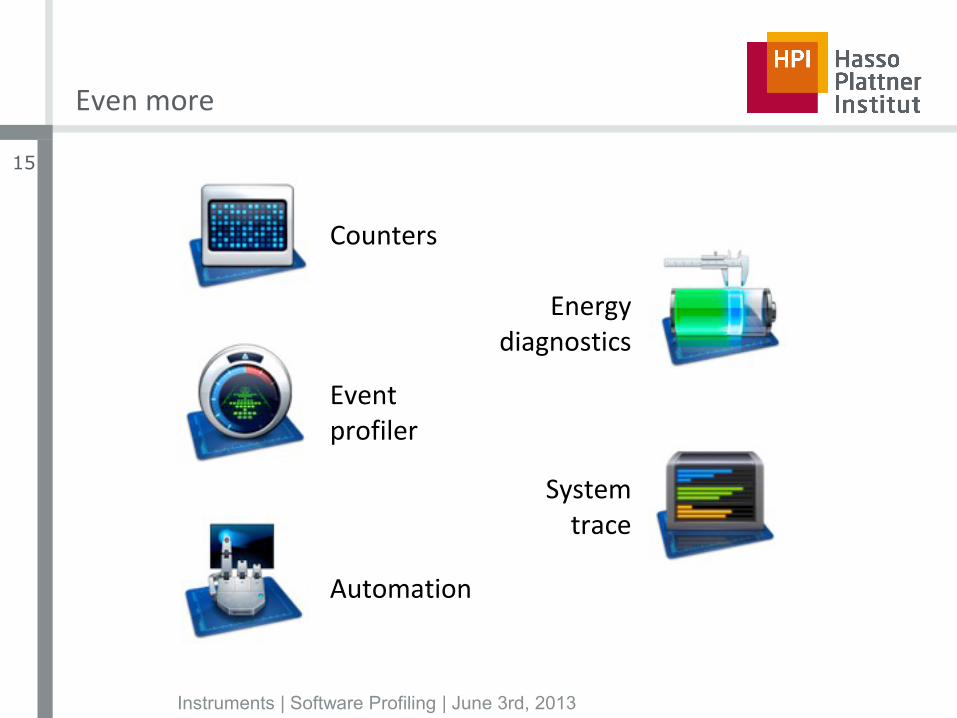
Even more
Counters
Eventprofiler
Energy diagnostics
Systemtrace
Automation
Instruments | Software Profiling | June 3rd, 2013
16
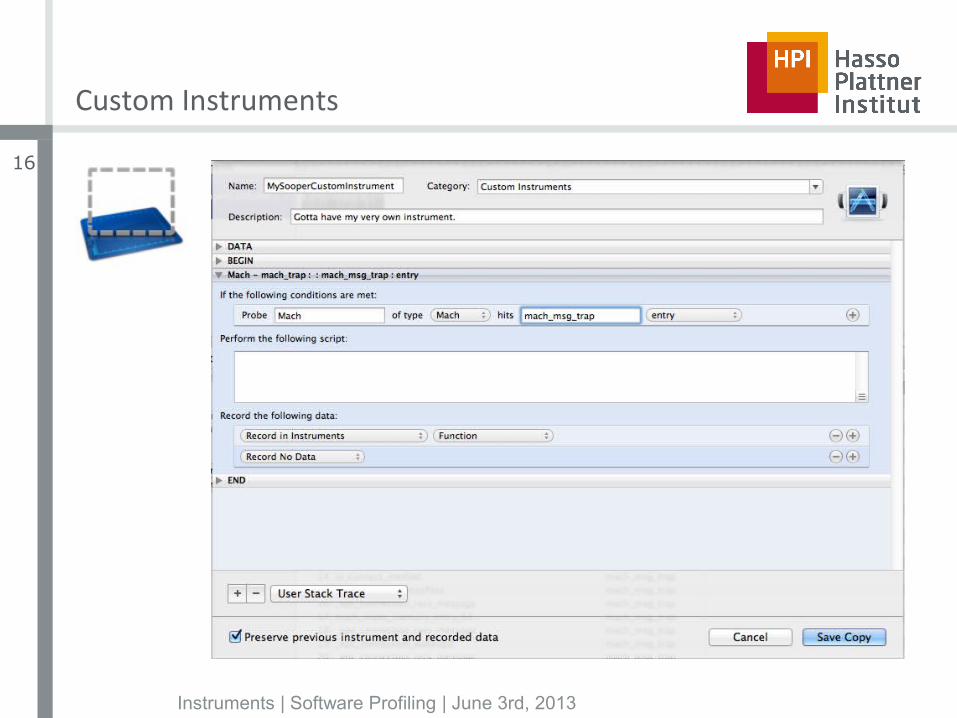
Custom Instruments
Instruments | Software Profiling | June 3rd, 2013
17
Custom Instruments
■ Essentially a GUI, wrapping DTrace-scripts
□ Allows to make use of the full flexibility of DTrace
□ Is handy if an application defines its own DTrace provider
■ Many providers available on Mac OS X
□ Including syscall, dtrace, mach_trap, fbt, sched
□ Use dtrace CLI to find out: /usr/sbin/dtrace
■ Not possible on iOS (DTrace missing)

Instruments | Software Profiling | June 3rd, 2013
18
Demo(i.e., screenshots...)
Instruments | Software Profiling | June 3rd, 2013
19
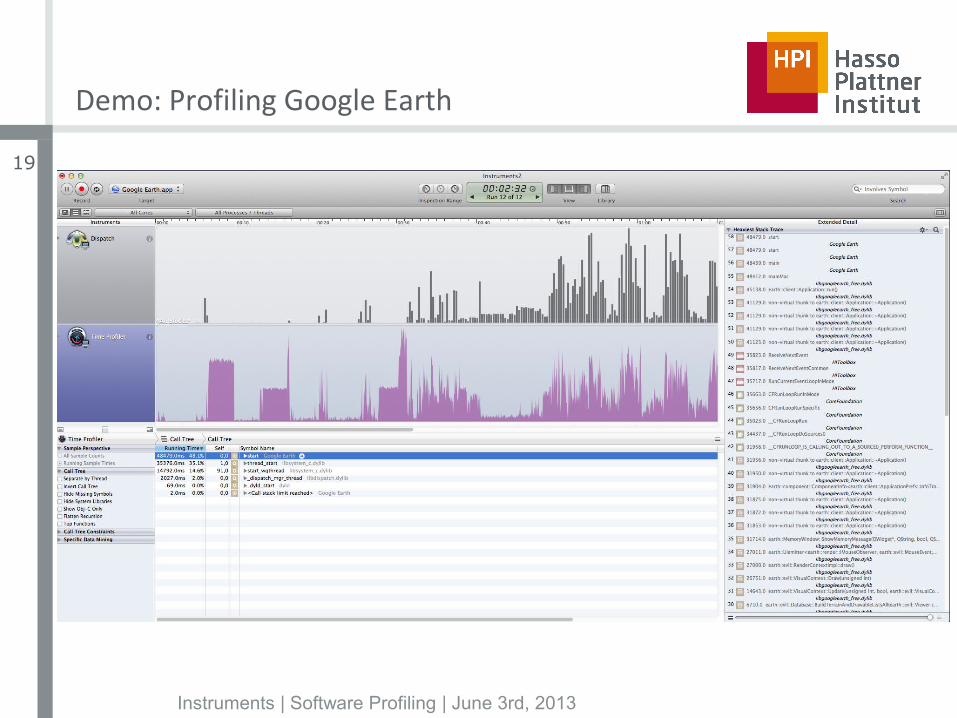
Demo: Profiling Google Earth
Instruments | Software Profiling | June 3rd, 2013
20
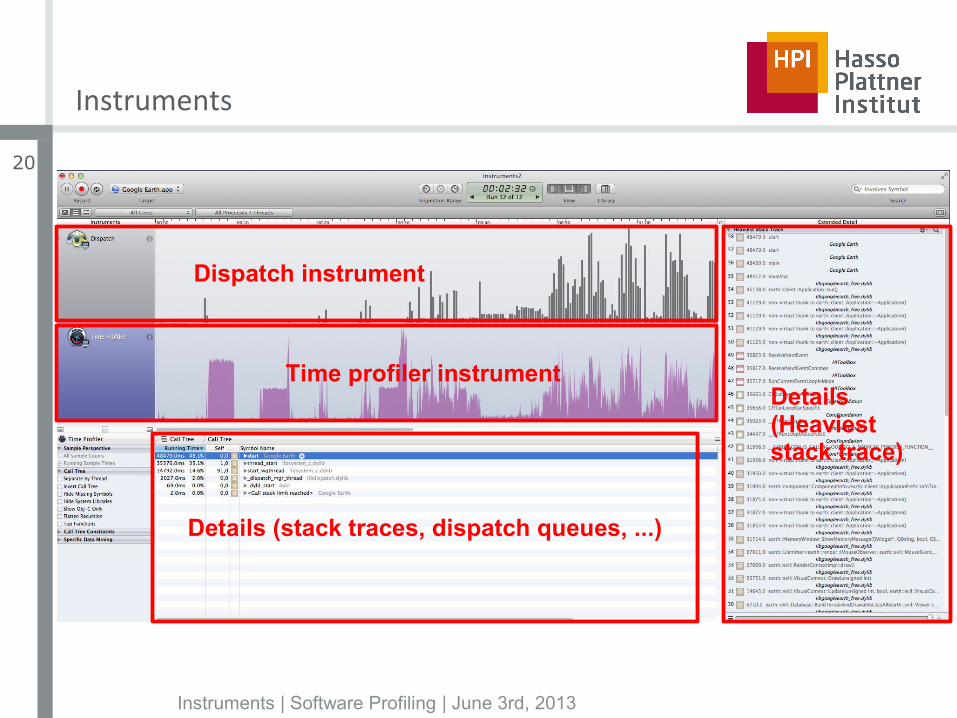
Instruments
Dispatch instrument
Time profiler instrument
Details (stack traces, dispatch queues, ...)
Details(Heavieststack trace)
Instruments | Software Profiling | June 3rd, 2013
21
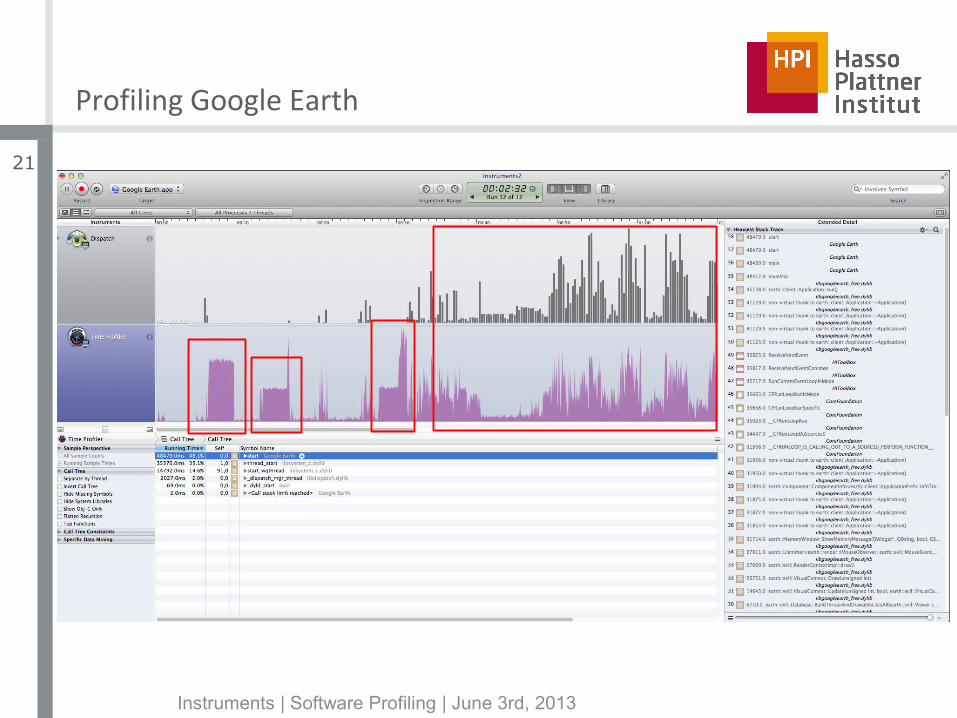
Profiling Google Earth
Instruments | Software Profiling | June 3rd, 2013
22
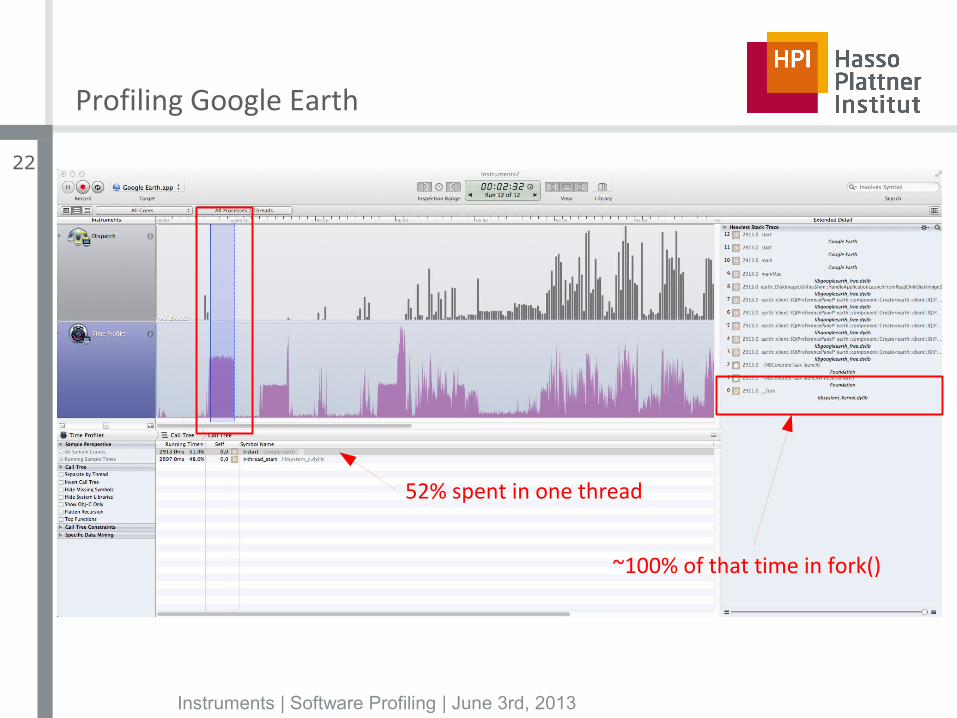
Profiling Google Earth
52% spent in one thread
~100% of that time in fork()
Instruments | Software Profiling | June 3rd, 2013
23
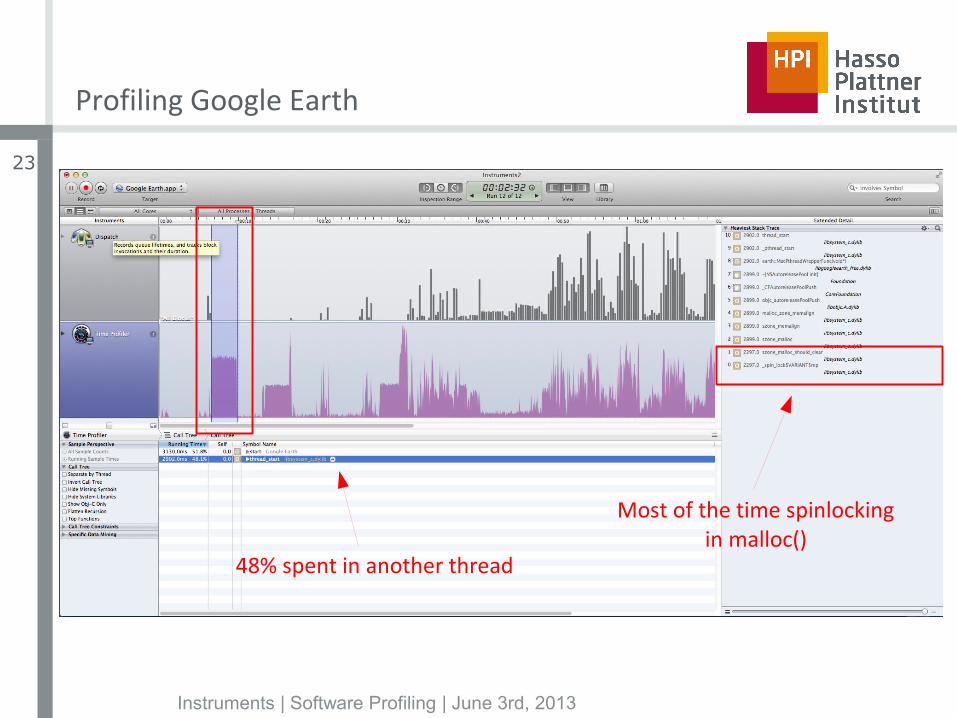
Profiling Google Earth
48% spent in another thread
Most of the time spinlockingin malloc()
Instruments | Software Profiling | June 3rd, 2013
24
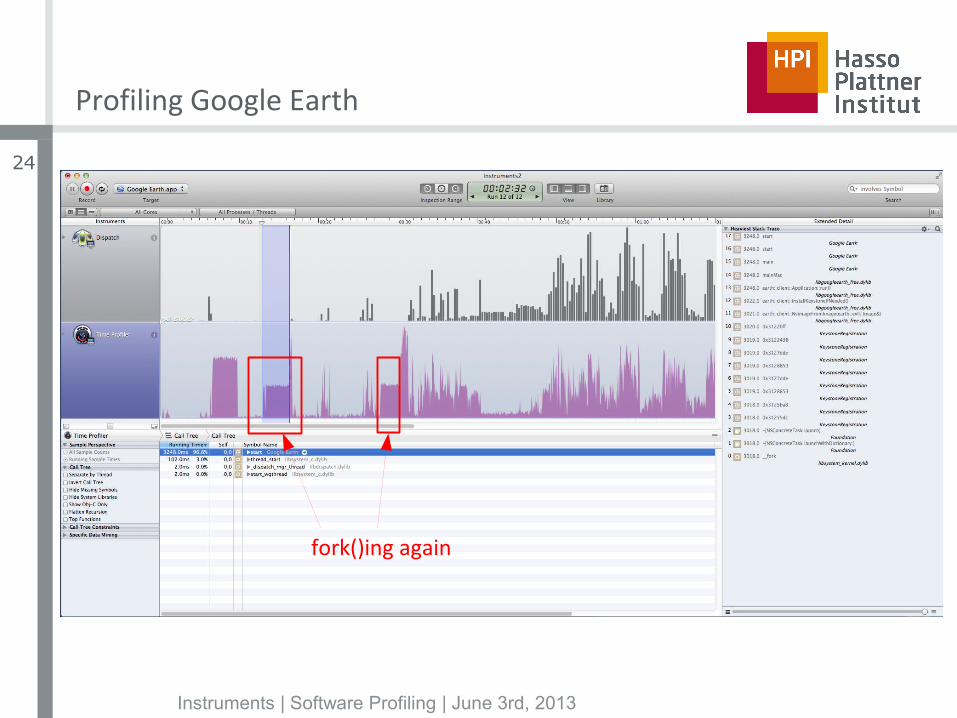
Profiling Google Earth
fork()ing again
Instruments | Software Profiling | June 3rd, 2013
25
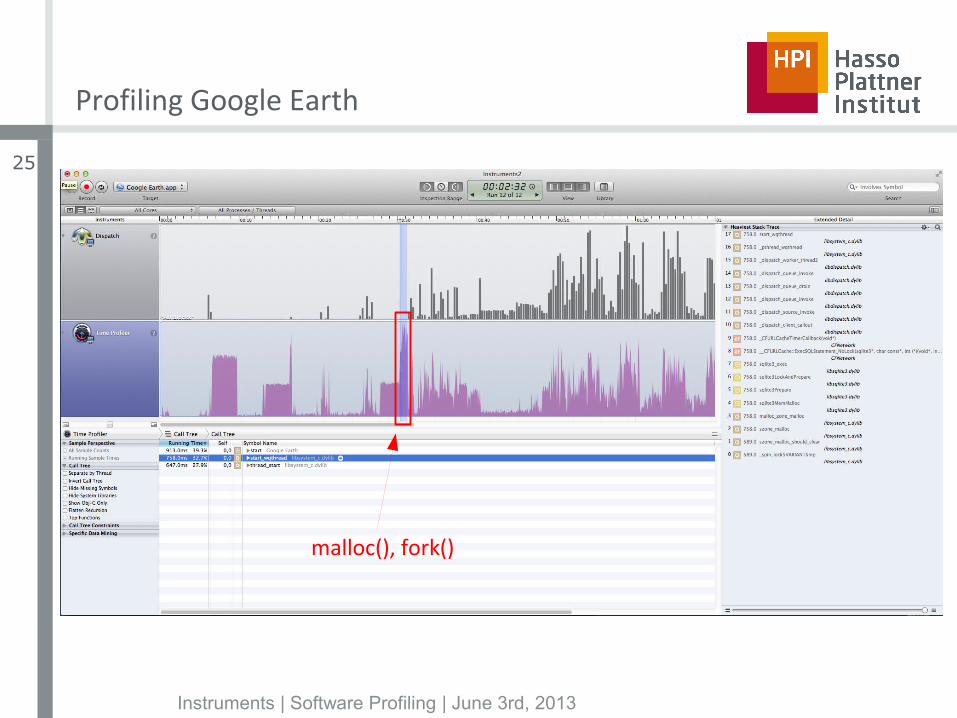
Profiling Google Earth
malloc(), fork()
Instruments | Software Profiling | June 3rd, 2013
26
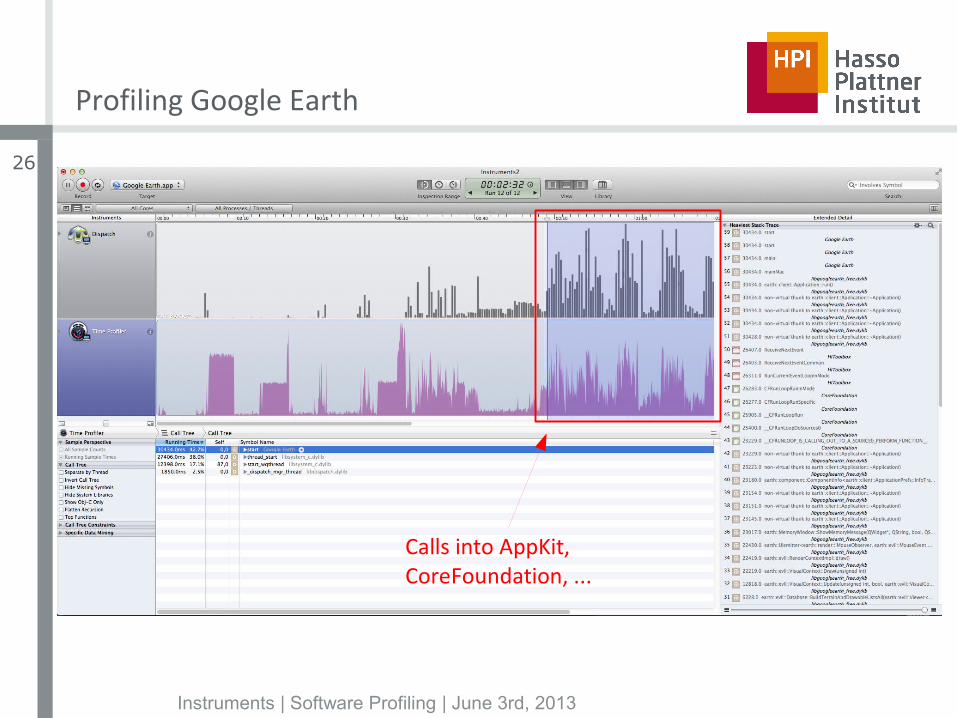
Profiling Google Earth
Calls into AppKit, CoreFoundation, ...
Instruments | Software Profiling | June 3rd, 2013
27
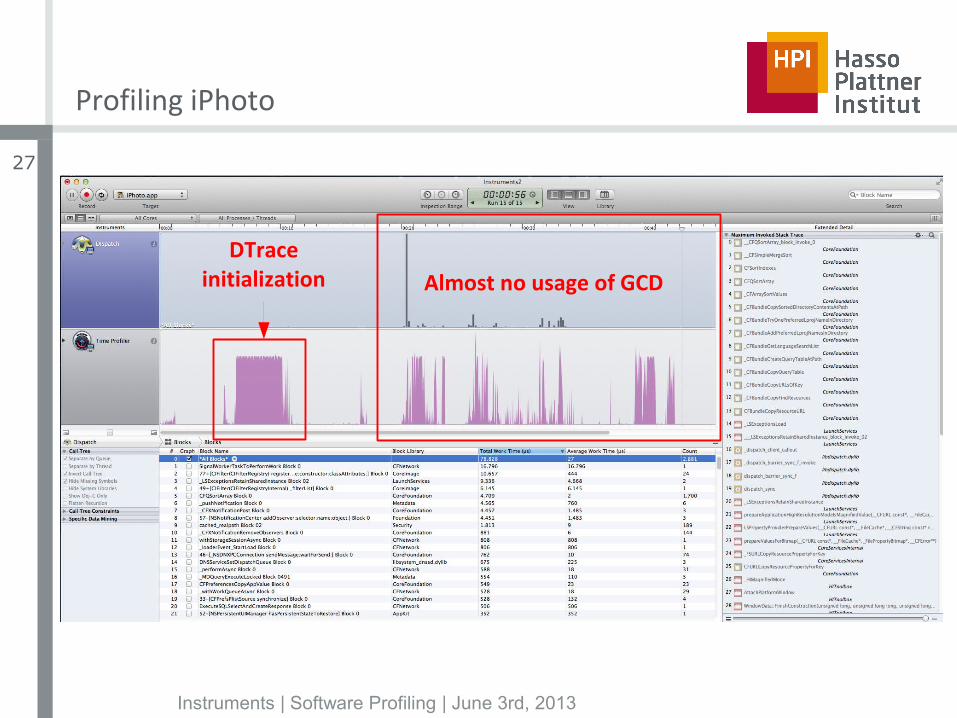
Profiling iPhoto
Almost no usage of GCDDTrace
initialization
Instruments | Software Profiling | June 3rd, 2013
28
LimitationsJust one, actually
Instruments | Software Profiling | June 3rd, 2013
29
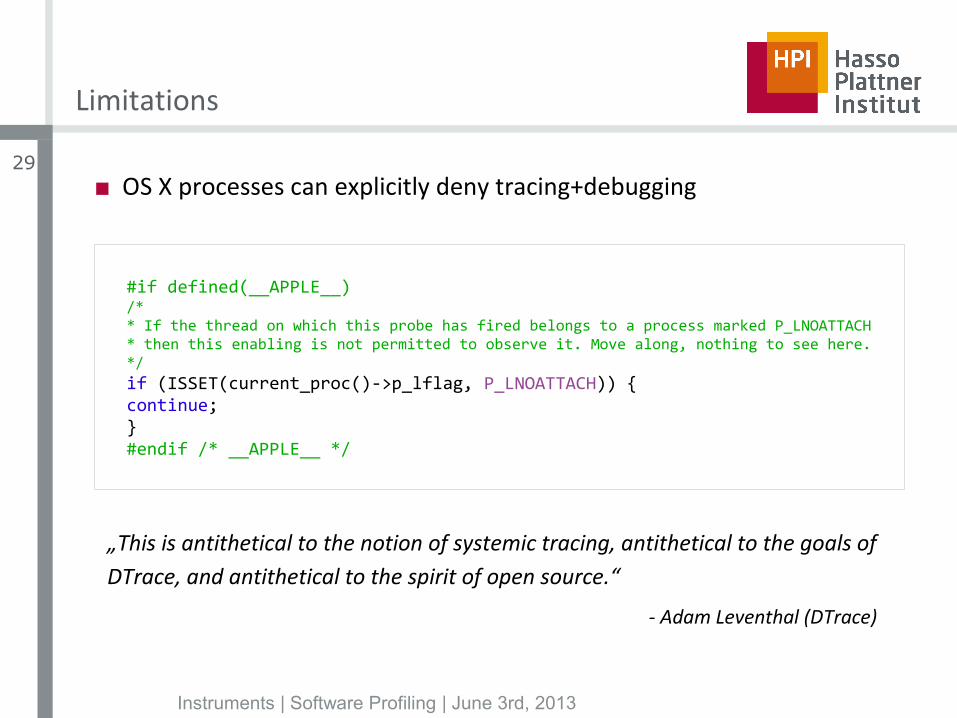
Limitations
■ OS X processes can explicitly deny tracing+debugging
#if defined(__APPLE__)/** If the thread on which this probe has fired belongs to a process marked P_LNOATTACH* then this enabling is not permitted to observe it. Move along, nothing to see here.*/if (ISSET(current_proc()->p_lflag, P_LNOATTACH)) {continue;}#endif /* __APPLE__ */
„This is antithetical to the notion of systemic tracing, antithetical to the goals of DTrace, and antithetical to the spirit of open source.“
- Adam Leventhal (DTrace)
Instruments | Software Profiling | June 3rd, 2013
30
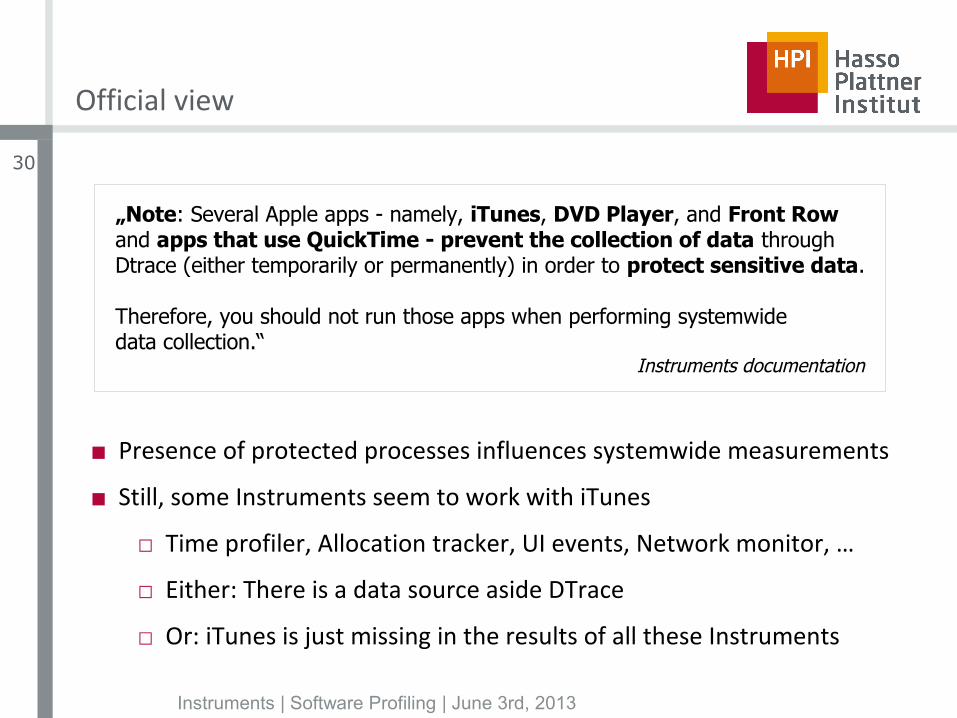
Official view
■ Presence of protected processes influences systemwide measurements
■ Still, some Instruments seem to work with iTunes
□ Time profiler, Allocation tracker, UI events, Network monitor, …
□ Either: There is a data source aside DTrace
□ Or: iTunes is just missing in the results of all these Instruments
„Note: Several Apple apps - namely, iTunes, DVD Player, and Front Rowand apps that use QuickTime - prevent the collection of data throughDtrace (either temporarily or permanently) in order to protect sensitive data.
Therefore, you should not run those apps when performing systemwidedata collection.“
Instruments documentation

Instruments | Software Profiling | June 3rd, 2013
31
Conclusion
Instruments | Software Profiling | June 3rd, 2013
32
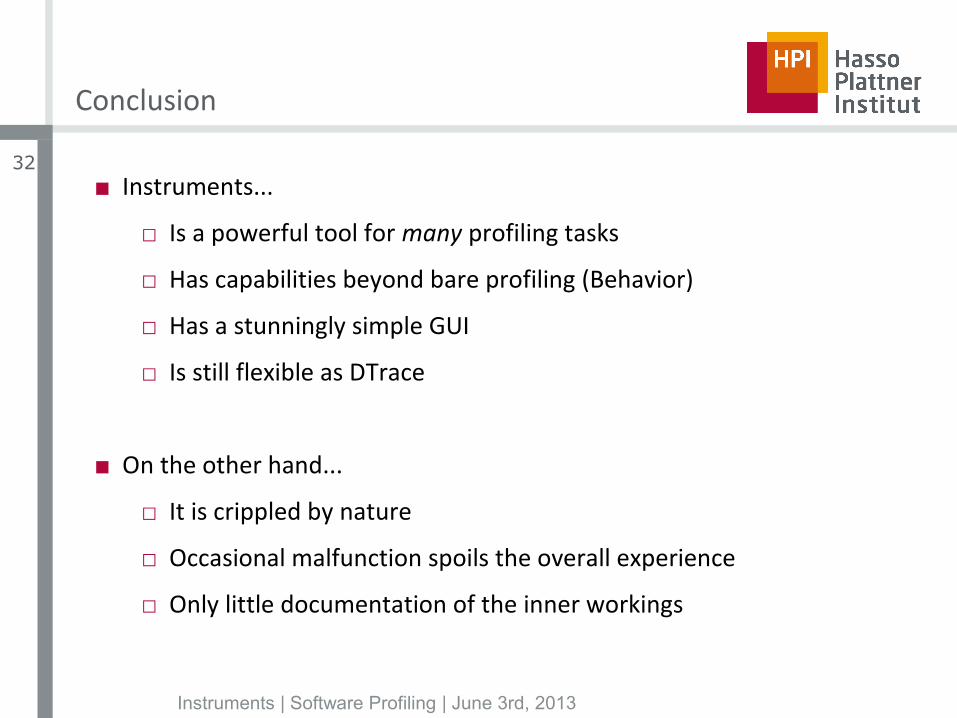
Conclusion
■ Instruments...
□ Is a powerful tool for many profiling tasks
□ Has capabilities beyond bare profiling (Behavior)
□ Has a stunningly simple GUI
□ Is still flexible as DTrace
■ On the other hand...
□ It is crippled by nature
□ Occasional malfunction spoils the overall experience
□ Only little documentation of the inner workings
Instruments | Software Profiling | June 3rd, 2013
33
References
- http://dtrace.org/blogs/ahl/2008/01/18/mac-os-x-and-the-missing-probes/
- http://en.wikipedia.org/wiki/DTrace [April 7, 2013]
- http://en.wikipedia.org/wiki/Instruments_(application) [April 12, 2013]
- http://developer.apple.com/library/mac/[...]/Introduction.html
- http://www.raywenderlich.com/23037/how-to-use-instruments-in-xcode
- http://www.symantec.com/business/support/index?page=content&id=HOWTO36824
- Mac OS X and iOS Internals: To the Apple's Core by Levin, Jonathan [10/2012]
- ECE459: Programming for Performance (patricklam.ca/p4p/2011/notes/pdf/L04.pdf)