Embed Size (px)
Citation preview
Software Modeling & Analysis
- Introduction to SASD- Structured Analysis
Lecturer: JUNBEOM [email protected]
References
• Modern Structured Analysis, Edward Yourdon, 1989.• Introduction to System Analysis and Design: a Structured
Approach, Penny A. Kendall, 1996.
• Zhou Qun, Kendra Hamilton, and Ibrahim Jadalowen (2002). Structured Analysis and Structured Design (SASD) - Class Presentaionhttp://pages.cpsc.ucalgary.ca/~jadalow/seng613/Group/
Konkuk University 2
Structured Analysis
• Structured analysis is [Kendall 1996]
– a set of techniques and graphical tools– that allow the analysts to develop a new kind of system specification– that are easily understandable to the users. – Analysts work primarily with their wits, pencil and paper.
• SASD– Structured Analysis and Structured Design
Konkuk University 3
History of SASD
• Developed in the late 1970s by DeMarco, Yourdon and Constantine after the emergence of structured programming.
• IBM incorporated SASD into their development cycle in the late 1970s and early 1980s.
• Yourdon published the book “Modern Structured Analysis” in 1989.
• The availability of CASE tools in 1990s enabled analysts to develop and modify the graphical SASD models.
Konkuk University 4
Philosophy of SASD
• Analysts attempt to divide large, complex problems into smaller, more easily handled ones. “Divide and Conquer”
• Top-Down approach
• Functional view of the problem
• Analysts use graphics to illustrate their ideas whenever possible.
• Analysts must keep a written record.
Konkuk University 5
Philosophy of SASD
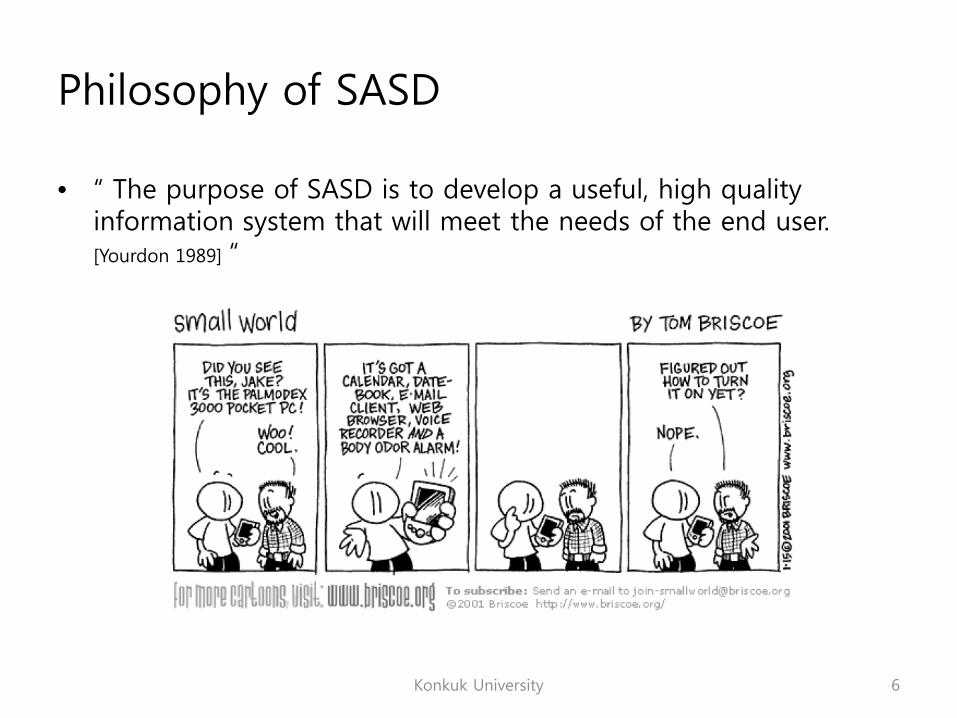
• “ The purpose of SASD is to develop a useful, high quality information system that will meet the needs of the end user.[Yourdon 1989] “
Konkuk University 6
Goals of SASD
• Improve quality and reduce the risk of system failure.
• Establish concrete requirements specifications and complete requirements documentations.
• Focus on reliability, flexibility and maintainability of system.
Konkuk University 7
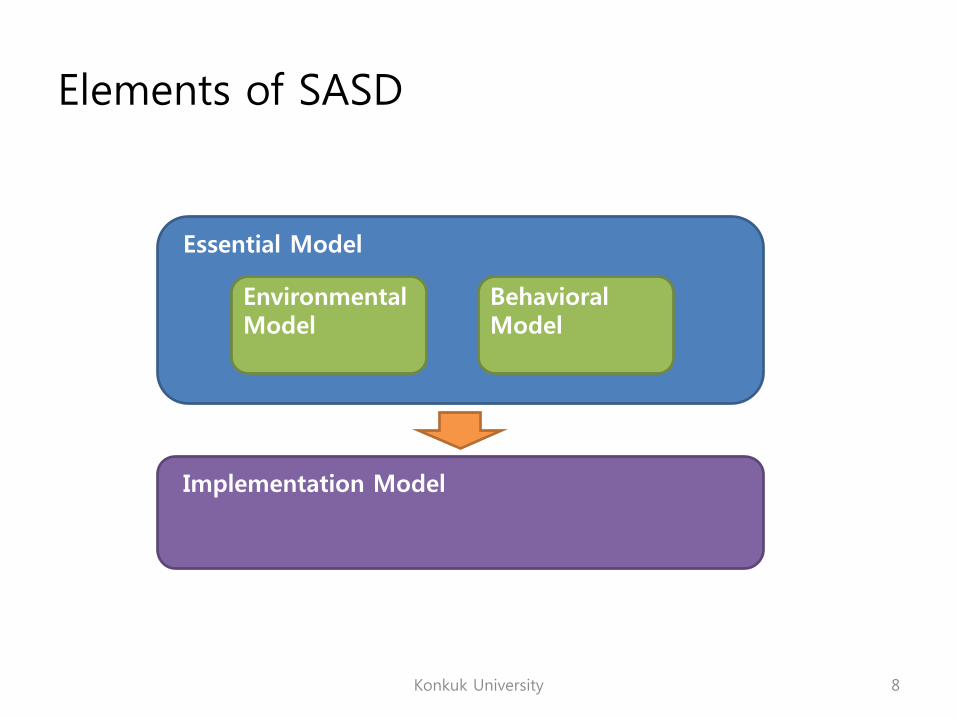
Elements of SASD
Konkuk University 8
Essential Model
EnvironmentalModel
BehavioralModel
Implementation Model
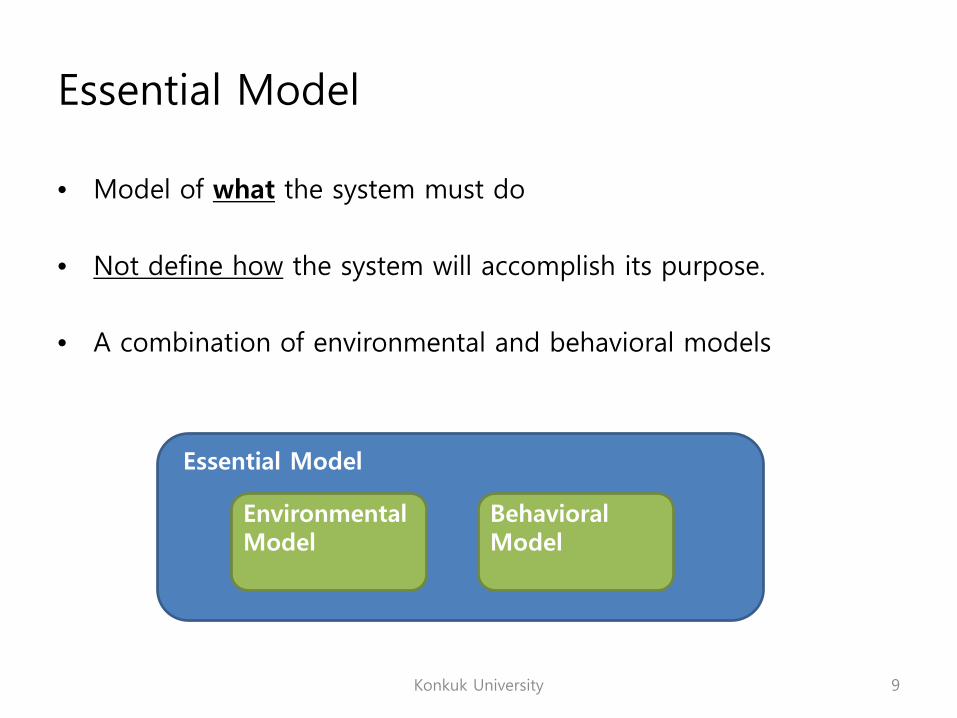
Essential Model
• Model of what the system must do
• Not define how the system will accomplish its purpose.
• A combination of environmental and behavioral models
Konkuk University 9
Essential Model
EnvironmentalModel
BehavioralModel
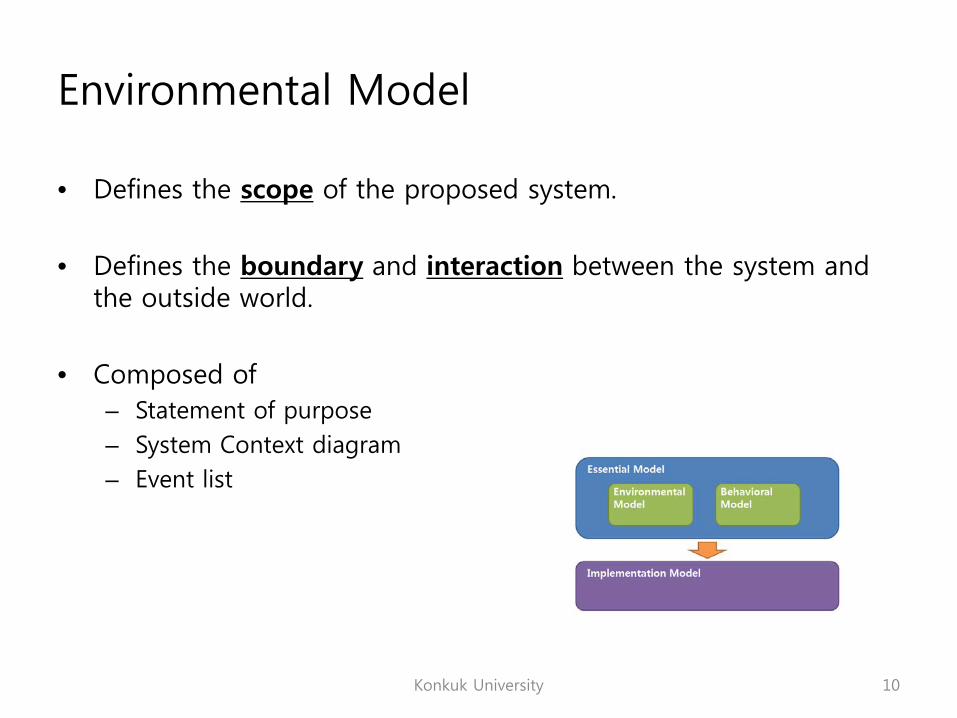
Environmental Model
• Defines the scope of the proposed system.
• Defines the boundary and interaction between the system and the outside world.
• Composed of – Statement of purpose– System Context diagram– Event list
Konkuk University 10
Behavioral Model
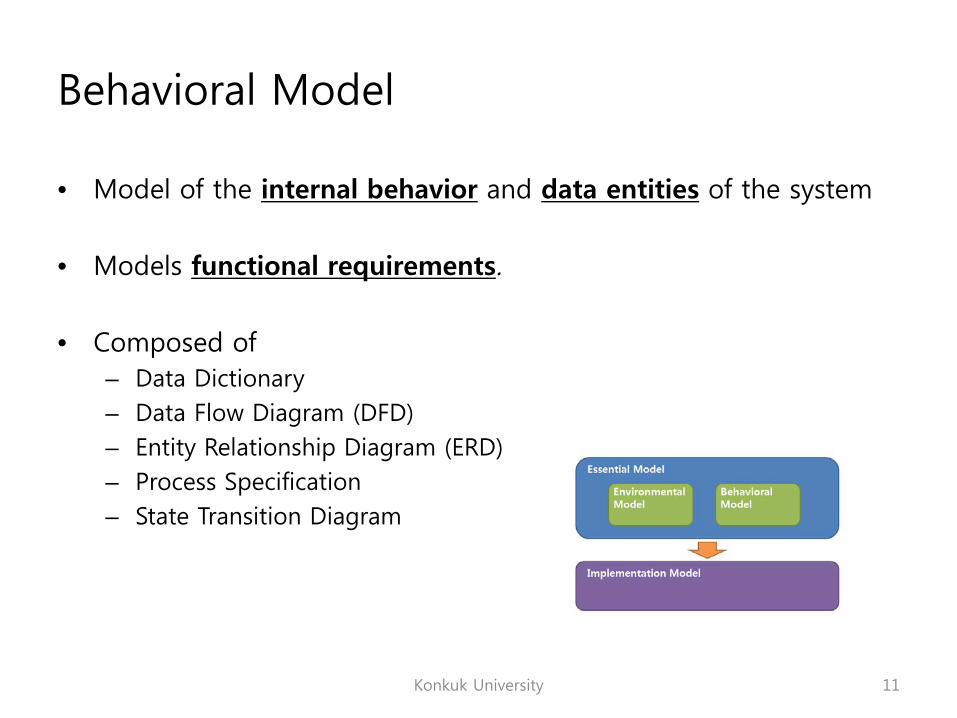
• Model of the internal behavior and data entities of the system
• Models functional requirements.
• Composed of – Data Dictionary– Data Flow Diagram (DFD)– Entity Relationship Diagram (ERD)– Process Specification– State Transition Diagram
Konkuk University 11
Implementation Model
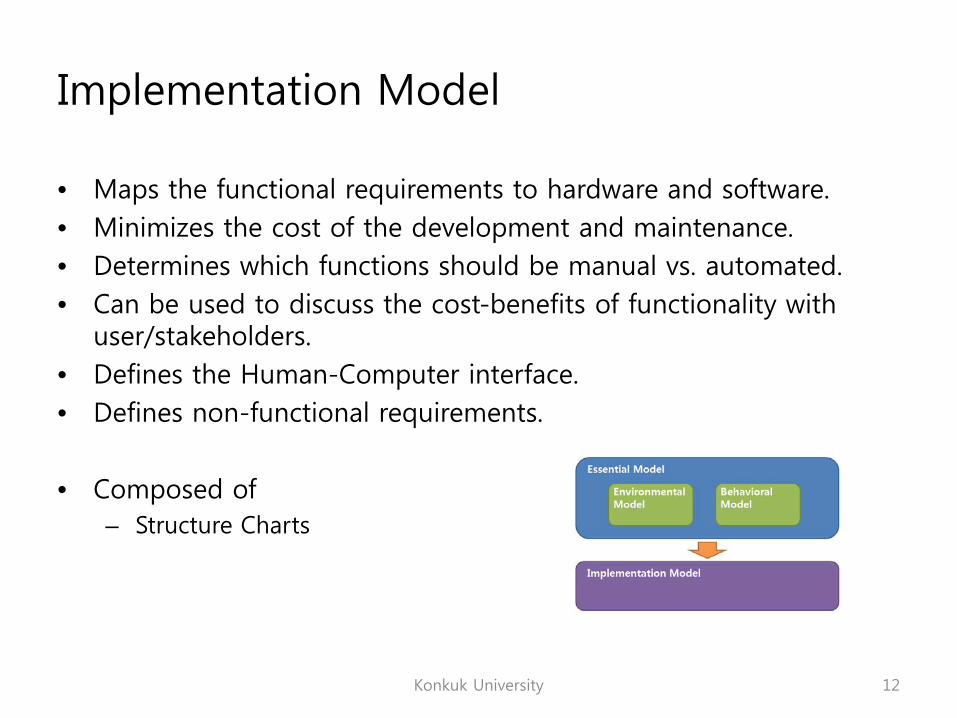
• Maps the functional requirements to hardware and software.• Minimizes the cost of the development and maintenance.• Determines which functions should be manual vs. automated.• Can be used to discuss the cost-benefits of functionality with
user/stakeholders.• Defines the Human-Computer interface.• Defines non-functional requirements.
• Composed of – Structure Charts
Konkuk University 12
SASD Process
Konkuk University 13
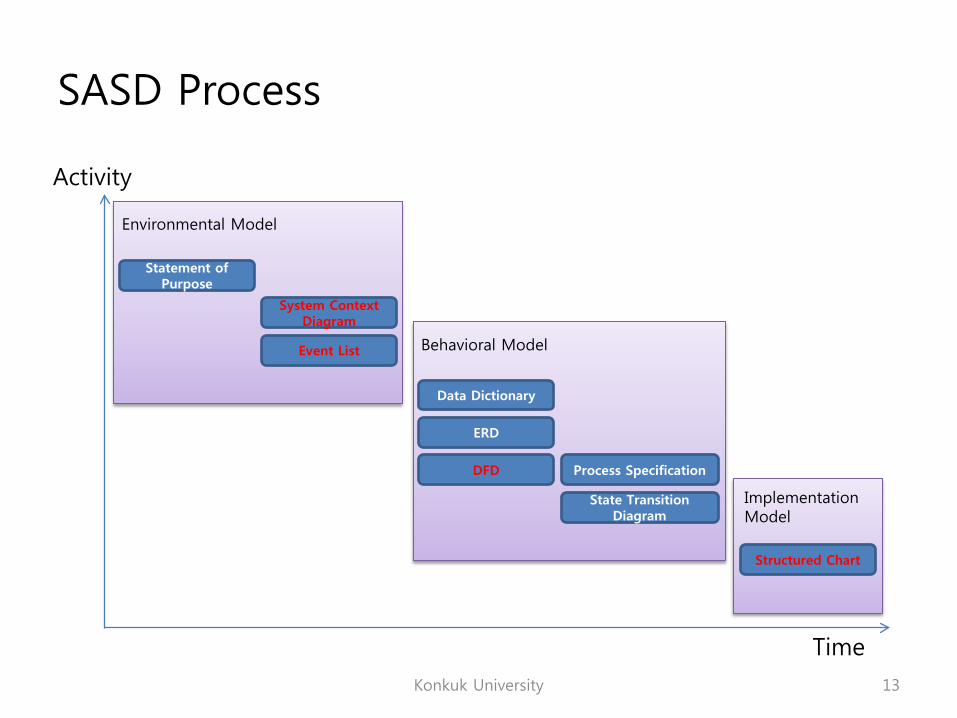
Activity
Time
Statement of Purpose
System Context Diagram
Event List
Data Dictionary
ERD
DFD Process Specification
State Transition Diagram
Structured Chart
Environmental Model
Behavioral Model
Implementation Model
Statement of Purpose
• A clear and concise textual description of the purpose for the system to develop
• It should be deliberately vague.• It is intended for top level management, user management and
others who are not directly involved in the system.
Konkuk University 14
Statement of Purpose – RVC Example
Konkuk University 15
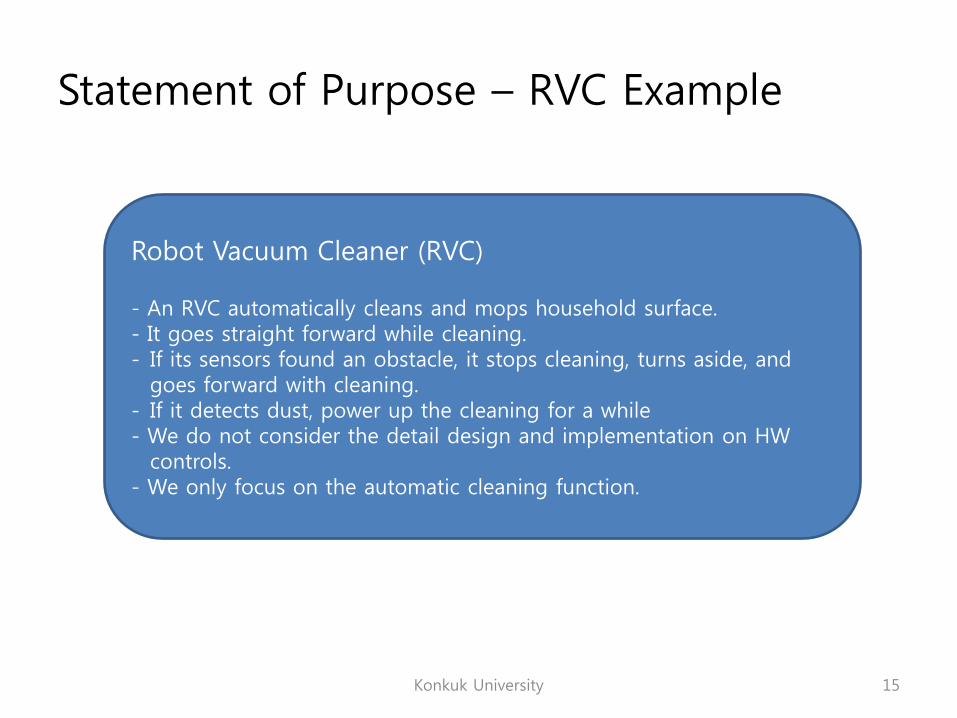
Robot Vacuum Cleaner (RVC)
- An RVC automatically cleans and mops household surface.- It goes straight forward while cleaning.- If its sensors found an obstacle, it stops cleaning, turns aside, and
goes forward with cleaning. - If it detects dust, power up the cleaning for a while- We do not consider the detail design and implementation on HW
controls. - We only focus on the automatic cleaning function.
System Context Diagram
• Highlights the boundary between the system and outside world.• Highlights the people, organizations and outside systems that
interact with the system under development.
• A special case of DFD
Konkuk University 16
System Context Diagram - Notation
Konkuk University 17
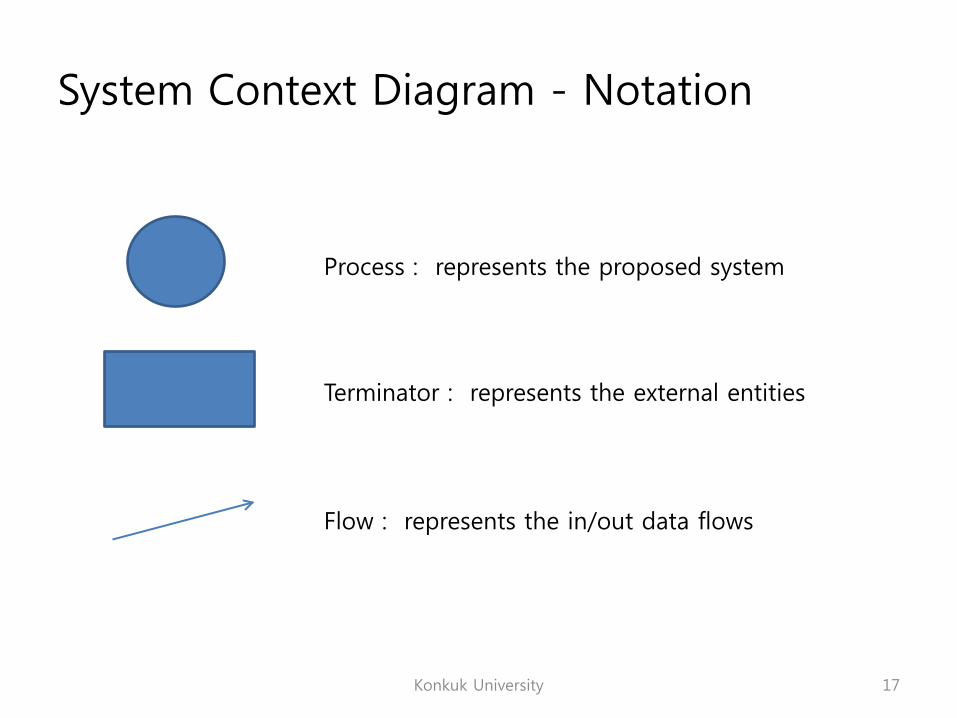
Process : represents the proposed system
Terminator : represents the external entities
Flow : represents the in/out data flows
System Context Diagram – RVC Example
Konkuk University 18
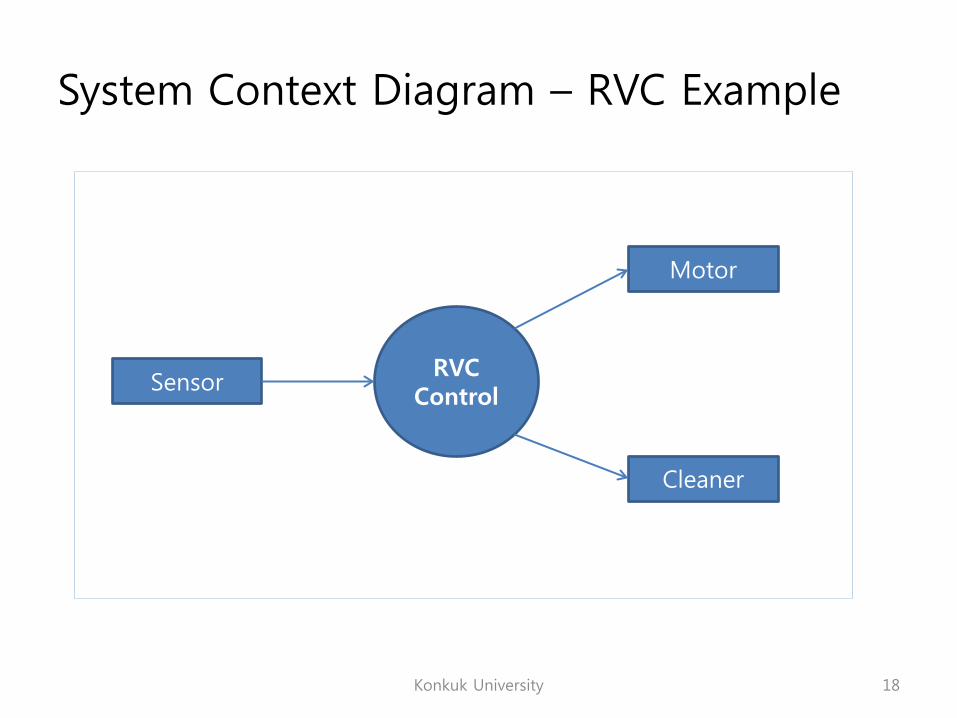
RVC Control
Sensor
Motor
Cleaner
Event List
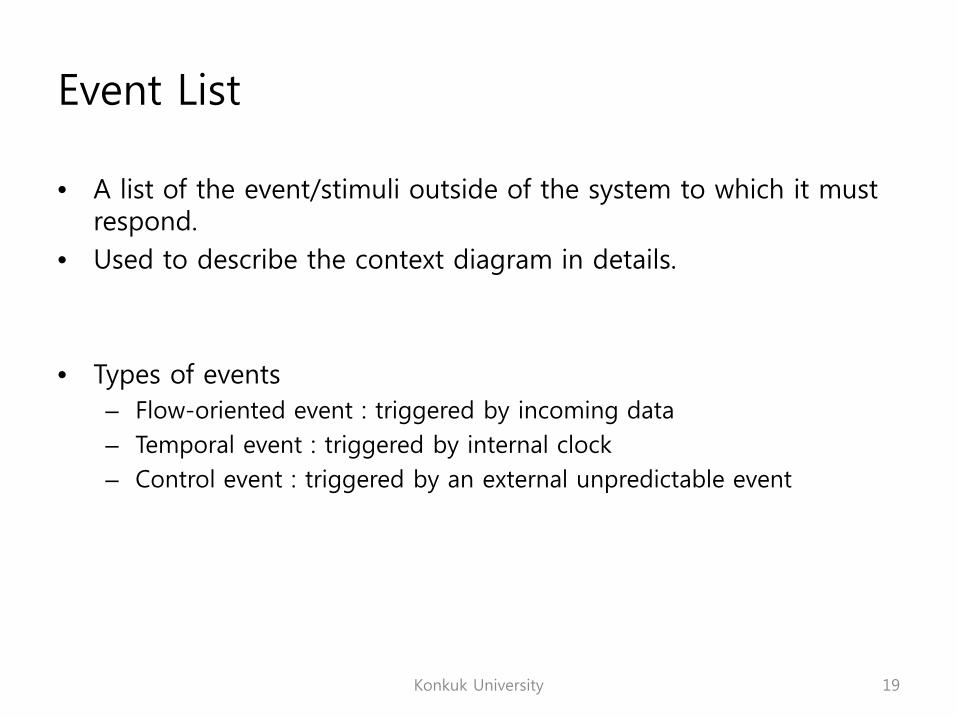
• A list of the event/stimuli outside of the system to which it must respond.
• Used to describe the context diagram in details.
• Types of events– Flow-oriented event : triggered by incoming data– Temporal event : triggered by internal clock– Control event : triggered by an external unpredictable event
Konkuk University 19
Event List – RVC Example
Konkuk University 20
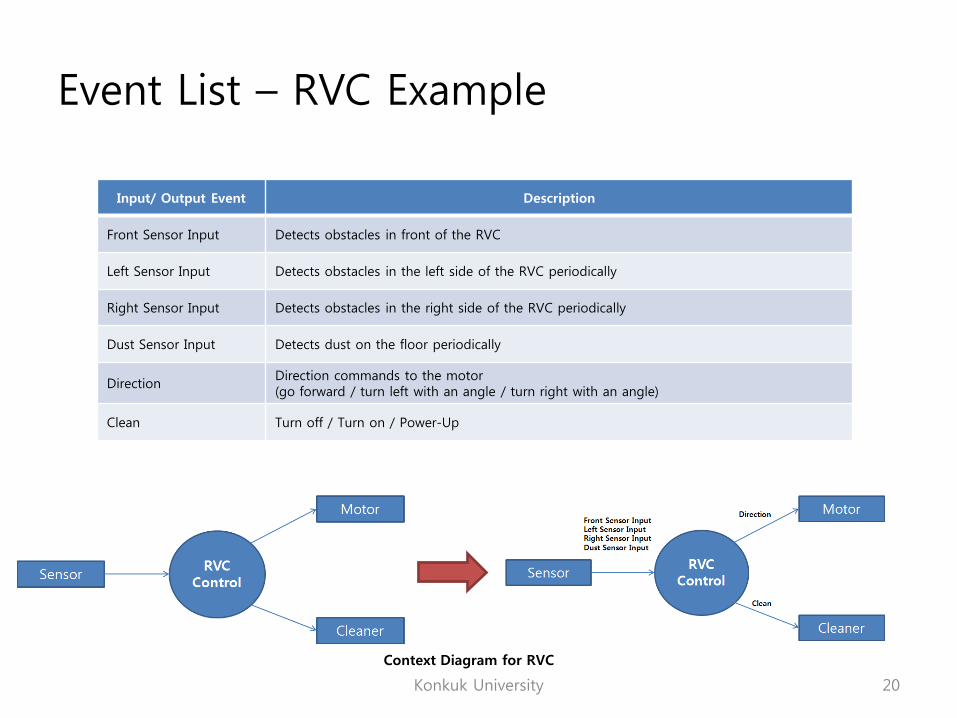
Input/ Output Event Description
Front Sensor Input Detects obstacles in front of the RVC
Left Sensor Input Detects obstacles in the left side of the RVC periodically
Right Sensor Input Detects obstacles in the right side of the RVC periodically
Dust Sensor Input Detects dust on the floor periodically
DirectionDirection commands to the motor (go forward / turn left with an angle / turn right with an angle)
Clean Turn off / Turn on / Power-Up
Context Diagram for RVC
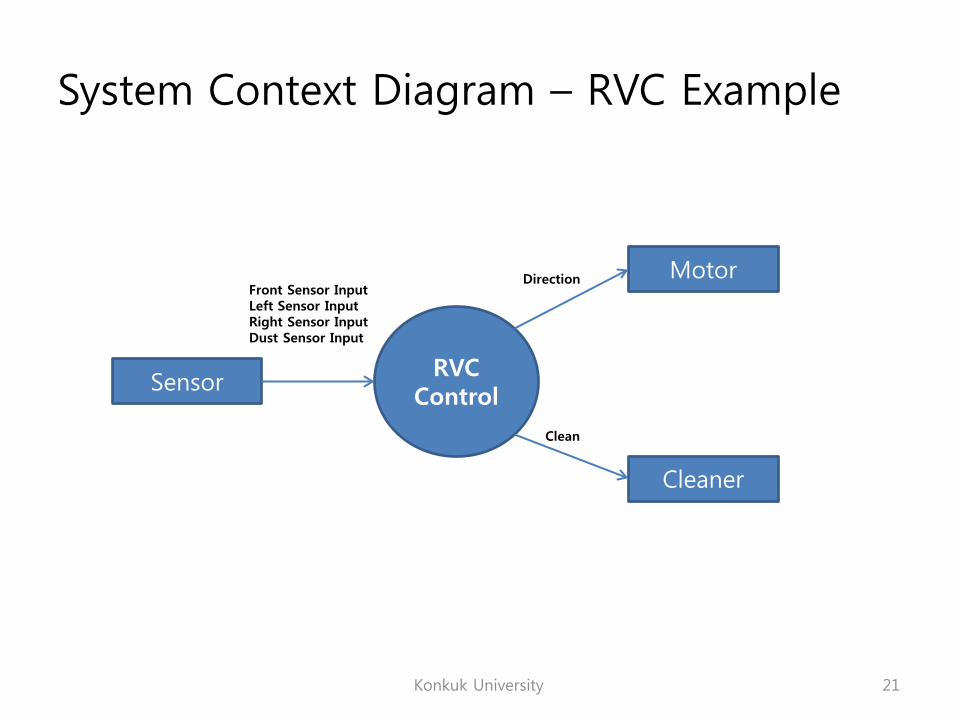
System Context Diagram – RVC Example
Konkuk University 21
RVC Control
Sensor
Motor
Cleaner
Front Sensor InputLeft Sensor InputRight Sensor InputDust Sensor Input
Direction
Clean
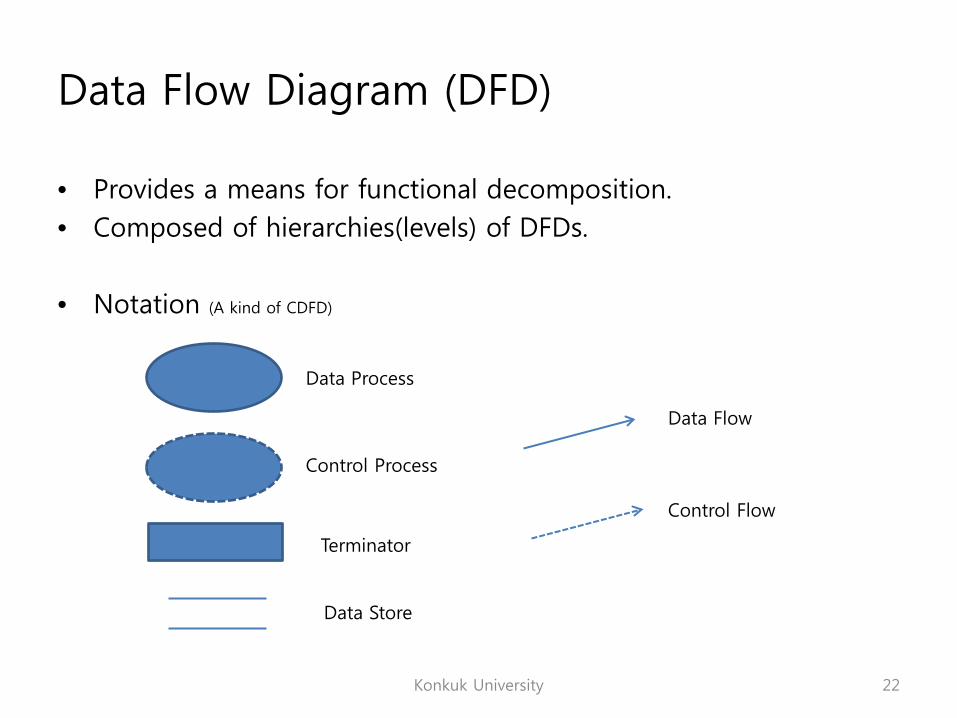
Data Flow Diagram (DFD)
• Provides a means for functional decomposition.• Composed of hierarchies(levels) of DFDs.
• Notation (A kind of CDFD)
Konkuk University 22
Data Process
Control Process
Terminator
Data Store
Data Flow
Control Flow
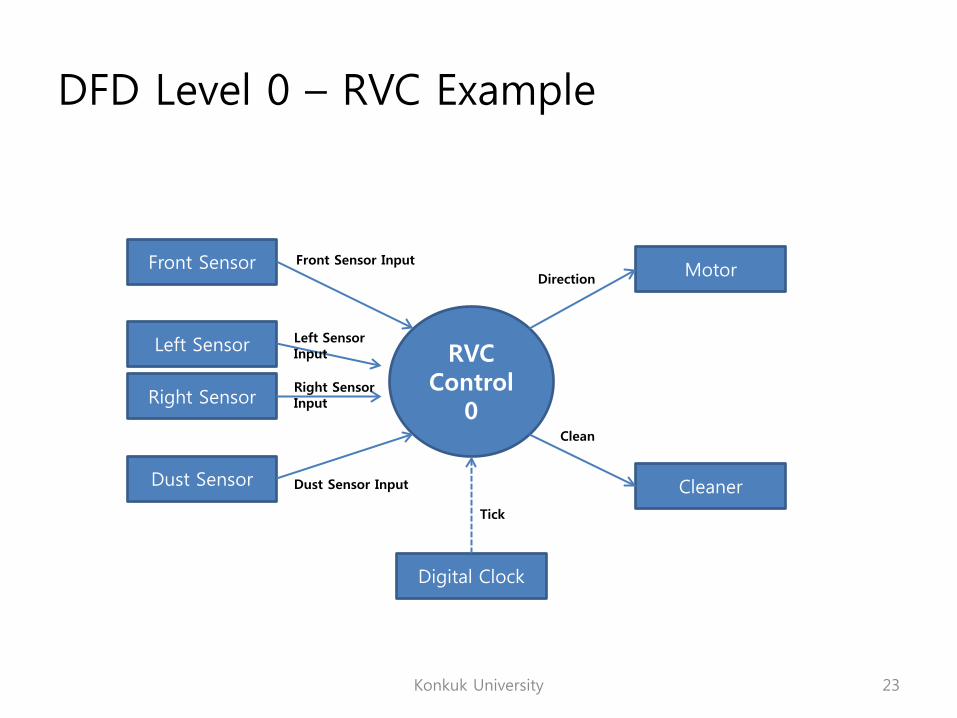
DFD Level 0 – RVC Example
Konkuk University 23
RVC Control
0
Front Sensor Motor
Cleaner
Direction
Clean
Left Sensor
Right Sensor
Dust Sensor
Front Sensor Input
Left Sensor Input
Right Sensor Input
Dust Sensor Input
Digital Clock
Tick
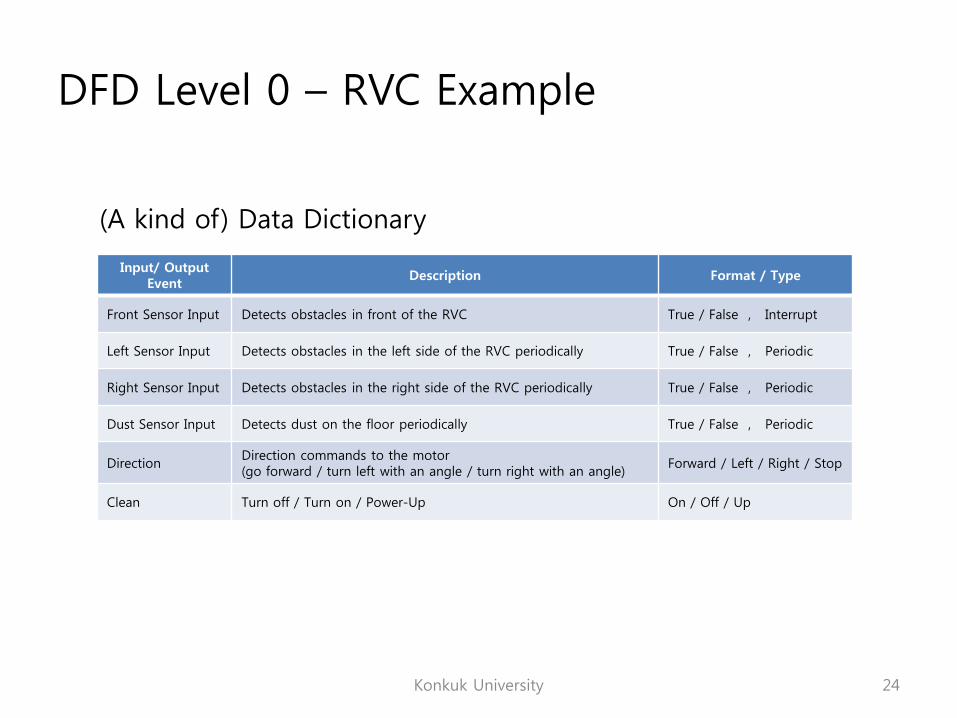
DFD Level 0 – RVC Example
Konkuk University 24
Input/ Output Event
Description Format / Type
Front Sensor Input Detects obstacles in front of the RVC True / False , Interrupt
Left Sensor Input Detects obstacles in the left side of the RVC periodically True / False , Periodic
Right Sensor Input Detects obstacles in the right side of the RVC periodically True / False , Periodic
Dust Sensor Input Detects dust on the floor periodically True / False , Periodic
DirectionDirection commands to the motor (go forward / turn left with an angle / turn right with an angle)
Forward / Left / Right / Stop
Clean Turn off / Turn on / Power-Up On / Off / Up
(A kind of) Data Dictionary
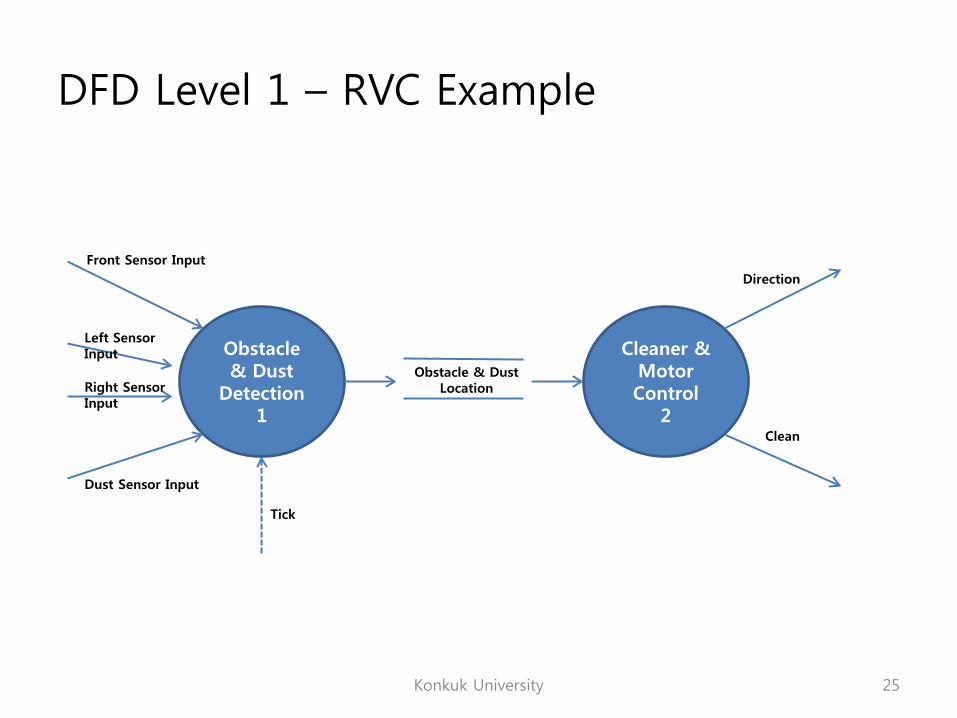
DFD Level 1 – RVC Example
Konkuk University 25
Obstacle & Dust
Detection1
Front Sensor Input
Left Sensor Input
Right Sensor Input
Dust Sensor Input
Tick
Obstacle & DustLocation
Cleaner & MotorControl
2
Direction
Clean
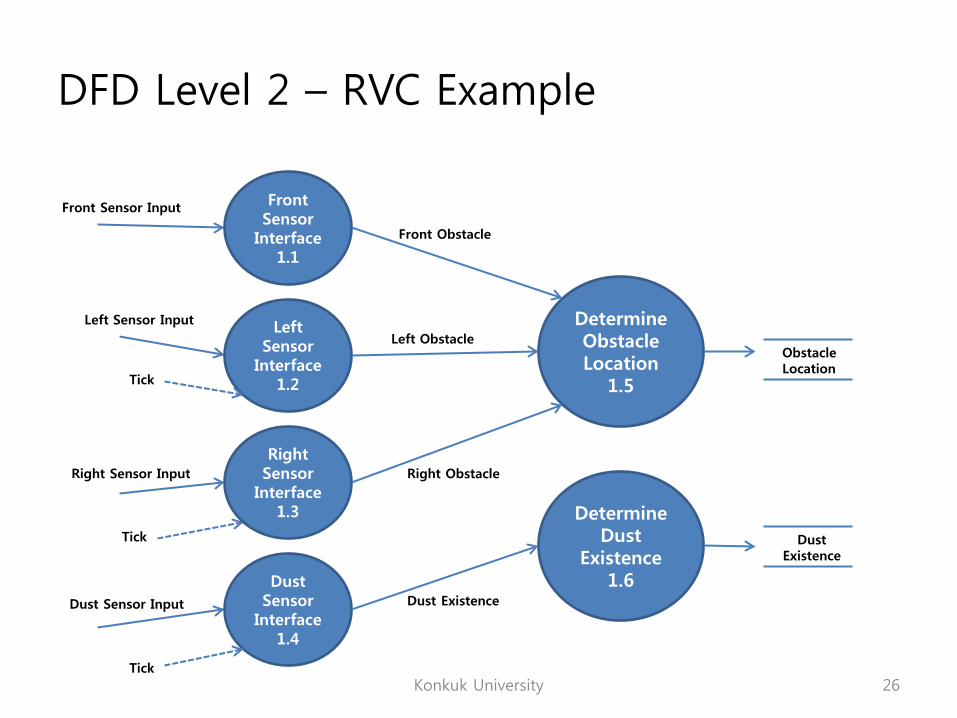
DFD Level 2 – RVC Example
Konkuk University 26
DetermineObstacleLocation
1.5
Front Sensor Input
Left Sensor Input
Right Sensor Input
Dust Sensor Input
Tick
ObstacleLocation
Front Sensor
Interface1.1
LeftSensor
Interface1.2
RightSensor
Interface1.3
DustSensor
Interface1.4
Tick
Tick
Front Obstacle
Left Obstacle
Right Obstacle
DetermineDust
Existence1.6
Dust Existence
DustExistence
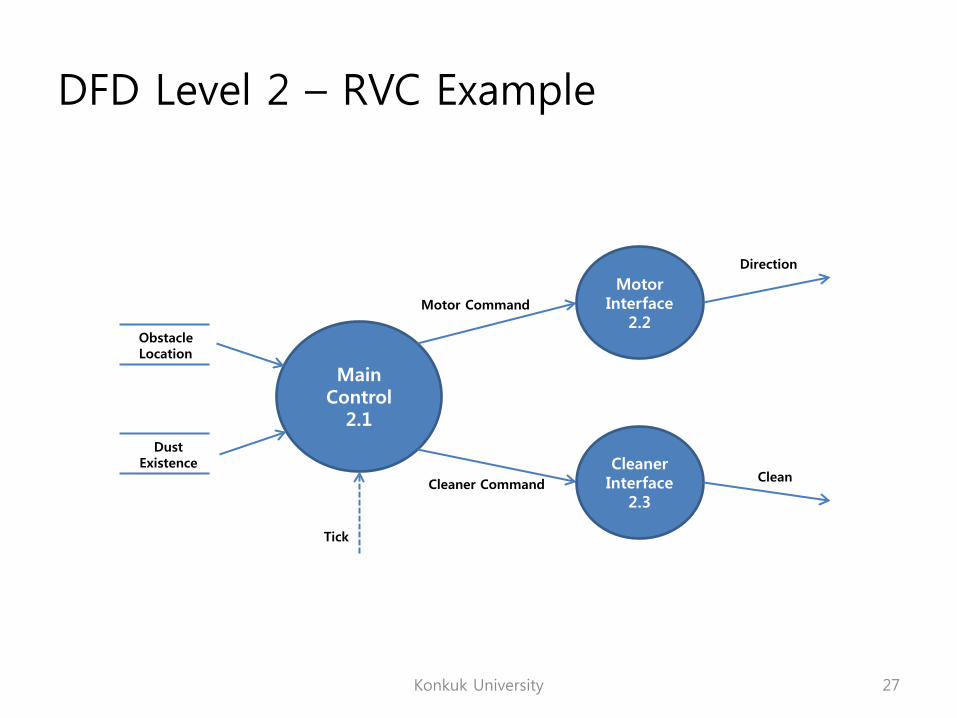
DFD Level 2 – RVC Example
Konkuk University 27
ObstacleLocation
DustExistence
Main Control
2.1
Motor Command
Cleaner Command
MotorInterface
2.2
CleanerInterface
2.3
Tick
Direction
Clean
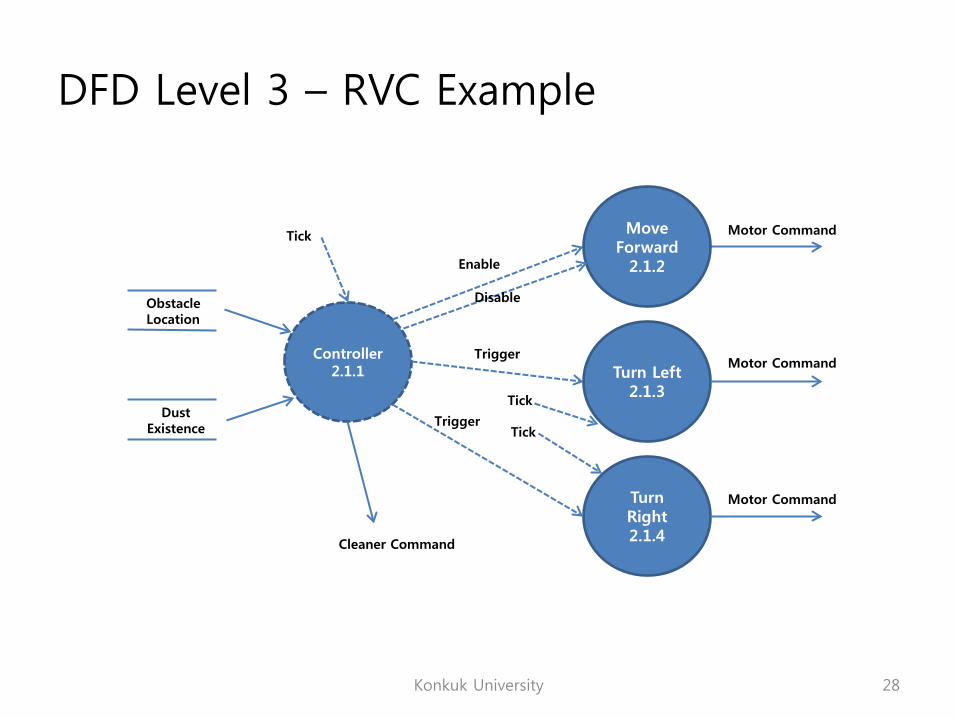
DFD Level 3 – RVC Example
Konkuk University 28
ObstacleLocation
DustExistence
Controller2.1.1
Motor Command
Cleaner Command
Tick Move Forward
2.1.2
Turn Left2.1.3
Turn Right2.1.4
Motor Command
Motor Command
Enable
Disable
Trigger
TriggerTick
Tick
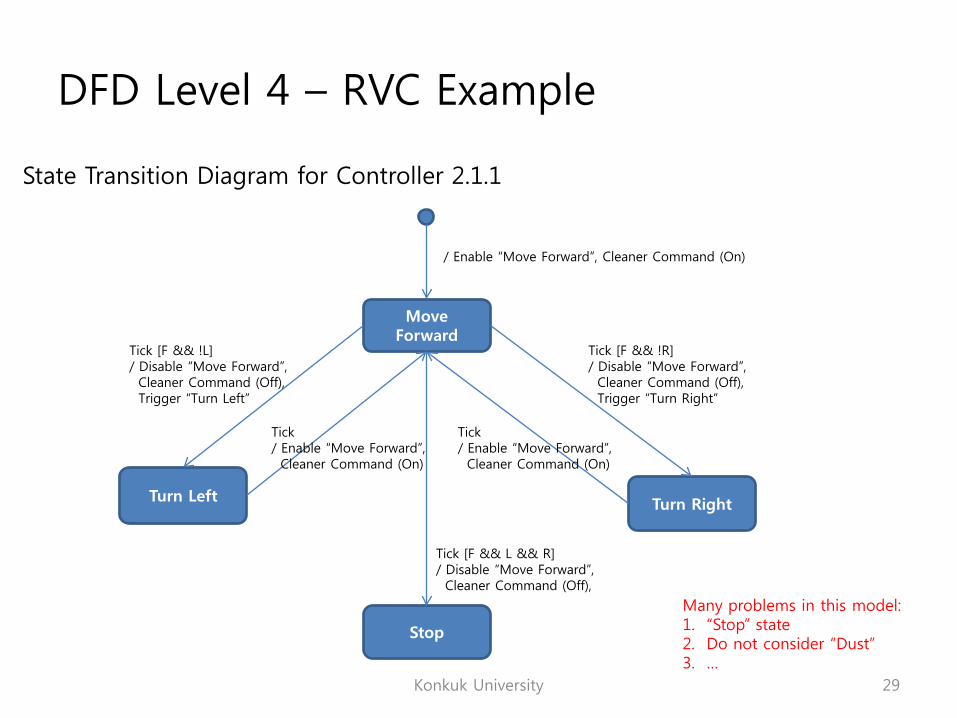
DFD Level 4 – RVC Example
Konkuk University 29
Move Forward
Turn RightTurn Left
/ Enable “Move Forward”, Cleaner Command (On)
Tick [F && !R]/ Disable “Move Forward”, Cleaner Command (Off),Trigger “Turn Right”
Tick / Enable “Move Forward”, Cleaner Command (On)
Tick [F && !L]/ Disable “Move Forward”, Cleaner Command (Off),Trigger “Turn Left”
Tick / Enable “Move Forward”, Cleaner Command (On)
Stop
Tick [F && L && R]/ Disable “Move Forward”, Cleaner Command (Off),
Many problems in this model:1. “Stop” state2. Do not consider “Dust”3. …
State Transition Diagram for Controller 2.1.1
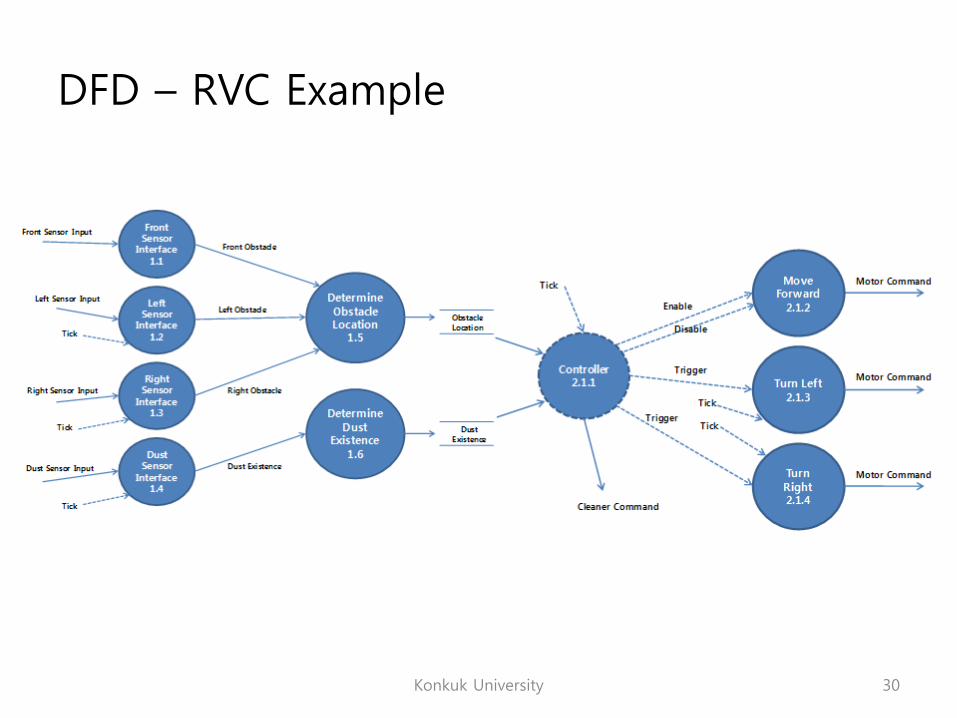
DFD – RVC Example
Konkuk University 30
Process Specification
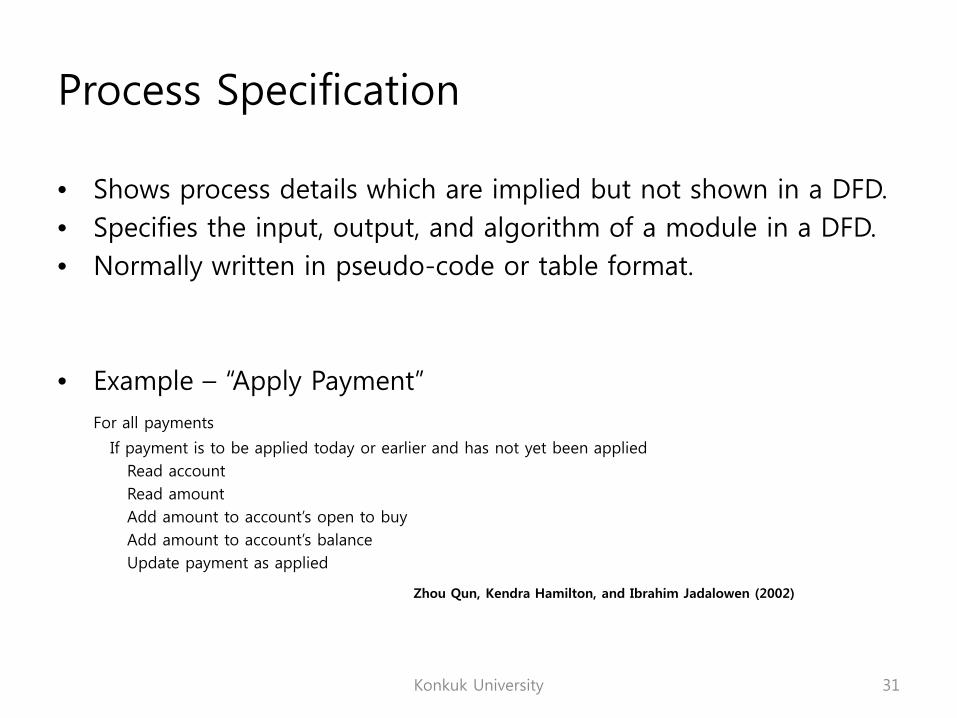
• Shows process details which are implied but not shown in a DFD.• Specifies the input, output, and algorithm of a module in a DFD.• Normally written in pseudo-code or table format.
• Example – “Apply Payment”For all payments
If payment is to be applied today or earlier and has not yet been appliedRead accountRead amountAdd amount to account’s open to buyAdd amount to account’s balanceUpdate payment as applied
Konkuk University 31
Zhou Qun, Kendra Hamilton, and Ibrahim Jadalowen (2002)
Process Specification – RVC Example
Konkuk University 32
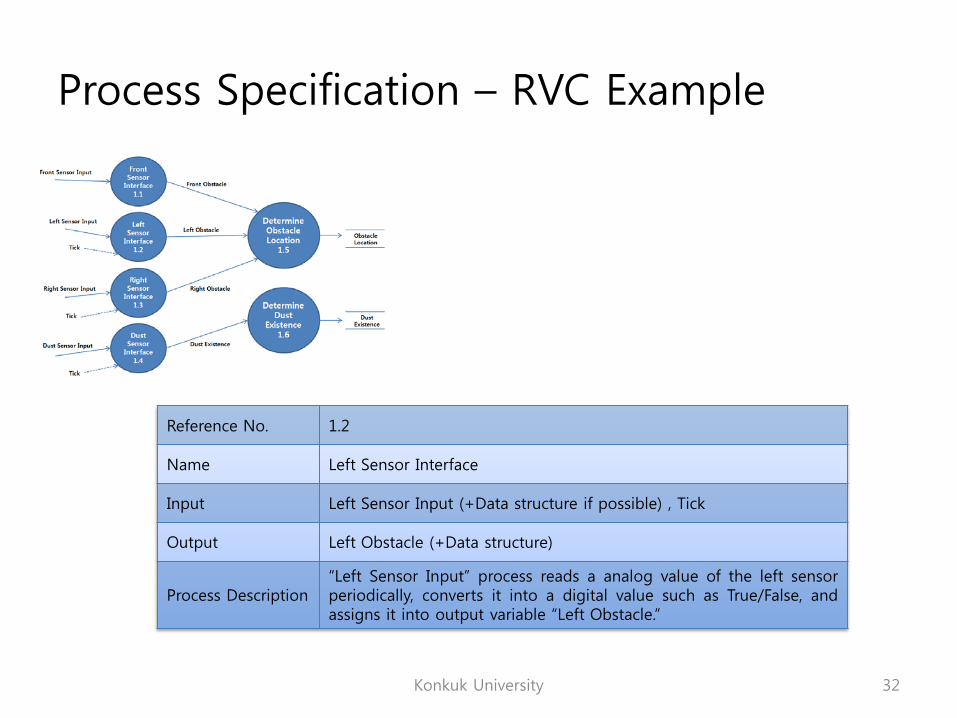
Reference No. 1.2
Name Left Sensor Interface
Input Left Sensor Input (+Data structure if possible) , Tick
Output Left Obstacle (+Data structure)
Process Description“Left Sensor Input” process reads a analog value of the left sensorperiodically, converts it into a digital value such as True/False, andassigns it into output variable “Left Obstacle.”
Data Dictionary
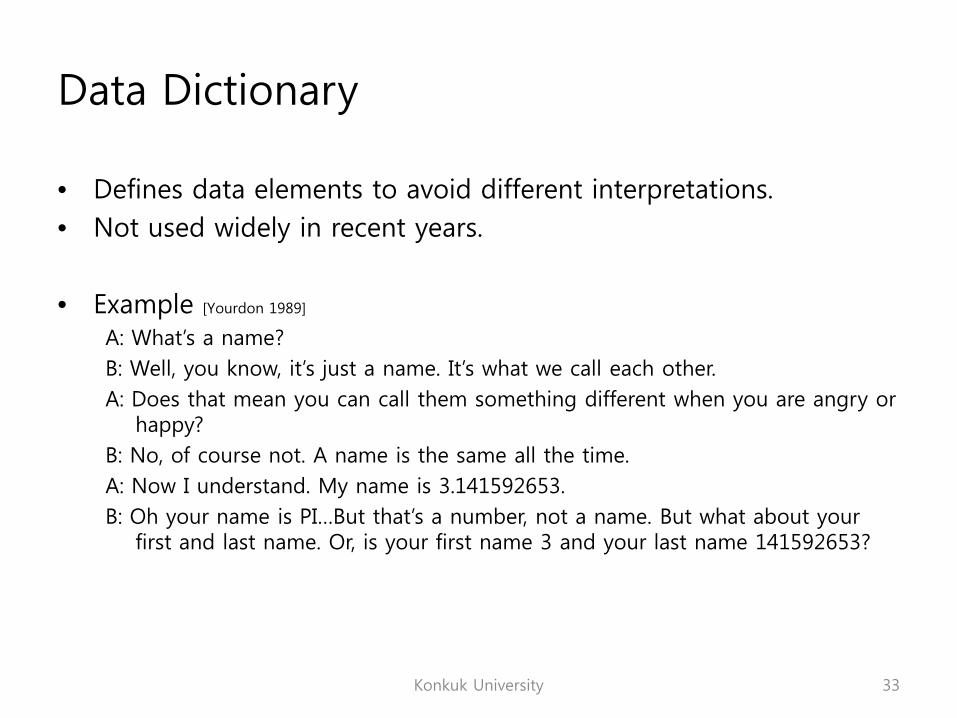
• Defines data elements to avoid different interpretations.• Not used widely in recent years.
• Example [Yourdon 1989]
A: What’s a name?B: Well, you know, it’s just a name. It’s what we call each other.A: Does that mean you can call them something different when you are angry or
happy?B: No, of course not. A name is the same all the time.A: Now I understand. My name is 3.141592653.B: Oh your name is PI…But that’s a number, not a name. But what about your
first and last name. Or, is your first name 3 and your last name 141592653?
Konkuk University 33
Data Dictionary
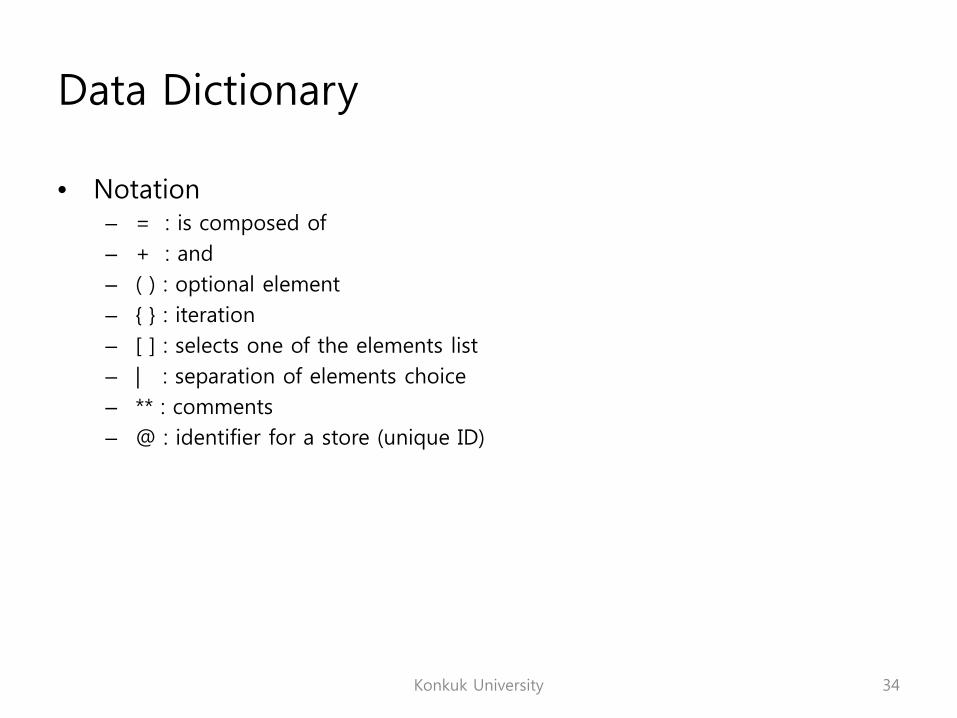
• Notation– = : is composed of– + : and– ( ) : optional element– { } : iteration– [ ] : selects one of the elements list– | : separation of elements choice– ** : comments– @ : identifier for a store (unique ID)
Konkuk University 34
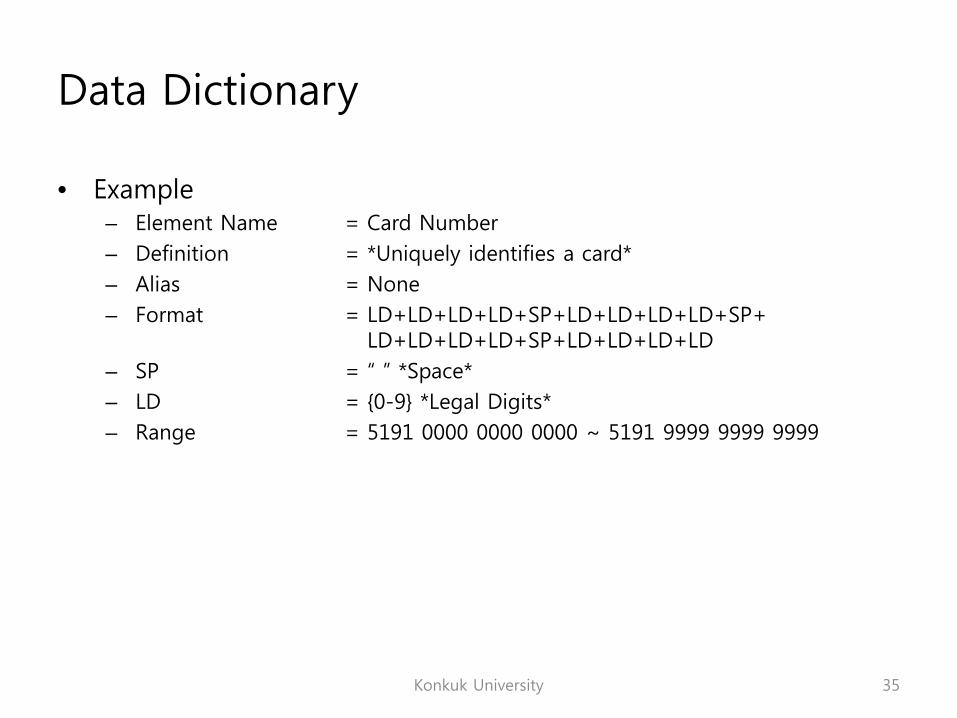
Data Dictionary
• Example– Element Name = Card Number– Definition = *Uniquely identifies a card*– Alias = None– Format = LD+LD+LD+LD+SP+LD+LD+LD+LD+SP+
LD+LD+LD+LD+SP+LD+LD+LD+LD– SP = “ ” *Space*– LD = {0-9} *Legal Digits*– Range = 5191 0000 0000 0000 ~ 5191 9999 9999 9999
Konkuk University 35
Entity Relationship Diagram (ERD)
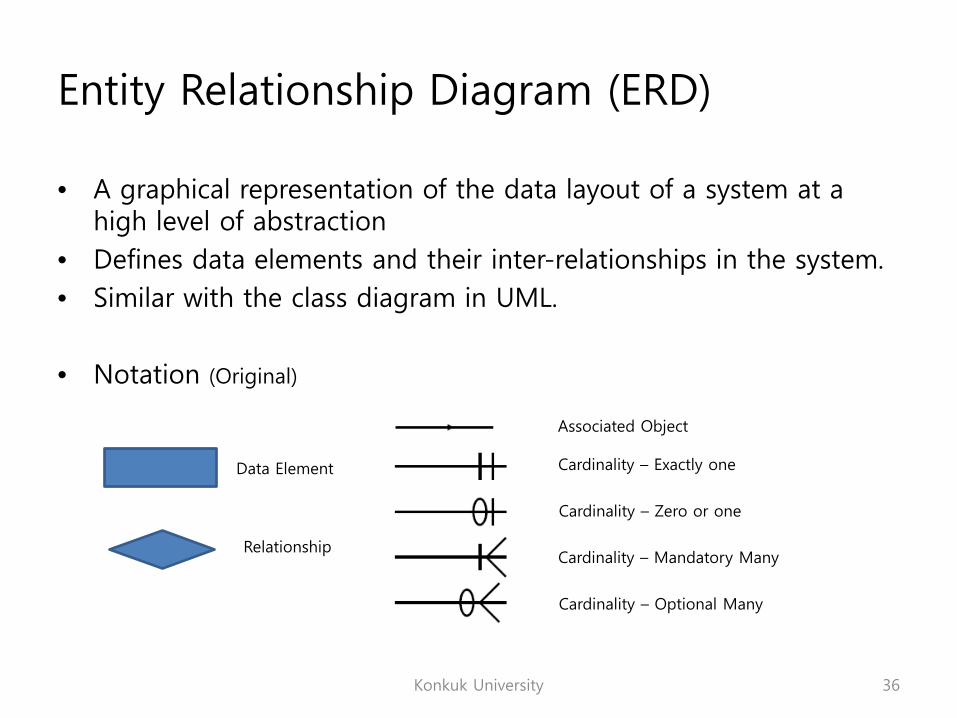
• A graphical representation of the data layout of a system at a high level of abstraction
• Defines data elements and their inter-relationships in the system.• Similar with the class diagram in UML.
• Notation (Original)
Konkuk University 36
Data Element
Relationship
Associated Object
Cardinality – Exactly one
Cardinality – Zero or one
Cardinality – Mandatory Many
Cardinality – Optional Many
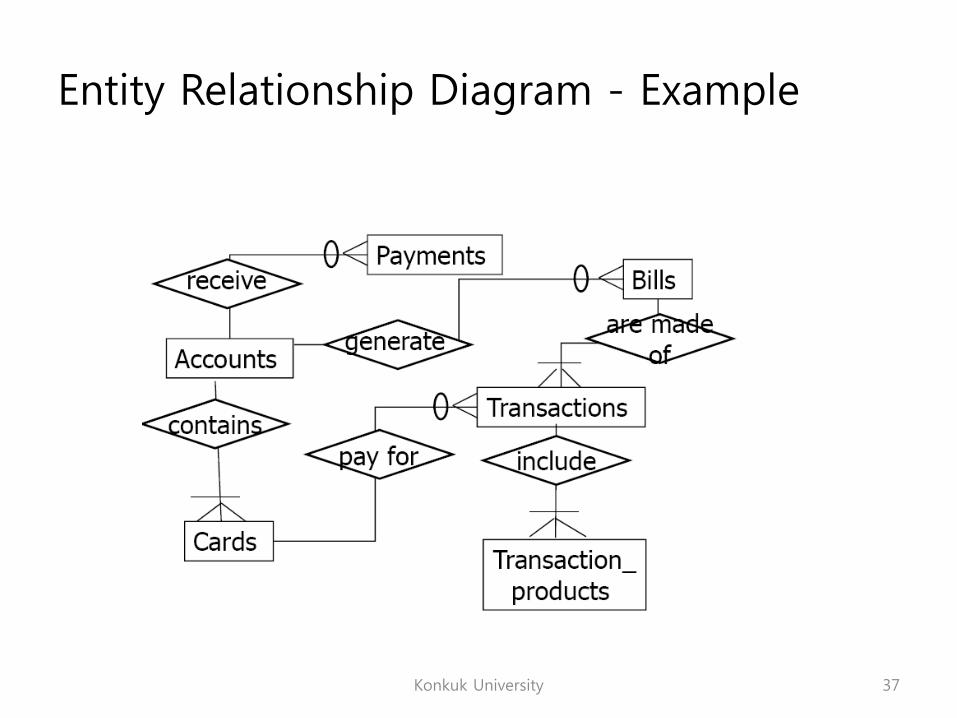
Entity Relationship Diagram - Example
Konkuk University 37
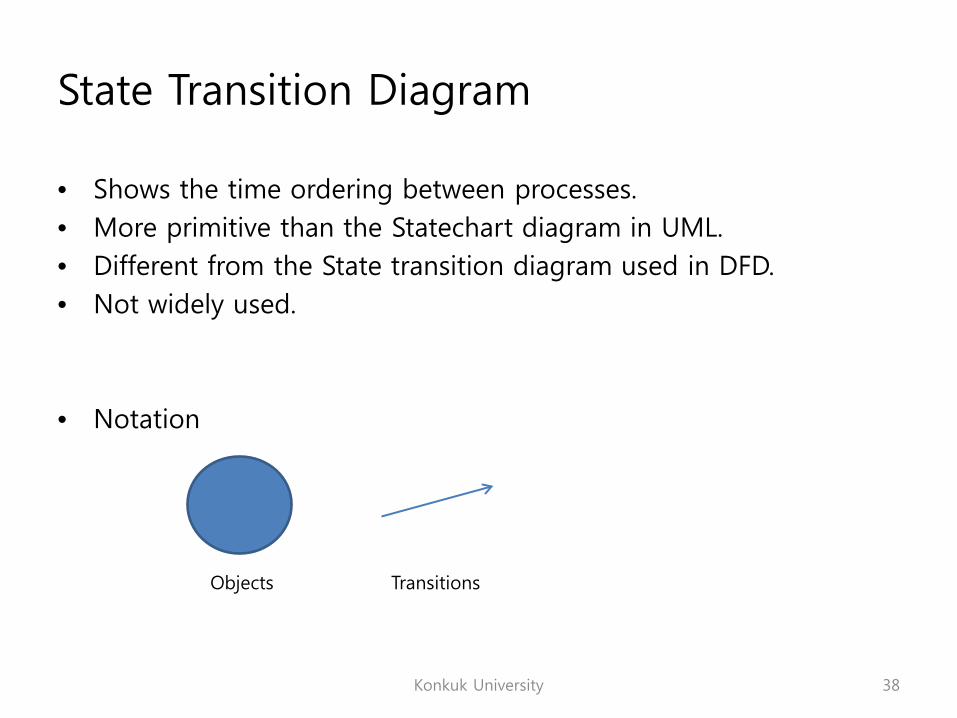
State Transition Diagram
• Shows the time ordering between processes.• More primitive than the Statechart diagram in UML.• Different from the State transition diagram used in DFD. • Not widely used.
• Notation
Konkuk University 38
TransitionsObjects
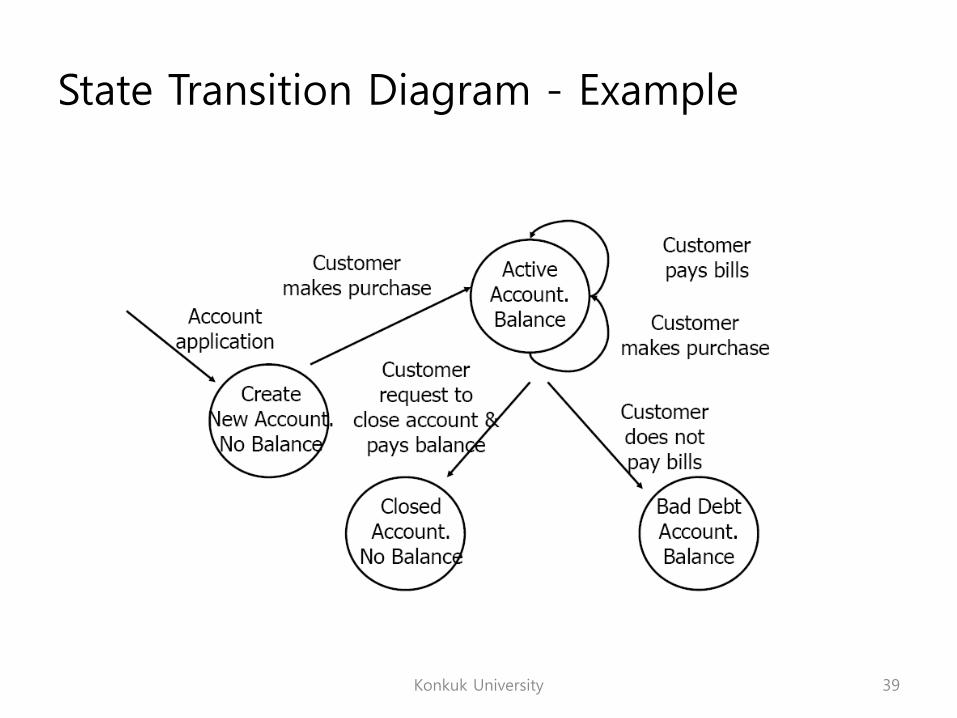
State Transition Diagram - Example
Konkuk University 39
Practice
• Complete the RVC analysis in more details.– Consider the “Dust”.– You may have several controller.
Konkuk University 40