Embed Size (px)
Citation preview

ITMPI005
smi Software Metrics, Inc.
Copyright Computer Aid, Inc. 2011. May not be copied or reproduced without the written permission of CAI.
1
Webinar:Root Causes of Project Schedule
Slippage
November 19, 2008
9:00 AM – 10:30 AM
Please note: The audio portion of this webinar is only accessible through the telephone dial-in number that you received in your registration confirmation email.

smi Software Metrics, Inc.
Copyright Computer Aid, Inc. 2011. May not be copied or reproduced without the written permission of CAI.
2
Brad Clark, Ph.D.Vice-President
Software Metrics Inc.
Michael MilutisDirector of Marketing
Computer Aid, Inc. (CAI)

smi Software Metrics, Inc.
Copyright Computer Aid, Inc. 2011. May not be copied or reproduced without the written permission of CAI.
3
About Software Metrics Inc.
• Small consulting company started in 1983
• We specialize in the practical application of measurement for predicting, controlling and improving organizational processes and product quality.
• Measurement is all that we do.

smi Software Metrics, Inc.
Copyright Computer Aid, Inc. 2011. May not be copied or reproduced without the written permission of CAI.
4
About Computer Aid, Inc. (CAI)• CAI is a global IT outsourcing firm currently managing active engagements with over 100
Fortune 1,000 companies and government agencies around the world.
• CAI is a leader in IT Best Practices for legacy support and new development application management.
• CAI’s focus is directed toward practical implementations that track and measure the right activities in software activity management
• CAI consistently promises and delivers double digit productivity in its outsourcing and consulting engagements.
• CAI makes all of this possible through the use of:
• Standard processes
• Management by metrics
• SLA compliance management
• Detailed cost, resource, and time tracking
• Capacity management
• Standard estimation
• A unique, metrics based methodology along with a proprietary, real time data repository and management system (TRACER®).

smi Software Metrics, Inc.
Copyright Computer Aid, Inc. 2011. May not be copied or reproduced without the written permission of CAI.
5
• The Project Management Institute’s ISSIG group has accredited
this webinar with PDUs
• Stay tuned! Your PDU code will be displayed at the conclusion of
this webinar.
PDU CREDITS FOR THIS WEBINAR

smi Software Metrics, Inc.
Copyright Computer Aid, Inc. 2011. May not be copied or reproduced without the written permission of CAI.
6
NOW AVAILABLE!
ONLINE WEBINAR RECORDINGS
ANYTIME ACCESS!
WWW. ITMPI.ORG / LIBRARY

smi Software Metrics, Inc.
Copyright Computer Aid, Inc. 2011. May not be copied or reproduced without the written permission of CAI.
7
Only through awareness and visibility can we hope to foresee problems early enough (while they are still small) that corrective action can be taken before schedule is impacted.
Background
• This work evolved from our consulting in assessing projects in trouble
– For the vast majority of assessments, schedule has been the primary
concern
• Projects have complicated dynamics and many things can negatively impact schedule.
• It is no wonder that so many projects slip schedule. The point of this presentation is to illuminate these dynamics.
smi Software Metrics, Inc.
Copyright Computer Aid, Inc. 2011. May not be copied or reproduced without the written permission of CAI.
8
Webinar Objectives
• Discuss the common approaches to tracking project progress
• Discuss actions to take when progress starts slipping
• Describe an approach to finding the root causes of slippage
• Describe characteristics of an effective monitoring program to proactively prevent future occurrences of slippage
• Provide a number of real-world examples

smi Software Metrics, Inc.
Copyright Computer Aid, Inc. 2011. May not be copied or reproduced without the written permission of CAI.
9
Subjective claims of progress (e.g. “90% complete”) are not a dependable means of tracking progress
Objective measures of progress are much better indicators:
[PSM 00]
Examples of Progress Tracking Measures
• Reviews successfully completed
• Task start and end dates
• Task critical path performance
• Milestones achieved
• Units designed
• Units coded
• Units integrated
• Source lines of code written
• Test cases attempted and passed
• Number of requirements tested
successfully
• Problem reports backlog
• Change requests opened or
completed (backlog)
• Action items opened or closed
(backlog)
• Delivery of artifacts

smi Software Metrics, Inc.
Copyright Computer Aid, Inc. 2011. May not be copied or reproduced without the written permission of CAI.
10
Progress Tracking Tools• Earned Value Management System tools
– Planned Value (BCSW) versus Earned Value (BCWP)
– Planned Value versus Actual Costs (ACWP)
• Work Breakdown Structure tools
– Gantt chart with milestones
– Critical path analysis
• Workflow tools
– Monitoring of work steps and approvals
• Spreadsheet tools
– Work unit progress
Tools will show what is not getting done but they don’t show the cause.
smi Software Metrics, Inc.
Copyright Computer Aid, Inc. 2011. May not be copied or reproduced without the written permission of CAI.
11
When Progress Starts Slipping• Schedule slippage is an unfortunate reality for many complex
software development projects.
• Repeated slippages cause problems and embarrassment.
• In this presentation, we discuss an approach to finding the root-causes of schedule slippage and preventing future “surprises” using a four-step process:
– Re-check the plan
– Analyze for root causes
– Eliminate surprises with key measures
– Monitor the issue areas

smi Software Metrics, Inc.
Copyright Computer Aid, Inc. 2011. May not be copied or reproduced without the written permission of CAI.
12
You need a plan that credibly sets expectations.
Step 1: Re-check the Plan
• Plans and their supporting estimates are made once and often not updated
• Requirements are often not fully understood at project initiation
• Initial plans assume an expected productivity or production rate
• Current plan may not reflect “real” productivities or production rates
• Re-plan based on actual performance
– ITMPI webinar: General Principles of Cost Estimation

smi Software Metrics, Inc.
Copyright Computer Aid, Inc. 2011. May not be copied or reproduced without the written permission of CAI.
13
Step 2: Analyze for Root Causes• Find the roadblocks to progress
– Data from program reviews
– Discussions with developers and support personnel
• There may be many things happening on a project that impact progress:
– Lack of consensus among key Stakeholders
– Changing or misinterpreted requirements
– Immature or poor technical solutions
– Problems with legacy code or COTS products
– Unplanned rework due to poor product quality
– Late subcontractor deliverable work
– Not enough people or not the right skills and experience
– Lack of development processes, inadequate support tools, chaotic development environment

smi Software Metrics, Inc.
Copyright Computer Aid, Inc. 2011. May not be copied or reproduced without the written permission of CAI.
14
Organizing Information• Project managers are flooded with a wealth of data and details
• Challenge is to organize all of this information
– Identify true cause(s) of slippage
– Take effective action to address problems
• This organization should:
– De-clutter the massive amounts of information on a project
– Relate the different issue areas to each other
– Highlight missing information
• Over many project assessments, we have developed a model for guidance in:
– Categorizing the wealth of data and details
– Assessing the causes of slippage
– Recommending a going-forward plan
smi Software Metrics, Inc.
Copyright Computer Aid, Inc. 2011. May not be copied or reproduced without the written permission of CAI.
15
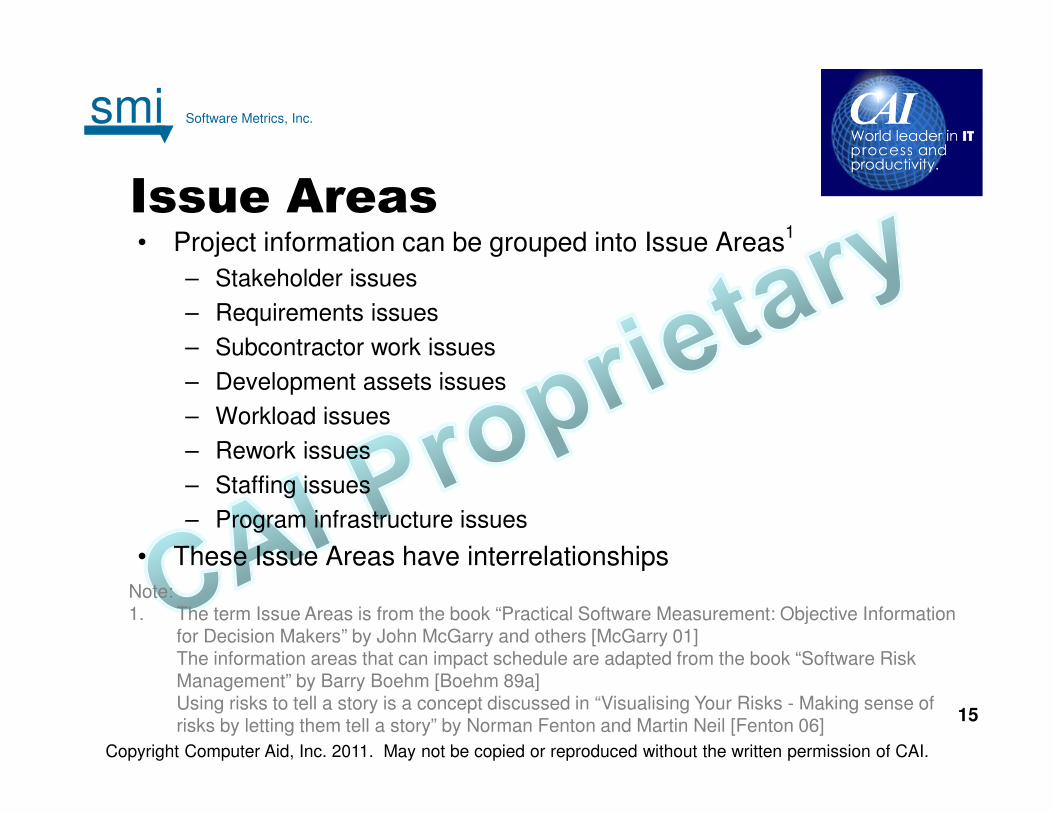
Note:1. The term Issue Areas is from the book “Practical Software Measurement: Objective Information
for Decision Makers” by John McGarry and others [McGarry 01]The information areas that can impact schedule are adapted from the book “Software Risk Management” by Barry Boehm [Boehm 89a]Using risks to tell a story is a concept discussed in “Visualising Your Risks - Making sense of risks by letting them tell a story” by Norman Fenton and Martin Neil [Fenton 06]
Issue Areas• Project information can be grouped into Issue Areas
1
– Stakeholder issues
– Requirements issues
– Subcontractor work issues
– Development assets issues
– Workload issues
– Rework issues
– Staffing issues
– Program infrastructure issues
• These Issue Areas have interrelationships
smi Software Metrics, Inc.
Copyright Computer Aid, Inc. 2011. May not be copied or reproduced without the written permission of CAI.
16
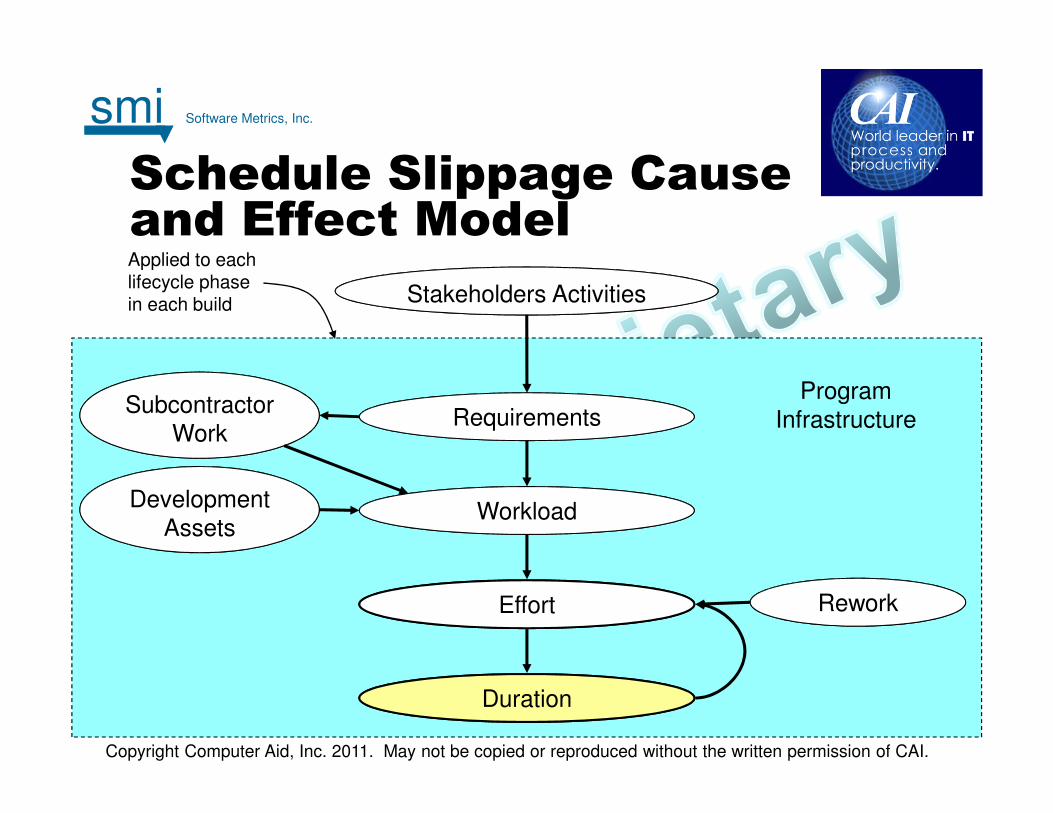
Stakeholders Activities
Development Assets
Requirements
Workload
Effort Rework
Program
InfrastructureSubcontractor
Work
Applied to each lifecycle phase in each build
Duration
Schedule Slippage Cause and Effect Model
smi Software Metrics, Inc.
Copyright Computer Aid, Inc. 2011. May not be copied or reproduced without the written permission of CAI.
17
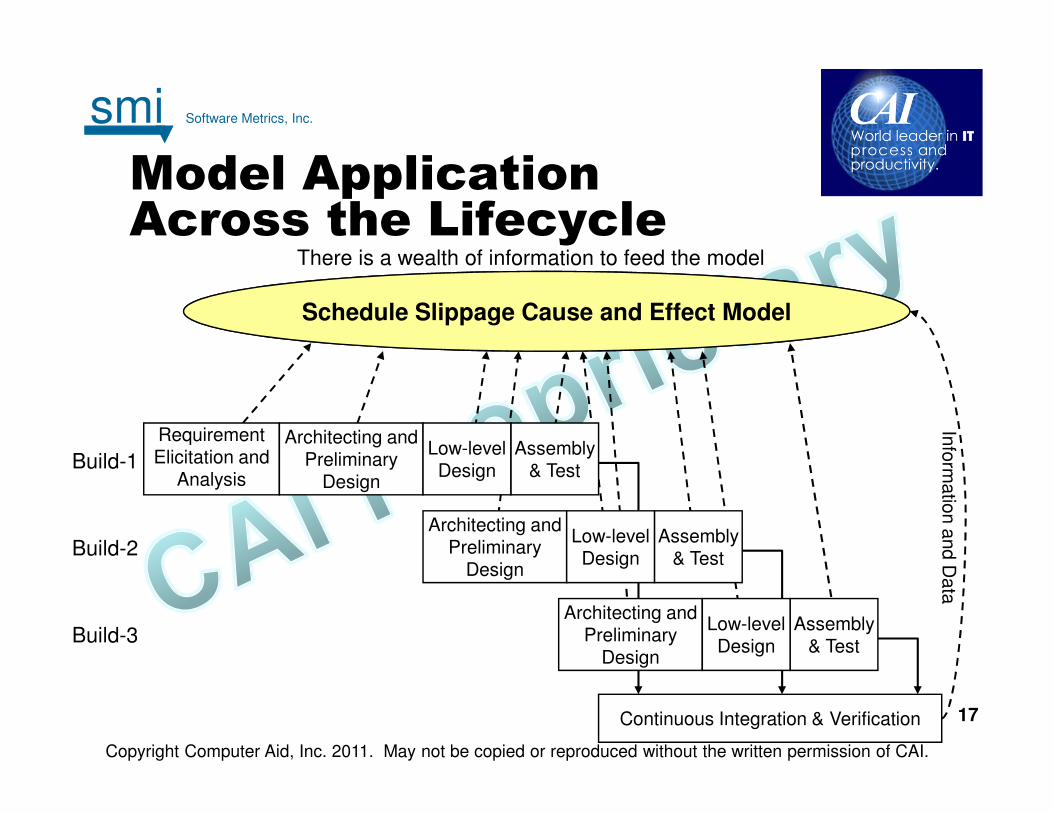
Model Application Across the Lifecycle
Continuous Integration & Verification
Build-1
Build-2
Build-3
Schedule Slippage Cause and Effect Model
Info
rmatio
n a
nd D
ata
Requirement Elicitation and
Analysis
Architecting and Preliminary
Design
Assembly& Test
Low-level Design
Architecting and Preliminary
Design
Assembly& Test
Low-level Design
Architecting and Preliminary
Design
Assembly& Test
Low-level Design
There is a wealth of information to feed the model

smi Software Metrics, Inc.
Copyright Computer Aid, Inc. 2011. May not be copied or reproduced without the written permission of CAI.
18
StakeholdersStakeholders
Assets
RequirementsRequirements
WorkloadWorkload
Effort ReworkRework
SubcontractorSubcontractor
Duration
• Management’s goal should be to establish effective communication and coordination channels with Stakeholders and then control inputs to the project
Note:1. There is a negotiation model and software tool that supports gaining
consensus among different stakeholder groups. See WinWin: [Lee 96] and [Boehm 89b].
Stakeholder Issues• This issue area reflects project turbulence and entropy because
of difficulties in synchronizing the project’s stakeholders: users, customers, system engineers, developers, maintainers, others.
• Real-life examples:
– 100 headed hydra: nobody could say “Yes” and anyone could say
“No”
– Technical Director for customer changed programming language
mid-way through project, e.g. from C++ to Java
• Stakeholder churn flows down to Requirements

smi Software Metrics, Inc.
Copyright Computer Aid, Inc. 2011. May not be copied or reproduced without the written permission of CAI.
19
StakeholdersStakeholders
Assets
RequirementsRequirements
WorkloadWorkload
Effort ReworkRework
SubcontractorSubcontractor
Duration
• Management’s goal should be to manage requirements so as to minimize changes in the workload
Requirement Issues
• This issue area reflects understanding and stability of the functional requirements, performance requirements, constraints, standards, etc. used to define and bound what is to be developed
• Real-life examples:
– Misinterpretation of a communication standard expands to 3000
additional requirements
– IKIWISI (I’ll Know It When I See It)
• Changes to requirements can add new work or create waste (throw-away completed work)

smi Software Metrics, Inc.
Copyright Computer Aid, Inc. 2011. May not be copied or reproduced without the written permission of CAI.
20
StakeholdersStakeholders
Assets
RequirementsRequirements
WorkloadWorkload
Effort ReworkRework
SubcontractorSubcontractor
Duration
• Management’s goal should be to balance what is purchased or delegated to a subcontractor with what can be done with more in-house control and often at less expense.
Subcontractor Issues• This issue area reflects subcontractor products or services that
will be delivered as a part of the overall software system
• Real-life examples:
– Interface problems with subcontracted subsystems
– Geographically dispersed subcontractors hinder coordination
• The number of requirements can be impacted if the Subcontractor does not do all of the allocated work, i.e. the number of unfilled requirements may increase the workload for the Prime Contractor.
smi Software Metrics, Inc.
Copyright Computer Aid, Inc. 2011. May not be copied or reproduced without the written permission of CAI.
21
StakeholdersStakeholders
Assets
RequirementsRequirements
WorkloadWorkload
Effort ReworkRework
SubcontractorSubcontractor
Duration
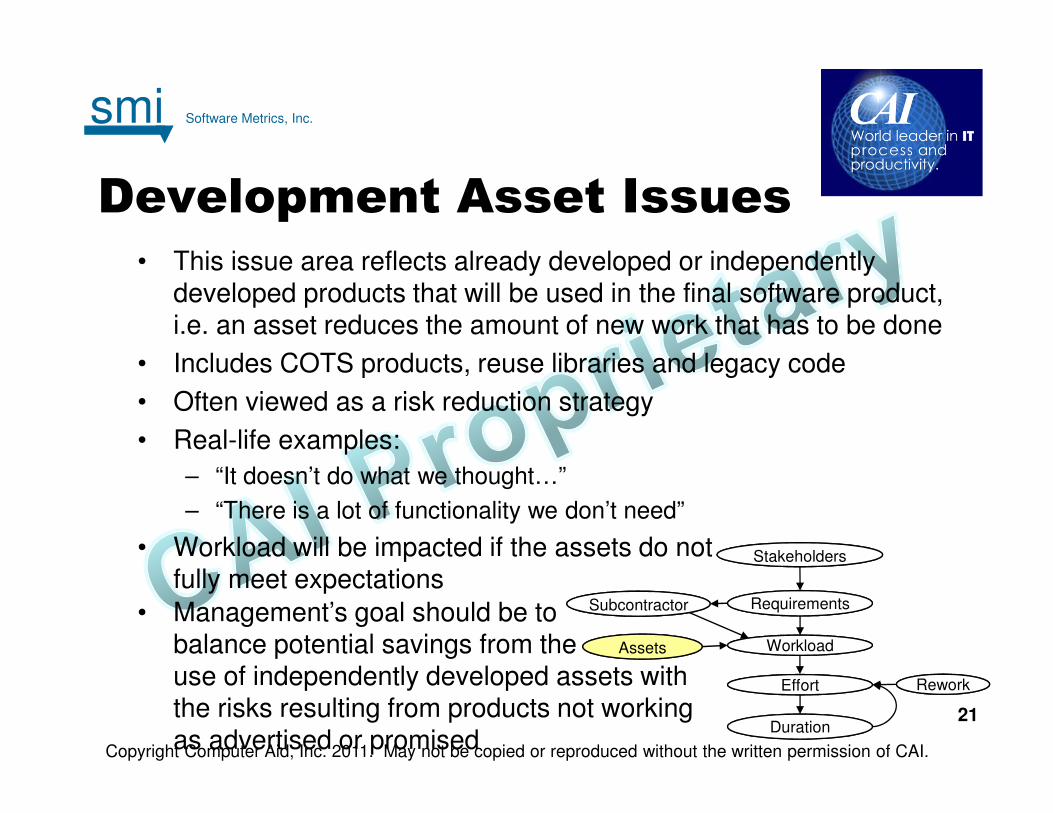
• Management’s goal should be tobalance potential savings from theuse of independently developed assets withthe risks resulting from products not workingas advertised or promised
Development Asset Issues
• This issue area reflects already developed or independently developed products that will be used in the final software product, i.e. an asset reduces the amount of new work that has to be done
• Includes COTS products, reuse libraries and legacy code
• Often viewed as a risk reduction strategy
• Real-life examples:
– “It doesn’t do what we thought…”
– “There is a lot of functionality we don’t need”
• Workload will be impacted if the assets do notfully meet expectations

smi Software Metrics, Inc.
Copyright Computer Aid, Inc. 2011. May not be copied or reproduced without the written permission of CAI.
22
StakeholdersStakeholders
Assets
RequirementsRequirements
WorkloadWorkload
Effort ReworkRework
SubcontractorSubcontractor
Duration
• Management’s goal should be to quantify the workload for planning and then monitor the changes in load in each lifecycle phase
Workload Issues• This issue area reflects the quantity of work that has to be done.
• The work is different depending on the development lifecyle phase.
– Development
• Number of design components
• Number of source lines of code
• Number of unit test cases
– Test
• Number of integration test cases
• Number of requirement verification procedures
smi Software Metrics, Inc.
Copyright Computer Aid, Inc. 2011. May not be copied or reproduced without the written permission of CAI.
23
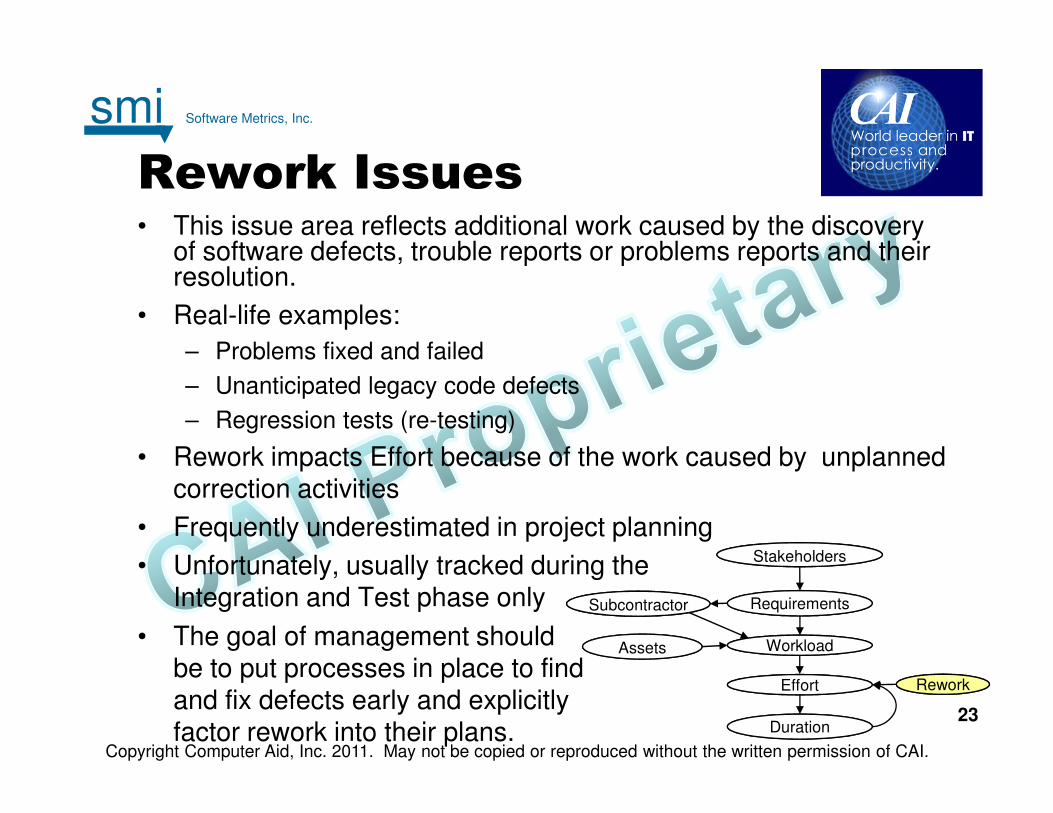
Rework Issues• This issue area reflects additional work caused by the discovery
of software defects, trouble reports or problems reports and their resolution.
• Real-life examples:
– Problems fixed and failed
– Unanticipated legacy code defects
– Regression tests (re-testing)
• Rework impacts Effort because of the work caused by unplanned correction activities
• Frequently underestimated in project planning
• Unfortunately, usually tracked during theIntegration and Test phase only
StakeholdersStakeholders
Assets
RequirementsRequirements
WorkloadWorkload
Effort ReworkRework
SubcontractorSubcontractor
Duration
• The goal of management shouldbe to put processes in place to find and fix defects early and explicitly factor rework into their plans.

smi Software Metrics, Inc.
Copyright Computer Aid, Inc. 2011. May not be copied or reproduced without the written permission of CAI.
24
Staffing Issues• This issue area reflects the availability, capability and experience
of the staff necessary to do the work.
• Available staffing determines how fast the workload can be drawn down
• Real-world examples:
– Personnel shortfalls
– High turnover can have a big impact (especially among experienced staff)
– Bringing on people to solve a slippage problem may make it worse (especially late in the project)
• Within limits, the amount of qualified effortavailable impacts the amount oftime needed (duration) to do thework.
StakeholdersStakeholders
Assets
RequirementsRequirements
WorkloadWorkload
Effort ReworkRework
SubcontractorSubcontractor
Duration
• Management’s goal should be to manage the staffing mix and build-up so as to not cause additional delays

smi Software Metrics, Inc.
Copyright Computer Aid, Inc. 2011. May not be copied or reproduced without the written permission of CAI.
25
StakeholdersStakeholders
Assets
RequirementsRequirements
WorkloadWorkload
Effort ReworkRework
SubcontractorSubcontractor
Duration
• Management’s goal should be to proactively monitor issues areas potentially impacting schedule for early warning of problems.
Schedule Issues• This issue area reflects the amount of calendar time needed and
used to execute the workload by available staff
• Depends on things going right in the other issue areas.
– Integration and test is usually where “reality” sets in
– Cannot compress schedule by increasing Effort at a linear rate
(example on the next slide)
smi Software Metrics, Inc.
Copyright Computer Aid, Inc. 2011. May not be copied or reproduced without the written permission of CAI.
26
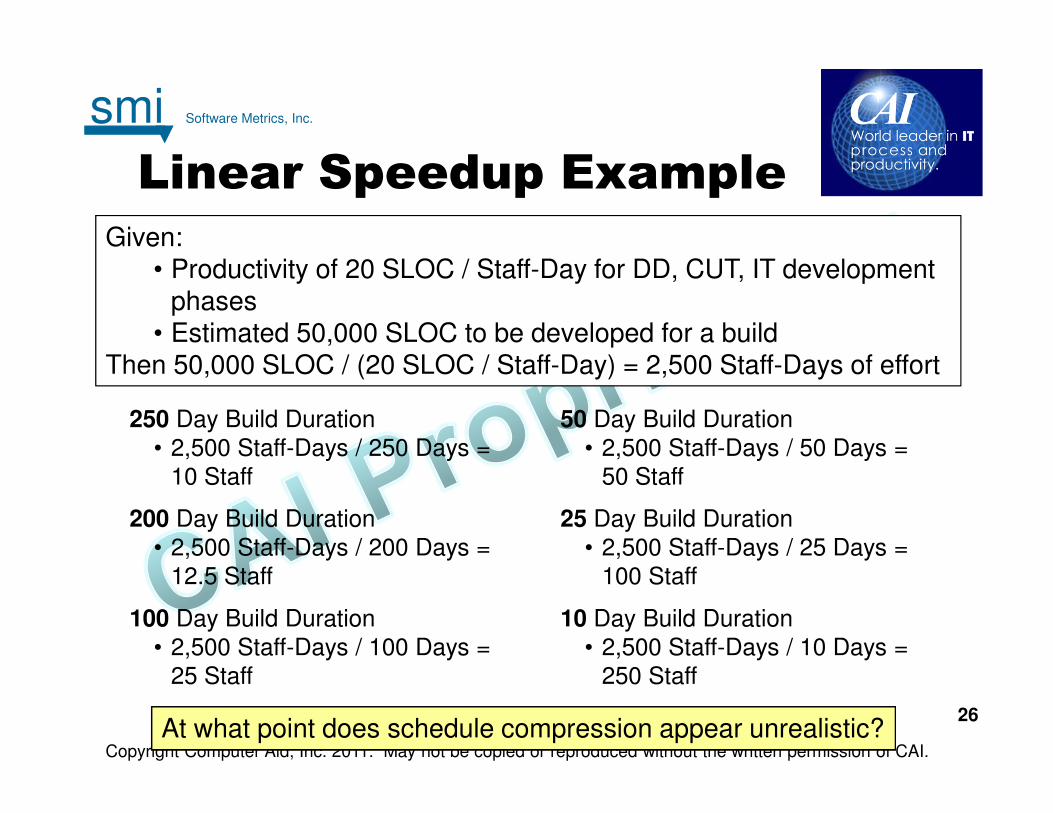
Given:• Productivity of 20 SLOC / Staff-Day for DD, CUT, IT development
phases• Estimated 50,000 SLOC to be developed for a build
Then 50,000 SLOC / (20 SLOC / Staff-Day) = 2,500 Staff-Days of effort
250 Day Build Duration• 2,500 Staff-Days / 250 Days =
10 Staff
200 Day Build Duration• 2,500 Staff-Days / 200 Days =
12.5 Staff
100 Day Build Duration• 2,500 Staff-Days / 100 Days =
25 Staff
50 Day Build Duration• 2,500 Staff-Days / 50 Days =
50 Staff
25 Day Build Duration• 2,500 Staff-Days / 25 Days =
100 Staff
10 Day Build Duration• 2,500 Staff-Days / 10 Days =
250 Staff
At what point does schedule compression appear unrealistic?
Linear Speedup Example
smi Software Metrics, Inc.
Copyright Computer Aid, Inc. 2011. May not be copied or reproduced without the written permission of CAI.
27
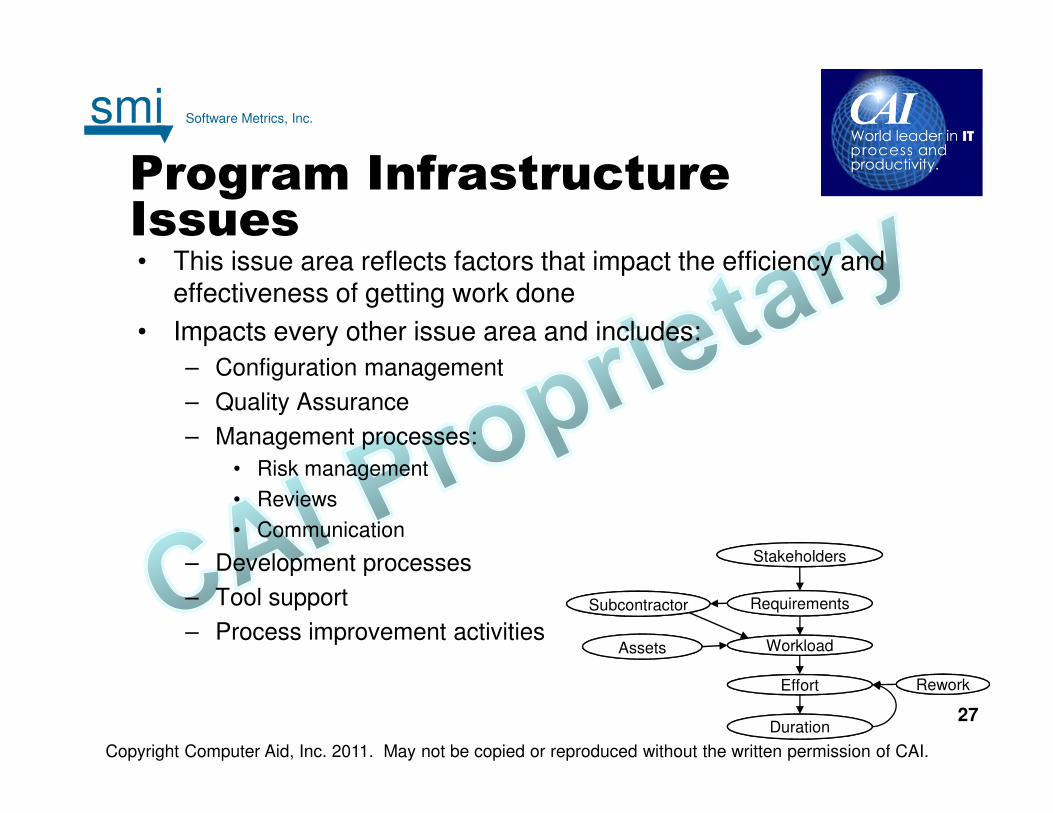
Program Infrastructure Issues• This issue area reflects factors that impact the efficiency and
effectiveness of getting work done
• Impacts every other issue area and includes:
– Configuration management
– Quality Assurance
– Management processes:
• Risk management
• Reviews
• Communication
– Development processes
– Tool support
– Process improvement activities
StakeholdersStakeholders
Assets
RequirementsRequirements
WorkloadWorkload
Effort ReworkRework
SubcontractorSubcontractor
Duration

smi Software Metrics, Inc.
Copyright Computer Aid, Inc. 2011. May not be copied or reproduced without the written permission of CAI.
28
When Progress Starts Slipping• Schedule slippage is an unfortunate reality for many complex
software development projects.
• Repeated slippages cause problems and embarrassment.
• In this presentation, we discuss an approach to finding the root-causes of schedule slippage and preventing future “surprises” using a four-step process:
– Re-check the plan
– Analyze for root causes
– Eliminate surprises with key measures
– Monitor the issue areas
smi Software Metrics, Inc.
Copyright Computer Aid, Inc. 2011. May not be copied or reproduced without the written permission of CAI.
29
• You can eliminate surprises by having access to information on progress and, equally important, on the problems found in the different issue areas.
– Key measures can help you objectively monitor and manage.
– Even qualitative information is useful
• Information in each of the issue areas become leading indicators of schedule slippage.
– A leading indicator of schedule slippage is a change in the status in
one issue area that will foretell a change in the program schedule.
– The root cause analysis model discussed in the previous step is a roadmap for setting up leading indicators of schedule slippage.
[PSM 00 & McGarry 01]
Step 3: Eliminate surprises with key measures

smi Software Metrics, Inc.
Copyright Computer Aid, Inc. 2011. May not be copied or reproduced without the written permission of CAI.
30
Design Progress
0
20
40
60
80
100
120
Ja
n-0
7
Fe
b-0
7
Ma
r-0
7
Ap
r-0
7
Ma
y-0
7
Ju
n-0
7
Ju
l-0
7
Au
g-0
7
Se
p-0
7
Oct-
07
No
v-0
7
De
c-0
7
De
sig
n U
nits C
om
ple
te
Design-Plan Design-Actual
Planned Progress
Actual Progress
Requirements Growth
0
20
40
60
80
100
120
140
160
180
Ja
n-0
7
Fe
b-0
7
Ma
r-0
7
Ap
r-0
7
Ma
y-0
7
Ju
n-0
7
Ju
l-0
7
Au
g-0
7
Se
p-0
7
Oct-
07
No
v-0
7
De
c-0
7
Nu
mb
er
of R
eq
uir
em
en
ts
Requirements
What could happen to Design Progress?
Leading Indicator Example -1

smi Software Metrics, Inc.
Copyright Computer Aid, Inc. 2011. May not be copied or reproduced without the written permission of CAI.
31
Code Growth
0
20
40
60
80
100
120
140
Ja
n-0
7
Fe
b-0
7
Ma
r-0
7
Ap
r-0
7
Ma
y-0
7
Ju
n-0
7
Ju
l-0
7
Au
g-0
7
Se
p-0
7
Oct-
07
No
v-0
7
De
c-0
7
Est. T
ota
l K
SL
OC
KSLOC
PTR Growth Rate
0
20
40
60
80
100
120
Ja
n-0
7
Fe
b-0
7
Ma
r-0
7
Ap
r-0
7
Ma
y-0
7
Ju
n-0
7
Ju
l-0
7
Au
g-0
7
Se
p-0
7
Oct-
07
No
v-0
7
De
c-0
7
Nu
mb
er
of P
TR
s
PRT-Open PTR-Closed
Test Progrress
01020304050607080
Ja
n-0
7
Fe
b-0
7
Ma
r-0
7
Ap
r-0
7
Ma
y-0
7
Ju
n-0
7
Ju
l-0
7
Au
g-0
7
Se
p-0
7
Oct-
07
No
v-0
7
De
c-0
7
Nu
mb
er
of T
est C
ase
s
Test-Plan Test-Actual
Staffing Levels
0
5
10
15
20
25
30
35
40
Ja
n-0
7
Fe
b-0
7
Ma
r-0
7
Ap
r-0
7
Ma
y-0
7
Ju
n-0
7
Ju
l-0
7
Au
g-0
7
Se
p-0
7
Oct-
07
No
v-0
7
De
c-0
7Nu
mb
er
of P
roje
ct P
ers
on
ne
l
Staffing
Leading Indicator Example -2

smi Software Metrics, Inc.
Copyright Computer Aid, Inc. 2011. May not be copied or reproduced without the written permission of CAI.
32
Issue Area Measurement Examples -1• Stakeholders Issue Area
– Survey of stakeholder expectations
– Issues raised by a stakeholder group
• Requirements Issue Area
– Changes to the number of requirements (added, deleted, modified)
– Changes to the functional size measure, e.g. function points
– Changes to interface specifications
– Number of functional change requests
smi Software Metrics, Inc.
Copyright Computer Aid, Inc. 2011. May not be copied or reproduced without the written permission of CAI.
33
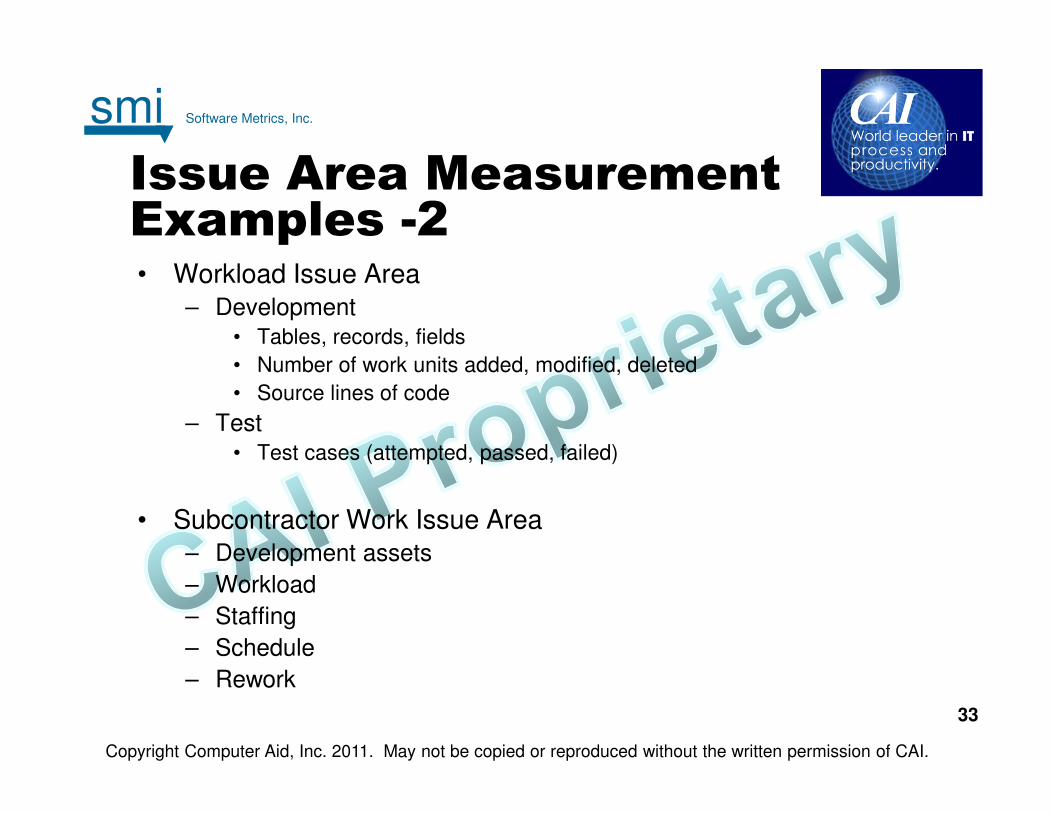
Issue Area Measurement Examples -2• Workload Issue Area
– Development• Tables, records, fields
• Number of work units added, modified, deleted
• Source lines of code
– Test• Test cases (attempted, passed, failed)
• Subcontractor Work Issue Area
– Development assets
– Workload
– Staffing
– Schedule
– Rework

smi Software Metrics, Inc.
Copyright Computer Aid, Inc. 2011. May not be copied or reproduced without the written permission of CAI.
34
Issue Area Measurement Examples -3• Development Assets Issue Area
– Legacy code• How much of the code is being modified
– COTS
• Number of functional and performance requirements that are not being fulfilled by COTS product
• Evolution of a product (even if the upgrade is not incorporated)
• Rework Issue Area
– Defects found during development
– Number of Problem Trouble Reports (PTRs) found during testing
– Repeat PTRs that were not fixed the first time
– Number of Operational Problem Reports
– Number of regression tests (re-tests)

smi Software Metrics, Inc.
Copyright Computer Aid, Inc. 2011. May not be copied or reproduced without the written permission of CAI.
35
Issue Area Measurement Examples -4• Staffing Issue Area
– Personnel turnover
– Staffing level
– Experience and skill levels
• Program Infrastructure Issue Area
– Quality Assurance Process Audits
– Configuration Management Audits
– Integration and Testing facilities
– Process improvement activities
– Risk management
smi Software Metrics, Inc.
Copyright Computer Aid, Inc. 2011. May not be copied or reproduced without the written permission of CAI.
36
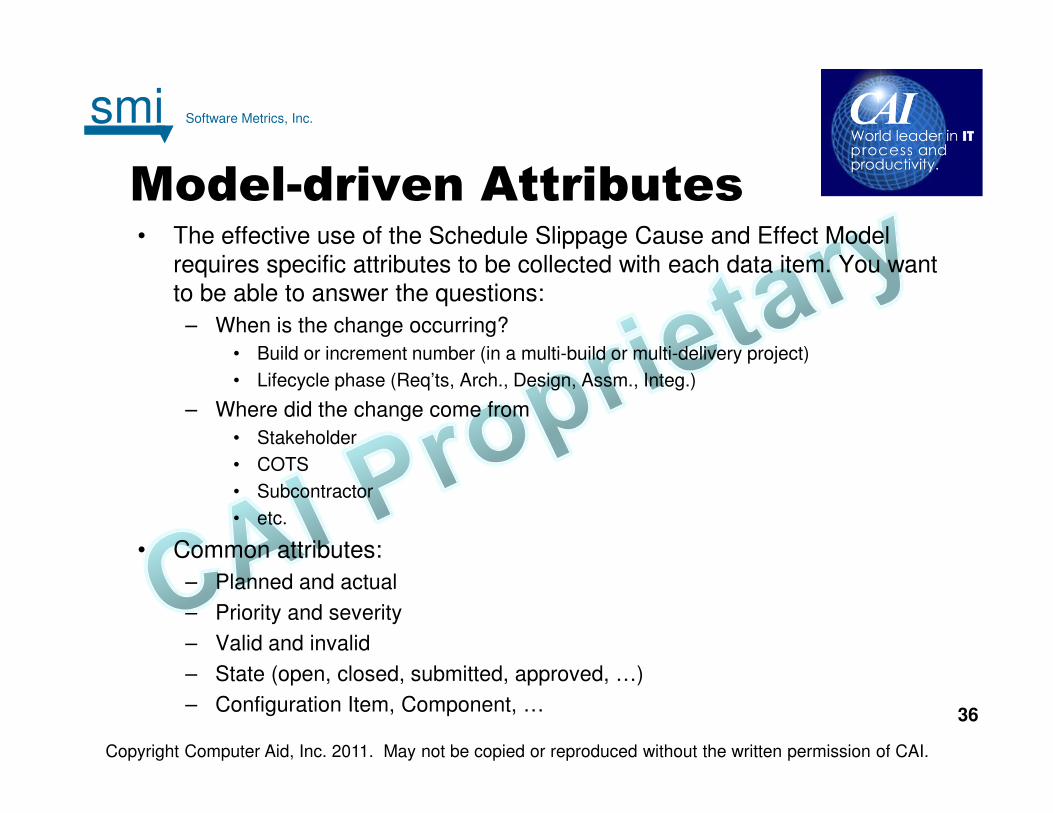
Model-driven Attributes• The effective use of the Schedule Slippage Cause and Effect Model
requires specific attributes to be collected with each data item. You want
to be able to answer the questions:
– When is the change occurring?
• Build or increment number (in a multi-build or multi-delivery project)
• Lifecycle phase (Req’ts, Arch., Design, Assm., Integ.)
– Where did the change come from
• Stakeholder
• COTS
• Subcontractor
• etc.
• Common attributes:
– Planned and actual
– Priority and severity
– Valid and invalid
– State (open, closed, submitted, approved, …)
– Configuration Item, Component, …

smi Software Metrics, Inc.
Copyright Computer Aid, Inc. 2011. May not be copied or reproduced without the written permission of CAI.
37
Step 4: Monitor the issue areas• Key measures require access to data in the different issue areas
• Measurement description needs to meet three criteria:
– Enhance Communication: Everyone can understand exactly “what” is
being measured
– Ensure Repeatability: Two or more people can independently collect the data and the results will be identical
• Data should be based on objective criteria:
– Completed activities
– Finished work products
• Data should be collected frequently enough to correct the underlying problem(s) before progress is impacted
• For each measure, a “measurement owner” needs to be identified and held accountable for improving performance

smi Software Metrics, Inc.
Copyright Computer Aid, Inc. 2011. May not be copied or reproduced without the written permission of CAI.
38
Measurement Description
Data Information
• Measure Name
• Purpose• Definition
• Attributes
• Baseline Data• Target / Desired Result
• Priority
• Build / Release• Lifecycle phase
Collection Information
• Data Source
• Collection Method• Collection Frequency
• Person responsible for
ensuring accuracy of data
Report Information
• Reporting Frequency• Report Creator
• Manager responsible for meeting targets
Measurement Description Template
smi Software Metrics, Inc.
Copyright Computer Aid, Inc. 2011. May not be copied or reproduced without the written permission of CAI.
39
Summary• The common methods used to track project progress do not show
“why” progress is slipping
• When slippage occurs, the first thing to assess is the realism of the plan
• Finding the causes of schedule slippage is the only chance you have to stop it
– Described nine issue areas for organizing information (starter set)
• There may be other issue areas that are unique to a project
– Described a schedule slippage cause and effect model
• By understanding the cause and effect of the different issue areas, you can use the model to head off impacts to the program schedule before they occur.
– Leading indicators warn of possible future occurrences of slippage
smi Software Metrics, Inc.
Copyright Computer Aid, Inc. 2011. May not be copied or reproduced without the written permission of CAI.
40
Conclusions
• Measures in each of the issue areas can focus attention and serve as the basis for objective communication
• Even without measurement data, the model can be useful as a guide in asking questions to identify
– Root causes of schedule slippage
– Missing information
• Any analysis of schedule slippage is challenged by software development lifecycles that do not have frequent “set-points”
smi Software Metrics, Inc.
Copyright Computer Aid, Inc. 2011. May not be copied or reproduced without the written permission of CAI.
41
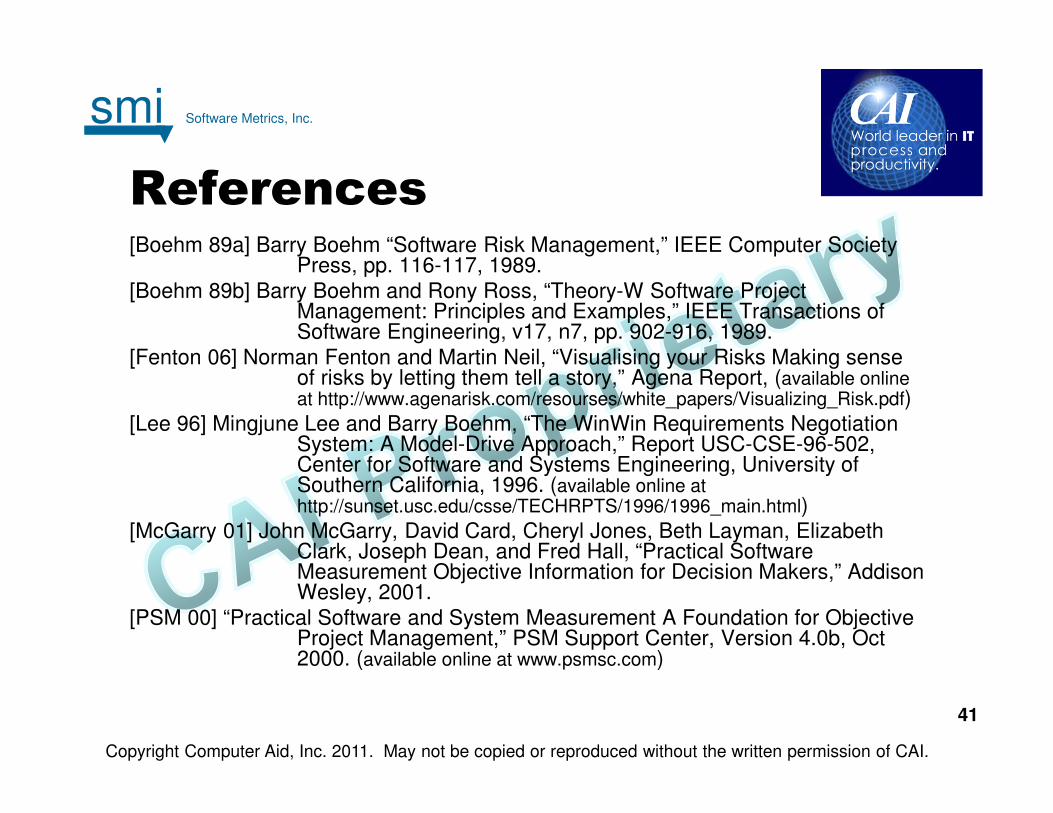
References[Boehm 89a] Barry Boehm “Software Risk Management,” IEEE Computer Society
Press, pp. 116-117, 1989.
[Boehm 89b] Barry Boehm and Rony Ross, “Theory-W Software Project Management: Principles and Examples,” IEEE Transactions of Software Engineering, v17, n7, pp. 902-916, 1989.
[Fenton 06] Norman Fenton and Martin Neil, “Visualising your Risks Making sense of risks by letting them tell a story,” Agena Report, (available online at http://www.agenarisk.com/resourses/white_papers/Visualizing_Risk.pdf)
[Lee 96] Mingjune Lee and Barry Boehm, “The WinWin Requirements Negotiation System: A Model-Drive Approach,” Report USC-CSE-96-502, Center for Software and Systems Engineering, University of Southern California, 1996. (available online at http://sunset.usc.edu/csse/TECHRPTS/1996/1996_main.html)
[McGarry 01] John McGarry, David Card, Cheryl Jones, Beth Layman, Elizabeth Clark, Joseph Dean, and Fred Hall, “Practical Software Measurement Objective Information for Decision Makers,” Addison Wesley, 2001.
[PSM 00] “Practical Software and System Measurement A Foundation for Objective Project Management,” PSM Support Center, Version 4.0b, Oct 2000. (available online at www.psmsc.com)
smi Software Metrics, Inc.
Copyright Computer Aid, Inc. 2011. May not be copied or reproduced without the written permission of CAI.
42
Questions?
Your PDU CODE: S010-ITMPI08061

smi Software Metrics, Inc.
Copyright Computer Aid, Inc. 2011. May not be copied or reproduced without the written permission of CAI.
4343
CAI Sponsors
The IT Metrics Productivity Institute:
• Clearinghouse repository of best practices: WWW.ITMPI.ORG
• Weekly educational newsletter: WWW.ITMPI.ORG / SUBSCRIBE
• Weekly webinars hosted by industry leaders: WWW.ITMPI.ORG / WEBINARS
• ACCESS WEBINAR RECORDINGS ANYTIME AT WWW.ITMPI.ORG / LIBRARY

smi Software Metrics, Inc.
Copyright Computer Aid, Inc. 2011. May not be copied or reproduced without the written permission of CAI.
44
Software Best Practices Conferences
Around the World
WWW.ITMPI.ORG / EVENTS
Fall 2008
Sept. 9 Pittsburgh, PA
Oct. 1 Toronto, ON
Oct. 16 Detroit, MI
Oct. 21 Tampa, FL
Oct. 23 Miami, FL
Oct. 30 New York, NY
Nov. 6 Philadelphia, PA
Nov. 13 Chicago, IL
Nov. 20 Baton Rouge, LA
Dates and Locations
Spring 2009
Mar. 10 Orlando, FL
Mar. 19 Princeton, NJ
Mar. 31 Albany, NY
Apr. 21 Detroit, MI
Apr. 28 Tallahassee, FL
May 5 New York, NY
May 14 Tampa, FL
May 19 Philadelphia, PA
Jun. 2 Rochester, NY

smi Software Metrics, Inc.
Copyright Computer Aid, Inc. 2011. May not be copied or reproduced without the written permission of CAI.
45
Brad Clark, Ph.D.Vice-President
Software Metrics Inc.
Michael MilutisDirector of Marketing
Computer Aid, Inc. (CAI)