Embed Size (px)
Citation preview
10. Software Metrics
CHAPTER 10 – Software MetricsIntroduction
• When, Why and What ?+ Measurement Theory+ GQM Paradigm
Effort Estimation• Algorithmic Cost Modeling• COCOMO• Putnam’s model (SLIM)• Size Measures
+ Lines of Code, Function Points+ Use case points
Quality Control• Quantitative Quality Model• Sample Quality Metrics
Conclusion• Metrics for Effort Estimation & Quality Control
1
10. Software Metrics
Literature• [Ghez02a] In particular, section 6.9 “Verifying Other Software
Properties” and 8.2 “Project Planning”• [Pres01a] In particular, chapters “Software Process and Project Metrics”
and “Software Project Planning“• [Somm04a] In particular, chapters “Software Cost Estimation” and
“Process Improvement”Other
• [Fent96a] Norman E. Fenton, Shari l. Pfleeger, “Software Metrics: A rigorous & Practical Approach”, Thompson Computer Press, 1996.
+ Thorough treatment of measurement theory with lots of advice to make it digestible.
• [Putn03a] Lawrence H. Putnam and Ware Myers, “Five Core Metrics - The intelligence behind Successful Software Management”, Dorset House Publishing, 2003.
+ Software estimation: Time and Effort are dependent variables !• [Schn98a] Applying Use Cases - a Practical Guide, Geri Schneider,
Jason, P. Winters, Addison-Wesley, 1998.+ Chapter 8 describes early work on estimation based on use cases.
2
10. Software Metrics
When Metrics ?
3
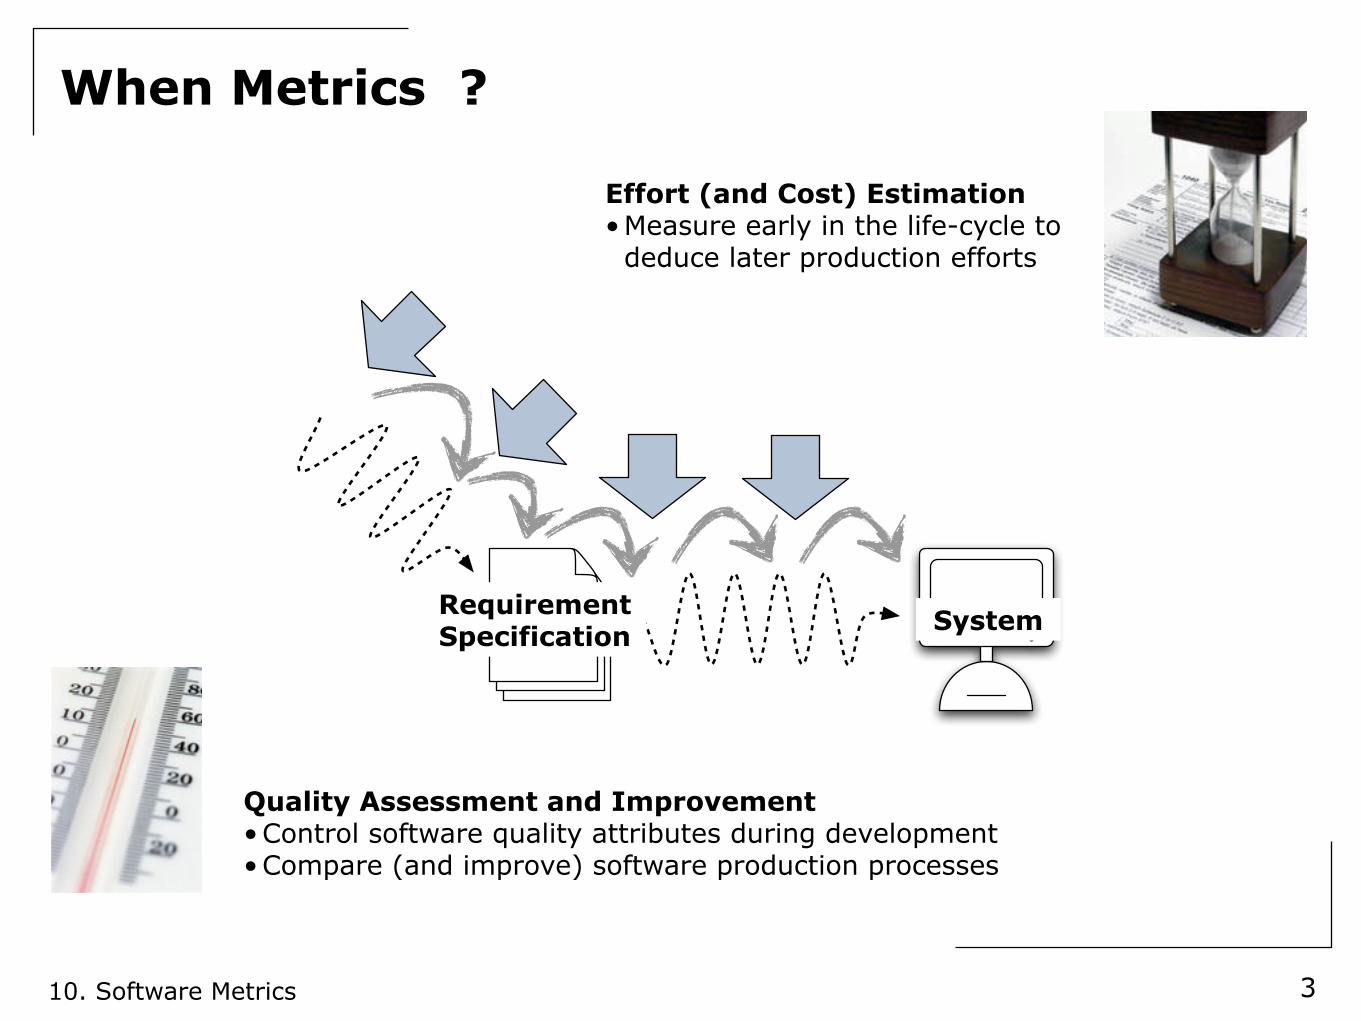
RequirementSpecification System
Effort (and Cost) Estimation•Measure early in the life-cycle to
deduce later production efforts
Quality Assessment and Improvement•Control software quality attributes during development•Compare (and improve) software production processes
10. Software Metrics
Why (Software) Metrics ?
4
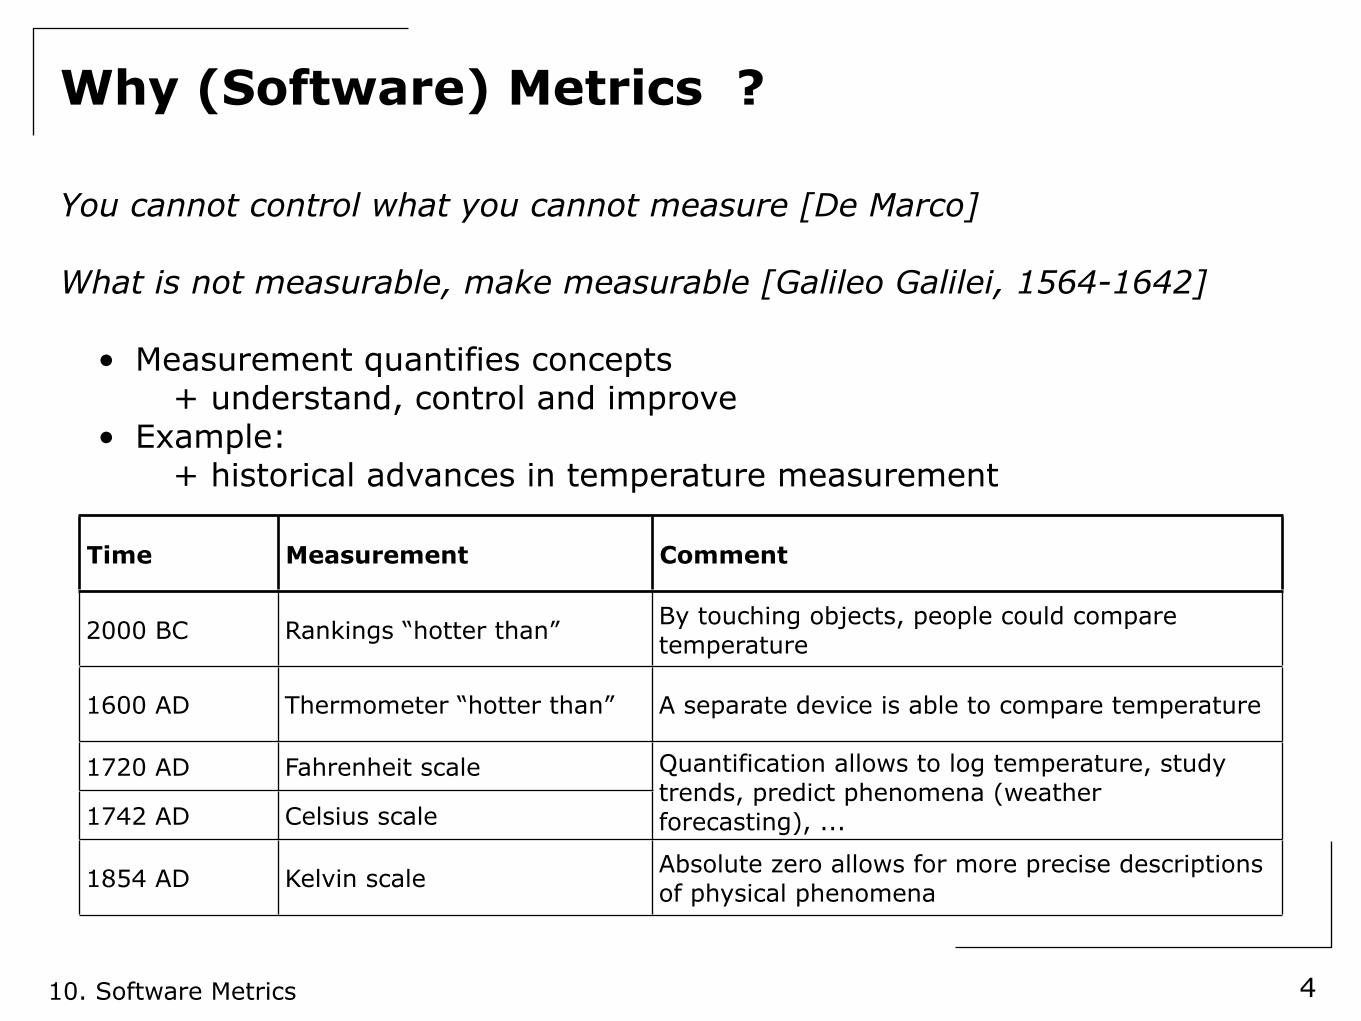
You cannot control what you cannot measure [De Marco]
What is not measurable, make measurable [Galileo Galilei, 1564-1642]
• Measurement quantifies concepts+ understand, control and improve
• Example:+ historical advances in temperature measurement
Time Measurement Comment
2000 BC Rankings “hotter than”By touching objects, people could compare temperature
1600 AD Thermometer “hotter than” A separate device is able to compare temperature
1720 AD Fahrenheit scale Quantification allows to log temperature, study trends, predict phenomena (weather forecasting), ...1742 AD Celsius scale
Quantification allows to log temperature, study trends, predict phenomena (weather forecasting), ...
1854 AD Kelvin scaleAbsolute zero allows for more precise descriptions of physical phenomena
10. Software Metrics
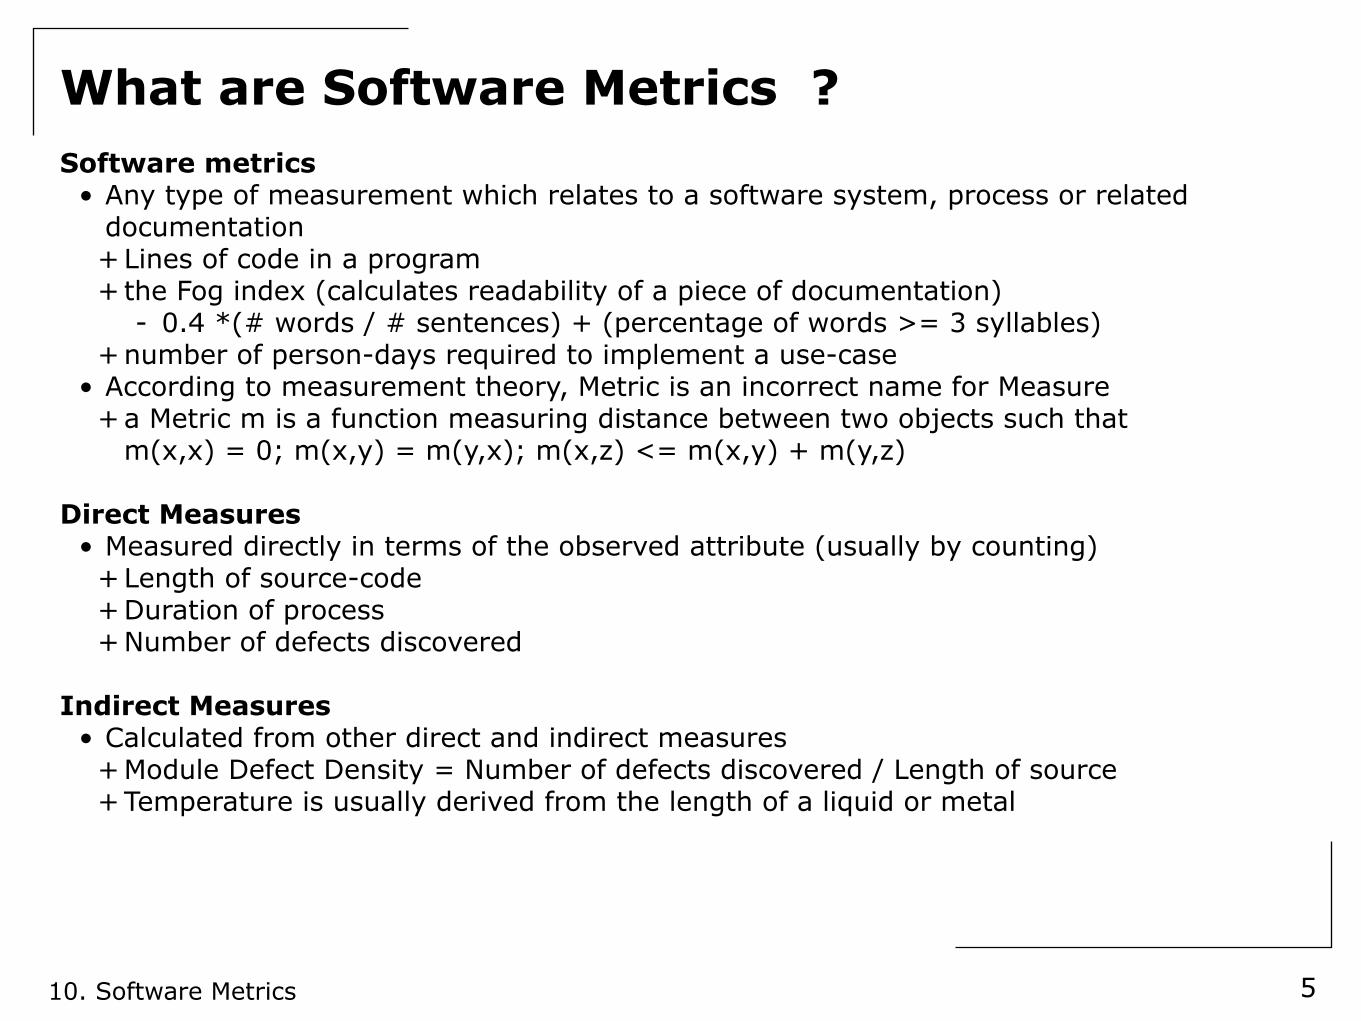
What are Software Metrics ?Software metrics
• Any type of measurement which relates to a software system, process or related documentation+Lines of code in a program+the Fog index (calculates readability of a piece of documentation)
- 0.4 *(# words / # sentences) + (percentage of words >= 3 syllables)+number of person-days required to implement a use-case
• According to measurement theory, Metric is an incorrect name for Measure+a Metric m is a function measuring distance between two objects such that
m(x,x) = 0; m(x,y) = m(y,x); m(x,z) <= m(x,y) + m(y,z)
Direct Measures• Measured directly in terms of the observed attribute (usually by counting)
+Length of source-code+Duration of process+Number of defects discovered
Indirect Measures• Calculated from other direct and indirect measures
+Module Defect Density = Number of defects discovered / Length of source+Temperature is usually derived from the length of a liquid or metal
5
10. Software Metrics
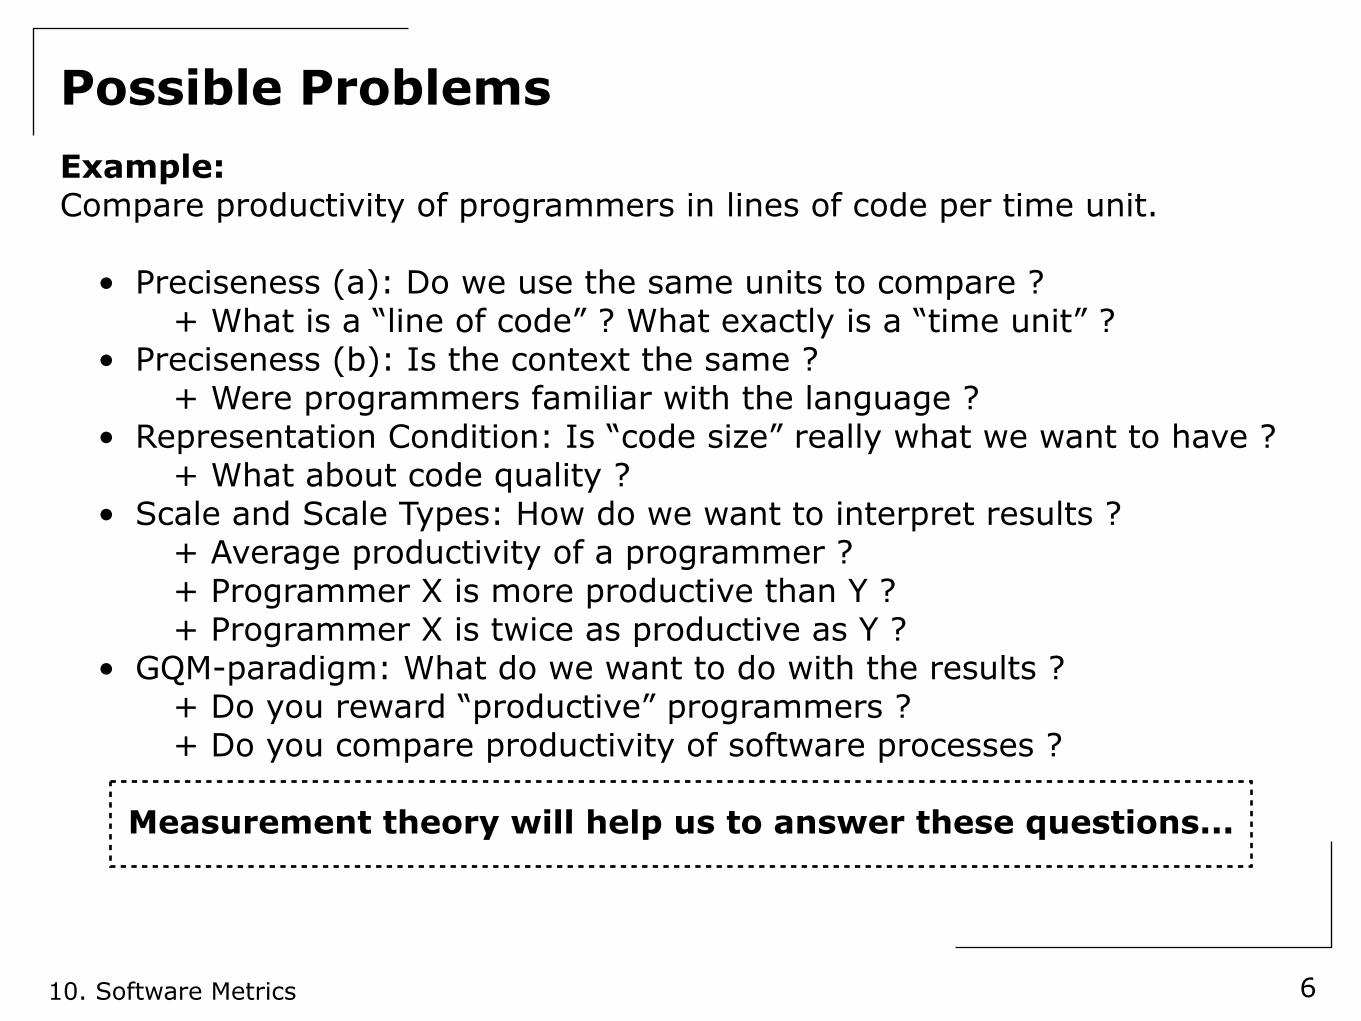
Possible ProblemsExample:Compare productivity of programmers in lines of code per time unit.
• Preciseness (a): Do we use the same units to compare ?+ What is a “line of code” ? What exactly is a “time unit” ?
• Preciseness (b): Is the context the same ?+ Were programmers familiar with the language ?
• Representation Condition: Is “code size” really what we want to have ?+ What about code quality ?
• Scale and Scale Types: How do we want to interpret results ?+ Average productivity of a programmer ?+ Programmer X is more productive than Y ?+ Programmer X is twice as productive as Y ?
• GQM-paradigm: What do we want to do with the results ?+ Do you reward “productive” programmers ?+ Do you compare productivity of software processes ?
Measurement theory will help us to answer these questions...
6
10. Software Metrics
Empirical Relations
7
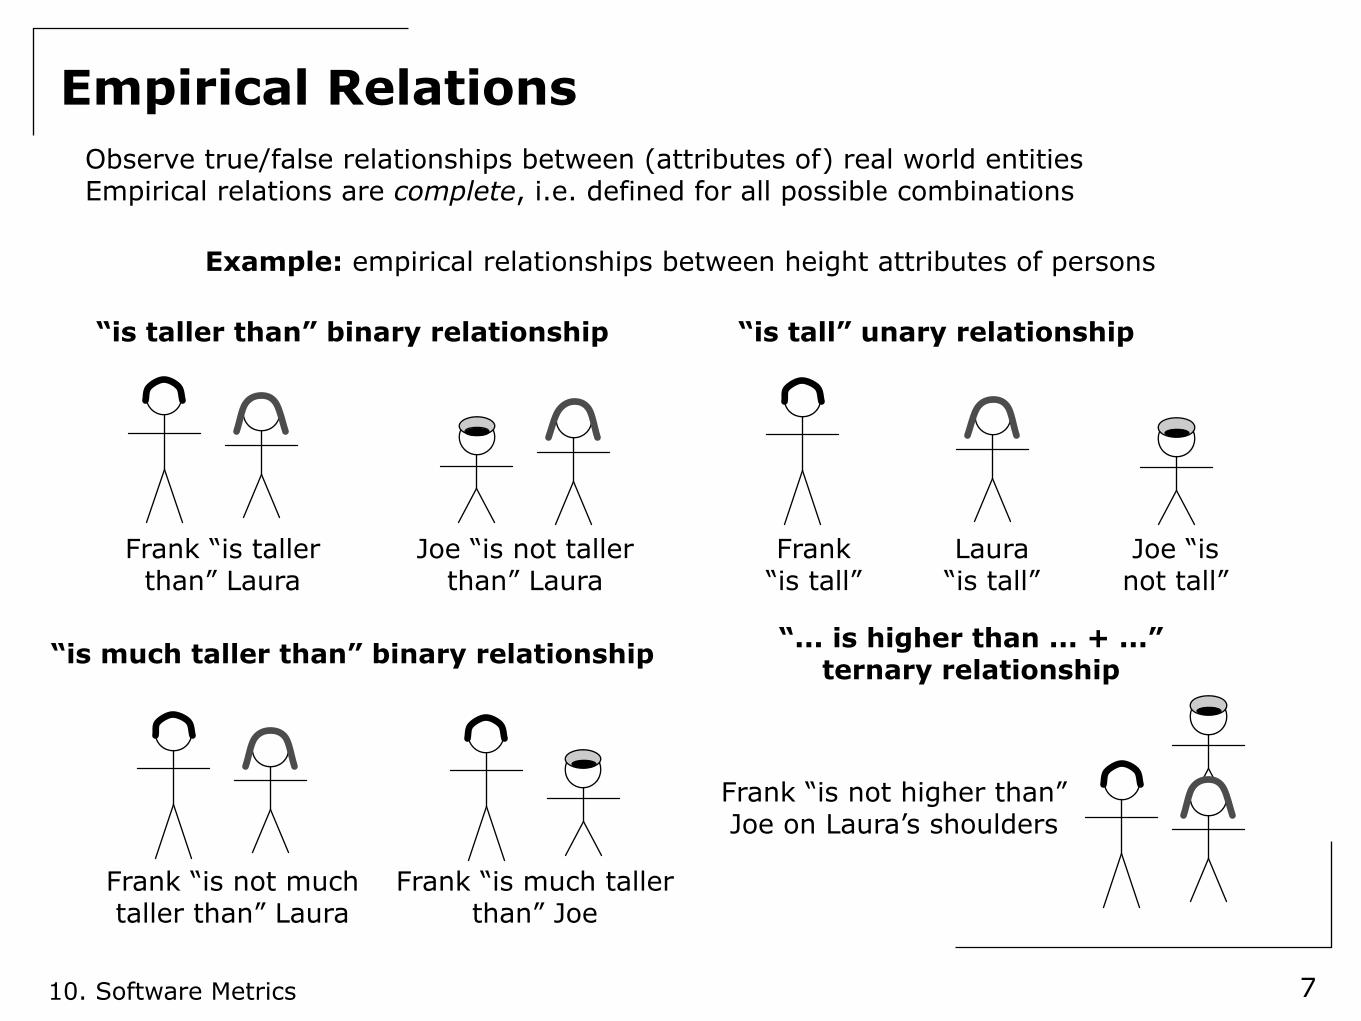
Observe true/false relationships between (attributes of) real world entitiesEmpirical relations are complete, i.e. defined for all possible combinations
Example: empirical relationships between height attributes of persons
“is taller than” binary relationship “is tall” unary relationship
“is much taller than” binary relationship “... is higher than ... + ...”ternary relationship
Frank “is tallerthan” Laura
Joe “is not tallerthan” Laura
Frank“is tall”
Laura“is tall”
Joe “isnot tall”
Frank “is not muchtaller than” Laura
Frank “is much tallerthan” Joe
Frank “is not higher than”Joe on Laura’s shoulders
10. Software Metrics
Measure & Measurement
8
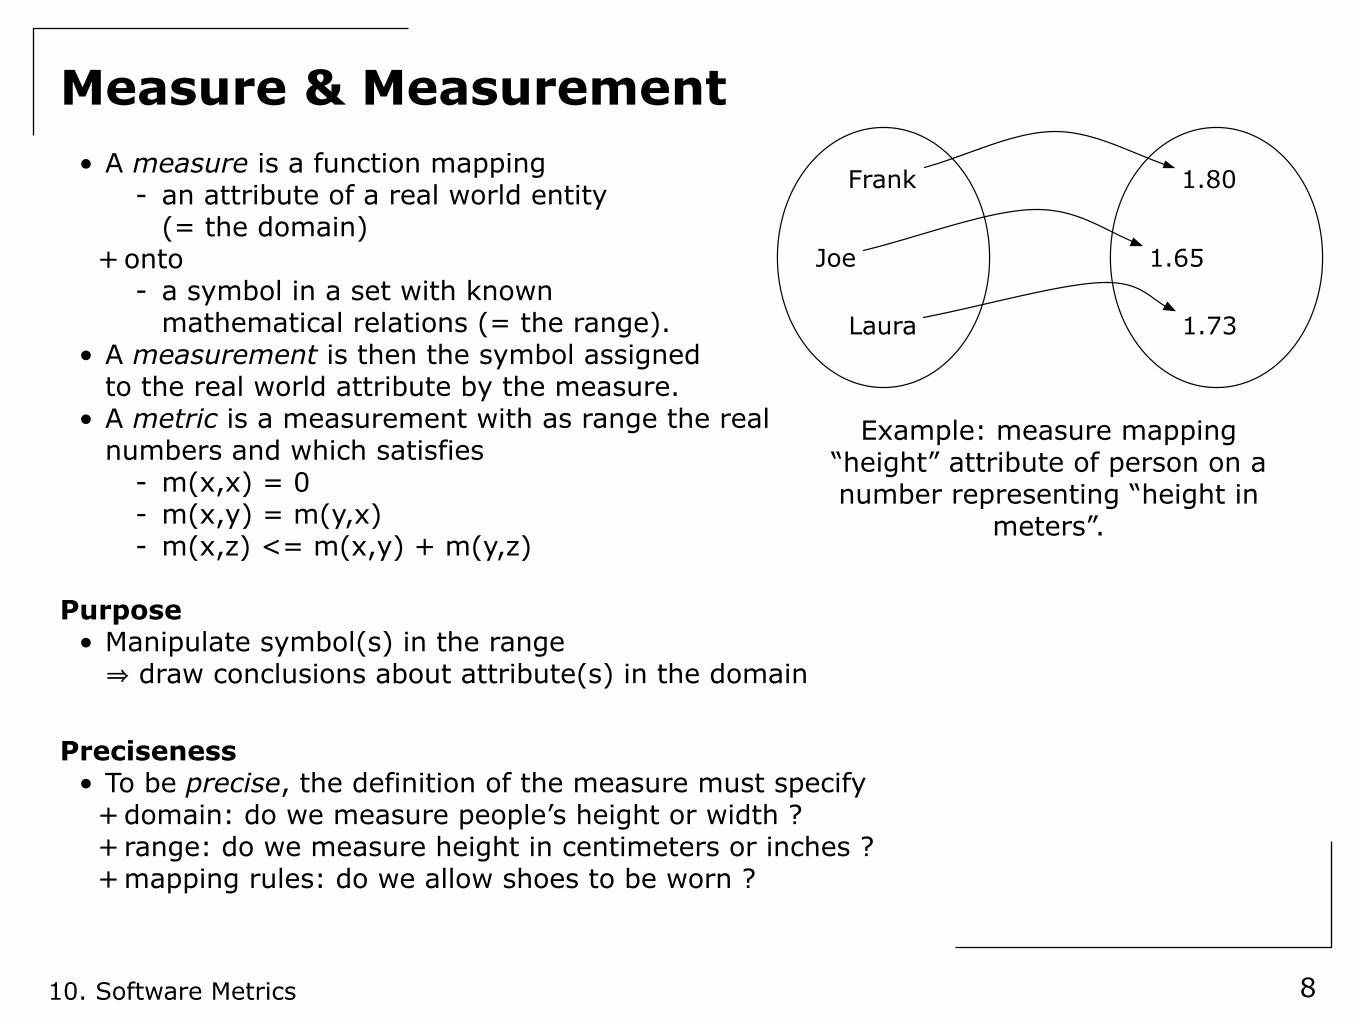
• A measure is a function mapping- an attribute of a real world entity
(= the domain)+onto
- a symbol in a set with knownmathematical relations (= the range).
• A measurement is then the symbol assignedto the real world attribute by the measure.
• A metric is a measurement with as range the realnumbers and which satisfies
- m(x,x) = 0- m(x,y) = m(y,x)- m(x,z) <= m(x,y) + m(y,z)
Purpose• Manipulate symbol(s) in the range⇒ draw conclusions about attribute(s) in the domain
Preciseness• To be precise, the definition of the measure must specify
+domain: do we measure people’s height or width ?+ range: do we measure height in centimeters or inches ?+mapping rules: do we allow shoes to be worn ?
Frank
Joe
Laura
1.80
1.65
1.73
Example: measure mapping “height” attribute of person on a number representing “height in
meters”.
10. Software Metrics
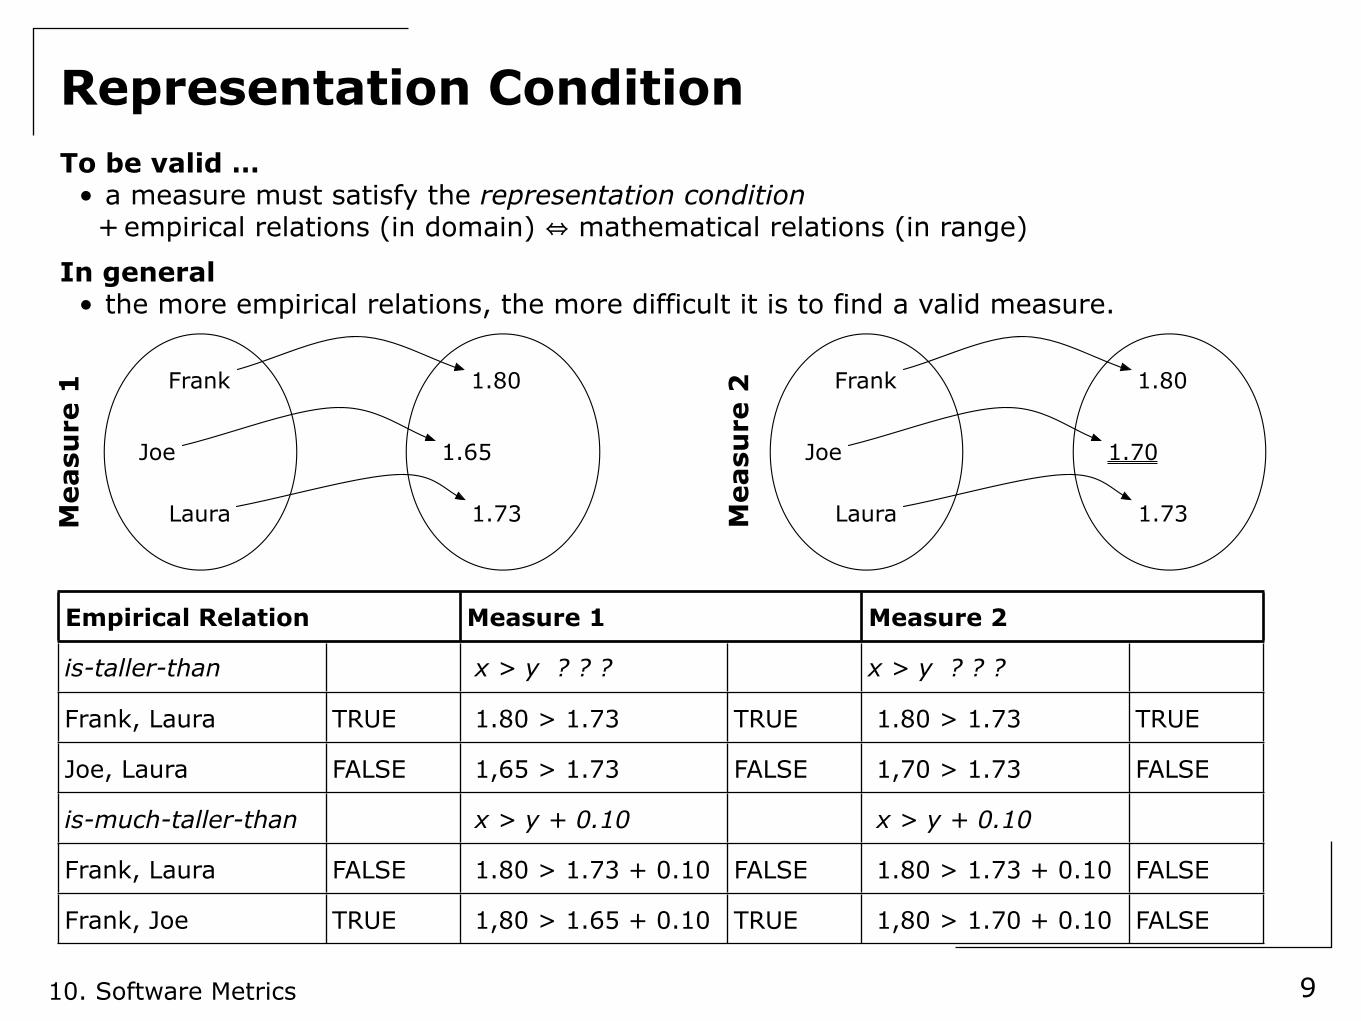
Representation ConditionTo be valid …
• a measure must satisfy the representation condition+empirical relations (in domain) ⇔ mathematical relations (in range)
In general• the more empirical relations, the more difficult it is to find a valid measure.
9
Frank
Joe
Laura
1.80
1.65
1.73
Frank
Joe
Laura
1.80
1.70
1.73Measu
re 2
Measu
re 1
Empirical RelationEmpirical Relation Measure 1Measure 1 Measure 2Measure 2
is-taller-than x > y ? ? ? x > y ? ? ?
Frank, Laura TRUE 1.80 > 1.73 TRUE 1.80 > 1.73 TRUE
Joe, Laura FALSE 1,65 > 1.73 FALSE 1,70 > 1.73 FALSE
is-much-taller-than x > y + 0.10 x > y + 0.10
Frank, Laura FALSE 1.80 > 1.73 + 0.10 FALSE 1.80 > 1.73 + 0.10 FALSE
Frank, Joe TRUE 1,80 > 1.65 + 0.10 TRUE 1,80 > 1.70 + 0.10 FALSE
10. Software Metrics
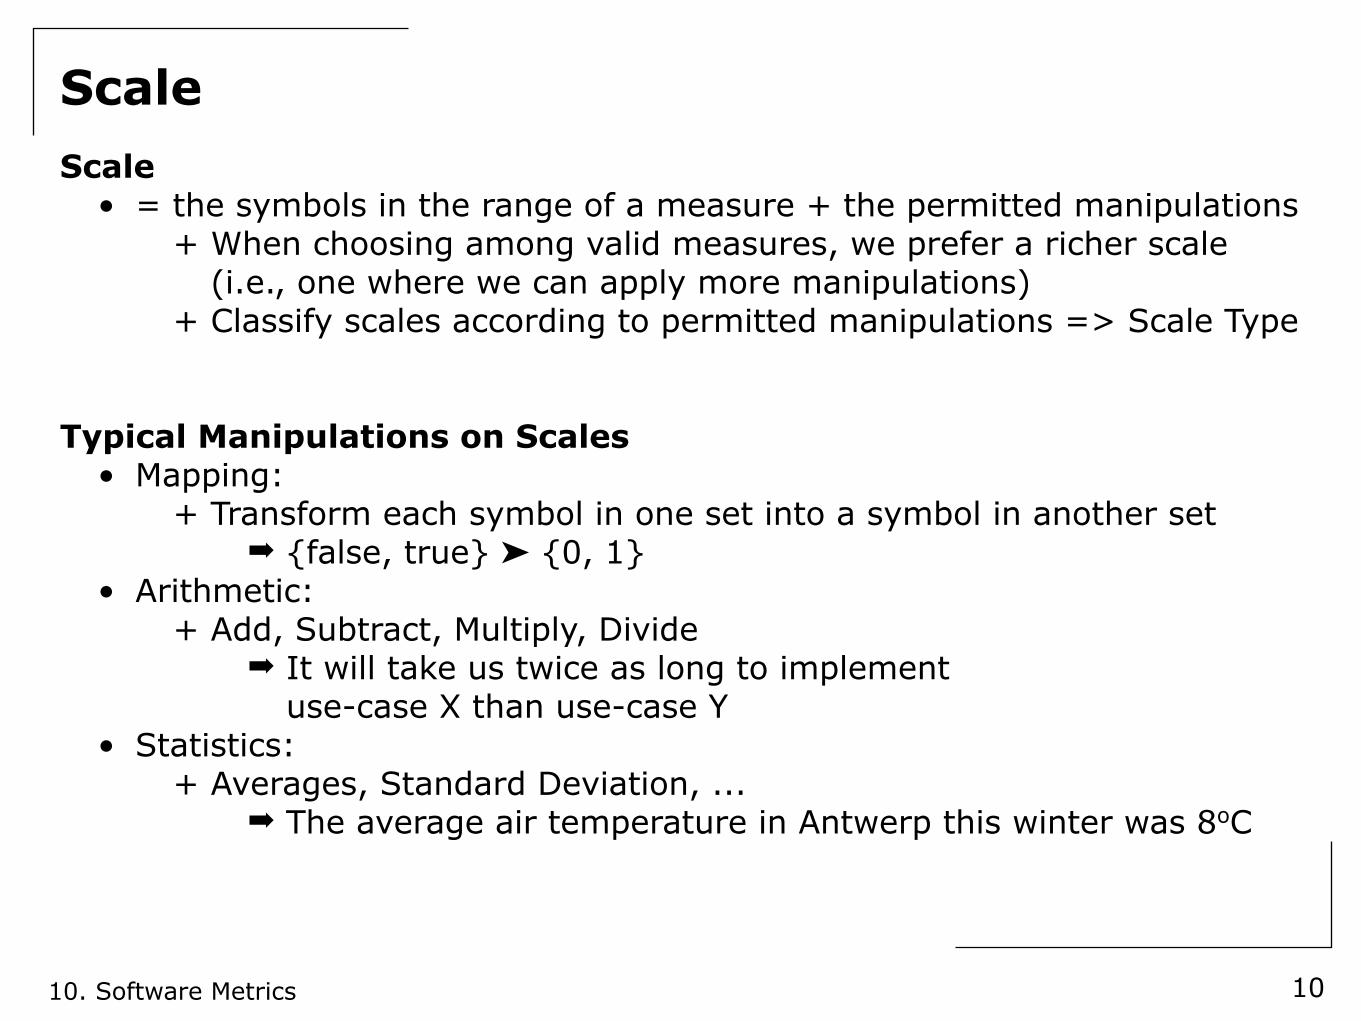
ScaleScale
• = the symbols in the range of a measure + the permitted manipulations+ When choosing among valid measures, we prefer a richer scale
(i.e., one where we can apply more manipulations)+ Classify scales according to permitted manipulations => Scale Type
Typical Manipulations on Scales• Mapping:
+ Transform each symbol in one set into a symbol in another set➡ {false, true} ➤ {0, 1}
• Arithmetic:+ Add, Subtract, Multiply, Divide
➡ It will take us twice as long to implementuse-case X than use-case Y
• Statistics:+ Averages, Standard Deviation, ...
➡ The average air temperature in Antwerp this winter was 8oC
10
10. Software Metrics
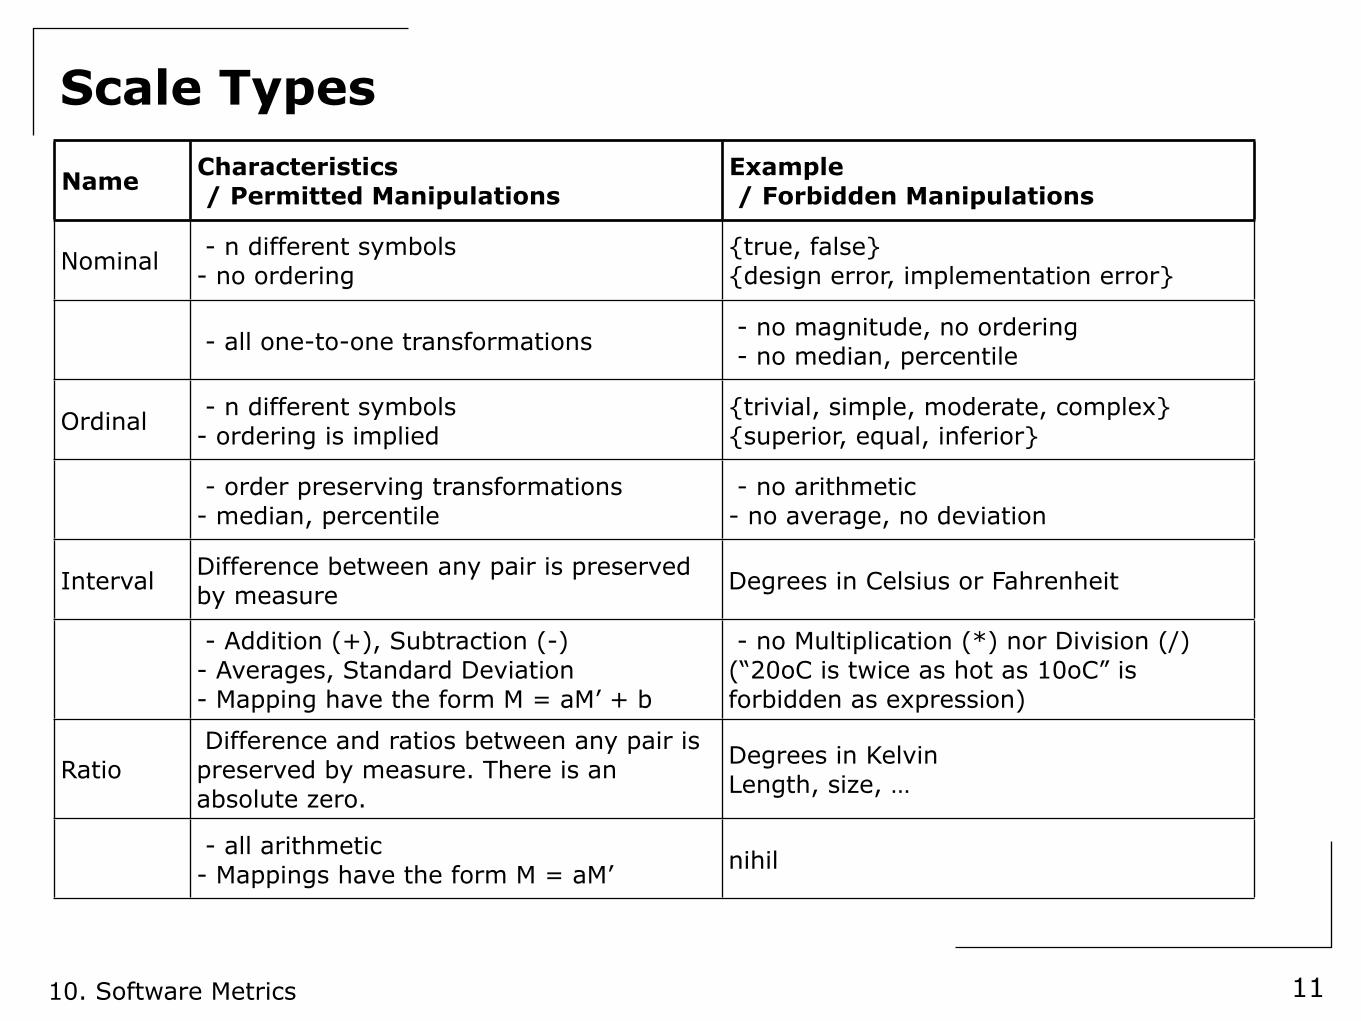
Scale Types
11
Name Characteristics / Permitted Manipulations
Example / Forbidden Manipulations
Nominal - n different symbols- no ordering
{true, false}{design error, implementation error}
- all one-to-one transformations - no magnitude, no ordering - no median, percentile
Ordinal - n different symbols- ordering is implied
{trivial, simple, moderate, complex}{superior, equal, inferior}
- order preserving transformations- median, percentile
- no arithmetic- no average, no deviation
IntervalDifference between any pair is preserved by measure
Degrees in Celsius or Fahrenheit
- Addition (+), Subtraction (-)- Averages, Standard Deviation- Mapping have the form M = aM’ + b
- no Multiplication (*) nor Division (/)(“20oC is twice as hot as 10oC” is forbidden as expression)
Ratio Difference and ratios between any pair is preserved by measure. There is an absolute zero.
Degrees in KelvinLength, size, …
- all arithmetic- Mappings have the form M = aM’
nihil
10. Software Metrics
GQM
12
Goal - Question - Metrics approach➡ [Basili 1988]
• Define Goal+ e.g., “How effective is the coding standard XYZ ?”
• Break down into Questions+ “Who is using XYZ ?”+ “What is productivity/quality with/without XYZ ?”
• Pick suitable Metrics+ Proportion of developers using XYZ+ Their experience with XYZ ...+ Resulting code size, complexity, robustness ...
10. Software Metrics
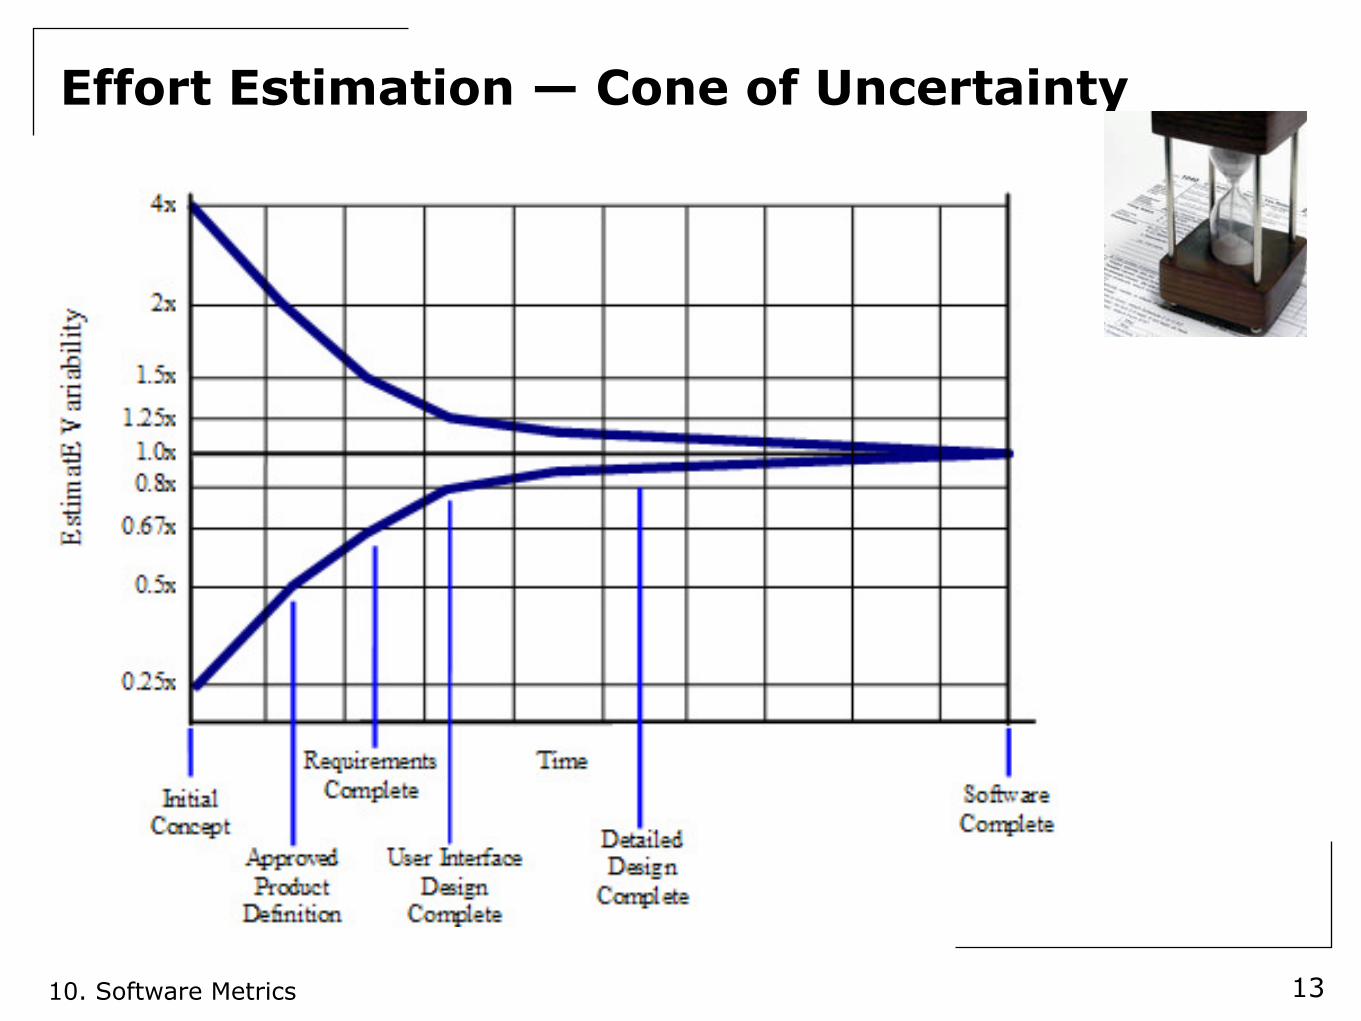
Effort Estimation — Cone of Uncertainty
13
10. Software Metrics
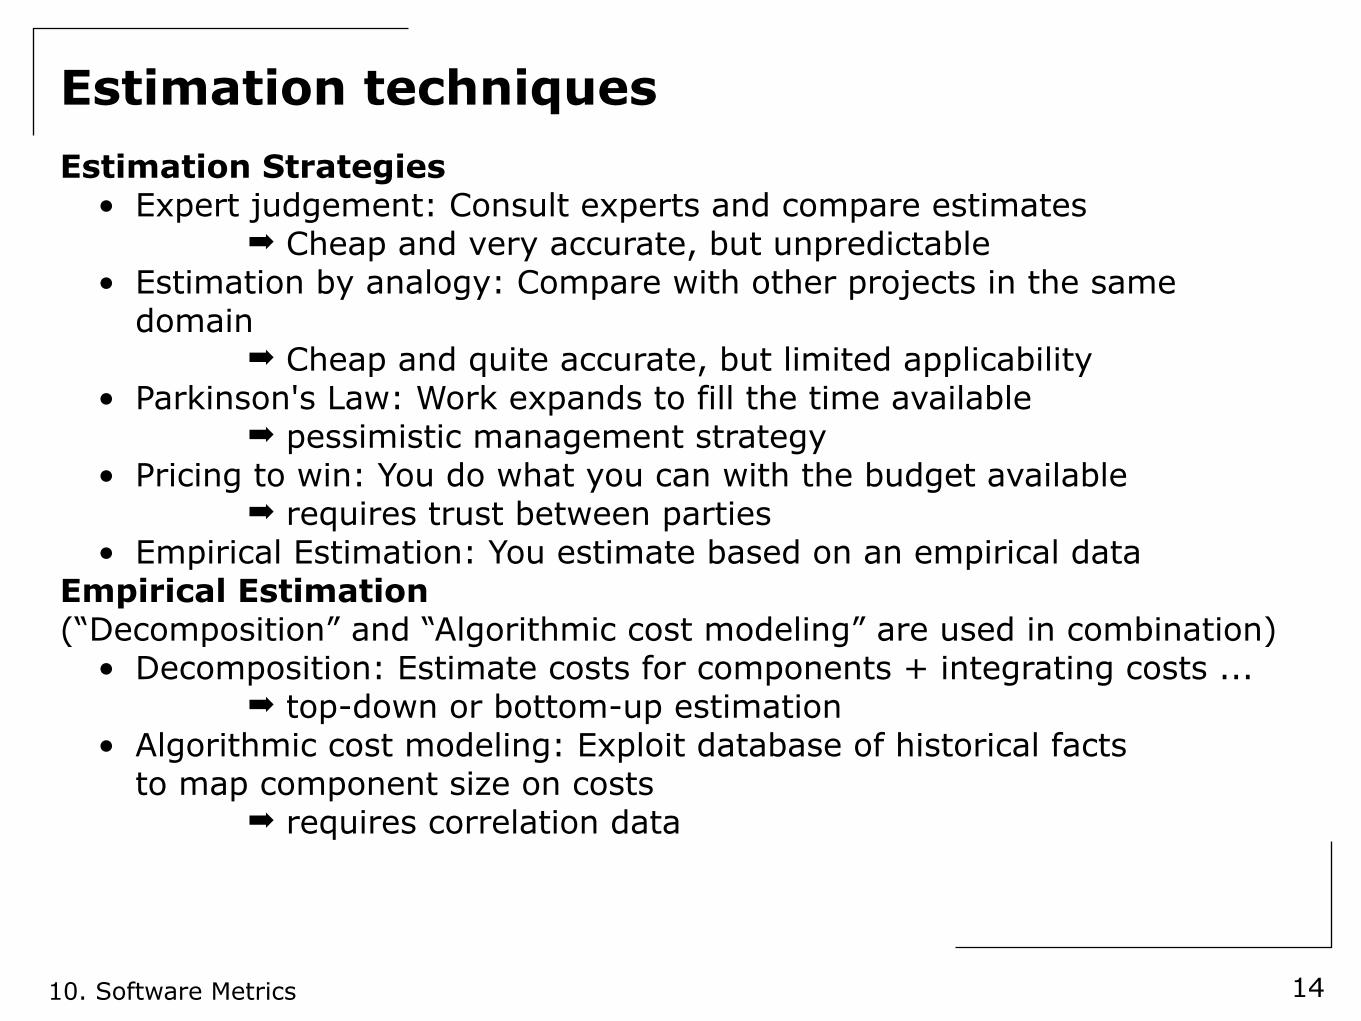
Estimation techniquesEstimation Strategies
• Expert judgement: Consult experts and compare estimates➡ Cheap and very accurate, but unpredictable
• Estimation by analogy: Compare with other projects in the same domain
➡ Cheap and quite accurate, but limited applicability• Parkinson's Law: Work expands to fill the time available
➡ pessimistic management strategy• Pricing to win: You do what you can with the budget available
➡ requires trust between parties• Empirical Estimation: You estimate based on an empirical data
Empirical Estimation(“Decomposition” and “Algorithmic cost modeling” are used in combination)
• Decomposition: Estimate costs for components + integrating costs ...➡ top-down or bottom-up estimation
• Algorithmic cost modeling: Exploit database of historical factsto map component size on costs
➡ requires correlation data
14
10. Software Metrics
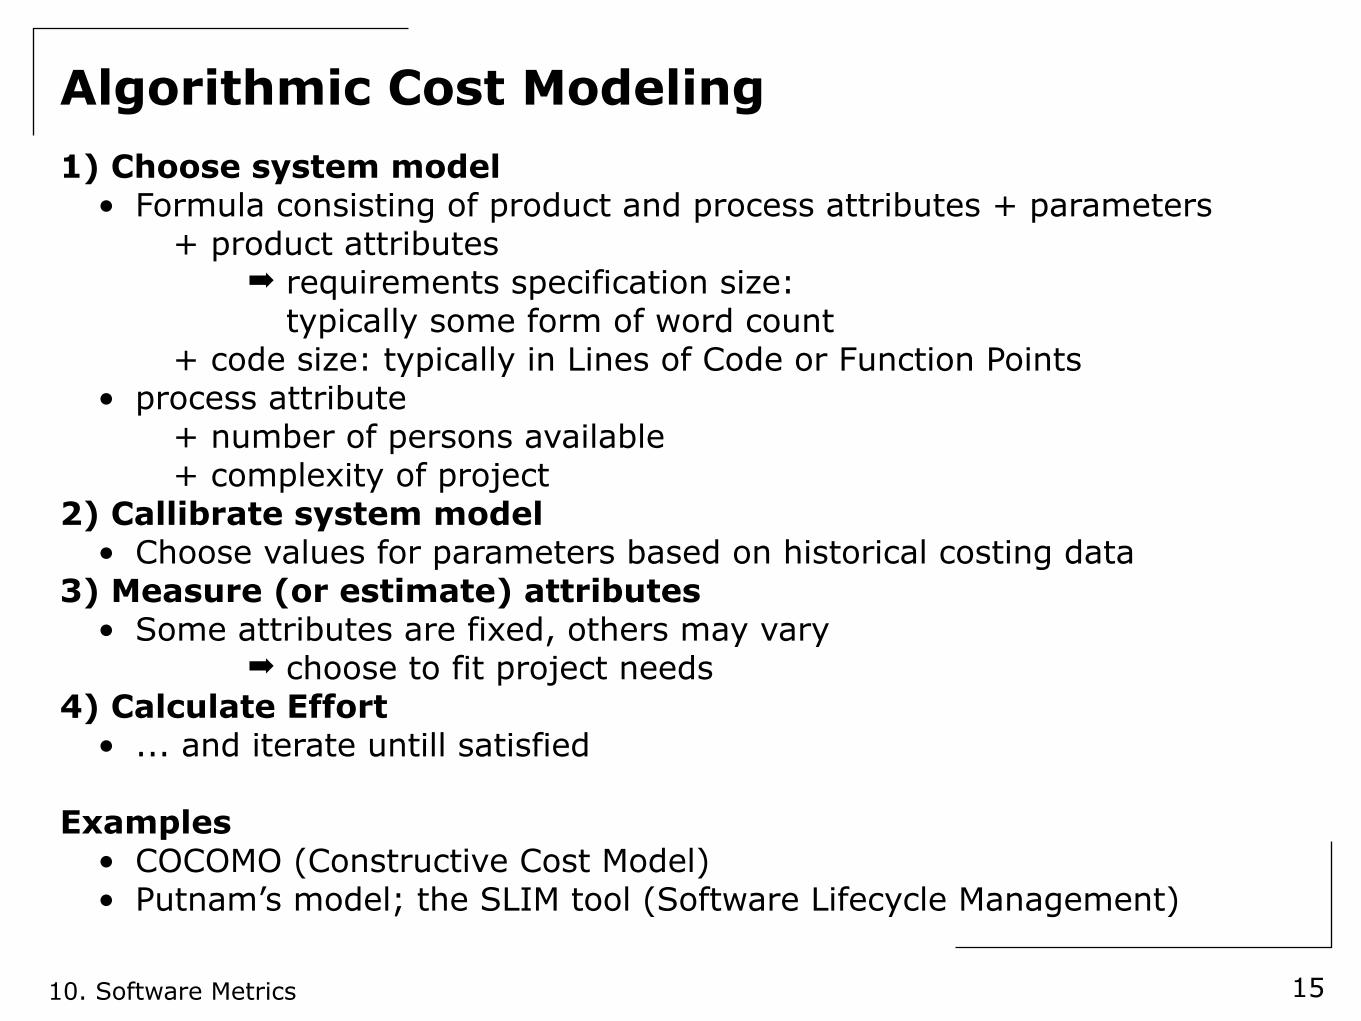
Algorithmic Cost Modeling1) Choose system model
• Formula consisting of product and process attributes + parameters+ product attributes
➡ requirements specification size:typically some form of word count
+ code size: typically in Lines of Code or Function Points• process attribute
+ number of persons available+ complexity of project
2) Callibrate system model• Choose values for parameters based on historical costing data
3) Measure (or estimate) attributes• Some attributes are fixed, others may vary
➡ choose to fit project needs4) Calculate Effort
• ... and iterate untill satisfied
Examples• COCOMO (Constructive Cost Model)• Putnam’s model; the SLIM tool (Software Lifecycle Management)
15
10. Software Metrics
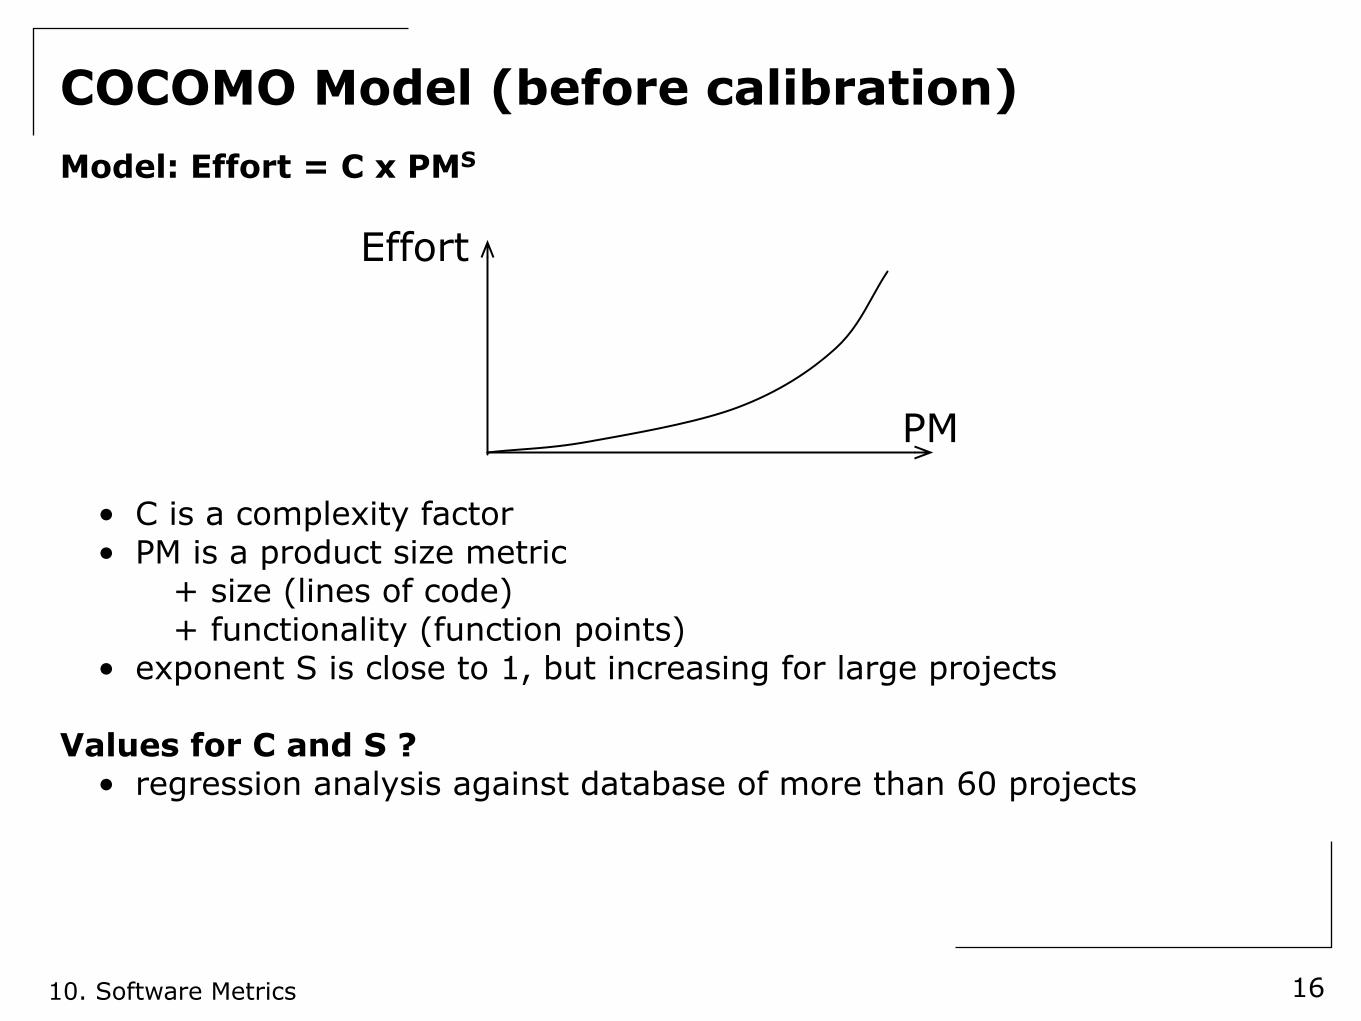
COCOMO Model (before calibration)
16
Model: Effort = C x PMS
• C is a complexity factor• PM is a product size metric
+ size (lines of code)+ functionality (function points)
• exponent S is close to 1, but increasing for large projects
Values for C and S ?• regression analysis against database of more than 60 projects
Effort
PM
10. Software Metrics
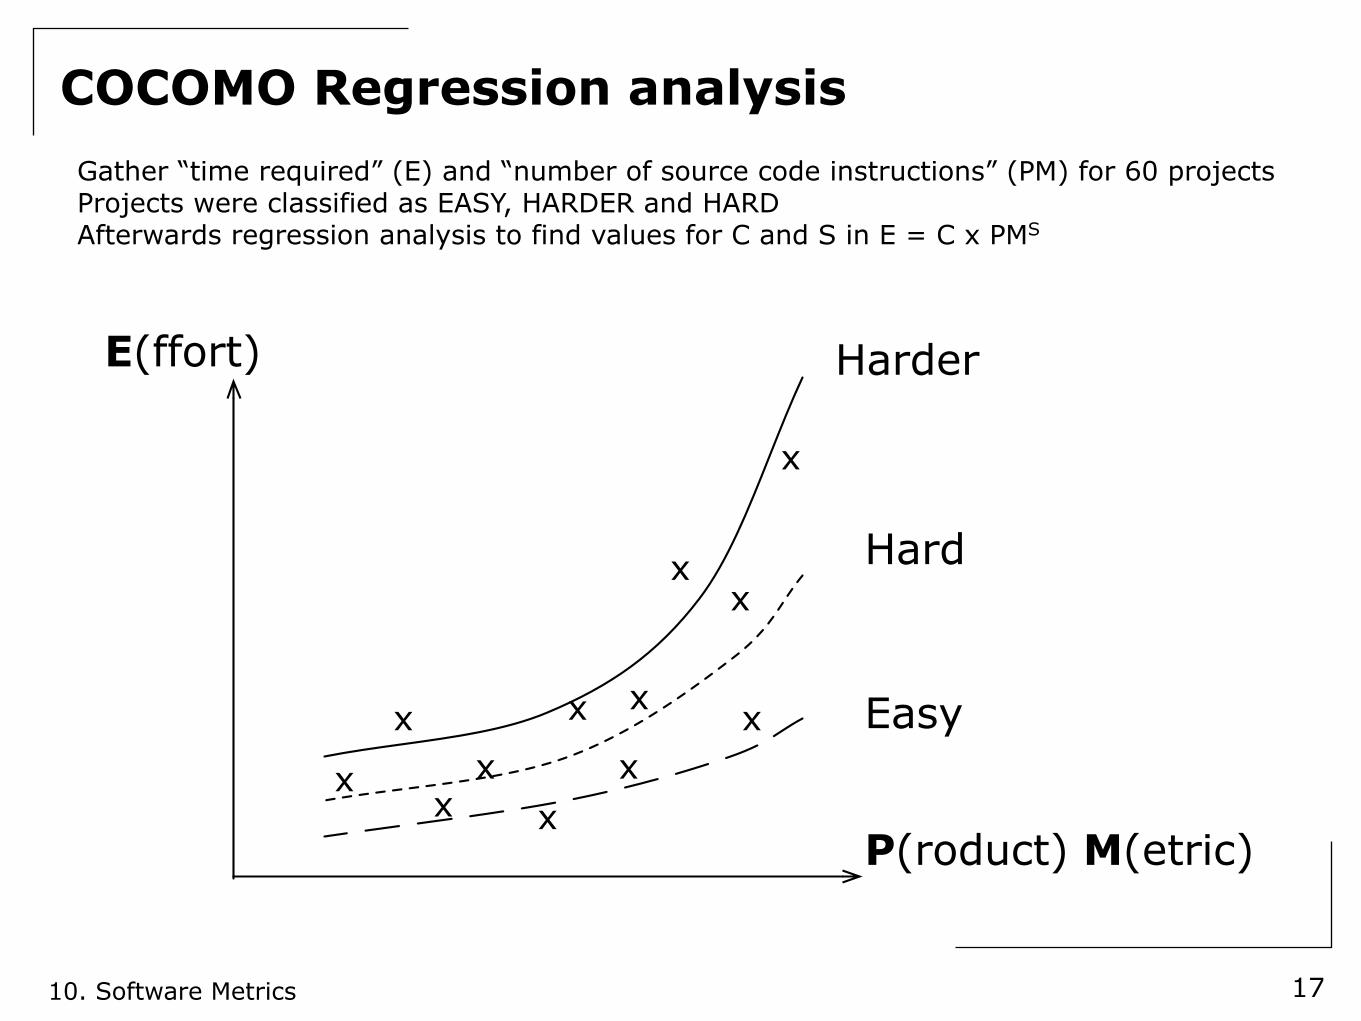
COCOMO Regression analysis
17
Gather “time required” (E) and “number of source code instructions” (PM) for 60 projectsProjects were classified as EASY, HARDER and HARDAfterwards regression analysis to find values for C and S in E = C x PMS
E(ffort)
P(roduct) M(etric)
Harder
Hard
Easy
x xx
x
x
x
xx
x x
x
x
10. Software Metrics
COCOMO Model (with calibration)
18
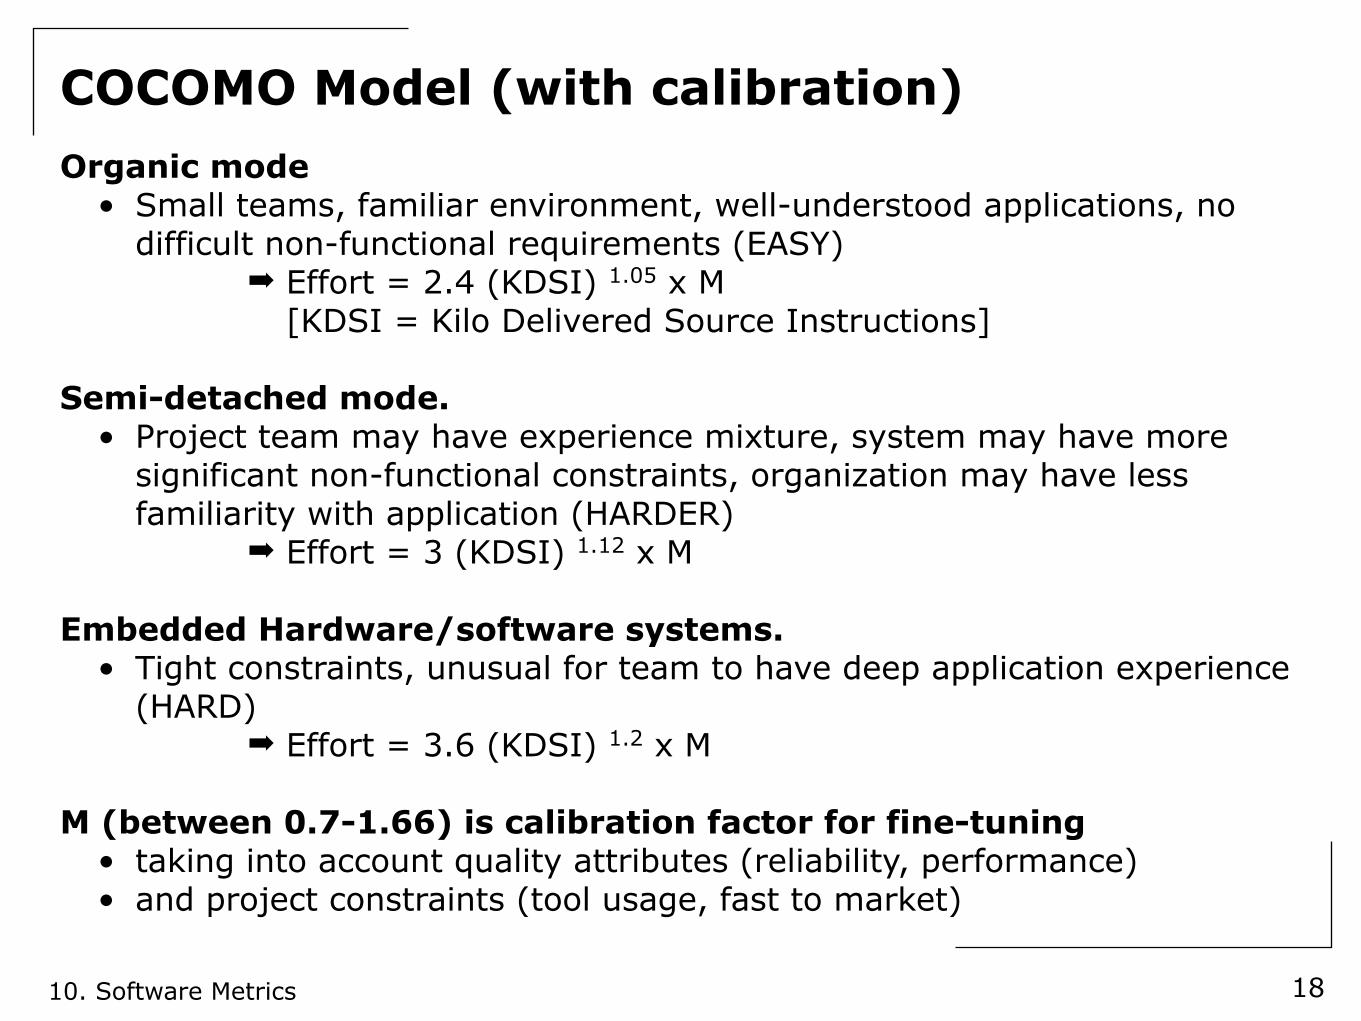
Organic mode• Small teams, familiar environment, well-understood applications, no
difficult non-functional requirements (EASY)➡ Effort = 2.4 (KDSI) 1.05 x M
[KDSI = Kilo Delivered Source Instructions]
Semi-detached mode.• Project team may have experience mixture, system may have more
significant non-functional constraints, organization may have less familiarity with application (HARDER)
➡ Effort = 3 (KDSI) 1.12 x M
Embedded Hardware/software systems.• Tight constraints, unusual for team to have deep application experience
(HARD)➡ Effort = 3.6 (KDSI) 1.2 x M
M (between 0.7-1.66) is calibration factor for fine-tuning• taking into account quality attributes (reliability, performance)• and project constraints (tool usage, fast to market)
10. Software Metrics
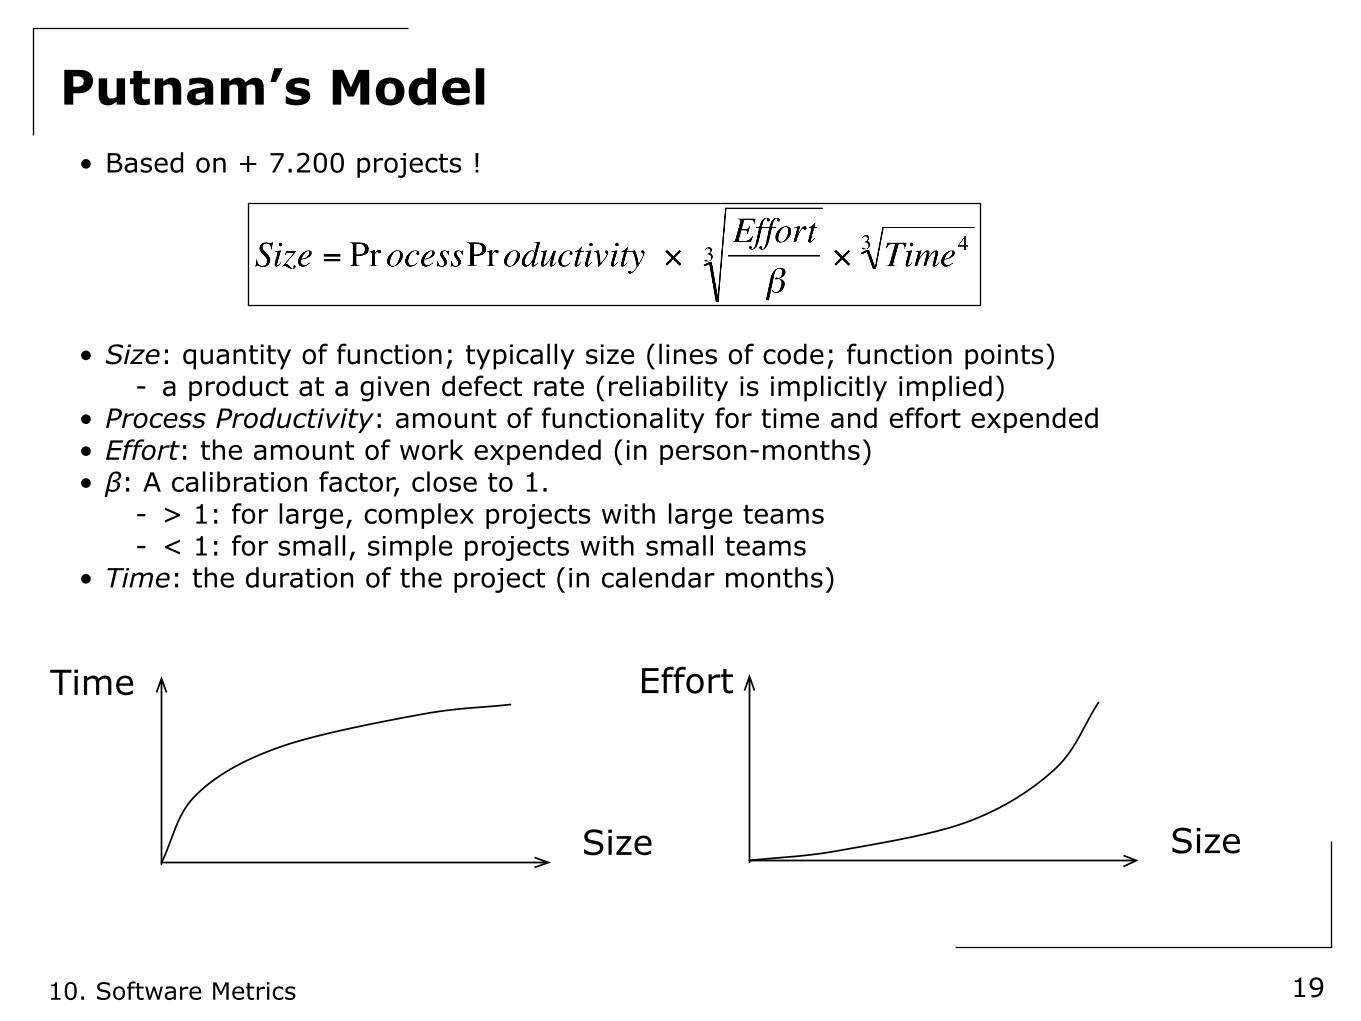
• Based on + 7.200 projects !
• Size: quantity of function; typically size (lines of code; function points)- a product at a given defect rate (reliability is implicitly implied)
• Process Productivity: amount of functionality for time and effort expended• Effort: the amount of work expended (in person-months)• β: A calibration factor, close to 1.
- > 1: for large, complex projects with large teams- < 1: for small, simple projects with small teams
• Time: the duration of the project (in calendar months)
Putnam’s Model
19
Time
Size
Effort
Size
10. Software Metrics
Putnam’s Model: Deriving Productivity
20
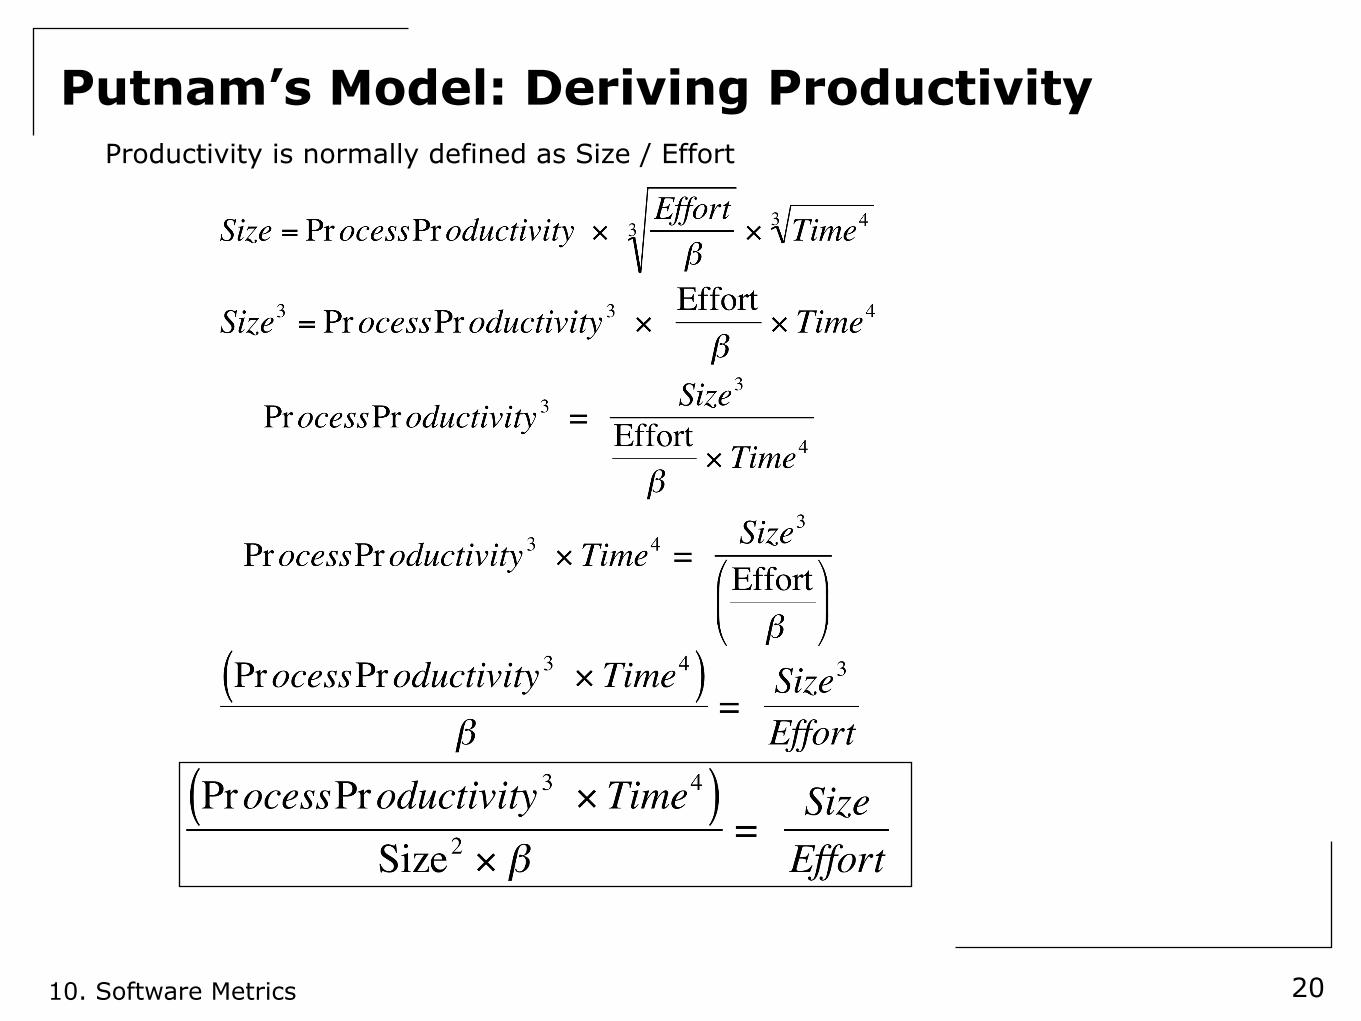
Productivity is normally defined as Size / Effort
10. Software Metrics
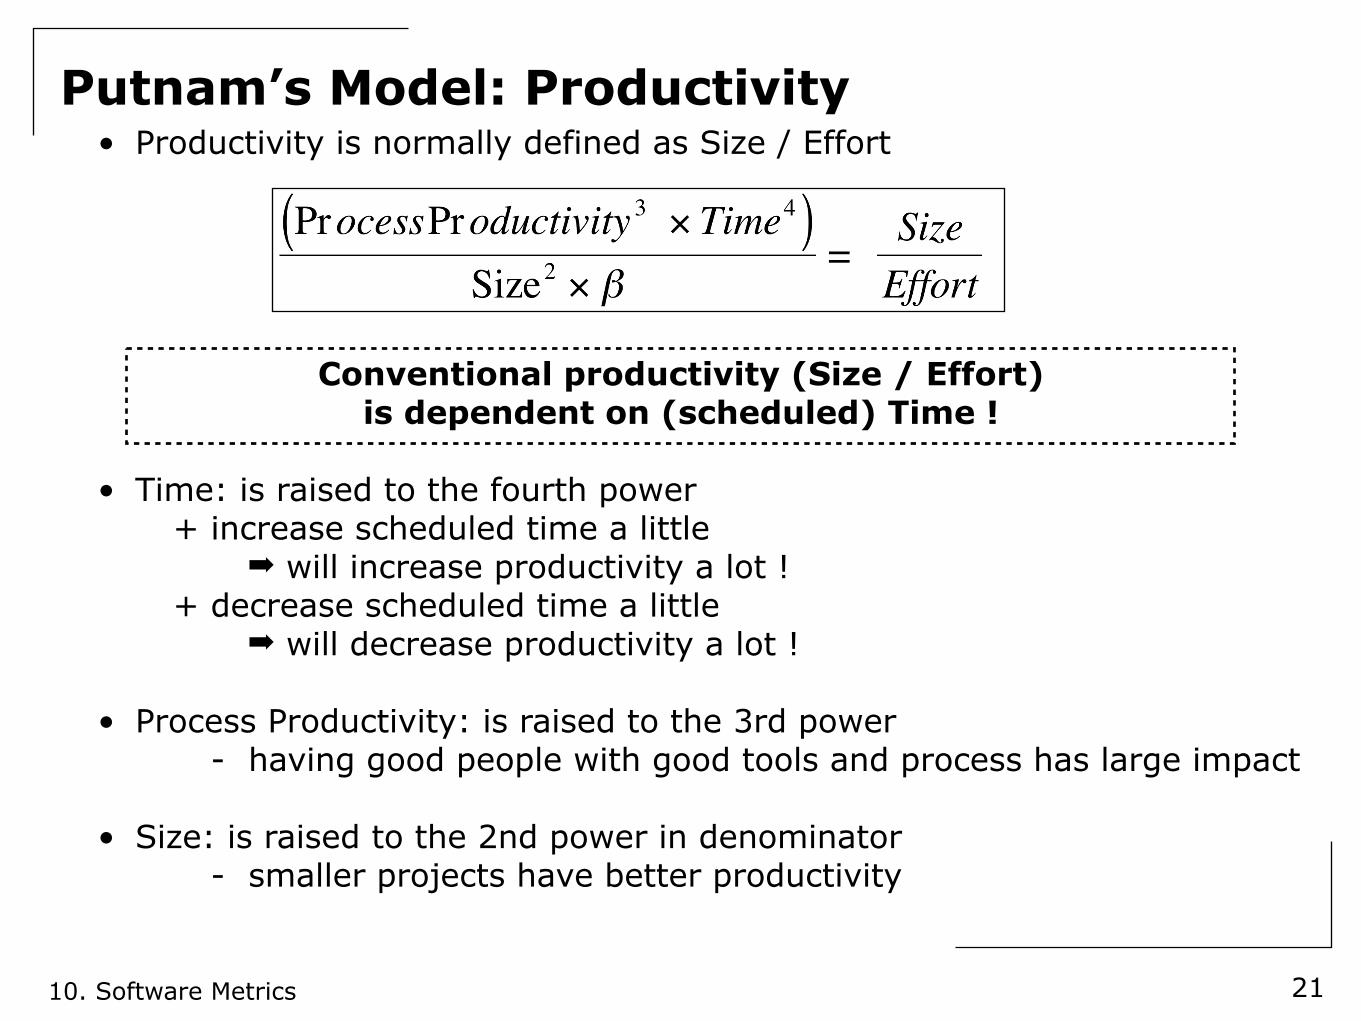
• Productivity is normally defined as Size / Effort
Conventional productivity (Size / Effort)is dependent on (scheduled) Time !
• Time: is raised to the fourth power+ increase scheduled time a little
➡ will increase productivity a lot !+ decrease scheduled time a little
➡ will decrease productivity a lot !
• Process Productivity: is raised to the 3rd power- having good people with good tools and process has large impact
• Size: is raised to the 2nd power in denominator- smaller projects have better productivity
Putnam’s Model: Productivity
21
10. Software Metrics
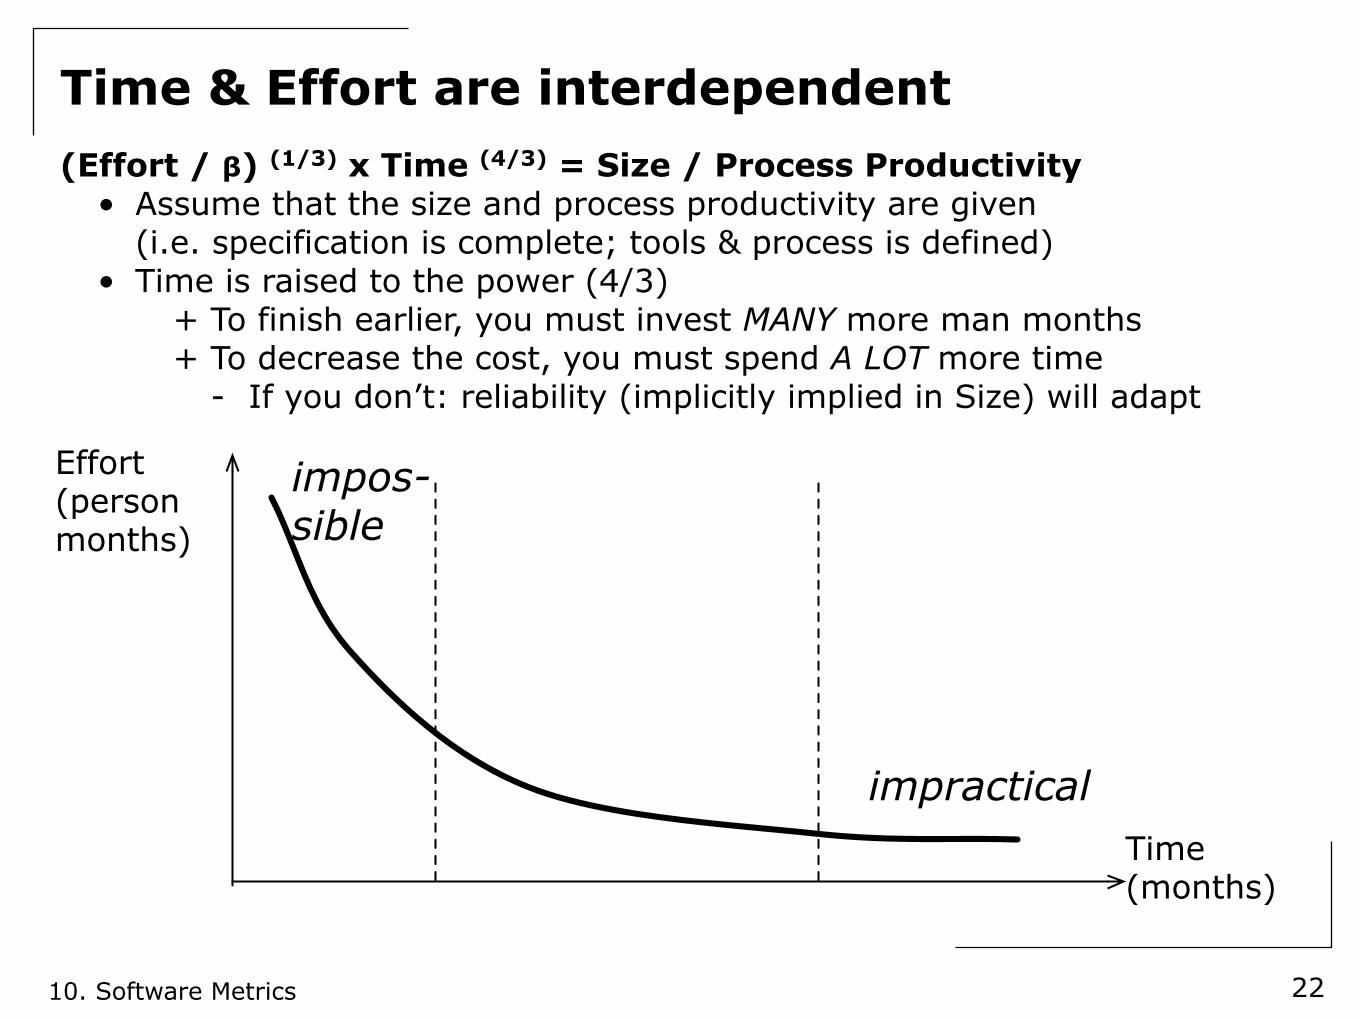
(Effort / β) (1/3) x Time (4/3) = Size / Process Productivity• Assume that the size and process productivity are given
(i.e. specification is complete; tools & process is defined)• Time is raised to the power (4/3)
+ To finish earlier, you must invest MANY more man months+ To decrease the cost, you must spend A LOT more time
- If you don’t: reliability (implicitly implied in Size) will adapt
Time & Effort are interdependent
22
Effort(person months)
Time (months)
impractical
impos-sible
10. Software Metrics
Time & Effort are interdependent
23
Effort(person months)
Time (months)
impractical
impos-sible
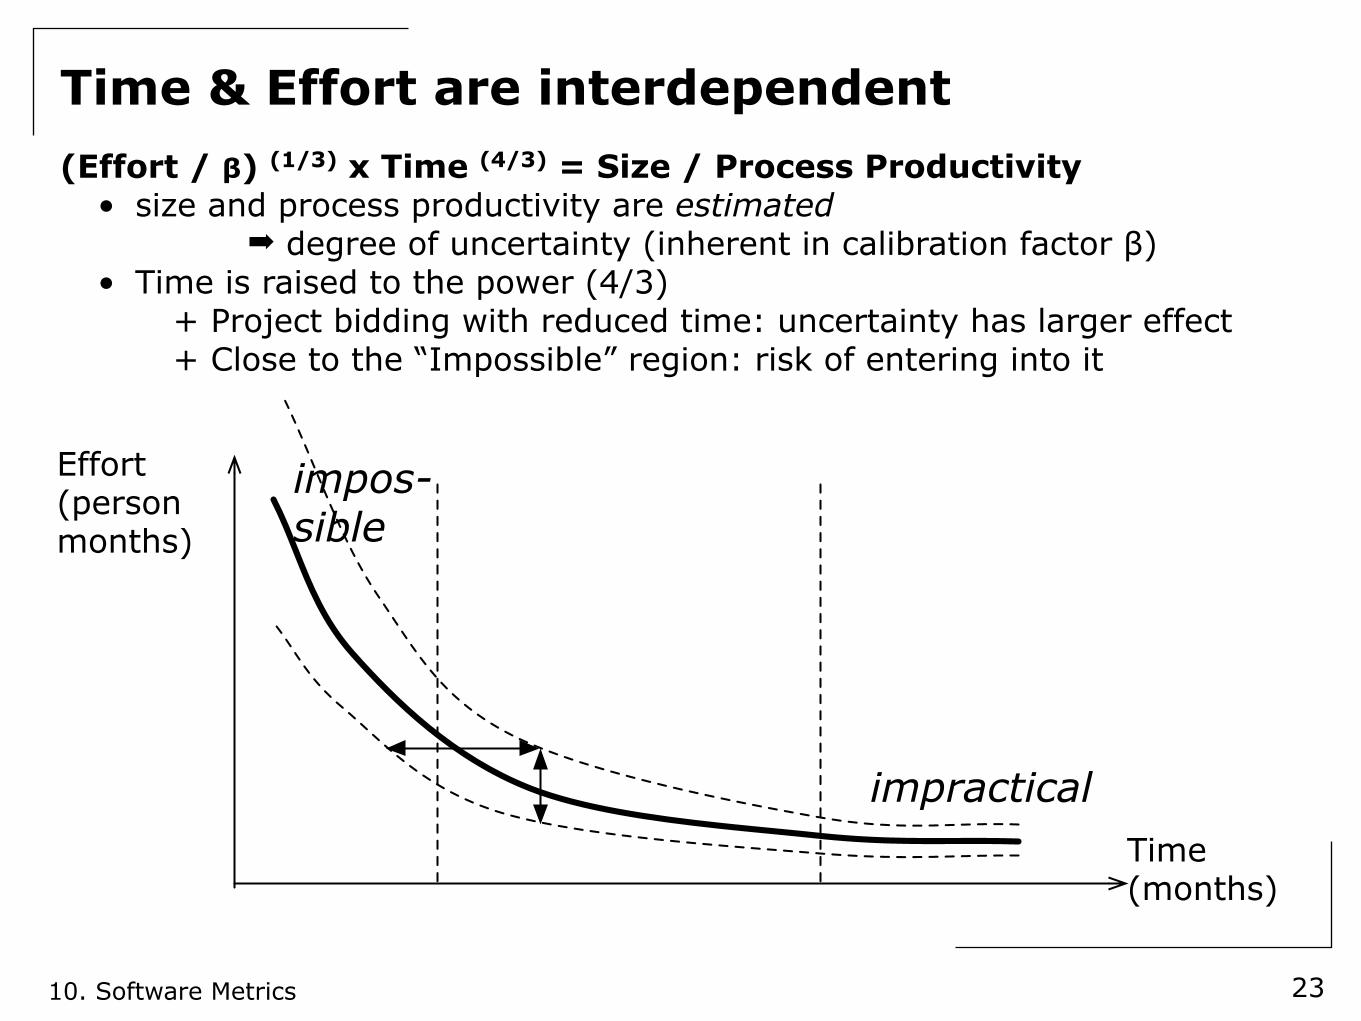
(Effort / β) (1/3) x Time (4/3) = Size / Process Productivity• size and process productivity are estimated
➡ degree of uncertainty (inherent in calibration factor β)• Time is raised to the power (4/3)
+ Project bidding with reduced time: uncertainty has larger effect+ Close to the “Impossible” region: risk of entering into it
10. Software Metrics
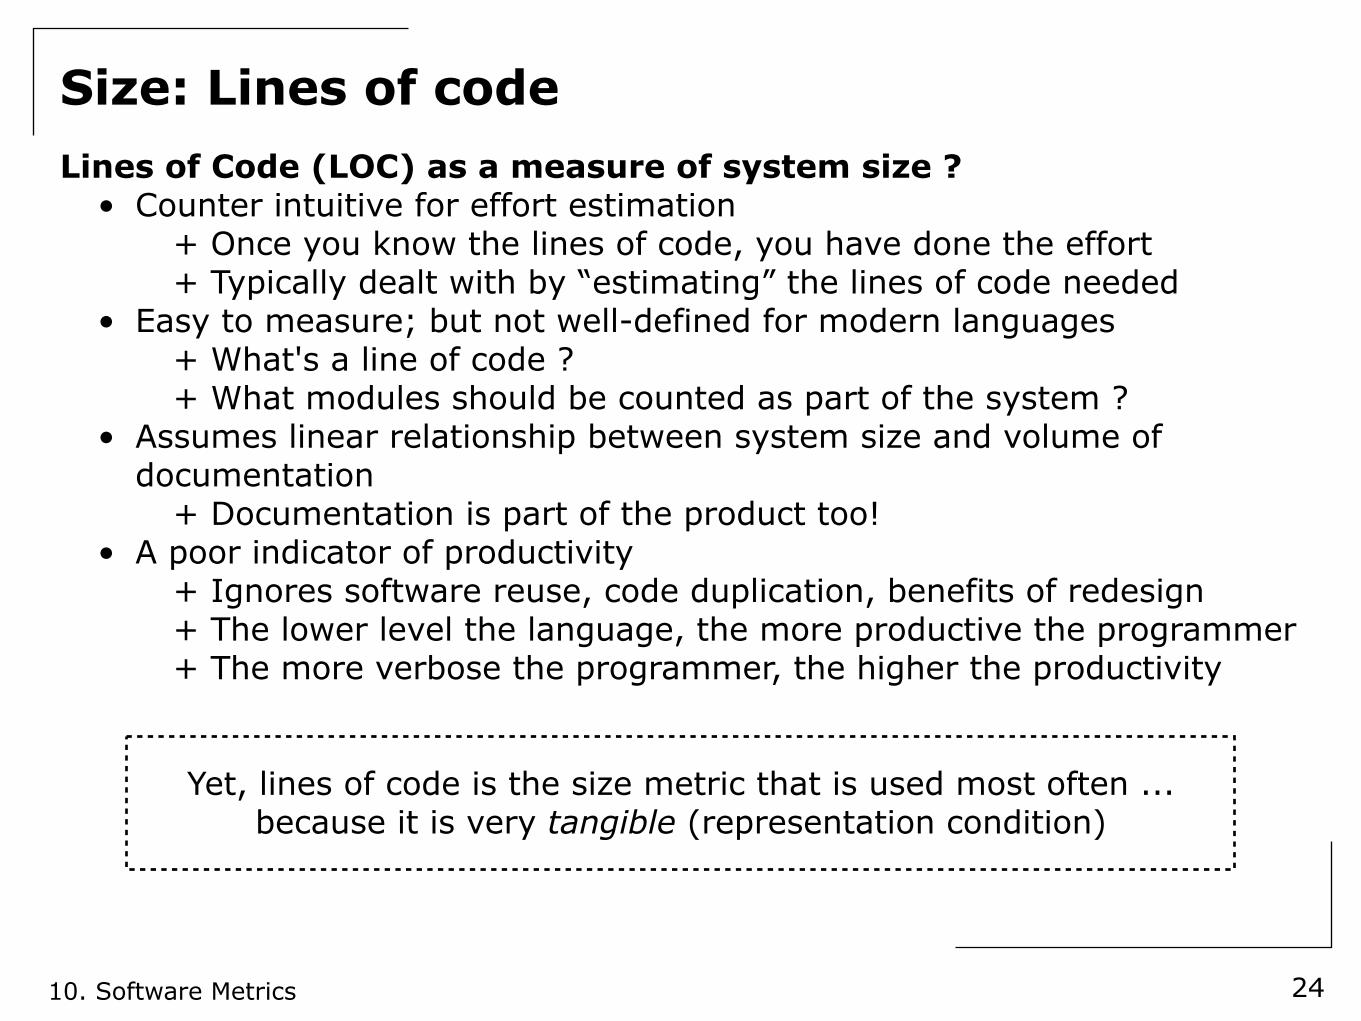
Size: Lines of codeLines of Code (LOC) as a measure of system size ?
• Counter intuitive for effort estimation+ Once you know the lines of code, you have done the effort+ Typically dealt with by “estimating” the lines of code needed
• Easy to measure; but not well-defined for modern languages+ What's a line of code ?+ What modules should be counted as part of the system ?
• Assumes linear relationship between system size and volume of documentation
+ Documentation is part of the product too!• A poor indicator of productivity
+ Ignores software reuse, code duplication, benefits of redesign+ The lower level the language, the more productive the programmer+ The more verbose the programmer, the higher the productivity
Yet, lines of code is the size metric that is used most often ...because it is very tangible (representation condition)
24
10. Software Metrics
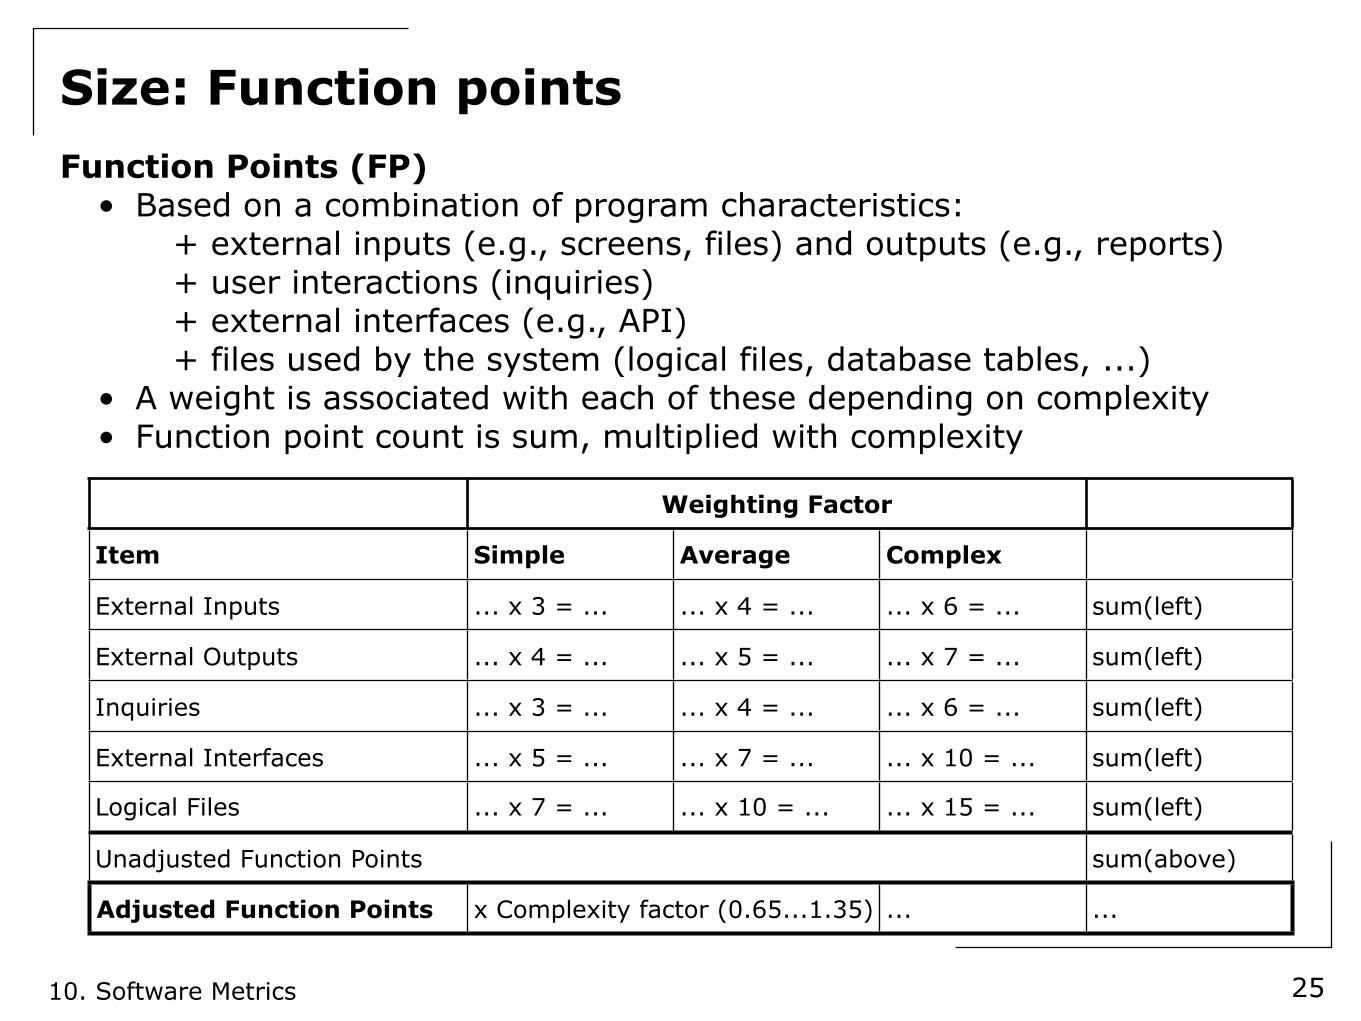
Size: Function pointsFunction Points (FP)
• Based on a combination of program characteristics:+ external inputs (e.g., screens, files) and outputs (e.g., reports)+ user interactions (inquiries)+ external interfaces (e.g., API)+ files used by the system (logical files, database tables, ...)
• A weight is associated with each of these depending on complexity• Function point count is sum, multiplied with complexity
25
Weighting FactorWeighting FactorWeighting Factor
Item Simple Average Complex
External Inputs ... x 3 = ... ... x 4 = ... ... x 6 = ... sum(left)
External Outputs ... x 4 = ... ... x 5 = ... ... x 7 = ... sum(left)
Inquiries ... x 3 = ... ... x 4 = ... ... x 6 = ... sum(left)
External Interfaces ... x 5 = ... ... x 7 = ... ... x 10 = ... sum(left)
Logical Files ... x 7 = ... ... x 10 = ... ... x 15 = ... sum(left)
Unadjusted Function PointsUnadjusted Function PointsUnadjusted Function PointsUnadjusted Function Points sum(above)
Adjusted Function Points x Complexity factor (0.65...1.35)x Complexity factor (0.65...1.35) ... ...
10. Software Metrics
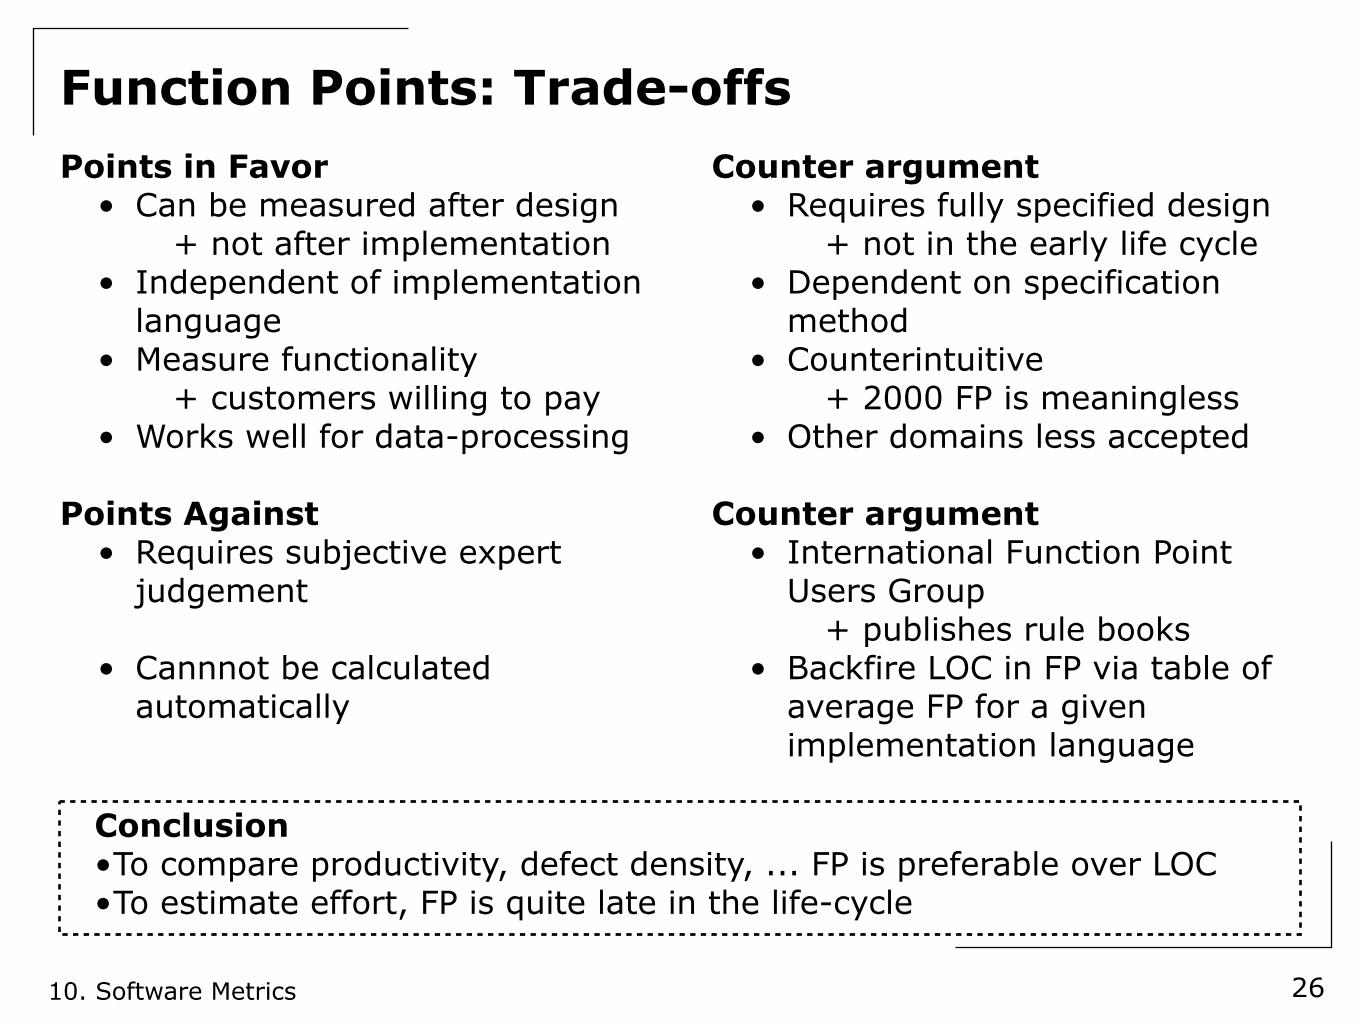
Function Points: Trade-offsPoints in Favor
• Can be measured after design+ not after implementation
• Independent of implementation language
• Measure functionality+ customers willing to pay
• Works well for data-processing
Points Against• Requires subjective expert
judgement
• Cannnot be calculated automatically
Counter argument• Requires fully specified design
+ not in the early life cycle• Dependent on specification
method• Counterintuitive
+ 2000 FP is meaningless• Other domains less accepted
Counter argument• International Function Point
Users Group+ publishes rule books
• Backfire LOC in FP via table of average FP for a given implementation language
26
Conclusion•To compare productivity, defect density, ... FP is preferable over LOC•To estimate effort, FP is quite late in the life-cycle
10. Software Metrics
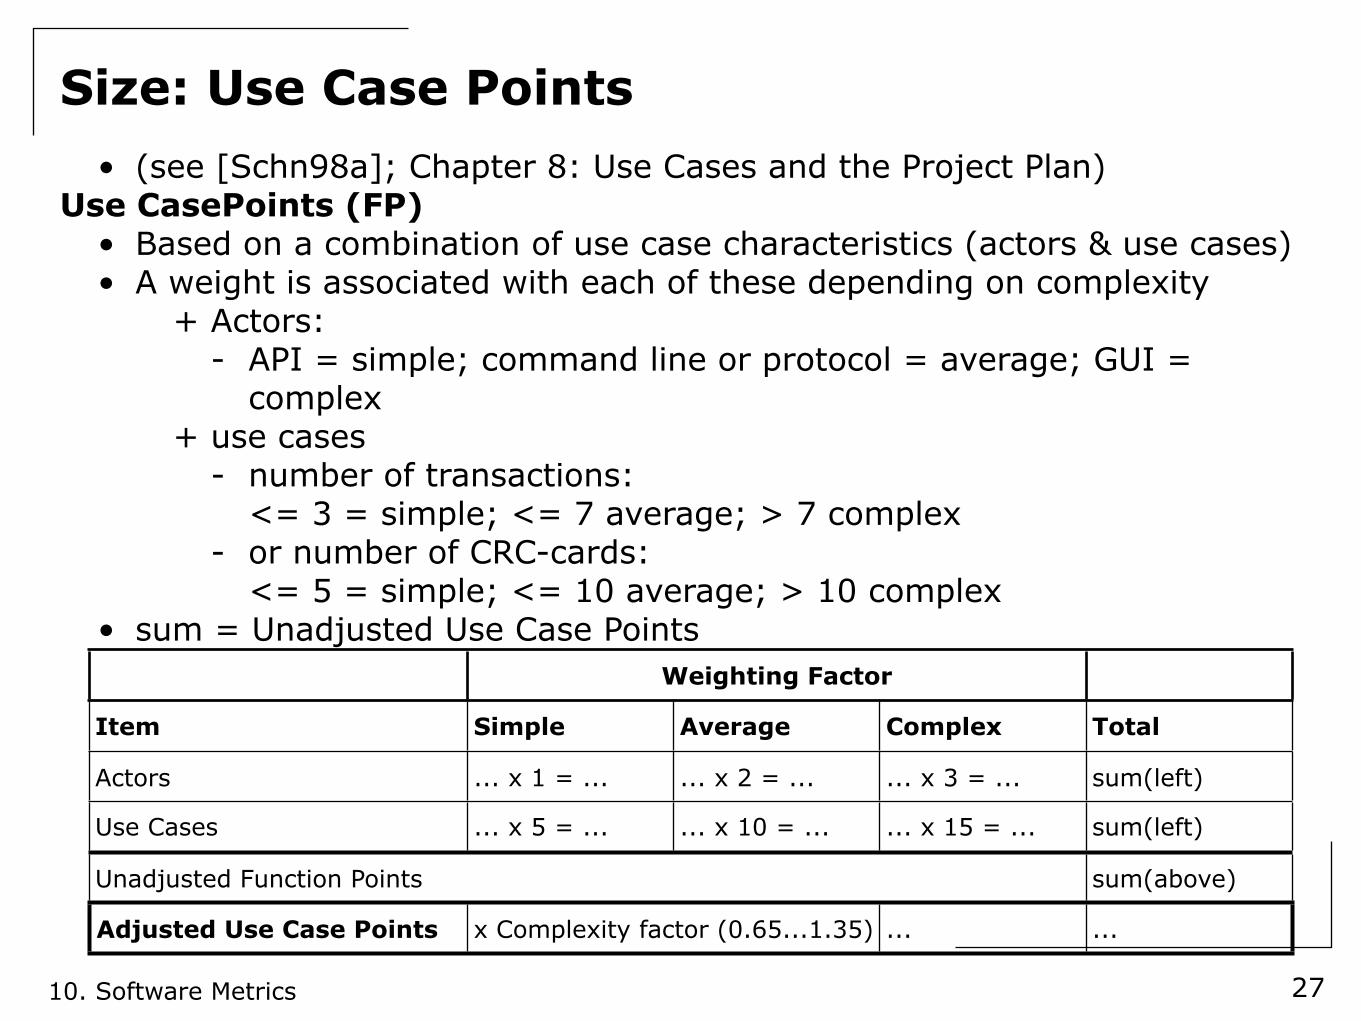
Size: Use Case Points• (see [Schn98a]; Chapter 8: Use Cases and the Project Plan)
Use CasePoints (FP)• Based on a combination of use case characteristics (actors & use cases)• A weight is associated with each of these depending on complexity
+ Actors:- API = simple; command line or protocol = average; GUI =
complex+ use cases
- number of transactions:<= 3 = simple; <= 7 average; > 7 complex
- or number of CRC-cards:<= 5 = simple; <= 10 average; > 10 complex
• sum = Unadjusted Use Case Points
27
Weighting FactorWeighting FactorWeighting Factor
Item Simple Average Complex Total
Actors ... x 1 = ... ... x 2 = ... ... x 3 = ... sum(left)
Use Cases ... x 5 = ... ... x 10 = ... ... x 15 = ... sum(left)
Unadjusted Function PointsUnadjusted Function PointsUnadjusted Function PointsUnadjusted Function Points sum(above)
Adjusted Use Case Points x Complexity factor (0.65...1.35)x Complexity factor (0.65...1.35) ... ...
10. Software Metrics
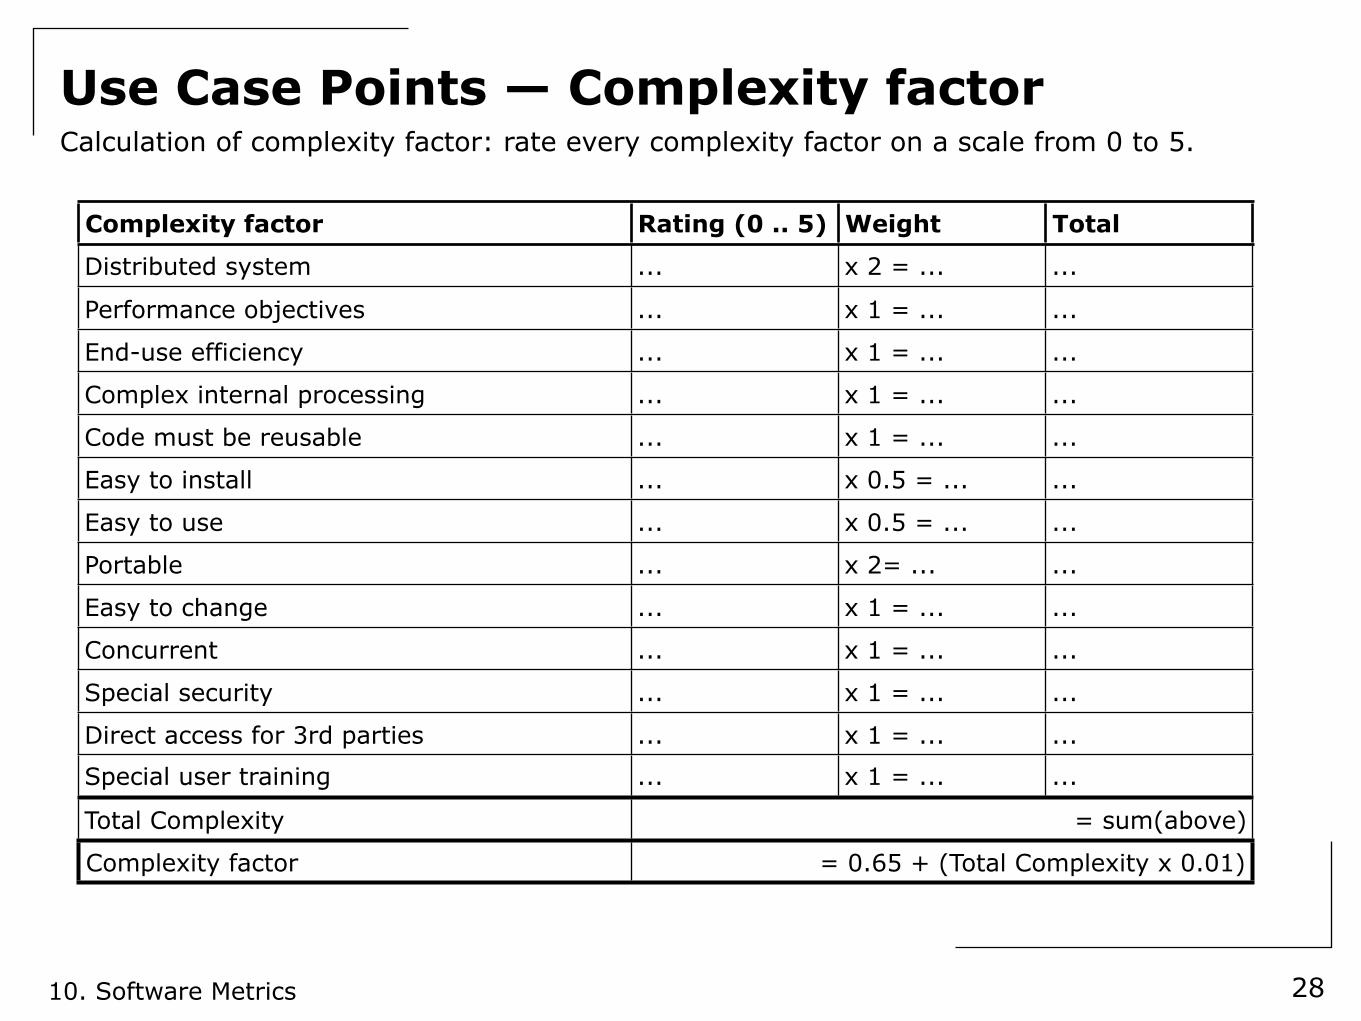
Use Case Points — Complexity factor
28
Calculation of complexity factor: rate every complexity factor on a scale from 0 to 5.
Complexity factor Rating (0 .. 5) Weight Total
Distributed system ... x 2 = ... ...
Performance objectives ... x 1 = ... ...
End-use efficiency ... x 1 = ... ...
Complex internal processing ... x 1 = ... ...
Code must be reusable ... x 1 = ... ...
Easy to install ... x 0.5 = ... ...
Easy to use ... x 0.5 = ... ...
Portable ... x 2= ... ...
Easy to change ... x 1 = ... ...
Concurrent ... x 1 = ... ...
Special security ... x 1 = ... ...
Direct access for 3rd parties ... x 1 = ... ...
Special user training ... x 1 = ... ...
Total Complexity = sum(above) = sum(above) = sum(above)
Complexity factor = 0.65 + (Total Complexity x 0.01) = 0.65 + (Total Complexity x 0.01) = 0.65 + (Total Complexity x 0.01)
10. Software Metrics
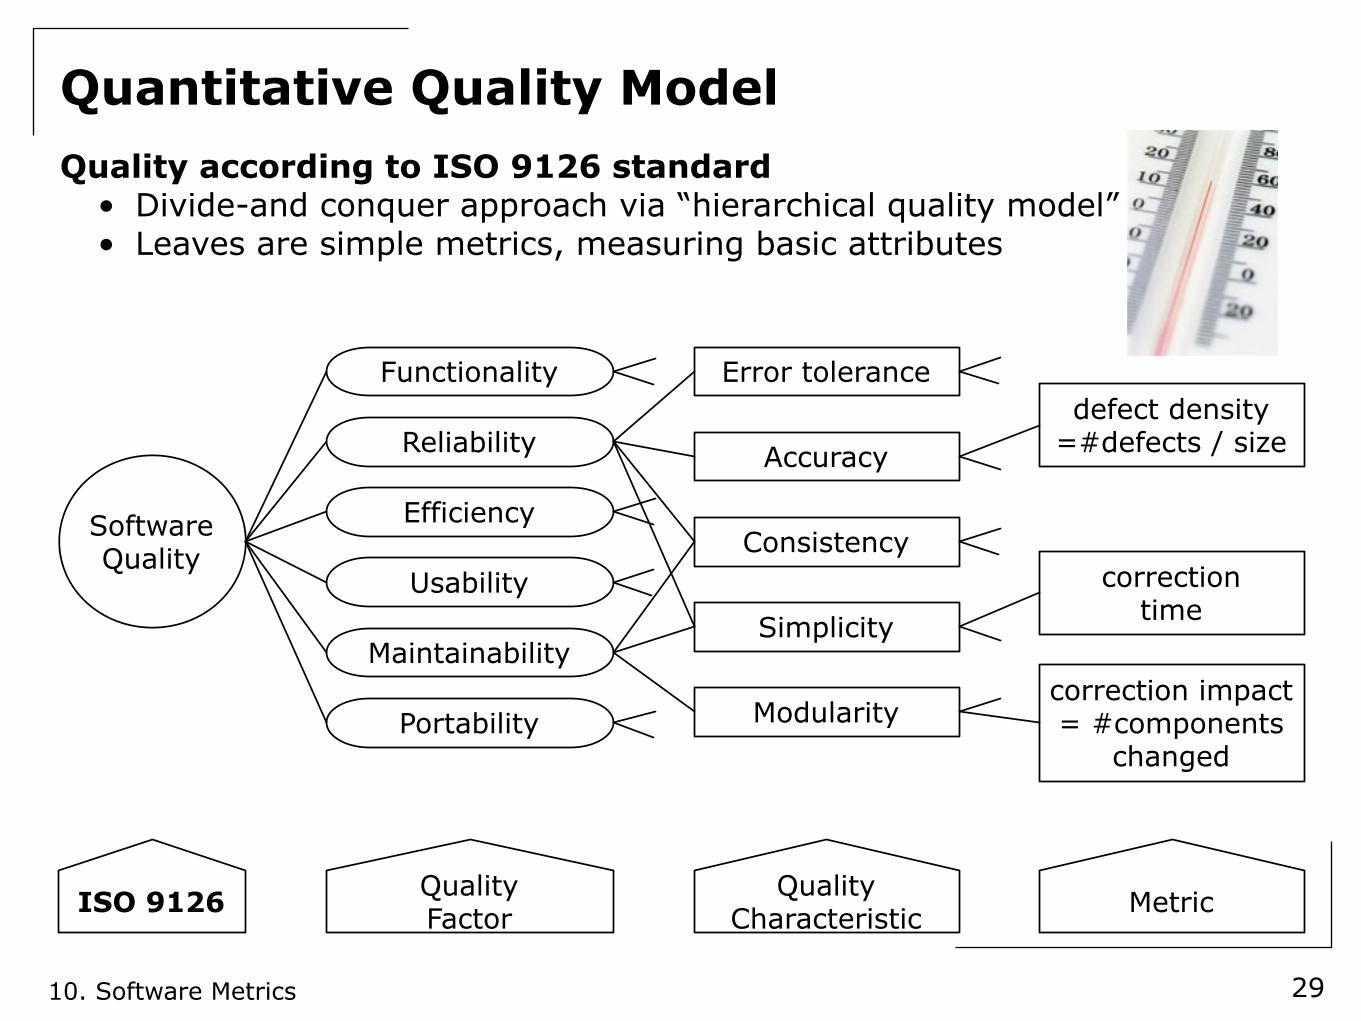
Quantitative Quality Model
29
Software Quality
Functionality
Reliability
Efficiency
Usability
Maintainability
Portability
Error tolerance
Accuracy
Consistency
Simplicity
Modularity
defect density=#defects / size
correctiontime
correction impact= #components
changed
ISO 9126 QualityFactor
QualityCharacteristic Metric
Quality according to ISO 9126 standard• Divide-and conquer approach via “hierarchical quality model”• Leaves are simple metrics, measuring basic attributes
10. Software Metrics
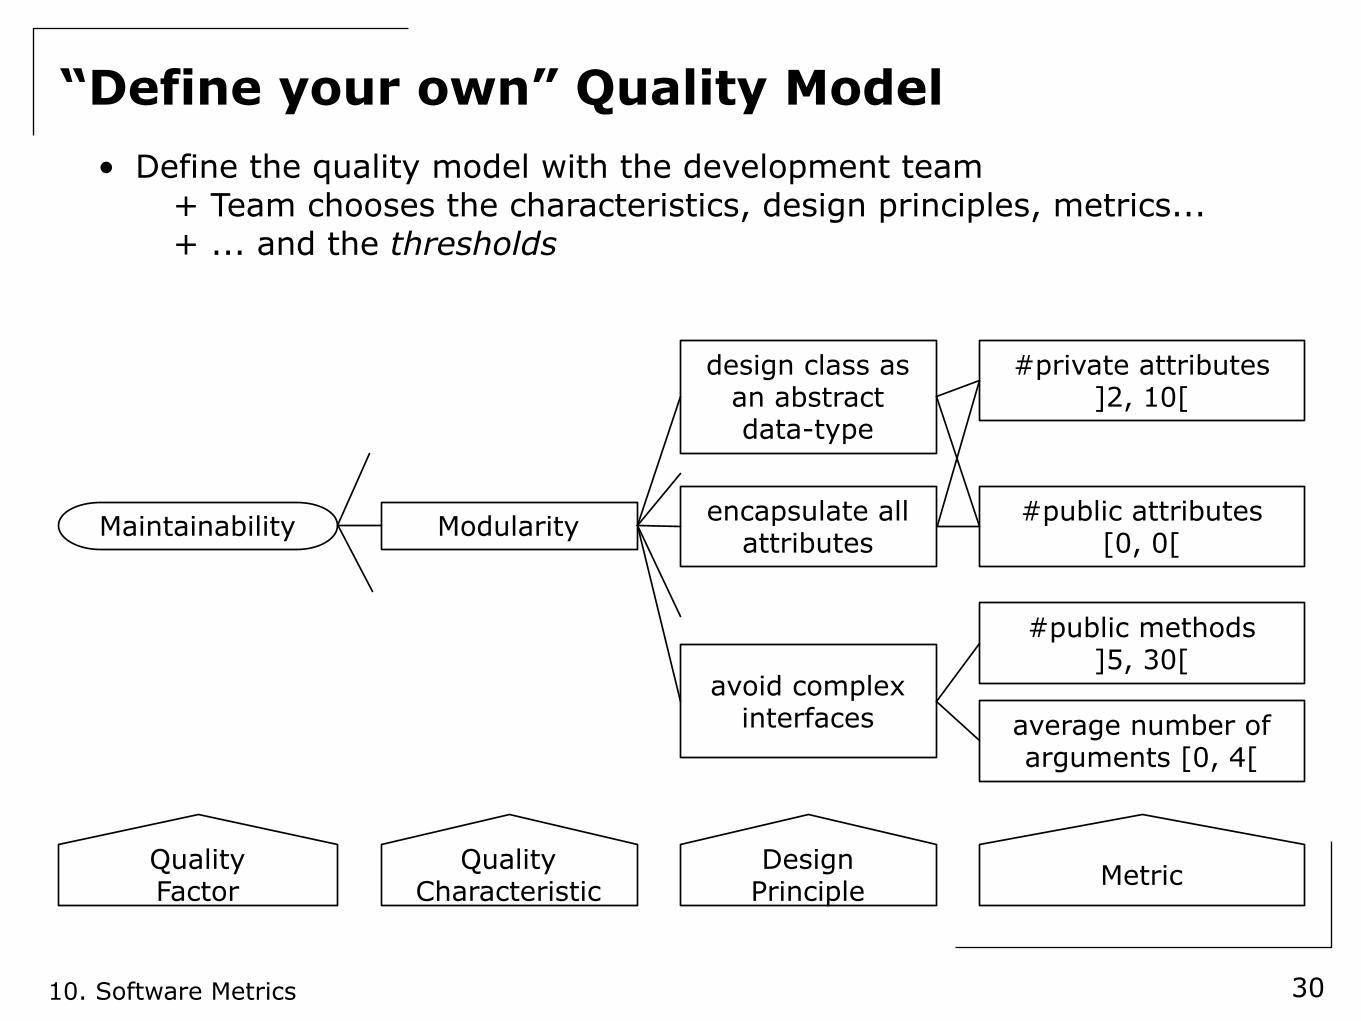
“Define your own” Quality Model• Define the quality model with the development team
+ Team chooses the characteristics, design principles, metrics...+ ... and the thresholds
30
Maintainability Modularity
design class as an abstractdata-type
encapsulate all attributes
avoid complex interfaces
QualityFactor
QualityCharacteristic
DesignPrinciple
#private attributes]2, 10[
#public attributes[0, 0[
Metric
#public methods]5, 30[
average number of arguments [0, 4[
10. Software Metrics
Sample Size Metrics
31
Class
AttributeMethod acess
belongsTo
inherits
invokes
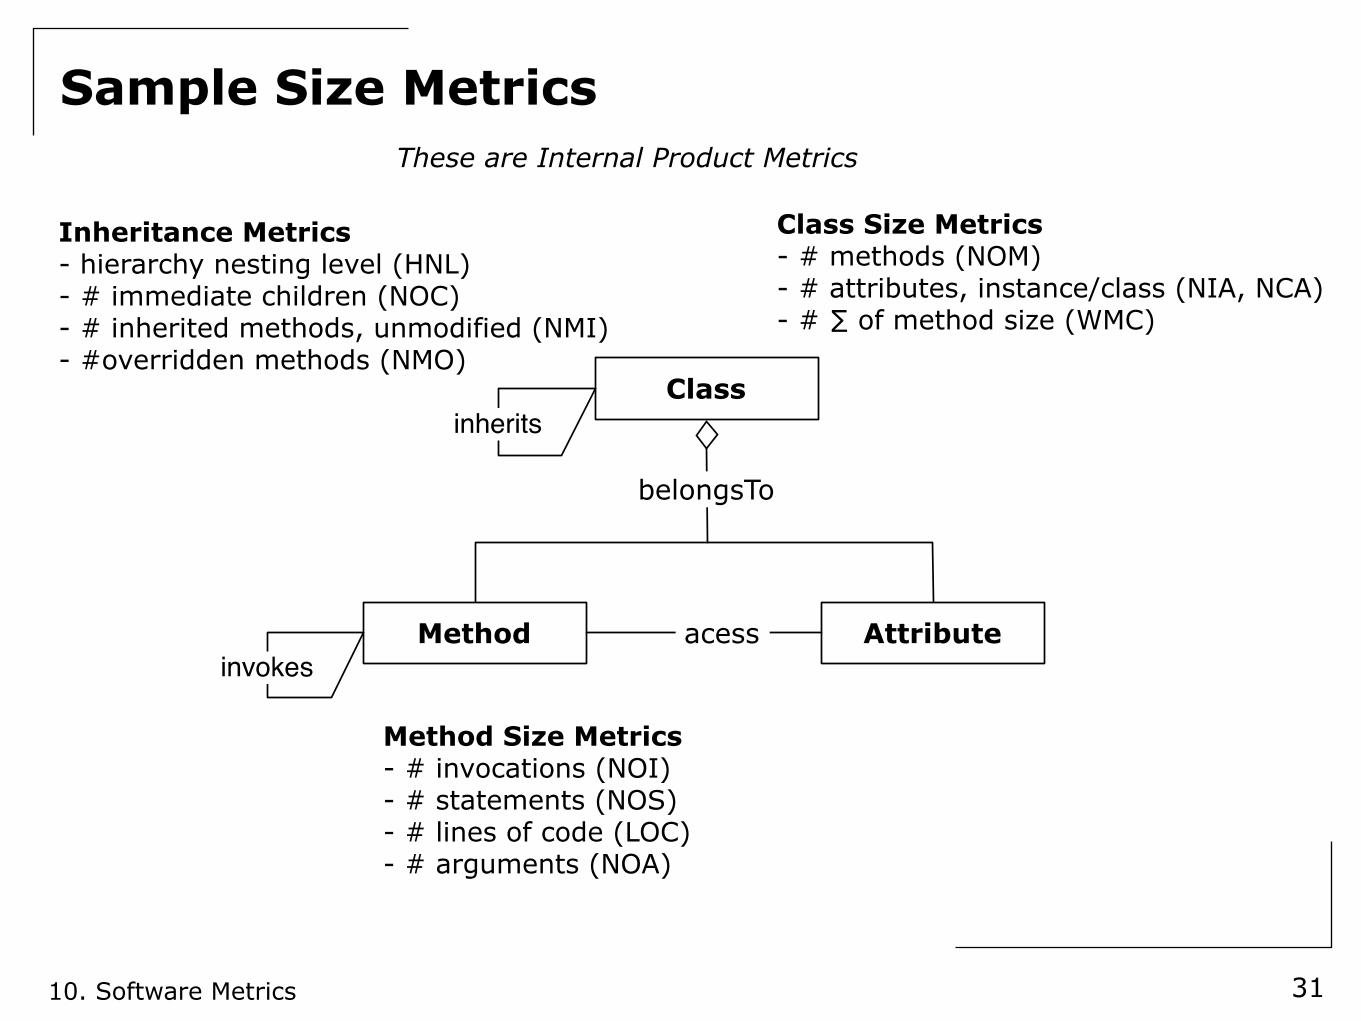
Inheritance Metrics- hierarchy nesting level (HNL)- # immediate children (NOC)- # inherited methods, unmodified (NMI)- #overridden methods (NMO)
Class Size Metrics- # methods (NOM)- # attributes, instance/class (NIA, NCA)- # ∑ of method size (WMC)
Method Size Metrics- # invocations (NOI)- # statements (NOS)- # lines of code (LOC)- # arguments (NOA)
These are Internal Product Metrics
10. Software Metrics
Sample Coupling & Cohesion Metrics
32
These are Internal Product Metrics
• Following definitions stem from [Chidamber en Kemerer 1994]Coupling Between Objects (CBO)
• CBO = number of other class to which given class is coupled+ Interpret as “number of other classes required to compile”
Lack of Cohesion in Methods (LCOM)• collect local methods not accessing same attribute• LCOM = number of disjoint sets
Beware• Disagreement whether coupling/cohesion metrics satisfy the
representation condition+ Classes that are observed to be cohesive may have a high LCOM
value- due to accessor methods
+ Classes that are not much coupled may have high CBO value- no distinction between data, method or inheritance coupling
10. Software Metrics
Sample External Quality Metrics (i)Productivity (Process Metric)
• functionality / time• functionality in LOC or FP; time in hours, weeks, months
+ be careful to compare: the same unit does not always represent the same
+ Does not take into account the quality of the functionality!Reliability (Product Metric)
• mean time to failure = mean of probability density function PDF+ MTTF (T) = ∫ f(t) dt+ for hardware, PDF is usually a negative exponential
f(t) = λe-λt
+ for software one must take into account the fact that repairs will influence the future behaviour
➡ quite complicated formulasaverage time between failures = # failures / time
• time in execution time or calendar time• necessary to calibrate the probability density function
mean time between failure = MTTF + mean time to repair• to know when your system will be available, take into account repair
33
10. Software Metrics
Sample External Quality Metrics (ii)Correctness (Product Metric)
• a system is correct or not, so one cannot measure correctness• defect density = # known defects / product size
+ product size in LOC or FP+ # known defects is a time based count!
• do NOT compare across projects unless you’re data collection is sound!
Maintainability (Product Metric)• #time to repair certain categories of changes• “mean time to repair” vs. “average time to repair”
+ similar to “mean time to failure” and “average time between failures”
• beware for the units+ categories of changes is subjective+ measuring time precisely is difficult
- problem recognition time + administrative delay time +problem analysis time + change time + testing & reviewing time
34
10. Software Metrics
Conclusion: Metrics for Effort EstimationQuestion:
• Can metrics be used for effort estimation ?
Yes, but...• Come a bit too late in the life-cycle
+ Require a quite complete “Requirements Specification”• Requires database of historical facts about projects
+ small numbers statistics is required if you do it yourself+ or hire external estimation consultants (which have such database)
• Can never be the sole basis for estimating+ models allow “trial and error” estimation+ complement with “Expert Judgement” or “Estimate by Analogy”
However...• Collecting historical data is a good idea anyway
+ Provides a basis for Quantitative analysis of processes+ “Levels 4 & 5” of CMM
35
10. Software Metrics
Conclusion: Metrics for Quality Assurance (i)Question:
• Can internal product metrics reveal which componentshave good/poor quality ?
Yes, but...• Not reliable
+ false positives: “bad” measurements, yet good quality+ false negatives: “good” measurements, yet poor quality
• Heavy weight approach+ Requires team to develop/customize a quantitative quality model+ Requires definition of thresholds (trial and error)
• Difficult to interpret+ Requires complex combinations of simple metrics
However...• Cheap once you have the quality model and the thresholds• Good focus (± 20% of components are selected for further inspection)
+ Note: focus on the most complex components first
36
10. Software Metrics
Conclusion: Metrics for Quality Assurance (ii)Question:
• Can external product/process metrics reveal quality ?
Yes, ...• More reliably then internal product metrics
However...• Requires a finished product or process• It is hard to achieve preciseness
+ even if measured in same units+ beware to compare results from one project to another
37
10. Software Metrics
Summary (i)You should know the answers to these questions
• Can you give three possible problems of metrics usage in software engineering ? How does the measurement theory address them ?
• What’s the distinction between a measure and a metric ?• Can you give an example of a direct and an indirect measure ?• What kind of measurement scale would you need to say “A specification error is worse
than a design error” ? And what if we want to say “A specification error is twice as bad as a design error ?”
• Explain the need for a calibration factor in Putnam’s model.• Fill in the blanks in the following sentence. Explain briefly, based on the Putnam’s model.
+ If you want to finish earlier (= decrease scheduled time), you should ... the effort ... .• Give three metrics for measuring size of a software product.• Discuss the main advantages and disadvantages of Function Points.• What does it mean for a coupling metric not to satisfy the representation condition ?• Can you give 3 examples of impreciseness in Lines of Code measurements ?• What’s the difference between “Mean time to failure” and “Average time between
failures” ? Why is the difference important ?
You should be able to complete the following tasks• Given a set of use cases (i.e. your project) calculate the use case points.
38
10. Software Metrics
Summary (ii)Can you answer the following questions ?
• During which phases in a software project would you use metrics ?• Why is it so important to have “good” product size metrics ?• Can you explain the two levels of calibration in COCOMO (i.e. C & S vs. M) ? How can
you derive actual values for these parameters ?• Can you motivate why in software engineering, productivity depends on the scheduled
time ? Do you have an explanation for it ?• Can you explain the cone of uncertainty ? And why is it so relevant to cost estimation in
software projects ?• How can you decrease the uncertainty of a project bid using Putnam’s model ?• Why do we prefer measuring Internal Product Attributes instead of External Product
Attributes during Quality Control ? What is the main disadvantage of doing that ?• You are a project manager and you want to convince your project team to apply
algorithmic cost modeling. How would you explain the technique ?• Where would you fit coupling/cohesion metrics in a hierarchical quality model like ISO
9126 ?• Why are coupling/cohesion metrics important ? Why then are they so rarely used ?• Do you believe that “defect density” says something about the correctness of a
program ? Motivate your answer ?
39