Embed Size (px)
Citation preview

SoftTech Engineers LimiteddInvestor Presentation
March 2019

2
Disclaimer
This presentation has been prepared by SoftTech Engineers Limited (the “Company”) solely for information purposes and does not constitute any offer,recommendation or invitation to purchase or subscribe for any securities, and shall not form the basis or be relied on in connection with any contract orbinding commitment what so ever. No offering of securities of the Company will be made except by means of a statutory offering document containingdetailed information about the Company.
This Presentation has been prepared by the Company based on information and data which the Company considers reliable, but the Company makes norepresentation or warranty, express or implied, whatsoever, and no reliance shall be placed on, the truth, accuracy, completeness, fairness andreasonableness of the contents of this Presentation. This Presentation may not be all inclusive and may not contain all of the information that you mayconsider material. Any liability in respect of the contents of, or any omission from, this Presentation is expressly excluded.
Certain matters discussed in this Presentation may contain statements regarding the Company’s market opportunity and business prospects that areindividually and collectively forward-looking statements. Such forward-looking statements are not guarantees of future performance and are subject toknown and unknown risks, uncertainties and assumptions that are difficult to predict. These risks and uncertainties include, but are not limited to, theperformance of the Indian economy and of the economies of various international markets, the performance of the industry in India and world-wide,competition, the company’s ability to successfully implement its strategy, the Company’s future levels of growth and expansion, technologicalimplementation, changes and advancements, changes in revenue, income or cash flows, the Company’s market preferences and its exposure to marketrisks, as well as other risks. The Company’s actual results, levels of activity, performance or achievements could differ materially and adversely fromresults expressed in or implied by this Presentation. The Company assumes no obligation to update any forward-looking information contained in thisPresentation. Any forward-looking statements and projections made by third parties included in this Presentation are not adopted by the Company andthe Company is not responsible for such third party statements and projections.
3
Table of Contents
01
03
04
05
02
06
01
03
04
05
Business Overview
Industry Opportunity
Company Overview
Way Ahead
Financial Highlights
02

Company Overview

5
Leading innovative software solution providers empowering business transformation through software products in architecture, engineering and construction (AEC) domain.
01▪ Pioneer and Market Leader (~80%
Market Share) in Building Permit Automation System, through
flagship Product AutoDCR®
Market Leader
02 Niche Product Offerings
▪ Pioneer products enabling digital transformation such as AutoDCR®, OPTICON™, PWIMS™, etc.
03 500+ Customers Served
▪ Clients across Government bodies, smart cities and enterprises in construction and infrastructure industry
04 450+ Team Members
▪ Highly qualified team of motivated technocrats led by visionary and highly
experienced management team05 20,000+ Software Users
▪ More than 20,000 users across various segments in domestic and international market
06 Latest Technology & Innovation
▪ Offers 2D & 3D based intelligent and machine learning driven technology
▪ Innovating Cloud technology enabled products
07 Strong Track Record
▪ Delivered to over 500 clients for over two decades to meet industry standards
▪ Consistent High Growth in last 5 years
About Us …

6
Journey So Far
▪ Technology Partnership with Microsoft, AutoDesk
▪ Growth funding from RVCF▪ 250+ Team size
Key Partnerships
▪ Received Venture Capital funding from SVCL (NFSIT)
▪ ISO Certification
VC Funding & QMS Certification
▪ STRUDS Released▪ ACCE Award for ‘Best Software Package
in Civil Engineering’
SoftTech Incorporated
▪ Funding from Technology Dev Board, GOI▪ OPTICON™ Galaxy Released▪ STRUDS & ESRGSR acquired by CSC UK Ltd.
Funding & IP monetized
▪ AutoDCR® & PWIMS™ launched▪ 4,000+ STRUDS users▪ OPTICON™ launched in MENA
region▪ 150+ Team Size
eGov Products Launched
▪ Incorporated wholly owned Subsidiary in USA and Finland
▪ Listing on NSE SME Emerge Exchange in May 2018
▪ BIMDCR & RuleBuddy Conceptualized▪ Large State level orders▪ 450+ Team Size
Innovations & Success Stories
1996-97
2000-03
2010-11
2004-09
2012-15
2016-18
7
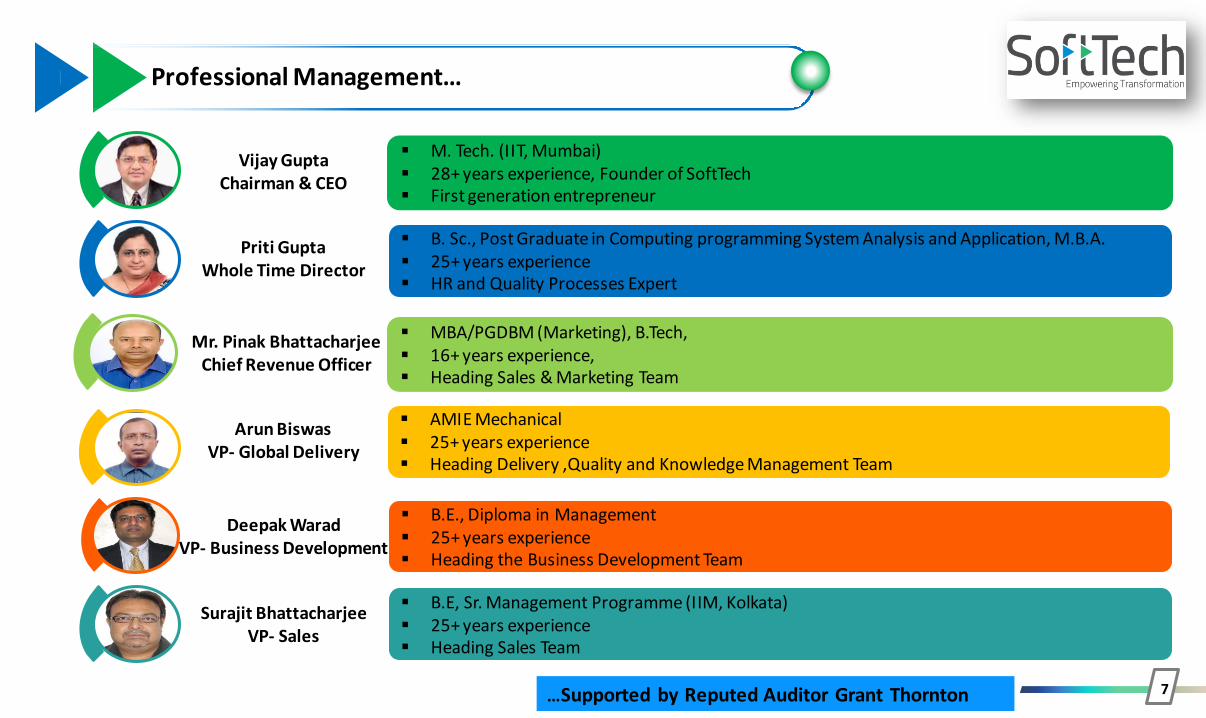
Professional Management…
▪ M. Tech. (IIT, Mumbai) ▪ 28+ years experience, Founder of SoftTech ▪ First generation entrepreneur
▪ B. Sc., Post Graduate in Computing programming System Analysis and Application, M.B.A.▪ 25+ years experience ▪ HR and Quality Processes Expert
▪ B.E, Sr. Management Programme (IIM, Kolkata) ▪ 25+ years experience▪ Heading Sales Team
▪ AMIE Mechanical▪ 25+ years experience ▪ Heading Delivery ,Quality and Knowledge Management Team
▪ B.E., Diploma in Management▪ 25+ years experience▪ Heading the Business Development Team
Vijay Gupta Chairman & CEO
Priti Gupta Whole Time Director
Arun Biswas VP- Global Delivery
Deepak WaradVP- Business Development
Surajit BhattacharjeeVP- Sales
…Supported by Reputed Auditor Grant Thornton
Mr. Pinak BhattacharjeeChief Revenue Officer
▪ MBA/PGDBM (Marketing), B.Tech, ▪ 16+ years experience, ▪ Heading Sales & Marketing Team

8
Professional Management…
▪ B.E. (Electronics), MS (Software Systems)▪ 19+ years experience▪ Heading the Product Technology Team
▪ B.Com, Chartered Accountant▪ 15+ years experience ▪ Heading Accounts and Finance Department
▪ B. Arch., M.Tech., EPBM, “Certificated Scrum Master", "Certified Software Engineering Professional”, EPAF (IIM, Kolkata)
▪ 18+ years experience ▪ Heading the AutoDCR product team
▪ BE (Production), MMS▪ 25+ years experience▪ Heading Opticon Product Team
▪ BE (Civil), “Certificated Scrum Master", ITIL v3 Foundation certified, Certification in Laws of Patents & other IP
▪ 20+ years experience ▪ Heading BIMDCR Product Team
Neetesh Singhal AVP- Technology
Sheetal JagtapAVP- AutoDCR
Premnath BasavaAVP- OPTICON
Amit KatariyaChief Financial Officer
Madhu KelkarGM (BIM Division)
…Supported by Reputed Auditor Grant Thornton
Vijay JainVP- Business Development
▪ Diploma in System Design & Analysis ▪ 25+ years experience▪ Heading the Business Development Team

Industry Overview

Indian IT Industry Overview
10
Sector CompositionMarket Size
24 29 32 32 32 34 35 37 41
50 59 69 76 87 98.5 108 117 126
FY10 FY11 FY12 FY13 FY14 FY15 FY16 FY17 FY18
(US$ billion)
Domestic Export
57%21%
22%
Sector Wise Breakup Of Export Revenue FY18
IT Services
BPO
R&D SoftwareProducts
86
32
33
15
Sector Wise Breakup of Indian IT market (US$ bn) FY18
IT Services
Business ProcessManagement
Software Products &Engineering Services
Hardware
Key Trends
US62%
UK17%
Europe(ex-UK)11%
Asia8%
RoW2%
Geographic Breakup Of Export Revenue In 2017-18
26 26 34 40 44 52 56 61 66 702612
1416 18
20 23 24 26 28
910
1113
1414
2022
2528
FY09 FY10 FY11 FY12 FY13 FY14 FY15 FY16 FY17 FY18
(US$ billion)
IT Services BPM Software Products & Engg. Services
Source: IBEF

Real Estate Sector in India – Significant Growth Potential
11
126180
FY15 FY20E
Market size Of Real Estate In India (US$ bn)
25647 351
1,9821,457
717
0
1000
2000
3000
LG MIG HIG
Cumulative Housing Demand-Supply In Top 8 Cities (‘000 units) 2016-20E
Demand Supply
16
25 26
815 13
32
4
0
10
20
30
40
City-Wise Commercial Space Demand (mn sq ft) 2013-18
Sector Composition
Key Trends
22 23
28 28 27
0
10
20
30
2013 2014 2015 2016 2017
Demand For Commercial Space In Top 8 cities(mn sq ft)
203 212 219 232 246
0
100
200
300
2013 2014 2015 2016 2017
Number Of New Malls In India
Market Size
Source: IBEF

Market Opportunity - Supported by Strong Govt. Initiatives
12
Smart Cities
▪ 100+ smart cities▪ Potential Market Size
(AutoDCR® & PWIMS™) :Rs. 500 Cr
AMRUT* Cities
▪ 500+ AMRUT cities▪ Potential Market Size
(AutoDCR® & PWIMS™): Rs. 1,000 Cr
Ease of doing business
▪ 4,000+ ULBs & Corporations.
▪ 1,200 will adopt BPAS in 3 years
▪ Market: Rs. 600 Cr
RERA
▪ 20% of 14,000 real estate market under process of adopting ERP
▪ Potential Market Size (OPTICON ™): Rs. 560 Cr
Digital India
▪ 30% of 500+ public works organizations in 3 years
▪ Potential Market Size (PWIMS ™) : Rs. 750 Cr
#PMAY
▪ 2800 cities selected ▪ 20% projects will adopt ERP for
execution ▪ Potential Market Size (OPTICON™):
Rs. 112 CrNotes:# PMAY refers to Pradhan Mantri AwasYojana*AMRUT refers to Atal Mission for Rejuvenation & UrbanTransformation

Business Overview

Product Evolution
14
Products Monetized and IP sold Current Products Upcoming Products
STRUDS
▪ Structural Analysis, Design & Detailing Software
▪ 4000+ Users
ESRGSR
▪ Structural Analysis, Design and Detailing for Water Tanks
▪ 100+ Customers
1996
2000
2007
2008
2009
2018
Under Development
Upcoming
LicensingAnd
Transaction basis
LicensingAnd
Transaction basis
LicensingAndSaaS
LicensingAnd
Transaction basis
SaaS SaaSSold to CSC, UK
AutoDCR®
▪ Automation of Building Permits (CAD based)
▪ Corporations / Local Bodies- 340+ live, 290+ in progress
PWIMS™
▪ Public Works Information Management System
▪ 10+ Government Organizations
OPTICON™
▪ ERP for Construction & Infrastructure companies
▪ 60+ Private Enterprises
BIMDCR ™
▪ 3D BIM model based Automation of Building Permits
RuleBuddy
▪ Building Projects Feasibility & Technical Analysis
IBPS
▪ Next generation innovative, intelligent and collaborative platform for Smart Cities

Current Products - AutoDCR®
15
✓ Unique and innovative Smart City Solution for building plan, scrutiny and approval system
✓ Solution for automation of building and layout plan approval - reads 2D CAD drawings and maps them to development control regulations of urban local bodies (ULBs)
✓ Approving authorities integrated with online approval workflow to monitor approval process with associated document scrutiny
Key Users Clients
▪ Municipal Councils & Corporations
▪ Urban Development Authorities
▪ Industrial Development Authorities
▪ Architects, Town Planners & Consultants
▪ Smart Cities
▪ 500+ local government Bodies in India, with over 150 in process
Process automation and integration
Acceleration of scrutiny process
Transparency (clear reasons for rejection
or approval)
Accountability through process efficiency
Uniformity in interpreting rules

Current Products - PWIMS™
16
✓ Enabling smarter management of processes for public works organization
✓ Web-based commercial-off-the shelf (COTS) application for managing all core functional process across project lifecycle including budgets, estimations, financial & technical approvals, e-tendering, contact management, monitoring and billing
▪ State and Country- level public works
departments
▪ Housing development boards
▪ Municipal Corporations
▪ Infrastructure development corporations
▪ Urban development authorities
▪ Irrigation departments
▪ Border road organizations
Clients
Prepare Estimate
Manage Tenders
Manage Billing
Manage work
orders
Maintain Assets
Manage Projects
Key Users
Core Processes
Manage approvals
Support Processes
Manage Integration
with SAP/ERP
Manage finance and Compliance
Manage HR & Administration
Manage External
Communication
Plan Budget

Current Products – OPTICON™
17
✓ Enterprise resource planning (ERP) software, combining advanced enterprise
technologies with nearly 20 years of construction industry domain experience
into integrated system
Key Users
▪ Builders and Real Estate Companies
▪ Turn Key contractors/ general contactors
▪ Infrastructure Companies
▪ Building contractors
Clients
Manage schedulesand eliminate cost and schedule overruns
Overview of all data in one Dashboard
Digitize all functionsinvolved in building construction lifecycle
Evaluate detailed cost estimate for projects
Bid efficiently

✓ Innovative 3D building model based online SINGLE WINDOW system
✓ BIM based integrated building approval system - enables automatic scrutiny of building proposal by reading building models submitted by applicant/architect
Current Products - BIMDCR ™
18
Key Users
▪ Smart cities▪ Municipal development
authorities, Fire authorities▪ Urban development authorities ▪ Industrial development authorities▪ Architects, tower planner &
consultants▪ MEP & utility consultants
Submission of combined model by applicant
Structural modelArchitectural model MEP model
Feedback
from
auth
ority
to a
pplic
ant
Building permission department
Bylaws verification report Area calculation reportClash detection reportModel comparison report
Various internal NOC departments (Fire, SWD, Water ,Traffic ,Garden, Tree etc)
Bylaws verification reportArea calculation reportClash detection reportModel comparison report
Various external NOC departments (Monuments,
Airport etc.)
Bylaws verification reportArea calculation reportClash detection reportModel comparison report
Combined remarks of all departments and deviations as per bylaws/norms highlighted – all on a single model
Clients
Data analysis and intelligent data output by BIMDCR ™

Upcoming product - Rule Buddy
19
✓E-commerce portal providing access to customers to realize their building projects
Enables Assessing & Analyzingcommercial and legal feasibility of any building project
Validates DCrules, fees, NOCs, mandatory documents requirements in 300+ULBs* in India
User gets to know whether project will pass through authority based on selected project parameters
Key Users
▪ Project owners▪ Project developers▪ Construction enterprises▪ Architects▪ Engineers▪ Contractors▪ Town planners▪ Financial institutions

Upcoming Product – IBPS (The Portal Based Approach)
Project Compliances (RERA specific)
Regulatory Frameworks
Governance Connect with Local bodies
Informatory -Construction/ Infrastructure-World updates, news, etc.
Project / Team Collaboration
Intelligent Urban Exchange
Platform
CITIZENS
BUILDERS
PROJECT TEAMS
LAWYERS CONSULTANTS
ARCHITECTS
CHARTERED
ACCOUNTANTS
INFRASTRUCTURE DEVELOPERS
Public Portal - Informatory
Regulatory Frameworks –National Building Codes/ State
Codes/ Rules
Project Collaborations Project
Compliances
Project planning, budgeting,
tracking
For Builders - RERAFor Infra Projects–Other Acts/ Forms
Legal frameworks – Info onlyFinance frameworks – Info only
on infra financings
Approvals/ Permission Processes
Document Management
Drawing Managements
Meeting Managements
Project sites/ sub sites of Builders
Project Portfolio analysis Project Risks analysis
20

Significant Market Potential For Growth
21
▪ Total market size of 3700+ ULB’s out of which 80% is still untapped
▪ SoftTech empanelled by Govt of India as consultant for smart city projects
▪ Strong demand in e-governance project & Construction
▪ Incorporated subsidiary in USA & Finland region
▪ Customization in AutoDCR® needed for US Govt approval - for which step down Subsidiary has been created
▪ GOI committed to e-governance projects
▪ Successful implementations in 7 state-wide organizations has given Company credibility and recognition
▪ Market size: 200+ state level organisations
▪ Africa, Australia, South-Asia and USA represents new markets for PWIMS ™
▪ Commonwealth countries follows similar process of PWD manual
▪ Construction enterprises becoming tech savvy & looking for ERP solutions
▪ Steady and robust growth is expected in next 3 years
▪ Market size: 13,000+ construction companies
▪ Huge market in MENA region
▪ Construction activity is expected to grow across emerging markets
▪ Products have advantage of price & features in global market
AutoDCR® PWIMS™ OPTICON ™
India
International

Pan–India Presence
22
10+ customers in International market (UAE, Oman, Nigeria) for OPTICON product
STRUDS product -adopted successfully at Malaysia, UAE, Kenya, Nigeria, Uganda
Telangana State Govt order (AutoDCR)
Mizoram PWD (PWIMS)
Andhra Pradesh state order (AutoDCR)
Ghaziabad Development Authority
(PWIMS)
MPUIIP (AutoDCR)
PWD West Bengal(PWIMS)
Jharkhand State order (AutoDCR)
Chennai Municipal Corporation (AutoDCR)
Mumbai Municipal Corporation (AutoDCR)
Pune Municipal Corporation(AutoDCR)
Uttarakhand PWD(PWIMS)
Gujarat State Order (AutoDCR)
Punjab PWD(PWIMS)
MIDC (AutoDCR & PWIMS)
Jaipur DevelopmentAuthority (AutoDCR)
Kerala State Order (AutoDCR)
State wide order
Municipal/local order

Expanding Global Footprint
23Tapping potential international markets with clear action plans
Expanding Global Footprint
Middle East (UAE, Saudi Arabia, Oman, Kuwait,
Bahrain etc)FY 19, 20
Africa (Nigeria, etc) FY 19, 20
South Asia (Singapore, Indonesia, Malaysia,
Philippines)FY 19, 20
North America FY 19, 20
Australia FY 20, 21
Europe ( Finland ) FY 19, 20

Long Standing Relationships Marquee Clients
24
OurClientele
AutoDCR® - State-wide
AutoDCR® - Corporations
OPTICON™- India
OPTICON™ - Africa
OPTICON™ - Middle East
PWIMS™

Business Strategy
25Holistic approach with focus on key growth drivers
Business Model
Leverage Partnerships▪ Channel partners, local
established players, leverage sales network of technology partner
Brand Marketing▪ Event participation, industry
leadership programs and industry associations
Product Strategy▪ Diverse offerings and market
segmentation
Scalable Revenue Model
▪ Scalable and sustainable revenue generation using multiple revenue models

Key Strengths
26
Proven Unique Technology
▪ Product designed to meet needs of e-governance and construction sectors
▪ Scalable & flexible products▪ Alliances with many technology leaders
Commercial Viability
▪ Higher ROI – profitable since inception▪ Lower product development cost due to
readily available expertise for CAD, BIM and web technologies
Favorable Market Conditions
▪ Govt. initiatives for EODB, digital India and smart cities
▪ Growing construction & infrastructure industry
▪ High adoption of internet, mobile & cloud technology
Successful Track Record
▪ Largest market share in India (80%) for building plan approval management system
▪ Tried and tested technological products▪ Customers spread across India▪ Pre-approved government vendor
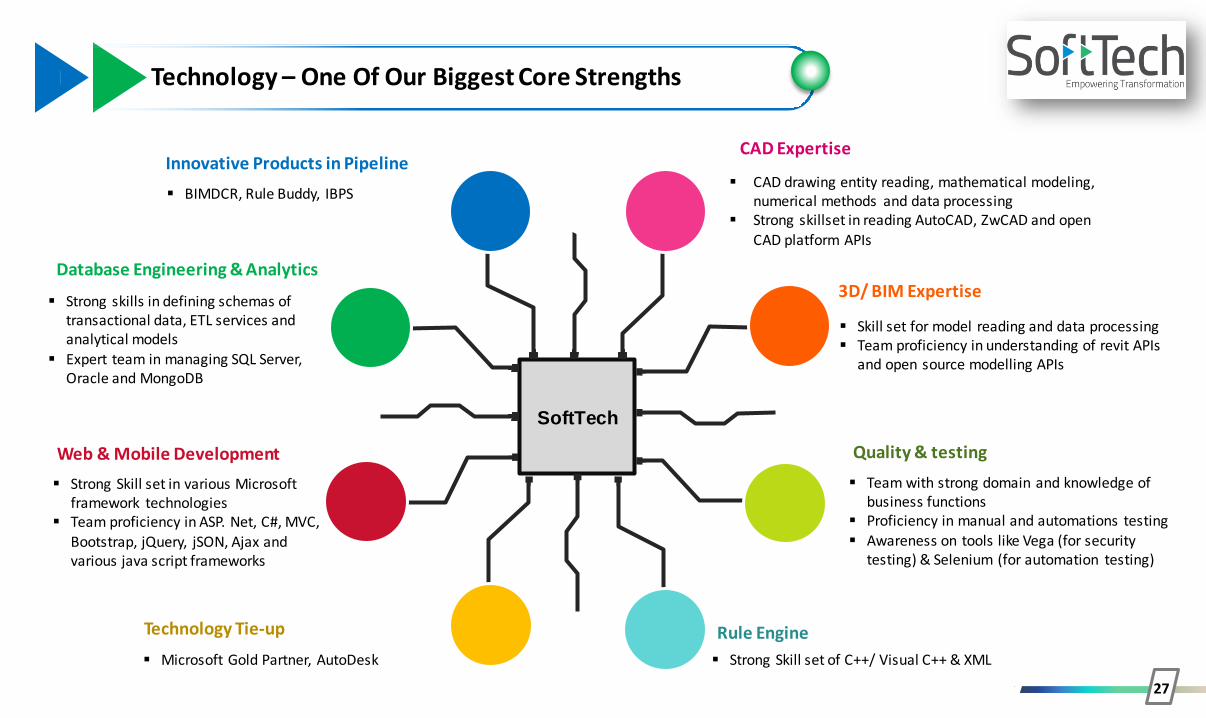
Technology – One Of Our Biggest Core Strengths
27
SoftTech
CAD Expertise
▪ CAD drawing entity reading, mathematical modeling, numerical methods and data processing
▪ Strong skillset in reading AutoCAD, ZwCAD and open CAD platform APIs
3D/ BIM Expertise
▪ Skill set for model reading and data processing▪ Team proficiency in understanding of revit APIs
and open source modelling APIs
Quality & testing
▪ Team with strong domain and knowledge of business functions
▪ Proficiency in manual and automations testing▪ Awareness on tools like Vega (for security
testing) & Selenium (for automation testing)
Rule Engine
▪ Strong Skill set of C++/ Visual C++ & XML
Technology Tie-up
▪ Microsoft Gold Partner, AutoDesk
Web & Mobile Development
▪ Strong Skill set in various Microsoft framework technologies
▪ Team proficiency in ASP. Net, C#, MVC, Bootstrap, jQuery, jSON, Ajax and various java script frameworks
Database Engineering & Analytics
▪ Strong skills in defining schemas of transactional data, ETL services and analytical models
▪ Expert team in managing SQL Server, Oracle and MongoDB
Innovative Products in Pipeline
▪ BIMDCR, Rule Buddy, IBPS

Awards and Recognitions
28
“National Award for Innovative use of technology in e-
Governance 2014” for ABPAS implemented by
SoftTech at MPUIIP
AIMA Award for “Creativity & Innovation in
Micro, Small & Medium Enterprises – 2016”
SME Achievers Award for Year
2015-16 by SME 100 FORUM, Supported by
Ministry of MSME, Govt. of India
Adjudged among “Top 50 Emerging Software Product
Companies in India” By NASSCOM in
2014
AUTODCR Conferred with ‘Manthan South Asia Award 2010 For e-Governance
Financial Highlights

Half Yearly – Financial Highlights
30
Rs. Cr H1 FY19 H1 FY18 Y-o-Y (%) H2 FY18
Revenue from Operations 29.60 20.63 43.47% 30.91
Raw material 1.88 1.76 2.65
Employee expenses 4.94 4.21 4.16
Professional fees for technical consultants
10.72 5.92 11.02
Other expenses 4.82 2.91 3.68
Total expenditure 22.36 14.81 21.50
EBITDA 7.24 5.82 24.40% 9.41
EBITDA Margin (%) 24.46% 28.21% 30.43%
Other income 0.41 0.25 0.21
Deprecation 2.00 1.94 1.84
Interest 0.88 1.19 1.07
Exceptional item 0.00 0.00 0.00
PBT 4.77 2.93 62.94% 6.70
Tax 1.32 0.81 2.02
PAT 3.45 2.12 63.24% 4.68
PAT Margin (%) 11.67% 10.26% 15.13%
Basic EPS (in Rs.)* 3.87 3.00 29.00% 6.63
• Revenue increased mainly due to faster execution of orders and strong order book
• EBITDA margin decline mainly on account of below factors:▪ Overseas expansion▪ Increased marketing
activities in domestic market
▪ Outsourced professional technical consultancy for certain orders to speed up implementation process
• Prepayment of high interest long- term debt led to increased profit

Balance Sheet – As on 30th September 2018
31
Rs. in CrAs on
30th Sept-18As on
31stMar-18
Shareholder’s Funds 56.78 37.40
Share capital 9.42 7.05
Reserves & Surplus 47.36 30.35
Non-current liabilities 4.12 5.64
Long-term borrowings 3.49 5.10
Other Long-term liabilities 0.01 0.01
Long-term provisions 0.62 0.53
Current liabilities 15.31 25.43
Short- term borrowings 4.76 4.51
Trade payables 1.48 7.55
Other current liabilities 7.98 13.13
Short-term provisions 1.10 0.24
Total Equity & Liabilities 76.21 68.46
Rs. in CrAs on
30th Sept-18As on
31stMar-18
Non-current Assets 21.12 20.28
Property, Plant & Equipment 0.83 1.00
Intangible assets 6.05 7.68
Non-current investments 0.06 0.04
Intangible assets under development 5.76 3.80
Deferred tax assets (Net) 1.00 0.76
Other Non-current assets 6.06 5.71
Long-Term loans & advances 1.35 1.28
Current Assets 55.10 48.19
Current Investments 5.00 0.00
Trade receivables 20.89 21.80
Cash & cash equivalents 0.17 1.27
Short-term loans & advances 1.60 1.58
Other current assets 27.43 23.53
Total Assets 76.21 68.46

Annual Financial Highlights
32
#Revenue (Rs. Cr) #EBITDA (Rs. Cr) / Margin (%)
25.62
35.25
43.99 46.7251.54
2014 2015 2016 2017 2018
Profit after Tax (Rs. Cr)/ Margin (%)
6.81 7.8610.15
12.9715.23
26.58%
22.29%23.07%
27.77%29.55%
8%
13%
18%
23%
28%
33%
0
5
10
15
20
2014 2015 2016 2017 2018
2.033.01 3.29
4.92
6.797.94% 8.53% 7.48%
10.53%13.18%
0%
2%
4%
6%
8%
10%
12%
14%
0
2
4
6
8
2014 2015 2016 2017 2018# Revenue & EBITDA excluding other income * EPS for all years has been adjusted for Bonus issue 1:1 in Feb 2018,as per Ind-AS guidelines
*Earning Per Share (in Rs.)
4.02
5.77 6.326.97
9.63
0
2
4
6
8
10
12
2014 2015 2016 2017 2018

Annual Financial Highlights
33
Rs. Cr FY18 FY17 Y-o-Y (%)
Revenue from Operations 51.54 46.72 10.33%
Raw material 4.41 7.14
Employee expenses 8.37 8.09
Other expenses 23.54 18.51
Total Expenditure 36.31 33.74
EBITDA 15.23 12.97 17.38%
EBITDA Margin (%) 29.55% 27.77% 178 bps
Other income 0.45 0.46
Depreciation 3.78 3.74
EBIT 11.90 9.70 22.66%
Interest 2.27 2.37
Exceptional item 0.00 0.00
PBT 9.63 7.33 31.37%
Tax 2.84 2.41
PAT 6.79 4.92 38.15%
PAT Margin 13.18% 10.53% 265 bps
*Basic EPS (in Rs.) 9.63 6.97 38.16%
* EPS FY 17 & FY 18 has been adjusted for Bonus issue 1:1 in Feb 2018, as per Ind-AS guidelines

Revenue Contribution – Product Wise (as % of sales)
34
FY2017
AUTODCR60%
PWIMS20%
OPTICON1%
*Others19%
* Others includes revenue from products and services other than own products
FY2018
AUTODCR57%
PWIMS25%
OPTICON8%
*Others10%

Balance Sheet – As on 31st March 2018
35
Rs. in CrAs on
31stMar-18As on
31st Mar-17
Shareholder’s Funds 37.40 30.96
Share capital 7.05 3.53
Reserves & Surplus 30.35 27.43
Non-current liabilities 5.64 9.25
Long- term borrowings 5.10 8.84
Other Long-term liabilities 0.01 0.01
Long-term provisions 0.53 0.40
Current liabilities 25.43 20.24
Short- term borrowings 4.51 4.27
Trade payables 7.55 5.62
Other current liabilities 13.13 10.20
Short-term provisions 0.24 0.16
Total Equity & Liabilities 68.46 60.45
Rs. in CrAs on
31stMar-18As on
31st Mar-17
Non-current assets 20.28 20.09
Property Plant & Equipment 1.00 1.80
Intangible assets 7.68 7.39
Intangible assets under development 3.80 2.30
Deferred tax assets 0.76 0.36
Non-current investments 0.04 0.04
Long-term loans & advances 1.28 1.53
Other Non-current assets 5.71 6.67
Current assets 48.19 40.35
Trade receivables 21.80 17.75
Cash & Cash equivalents 1.27 3.26
Short-term loans & advances 1.58 1.70
Other current assets 23.53 17.65
Total Assets 68.46 60.45

Key Ratios
36
ROE (%) ROCE (%)
Debt to Equity Ratio
13.37% 13.10% 12.63%
15.88%18.17%
2014 2015 2016 2017 2018
0.79
0.38
0.56
0.42
0.26
2014 2015 2016 2017 2018
16.94%19.01%
17.08%
22.04%25.33%
2014 2015 2016 2017 2018
RoE = Net Profit/Net Worth : D/E = Total Debt/Total Equity : RoCE = EBIT/(Shareholders Fund + Total Debt -Non current investments) : ROA = Net Profit/ Total Assets
ROA (%)
5.68%
7.13%
5.62%
8.14%
9.92%
2014 2015 2016 2017 2018

Way Ahead

Our Growth Drivers
38
Rs. 1,125 Cr
AUTODCR® PWIMS™ OPTICON™ BIMDCR RULE BUDDY
Smart Cities: Rs. 150 Cr
AMRUT Cities: Rs. 375Cr
EODB: Rs. 600 Cr
Smart Cities: Rs. 350 Cr
AMRUT Cities: Rs. 625Cr
Digital India: Rs. 750 Cr
RERA: Rs. 560 Cr
PMAY: Rs. 112 Cr
Smart Cities: Rs.150 Cr
AMRUT Cities: Rs. 375Cr
EODB: Rs. 600 Cr
Architects: Rs. 227 Cr
Developers: Rs. 94 Cr
Fin Institutes: Rs. 8 Cr
Education: Rs. 37 Cr
Rs. 1,725 Cr Rs. 672 Cr Rs. 1,125 Cr Rs. 366 CrMarket Potential
Opportunities
Our Product Offerings

Way Forward…
39
Innovate
Augment
Expand
▪ Continued investments in R&D▪ Innovate new products▪ Develop new applications for established products▪ Co-development opportunities with strong international Product
companies - to create world class product offerings
▪ Widen customer base by augmenting company reach toenterprises and corporates and international Strategicpartners
▪ Increase product contribution of PWIMS™, OPTICON™ andother upcoming products
▪ Organic growth - Product base and industry offerings, presence & setup across India & overseas
▪ Inorganic growth - International and domestic markets through jointventures or strategic alliances, strategic Investments or tie ups addingvalue to existing suite of products, increase wallet share of existingcustomer, new products, customers & geographies
▪ International JV’s / partnership giving benefit of leveraging assets andresources
Vision 2022 – To become 150+ crore turnover company, via organic growth in domestic and overseas markets, endeavor 30% from International business adding to overall revenue

Thank You
40
For further information, please contact:
Company : Investor Relations Advisors :
SoftTech Engineers Limited
Ms. Aishwarya [email protected]
www.softtech-engr.com
Bridge Investor Relations Pvt. Ltd.
Ms. Savli [email protected]
Ms. Aesha [email protected]
www.bridge-ir.com
SOFTTECH:IN SOTF.NSSOFTTECH