Embed Size (px)
Citation preview

Soft Matter under Exogenic Impacts edited by Sylwester J. Rzoska Dept. of Biophysics and Molecular Physics Institute of Physics Silesian University Katowice POLAND and Victor A. Mazur Dept. of Thermodynamics Institute of Energy and Ecology State Academy of Refrigeration Odessa UKRAINE
Downloaded from http://polymerphysics.netDownloaded from http://polymerphysics.net

TABLE OF CONTENTS Part I: General Issues Asteroid impact in the black sea; a black scenario R. D. Schuiling, R. B. Cathcart, V. Badescu............................................1 The conductivity of hydrogen in extreme conditions V. T. Shvets, S. V. Savenko, J. K. Malynovski...........................................9 Dynamic Crossover and liquid- liquid critical point in the TIP5P model of water P. Kumar, S. V. Buldyrev, H. E. Stanley..................................................22 Amorphization of ice by collapse under pressure, vibrational properties and ultraviscous water at 1 GPa G. P. Johari, O. Andersson......................................................................33 Coupled ordering in soft matter: competition of mesoscales and dynamics of coupled fluctuations M. A. Anisimov..........................................................................................73 All standard theories and models of glass transition appear to be inadequate: missing some essential physics K. L. Ngai.................................................................................................89 Part II: Glass forming liquids Positron annihilation lifetime spectroscopy and atomistic modeling - effective tools for the disordered condensed systems characterization J. Bartoš, D. Račko, O.Šauša, J. Krištiak................................................110 Segmental and chain dynamics in Polymers, C. M. Roland and R. Casalini.................................................................130 Isobaric and Isochoric properties of glass-formers, R. Casalini and C. M Roland..................................................................137
Molecular structure and relaxation processes in diisooctyl phthalate and diisooctyl maleate. S. Pawlus, M. Paluch, M. Mierzwa, S. Hensel – Bielowka, E. Kaminska, K. Kaminski, S. J. Rzoska and S. Maslanka.....................144 Orientationally disordered glassy phases J. Ll. Tamarit, S. Pawlus, A. Drozd-Rzoska and S. J. Rzoska..................155 Part III: Liquid Crystals Glassy dynamics of rod – like liquid crystals: the influence of molecular structure A. Drozd-Rzoska, S.J. Rzoska, M. Janik...................................................182 Ordering effects on dynamics in glassforming mixture of liquid crystals M. Mierzwa, M. Paluch, S. J. Rzoska, J. Zioło, U. Maschke....................193 Nonlinear dielectric spectroscopy near SmA - SmC* transition in ferrolectic liquid crystal DOBAMBC S. J. Rzoska and A. Drozd-Rzoska ...........................................................208 Confined liquid crystaline 5CB – combined temperature and high pressures dielectric relaxation studies S. Pawlus, S. J. Rzoska, W. Osińska, S. Cordoyiannis, S. Kralj...............220 Annihilation of defects in liquid crystals M. Svetec, M. Ambrožič, S. Kralj..............................................................230 Waves at the nematic-isotropic interface: nematic—non-nematic and polymer-nematic mixtures V. Popa-Nita, T. J. Sluckin........................................................................243 Part IV: Critical Liquids Global phase behaviour of supercritical water – environmentally significant organic chemicals mixtures S. V. Artemenko, V. A. Mazur.................................................................259 Properties of water near its critical point V. Kulinskii, N. Malomuzh.......................................................................277

Fluctuational equation of state and slopes of critical curves near the critical point of solvent V. Rogankov, O. Byutner.........................................................................295 Combined models of thermophysical properties along the coexistence curve E. E. Ustjuzhanin, B. F. Reutov, V. F. Utenkov, V. A. Rykov...................314 Intermolecular potential for simple liquids and gases in the high pressure region V. Yu.Bardic, L. A.Bulavin, V. M.Sysoev, N. P.Malomuzh, K. S.Shakun..................................................................328 Homogeneous nucleation and growth from highly supersaturated vapor by molecular dynamics simulation, N. Lümmen, B. Fischer, T. Kraska...........................................................341 How to generate and measure negative pressure in liquids? A. R. Imre.................................................................................................367 Indirect methods to study liquid-liquid miscibility in binary liquids under negative pressure A. R. Imre, A. Drozd-Rzoska, T. Kraska, S. J. Rzoska............................ 378 Part V: Bio-iquids and related problems Critical properties of soft matter at restricted geometry as emerging problem: fundamentals and biological applications A. V. Chalyi, L. A. Bulavin and K. A. Chalyy , L. M. Chernenko...............................................................387 Water-biomolecule systems under extreme conditions: From confinement to pressure effects M.-C. Bellissent-Funel.............................................................................401 Recent progresses in understanding of water interacting with biomolecules, and inside living cells and tissues R. C. Ford, J. Li........................................................................................420

Self-assembly of polypeptides. The effect of thermodynamic confinement G. Floudas and P. Papadopoulos.............................................................434 Coulomb liquids under electric field – application of a new computer simulation method E. S. Yakub................................................................................................443 Solvation effect in near-critical polar liquids A. Onuki....................................................................................................452 PARTICIPANTS:
Directors: Sylwester J. Rzoska Institute of Physics, Silesian University, Katowice, POLAND Victor M. Mazur Academy of Refrigeration, Odessa 65026, UKRAINE
Key speakers: Gyan P. Johari Dept. of Materials Science and Engineering, McMaster University, CANADA. Christiane M. Alba-Simionesco Lab. Chimie Physique, C.N.R.S, Université Paris-Sud Orsay, FRANCE. Marie-Claire-Bellisent Laboratoire Leon Brillouin, Gif-Dur-Yvette, FRANCE Thomas Kraska Institute for Physical Chemistry, University at Cologne, Köln, GERMANY.

George Floudas, Department of Physics, Univ. of Ioannina, Ioannina, and FORTH-BRI GREECE, Attila R. Imre KFKI Atomic Energy Institute, Budapest, HUNGARY Simone Capaccioli Istituto Nazionale per la Fisica della Materia and Dip. di. Fisica Univ. di Pisa, ITALY Rolaf D. Schuiling Utrecht University, Utrecht, The NETHERLANDS Aleksandra Drozd-Rzoska Institute of Physics, Silesian University, Katowice, POLAND. Marian Paluch, Institute of Physics, Silesian University, Katowice, POLAND. Stefan Jurga, A. Mickiewicz University, Department of Macromolecular Physics, Poznan, POLAND Jerzy Zioło Institute of Physics, Silesian University, Katowice, POLAND. Samo Kralj Univerza v Mariboru, Oddelek za fiziko, Maribor, SLOVENIA. Josep Lluís Tamarit ETSEIB, Universitat Politècnica de Catalunya, , Barcelona, Catalunya, SPAIN. Jichen. C. Li Dept. Physics, Biomolecular Sci, Manchester University, Manchester, UK Eugene H. Stanley Center for Polymer Studies, Dept Phys., Boston University, Boston, USA Mikhail A. Anisimov

Dept. Chem. Engn. & Inst. for Phys. Sci.&Tech. Univ. of Maryland College Park, USA C. Mike Roland Naval Research Laboratory, Washington, USA Kia L. Ngai Naval Research Laboratory, Washington, USA Eugene Yakub Computer Science Dept., State Economic University, Odessa, UKRAINE. Leonid Bulavin Taras Shevchenko Kiev National University, UKRAINE. Nikolay Malomuzh Odessa National University, Odessa, UKRAINE Aleksandr V. Chalyi Physics Dept., National Medical University, Kiev, UKRAINE Kirill Schmulovich Institute of Experimental Mineralogy, Chernogolovka, RUSSIA. Akira Onuki Department of Physics, Graduate School of Science, Kyoto University, Kyoto, JAPAN.
Other Participants: George Cordoyiannis National Centre for Scientific Research “Demokritos”, Aghia Paraskevi, GREECE Michał Mierzwa Institute of Physics, Silesian University Katowice, POLAND Wiesław Sułkowski Institute of Chemistry, Silesian University, Katowice, POLAND Sebastian Pawlus Institute of Physics, Silesian University, Katowice, POLAND

Małgorzata Janik Institute of Physics, Silesian University, Katowice, POLAND Sławomir Maślanka Institute of Chemistry, Silesian University, Katowice, POLAND Milan Svetec Regional Dev. Agency and Fac. of Educ., University of Maribor, Maribor, SLOVENIA. Josef Bartos Polymer Inst., Slovak Academy of Sciences, Bratislava, SLOVAKIA. Ricardo Casalini Naval Res. Lab., Washington DC and George Mason University, Fairfax, USA Vlad Popa-Nita Faculty of Physics, University of Bucharest, ROMANIA Dmitry Yu. Ivanov St. Petersburg State Uni. of Refrig. and Food Engn, Saint Petersburg, RUSSIA. H. Schvets Odessa Natl. University, Odessa, UKRAINE. Vitaly Rogankov Odessa Natl. University, Odessa, UKRAINE. Vladimir Kulinski Odessa Natl. University, Odessa, UKRAINE. Sergey Artemenko Odessa Natl. University, Odessa, UKRAINE.

ARW NATO “Soft matter under exogenic impacts” Odessa, Ukraine, 2005 conference photo at the terrace of Hotel “Morskoy”. Arrows indicate directors of the Workshop.

POSITRON ANNIHILATION LIFETIME SPECTROSCOPY AND ATOMISTIC MODELING – EFFECTIVE TOOLS FOR THE DISORDERED CONDENSED SYSTEM CHARACTERIZATION
FREE VOLUME FROM PALS AND MODELING
J.BARTOŠ∗, D.RAČKO Polymer Institute of SAS, Dúbravská cesta 9, 842 36 Bratislava Slovakia
O.ŠAUŠA, J.KRIŠTIAK Institute of Physics of SAS,Dúbravská cesta 9,842 28 Bratislava, Slovakia
Abstract. The complex structure–property relationships in the disordered systems under normal and exogenic conditions can be understood after characterizing the spatial arrangement of constituents. Here, an integral approach including the relevant experimental technique, phenomenological and theoretical analyses as well as atomistic modeling is presented. Application of such a combined approach is demonstrated for the cases of glycerol and propylene glycol.
Keywords: free volume; positron annihilation; free volume models; atomistic modeling
1. Introduction
Many important condensed materials are characterized by the irregular spatial arrangements of the particles‘ constituents. Understanding the complex structural – property relationships in such systems under normal and exogenic conditions needs as complete as possible a characterization of the irregular sites of the matrix. At present, the relevant experimental technique is positron annihilation lifetime spectroscopy (PALS). In order to utilize fully the characterization potential of this method there is required a complete understanding of the universal as well as the specific features of the PALS
______ ∗ To whom correspondence should be addressed. E-mail:

FREE VOLUME FROM PALS AND MODELING 111
response of a given material. To solve this complex task requires a combined approach including phenomenological analyses of the PALS response using the thermodynamic and dynamic data, its appropriate theoretical treatments, i.e., free volume analyses (FVA) and theoretical and atomistic modeling approaches consisting in appropriate free volume models of liquid state or molecular dynamics (MD) simulation followed by the cavity analysis (CAVA), respectively.The individual aspects of this combined approach will be presented together with application on two model systems.
2.Positron annihilation lifetime spectroscopy
Positron annihilation lifetime spectroscopy (PALS) is based on the unique annihilation behavior of ortho-positronium (o-Ps)1-5 being very sensitive indicator of the local regions of lowered electron density in condensed matrix such as vacancies in the ordered (crystal) systems or the so-called free volume holes in the disordered (amorphous or semicrystalline) ones. When a positron, e+, from the positron source 22Na enters the condensed system it loses its kinetic energy very quickly under forming a positron radiation track which contains the ionized entities such as electrons, e-, and cations of constituents, M+ and the excited species. The large majority of these ionized species are immediately neutralized by their mutual recombinations within the positron track but some of electrons can escape it and be preferentially trapped in the local positively charged regions of the matrix. The electrons from track and the trapped electrons can capture the original or next entering positron at forming a neutral bound positron-electron particle, the so-called positronium (Ps). Depending on the mutual spin orientation of positron and electron in Ps, two distinct states differing in the respective lifetimes, τ , can arise. Singlet with antiparalel spins: para-positronium (p-Ps) has a typical lifetime, τ1 ≅ 0.12 ns being almost independent on temperature. On the other hand, a triplet state with parallel spins forms the ortho-positronium (o-Ps) which is more stable with a typical lifetime,τ3 , ranging from ~ 0.6 – 5 ns in normal organic substances. This specific form of Ps annihilates by an interaction of the positron with some electron from the surrounding medium with antiparallel spin in the so-called pick-off decay mechanism being temperature dependent. Finally, in addition to the above-mentioned bounded forms of positron, the unbounded “free“ positron can survive in the matrix with a typical lifetime, τ2 ≅ 0.3 - 0.4ns which annihilate by an interaction with some electron in the matrix.

112
2.1 TYPICAL PALS RESPONSE, ITS PHENOMENOLOGICAL ANALYSIS AND CORRELATIONS
Figure 1 shows the typical o-Ps responses of two small molecular glass-formers: glycerol (GL) HO-CH2-CH(OH)-CH2-OH 6 and 1,2-propylene glycol (PG) HO-CH2-CH(OH)-CH3
7. In both the chemical compounds, the o-Ps lifetime, τ3, as a function of temperature exhibits four regions of different thermal behavior depicted as regions I, II, III and IV. Linear analyses of these regions define the characteristic PALS temperatures in the liquid state: Tg
PALS, TL
b1 and TLb2 8. In the case of GL: Tg
PALS = 189K, TLb1 = 241K and TL
b2 ≅ 290K, while for PG: Tg
PALS = 172K, TLb1 = 220K and TL
b2 ≅ 265K.
0 50 100 150 200 250 3000.8
1.0
1.2
1.4
1.6
1.8
2.0
2.2
2.4
2.6
2.8
3.0
0 50 100 150 200 250 3000.8
1.0
1.2
1.4
1.6
1.8
2.0
2.2
2.4
2.6
2.8
3.0
TgPALS
TLb1
TLb2
IVIII
II
I
GL vs. PG
τ 3 , ns
T , K
Glycerol
Propylene glycol
Figure 1. The o-Ps lifetime, τ3, as a function of temperature for glycerol (GL) and propylene glycol (PG)
The first pronounced change in slope on τ3 – T plot takes place near the corresponding quasi-static glass to liquid transition temperatures, Tg
THERM as obtained by classical macroscopic thermodynamic techniques such as dilatometry9,10 as well as to the dynamic glass temperatures, Tg
DYN, being commonly defined as the temperature at which the mean relaxation time of the primary α relaxation reaches some arbitrary value, e.g., τα = 100s11,12. These findings mean that the expansion behavior of the localized free volume regions detectable via the annihilation of the o-Ps probe is closely related to the expansion behavior of the macroscopic volume as well as to the cooperative

FREE VOLUME FROM PALS AND MODELING 113
dynamics which is believed to be responsible for the most characteristic dynamic process, i.e., the primary α relaxation. In the glassy state region I up to Tg
PALS, GL and PG are characterized by the relatively low o-Ps lifetimes, whereby the values of τ3 for GL are systematically smaller then those for PG over the whole temperature range investigated. By comparing GL and PG with small molecular systems of van der Waals type as studied by us such as meta-tricresyl phosphate (m-TCP)5 or diethyl phthalate (DEP)13 it indicates that both the systems are relatively effectively packed ones. This appears to be consistent with the hydrogen-bonding nature of both the systems, whereby the lower values for GL may be attributed to the higher density of hydroxyl groups capable to form more intermolecular hydrogen bonds compared to PG. Anyway, the presence of H-bonding leads to the more compact and stiffer microstructure of GL matrix with respect to the PG one as well as to some typical van der Waals substances such as m-TCP and DEP 5,13.
160 180 200 220 240 260 280 300 320 340-12
-10
-8
-6
-4
-2
0
2
160 180 200 220 240 260 280 300 320 340-12
-10
-8
-6
-4
-2
0
2
160 180 200 220 240 260 280 300 320 340-12
-10
-8
-6
-4
-2
0
2
160 180 200 220 240 260 280 300 320 340-12
-10
-8
-6
-4
-2
0
2
160 180 200 220 240 260 280 300 320 340-12
-10
-8
-6
-4
-2
0
2
160 180 200 220 240 260 280 300 320 340-12
-10
-8
-6
-4
-2
0
2
TBSCH=268K
TLb2=265KTL
b1=220KTg=168K
PG
log
τ α (s
) , -
T , K
Schoenhals 1993 Park 1999
Leon 1999
Stickel 1995
Lunkenheimer 2001
τα(TL
b2)=τ3
τα(TL
b1)
Bergman 2002
Figure 2. Compilation of the primary α relaxation times for propylene glycol (PG) together with the characteristic PALS temperatures (Tg , TL
b1 and TLb2 ) and the DS temperature TB
SCH showing empirical correlation between TL
b2 and TBSCH
In the liquid state above TgPALS, the two further bend effects are evident in
Figure 1: i) a slight change in slope in strongly cold liquid at TLb1 = 1.275 Tg
PALS
for GL and TLb1 = 1.28Tg
PALS for PG which defines mild crossover between regions II and III and finally ii) a large change in slope in weakly cold liquid at higher temperatures to a quasi-plateau level at TL
b2 = 1.53TgPALS for GL and
TLb2 = 1.54 Tg
PALS for PG defining drastic crossover between regions III and IV.

114
First, we analyse the former of the mentionned effects. Figure 2 represents a compilation of the mean relaxation time of the primary α process, τα , as a function of temperature for PG as obtained from several dielectric relaxation studies in the literature. As can be seen, at TL
b1 the mean dielectric relaxation time of the primary α process reaches just the value of 10-6 s, now being depicted as Tα(-6). Similar situation can be found also for further glass-forming systems. Figure 3 demonstrates such an empirical correlation between the TL
b1’s values and the characteristic DS temperature Tα(-6) for a series of small molecular as well as polymer glass-formers. This finding suggests that a change in the expansion behavior of the localized free volume regions at around 1.2 - 1.3 Tg
PALS seems to reflect some universal feature of glass-forming liquids which occurs when the mean α relaxation time reaches just a microsecond level.
200 220 240 260 280 300200
220
240
260
280
300
200 210 220 230 240 250 260 270 280 290 300200
210
220
230
240
250
260
270
280
290
300
A
G
F
EDC
B
3
2
1
TLb1 - Tα
(-6) correlation
Tα(-6) = T
α(log τ
α = − 6 ) , K
low MW compounds:
A - DEP B - PG C - DPG D - TPG E - GL F - m-TCP G - OTP
TL
b1 ,
K
high-MW compounds:
1 - c-t-1,4-PBD 2 - PPG 4000 3 - PIB
Figure 3. The empirical correlation between the first characteristic PALS temperature, TL
b1, and the temperature, Tα(-6) , at which the primary α relaxation time, τa , reaches just 10-6s for a series of small molecular and polymer glass-formers.
Explanation of this feature in the o-Ps response is the subject of a continuing interest. The two possible-not necessary excluding-explanations based on either structural or dynamical hypothesis have recently been suggested by us5. Here, we discuss the latter possibility consisting in the influence of some more rapid local mobility, generally named as secondary relaxations, on a redistribution of the free volume hole population. Figure 4 presents the temperature dependences of relaxation time for both the primary α relaxation and the secondary β process for glycerol. Their values were obtained by a

FREE VOLUME FROM PALS AND MODELING 115
spectral deconvolution of the dielectric spectra in terms of the Cole – Davidson (CD) function for the α process and the Cole - Cole (CC) function for the β one14. In particular, the closseness between the o-Ps lifetime, τ3, and the mean secondary β relaxation time, τβ , at temperature 253K quite close to TL
b1 = 241K suggests that the local rapid β relaxators might contribute to the effective free volume distribution accesible for o-Ps probe. According to the general length – frequency principle of the dynamic events15, presumably smaller free volume holes requesting the smaller amplitude local motion might be eliminated from detection by an o-Ps probe. This elimination may result into the dominance of the larger free volume holes above TL
b116.
180 200 220 240 260 280 300 320 340 360 380 400 420-12
-10
-8
-6
-4
-2
0
2
4
180 200 220 240 260 280 300 320 340 360 380 400 420-12
-10
-8
-6
-4
-2
0
2
4
α - process
DS data (Lunkenheimer 2002)
τβ=τ
3
τα=τ
α(TL
b2)
T(τ3=τ
β)
τα(Tb1)
TLb2=290K
TLb1=241K
Tg=190K
Glycerol
log
τ (s)
, -
T , K
β - process
Figure 4. Relationship between the o-Ps lifetime, τ3 , and the secondary βJG relaxation time, τβ for GL. On increasing further the temperature, a dramatic discontinuity on τ3 - T plot occurs, at 1.53 Tg
PALS in GL and 1.54 TgPALS in PG, characterized by a crossover
from the steeply increasing linear trend in the weakly cold liquid to a quasi - plateau level in the warm liquid. The onset of the plateau effect correlates with several dynamic features of the primary α process as observed in dielectric spectroscopy studies17,18. First, Figure 5 presents the so-called Stickel’s plot for DS data on GL taken from Ref. 17. Here, the two linear regions indicate a crossover between the two different motional regimes at the so-called Stickel temperature, TB
ST = 287K. Similar type of analysis for PG gives TBST = 270 K17.
In both the cases, good coincidence between the onset of plateau region at TLb2
and this characteristic DS temperature can be found for GL (Ref. 6) and PG. Secondly, Figure 6 shows the so-called Schönhals’ plot for the relaxation

116
strength of the α process for PG, ∆εα , vs. logarithm of the α relaxation time, log τα
18. Evidently, a dramatic change at the characteristic DS temperature, TB
SCH = 268K can be found being in the vicinity of the TLb2 = 265K. Good
2.5 3.0 3.5 4.0 4.5 5.0 5.5 6.0
0.3
0.4
0.5
0.6
0.7
0.8
0.9
2.5 3.0 3.5 4.0 4.5 5.0 5.5 6.0
0.3
0.4
0.5
0.6
0.7
0.8
0.9
2.5 3.0 3.5 4.0 4.5 5.0 5.5 6.0
0.3
0.4
0.5
0.6
0.7
0.8
0.9
DS data (Stickel 1995)
TBST = 287K
Glycerol
Φ =
[ ∆
log
τ α / ∆(
1000
/T) ]
, -
1000/T , 1/K
Figure 5 Stickel’s plot for the primary α relaxation time, τα for GL demonstrating the change in the dynamical regime at the characteristic DS (Stickel) temperature, TB
ST correlating with the characteristic PALS temperature TL
b2 .
agreement between TBST and TB
SCH for GL and PG and its correlation with the dramatic change in the PALS response at TL
b2 indicates the common origin of these significant changes in the relaxation time,τα ,the relaxation strength, ∆εα, and the o-Ps lifetime,τ3. This feature will be addressed further below. Finally, in addition to the above-mentioned coincidence between the characteristic PALS and DS temperatures reflecting the changes in both the annihilation and relaxation quantities, more direct relationship between the corresponding time scales of both the methods exists. In other words, a comparison of the τ3 value at the onset of the quasi-plateau region in Figure 1 with the mean relaxation times of the α process, τα , from Figure 2 for PG confirms our so far findings of the equality between both the time parameters for other small molecular and polymer systems8. The same has already been found to be valid for GL6. This fact indicates very close relationship between the progressively fluctuating matrix via the less cooperative α dynamics and the mean lifetime of the o-Ps probe8 at the relatively higher temperatures, and at higher macroscopic volumes, V(T), and then, at higher static empty free volumes Vf
e(T) = V(T) - VW, where VW is the van der Waals volume of the molecules. The continuously

FREE VOLUME FROM PALS AND MODELING 117
0
10
20
30
40
50
60
70
0
10
20
30
40
50
60
70
-12 -11 -10 -9 -8 -7 -6 -5 -4 -3 -2 -1 0 1 2 30
10
20
30
40
50
60
70
∆ ε α ,
-
log τα(s) , -
low T region ∆ε
α = 3.59log τ
α+ 62.19
log τα,B
SCH = - 8.56 => τα,B
SCH = 2.7 x10⁻⁹s
IV
II+III PG
DS data(Schönhals 2001)
high-T region ∆ε
α = 11.66log τ
α+131
Figure 6 Schönhals’ plot for the primary α relaxation time, τα , for PG showing the change in the α relaxation strength at the characteristic DS (Schönhals) temperature, TB
SCH correlating with the characteristic PALS temperature TL
b2.
increasing macroscopic volume of the system is accompanied by a continuously increasing empty free volume and the still less cooperative α process characterized by the more intense cage reorganization. Both these aspects together result into a quasi-plateau feature in the PALS response above TL
b2 , where o-Ps seems to be formed and localized in the sufficiently long living dynamic free volume holes only.
2.2 FREE VOLUME INTERPRETATION OF THE O-PS RESPONSE USING SEMIEMPIRICAL MODELS
The o-Ps response can be transformed into free volume information by means of existing physically plausible models which address two basic aspects of free volume characterization of any disordered material, i.e., free volume hole size, Vh, and free volume hole fraction, fh .The former quantity is obtained using a standard quantum-mechanical model of o-Ps in a spherical hole which provides the following relationship between the o-Ps lifetime, τ3, and the free volume hole radius, Rh
19: 1
h
h
h
h0,33 sin
211
−
⎥⎦
⎤⎢⎣
⎡⎟⎟⎠
⎞⎜⎜⎝
⎛∆+
+∆+
−=RR
RRR
Rπ
ττ (1)

118
where τ3,0 is 0.5ns and ∆R is the thickness of electron layer about hole obtained as a calibration parameter from fitting the observed o-Ps lifetimes to known vacancy or free volume hole sizes in molecular crystals or zeolites. In fact, the form of free volume entities is not strictly spherical because of the non-spherical form of constituent’s particles so that the standard model is used usually in the sense of a volume equivalent spherical hole size Vh = (4π/3)Rh
3. Other geometrical forms of holes such as ellipsoid, cuboid and cylinder have been considered20. However, as it was recently shown some parameters derived from PALS such as the free volume fraction are not strongly influenced by the choice of the free volume hole geometry21. The mean free volume hole sizes in GL and PG at the above-mentioned characteristic temperatures are summarized in Table I. In the glassy state as well as in the supercooled liquid one below the second liquid PALS temperature, TL
b2 , the mean hole sizes represent a part of the van der Waals volume of the corresponding molecules, while above TL
b2 , the corresponding mean hole sizes overcome the own molecular size apparently in consistency with the low viscosity normal liquid character of the systems.
TABLE 1. The mean free volume hole characterization of GL and PG according to Eq.1 at the characteristic PALS temperatures.
System PALS
gT hV Wh VV L
b1T hV Wh VV L
b2T hV Wh VV
K Å - K Å - K Å - GL 189 20 0.23 241 47 0.54 290 105 1.2 PG 172 30 0.38 220 61 0.78 265 165 2.1
3. Extended free volume (EFV) model and its relationship to the free volume data from PALS
Some microscopic models based on free volume concept can be tested by using the above-mentioned free volume information. Here, we present an application of the extended free volume (EVF) model formulated by Cohen – Grest22. Briefly, this microscopic model of the liquid state accounts for a liquid as being formed by solid-like and liquid-like cells, only the latter ones contain a free volume. Using the percolation ideas, the specific mean free volume within the liquid-like clusters is given by the four-parameter equation:

FREE VOLUME FROM PALS AND MODELING 119
( ) ( )[ ]⎭⎬⎫
⎩⎨⎧ +−+−= 2
12CG0
CG0f 'C'A TTTTTv (2)
where A’= (vmlne/B), and B, C’ and T0CG are material – dependent coefficients;
here vm is the molecular volume and T0CG represents the temperature at which
percolated liquid cluster should occur.
0 50 100 150 200 250 3000
20
40
60
80
100
120
0 50 100 150 200 250 3000
20
40
60
80
100
120IV
III
II
I
Glycerol
Vh ,
A3
TLb2=290K
T0=249K
TLb1=241K
TgPALS=189K
Data: PALS+QM data 190-280KModel: EFV model χ2 = 2.64298R2 = 0.99694 A 1.17874 ±0.18173B=T0 249.42666 ±9.2479C 14.18715 ±0.82608
T , K
Figure 7 Application of the EFV model on the free volume data for glycerol.
Figure 7 shows the result of fitting Eq. 2 to the mean free volume hole sizes being identified with vf from the EFV model. As can be seen, the EFV model is able to describe the free volume hole data over the whole range of the equilibrated supercooled liquid from the high temperature limit at TL
b2 down to Tg
PALS. Interestingly, the characteristic temperature of the EVF model, T0CG, is
quite close to the first characteristic PALS temperature. In particular, for GL we find T0
CG(PALS) = 249±9K close to TLb = 241K and for PG T0
CG(PALS) = 237±7K not too distant from TL
b1 = 220K. According to the EFV model, this coincidence of the temperature parameters could be interpreted as the occurrence of the free volume percolation at around TL
b1 being responsible for the steeper slope in slightly supercooled liquid. However, the situation is not so simple as it will be discussed below.

120
160 180 200 220 240 260 280 300 320 340 360 380 400 420 440-12
-10
-8
-6
-4
-2
0
2
4
Glycerol
Data: DS dataModel: EFVmodel - dynamics χ2 = 0.0041R2 = 0.99962 A -13.29825 ±0.08562B 1150.91832 ±49.61164T
0CG 182.96187 ±4.00845
C 26.19047 ±1.29087
log
τ max
(s) ,
-
T , K
DS data Wang 2002
Figure 8. Application of the EFV model on the primary α relaxation data for glycerol
4. Atomistic modeling of free volume microstructure of supercooled liquids
The significance of free volume information, as obtained from the FVA of the o-Ps response can be evaluated by means of atomistic modeling. In general, this approach consists in a combination of the generation of disordered systems by using, e.g., molecular dynamics (MD) simulation followed by an appropriate free volume analysis of the generated microstructures. Here, we demonstrate such an atomistic modeling approach for both the model systems. The first step of modeling has been performed by detailed MD simulations by means of the ORAC program . The next step consists in sampling of the free space between the molecular bodies in the simulated microstructures by inserting the rigid probe of a given geometry and size and the volume integration of the inserted probes. In the case of our cavity analysis (CAVA) program , the o-Ps probe is modeled by the hard
23
24
sphere of diameter 1.06 Å and the molecular bodies, formed by atoms with van der Waals radii employed, represent the matrix particles. The CAVA code provides a set of the cavity parameters which can be compared with the free volume hole characteristics derived from the above-mentioned free volume analysis (FVA). The results of our MD plus CAVA investigations for GL are presented in Ref. 24 and for PG here. Figure 9 compares the calculated volume from our very

FREE VOLUME FROM PALS AND MODELING 121
extended MD simulations of GL and PG with the experimental macroscopic volume from dilatometry (DIL)9,10 in terms of the volume of simulation box containing the sufficient amount of molecules. In general, satisfactory agreement between both the macroscopic volume quantities can be found, especially at higher temperatures.
100 150 200 250 300 350 40030
32
34
36
38
40
Tg DIL
PG
GL
TgMD
V ,
103 A
3
T , K
Figure 9. The simulated (points) and experimental (lines) box volumes of 300 molecules for glycerol (GL) and propylene glycol (PG).
In particular, for GL the relative difference between the simulated volume data and the measured ones reaches 0.3 % at higher temperature regions and 1.4 % at lower ones. Evidently, the larger deviations for the lower temperature regions are connected with the effectively very high cooling rate in MD simulation25 and the associated easier onset of the glass transition phenomenon. The onset of deviations defines the simulated glass transition temperature, Tg
MD, which can be related to the experimental glass transition temperature, Tg, from dilatometry via fragility, mg, by the following Donth relation15:
c
DILgg
g
g
logφ∆
−−=
TTmT
(3)
where ∆log Φc is the difference between the simulated and experimental cooling rates. Table II summarizes the the dilatometric, Tg
DIL, the estimated, Tg, and the simulated, Tg
MD, glass transition temperatures for both the systems. Good agreement between the estimated and simulated values indicates that a linear approximation for cooling rate dependence of glass temperature is valid

122
even for the 14 orders of magnitude change in Φc , so that the simulated microstructures should correspond to the real physical ones as obtained with very rapid cooling.
TABLE 2. The experimental, Tg DIL, estimated, Tg* , and simulated, Tg
MD, glass temperatures for GL and PG according to Eq.3 for ∆ log Φc = 14. The mg values from Beiner, M. (2001) J.Non-Cryst.Solids 279,126.
System DIL
gT mg *gT DIL
gT K - K K GL 189 49 240 250 PG 172 48 220 230
The obtained static microstructures of GL and PG have been analysed by using the CAVA program24. On the basis of determination of the sizes and the number of the individual cavities Figure 10a and 10b show for the case of GL and PG a comparison between the mean free volume hole, Vh , from Eq. 1 and the mean cavity volume,Vcav, as calculated from the following equation26:
∑∑=cavmaxcav,
mincav,
icav,icav,cav
N
i
V
VNVV (4)
As can be seen, the mean cavity volumes are smaller than the mean free volume ones over the whole temperature range predominantly due to a large amount of he small cavities sampled by very small o-Ps probe (Vo-Ps = 0.64Å3). Having on mind that the simulated microstructures are the static ones while PALS is performed on the fluctuating matrix, we introduce within the framework of general length scale - frequency principle15 the dynamic aspect via a concept of the limiting cavity size.24 This is expressed by a set of curves for different Vcav,lim’s. As the result, a good agreement for the equilibrated liquid above TL
b1 between both the mean free volume quantities is achieved with Vcav,lim ≈ 20 -30Å3. The physical backround for this concept accounts for a possible blocking effect of some small scale mobility on a part of the total free volume distribution. Experimental support for this concept in terms of the secondary β relaxation has been reported for GL elsewhere16. In fact, from Figure 4 it follows that the time scale of the β process above 250K is shorter than the mean o-Ps lifetime so that a part of the free volume hole population is fluctuating too

FREE VOLUME FROM PALS AND MODELING 123
rapidly to be accessible for the o-Ps probe localization. The finding about the size of Vcav,lim is consistent with other estimations as obtained by other ways27.
150 200 250 300 350 4000
20
40
60
80
100
120
140
0
Vlim,A3
GL
TgPALS Tg
SIM Tb2L
30252015105
Vca
v and
Vh ,
A3
T , K
100 150 200 250 300 350 4000
20
40
60
80
100
120
140
160
180
200
100 150 200 250 300 350 4000
20
40
60
80
100
120
140
160
180
200
100 150 200 250 300 350 4000
20
40
60
80
100
120
140
160
180
200
100 150 200 250 300 350 4000
20
40
60
80
100
120
140
160
180
200
100 150 200 250 300 350 4000
20
40
60
80
100
120
140
160
180
200
100 150 200 250 300 350 4000
20
40
60
80
100
120
140
160
180
200
100 150 200 250 300 350 4000
20
40
60
80
100
120
140
160
180
200
PG
Vh a
nd V
cav ,
A3
T , K
2520151050
VWPG=78.5A3
TLb2TL
b1TgPALS
PALS + QM data
Figure 10. Mean cavity volumes, calculated from equation 4 for several cases of Vlim, together with the experimental mean hole volumes (points) from PALS for GL (a) and PG (b).
Figure 11 presents the integral volume distributions of all the cavities at several temperatures in PG. Two qualitatively different temperature regions can be distinguished. At lower temperatures below 260K, a continuously increasing integral distribution is observed which changes into a discontinuous bimodal one in the higher temperature region above 270K.The detailed visual inspection of the static cavity configurations reveals an increasing contribution of the larger cavities which results into the fully percolated cavities over the whole simulation box. This is evident from the temperature evolution of three-dimensional cavity microstructures in GL Figure 12. Interestingly, the the presence of percolated cavity phenomenon from our MD + CAVA approach in between 260 and 270K is commensurable with the characteristic PALS temperature of the onset of the plateau region at TL
b2 = 265K as well as with the characteristic DS temperatures TB
ST and TBSCH as mentioned above. Moreover,
the equality between τ3 ≡ τα at TLb2 ≅ TB’s is observed – Figure 2 – so that for T
< TLb2 the τ3 < τα relationship is valid, while for T > TL
b2 the τ3 > τα relationship is found. All these facts allow us to formulate a concept of the dynamic free volume facility, i.e., the presence of the static fully percolated cavity volume facilitates for a qualitative change in the primary α relaxation. Thus, according to our proposal, the crossover effects in PALS and DS data result from the mutual interplay between the increasing empty free space between particles with the progressively increasing appearance of percolating cavities and the associated intense cooperative rearrangements of particle constituents of the matrix.

124
0 500 1000 1500 2000 2500 3000 3500 4000 4500 50000.0
0.2
0.4
0.6
0.8
1.0
PG 310
350
330
270300
≤ 250
I cav ,
-
Vcav , A3
Figure 11. Integral cavity distribution in PG for a series of temperatures exhibiting the change to the bimodal cavity distribution in between 250K and 270K coinciding with TL
b2.
5. Crossover phenomenon from a viewpoint of the present microscopic models and atomistic modeling
Finally, it is of interest to compare the explanations of the crossover phenomenon in the primary α relaxation properties at TB proposed so far with the results of our atomistic modeling studies on GL and PG. Several interpretations of this important aspect of the supercooled liquid dynamics in terms of various microscopic models have been offered in the literature. They are based either on a coincidence between the crossover temperature, TB, and a
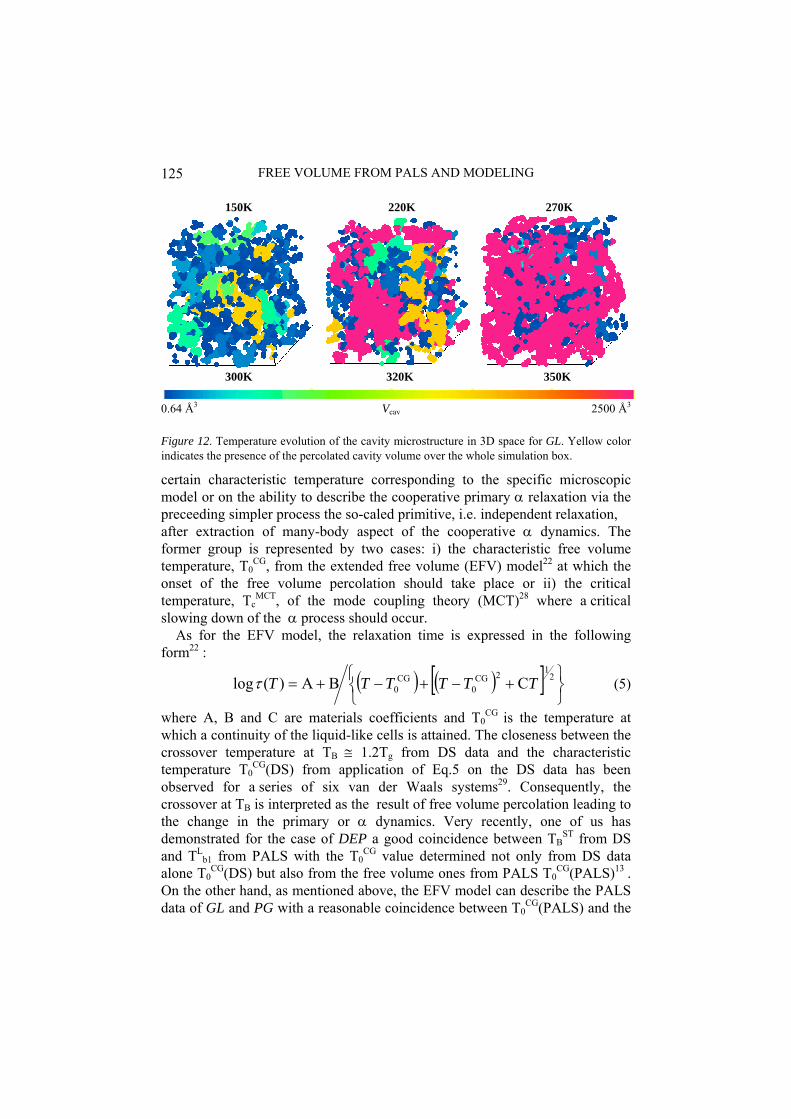
FREE VOLUME FROM PALS AND MODELING 125
150K 220K 270K
350K
0.64 Å3 2500 Å3
Figure 12. Temperature evolution of th GL. Yellow color indicates the presence of the perc ole simulation box.
certain characteristic temperature corresponding the specific microscopic model or on the ability to mary α relaxation via the preceeding simple dependent relaxation,
dy aspect of the cooperative α dynamics. The former group is represented by two cases: i) the characteristic free volume temperature, T0
CG, from the extended free volume (EFV) model22 at which the onset of the free volume percolation should take place or ii) the critical temperature, Tc
MCT, of the mode coupling theory (MCT)28 where a critical slowing down of the α process should occur. As for the EFV model, the relaxation time is expressed in the following form22 :
300K 320K
Vcav
e cavity microstructure in 3D space for olated cavity volume over the wh
todescribe the cooperative pri
r process the so-caled primitive, i.e. in-boafter extraction of many
( ) ( )[ ]⎭⎬ ⎫
⎩⎨⎧ +−+−= 2
12CG0
CG CBA)( TTTTTτ (5)
A, B and C are materials coefficients and T0CG is the tempera
a continuity of the liquid-like cells is attained. The closeness betwe
as been
0
+ 0Tlog
where hich
ture at en the w
crossover temperature at TB ≅ 1.2Tg from DS data and the characteristic temperature T0
CG(DS) from application of Eq.5 on the DS data hobserved for a series of six van der Waals systems29. Consequently, the crossover at TB is interpreted as the result of free volume percolation leading to the change in the primary or α dynamics. Very recently, one of us has
STdemonstrated for the case of DEP a good coincidence between TB from DS and TL
b1 from PALS with the T0CG value determined not only from DS data
alone T0CG(DS) but also from the free volume ones from PALS T0
CG(PALS)13 . On the other hand, as mentioned above, the EFV model can describe the PALS data of GL and PG with a reasonable coincidence between T CG(PALS) and the

126
first bend temperature TLb1, but not between T0
CG(PALS) and the second characteristic PALS temperature TL
b2 ≅ TB as indicated by atomistic modeling.
count for both the free volume and the relaxation data simultaneously, with the same T0
CG(PALS) = T0CG(DS) parameter as predicted by the EFV
mo act, the T0CG(DS) values for GL (Figure 8) and PG (not shown) are
178.5±7K or 162±6K, being close to the respective T ’s, are not consistent with
the evidencies that the primitive process
Moreover, for our hydrogen-bonded liquids GL and PG Eqs.2 and 5 are not able to ac
del22. In fg
the above-mentioned T0CG(PALS) ones: 249±9K and 237±7K, respectively.
Thus, the unability to describe both PALS and DS data simultaneously as well as the discrepancy with the results of atomistic modeling allow us to conclude that the EFV model appears to be irrelevant for strongly hydrogen-bonded glass-forming liquids such as GL and PG, at least. On the other hand, the validity of the EFV model for slightly hydrogen-bonded and van der Waals‘ systems remains to be further tested. Regarding the interpretation within the mode coupling theory (I-MCT), althought TB ≈ Tc is often observed30,31, the predicted divergency of the α relaxation time is not actually observed so that the ideal version of MCT needs some modification. The extended mode coupling theory (E-MCT) when applied on a few van der Waals systems such as ortho-terphenyl, gives Tc(I-MCT) ≅ Tc(E-MCT)32 so that TB ≈ Tc(I-MCT) should imply an onset of the thermally activated dynamics.Very recent I-MCT analysis of GL provided Tc=288K31 in agreement with the above-mentioned coincidence: TB
ST≅TBSCH≅TL
b2 as well as close to the onset temperature of the percolated free volume from our MD and CAVA approach. Unfortunately, the E-MCT has not been applied so far on our more complicated hydrogen-bonded model systems so that the range of its validity remains unknown. Finally, the latter class is represented by the coupling model (CM) of Ngai et al.33. For a series of five van der Waals liquids, the crossover at TB
ST is explained in terms of the large change in the heterogeneous character of the primary dynamics via the change in the strength of the intermolecular cooperativity on the preceeding primitive relaxation process from strongly cooperative process below TB to less cooperative one at higher temperatures34. In the last years, a growing amount ofmay be identified with the secondary Johari-Goldstein β process has appeared35,36.The original set of the five compounds does not include strongly intermolecularly hydrogen-bonded systems34. In the case of GL, the closeness of the β relaxation time, τβ, as obtained from a deconvolution of the DS spectra, with the primitive relaxation time, τ0 , calculated from the primary α relaxation time, τα, via τ0 = tc
n.τα1-n, where n is a measure of cooperativity connected with
the Kohlrausch-Williams-Watts (KWW) exponent, βKWW, by relation n = 1- βKWW as well as the mutual merging of α and β processes at around 300K,

FREE VOLUME FROM PALS AND MODELING 127
close to TLb2 = 290K,37 seem to suggest some important change in the
microstructure of the GL matrix, which may change the character of the α dynamics. This quasi-microscopic CM explanation together with the fact of the equality of the α relaxation time, τα , and the mean o-Ps lifetime, τ3 , appears to
w Jee Ortho-Positronium
Probe from Positron Annihilation Lifetime Spectroscopy and its Relationships to the Dynamics of Glass-Forming Systems in ARW NATO Series:
Nonlinear Dielectric Phenomena in Complex Liquids,Kluwer, Acad.Publ.,
. Bartoš,J., Šauša,O., Bandžuch,P., Zrubcová,J., Krištiak,J. (2002) J.Non-Cryst.Solids 417.
9. ovacs, A. (1963) Adv. Polym.Sci. 3, 394.
be qualitatively consistent with our MD and CAVA results. Thus, the onset of the fully percolated static free volume in the MD microstructures close to TL
b2 might imply some significant influence on the character of the cooperative α dynamics. As mentioned above, one possibility may be that the transition to the percolated free volume facilitates the crossover from a strongly cooperative mobility below TB
ST to a slightly cooperative one above TBST together with a
full diminishing the more local β process just above TBST.
Acknowledgment The authors would like to express their thanks to the VEGA Agency, Slovakia for the financial support by grants 2/3026/23 (JB) and 2/4103/24 (JK) as well as the APVT Agency,Slovakia for grant APVT 51-045302 (JK&JB). References
1. Brandt, W., Dupasquier, A. eds.(1983) Positron Solid State Physics, North-Holland, Amsterdam. 2. Jean, Y.C. (1995) Characterizing Free Volume and Holes in Polymers by Positron
Annihilation Spectroscopy in Dupasquer, A. (ed) Positron Spectroscopy of Solids, IOS, Ohmsha,
Amsterdam , pp. 563. 3. Bartoš,J. (2000) Positron Annihilation Spectroscopy of Polymers and Rubbers in
R.A.Meyers (ed) Encyclopedia of Analytical Chemistry, Wiley & Sons, Chichester pp.7968.
4. Jean, Y.C., Mallon, P.E., Schrader, D.M. (eds) (2003) Principles and Applications of Positron & Positronium Chemistry, World Scientific Publ., Ne rsey.
. Bartoš, J., Šauša,O., Krištiak,J.Annihilation Response of th5
Free Volume and
Dordrecht, The Netherlands, 2004 p. 289. 6. Bartoš, J., Šauša,O., Krištiak,J., Blochowicz,T., Rössler, E. (2001) J.Phys.- Cond.
Matter 13, 11473. 7. Šauša,O.,Bartoš, J., Krištiak,J. to be published 8
307 - 310, K
10. Parks,G.S., Huffman,H.M. (1927) J.Phys. Chem. 1842.

128
11. Angell, C.A. (1985) Strong and fragile liquids in Ngai,K., Wright(eds) Relaxations in Complex Systems, NTIS, Springfield, p.1. Leon,C., Ngai,K12. ., Roland,C.M. (1999) J. Chem. Phys. 110, 11585.
uša, O., Krištiak, J., Paluch, M. (2005) submitted
15. 16. ., Šauša,O., Račko,D., Krištiak, Fontanella,J.J. (2005) J.Non-Cryst.Solids
17.
19.
, G Acta Phys. Polonica A 95,557; Olson, B.G., Prodpran,T.,
43, 6775.
22. est;G.S. (1979) Phys. Rev. B20, 1077; Grest, G. S., Cohen, M. H. en,M.H. (1981) Adv. Chem. Phys. 48,
24. Califano, S. 920050 Eur. Phys. J.E 32,
ger, F. H. (1998)
cules 28, 6100; Yu,Z. 1995 Ph.D. thesis, Case Western Reserve
. 55, 241.
30. 31.
4.
33. ) (1997) Supercooled
posium Series, Vol.676
34. 35. K. L., Paluch, M. (2004) J. Chem. Phys. 120, 857.
) J. Chem. Phys. 115, 1405.
13. Pawlus, S., Bartoš, J., Ša14. Lunkenheimer,P., Loidl,A. (2002) Chem.Phys. 284, 205.
Donth, E., The Glass Transition, Springer, Berlin, 2001 Bartoš, J351,2599. Stickel , F.J. Ph.D.Thesis, Shaker-Verlag, Aachen 1995.
18. Schönhals, A. (2001) Europhys.Letts.56, 815. Tao,J. (1972) J. Chem. Phys. 56, 5499; Eldrup,M. Lightbody, D., Sherwood,J.N.(1981) Chem. Phys.63,51; Nakanishi,H., Wang, S. J., Jean,Y. C. (1988) in S. C.Sharma (ed), Positron Annihilation Studies of Fluids, World Science, Singapore , p. 292.
20. Jean,Y.C., Shi,H. (1994) J. Non-Cryst. Solids 172, 806; Jasinska,B., Koziol, A.E.oworek,B. (1999)
Jamieson, A. M., Nazarenko, S. (2002) Polymer 21. Consolati, G. (2002) J. Chem. Phys. 117, 7279.
Cohen,M.H., Gr(1980) Phys.Rev. B21, 4113; Grest,G.S. Coh455.
23. Procacci, P.,Darden, T. A., Paci, E., Marchi, M.(1996) J. Phys Chem. 100,10464. Račko, D., Chelli, R., Bartoš, J., Cardini, G.,289.
25. Angell, C. A.,Wang ,L. M. (2003) Biophys. Chem. 105, 621. 26. Sastry,S., Truskett, T. M., Debenedetti, P. G., Torquato, S., Stillin
Mol. Phys. 95, 289. 27. McCullagh,C.M.,Yu,Z., Jamiesson,A.M.,Blackwell,J.McGervey,J.D. (1995)
MacromoleUniversity, Cleveland, OH.
28. Götze,W., Sjörgen, L. (1992) Rep. Progr. Phys29. Paluch, M., Casalini, R., Roland, C. M. (2003) Phys.Rev. E67, 021508.
Novikov, V.N.,Sokolov, A.P (2003) Phys. Rev E67, 031507. Adichtchev, S., Blochowicz, T. Tschirwitz, Ch., Novikov, V. N., Rössler, E. A. (2003) Phys. Rev. E68, 01150
32. Götze, W.(1999) J. Phys.-Cond. Matt. 11, A1. Ngai, L.K (1979) Comment Solid State Physics 9,127; Ngai, K.L., Rendell, R.W. in Fourkas, J.T,Kivelson,D.,Mohanty,U.,Nelson,K.(edsLiquids. Advances and Novel Applications, ACS SymAmer.Chem.Soc. Washington, DC p.45. Casalini, R. Ngai, K. L., Roland, C. M. (2003) Phys. Rev. B68 014201.
Ngai,36. Ngai, K. L. (2005) J. Non-Cryst. Solids 351, 2635. 37. Ngai. K. L. , Lunkenheimer P. , Leon C., Scheneider U., Brand, R., Loidl, A,
(2001