Embed Size (px)
Citation preview
Soft Information Matters: Voluntary Corporate Disclosure Tone
and Financial Distress*
Yousry Ahmed† Bin Xu‡
Preliminary Draft
Abstract
The assessment of corporate financial distress risk often relies on hard information (i.e.
accounting numbers), while soft information (i.e. accounting narratives) is often neglected. We
investigate whether disclosure tone of the voluntary (highly discretionary) disclosures in the
unstructured UK annual reports can predict financial distress, and find that more positive tone is
associated with lower bankruptcy risk. This predictability is stronger for firms whose managers
have lower incentive to mislead investors due to better board monitoring, stringent stock market
regulation (in LSE main market), the IFRS adoption, and Big 4 audits. We find complementary
evidence that higher tone is associated with higher future performance and earnings persistence,
and lower performance volatility. Further, firms with higher tone are less likely to substantially
cut dividend or employment, or increase trade payable, and are less likely to receive qualified
(unfavorable) audit opinions. Overall, all evidence suggests that corporate disclosures provide
credible soft information for assessing firm financial health.
Keywords: voluntary corporate disclosure, linguistic tone, bankruptcy risk, financial distress,
tone management
* This draft: July 2019. We thank Jie Chen, Francesco Vallascas and Steven Young for valuable discussions and comments. The financial support from Leeds University Business School is gratefully acknowledged. † Lecturer in Accounting & Finance, Newcastle University, UK, [email protected]
‡ Lecturer in Banking & Finance, University of Leeds, UK, [email protected]
1
1. Introduction
The extant literature on the prediction of corporate bankruptcy tends to rely on hard
information, especially accounting numbers. 1 Accounting narrative disclosures, which could
contain value-relevant incremental information, are however often neglected by academics and
practitioners. In a survey paper, Loughran and McDonald (2016, p. 1188) pose an important
question of whether “textual artifacts provide an additional attribute that predicts bankruptcies”.2
In practice, JPMorgan, a $1.7 trillion hedge fund, has invested in a system that can detect positive
and negative tone of corporate transcripts in order to issue worrying signals to its managers
(Wigglesworth, 2018). Given the growing interest in the information content of corporate
narrative disclosures, this study aims to investigate whether the soft information, embedded in
the voluntary (highly discretionary) narratives in firm annual reports, matters for assessing firm
financial solvency.
The existing literature on annual report disclosures focuses predominantly on mandatory
and highly regulated and structured disclosures (e.g., the US 10-K filings), while the information
content of highly discretionary disclosures is underresearched partly due to the difficulties in
extracting textual information from unstructured, mainly non-US, corporate filings (e.g., the UK
annual reports).3 In the first large-sample analysis of the disclosure attributes of unstructured
PDF annual reports of non-US firms in 42 countries, Lang and Stice-Lawrence (2015) document
that more transparent disclosure is associated with greater stock liquidity, institutional ownership,
and analyst following. Their analysis, however, is based on the entire annual report, ignoring the
1 There is a large literature on bankruptcy prediction using quantitative (hard) information (e.g., Beaver, 1966; Altman, 1968; Libby, 1975; Ohlson, 1980; Taffler, 1984; Shumway, 2001; Charitou et al., 2004; Campbell et al., 2008). Altman and Hotchkiss (2006, pp. 237-238) highlight the importance of qualitative information and argue that “almost all of the statistical credit scoring models … involve the combination of a set of quantifiable financial indicators of firm performance … mainly financial ratios and capital market values, one should not underestimate the importance of qualitative measures in the process”. 2 Similarly, in an earlier survey paper, Li (2010b, p. 159) also suggests that “whether the textual information … have predictive power in bankruptcy forecasting” is an important empirical question. 3 Similar to the Management Discussion and Analysis (MD&A) section in the US 10-K filing, the Directors’ Report in the UK annual report is also mandatory and regulated by the UK Company Act 2006. However, the Directors’ Report is explicitly excluded when constructing the tone measures used in this study. Thus, our main focus is on the discretionary annual report narratives.
2
fact that the disclosure attributes in various sections of the annual report can be heterogeneous.
This could be largely because it is particularly challenging to extract various narrative sections of
a large sample of unstructured and brochure-style PDF annual reports. We contribute to the
literature on the information content of highly discretionary and unstructured disclosures by
investigating whether the narrative disclosures in various sections of the UK annual reports can
predict financial distress.4 Specifically, we examine the predictive ability of net positive tone5 of
not only the entire annual report but also some of the key individual narrative sections (namely,
Chairman’s Statement, Performance Section, and Business Review Section).
The extent to which corporate disclosure can predict financial distress largely depends on
managerial incentives. Managers can use disclosures to either inform or intentionally misinform
investors (Healy and Palepu, 2001; Merkl-Davies and Brennan, 2007; Huang et al., 2014).
Arguably, the narratives in the UK annual reports, in particular, could include incremental
information indicating firm future performance and financial health. In contrast, if the managers
use these narratives to strategically manipulate outsiders’ impression about firm future prospects,
the information embedded in the narratives would be misleading and noisy indicators of future
performance. The existing literature is inconclusive as to whether disclosure tone reduces
information asymmetry or is inflated to manage impression.6 Therefore, the extent to which
corporate disclosure tone can predict firm bankruptcy is an important empirical question, and
this predictability also depends on managerial incentive to engage in impression management,
both of which will be investigated in this study.
4 Thanks to the recent software of textual analysis of unstructured corporate documents developed by El-Haj et al. (2017) that enables researchers to examine and compare the information content of various narrative sections of the UK annual reports. 5 Following Huang et al. (2014) and Henry and Leone (2016), net positive tone is measured as the difference between frequencies of positive and negative words divided by the total number of positive and negative words. 6 It is well documented that tone reduces information asymmetry (Lang and Lundholm, 2000; Kothari, Li and Short, 2009; Davis, Piger, and Sedor, 2012), while it is also observed that tone is used to manage investors’ impression (Davis and Tama-Sweet, 2012; Huang et al., 2014). We provide an overview of these studies in Section 2.1.
3
The UK market provides a perfect setting to empirically examine whether firms use
corporate disclosure tone to release credible incremental information or constitute impression
management about future performance. The information content of the disclosures of UK firms
could be affected by the unique regulatory environment. UK company and securities laws allow
much greater discretion of the content and format of firms’ annual report than the US Securities
and Exchange Commission (SEC) rules (Clatworthy and Jones, 2003; Athanasakou et al., 2019).
Specifically, there is an absence of the prescriptive template for the narrative component of the
UK annual report in these laws, while the US firms must follow a standardized annual report
template (Athanasakou et al., 2019). Consequently, there is substantial heterogeneity in the
content and structure of UK annual report narratives across firms (Financial Reporting Council,
2012). UK firms are also exposed to less shareholder litigation risk than their US counterparts
(Seetharaman et al., 2002), meaning that the UK firms might be more likely to engage in
impression management. Moreover, the amount of textual information in the UK annual report
has increased substantially. The average length of all the narrative components of annual reports
increases from 9,546 to 18,915 words over 2003-2014.7
Our sample consists of around 1,400 UK listed non-financial firms and 6,900
observations over 2003-2014. To empirically examine whether disclosure tone can predict firm
financial distress, we use a wide range of direct and indirect measures of financial distress risk as
dependent variables. The dependent variable in our baseline analysis is the actual corporate
bankruptcy, a dummy variable that takes the value of one if a firm goes bankrupt, as reported in
the London Share Price Database (LSPD), in the next fiscal year, and zero otherwise. The logit
regression results show that more positive tone is associated with a lower probability of
bankruptcy in the next one to three years. The tone of various narrative sections of the annual
reports, namely Chairman’s Statement, Performance Section, and Business Review Section, all
7 These figures are calculated based on information in the UK Annual Report Narrative Disclosure Scores dataset with 1,887 firms and 8,979 annual reports over 2003-2014.
4
exhibit significant incremental predictive power over an extensive list of firm fundamentals.
These results suggest that firms which convey more positive tone in their annual reports are less
likely to be financially distressed.
We then conduct cross-sectional analyses to compare the predictive power of tone across
subsamples of firms with high vs. low managerial incentives to engage in impression
management. The idea is that managerial impression management incentives are heterogeneous,
and could be driven by a range of internal and external factors (e.g., board monitoring, stock
market regulation, accounting standards, external audit quality). These factors can, therefore,
moderate the predictive ability of tone. We find that tone can better predict bankruptcy for firms
with more independent board of directors, listed in the Main Market relative to the Alternative
Investment Market (AIM), adopting IFRS, and audited by the Big 4 audit firms.8 These results
are consistent with the argument that the predictive power of tone is stronger for firms whose
managers have lower incentive to intentionally mislead investors.
Our baseline results are highly robust to alternative dependent variables capturing the
probability of being financially distressed, as indicated by the Z-Score (Altman, 1968) and O-
Score (Ohlson, 1980) respectively. We find consistent evidence that firms with more positive
tone are significantly less likely to be in financial distress, and are thus much less likely to go
bankrupt in the near future. Moreover, the bankruptcy predictability of tone should be supported
by its association with firm future performance. We thus examine whether tone can predict
future firm future fundamentals, and find that higher tone is associated with higher future
performance and earnings persistence, and lower volatility of future stock returns and earnings.
Further, we investigate whether tone is associated with extreme corporate policies,
including dramatic dividend cut, reduction of employees, and the increase of trade payables.
8 This is because managerial impression management incentives tend to be weaker with more independent board (Armstrong et al., 2014), stronger stock market regulations (i.e. the main market relative to the AIM) (Gerakos et al., 2013), more effective accounting standards (i.e. IFRS relative to local standard) (Horton et al., 2013), and Big 4 audits (Francis and Wang, 2008; Guillamón-Saorín et al., 2016), which in turn enhance the predictive power of tone.
5
These corporate policy responses are likely to be triggered by financial distress, and thus can be
considered as indirect measures of financial distress. We find that firms with higher tone are less
likely to cut dividend or employment, or increase trade credit substantially. We also find that
firms with more positive tone are less likely to receive qualified audit opinions9, consistent with
the view that tone is considered as credible information by external auditors (Mayew et al., 2015).
Our results are highly robust to various direct and indirect measures of financial distress and the
inclusion of an extensive list of controls.
This study examines the predictive ability of the tone of highly discretionary, and largely
unregulated and unstructured narrative disclosures in UK firm annual reports, and contributes to
the literature in several ways. First, we contribute to the growing literature on the information
content of corporate disclosure tone. Our evidence suggests that the tone of the narrative
disclosures in the UK annual reports contains incremental information indicative of firm future
distress, especially when the managerial impression management incentives are low. Our study
complements Mayew et al. (2015) which focus on the predictive ability of the tone of the
mandatory, and heavily regulated and structured disclosures (i.e. the MD&A sections of the US
10-K filings). Importantly, we provide new evidence that the predictive ability of tone depends
on several internal and external factors that drive managerial impression management incentives
(i.e. board independence, Main Market vs. AIM listing, the IFRS, Big 4 audits).
We also add to the literature on the disclosure attributes of the unstructured annual
reports (e.g., Smith and Taffler, 2000; Lang and Stice-Lawrence, 2015), which often focuses on
the information content of a single section (e.g., Chairman’s Statement) or the annual report as a
whole. We provide important new evidence that the tone of main sections of the UK annual
reports are highly informative and move largely in the same vein as the aggregate tone of the
entire report. Specifically, we get consistent results using textual analysis of the Chairman’s
9 The qualified audit opinion often indicates that a firm’s financial statements are materially misstated.
6
Statement, Performance Section, Business Review Section and all verbal sections in the annual
report respectively.
Second, we contribute to the vast literature of bankruptcy prediction by suggesting that
not only accounting numbers but words matter: disclosure tone has significant incremental
predictive power over a wide range of quantitative firm fundamentals. This finding supports the
premises of Loughran and McDonald (2016) and Li (2010) that linguistic analysis of corporate
disclosures may be useful for bankruptcy prediction. Thus, bankruptcy prediction models should
incorporate text-based information derived from various narrative components of annual reports.
Overall, this study confirms the importance of “hardening (quantifying) soft information” 10
(Liberti and Petersen, 2018) in the highly discretionary and unstructured corporate disclosures in
predicting corporate financial distress.
The paper proceeds as follows. Section 2 reviews the corporate disclosure tone literature,
and develops the hypotheses. Section 3 describes the sample, key variables, empirical models,
and summary statistics. Section 4 presents the baseline results on tone and bankruptcy risk, and
examines the cross-sectional heterogeneity in the predictive power of tone. Section 5 provides
complimentary evidence on tone and firm future performance. Section 6 performs further
analyses related to extreme corporate policies and audit opinion. Section 7 concludes.
2. Related Literature and Hypotheses
2.1 Prior Studies on Corporate Disclosure Tone
There is a growing literature in accounting and finance that focuses on the implications of the
linguistic tone (i.e. the use of positive and negative words) of various types of corporate
10 Liberti and Petersen (2018) discuss the role of soft information in finance and argue that “whether the ability to harden soft information is useful in predicting default models or explaining stock returns is an empirical question”.
7
disclosures (e.g., annual report/10-K filings, MD&A, earnings conference calls, earnings press
releases).11 There is increasing evidence to suggest that corporate disclosure tone is associated
with corporate decisions and outcomes. For example, disclosure tone has significant impacts on
the cost of capital and analyst forecasts (Kothari, Li and Short, 2009), and market pricing (e.g.,
Henry, 2008; Li, 2010a; Feldman et al., 2010; Davis, Piger and Sedor, 2012, Huang et al., 2014). In
addition, disclosure tone is also related to earnings quality (Li, 2010a), financial misreporting
(Larcker and Zakolyukina, 2012), and shareholder litigation (Rogers, Buskirk and Zechman,
2011). The existing literature thus indicates that corporate disclosure tone has important
implications for firm future performance. However, limited attention has been paid to the
information content of the tone of unstructured and high discretionary disclosures in corporate
annual reports, and its predictive value for corporate financial distress. This study fills this void
in the literature.
To study the relationship between tone and financial distress, alternative perspectives of
disclosure tone must be considered, and empirical predictions can then be made accordingly.
Healy and Palepu (2001, p. 420) posit that “managers trade off between making accounting
decisions and disclosures to communicate their superior knowledge of firm’s performance to
investors, and to manage reported performance for contracting, political or corporate
governance reasons”. Specifically, if disclosure tone contains incremental soft information, which
is not captured by the firm accounting numbers, a more positive tone reduces information
asymmetry and indicates that the firm is less subject to financial distress risk. In contrast, if self-
interested managers have the incentive to manage outsiders’ impression by strategically
manipulating or inflating the tone, a more positive tone would not be closely related to firm
financial solvency. Put differently, disclosure tone could reflect manager’s private information
11 Previous studies focus on various types of textual information: MD&As in the 10-K (e.g., Li, 2010a; Feldman et al., 2010; Davies and Tama-Sweet, 2012; Huang, Teoh and Zhang, 2014), earnings press releases (e.g., Henry, 2008; Davis, Piger and Sedor, 2012; Huang, Teoh and Zhang, 2014; Henry and Leone, 2016; Hilary et al., 2016), and earnings conference calls (e.g., Price et al., 2012; Larcker and Zakolyukina, 2012; Davis et al., 2015).
8
about firm fundamentals or managerial impression management incentives, and thus disclosure
tone can either inform or misinform investors about firm future performance (Huang et al.,
2014). 12 Healy and Palepu (2001, p. 420) suggest that “management motives for making
voluntary disclosure and their credibility” are interesting empirical questions in the corporate
disclosure literature. In what follows, we briefly review the relevant literature on these two main
perspectives of tone and then develop our main hypotheses.
2.1.1 Incremental Information
Disclosure tone could contain incremental information which reduces the information
asymmetry between managers and the outside investors. In an early review of the corporate
disclosure literature, Healy and Palepu (2001, p. 420) point out that “even in an efficient capital
market, managers have superior information to outside investors on their firms’ expected future
performance”. Lang and Lundholm (2000) investigate corporate voluntary disclosure around the
seasoned equity offerings and the market reaction, and find that firms with a consistent level of
disclosure experience less negative abnormal returns at the announcement date. This evidence
suggests that voluntary disclosure reduces information cost associated with equity offerings.
Kothari, Li and Short (2009) provide further evidence that disclosures can mitigate information
asymmetry. They find that positive management disclosure is negatively associated with both the
cost of equity and return volatility. On the other hand, Tetlock et al. (2008) examine the
information content of firm-specific news stories, and document that negative words in the news
can predict firms’ earnings and stock returns. They find that negative words are associated with
lower firm future earnings and investors also incorporate negative tone into stock prices. Tetlock
et al. (2008, p. 1438) argue that “quantifying language provides novel information about firms’
earnings and returns”. This important conclusion could be generalized to the information
12 It is also likely that disclosure tone reflects managerial bias (e.g., optimism), in which case managers unintentionally misinform investors. Our empirical analyses control for managerial overconfidence in Section 6.3, and the results are robust.
9
content of corporate disclosures. Indeed, several studies (e.g., Li, 2010a; Feldman et al., 2010)
suggest that textual information in the MD&As can predict firm future performance.
Furthermore, Davis, Piger, and Sedor (2012) examine the information content of
earnings press release and market reactions. They argue that language in the earnings press
release is used by the managers to signal their expected future firm performance. Consistent with
this proposition, they find that optimistic language in earnings press releases is associated with
the significantly higher future return on assets, and also generates a positive market reaction.
These evidence supports the view that managers’ optimistic language conveys credible
information about expected future performance to the outside investors. To sum up, the
literature suggests that corporate disclosure tone can reduce information asymmetry and inform
investors about firm fundamentals, and thus predict firm future performance.
2.1.2 Impression Management
Disclosure tone could be driven by managerial impression management incentives (i.e.
managerial opportunism), and consequently misinform investors about firm future performance.
In the presence of agency conflicts between managers and investors, self-interested managers
have the incentive to engage in opportunistic disclosure choices and biased reporting, in order to
maximize their personal wealth (Merkl-Davies and Brennan, 2007; Huang et al., 2014). Huang et
al. (2014) provide comprehensive evidence that managers engage in tone management to
strategically and intentionally manage investors’ perception of firm performance. They define
tone management as “the choice of the tone level in the qualitative text that is incommensurate
with the concurrent quantitative information” (Huang et al., 2014, p. 1083). Tone management
can be considered as a specific form of impression management, and has been observed in
several empirical studies. Specifically, Huang et al. (2014) document that the tone of earnings
press releases becomes more positive when firms issue new equity or conduct mergers and
acquisitions, and more negative when granting stock options. These observed managers’
10
attempts to hype the stock before major corporate events reflect managerial incentive to
strategically manage the impression of outside investors.
Furthermore, Davis and Tama-Sweet (2012) examine the managers’ disclosure choices
across two alternative outlets (i.e. earnings press release vs. MD&A). Given that the market
usually processes the information in earnings press releases more efficiently than that in the 10-K
filings (e.g., Stice, 1991; Levi, 2008), and thus react more to the earnings press releases, managers
have the incentive to strategically manipulate the language especially in the earnings press
releases. Consistent with this conjecture, they document that managers do engage in strategic
reporting that the levels of optimistic (pessimistic) language are higher (lower) in earnings press
releases relative to MD&As. On the other hand, they find that the pessimistic language in the
MD&A is associated with lower future earnings, suggesting that the MD&A contains
incremental information to the language in the earnings press releases. These findings suggest
that whether corporate disclosures inform or misinform investors also partly depends on the
type of disclosures. Moreover, Allee and Deangelis (2015) find that managers deliberately change
tone dispersion (i.e. how positive and negative words are spread out in conference calls) to
manage the impression of investors.
Overall, the literature provides mixed evidence on the information content of corporate
disclosure tone, and seems to suggest that managers have both the incentive to provide credible
information and reduce information asymmetry, and the incentive to provide misleading
information and engage in impression management.
2.2 Hypotheses
As discussed in the previous section, the predictive power of tone largely depends on whether
tone contains incremental information or reflects impression management incentives. If, as
suggested by the prior studies (e.g., Lang and Lundholm, 2000; Kothari, Li and Short, 2009;
11
Davis, Piger, and Sedor, 2012), tone is used to inform investors and reduce information
asymmetry, more positive tone predicts lower financial distress. We thus form our first testable
hypothesis:
H1: More positive tone is associated with the lower probability of bankruptcy.
In contrast, there is also evidence to suggest that firms engage in tone management,
which reduces the informativeness of tone (e.g., Davis and Tama-Sweet, 2012; Huang et al.,
2014). If tone is driven by the managers’ incentive of impression management (i.e. hyping), tone
would be a noisy predictor of or even fail to predict financial distress. This particular incentive
problem with corporate disclosure has long been recognized. For example, Frost (1997) finds
that the voluntary disclosures made by managers of financially distressed UK firms are overly
optimistic, while the stock market discounts the positive disclosure tone of these firms.
In reality, both the incentive to reduce information asymmetry and the incentive to
manage impression could co-exist (Huang et al., 2014), and it is an empirical question as to which
incentive dominants. The disclosure tone of some firms may be more informative than that of
others, and thus the relationship between tone and financial distress, as described in H1, can be
heterogeneous across firms. Specifically, the stronger the managerial impression management
incentives, the weaker the ability of tone in predicting financial distress. We hypothesize that the
predictive power of tone depends on the extent to which tone is strategically inflated to
manipulate investors’ impression:
H2: The predictive power of tone is stronger for firms with lower managerial incentive to
engage in impression management.
12
3. Data, Variables, and Statistics
To test whether the tone of the UK corporate disclosure can predict financial distress, we first
obtain the UK Annual Report Narrative Disclosure Scores (including e.g., tone and length of
various narratives components of the annual report) developed in the Corporate Financial
Information Environment (CFIE) project.13 We then merge this disclosure scores data with the
firm financial and accounting data from the Worldscope and Datastream. We further merge the
date of death and death type information from the London Share Price Database (LSPD). We
keep firm-year observations with non-missing tone measures and several firm characteristics
including firm size, leverage, liquidity, profitability, market-to-book, dividend, cash, firm age, and
insider ownership. We also construct board independence measure and past M&As intensity
measure using the BoardEx and Thompson One Banker databases respectively. We winsorize all
continuous variables at the 1% and 99% levels to mitigate the influence of extreme values. The
final sample consists of 1,424 UK listed firms and around 6,900 observations over the period
2003-2014.
To examine the incremental information content of disclosure tone in predicting
bankruptcy, following previous studies (e.g., Mayew et al., 2015), we estimate a discrete-time logit
model using maximum-likelihood methods as follows:
Pr(𝐵𝑎𝑛𝑘𝑟𝑢𝑝𝑡𝑐𝑦𝑖𝑡+1) = 𝛼 + 𝛽𝑇𝑜𝑛𝑒𝑖𝑡 + Ω𝑿𝒊𝒕 + 𝑒𝑖𝑡 (1)
where, 𝐵𝑎𝑛𝑘𝑟𝑢𝑝𝑡𝑐𝑦𝑖𝑡 is the key dependent variable that takes the value of one if a firm goes
bankrupt, as reported in the LSPD database, in year t+1, and zero otherwise. Specifically, similar
to previous studies on the UK firm bankruptcy (e.g., Agarwal and Taffler, 2008), 𝐵𝑎𝑛𝑘𝑟𝑢𝑝𝑡𝑐𝑦𝑖𝑡
13 We greatly appreciate the CFIE project team for generously sharing the UK Annual Report Narrative Disclosure Scores dataset. See El-Haj et al. (2017) for more details on how the tone of various sections of UK annual reports are constructed.
13
takes the value of one if the LSPD death type is liquidation/voluntary liquidation, receiver
appointed, in administration/administrative receivership, or cancelled assumed valueless, and
zero otherwise.
We provide complimentary evidence by examining the relationship between tone and the
probability of being financial distressed. We use two accounting-based financial distress
indicators as alternative dependent variables, namely Z-Score_Distress and O-Score_Distress. Z-
Score_Distress is a dummy variable that is equal to 1 if the Altman (1968) Z-Score is below 1.81,
and zero otherwise. O-Score_Distress is a dummy variable that is equal to 1 if the Ohlson (1980)
O-Score is above 0.5, and zero otherwise. In the robustness tests, we use additional financial
distress measures based on the Piotroski’s (2000) financial strength measure (i.e. F-Score) and
the interest coverage (Asquith et al., 1994), respectively.
The main variable of interest is 𝑇𝑜𝑛𝑒𝑖𝑡. Following the prior literature (e.g., Huang et al.,
2014; Henry and Leone, 2016), the tone variable is constructed as the difference between the
numbers of positive and negative words divided by the total number of positive and negative
words.14 These word lists are developed by Loughran and McDonald (2011) specifically for the
analysis of corporate disclosures. The variety of narrative disclosures available in the UK annual
report allows us to examine the predictive power of the tone of various narratives components.
Our key tone measures are Tone_All, Tone_Chair, Tone_Perform, and Tone_Review. These tone
measures are constructed based on different parts or combinations of the narrative sections of
the annual report, including All Sections; Chairman’s Statement; Performance Section; and
Business Review Section, respectively.
We also use further lagged tone measures in year t-1 and t-2, respectively, to predict
corporate bankruptcy and financial distress in year t+1. If more positive tone is used by the firms
to inform investors and reduce information asymmetry, in which case tone is a genuine indicator
14 Similarly, Davis, Piger and Sedor (2012) use net tone as a measure of the net signal about managers’ expected future performance.
14
of firm future prospects, we would expect the coefficient on tone to be significantly positive. If,
however, tone is driven by managers’ incentive to manipulate investors’ impression, we would
not expect the tone to have a significant predictive power.
𝑿𝒊𝒕 is a vector of control variables. In the spirit of Loughran and McDonald (2014), we
control for disclosure length (Length) as a proxy for the complexity of the disclosure. Financially
distressed firms may make their narrative sections lengthier and more complex so that it would
be more difficult for investors to process the information. Length is the natural logarithm of the
number of words for certain annual report sections based on which the tone measure is
constructed. We also control for a wide range of firm characteristics, which might be associated
with financial distress. In addition to leverage, liquidity, and profitability that have been used as
controls in previous studies (Zmijewski, 1984; Shumway, 2001), we further control for firm size,
market-to-book, dividend, cash, firm age, and insider ownership.
In addition to the aforementioned baseline analysis on the relationship between tone and
financial distress risk, we also provide complementary evidence by replacing the bankruptcy and
financial distress measures in Equation (1) with a range of indirect indicators of financial
distress.15 Specifically, we examine the relationship between tone and future firm performance
and risk. Further, we investigate whether the tone is associated with several extreme corporate
policies, which are likely to be driven by financial distress, including dramatic dividend cut,
reduction of employees, and increase of trade payables. We also provide further evidence on the
relationship between tone and the probability of receiving qualified audit opinions, which
indicates whether auditors consider disclosure tone as credible information (Mayew et al., 2015).
Table 1 Panel A presents the summary statistics of the key dependent and independent
variables. The mean of Bankruptcy is 0.014. Among the tone measures, Tone_All has an average of
0.138 and a standard deviation of 0.152, while Tone_CEO and Tone_Chair have relatively higher
15 Some indirect measures (e.g., delisting, dividend, ROA, loan loss provisions) are used to gauge financial distress in Gandhi, Loughran and McDonald’s (2018) study on annual report (i.e. 10-K forms) sentiment and the financial distress of US banks.
15
averages (0.401 and 0.374) and Tone_Chair has the highest standard deviation (0.217). The
averages of firm size and firm age are 11.098 and 2.915 respectively, suggesting that our sample
is reasonably representative of UK listed firms.
Table 1 Panel B presents the correlations among the financial distress and tone measures.
The correlations between Bankruptcy and several financial distress indicators (e.g., Z_Score_Distress,
O_Score_Distress, Int_Cov_Distress1) are around 0.1, suggesting that these accounting number-
based distress measures are far from perfect, and the tone measures are likely to have
incremental predictive power. The correlations among four tone measures are high, ranging from
0.64 to 0.92. The correlations between Tone_Chair and other tone measures (Tone_Perform,
Tone_Review) are relatively low (around 0.65), indicating that the Chairman’s Statements may
contain some distinctive information content. The correlations between all the tone measures
and the bankruptcy and financial distress measures are negative. Tone_Chair has the most
significant negative correlations with all the financial distress. The correlation analysis above
suggests that tone is negatively associated with the financial distress.
[Insert Table 1 here]
Table 2 shows how tone varies across firms and over time. One would expect a decent
predictor of financial distress to be reasonably time-varying. To explore the time-series variations
of tone, we present three-year transition matrices of our four tone measures, Tone_All,
Tone_Chair, Tone_Perform, and Tone_Review, in Panels A-D respectively. We construct three-year
transition probabilities of these tone measures based on non-overlapping time periods. The rows
represent the initial tone quartiles of a firm. The columns represent the tone quartiles of the firm
three years later. To construct the transition matrix, we divide the sample into non-overlapping
three-year intervals and then assign firm-years to quartiles in each interval, and this matrix
indicates how tone changes from one interval to the next. Specifically, take Tone_All (Panel A) as
an example, a firm in the lowest tone quartile in the current year has a probability of 52.4%
16
remaining in the same quartile in the next three-year period, and a probability of 26%, 14.8%,
and 6.8% moving to the second-lowest, second-highest, and highest quartiles, respectively, in the
next three-year period. Among the four tone measures, Tone_Chair (Panel B) is the most time-
varying, with a probability of only 37.9% remaining in the same quartile in the next three-year
period.16
[Insert Table 2 here]
4. Disclosure Tone and Financial Distress Risk
4.1 Disclosure Tone and Bankruptcy Prediction
Table 3 presents our baseline regression results on the ability of the tone of various narrative
sections of the annual reports in predicting bankruptcy. The dependent variable is Bankruptcyt+1, a
dummy variable that takes the value of one if a firm’s death type is liquidation, voluntary
liquidation, receiver appointed/liquidation, in administration/administrative receivership, or
cancelled assumed valueless in the LSPD database in the next fiscal year. We run standard logit
regression, controlling for both year and industry fixed effects. In Column (1), the main
independent variable of interest is Tone_All which captures the sentiment of all the narrative
sections in the UK annual reports. The coefficient on Tone_All is negative and statistically
significant at 1% level. This finding is consistent with H1 that more positive tone indicates a
lower probability of bankruptcy.
To better understand the economic magnitude of the impact of Tone_All on the
likelihood of bankruptcy, we replace the tone variables with four tone dummies that takes the
value of one if Tone_All, Tone_Chair, Tone_Perform, and Tone_Review respectively is in the top
16 In untabulated results, we decompose the standard deviation (SD) of the tone into between-firm and within-firm SDs, respectively. The between-firm SD of the Tone_All is 0.14, and within-firm SD is slightly lower (0.09). The SDs of the tone of individual narrative components are relatively larger, with the between-firm SDs ranging from 0.16 to 0.18, and the within-firm SDs ranging from 0.11 to 0.15. The variations of the Tone_Chair is the highest both across firms and over time.
17
quartile and zero otherwise, and then re-estimate the models in Columns (1)-(4). In untabulated
results, we estimate the average marginal effects of these four tone dummies, and find that firms
with top-quartile Tone_All, Tone_Chair, Tone_Perform, and Tone_Review, respectively, are 0.89, 2.65,
1.30, and 1.98 percentage points less likely to go bankrupt.
In Columns (2)-(4), we use alternative tone measures that are constructed based on a
particular narrative component of the annual reports, namely Tone_Chair, Tone_Perform, and
Tone_Review, respectively. The coefficients on these four tone measures are negative and
statistically significant at 1% level, among which Tone_Chair has the highest statistical and
economic significance partly because Tone_Chair is more time-varying than other tone indices. To
compare the predictive ability of these models, we use the Receiver Operating Characteristic
(ROC) (see, e.g., Kim and Skinner, 2012) curve, the area under which measures a model’s ability
to discriminate. The area under the corresponding ROC curve (AUC) of the logit models in
Columns (1)-(4) ranges from 0.849 to 0.860, suggesting excellent predictive and discriminatory
ability of these models.17
In Columns (5)-(6) the dependent variables are Bankruptcyt+2 and Bankruptcyt+3, indicating
whether a firm goes bankrupt in year t+2 and t+3 respectively. We find that Tone_All still has
significant predictive power at 5% level. In untabulated results, we re-estimate the regression in
Column (1) using the penalized maximum likelihood regression proposed by Firth (1993)
(henceforth firthlogit),18 and find that the tone measures remains significant. To conclude, both
the logit and firthlogit regressions show that our tone measures, one, two, or three years prior to
bankruptcy, have significant incremental explanatory power for predicting future bankruptcy.19
[Insert Table 3 here]
17 AUC of between 0.7 and 0.8 indicates acceptable predictive ability, and AUC above 0.8 indicates the model’s excellent ability to predict bankruptcy (see footnote 27 in Kim and Skinner (2012)). 18 The firthlogit estimator (Firth, 1993) can reduce bias, associated with the low prevalence of the outcome variable (i.e. bankruptcy), in maximum likelihood estimation. 19 In Appendix Table 1, we control for the widely used accounting number-based measures of bankruptcy risk, namely Z-score or O-score, and find that tone still has highly significant incremental explanatory power.
18
4.2 Cross-sectional Heterogeneity in the Predictive Power of Tone
Table 4 investigates the cross-sectional heterogeneity in the explanatory power of tone for
predicting bankruptcy. The predictive ability of tone would be stronger if managerial impression
management incentive is lower, in which case tone is less likely to be inflated to mislead investors
and thus more informative. Prior literature suggests that a better firm information environment
can reduce impression management. For example, Osma and Guillamón-Saorín (2011) argue
that firms with higher market capitalization and analyst coverage tend to face a higher demand
for transparent information, which in turn enhances the disclosure quality. Consistent with this
argument, they empirically show that several measures of firm information environment (e.g.,
size, analyst coverage) are negatively associated with impression management. Given the negative
association between information environment and impression management, the predictive ability
of tone might depend on factors affecting firm information environment.
Empirically, we examine the moderating effects of four such factors, namely board
independence, AIM listing, the IFRS adoption, and Big 4 audits, on the predictive ability of tone.
First, we compare the predictive power of the tone of firms with high and low board
independence. It is well documented that independent directors can improve the quality of
financial reporting (e.g., Ferreira et al., 2011; Ahmed and Duellman, 2007). Osma and Guillamón-
Saorín (2011) show that higher board independence is negatively associated with impression
management that is partly captured by disclosure tone. Armstrong et al. (2014) provide causal
evidence that firms facing an exogenous increase in board independence enhance corporate
transparency to meet the informational demands of independent directors. They document that
higher board independence increases analyst coverage and the frequency and precision of
management forecasts, which in turn improves the firm information environment.
Second, we compare the predictive power of the tone of firms listed in the AIM and the
LSE main market. Gerakos et al. (2013, p. 190) find that the post-listing performance of the AIM
firms is worse than that of the counterparts on traditionally regulated exchanges, which is
19
attributed to the fact that “explicit listing, regulatory, and disclosure requirements on the AIM
are limited relative to other major markets”. In addition, Nielsson (2013, p. 335) argues that “the
AIM market attracts small firm that – due to size – face disproportional regulatory costs”. Thus,
due to the lower regulatory and disclosure requirements on firms listed in the AIM, the
information environment of AIM firms tend to be inferior.
Third, we compare the predictive power of the tone of firms adopting IFRS and local
standard respectively. The adoption of IFRS can improve firms’ information environment.
Horton et al. (2013) document that the consensus forecast errors decrease after the adoption of
IFRS, suggesting that IFRS improves firms’ information environment. In addition, Lang and
Stice-Lawrence (2015) provide causal evidence that the adoption of IFRS improves the quality of
annual reports by increasing the amount of disclosures and reducing repetitive disclosures.
Fourth, we compare the predictive power of the tone of firms with Big 4 vs. non-Big 4
auditors. Previous studies show that Big 4 audits reduce earnings management (e.g., Becker et al.,
1998; Francis and Wang, 2008). It has also been recognized that earnings management and
impression management are positively associated, suggesting that firms tend to engage in the
manipulation of both accounting numbers and narratives to jointly influence outsiders’
perception (Guillamón-Saorín et al., 2016). It is plausible that if earnings management is
restrained by Big 4 audits then impression management is also less likely to be triggered. These
evidence thus suggests that Big 4 audits may improve the quality of firm information disclosures
and information environment.
Taken together, all the aforementioned four factors, namely board independence, AIM
listing, IFRS, and Big 4 audits, are associated with firm information environment. Recall that
better information environment could potentially reduce managerial impression management
(e.g., Osma and Guillamón-Saorín, 2011), we, therefore, expect the predictive power of tone to
be stronger for firms with more independent boards, weaker for firms in the AIM (relative to the
main market firms), stronger for firms following IFRS, and stronger for firms with Big 4 auditors.
20
As expected, Table 4 shows that the predictive ability of all our tone measures is stronger (except
Columns (5)-(6) Panel D) for firms with higher (above-median) board independence, listed in the
main market, following IFRS, and audited by Big 4 audit firms. These findings are consistent
with the argument that tone becomes more informative and thus more indicative of future
bankruptcy especially when the firms’ information environment is better and managerial
impression management incentives are weaker, supporting H2.
[Insert Table 4 here]
4.3 Disclosure Tone and Financial Distress
To provide further evidence on the relationship between tone and financial distress risk, Table 5
examines whether the more positive tone is associated with a lower probability of being
financially distressed. The dependent variable is Z-Score_Distresst+1 in Columns (1)-(5), a dummy
variable that takes the value of one if Altman (1968) Z-Score is below 1.81, and zero otherwise.
The dependent variable is O-Score_Distresst+1 in Columns (6)-(10), a dummy variable that takes the
value of one if Ohlson (1980) O-Score is above 0.5, and zero otherwise. The independent
variables are Tone_All in Columns (1) and (6), Tone_Chair in Columns (2) and (7), Tone_Perform in
Columns (3) and (8), and Tone_Review in Columns (4) and (9). We run the standard logit
regressions in all columns, with the same control variables as those in Table 3. We find that all
the tone measures have statistically significant negative impacts on Z-Score_Distresst+1 at 1% level
in Columns (1)-(5). In addition, Tone_All, Tone_Chair, and Tone_Perform also have significant
negative impacts on O-Score_Distresst+1 at 1% or 10% level in Columns (6)-(8). These results are
also consistent with the baseline results in Table 3 and further support our H1, and suggest that a
firm’s more positive tone indicates that the firm is less likely to go bankrupt in the near future.
[Insert Table 5 here]
21
5. Complementary Evidence: Tone and Future Firm Performance
To corroborate the baseline results that more positive tone is negatively associated with financial
distress risk, we provide further evidence on the relationship between tone and firm future
performance. Our empirical tests focus on three aspects of future firm performance: the level of
future performance, earnings persistence, and the volatility of future performance (or firm risk).
5.1 Disclosure Tone and Firm Performance
Table 6 examines whether the more positive tone indicates higher firm future performance. We
use three alternative measures of firm performance, namely Sales Growth in Columns (1)-(2),
ROA in Columns (3)-(4), and Market-to-Book in Columns (5)-(6). The main independent variable
of interest is Tone_All in the odd columns and Tone_Chair in the even columns. We run OLS
regressions with both year and industry fixed effects. We find that both Tone_All and Tone_Chair
are associated with significantly higher Sales Growth, ROA, and Market-to-Book in the next fiscal
year. These effects are both statistically and economically significant. For example, in Column (3)
the coefficient on Tone_All is 0.217, meaning that a one-standard-deviation increase in Tone_All
is associated with 3.3-percentage-points increase in ROA in year t+1. The observed positive
relationship between tone and firm future performance is consistent with our H1 since better
future performance reduces financial distress risk.
[Insert Table 6 here]
5.2 Disclosure Tone and Earnings Persistence
Table 7 examines whether the tone is informative about earnings persistence.20 Higher earnings
persistence means that firms are more able to meet future obligations and less likely to go
bankrupt, and can be considered as an indicator of financial solvency. Our evidence in Section
20 Similarly, previous study (Li, 2008) examines the effect of a different disclosure attribute, namely annual report readability, on earnings persistence.
22
5.1 on the positive relationship between tone and firm future performance also implies that firms
with more positive tone should be more able to maintain their profit and thus exhibit higher
earnings persistence.
Our empirical model is similar to Skinner and Soltes (2011) which examines the
implication of dividend payment for earnings persistence. The dependent variable is the
operating profit in year t+1, Profitabilityt+1, in Columns (1)-(2), and the operating profit in year
t+2, Profitabilityt+2, in Columns (3)-(4). The main variable of interest is the interaction between
Tone_All_High and Profitability in Columns (1) and (3), and the interaction between
Tone_Chair_High and Profitability in Columns (2) and (4). Tone_All_High (Tone_Chair_High) is a
dummy variable that takes the value of one if Tone_All (Tone_Chair) is in the top quartile, and
zero otherwise. We find that the coefficients on the interaction between the high tone indicators
and the current year operating profit are positive and statistically significant at 1% or 5% level,
meaning that positive tone indicates both 1-year-ahead and 2-year-ahead earnings persistence.
These results suggest that the earnings of firms with more positive tone are more persistent,
which lends further support to our H1 since higher earnings persistence means lower financial
distress risk.
[Insert Table 7 here]
5.3 Disclosure Tone and Firm Risk
Table 8 examines whether the more positive tone is associated with lower future firm risk. We
use two alternative measures of the volatility of future firm performance, namely SD_Returnt+1 in
Columns (1)-(2), and SD_F3EBITDAt+1 in Columns (3)-(4). SD_Returnt+1 is the standard
deviation of the monthly stock return in the next fiscal year. SD_F3EBITDAt+1 is the standard
deviation of the EBITDA/total assets in the next three years. The independent variables are
Tone_All in the odd columns, and Tone_Chair in the even columns. We run OLS regressions with
both year and industry fixed effects.
23
We find that both Tone_All and Tone_Chair are associated with significantly lower
SD_F3EBITDAt+1 and SD_Returnt+1. These effects are statistically significant at 1% level, and
economically sizable. For example, in Column (3) the coefficient on Tone_All is -3.107, meaning
that a one-standard-deviation increase in Tone_All is associated with 47.2-percentage-points
decrease in SD_F3EBITDAt+1. The observed negative relationship between tone and firm future
risk is consistent with our H1 since higher performance volatility contributes to financial distress.
[Insert Table 8 here]
6. Further Analyses and Robustness
6.1 Disclosure Tone and Extreme Corporate Policies
Table 9 examines whether the more positive tone is associated with extreme corporate policies
which are likely to be triggered by the financial distress of the firm. For example, financially
distressed firms may be forced to significantly cut dividend payments, although firms are often
reluctant to do so. Financially distressed firms may also cut a relatively large number of
employees to reduce staff costs. In addition, firms facing liquidity problems may delay payment
to suppliers or significantly increase the usage of trade credit. These extreme corporate policies
could be driven by, and thus can serve as indirect indicators of firm financial distress.
The dependent variables are Dividend_Cutt+1 in Columns (1)-(2), Employee_Cutt+1 in
Columns (3)-(4), and Payable_Increaset+1 in Columns (5)-(6), respectively. Dividend_Cutt+1 is a
dummy variable that takes the value of one if a firm’s common dividends are cut from positive
to zero in year t+1. Employee_Cutt+1 is a dummy variable that takes the value of one if the number
of employees is cut by over 10 percent in year t+1. Payable_Increaset+1 is a dummy variable that
takes the value of one if a firm’s ratio of trade payables to total assets increases over five percent
in year t+1. The independent variables are Tone_All in the odd columns, and Tone_Chair in the
24
even columns. We find that more positive Tone_All and Tone_Chair significantly decrease the
probability of omitting dividend payment, having a dramatic cut of the number of employees,
and significantly increasing trade credit. These effects are all statistically significant at 1% level.
These additional evidence based on extreme corporate policies is in line with H1.
[Insert Table 9 here]
6.2 Disclosure Tone and Audit Opinion
To corroborate whether disclosure tone informs investors, we investigate whether the tone is
considered by auditors who are sophisticated users of accounting information. Auditors may
have private information about the firm fundamentals and are more capable of detecting
impression management. If disclosure tone reflects firm fundamentals and true private
information, auditors would be more likely to consider disclosure tone when giving audit
opinions.
Table 10 examines the effects of tone on the probability of receiving a qualified auditor
opinion that indicates the possibility of material misstatement of financial statements. The
dependent variable is Audit_Opinion_Qualified in all columns, a dummy variable that takes the
value of one if a firm receives a qualified auditor’s opinion. The independent variables are
Tone_All in the odd columns, and Tone_Chair in the even columns. Columns (1)-(2) show that
firms with more positive tone are significantly less likely to receive the qualified auditor’s opinion.
In Columns (3)-(4), we further control for Big4 as a proxy for auditor size, which is positively
associated with audit quality (DeAngelo, 1981). The results are robust to the inclusion of this
additional control.
These results are in line with the US evidence that the tone of MD&As is negatively
associated with the probability of receiving going concern opinion from the auditors (Mayew et
al., 2015), suggesting that auditors take corporate disclosures into consideration when making
such assessment. Our evidence also supports Teoh’s (2018, p. 112) argument that textual
25
information can enhance auditors’ “ability to red flag poor financial reporting and to reduce
audit failures”. In untabulated results, we control for Audit_Opinion_Qualified to examine the
incremental explanatory power of tone. Consistent with Mayew et al. (2015), we find that tone
has a significant incremental explanatory power over audit option and a range of firm
fundamentals.
[Insert Table 10 here]
6.3 Controlling for Managerial Overconfidence
Disclosure tone may reflect managerial overconfidence (Davis et al., 2015), in which case
optimistic tone captures overconfidence rather than incremental information. The prior literature
shows that managerial overconfidence leads to value-destroying M&As (Malmendier and Tate,
2008) and high leverage (Malmendier, Tate and Yan, 2011), and can, therefore, be detrimental to
firm value. In contrast, managerial overconfidence could be value-enhancing by improving
innovation performance (Hirshleifer et al., 2012) and mitigating agency problems (Hackbarth,
2008). Considering that managerial overconfidence could drive both the tone and the financial
distress risk, we control for managerial overconfidence to eliminate this omitted variable bias.
Appendix Table 2 reports the findings. We control for two alternative measures of
managerial overconfidence: Past_MA in Panel A, and IAIR_D in Panel B respectively. Past_MA
is the total number of M&A transactions in the past five years. IAIR_D is a dummy variable that
takes the value of one if the industry-adjusted Capex (capital expenditures/total assets) is in the
top quintile of the sample distribution. The independent variables are Tone_All in the odd
columns, and Tone_Chair in the even columns. We run the standard logit regressions in all
columns. The coefficients on Tone_All and Tone_Chair are still significantly negative after
controlling for managerial overconfidence, ruling out the possibility that our results are driven by
overconfidence.
26
6.4 Controlling for Macroeconomic Conditions
It is likely that macroeconomic conditions drive both the tone of the annual reports and
corporate bankruptcies. To address this concern, we control for several macroeconomic factors,
including GDP, GDP Volatility, and Lending Risk Premium21, in Appendix Table 3. We find
that both Tone_All and Tone_Chair still significantly reduce the probability of bankruptcy in
Columns (1)-(4) and being financially distressed according to Z-Score and O-Score respectively
in Columns (5)-(8) and Columns (9)-(12). These findings rule out the possibility that the
macroeconomic conditions drive our results.
6.5 Alternative Measures of Financial Distress
As a further robustness check, we use three alternative measures of financial distress in
Appendix Table 4. The dependent variables are F-Score_Distresst+1 in Columns (1)-(2),
Int_Cov_Distress1t+1 in Columns (3)-(4), and Int_Cov_Distress2t+1 in Columns (5)-(6), respectively.
F-Score_Distresst+1 is a dummy variable that takes the value of one if the Piotroski (2000) F-Score
is below three in year t+1. Int_Cov_Distress1t+1 is a dummy variable that takes the value of one if
the interest coverage is below one in two consecutive years, or in any one of the past two years
the interest coverage is below 0.8 (see Asquith et al., 1994). Int_Cov_Distress2t+1 is a dummy
variable that takes the value of one if a firm’s interest coverage is negative in the past two years.
The independent variables are Tone_All in the odd columns, and Tone_Chair in the even columns.
The logit regression results show that both Tone_All and Tone_Chair significantly reduce the
probability of being financially distressed as measured by the above three alternative financial
distress measures.
21 The UK macroeconomic data is downloadable at https://data.worldbank.org/country/united-kingdom
27
6.6 Caveats
Our empirical analyses are subject to a few caveats. First, to construct our tone measure we use
widely used Loughran and McDonald (2011) word list which is developed using the US 10-K
filings, while domain-specific word lists developed based on the UK annual reports might have
even stronger predictive power. We also assume the set of languages that firms use to describe
firm performance and risk is largely time-invariant. However, word lists indicating bankruptcy
risk might change over time, partly due to the changing business and regulatory environment
(e.g., the UK Corporate Governance Code) that could shape business communications. Second,
we adopt the bag-of-words approach to capture the textual information that is indicative of
financial distress, while some advanced natural language processing (NLP) techniques (e.g.,
machine learning) can be used to identify textual information that may better predict financial
distress. Third, further studies may focus on the tone of forward-looking statements. For
example, Li (2010a) uses the naïve Bayesian machine learning approach to examine the
information content of forward-looking statements. To sum up, there might be better ways to
extract textual information that can further enhance the accuracy of the bankruptcy prediction
model.22 See El-Haj et al. (2019) for an insightful review of the corporate disclosure literature,
and suggestions on how more advanced computational linguistics techniques can be employed to
potentially enhance the validity of textual analysis in accounting and finance.
7. Conclusion
This paper examines the incremental explanatory power of the linguistic tone of the voluntary
(highly discretionary) disclosures in the UK annual reports in predicting financial distress.
22 Liberti and Petersen (2018) point out a fundamental challenge of hardening soft information: “since the nature of information is not an exogenously fixed quantity, using textual analysis or coding soft information into numeric scores, may change or degrade the information”.
28
Corporate disclosures could either inform or misinform the users of accounting information.
The information content of the disclosure tone largely depends on the managerial incentive to
engage in impression management. This paper finds that more positive tone is associated with a
lower probability of bankruptcy. Furthermore, our cross-sectional analyses show that the
predictive power of tone is stronger for firms with lower managerial incentive to mislead
investors, in which case tone appears to be more informative and more indicative of bankruptcy
risk. We also provide complementary evidence that tone predicts both the level and volatility of
firm future performance, extreme corporate policies, and audit opinion. Our study confirms that
even the tone of the unstructured and highly discretionary corporate disclosure has significant
incremental information content in predicting firm future financial distress and performance.
This study has important implications for various stakeholders. From the investors’
perspective, textual analysis can be employed to extract value-relevant information even from
highly unstructured and discretionary corporate disclosures. From the corporate governance
perspective, more effective board monitoring can potentially enhance information quality of
corporate disclosures. From the regulatory perspective, stock market regulations and accounting
standards could also play an important role in improving the information quality of the
disclosures (especially for the AIM firms). This paper opens up several fruitful avenues for future
studies. Future research could examine the predictive ability of other disclosure attributes (e.g.,
risk disclosures, readability). It is also worth further investigating how various factors (e.g.,
corporate governance, regulations) could affect disclosure attributes by changing managerial
impression management incentives. Future studies may also consider the information content of
other types of corporate disclosures (not necessarily annual reports).
29
References Agarwal, V., & Taffler, R. (2008). Comparing the performance of market-based and accounting-
based bankruptcy prediction models. Journal of Banking & Finance, 32(8), 1541-1551. Ahmed, A. S., & Duellman, S. (2007). Accounting conservatism and board of director
characteristics: An empirical analysis. Journal of Accounting and Economics, 43(2-3), 411-437. Altman, E. I. (1968). Financial ratios, discriminant analysis and the prediction of corporate
bankruptcy. Journal of Finance, 23(4), 589-609. Altman, E. I., & Hotchkiss, E. (2006). Corporate Credit Scoring–insolvency Risk Models. Corporate
Financial Distress and Bankruptcy: Predict and Avoid Bankruptcy, Analyze and Invest in Distressed Debt, Third Edition, 231-264.
Allee, K. D., & DeAngelis, M. D. (2015). The structure of voluntary disclosure narratives: Evidence from tone dispersion. Journal of Accounting Research, 53(2), 241-274.
Armstrong, C. S., Core, J. E., & Guay, W. R. (2014). Do independent directors cause improvements in firm transparency?. Journal of Financial Economics, 113(3), 383-403.
Asquith, P., Gertner, R., & Scharfstein, D. (1994). Anatomy of financial distress: An examination of junk-bond issuers. The Quarterly Journal of Economics, 109(3), 625-658.
Athanasakou, V., El-Haj, M., Rayson, P., Walker, M. & Young, S. (2019). Annual Report Commentary Articulating Business Model and Strategy. Working Paper.
Beaver, W. H. (1966). Financial ratios as predictors of failure. Journal of Accounting Research, 71-111. Becker, C. L., DeFond, M. L., Jiambalvo, J., & Subramanyam, K. R. (1998). The effect of audit
quality on earnings management. Contemporary Accounting Research, 15(1), 1-24. Campbell, J. Y., Hilscher, J., & Szilagyi, J. (2008). In search of distress risk. Journal of Finance, 63(6),
2899-2939. Charitou, A., Neophytou, E., & Charalambous, C. (2004). Predicting corporate failure: empirical
evidence for the UK. European Accounting Review, 13(3), 465-497. Clatworthy, M., & Jones, M. J. (2003). Financial reporting of good news and bad news: evidence
from accounting narratives. Accounting and Business Research, 33(3), 171-185. Davis, A. K., Piger, J. M., & Sedor, L. M. (2012). Beyond the numbers: Measuring the
information content of earnings press release language. Contemporary Accounting Research, 29(3), 845-868.
Davis, A. K., & Tama‐Sweet, I. (2012). Managers’ use of language across alternative disclosure outlets: Earnings press releases versus MD&A. Contemporary Accounting Research, 29(3), 804-837.
Davis, A. K., Ge, W., Matsumoto, D., & Zhang, J. L. (2015). The effect of manager-specific optimism on the tone of earnings conference calls. Review of Accounting Studies, 20(2), 639-673.
DeAngelo, L. E. (1981). Auditor size and audit quality. Journal of Accounting and Economics, 3(3), 183-199.
El-Haj, M., Alves, P., Rayson, P., Walker, M. & Young, S. (2017). Retrieving, Classifying and Analysing Narrative Commentary in Unstructured (Glossy) Annual Reports Published as PDF Files (October 1, 2017). Available at SSRN: https://ssrn.com/abstract=2803275
El-Haj, M., Rayson, P., Walker, M., Young, S., & Simaki, V. (2019). In Search of Meaning: Lessons, Resources and Next Steps for Computational Analysis of Financial Discourse. Journal of Business Finance and Accounting, forthcoming.
Feldman, R., Govindaraj, S., Livnat, J., & Segal, B. (2010). Management’s tone change, post earnings announcement drift and accruals. Review of Accounting Studies, 15(4), 915-953.
Ferreira, D., Ferreira, M. A., & Raposo, C. C. (2011). Board structure and price informativeness. Journal of Financial Economics, 99(3), 523-545.
Financial Reporting Council (2012). Thinking about Disclosures in a Broader Context: A Road Map for a Disclosure Framework. London.
Firth, D. (1993). Bias reduction of maximum likelihood estimates. Biometrika, 80(1), 27-38.
30
Francis, J. R., & Wang, D. (2008). The joint effect of investor protection and Big 4 audits on earnings quality around the world. Contemporary Accounting Research, 25(1), 157-191.
Frost, C. A. (1997). Disclosure policy choices of UK firms receiving modified audit reports. Journal of Accounting and Economics, 23(2), 163-187.
Gandhi, P., Loughran, T., & McDonald, B. (2018). Using Annual Report Sentiment as a Proxy for Financial Distress in US Banks. Available at SSRN: https://ssrn.com/abstract=2905225
Gerakos, J., Lang, M., & Maffett, M. (2013). Post-listing performance and private sector regulation: The experience of London's Alternative Investment Market. Journal of Accounting and Economics, 56(2-3), 189-215.
Guillamón-Saorín, E., Osma, B. G., & Aerts, W. (2016). Earnings management and impression management. Available at SSRN 2756424.
Hackbarth, D. (2008). Managerial traits and capital structure decisions. Journal of Financial and Quantitative Analysis, 43(4), 843-881.
Healy, P. M., & Palepu, K. G. (2001). Information asymmetry, corporate disclosure, and the capital markets: A review of the empirical disclosure literature. Journal of Accounting and Economics, 31(1-3), 405-440.
Henry, E. (2008). Are investors influenced by how earnings press releases are written?. The Journal of Business Communication, 45(4), 363-407.
Henry, E., & Leone, A. J. (2016). Measuring qualitative information in capital markets research: Comparison of alternative methodologies to measure disclosure tone. Accounting Review, 91(1), 153-178.
Hilary, G., Hsu, C., Segal, B., & Wang, R. (2016). The bright side of managerial over-optimism. Journal of Accounting and Economics, 62(1), 46-64.
Hirshleifer, D., Low, A., & Teoh, S. H. (2012). Are overconfident CEOs better innovators?. Journal of Finance, 67(4), 1457-1498.
Horton, J., Serafeim, G., & Serafeim, I. (2013). Does mandatory IFRS adoption improve the information environment?. Contemporary Accounting Research, 30(1), 388-423.
Huang, X., Teoh, S. H., & Zhang, Y. (2014). Tone management. Accounting Review, 89(3), 1083-1113.
Kim, I., & Skinner, D. J. (2012). Measuring securities litigation risk. Journal of Accounting and Economics, 53(1-2), 290-310.
Kothari, S. P., Li, X., & Short, J. E. (2009). The effect of disclosures by management, analysts, and business press on cost of capital, return volatility, and analyst forecasts: A study using content analysis. Accounting Review, 84(5), 1639-1670.
Lang, M., & Stice-Lawrence, L. (2015). Textual analysis and international financial reporting: Large sample evidence. Journal of Accounting and Economics, 60(2-3), 110-135.
Lang, M. H., & Lundholm, R. J. (2000). Voluntary disclosure and equity offerings: reducing information asymmetry or hyping the stock?. Contemporary Accounting Research, 17(4), 623-662.
Larcker, D. F., & Zakolyukina, A. A. (2012). Detecting deceptive discussions in conference calls. Journal of Accounting Research, 50(2), 495-540.
Levi, S. (2008). Voluntary disclosure of accruals in earnings press releases and the pricing of accruals. Review of Accounting Studies, 13(1), 1-21.
Libby, R. (1975). Accounting ratios and the prediction of failure: Some behavioral evidence. Journal of Accounting Research, 150-161.
Liberti, J. M., & Petersen, M. A. (2018). Information: Hard and soft. Rev. Corporate Finance Stud, 1-42.
Li, F. (2008). Annual report readability, current earnings, and earnings persistence. Journal of Accounting and Economics, 45(2-3), 221-247.
Li, F. (2010a). The information content of forward-looking statements in corporate filings - A naïve Bayesian machine learning approach. Journal of Accounting Research, 48(5), 1049-1102.
31
Li, F. (2010b). Textual analysis of corporate disclosures: A survey of the literature. Journal of Accounting Literature, 29, 143.
Loughran, T., & McDonald, B. (2011). When is a liability not a liability? Textual analysis,
dictionaries, and 10‐Ks. Journal of Finance, 66(1), 35-65. Loughran, T., & McDonald, B. (2014). Measuring readability in financial disclosures. Journal of
Finance, 69(4), 1643-1671. Loughran, T., & McDonald, B. (2016). Textual analysis in accounting and finance: A survey.
Journal of Accounting Research, 54(4), 1187-1230. Malmendier, U., & Tate, G. (2008). Who makes acquisitions? CEO overconfidence and the
market's reaction. Journal of Financial Economics, 89(1), 20-43.
Malmendier, U., Tate, G., & Yan, J. (2011). Overconfidence and early‐life experiences: the effect of managerial traits on corporate financial policies. Journal of Finance, 66(5), 1687-1733.
Mayew, W. J., Sethuraman, M., & Venkatachalam, M. (2015). MD&A disclosure and the firm's ability to continue as a going concern. Accounting Review, 90(4), 1621-1651.
Merkl-Davies, D. M., & Brennan, N. (2007). Discretionary disclosure strategies in corporate narratives. Journal of Accounting Literature, 26, 116-196.
Nielsson, U. (2013). Do less regulated markets attract lower quality firms? Evidence from the London AIM market. Journal of Financial Intermediation, 22(3), 335-352.
Ohlson, J. A. (1980). Financial ratios and the probabilistic prediction of bankruptcy. Journal of Accounting Research, 109-131.
Osma, B. G., & Guillamón-Saorín, E. (2011). Corporate governance and impression management in annual results press releases. Accounting, Organizations and Society, 36(4-5), 187-208.
Piotroski, J. D. (2000). Value investing: The use of historical financial statement information to separate winners from losers. Journal of Accounting Research, 1-41.
Price, S. M., Doran, J. S., Peterson, D. R., & Bliss, B. A. (2012). Earnings conference calls and stock returns: The incremental informativeness of textual tone. Journal of Banking & Finance, 36(4), 992-1011.
Rogers, J. L., Van Buskirk, A., & Zechman, S. L. (2011). Disclosure tone and shareholder litigation. Accounting Review, 86(6), 2155-2183.
Seetharaman, A., Gul, F. A., & Lynn, S. G. (2002). Litigation risk and audit fees: Evidence from UK firms cross-listed on US markets. Journal of Accounting and Economics, 33(1), 91-115.
Shumway, T. (2001). Forecasting bankruptcy more accurately: A simple hazard model. Journal of Business, 74(1), 101-124.
Skinner, D. J., & Soltes, E. (2011). What do dividends tell us about earnings quality?. Review of Accounting Studies, 16(1), 1-28.
Smith, M., & Taffler, R. J. (2000). The chairman’s statement-a content analysis of discretionary narrative disclosures. Accounting, Auditing & Accountability Journal, 13(5), 624-647.
Stice, E. K. (1991). The market reaction to 10-K and 10-Q filings and to subsequent The Wall Street Journal earnings announcements. Accounting Review, 42-55.
Taffler, R. J. (1984). Empirical models for the monitoring of UK corporations. Journal of Banking & Finance, 8(2), 199-227.
Teoh, S. H. (2018). The promise and challenges of new datasets for accounting research. Accounting, Organizations and Society, 68-69, 109-117.
Tetlock, P. C., Saar-Tsechansky, M., & Macskassy, S. (2008). More than words: Quantifying language to measure firms' fundamentals. Journal of Finance, 63(3), 1437-1467.
Wigglesworth, R. (2018). The rise of ‘quantamental’ investing: where man and machine meet, The Financial Times, 20 November, p.141.
Zmijewski, M. E. (1984). Methodological issues related to the estimation of financial distress prediction models. Journal of Accounting Research, 59-82.
32
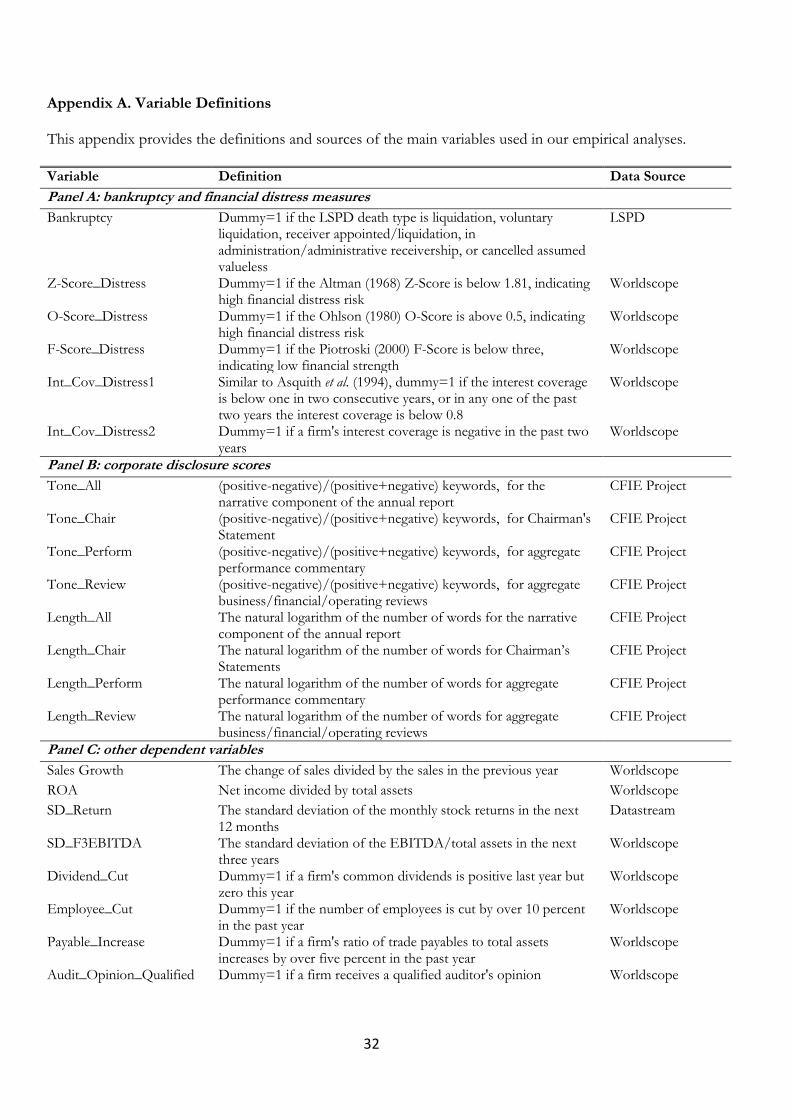
Appendix A. Variable Definitions
This appendix provides the definitions and sources of the main variables used in our empirical analyses.
Variable Definition Data Source
Panel A: bankruptcy and financial distress measures
Bankruptcy Dummy=1 if the LSPD death type is liquidation, voluntary liquidation, receiver appointed/liquidation, in administration/administrative receivership, or cancelled assumed valueless
LSPD
Z-Score_Distress Dummy=1 if the Altman (1968) Z-Score is below 1.81, indicating high financial distress risk
Worldscope
O-Score_Distress Dummy=1 if the Ohlson (1980) O-Score is above 0.5, indicating high financial distress risk
Worldscope
F-Score_Distress Dummy=1 if the Piotroski (2000) F-Score is below three, indicating low financial strength
Worldscope
Int_Cov_Distress1 Similar to Asquith et al. (1994), dummy=1 if the interest coverage is below one in two consecutive years, or in any one of the past two years the interest coverage is below 0.8
Worldscope
Int_Cov_Distress2 Dummy=1 if a firm's interest coverage is negative in the past two years
Worldscope
Panel B: corporate disclosure scores
Tone_All (positive-negative)/(positive+negative) keywords, for the narrative component of the annual report
CFIE Project
Tone_Chair (positive-negative)/(positive+negative) keywords, for Chairman's Statement
CFIE Project
Tone_Perform (positive-negative)/(positive+negative) keywords, for aggregate performance commentary
CFIE Project
Tone_Review (positive-negative)/(positive+negative) keywords, for aggregate business/financial/operating reviews
CFIE Project
Length_All The natural logarithm of the number of words for the narrative component of the annual report
CFIE Project
Length_Chair The natural logarithm of the number of words for Chairman’s Statements
CFIE Project
Length_Perform The natural logarithm of the number of words for aggregate performance commentary
CFIE Project
Length_Review The natural logarithm of the number of words for aggregate business/financial/operating reviews
CFIE Project
Panel C: other dependent variables
Sales Growth The change of sales divided by the sales in the previous year Worldscope
ROA Net income divided by total assets Worldscope
SD_Return The standard deviation of the monthly stock returns in the next 12 months
Datastream
SD_F3EBITDA The standard deviation of the EBITDA/total assets in the next three years
Worldscope
Dividend_Cut Dummy=1 if a firm's common dividends is positive last year but zero this year
Worldscope
Employee_Cut Dummy=1 if the number of employees is cut by over 10 percent in the past year
Worldscope
Payable_Increase Dummy=1 if a firm's ratio of trade payables to total assets increases by over five percent in the past year
Worldscope
Audit_Opinion_Qualified
Dummy=1 if a firm receives a qualified auditor's opinion Worldscope
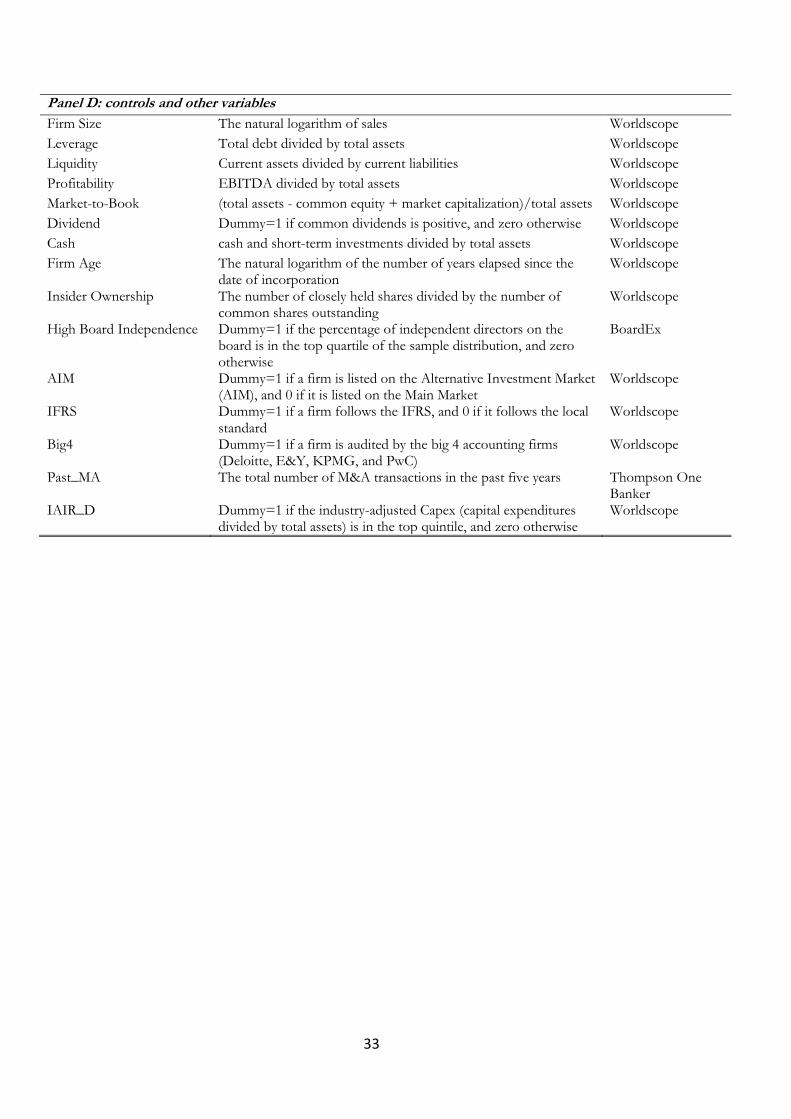
33
Panel D: controls and other variables
Firm Size The natural logarithm of sales Worldscope
Leverage Total debt divided by total assets Worldscope
Liquidity Current assets divided by current liabilities Worldscope
Profitability EBITDA divided by total assets Worldscope
Market-to-Book (total assets - common equity + market capitalization)/total assets Worldscope
Dividend Dummy=1 if common dividends is positive, and zero otherwise Worldscope
Cash cash and short-term investments divided by total assets Worldscope
Firm Age The natural logarithm of the number of years elapsed since the date of incorporation
Worldscope
Insider Ownership The number of closely held shares divided by the number of common shares outstanding
Worldscope
High Board Independence Dummy=1 if the percentage of independent directors on the board is in the top quartile of the sample distribution, and zero otherwise
BoardEx
AIM Dummy=1 if a firm is listed on the Alternative Investment Market (AIM), and 0 if it is listed on the Main Market
Worldscope
IFRS Dummy=1 if a firm follows the IFRS, and 0 if it follows the local standard
Worldscope
Big4 Dummy=1 if a firm is audited by the big 4 accounting firms (Deloitte, E&Y, KPMG, and PwC)
Worldscope
Past_MA The total number of M&A transactions in the past five years Thompson One Banker
IAIR_D Dummy=1 if the industry-adjusted Capex (capital expenditures divided by total assets) is in the top quintile, and zero otherwise
Worldscope
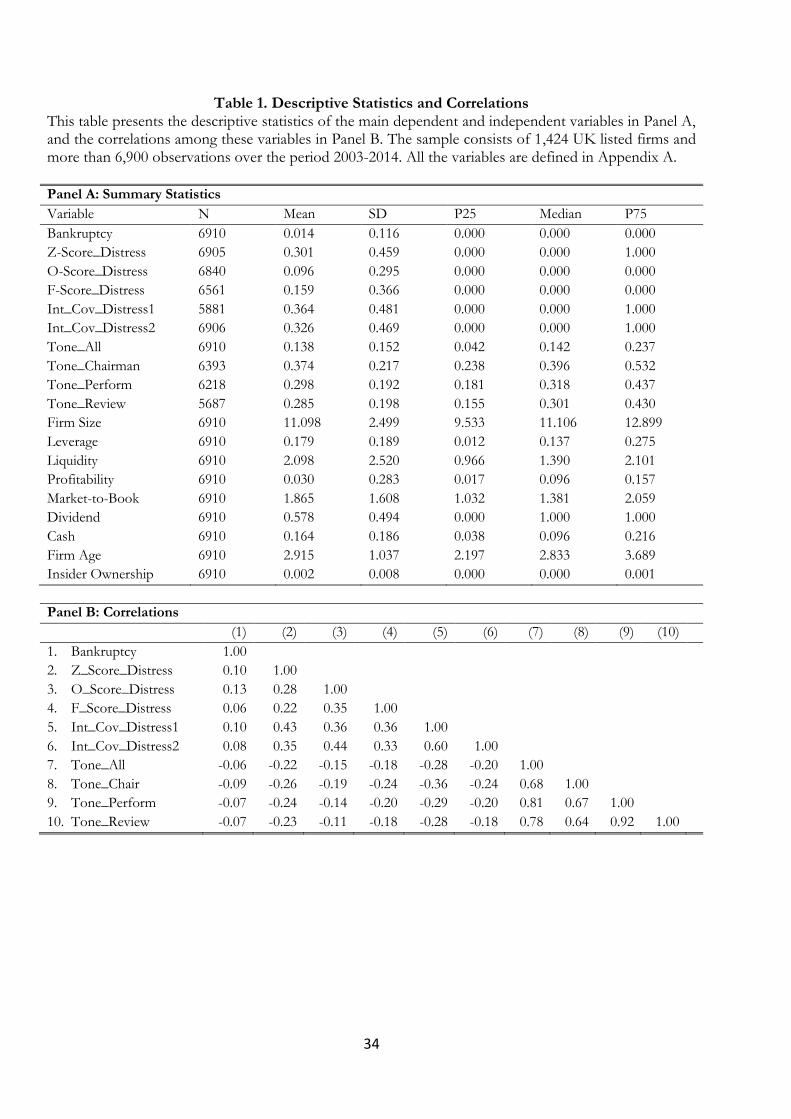
34
Table 1. Descriptive Statistics and Correlations This table presents the descriptive statistics of the main dependent and independent variables in Panel A, and the correlations among these variables in Panel B. The sample consists of 1,424 UK listed firms and more than 6,900 observations over the period 2003-2014. All the variables are defined in Appendix A.
Panel A: Summary Statistics
Variable N Mean SD P25 Median P75
Bankruptcy 6910 0.014 0.116 0.000 0.000 0.000
Z-Score_Distress 6905 0.301 0.459 0.000 0.000 1.000
O-Score_Distress 6840 0.096 0.295 0.000 0.000 0.000
F-Score_Distress 6561 0.159 0.366 0.000 0.000 0.000
Int_Cov_Distress1 5881 0.364 0.481 0.000 0.000 1.000
Int_Cov_Distress2 6906 0.326 0.469 0.000 0.000 1.000
Tone_All 6910 0.138 0.152 0.042 0.142 0.237
Tone_Chairman 6393 0.374 0.217 0.238 0.396 0.532
Tone_Perform 6218 0.298 0.192 0.181 0.318 0.437
Tone_Review 5687 0.285 0.198 0.155 0.301 0.430
Firm Size 6910 11.098 2.499 9.533 11.106 12.899
Leverage 6910 0.179 0.189 0.012 0.137 0.275
Liquidity 6910 2.098 2.520 0.966 1.390 2.101
Profitability 6910 0.030 0.283 0.017 0.096 0.157
Market-to-Book 6910 1.865 1.608 1.032 1.381 2.059
Dividend 6910 0.578 0.494 0.000 1.000 1.000
Cash 6910 0.164 0.186 0.038 0.096 0.216
Firm Age 6910 2.915 1.037 2.197 2.833 3.689
Insider Ownership 6910 0.002 0.008 0.000 0.000 0.001
Panel B: Correlations
(1) (2) (3) (4) (5) (6) (7) (8) (9) (10)
1. Bankruptcy 1.00
2. Z_Score_Distress 0.10 1.00
3. O_Score_Distress 0.13 0.28 1.00
4. F_Score_Distress 0.06 0.22 0.35 1.00
5. Int_Cov_Distress1 0.10 0.43 0.36 0.36 1.00
6. Int_Cov_Distress2 0.08 0.35 0.44 0.33 0.60 1.00
7. Tone_All -0.06 -0.22 -0.15 -0.18 -0.28 -0.20 1.00
8. Tone_Chair -0.09 -0.26 -0.19 -0.24 -0.36 -0.24 0.68 1.00
9. Tone_Perform -0.07 -0.24 -0.14 -0.20 -0.29 -0.20 0.81 0.67 1.00
10. Tone_Review -0.07 -0.23 -0.11 -0.18 -0.28 -0.18 0.78 0.64 0.92 1.00
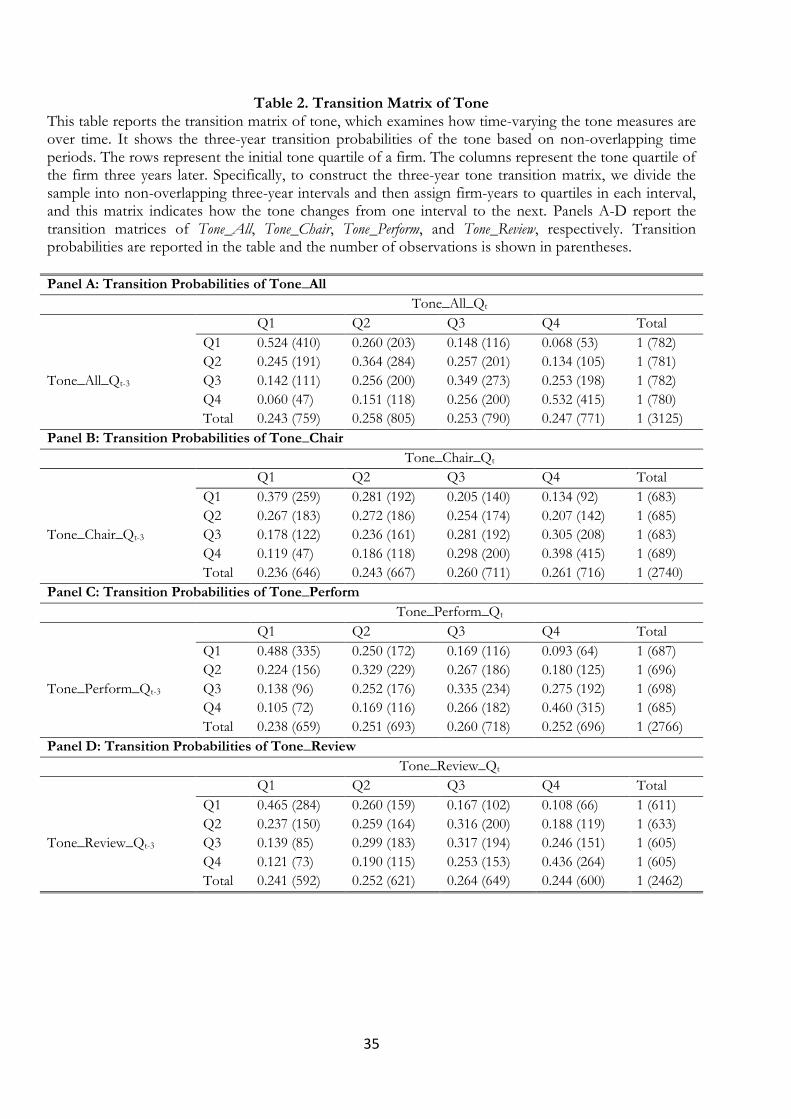
35
Table 2. Transition Matrix of Tone This table reports the transition matrix of tone, which examines how time-varying the tone measures are over time. It shows the three-year transition probabilities of the tone based on non-overlapping time periods. The rows represent the initial tone quartile of a firm. The columns represent the tone quartile of the firm three years later. Specifically, to construct the three-year tone transition matrix, we divide the sample into non-overlapping three-year intervals and then assign firm-years to quartiles in each interval, and this matrix indicates how the tone changes from one interval to the next. Panels A-D report the transition matrices of Tone_All, Tone_Chair, Tone_Perform, and Tone_Review, respectively. Transition probabilities are reported in the table and the number of observations is shown in parentheses.
Panel A: Transition Probabilities of Tone_All
Tone_All_Qt
Q1 Q2 Q3 Q4 Total
Tone_All_Qt-3
Q1 0.524 (410) 0.260 (203) 0.148 (116) 0.068 (53) 1 (782)
Q2 0.245 (191) 0.364 (284) 0.257 (201) 0.134 (105) 1 (781)
Q3 0.142 (111) 0.256 (200) 0.349 (273) 0.253 (198) 1 (782)
Q4 0.060 (47) 0.151 (118) 0.256 (200) 0.532 (415) 1 (780)
Total 0.243 (759) 0.258 (805) 0.253 (790) 0.247 (771) 1 (3125)
Panel B: Transition Probabilities of Tone_Chair
Tone_Chair_Qt
Q1 Q2 Q3 Q4 Total
Tone_Chair_Qt-3
Q1 0.379 (259) 0.281 (192) 0.205 (140) 0.134 (92) 1 (683)
Q2 0.267 (183) 0.272 (186) 0.254 (174) 0.207 (142) 1 (685)
Q3 0.178 (122) 0.236 (161) 0.281 (192) 0.305 (208) 1 (683)
Q4 0.119 (47) 0.186 (118) 0.298 (200) 0.398 (415) 1 (689)
Total 0.236 (646) 0.243 (667) 0.260 (711) 0.261 (716) 1 (2740)
Panel C: Transition Probabilities of Tone_Perform
Tone_Perform_Qt
Q1 Q2 Q3 Q4 Total
Tone_Perform_Qt-3
Q1 0.488 (335) 0.250 (172) 0.169 (116) 0.093 (64) 1 (687)
Q2 0.224 (156) 0.329 (229) 0.267 (186) 0.180 (125) 1 (696)
Q3 0.138 (96) 0.252 (176) 0.335 (234) 0.275 (192) 1 (698)
Q4 0.105 (72) 0.169 (116) 0.266 (182) 0.460 (315) 1 (685)
Total 0.238 (659) 0.251 (693) 0.260 (718) 0.252 (696) 1 (2766)
Panel D: Transition Probabilities of Tone_Review
Tone_Review_Qt
Q1 Q2 Q3 Q4 Total
Tone_Review_Qt-3
Q1 0.465 (284) 0.260 (159) 0.167 (102) 0.108 (66) 1 (611)
Q2 0.237 (150) 0.259 (164) 0.316 (200) 0.188 (119) 1 (633)
Q3 0.139 (85) 0.299 (183) 0.317 (194) 0.246 (151) 1 (605)
Q4 0.121 (73) 0.190 (115) 0.253 (153) 0.436 (264) 1 (605)
Total 0.241 (592) 0.252 (621) 0.264 (649) 0.244 (600) 1 (2462)
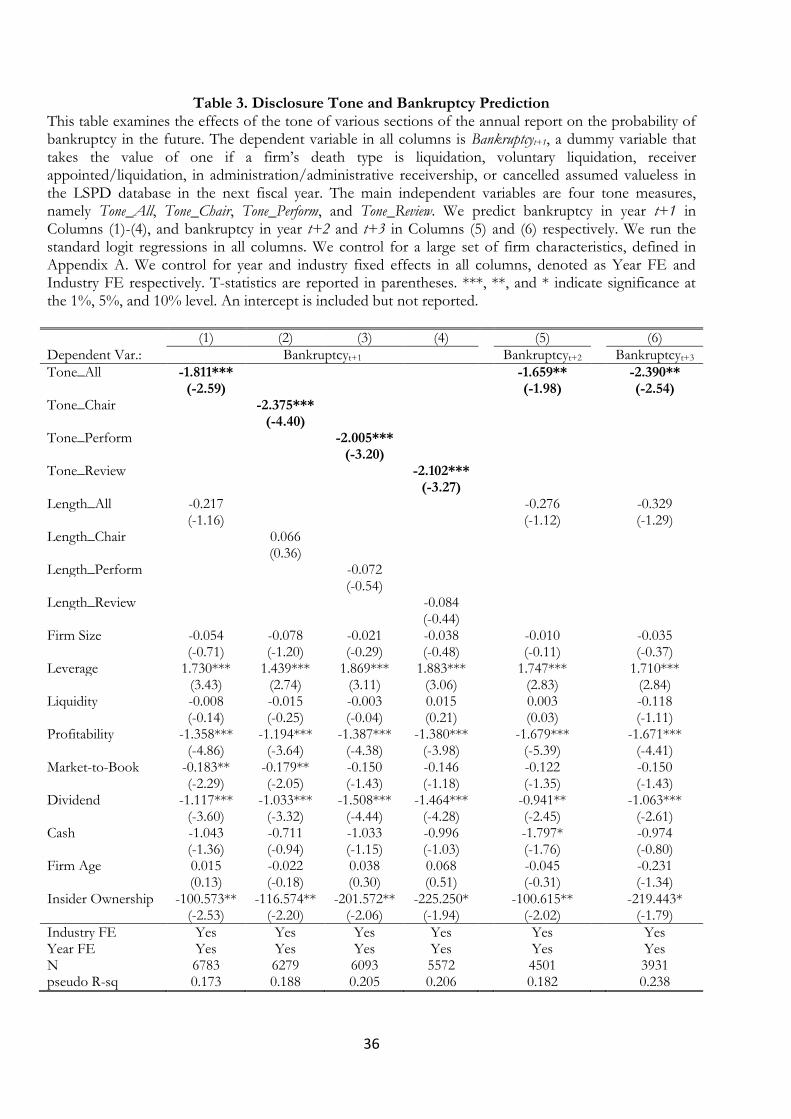
36
Table 3. Disclosure Tone and Bankruptcy Prediction This table examines the effects of the tone of various sections of the annual report on the probability of bankruptcy in the future. The dependent variable in all columns is Bankruptcyt+1, a dummy variable that takes the value of one if a firm’s death type is liquidation, voluntary liquidation, receiver appointed/liquidation, in administration/administrative receivership, or cancelled assumed valueless in the LSPD database in the next fiscal year. The main independent variables are four tone measures, namely Tone_All, Tone_Chair, Tone_Perform, and Tone_Review. We predict bankruptcy in year t+1 in Columns (1)-(4), and bankruptcy in year t+2 and t+3 in Columns (5) and (6) respectively. We run the standard logit regressions in all columns. We control for a large set of firm characteristics, defined in Appendix A. We control for year and industry fixed effects in all columns, denoted as Year FE and Industry FE respectively. T-statistics are reported in parentheses. ***, **, and * indicate significance at the 1%, 5%, and 10% level. An intercept is included but not reported.
(1) (2) (3) (4) (5) (6)
Dependent Var.: Bankruptcyt+1 Bankruptcyt+2 Bankruptcyt+3
Tone_All -1.811*** -1.659** -2.390** (-2.59) (-1.98) (-2.54) Tone_Chair -2.375*** (-4.40) Tone_Perform -2.005*** (-3.20) Tone_Review -2.102*** (-3.27) Length_All -0.217 -0.276 -0.329 (-1.16) (-1.12) (-1.29) Length_Chair 0.066 (0.36) Length_Perform -0.072 (-0.54) Length_Review -0.084 (-0.44) Firm Size -0.054 -0.078 -0.021 -0.038 -0.010 -0.035 (-0.71) (-1.20) (-0.29) (-0.48) (-0.11) (-0.37) Leverage 1.730*** 1.439*** 1.869*** 1.883*** 1.747*** 1.710*** (3.43) (2.74) (3.11) (3.06) (2.83) (2.84) Liquidity -0.008 -0.015 -0.003 0.015 0.003 -0.118 (-0.14) (-0.25) (-0.04) (0.21) (0.03) (-1.11) Profitability -1.358*** -1.194*** -1.387*** -1.380*** -1.679*** -1.671*** (-4.86) (-3.64) (-4.38) (-3.98) (-5.39) (-4.41) Market-to-Book -0.183** -0.179** -0.150 -0.146 -0.122 -0.150 (-2.29) (-2.05) (-1.43) (-1.18) (-1.35) (-1.43) Dividend -1.117*** -1.033*** -1.508*** -1.464*** -0.941** -1.063*** (-3.60) (-3.32) (-4.44) (-4.28) (-2.45) (-2.61) Cash -1.043 -0.711 -1.033 -0.996 -1.797* -0.974 (-1.36) (-0.94) (-1.15) (-1.03) (-1.76) (-0.80) Firm Age 0.015 -0.022 0.038 0.068 -0.045 -0.231 (0.13) (-0.18) (0.30) (0.51) (-0.31) (-1.34) Insider Ownership -100.573** -116.574** -201.572** -225.250* -100.615** -219.443* (-2.53) (-2.20) (-2.06) (-1.94) (-2.02) (-1.79)
Industry FE Yes Yes Yes Yes Yes Yes Year FE Yes Yes Yes Yes Yes Yes N 6783 6279 6093 5572 4501 3931 pseudo R-sq 0.173 0.188 0.205 0.206 0.182 0.238
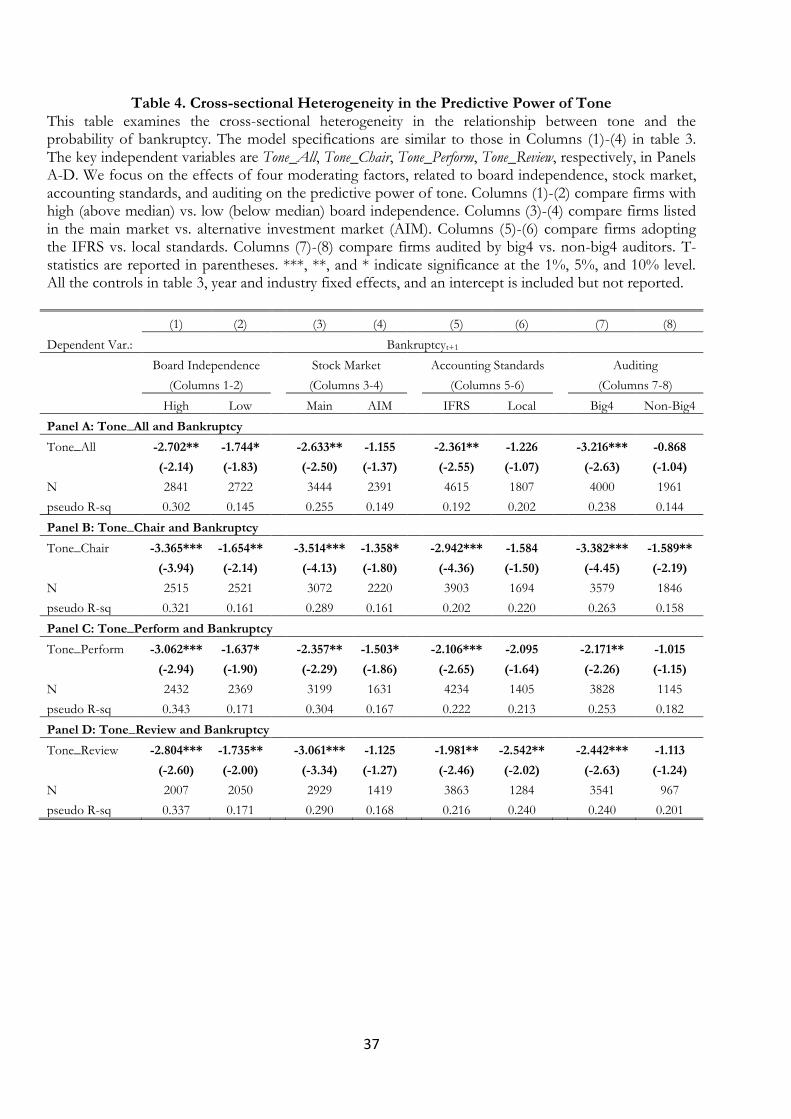
37
Table 4. Cross-sectional Heterogeneity in the Predictive Power of Tone This table examines the cross-sectional heterogeneity in the relationship between tone and the probability of bankruptcy. The model specifications are similar to those in Columns (1)-(4) in table 3. The key independent variables are Tone_All, Tone_Chair, Tone_Perform, Tone_Review, respectively, in Panels A-D. We focus on the effects of four moderating factors, related to board independence, stock market, accounting standards, and auditing on the predictive power of tone. Columns (1)-(2) compare firms with high (above median) vs. low (below median) board independence. Columns (3)-(4) compare firms listed in the main market vs. alternative investment market (AIM). Columns (5)-(6) compare firms adopting the IFRS vs. local standards. Columns (7)-(8) compare firms audited by big4 vs. non-big4 auditors. T-statistics are reported in parentheses. ***, **, and * indicate significance at the 1%, 5%, and 10% level. All the controls in table 3, year and industry fixed effects, and an intercept is included but not reported.
(1) (2) (3) (4) (5) (6) (7) (8)
Dependent Var.: Bankruptcyt+1
Board Independence
(Columns 1-2)
Stock Market
(Columns 3-4)
Accounting Standards
(Columns 5-6)
Auditing
(Columns 7-8)
High Low Main AIM IFRS Local Big4 Non-Big4
Panel A: Tone_All and Bankruptcy
Tone_All -2.702** -1.744* -2.633** -1.155 -2.361** -1.226 -3.216*** -0.868
(-2.14) (-1.83) (-2.50) (-1.37) (-2.55) (-1.07) (-2.63) (-1.04)
N 2841 2722 3444 2391 4615 1807 4000 1961
pseudo R-sq 0.302 0.145 0.255 0.149 0.192 0.202 0.238 0.144
Panel B: Tone_Chair and Bankruptcy
Tone_Chair -3.365*** -1.654** -3.514*** -1.358* -2.942*** -1.584 -3.382*** -1.589**
(-3.94) (-2.14) (-4.13) (-1.80) (-4.36) (-1.50) (-4.45) (-2.19)
N 2515 2521 3072 2220 3903 1694 3579 1846
pseudo R-sq 0.321 0.161 0.289 0.161 0.202 0.220 0.263 0.158
Panel C: Tone_Perform and Bankruptcy
Tone_Perform -3.062*** -1.637* -2.357** -1.503* -2.106*** -2.095 -2.171** -1.015
(-2.94) (-1.90) (-2.29) (-1.86) (-2.65) (-1.64) (-2.26) (-1.15)
N 2432 2369 3199 1631 4234 1405 3828 1145
pseudo R-sq 0.343 0.171 0.304 0.167 0.222 0.213 0.253 0.182
Panel D: Tone_Review and Bankruptcy
Tone_Review -2.804*** -1.735** -3.061*** -1.125 -1.981** -2.542** -2.442*** -1.113
(-2.60) (-2.00) (-3.34) (-1.27) (-2.46) (-2.02) (-2.63) (-1.24)
N 2007 2050 2929 1419 3863 1284 3541 967
pseudo R-sq 0.337 0.171 0.290 0.168 0.216 0.240 0.240 0.201
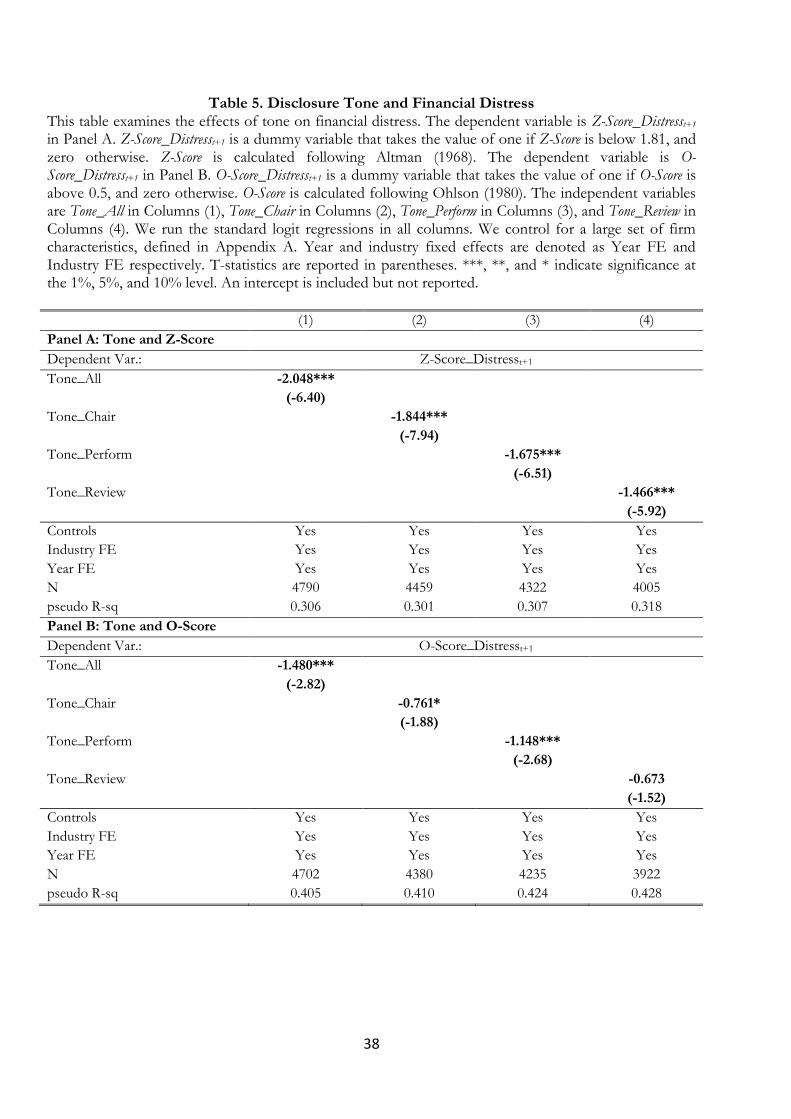
38
Table 5. Disclosure Tone and Financial Distress This table examines the effects of tone on financial distress. The dependent variable is Z-Score_Distresst+1 in Panel A. Z-Score_Distresst+1 is a dummy variable that takes the value of one if Z-Score is below 1.81, and zero otherwise. Z-Score is calculated following Altman (1968). The dependent variable is O-Score_Distresst+1 in Panel B. O-Score_Distresst+1 is a dummy variable that takes the value of one if O-Score is above 0.5, and zero otherwise. O-Score is calculated following Ohlson (1980). The independent variables are Tone_All in Columns (1), Tone_Chair in Columns (2), Tone_Perform in Columns (3), and Tone_Review in Columns (4). We run the standard logit regressions in all columns. We control for a large set of firm characteristics, defined in Appendix A. Year and industry fixed effects are denoted as Year FE and Industry FE respectively. T-statistics are reported in parentheses. ***, **, and * indicate significance at the 1%, 5%, and 10% level. An intercept is included but not reported.
(1) (2) (3) (4)
Panel A: Tone and Z-Score
Dependent Var.: Z-Score_Distresst+1
Tone_All -2.048***
(-6.40)
Tone_Chair -1.844***
(-7.94)
Tone_Perform -1.675***
(-6.51)
Tone_Review -1.466***
(-5.92)
Controls Yes Yes Yes Yes
Industry FE Yes Yes Yes Yes
Year FE Yes Yes Yes Yes
N 4790 4459 4322 4005
pseudo R-sq 0.306 0.301 0.307 0.318
Panel B: Tone and O-Score
Dependent Var.: O-Score_Distresst+1
Tone_All -1.480***
(-2.82)
Tone_Chair -0.761*
(-1.88)
Tone_Perform -1.148***
(-2.68)
Tone_Review -0.673
(-1.52)
Controls Yes Yes Yes Yes
Industry FE Yes Yes Yes Yes
Year FE Yes Yes Yes Yes
N 4702 4380 4235 3922
pseudo R-sq 0.405 0.410 0.424 0.428
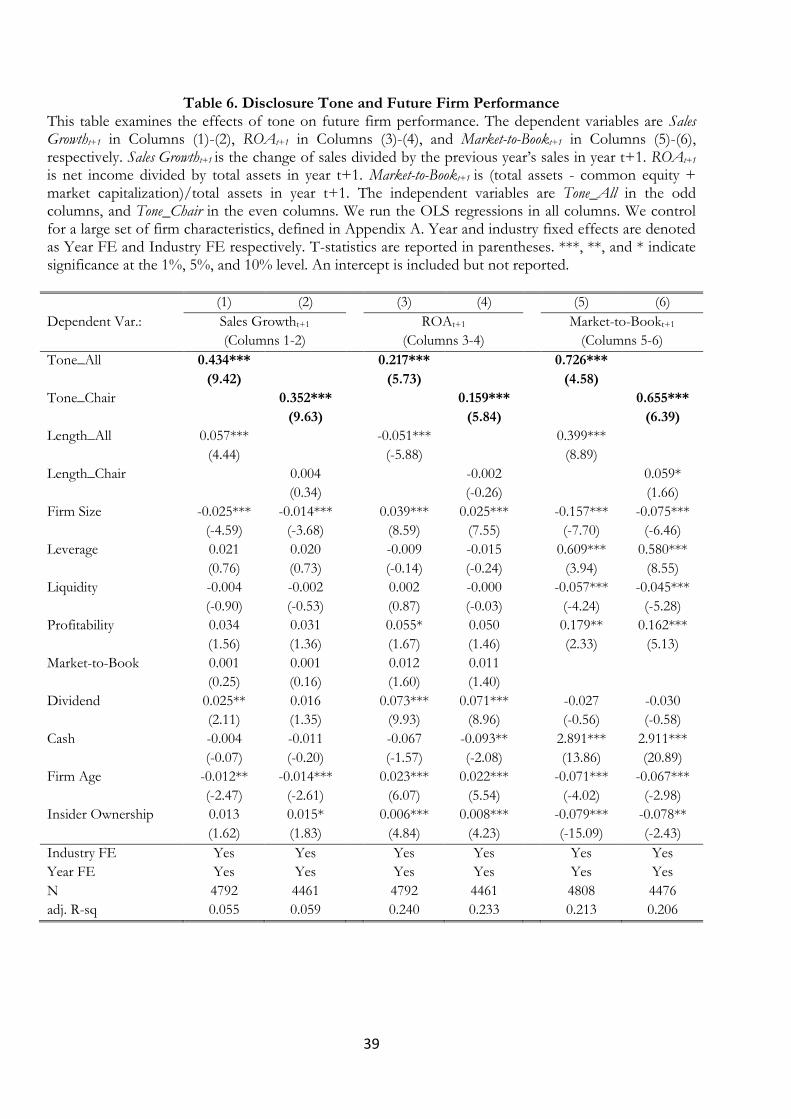
39
Table 6. Disclosure Tone and Future Firm Performance This table examines the effects of tone on future firm performance. The dependent variables are Sales Growtht+1 in Columns (1)-(2), ROAt+1 in Columns (3)-(4), and Market-to-Bookt+1 in Columns (5)-(6), respectively. Sales Growtht+1 is the change of sales divided by the previous year’s sales in year t+1. ROAt+1
is net income divided by total assets in year t+1. Market-to-Bookt+1 is (total assets - common equity + market capitalization)/total assets in year t+1. The independent variables are Tone_All in the odd columns, and Tone_Chair in the even columns. We run the OLS regressions in all columns. We control for a large set of firm characteristics, defined in Appendix A. Year and industry fixed effects are denoted as Year FE and Industry FE respectively. T-statistics are reported in parentheses. ***, **, and * indicate significance at the 1%, 5%, and 10% level. An intercept is included but not reported.
(1) (2) (3) (4) (5) (6)
Dependent Var.: Sales Growtht+1
(Columns 1-2)
ROAt+1
(Columns 3-4)
Market-to-Bookt+1
(Columns 5-6)
Tone_All 0.434*** 0.217*** 0.726***
(9.42) (5.73) (4.58)
Tone_Chair 0.352*** 0.159*** 0.655***
(9.63) (5.84) (6.39)
Length_All 0.057*** -0.051*** 0.399***
(4.44) (-5.88) (8.89)
Length_Chair 0.004 -0.002 0.059*
(0.34) (-0.26) (1.66)
Firm Size -0.025*** -0.014*** 0.039*** 0.025*** -0.157*** -0.075***
(-4.59) (-3.68) (8.59) (7.55) (-7.70) (-6.46)
Leverage 0.021 0.020 -0.009 -0.015 0.609*** 0.580***
(0.76) (0.73) (-0.14) (-0.24) (3.94) (8.55)
Liquidity -0.004 -0.002 0.002 -0.000 -0.057*** -0.045***
(-0.90) (-0.53) (0.87) (-0.03) (-4.24) (-5.28)
Profitability 0.034 0.031 0.055* 0.050 0.179** 0.162***
(1.56) (1.36) (1.67) (1.46) (2.33) (5.13)
Market-to-Book 0.001 0.001 0.012 0.011
(0.25) (0.16) (1.60) (1.40)
Dividend 0.025** 0.016 0.073*** 0.071*** -0.027 -0.030
(2.11) (1.35) (9.93) (8.96) (-0.56) (-0.58)
Cash -0.004 -0.011 -0.067 -0.093** 2.891*** 2.911***
(-0.07) (-0.20) (-1.57) (-2.08) (13.86) (20.89)
Firm Age -0.012** -0.014*** 0.023*** 0.022*** -0.071*** -0.067***
(-2.47) (-2.61) (6.07) (5.54) (-4.02) (-2.98)
Insider Ownership 0.013 0.015* 0.006*** 0.008*** -0.079*** -0.078**
(1.62) (1.83) (4.84) (4.23) (-15.09) (-2.43)
Industry FE Yes Yes Yes Yes Yes Yes
Year FE Yes Yes Yes Yes Yes Yes
N 4792 4461 4792 4461 4808 4476
adj. R-sq 0.055 0.059 0.240 0.233 0.213 0.206
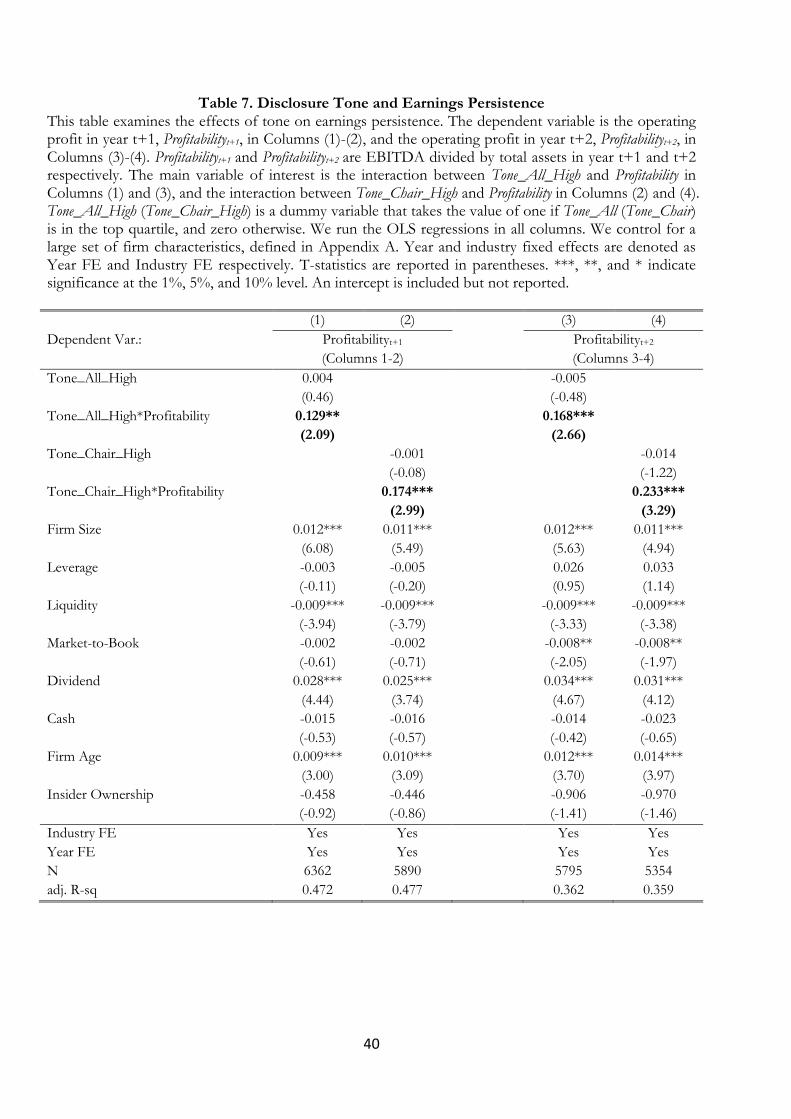
40
Table 7. Disclosure Tone and Earnings Persistence This table examines the effects of tone on earnings persistence. The dependent variable is the operating profit in year t+1, Profitabilityt+1, in Columns (1)-(2), and the operating profit in year t+2, Profitabilityt+2, in Columns (3)-(4). Profitabilityt+1 and Profitabilityt+2 are EBITDA divided by total assets in year t+1 and t+2 respectively. The main variable of interest is the interaction between Tone_All_High and Profitability in Columns (1) and (3), and the interaction between Tone_Chair_High and Profitability in Columns (2) and (4). Tone_All_High (Tone_Chair_High) is a dummy variable that takes the value of one if Tone_All (Tone_Chair) is in the top quartile, and zero otherwise. We run the OLS regressions in all columns. We control for a large set of firm characteristics, defined in Appendix A. Year and industry fixed effects are denoted as Year FE and Industry FE respectively. T-statistics are reported in parentheses. ***, **, and * indicate significance at the 1%, 5%, and 10% level. An intercept is included but not reported.
(1) (2) (3) (4)
Dependent Var.: Profitabilityt+1
(Columns 1-2)
Profitabilityt+2
(Columns 3-4)
Tone_All_High 0.004
-0.005
(0.46)
(-0.48)
Tone_All_High*Profitability 0.129**
0.168***
(2.09)
(2.66)
Tone_Chair_High
-0.001
-0.014
(-0.08)
(-1.22)
Tone_Chair_High*Profitability
0.174***
0.233***
(2.99)
(3.29)
Firm Size 0.012*** 0.011*** 0.012*** 0.011***
(6.08) (5.49) (5.63) (4.94)
Leverage -0.003 -0.005 0.026 0.033
(-0.11) (-0.20) (0.95) (1.14)
Liquidity -0.009*** -0.009*** -0.009*** -0.009***
(-3.94) (-3.79) (-3.33) (-3.38)
Market-to-Book -0.002 -0.002 -0.008** -0.008**
(-0.61) (-0.71) (-2.05) (-1.97)
Dividend 0.028*** 0.025*** 0.034*** 0.031***
(4.44) (3.74) (4.67) (4.12)
Cash -0.015 -0.016 -0.014 -0.023
(-0.53) (-0.57) (-0.42) (-0.65)
Firm Age 0.009*** 0.010*** 0.012*** 0.014***
(3.00) (3.09) (3.70) (3.97)
Insider Ownership -0.458 -0.446 -0.906 -0.970
(-0.92) (-0.86) (-1.41) (-1.46)
Industry FE Yes Yes Yes Yes
Year FE Yes Yes Yes Yes
N 6362 5890 5795 5354
adj. R-sq 0.472 0.477 0.362 0.359
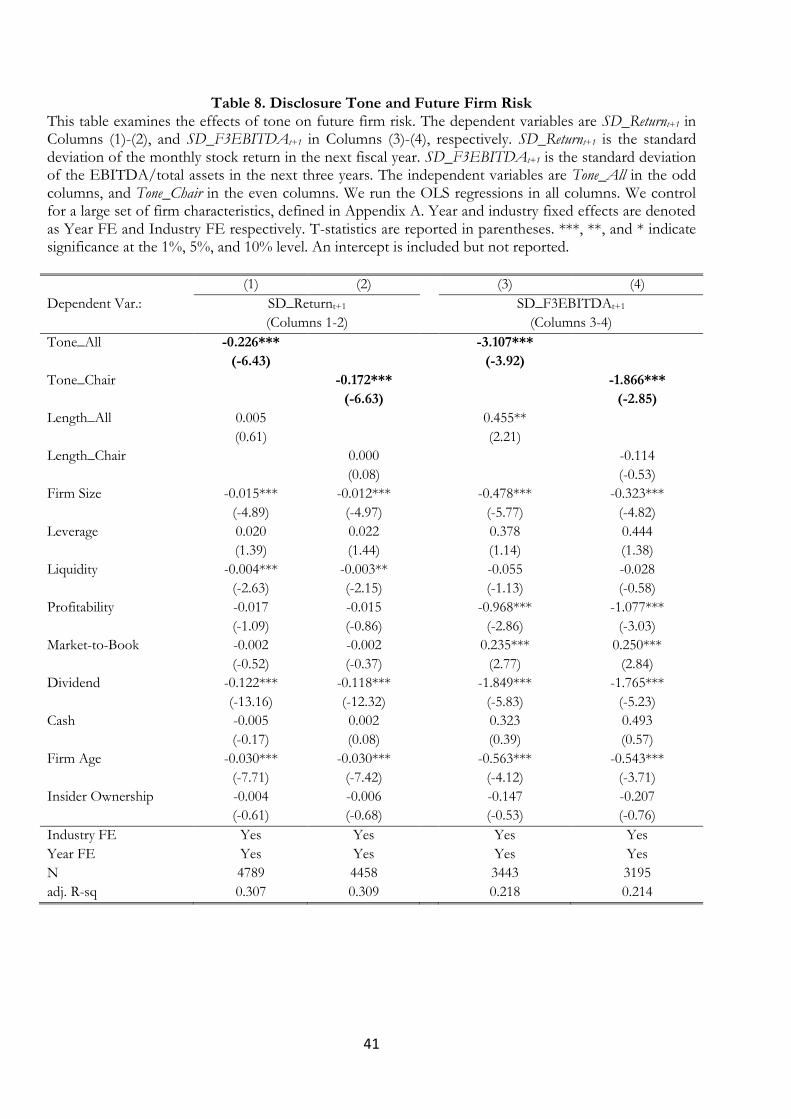
41
Table 8. Disclosure Tone and Future Firm Risk This table examines the effects of tone on future firm risk. The dependent variables are SD_Returnt+1 in Columns (1)-(2), and SD_F3EBITDAt+1 in Columns (3)-(4), respectively. SD_Returnt+1 is the standard deviation of the monthly stock return in the next fiscal year. SD_F3EBITDAt+1 is the standard deviation of the EBITDA/total assets in the next three years. The independent variables are Tone_All in the odd columns, and Tone_Chair in the even columns. We run the OLS regressions in all columns. We control for a large set of firm characteristics, defined in Appendix A. Year and industry fixed effects are denoted as Year FE and Industry FE respectively. T-statistics are reported in parentheses. ***, **, and * indicate significance at the 1%, 5%, and 10% level. An intercept is included but not reported.
(1) (2) (3) (4)
Dependent Var.: SD_Returnt+1
(Columns 1-2)
SD_F3EBITDAt+1
(Columns 3-4)
Tone_All -0.226*** -3.107***
(-6.43) (-3.92)
Tone_Chair -0.172*** -1.866***
(-6.63) (-2.85)
Length_All 0.005 0.455**
(0.61) (2.21)
Length_Chair 0.000 -0.114
(0.08) (-0.53)
Firm Size -0.015*** -0.012*** -0.478*** -0.323***
(-4.89) (-4.97) (-5.77) (-4.82)
Leverage 0.020 0.022 0.378 0.444
(1.39) (1.44) (1.14) (1.38)
Liquidity -0.004*** -0.003** -0.055 -0.028
(-2.63) (-2.15) (-1.13) (-0.58)
Profitability -0.017 -0.015 -0.968*** -1.077***
(-1.09) (-0.86) (-2.86) (-3.03)
Market-to-Book -0.002 -0.002 0.235*** 0.250***
(-0.52) (-0.37) (2.77) (2.84)
Dividend -0.122*** -0.118*** -1.849*** -1.765***
(-13.16) (-12.32) (-5.83) (-5.23)
Cash -0.005 0.002 0.323 0.493
(-0.17) (0.08) (0.39) (0.57)
Firm Age -0.030*** -0.030*** -0.563*** -0.543***
(-7.71) (-7.42) (-4.12) (-3.71)
Insider Ownership -0.004 -0.006 -0.147 -0.207
(-0.61) (-0.68) (-0.53) (-0.76)
Industry FE Yes Yes Yes Yes
Year FE Yes Yes Yes Yes
N 4789 4458 3443 3195
adj. R-sq 0.307 0.309 0.218 0.214
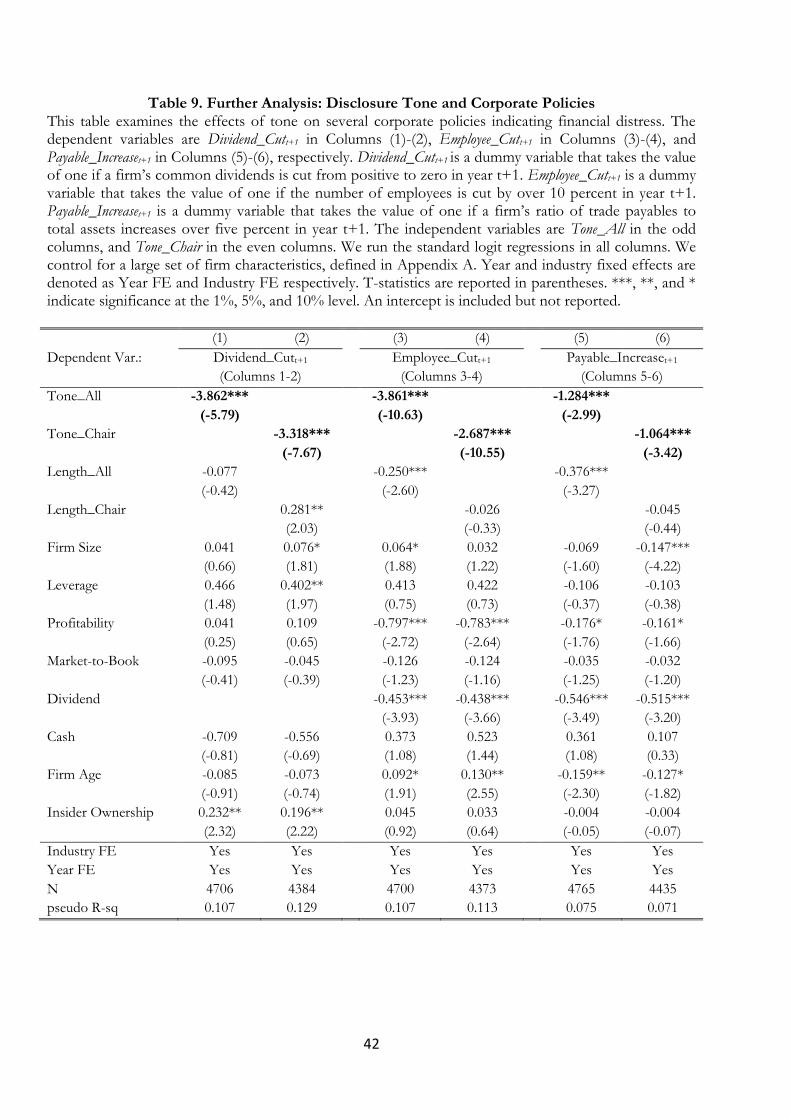
42
Table 9. Further Analysis: Disclosure Tone and Corporate Policies This table examines the effects of tone on several corporate policies indicating financial distress. The dependent variables are Dividend_Cutt+1 in Columns (1)-(2), Employee_Cutt+1 in Columns (3)-(4), and Payable_Increaset+1 in Columns (5)-(6), respectively. Dividend_Cutt+1 is a dummy variable that takes the value of one if a firm’s common dividends is cut from positive to zero in year t+1. Employee_Cutt+1 is a dummy variable that takes the value of one if the number of employees is cut by over 10 percent in year t+1. Payable_Increaset+1 is a dummy variable that takes the value of one if a firm’s ratio of trade payables to total assets increases over five percent in year t+1. The independent variables are Tone_All in the odd columns, and Tone_Chair in the even columns. We run the standard logit regressions in all columns. We control for a large set of firm characteristics, defined in Appendix A. Year and industry fixed effects are denoted as Year FE and Industry FE respectively. T-statistics are reported in parentheses. ***, **, and * indicate significance at the 1%, 5%, and 10% level. An intercept is included but not reported.
(1) (2) (3) (4) (5) (6)
Dependent Var.: Dividend_Cutt+1
(Columns 1-2)
Employee_Cutt+1
(Columns 3-4)
Payable_Increaset+1
(Columns 5-6)
Tone_All -3.862***
-3.861***
-1.284***
(-5.79)
(-10.63)
(-2.99)
Tone_Chair
-3.318***
-2.687***
-1.064***
(-7.67)
(-10.55)
(-3.42)
Length_All -0.077
-0.250***
-0.376***
(-0.42)
(-2.60)
(-3.27)
Length_Chair
0.281**
-0.026
-0.045
(2.03)
(-0.33)
(-0.44)
Firm Size 0.041 0.076* 0.064* 0.032 -0.069 -0.147***
(0.66) (1.81) (1.88) (1.22) (-1.60) (-4.22)
Leverage 0.466 0.402** 0.413 0.422 -0.106 -0.103
(1.48) (1.97) (0.75) (0.73) (-0.37) (-0.38)
Profitability 0.041 0.109 -0.797*** -0.783*** -0.176* -0.161*
(0.25) (0.65) (-2.72) (-2.64) (-1.76) (-1.66)
Market-to-Book -0.095 -0.045 -0.126 -0.124 -0.035 -0.032
(-0.41) (-0.39) (-1.23) (-1.16) (-1.25) (-1.20)
Dividend
-0.453*** -0.438*** -0.546*** -0.515***
(-3.93) (-3.66) (-3.49) (-3.20)
Cash -0.709 -0.556 0.373 0.523 0.361 0.107
(-0.81) (-0.69) (1.08) (1.44) (1.08) (0.33)
Firm Age -0.085 -0.073 0.092* 0.130** -0.159** -0.127*
(-0.91) (-0.74) (1.91) (2.55) (-2.30) (-1.82)
Insider Ownership 0.232** 0.196** 0.045 0.033 -0.004 -0.004
(2.32) (2.22) (0.92) (0.64) (-0.05) (-0.07)
Industry FE Yes Yes Yes Yes Yes Yes
Year FE Yes Yes Yes Yes Yes Yes
N 4706 4384 4700 4373 4765 4435
pseudo R-sq 0.107 0.129 0.107 0.113 0.075 0.071
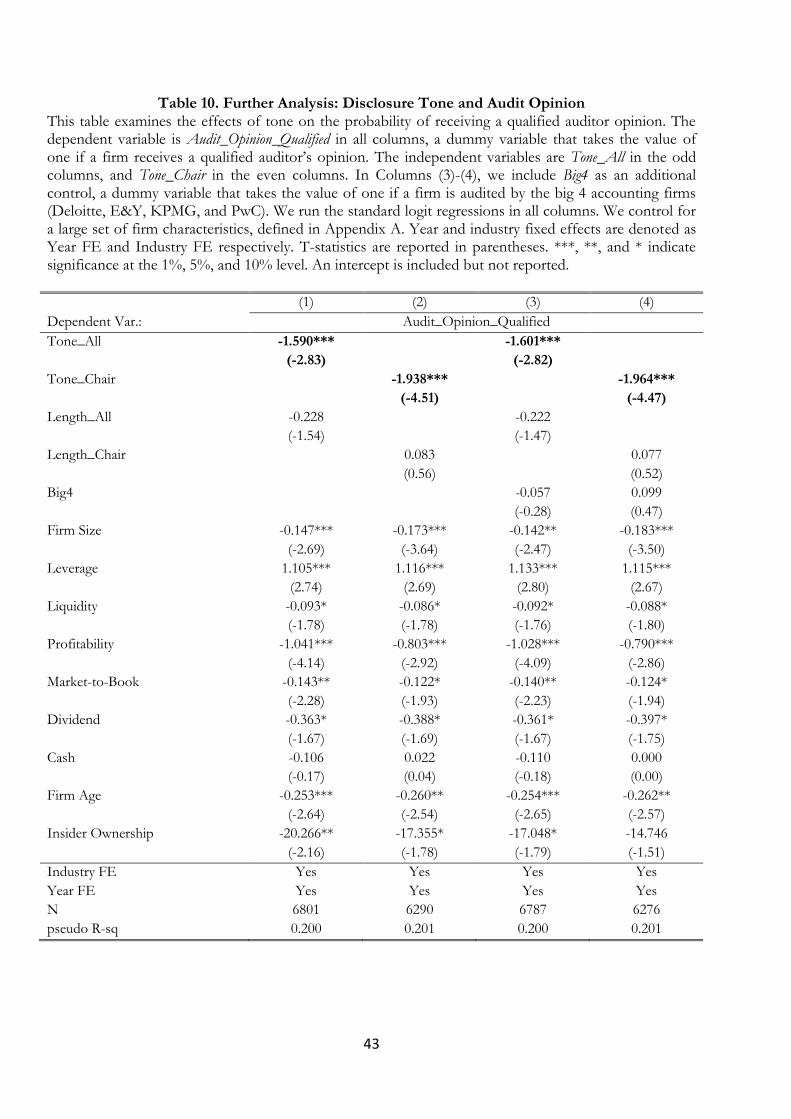
43
Table 10. Further Analysis: Disclosure Tone and Audit Opinion This table examines the effects of tone on the probability of receiving a qualified auditor opinion. The dependent variable is Audit_Opinion_Qualified in all columns, a dummy variable that takes the value of one if a firm receives a qualified auditor’s opinion. The independent variables are Tone_All in the odd columns, and Tone_Chair in the even columns. In Columns (3)-(4), we include Big4 as an additional control, a dummy variable that takes the value of one if a firm is audited by the big 4 accounting firms (Deloitte, E&Y, KPMG, and PwC). We run the standard logit regressions in all columns. We control for a large set of firm characteristics, defined in Appendix A. Year and industry fixed effects are denoted as Year FE and Industry FE respectively. T-statistics are reported in parentheses. ***, **, and * indicate significance at the 1%, 5%, and 10% level. An intercept is included but not reported.
(1) (2) (3) (4)
Dependent Var.: Audit_Opinion_Qualified
Tone_All -1.590*** -1.601***
(-2.83) (-2.82)
Tone_Chair -1.938*** -1.964***
(-4.51) (-4.47)
Length_All -0.228 -0.222
(-1.54) (-1.47)
Length_Chair 0.083 0.077
(0.56) (0.52)
Big4 -0.057 0.099
(-0.28) (0.47)
Firm Size -0.147*** -0.173*** -0.142** -0.183***
(-2.69) (-3.64) (-2.47) (-3.50)
Leverage 1.105*** 1.116*** 1.133*** 1.115***
(2.74) (2.69) (2.80) (2.67)
Liquidity -0.093* -0.086* -0.092* -0.088*
(-1.78) (-1.78) (-1.76) (-1.80)
Profitability -1.041*** -0.803*** -1.028*** -0.790***
(-4.14) (-2.92) (-4.09) (-2.86)
Market-to-Book -0.143** -0.122* -0.140** -0.124*
(-2.28) (-1.93) (-2.23) (-1.94)
Dividend -0.363* -0.388* -0.361* -0.397*
(-1.67) (-1.69) (-1.67) (-1.75)
Cash -0.106 0.022 -0.110 0.000
(-0.17) (0.04) (-0.18) (0.00)
Firm Age -0.253*** -0.260** -0.254*** -0.262**
(-2.64) (-2.54) (-2.65) (-2.57)
Insider Ownership -20.266** -17.355* -17.048* -14.746
(-2.16) (-1.78) (-1.79) (-1.51)
Industry FE Yes Yes Yes Yes
Year FE Yes Yes Yes Yes
N 6801 6290 6787 6276
pseudo R-sq 0.200 0.201 0.200 0.201
44
Appendix Tables
Appendix Table 1. The Incremental Predictive Power of Tone
Appendix Table 2. Controlling for Managerial Overconfidence
Appendix Table 3. Controlling for Macroeconomic Conditions
Appendix Table 4. Alternative Measures of Financial Distress
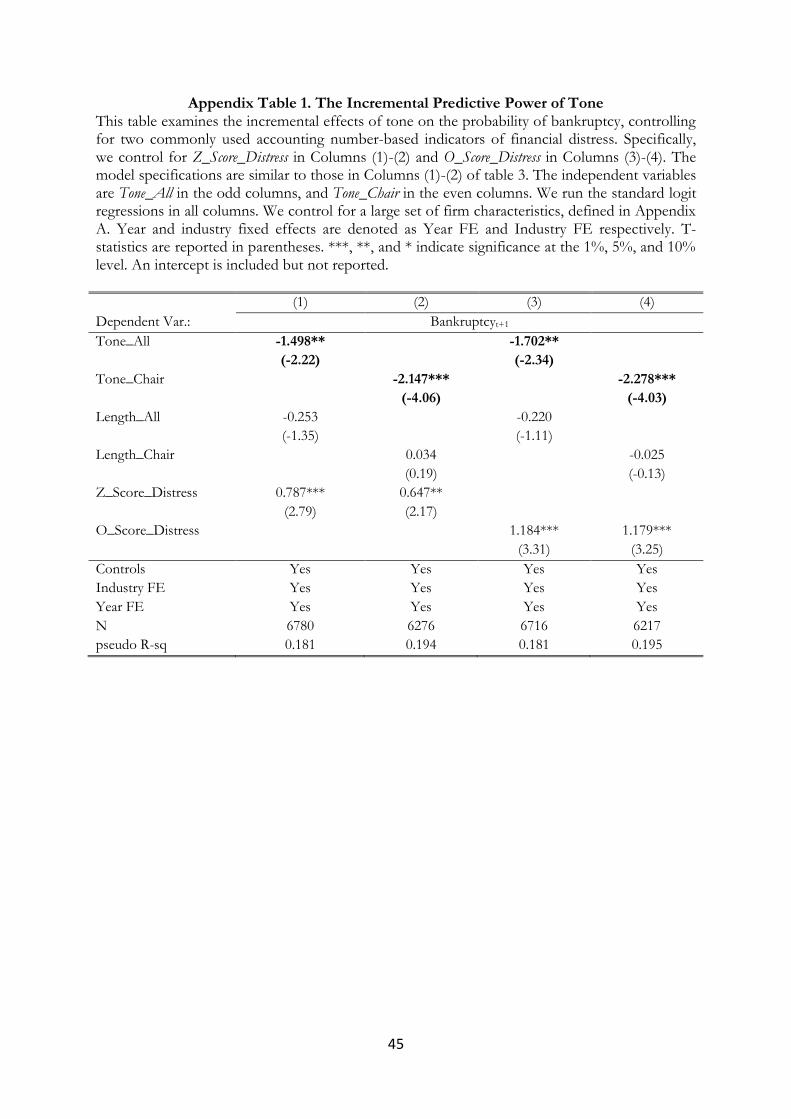
45
Appendix Table 1. The Incremental Predictive Power of Tone This table examines the incremental effects of tone on the probability of bankruptcy, controlling for two commonly used accounting number-based indicators of financial distress. Specifically, we control for Z_Score_Distress in Columns (1)-(2) and O_Score_Distress in Columns (3)-(4). The model specifications are similar to those in Columns (1)-(2) of table 3. The independent variables are Tone_All in the odd columns, and Tone_Chair in the even columns. We run the standard logit regressions in all columns. We control for a large set of firm characteristics, defined in Appendix A. Year and industry fixed effects are denoted as Year FE and Industry FE respectively. T-statistics are reported in parentheses. ***, **, and * indicate significance at the 1%, 5%, and 10% level. An intercept is included but not reported.
(1) (2) (3) (4)
Dependent Var.: Bankruptcyt+1
Tone_All -1.498** -1.702**
(-2.22) (-2.34)
Tone_Chair -2.147*** -2.278***
(-4.06) (-4.03)
Length_All -0.253 -0.220
(-1.35) (-1.11)
Length_Chair 0.034 -0.025
(0.19) (-0.13)
Z_Score_Distress 0.787*** 0.647**
(2.79) (2.17)
O_Score_Distress 1.184*** 1.179***
(3.31) (3.25)
Controls Yes Yes Yes Yes
Industry FE Yes Yes Yes Yes
Year FE Yes Yes Yes Yes
N 6780 6276 6716 6217
pseudo R-sq 0.181 0.194 0.181 0.195
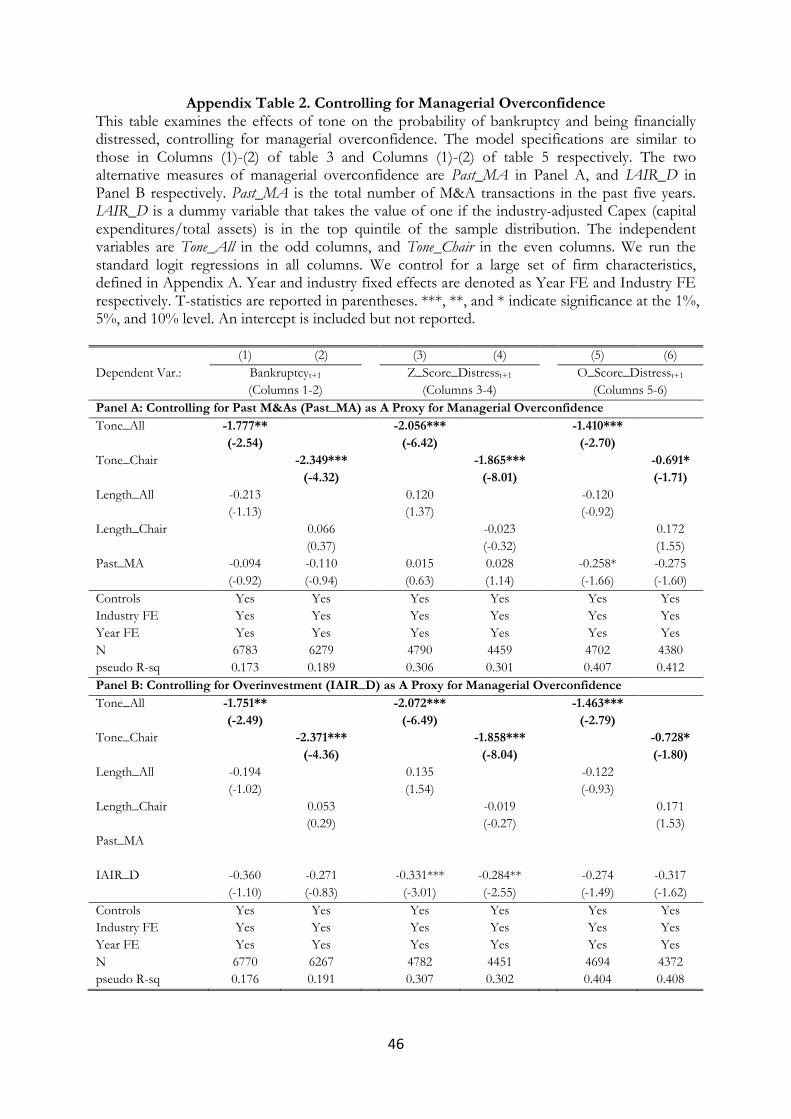
46
Appendix Table 2. Controlling for Managerial Overconfidence This table examines the effects of tone on the probability of bankruptcy and being financially distressed, controlling for managerial overconfidence. The model specifications are similar to those in Columns (1)-(2) of table 3 and Columns (1)-(2) of table 5 respectively. The two alternative measures of managerial overconfidence are Past_MA in Panel A, and IAIR_D in Panel B respectively. Past_MA is the total number of M&A transactions in the past five years. IAIR_D is a dummy variable that takes the value of one if the industry-adjusted Capex (capital expenditures/total assets) is in the top quintile of the sample distribution. The independent variables are Tone_All in the odd columns, and Tone_Chair in the even columns. We run the standard logit regressions in all columns. We control for a large set of firm characteristics, defined in Appendix A. Year and industry fixed effects are denoted as Year FE and Industry FE respectively. T-statistics are reported in parentheses. ***, **, and * indicate significance at the 1%, 5%, and 10% level. An intercept is included but not reported. (1) (2) (3) (4) (5) (6)
Dependent Var.: Bankruptcyt+1
(Columns 1-2)
Z_Score_Distresst+1
(Columns 3-4)
O_Score_Distresst+1
(Columns 5-6)
Panel A: Controlling for Past M&As (Past_MA) as A Proxy for Managerial Overconfidence
Tone_All -1.777** -2.056*** -1.410***
(-2.54) (-6.42) (-2.70)
Tone_Chair -2.349*** -1.865*** -0.691*
(-4.32) (-8.01) (-1.71)
Length_All -0.213 0.120 -0.120
(-1.13) (1.37) (-0.92)
Length_Chair 0.066 -0.023 0.172
(0.37) (-0.32) (1.55)
Past_MA -0.094 -0.110 0.015 0.028 -0.258* -0.275
(-0.92) (-0.94) (0.63) (1.14) (-1.66) (-1.60)
Controls Yes Yes Yes Yes Yes Yes
Industry FE Yes Yes Yes Yes Yes Yes
Year FE Yes Yes Yes Yes Yes Yes
N 6783 6279 4790 4459 4702 4380
pseudo R-sq 0.173 0.189 0.306 0.301 0.407 0.412
Panel B: Controlling for Overinvestment (IAIR_D) as A Proxy for Managerial Overconfidence
Tone_All -1.751** -2.072*** -1.463***
(-2.49) (-6.49) (-2.79)
Tone_Chair -2.371*** -1.858*** -0.728*
(-4.36) (-8.04) (-1.80)
Length_All -0.194 0.135 -0.122
(-1.02) (1.54) (-0.93)
Length_Chair 0.053 -0.019 0.171
(0.29) (-0.27) (1.53)
Past_MA
IAIR_D -0.360 -0.271 -0.331*** -0.284** -0.274 -0.317
(-1.10) (-0.83) (-3.01) (-2.55) (-1.49) (-1.62)
Controls Yes Yes Yes Yes Yes Yes
Industry FE Yes Yes Yes Yes Yes Yes
Year FE Yes Yes Yes Yes Yes Yes
N 6770 6267 4782 4451 4694 4372
pseudo R-sq 0.176 0.191 0.307 0.302 0.404 0.408
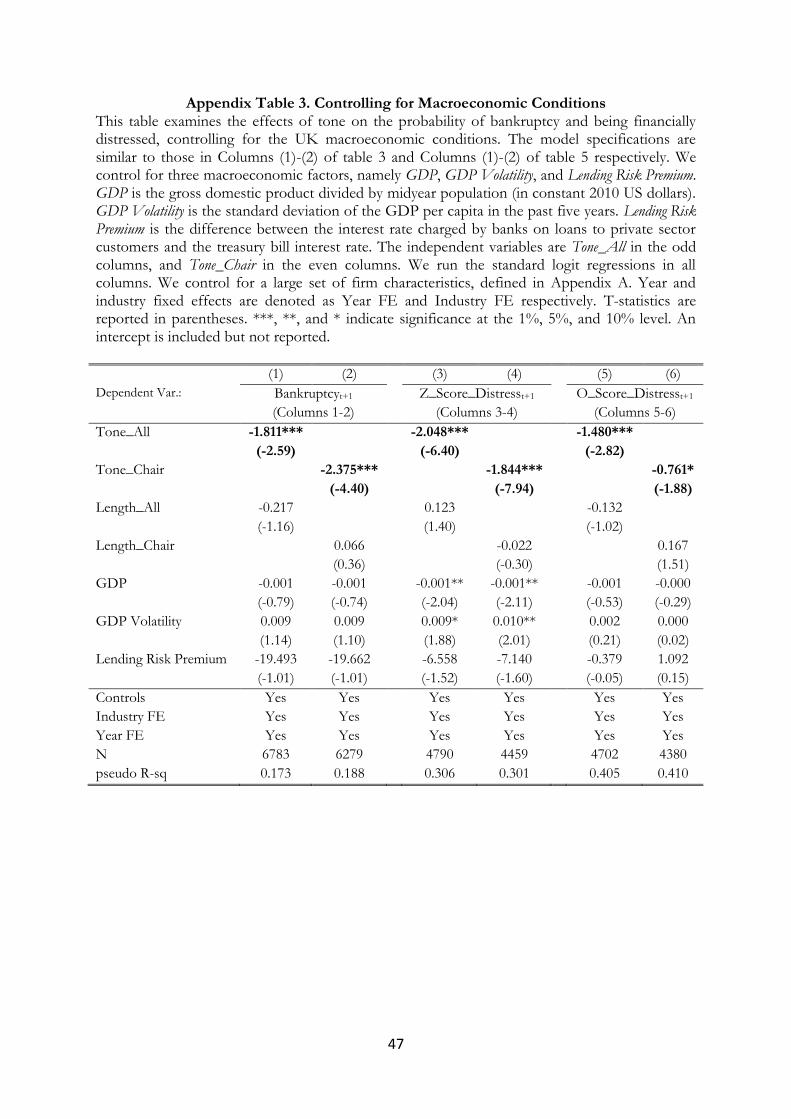
47
Appendix Table 3. Controlling for Macroeconomic Conditions This table examines the effects of tone on the probability of bankruptcy and being financially distressed, controlling for the UK macroeconomic conditions. The model specifications are similar to those in Columns (1)-(2) of table 3 and Columns (1)-(2) of table 5 respectively. We control for three macroeconomic factors, namely GDP, GDP Volatility, and Lending Risk Premium. GDP is the gross domestic product divided by midyear population (in constant 2010 US dollars). GDP Volatility is the standard deviation of the GDP per capita in the past five years. Lending Risk Premium is the difference between the interest rate charged by banks on loans to private sector customers and the treasury bill interest rate. The independent variables are Tone_All in the odd columns, and Tone_Chair in the even columns. We run the standard logit regressions in all columns. We control for a large set of firm characteristics, defined in Appendix A. Year and industry fixed effects are denoted as Year FE and Industry FE respectively. T-statistics are reported in parentheses. ***, **, and * indicate significance at the 1%, 5%, and 10% level. An intercept is included but not reported.
(1) (2) (3) (4) (5) (6)
Dependent Var.: Bankruptcyt+1
(Columns 1-2)
Z_Score_Distresst+1
(Columns 3-4)
O_Score_Distresst+1
(Columns 5-6)
Tone_All -1.811***
-2.048***
-1.480***
(-2.59)
(-6.40)
(-2.82)
Tone_Chair
-2.375***
-1.844***
-0.761*
(-4.40)
(-7.94)
(-1.88)
Length_All -0.217
0.123
-0.132
(-1.16)
(1.40)
(-1.02)
Length_Chair
0.066
-0.022
0.167
(0.36)
(-0.30)
(1.51)
GDP -0.001 -0.001 -0.001** -0.001** -0.001 -0.000
(-0.79) (-0.74) (-2.04) (-2.11) (-0.53) (-0.29)
GDP Volatility 0.009 0.009 0.009* 0.010** 0.002 0.000
(1.14) (1.10) (1.88) (2.01) (0.21) (0.02)
Lending Risk Premium -19.493 -19.662 -6.558 -7.140 -0.379 1.092
(-1.01) (-1.01) (-1.52) (-1.60) (-0.05) (0.15)
Controls Yes Yes Yes Yes Yes Yes
Industry FE Yes Yes Yes Yes Yes Yes
Year FE Yes Yes Yes Yes Yes Yes
N 6783 6279 4790 4459 4702 4380
pseudo R-sq 0.173 0.188 0.306 0.301 0.405 0.410
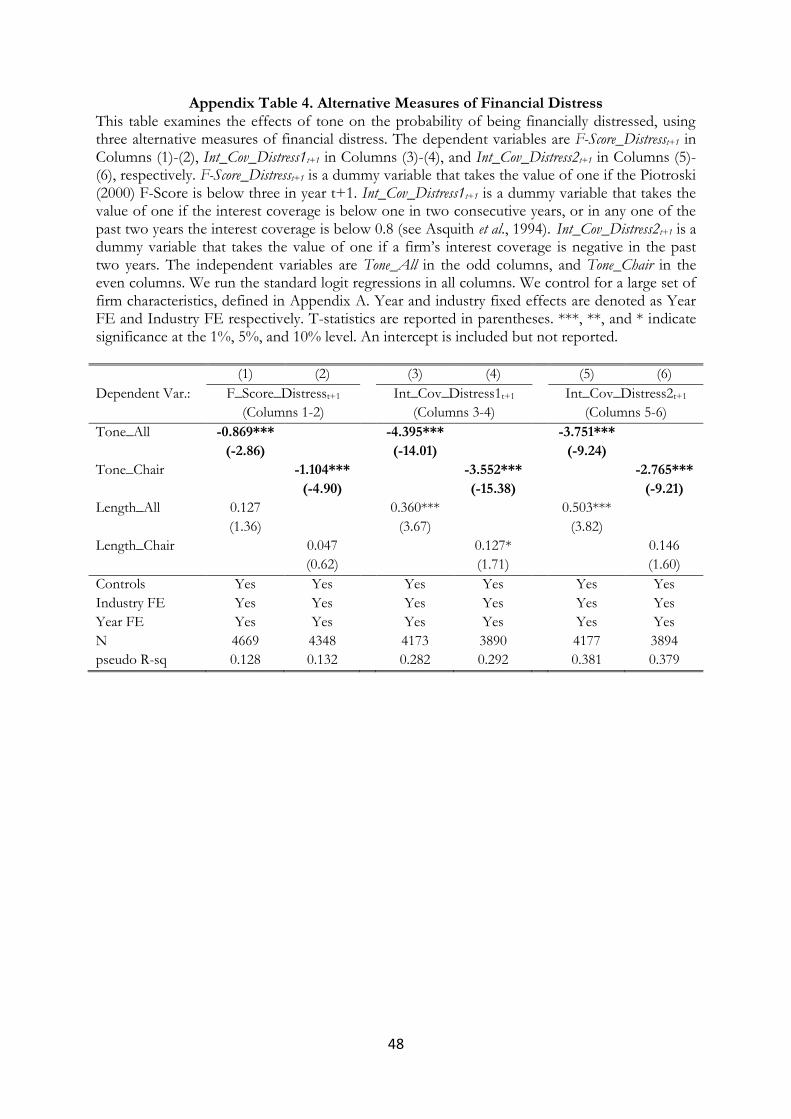
48
Appendix Table 4. Alternative Measures of Financial Distress This table examines the effects of tone on the probability of being financially distressed, using three alternative measures of financial distress. The dependent variables are F-Score_Distresst+1 in Columns (1)-(2), Int_Cov_Distress1t+1 in Columns (3)-(4), and Int_Cov_Distress2t+1 in Columns (5)-(6), respectively. F-Score_Distresst+1 is a dummy variable that takes the value of one if the Piotroski (2000) F-Score is below three in year t+1. Int_Cov_Distress1t+1 is a dummy variable that takes the value of one if the interest coverage is below one in two consecutive years, or in any one of the past two years the interest coverage is below 0.8 (see Asquith et al., 1994). Int_Cov_Distress2t+1 is a dummy variable that takes the value of one if a firm’s interest coverage is negative in the past two years. The independent variables are Tone_All in the odd columns, and Tone_Chair in the even columns. We run the standard logit regressions in all columns. We control for a large set of firm characteristics, defined in Appendix A. Year and industry fixed effects are denoted as Year FE and Industry FE respectively. T-statistics are reported in parentheses. ***, **, and * indicate significance at the 1%, 5%, and 10% level. An intercept is included but not reported.
(1) (2) (3) (4) (5) (6)
Dependent Var.: F_Score_Distresst+1
(Columns 1-2)
Int_Cov_Distress1t+1
(Columns 3-4)
Int_Cov_Distress2t+1
(Columns 5-6)
Tone_All -0.869*** -4.395*** -3.751***
(-2.86) (-14.01) (-9.24)
Tone_Chair -1.104*** -3.552*** -2.765***
(-4.90) (-15.38) (-9.21)
Length_All 0.127 0.360*** 0.503***
(1.36) (3.67) (3.82)
Length_Chair 0.047 0.127* 0.146
(0.62) (1.71) (1.60)
Controls Yes Yes Yes Yes Yes Yes
Industry FE Yes Yes Yes Yes Yes Yes
Year FE Yes Yes Yes Yes Yes Yes
N 4669 4348 4173 3890 4177 3894
pseudo R-sq 0.128 0.132 0.282 0.292 0.381 0.379