Embed Size (px)
Citation preview
East Ayrshire Council Chapter 6 – Climate Change State of the Environment Report Page 1
IronsideFarrar July 2016
EAST AYRSHIRE COUNCIL STATE OF THE ENVIRONMENT REPORT CHAPTER 6 – CLIMATE CHANGE SUMMARY Key Messages Climate Change Climate change is defined as a world-wide, long-term change in weather patterns and/or average temperatures of the planet caused by human activity. Climate change as a result of human activity and climate change adaption are potentially the most important challenges for the population at global level. International agreements have been made in order to reduce emissions of greenhouse gases. Emissions of Greenhouse Gases Current emissions of greenhouse gases per head of population in East Ayrshire are lower than the national average for Scotland. Emissions have dropped substantially since 1990 but the rate of decrease has flattened out in recent years. Future reductions are required in order to meet the Scottish Government’s international obligations which will rely on the continued growth of the renewables sector at national level. Land use changes, particularly afforestation are also likely to make an important contribution to reducing net carbon emissions. Total emissions of CO2 in 2012 from East Ayrshire were 722 ktonnes compared with
39800 ktonnes for Scotland as a whole Total greenhouse gas emissions for Scotland, including international aviation and
shipping, were estimated to be 52.9 million tonnes of CO2 equivalent (MtCO2e) implying that CO2 emissions account for about 75% of total greenhouse gas emission as CO2 equivalents.
Within East Ayrshire, road transport is the biggest source of CO2 emissions and there is only one significant point source of CO2 emissions – the Egger Barony chipboard plant in Auchinleck. Emissions from Egger Barony reduced from 598 tonnes in 2008 to 285 tonnes in 2012.
Entries in the Scottish Pollutant Release Inventory (SPRI) indicate that surface coaling has historically been an important source of emissions of CO2 and methane. During the period 2010-2014, emissions from surface coaling contributed to>20% total greenhouse gas emissions from East Ayrshire. East Ayrshire has about 2.3% of Scotland’s population but only accounts for about 1.3% of total CO2 emissions which probably reflects the low level of industrialisation, extensive carbon sinks in the form of forestry and other land uses and the absence of an international airport.
Climate Change and East Ayrshire Long term measurements of temperature and rainfall in Scotland show substantial year on year variability. In general the weather has become warmer and wetter over the last 30 years but there are no consistent trends over the last century. It seems certain that the climate will continue to change in future years. It is likely to get slightly warmer, and it is predicted that winters will become wetter and summers will become drier, although this is at odds with the trend over recent years. Renewables in East Ayrshire The onshore wind planning application visual register illustrates the number and location of wind farms in East Ayrshire that are: Operational – 4 Consented/ Under Construction – 4 Planning Applications – 5
East Ayrshire Council Chapter 6 – Climate Change State of the Environment Report Page 2
IronsideFarrar July 2016
Section 36 Applications – 6 Pre Application - 1 Scoping requests – 4 In terms of hydro schemes, according to the East Ayrshire planning portal1, there are 4 approved micro-hydro schemes, 1 approved with conditions and 1 pending a decision (data accessed 27th August 2015). Overall Trends - Climate Change There appears to be a relatively high level of certainty that the climate will become warmer during the remainder of the 21st Century but much less certainty about the predicted changes in rainfall. It is also likely that there will be an increased frequency of severe weather events. East Ayrshire will experience climate change regardless of its own future greenhouse gas emissions. Climate change will have wide ranging implications for the economy, the built and natural environment and people’s lives and whilst it is important to reduce Scotland’s contribution to the causes of global warming it is also necessary to prepare to adapt to the changes. East Ayrshire Council hosts a number of renewable energy developments including the UK’s largest windfarm at Whitelee and is therefore contributing to overall targets for renewable energy generation set by the Scottish Government. Energy generated by renewables in East Ayrshire is expected to increase when recently consented windfarm schemes become operational. State and Trend
1 http://eplanning.east-ayrshire.gov.uk/online/search.do?action=simple&searchType=Application
East Ayrshire Council Chapter 6 – Climate Change State of the Environment Report Page 3
IronsideFarrar July 2016
OVERVIEW 1.1 Greenhouse gas emissions Climate change as a result of human activity and climate change adaption are potentially the most important challenges for humankind at global level. International agreements have been made in order to reduce emissions of greenhouse gases. Water vapour is the strongest greenhouse gas but carbon dioxide (CO2) and methane are both important greenhouse gases that are mainly emitted as a result of human activity. There are also potentially large secondary effects on atmospheric concentrations of these gases as a result of decreased carbon storage in forests or the potential release of large amounts of methane from melting permafrost. The amount of CO2 in the atmosphere has increased by about 38% (as of 2012) since the Industrial Revolution. As the atmosphere warms, the amount of water vapour it holds also increases - which further adds to the warming effect. The United Nations Framework Convention on Climate Change (UNFCCC) was established in 1992 and the Kyoto Protocol - the only global international agreement on climate change - was signed in 1997. The Kyoto Protocol entered into force in February 2005. It committed the signatories to reducing their combined emissions of the six main greenhouse gases by 5.2% below 1990 levels over the period 2008-2012. The UK share of the collective Kyoto target, assumed by the European Union is an emissions reduction of 12.5%. Scottish Ministers joined the UK Delegation to the annual UNFCCC Conference of Parties at Cancun, Mexico in December 2010. The "Cancun Agreements" maintain momentum towards a legally binding global agreement to succeed the Kyoto Protocol. The Climate Change (Scotland) Act 2009 introduced legislation to reduce emissions of greenhouse gases in Scotland by at least 80% by 2050. The Government intends that renewable sources will generate the equivalent of 100% of Scotland's gross annual electricity consumption and 11% of Scotland's heat demand by 2020. 1.2 Climate Change The Intergovernmental Panel on Climate Change (IPCC, 2013)2 reported that there is a strengthened body of evidence that humans are almost certainly influencing the climate and reducing global greenhouse gas emissions is the only way to limit the extent of future climate change. The report shows that: Atmospheric concentrations of CO2, methane, and nitrous oxide are at their highest
levels for at least 800,000 years. Global temperatures rose by 0.9°C between 1880 and 2012 and it is extremely likely that
greenhouse gas emissions as a result of human activity have caused more than half the warming seen since the middle of the 20th century.
Warming already taking place means that global sea levels will continue to rise and extreme climate and weather events can be expected to increase in scale and frequency over the coming decades. Without significant reductions in emissions, global temperatures are likely to rise by at least 2°C above pre-industrial levels and could be as much as 5°C higher by the end of this century.
Climate change is becoming more evident from rising temperatures, rising sea levels, melting sea ice and glaciers, and an increasing frequency and intensity of extreme events such as heat-waves and heavy precipitation. Sea levels have already risen by about 0.2 m since 1901 and this rise is accelerating, while Arctic sea ice cover in the summer has reduced by up to 40% since 1979.
2 Climate Change 2013: The Physical Science Basis was published by the IPCC in September 2013.
East Ayrshire Council Chapter 6 – Climate Change State of the Environment Report Page 4
IronsideFarrar July 2016
The odds of many extreme climate and weather events have already shortened owing to greenhouse gas emissions and the risks of such extreme events, especially heat waves and heavy rainfall, are expected to increase further in coming decades in most regions of the world. Global average sea level is predicted to be between 0.26 and 0.82 m higher than now (1986 to 2005) by the end of this century and will continue to rise for centuries to come.
The Met Office (December 2014)3 have announced that 2014 is likely to be the warmest year on record, both globally and for the UK. The global mean temperature for January to October based on the HadCRUT4 dataset
(compiled by the Met Office and the University of East Anglia's Climate Research Unit) is 0.57°C (±0.1) above the long-term (1961-1990) average of 14.00°C. This is consistent with the statement from the World Meteorological Organization (WMO).
Previously, the record was 0.56°C set in 2010 against the global series which dates back to 1850.
Global average sea-surface temperatures in 2014 were unusually warm, particularly in the latter half of the year. For the UK, the mean temperature from 1 January to 25 November was 1.6°C above the long term (1961-1990) average. 2014 was also one of the warmest on record in the Central England Temperature (CET) series, which goes back to 1659.
The Met Office consider that the evidence for the influence of human emissions of greenhouse gases on 2014’s likely global mean surface temperature record is irrefutable. Even for the UK itself, the current record temperatures have been shown to be 10 times more likely to have arisen because of human activities than as a result of natural variability. Information on climate change specific to East Ayrshire is not readily available and the discussion in this chapter is based on predicted future trends for “West of Scotland”.
3 http://www.metoffice.gov.uk/research/news/2014-temperatures
East Ayrshire Council Chapter 6 – Climate Change State of the Environment Report Page 5
IronsideFarrar July 2016
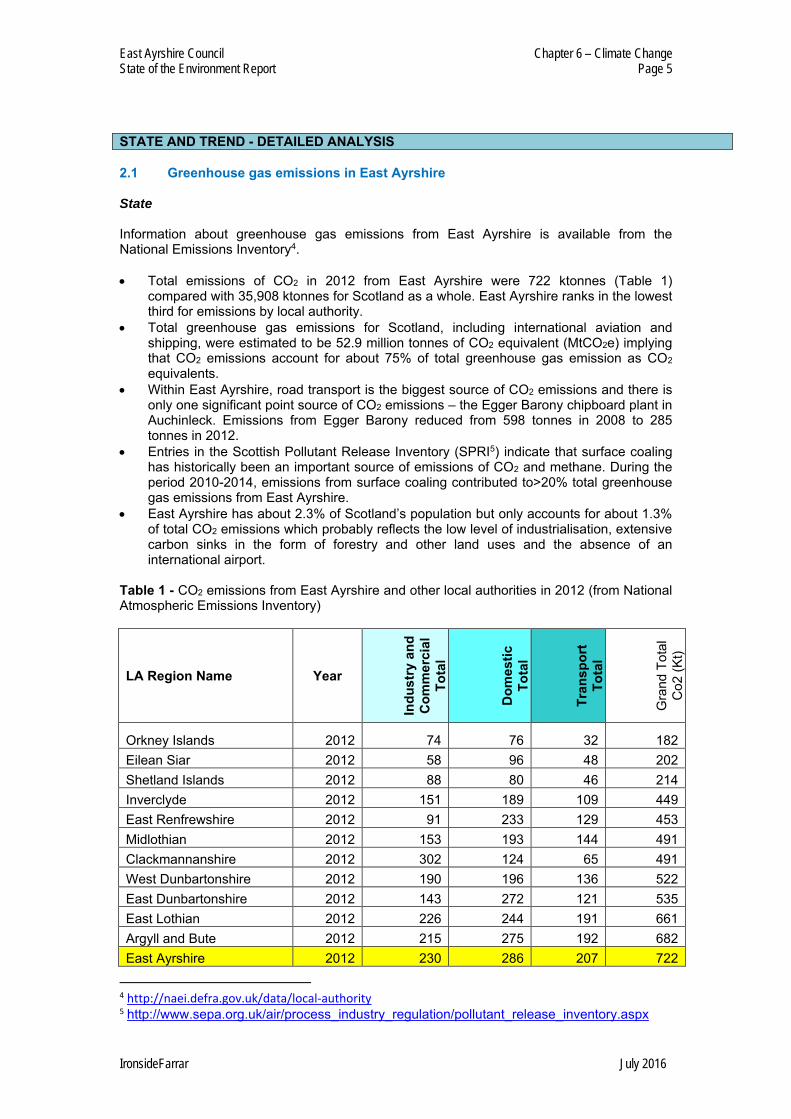
STATE AND TREND - DETAILED ANALYSIS 2.1 Greenhouse gas emissions in East Ayrshire State Information about greenhouse gas emissions from East Ayrshire is available from the National Emissions Inventory4. Total emissions of CO2 in 2012 from East Ayrshire were 722 ktonnes (Table 1)
compared with 35,908 ktonnes for Scotland as a whole. East Ayrshire ranks in the lowest third for emissions by local authority.
Total greenhouse gas emissions for Scotland, including international aviation and shipping, were estimated to be 52.9 million tonnes of CO2 equivalent (MtCO2e) implying that CO2 emissions account for about 75% of total greenhouse gas emission as CO2 equivalents.
Within East Ayrshire, road transport is the biggest source of CO2 emissions and there is only one significant point source of CO2 emissions – the Egger Barony chipboard plant in Auchinleck. Emissions from Egger Barony reduced from 598 tonnes in 2008 to 285 tonnes in 2012.
Entries in the Scottish Pollutant Release Inventory (SPRI5) indicate that surface coaling has historically been an important source of emissions of CO2 and methane. During the period 2010-2014, emissions from surface coaling contributed to>20% total greenhouse gas emissions from East Ayrshire.
East Ayrshire has about 2.3% of Scotland’s population but only accounts for about 1.3% of total CO2 emissions which probably reflects the low level of industrialisation, extensive carbon sinks in the form of forestry and other land uses and the absence of an international airport.
Table 1 - CO2 emissions from East Ayrshire and other local authorities in 2012 (from National Atmospheric Emissions Inventory)
4 http://naei.defra.gov.uk/data/local-authority 5 http://www.sepa.org.uk/air/process_industry_regulation/pollutant_release_inventory.aspx
LA Region Name Year
Indu
stry
and
C
omm
erci
al
Tota
l
Dom
estic
To
tal
Tran
spor
t To
tal
Gra
nd T
otal
C
o2 (K
t)
Orkney Islands 2012 74 76 32 182 Eilean Siar 2012 58 96 48 202 Shetland Islands 2012 88 80 46 214 Inverclyde 2012 151 189 109 449 East Renfrewshire 2012 91 233 129 453 Midlothian 2012 153 193 144 491 Clackmannanshire 2012 302 124 65 491 West Dunbartonshire 2012 190 196 136 522 East Dunbartonshire 2012 143 272 121 535 East Lothian 2012 226 244 191 661 Argyll and Bute 2012 215 275 192 682 East Ayrshire 2012 230 286 207 722
East Ayrshire Council Chapter 6 – Climate Change State of the Environment Report Page 6
IronsideFarrar July 2016
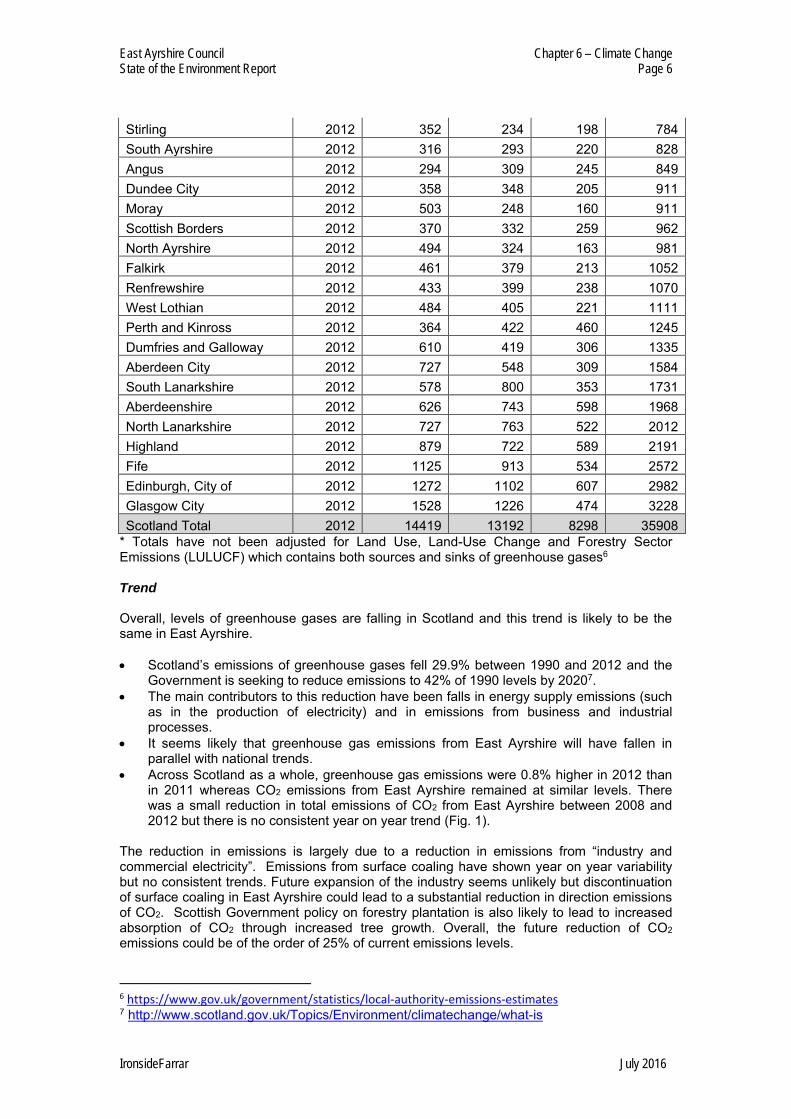
* Totals have not been adjusted for Land Use, Land-Use Change and Forestry Sector Emissions (LULUCF) which contains both sources and sinks of greenhouse gases6 Trend Overall, levels of greenhouse gases are falling in Scotland and this trend is likely to be the same in East Ayrshire. Scotland’s emissions of greenhouse gases fell 29.9% between 1990 and 2012 and the
Government is seeking to reduce emissions to 42% of 1990 levels by 20207. The main contributors to this reduction have been falls in energy supply emissions (such
as in the production of electricity) and in emissions from business and industrial processes.
It seems likely that greenhouse gas emissions from East Ayrshire will have fallen in parallel with national trends.
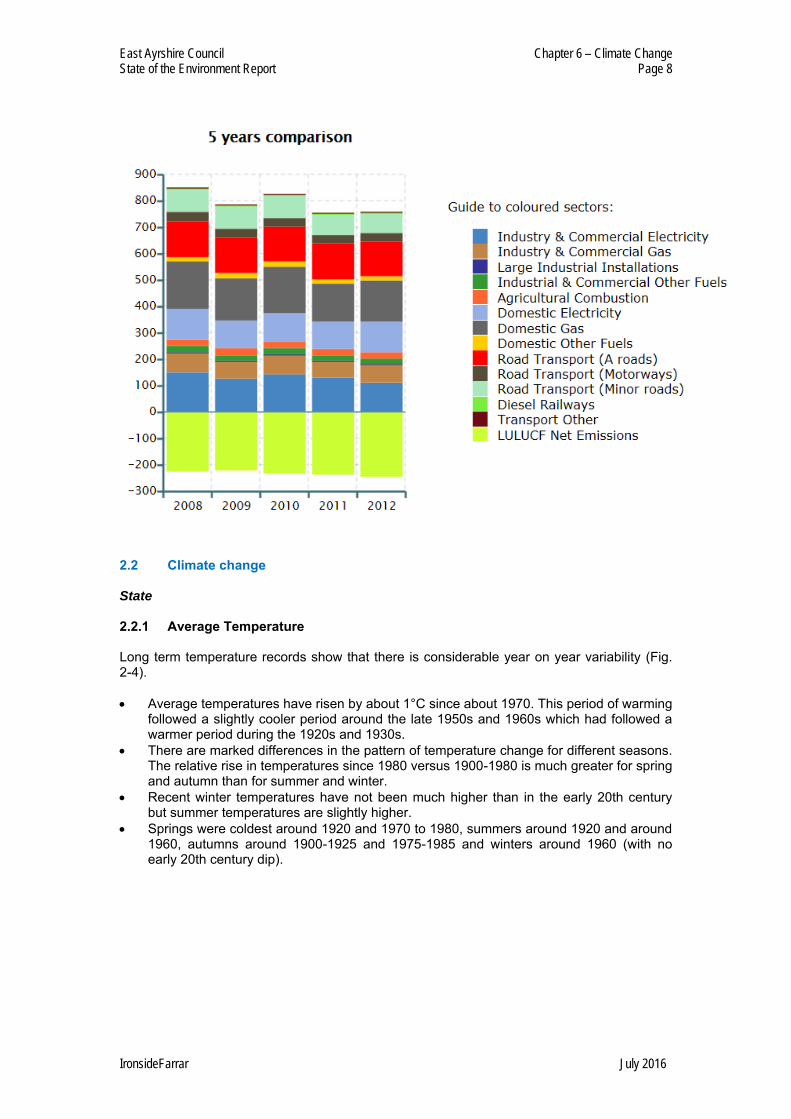
Across Scotland as a whole, greenhouse gas emissions were 0.8% higher in 2012 than in 2011 whereas CO2 emissions from East Ayrshire remained at similar levels. There was a small reduction in total emissions of CO2 from East Ayrshire between 2008 and 2012 but there is no consistent year on year trend (Fig. 1).
The reduction in emissions is largely due to a reduction in emissions from “industry and commercial electricity”. Emissions from surface coaling have shown year on year variability but no consistent trends. Future expansion of the industry seems unlikely but discontinuation of surface coaling in East Ayrshire could lead to a substantial reduction in direction emissions of CO2. Scottish Government policy on forestry plantation is also likely to lead to increased absorption of CO2 through increased tree growth. Overall, the future reduction of CO2 emissions could be of the order of 25% of current emissions levels.
6 https://www.gov.uk/government/statistics/local-authority-emissions-estimates 7 http://www.scotland.gov.uk/Topics/Environment/climatechange/what-is
Stirling 2012 352 234 198 784 South Ayrshire 2012 316 293 220 828 Angus 2012 294 309 245 849 Dundee City 2012 358 348 205 911 Moray 2012 503 248 160 911 Scottish Borders 2012 370 332 259 962 North Ayrshire 2012 494 324 163 981 Falkirk 2012 461 379 213 1052 Renfrewshire 2012 433 399 238 1070 West Lothian 2012 484 405 221 1111 Perth and Kinross 2012 364 422 460 1245 Dumfries and Galloway 2012 610 419 306 1335 Aberdeen City 2012 727 548 309 1584 South Lanarkshire 2012 578 800 353 1731 Aberdeenshire 2012 626 743 598 1968 North Lanarkshire 2012 727 763 522 2012 Highland 2012 879 722 589 2191 Fife 2012 1125 913 534 2572 Edinburgh, City of 2012 1272 1102 607 2982 Glasgow City 2012 1528 1226 474 3228 Scotland Total 2012 14419 13192 8298 35908
East Ayrshire Council Chapter 6 – Climate Change State of the Environment Report Page 7
IronsideFarrar July 2016
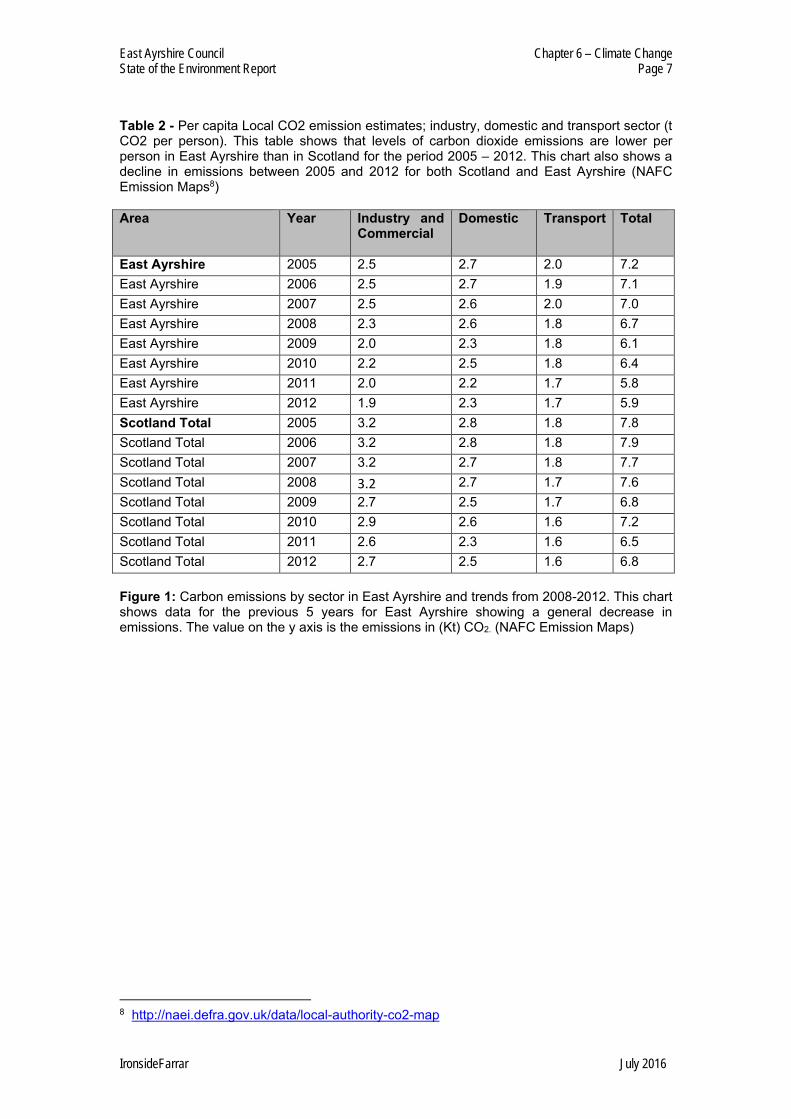
Table 2 - Per capita Local CO2 emission estimates; industry, domestic and transport sector (t CO2 per person). This table shows that levels of carbon dioxide emissions are lower per person in East Ayrshire than in Scotland for the period 2005 – 2012. This chart also shows a decline in emissions between 2005 and 2012 for both Scotland and East Ayrshire (NAFC Emission Maps8) Area Year Industry and
Commercial Domestic Transport Total
East Ayrshire 2005 2.5 2.7 2.0 7.2 East Ayrshire 2006 2.5 2.7 1.9 7.1 East Ayrshire 2007 2.5 2.6 2.0 7.0 East Ayrshire 2008 2.3 2.6 1.8 6.7 East Ayrshire 2009 2.0 2.3 1.8 6.1 East Ayrshire 2010 2.2 2.5 1.8 6.4 East Ayrshire 2011 2.0 2.2 1.7 5.8 East Ayrshire 2012 1.9 2.3 1.7 5.9 Scotland Total 2005 3.2 2.8 1.8 7.8 Scotland Total 2006 3.2 2.8 1.8 7.9 Scotland Total 2007 3.2 2.7 1.8 7.7 Scotland Total 2008 3.2 2.7 1.7 7.6 Scotland Total 2009 2.7 2.5 1.7 6.8 Scotland Total 2010 2.9 2.6 1.6 7.2 Scotland Total 2011 2.6 2.3 1.6 6.5 Scotland Total 2012 2.7 2.5 1.6 6.8 Figure 1: Carbon emissions by sector in East Ayrshire and trends from 2008-2012. This chart shows data for the previous 5 years for East Ayrshire showing a general decrease in emissions. The value on the y axis is the emissions in (Kt) CO2. (NAFC Emission Maps)
8 http://naei.defra.gov.uk/data/local-authority-co2-map
East Ayrshire Council Chapter 6 – Climate Change State of the Environment Report Page 8
IronsideFarrar July 2016
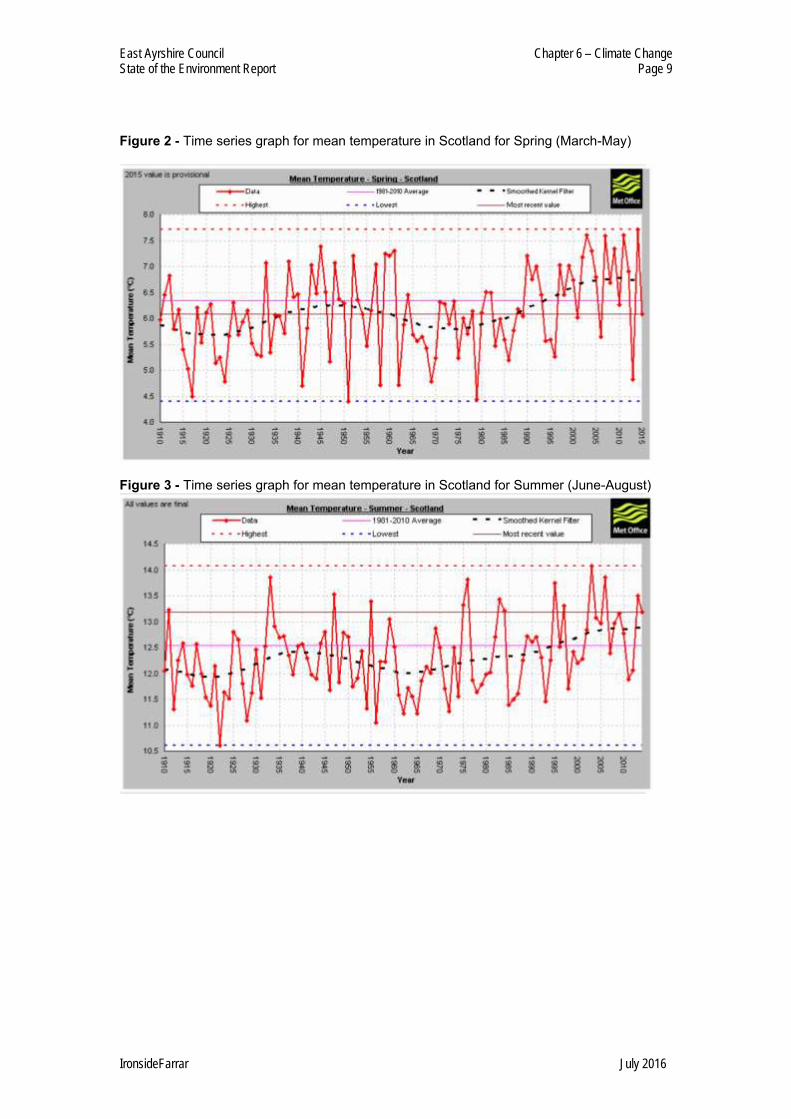
2.2 Climate change State 2.2.1 Average Temperature Long term temperature records show that there is considerable year on year variability (Fig. 2-4). Average temperatures have risen by about 1°C since about 1970. This period of warming
followed a slightly cooler period around the late 1950s and 1960s which had followed a warmer period during the 1920s and 1930s.
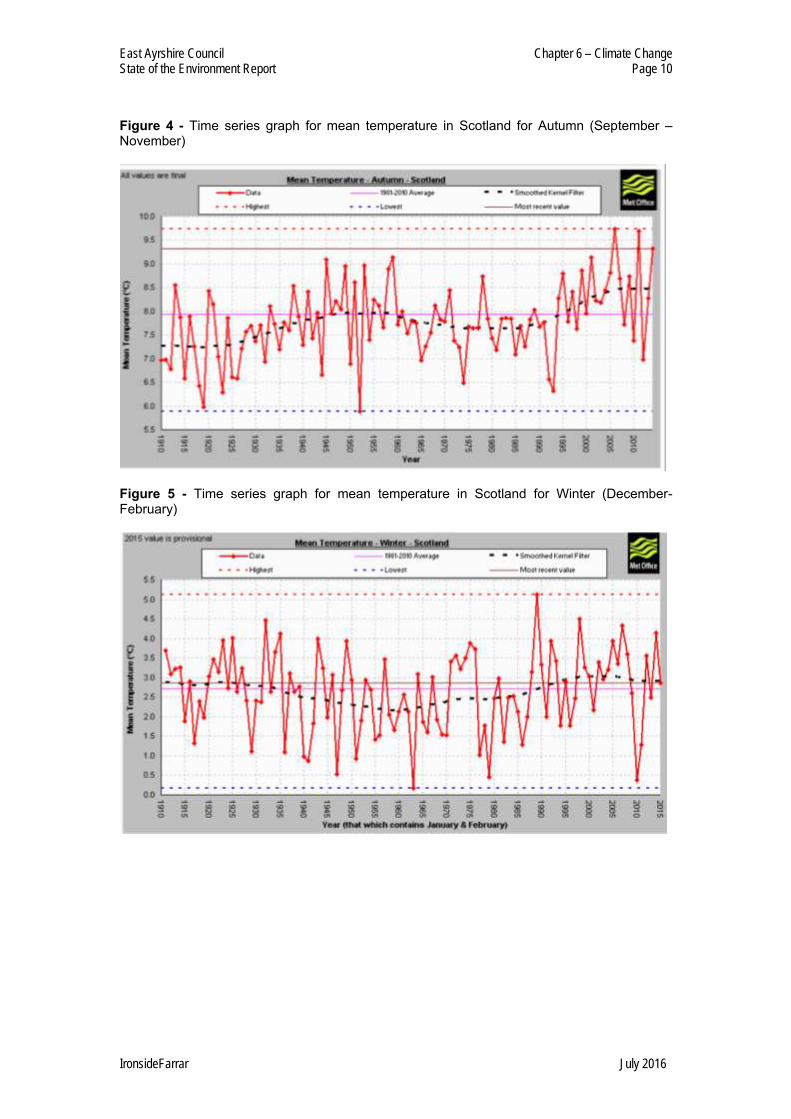
There are marked differences in the pattern of temperature change for different seasons. The relative rise in temperatures since 1980 versus 1900-1980 is much greater for spring and autumn than for summer and winter.
Recent winter temperatures have not been much higher than in the early 20th century but summer temperatures are slightly higher.
Springs were coldest around 1920 and 1970 to 1980, summers around 1920 and around 1960, autumns around 1900-1925 and 1975-1985 and winters around 1960 (with no early 20th century dip).
East Ayrshire Council Chapter 6 – Climate Change State of the Environment Report Page 9
IronsideFarrar July 2016
Figure 2 - Time series graph for mean temperature in Scotland for Spring (March-May)
Figure 3 - Time series graph for mean temperature in Scotland for Summer (June-August)
East Ayrshire Council Chapter 6 – Climate Change State of the Environment Report Page 10
IronsideFarrar July 2016
Figure 4 - Time series graph for mean temperature in Scotland for Autumn (September – November)
Figure 5 - Time series graph for mean temperature in Scotland for Winter (December-February)
East Ayrshire Council Chapter 6 – Climate Change State of the Environment Report Page 11
IronsideFarrar July 2016
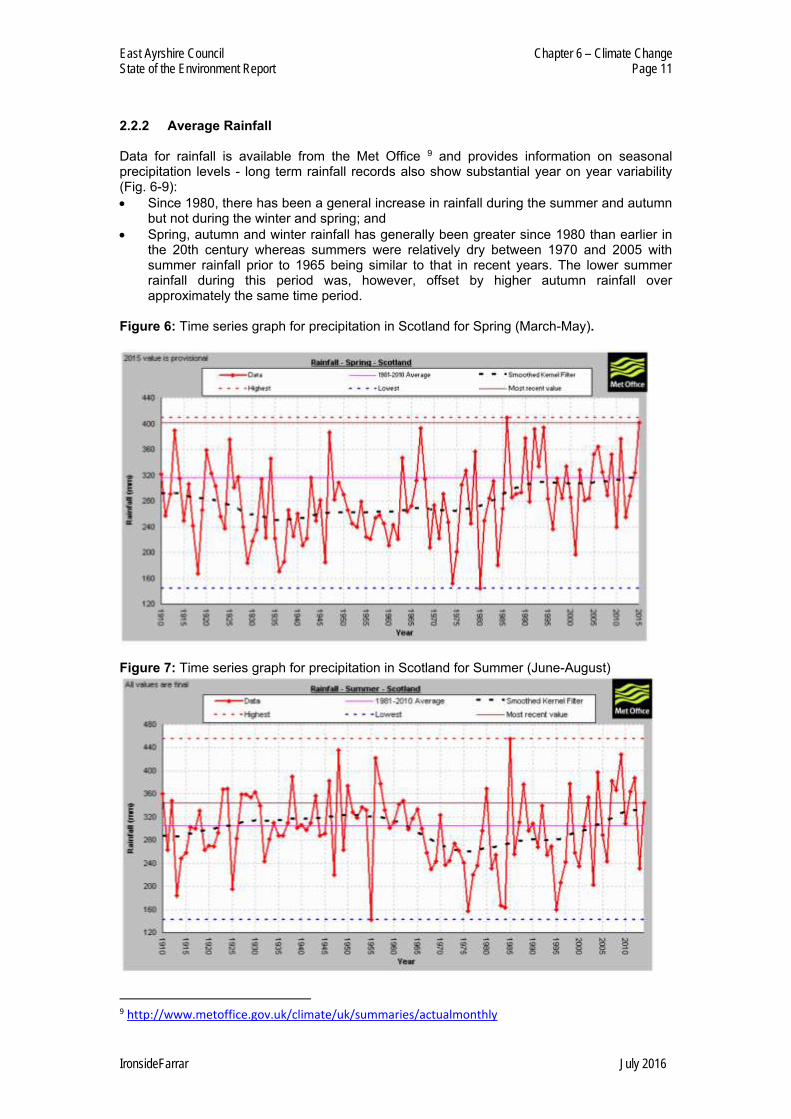
2.2.2 Average Rainfall Data for rainfall is available from the Met Office 9 and provides information on seasonal precipitation levels - long term rainfall records also show substantial year on year variability (Fig. 6-9): Since 1980, there has been a general increase in rainfall during the summer and autumn
but not during the winter and spring; and Spring, autumn and winter rainfall has generally been greater since 1980 than earlier in
the 20th century whereas summers were relatively dry between 1970 and 2005 with summer rainfall prior to 1965 being similar to that in recent years. The lower summer rainfall during this period was, however, offset by higher autumn rainfall over approximately the same time period.
Figure 6: Time series graph for precipitation in Scotland for Spring (March-May).
Figure 7: Time series graph for precipitation in Scotland for Summer (June-August)
9 http://www.metoffice.gov.uk/climate/uk/summaries/actualmonthly
East Ayrshire Council Chapter 6 – Climate Change State of the Environment Report Page 12
IronsideFarrar July 2016
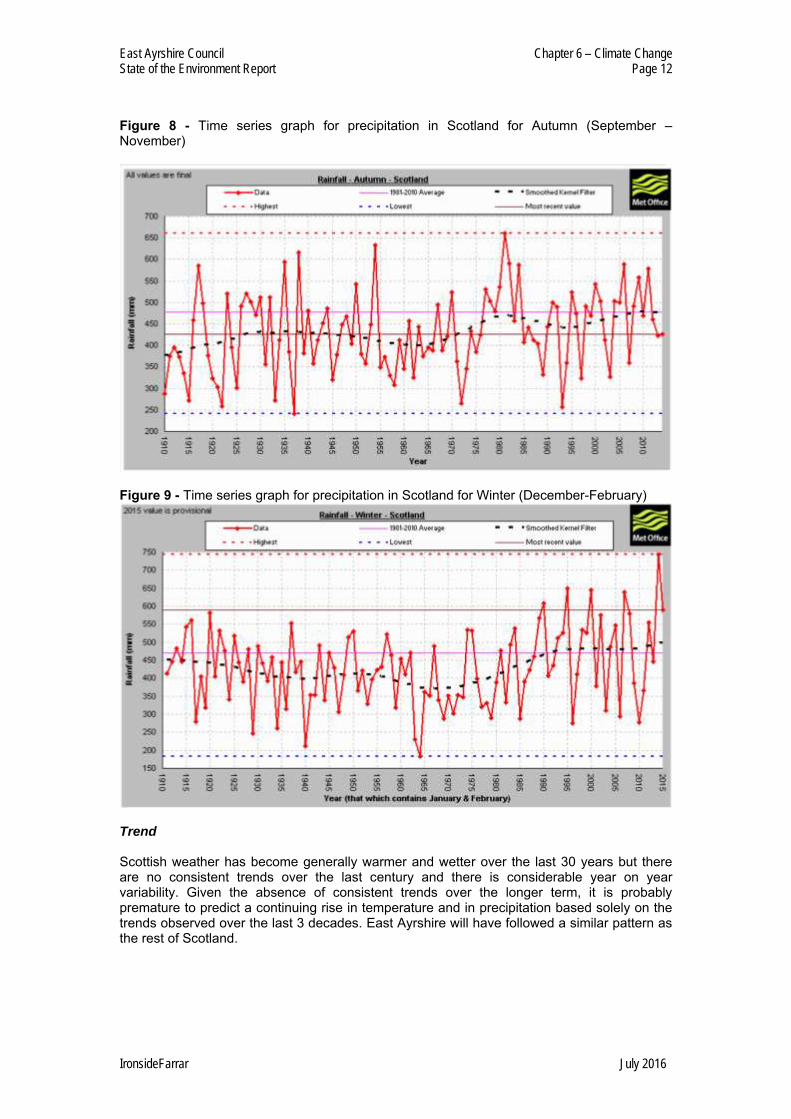
Figure 8 - Time series graph for precipitation in Scotland for Autumn (September – November)
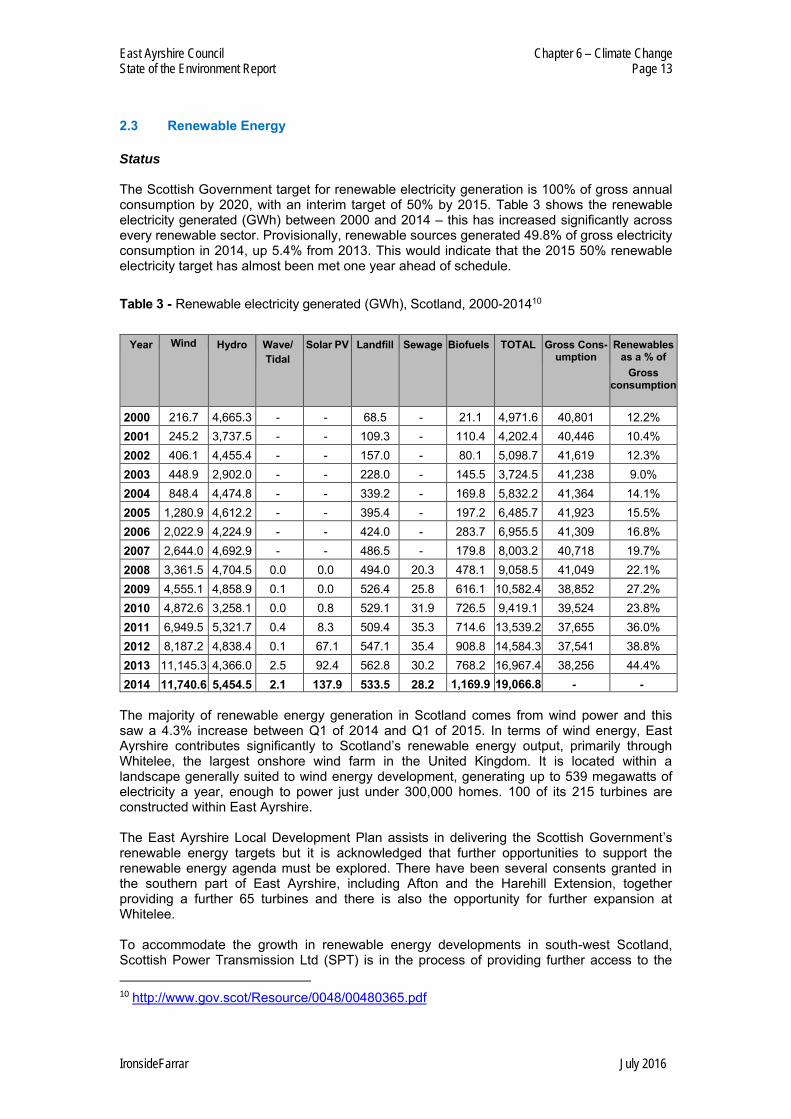
Figure 9 - Time series graph for precipitation in Scotland for Winter (December-February)
Trend Scottish weather has become generally warmer and wetter over the last 30 years but there are no consistent trends over the last century and there is considerable year on year variability. Given the absence of consistent trends over the longer term, it is probably premature to predict a continuing rise in temperature and in precipitation based solely on the trends observed over the last 3 decades. East Ayrshire will have followed a similar pattern as the rest of Scotland.
East Ayrshire Council Chapter 6 – Climate Change State of the Environment Report Page 13
IronsideFarrar July 2016
2.3 Renewable Energy Status The Scottish Government target for renewable electricity generation is 100% of gross annual consumption by 2020, with an interim target of 50% by 2015. Table 3 shows the renewable electricity generated (GWh) between 2000 and 2014 – this has increased significantly across every renewable sector. Provisionally, renewable sources generated 49.8% of gross electricity consumption in 2014, up 5.4% from 2013. This would indicate that the 2015 50% renewable electricity target has almost been met one year ahead of schedule. Table 3 - Renewable electricity generated (GWh), Scotland, 2000-201410
Year Wind Hydro Wave/ Tidal
Solar PV Landfill Sewage Biofuels TOTAL Gross Cons-umption
Renewables as a % of
Gross consumption
2000 216.7 4,665.3 - - 68.5 - 21.1 4,971.6 40,801 12.2% 2001 245.2 3,737.5 - - 109.3 - 110.4 4,202.4 40,446 10.4% 2002 406.1 4,455.4 - - 157.0 - 80.1 5,098.7 41,619 12.3% 2003 448.9 2,902.0 - - 228.0 - 145.5 3,724.5 41,238 9.0% 2004 848.4 4,474.8 - - 339.2 - 169.8 5,832.2 41,364 14.1% 2005 1,280.9 4,612.2 - - 395.4 - 197.2 6,485.7 41,923 15.5% 2006 2,022.9 4,224.9 - - 424.0 - 283.7 6,955.5 41,309 16.8% 2007 2,644.0 4,692.9 - - 486.5 - 179.8 8,003.2 40,718 19.7% 2008 3,361.5 4,704.5 0.0 0.0 494.0 20.3 478.1 9,058.5 41,049 22.1% 2009 4,555.1 4,858.9 0.1 0.0 526.4 25.8 616.1 10,582.4 38,852 27.2% 2010 4,872.6 3,258.1 0.0 0.8 529.1 31.9 726.5 9,419.1 39,524 23.8% 2011 6,949.5 5,321.7 0.4 8.3 509.4 35.3 714.6 13,539.2 37,655 36.0% 2012 8,187.2 4,838.4 0.1 67.1 547.1 35.4 908.8 14,584.3 37,541 38.8% 2013 11,145.3 4,366.0 2.5 92.4 562.8 30.2 768.2 16,967.4 38,256 44.4% 2014 11,740.6 5,454.5 2.1 137.9 533.5 28.2 1,169.9 19,066.8 - -
The majority of renewable energy generation in Scotland comes from wind power and this saw a 4.3% increase between Q1 of 2014 and Q1 of 2015. In terms of wind energy, East Ayrshire contributes significantly to Scotland’s renewable energy output, primarily through Whitelee, the largest onshore wind farm in the United Kingdom. It is located within a landscape generally suited to wind energy development, generating up to 539 megawatts of electricity a year, enough to power just under 300,000 homes. 100 of its 215 turbines are constructed within East Ayrshire. The East Ayrshire Local Development Plan assists in delivering the Scottish Government’s renewable energy targets but it is acknowledged that further opportunities to support the renewable energy agenda must be explored. There have been several consents granted in the southern part of East Ayrshire, including Afton and the Harehill Extension, together providing a further 65 turbines and there is also the opportunity for further expansion at Whitelee. To accommodate the growth in renewable energy developments in south-west Scotland, Scottish Power Transmission Ltd (SPT) is in the process of providing further access to the 10 http://www.gov.scot/Resource/0048/00480365.pdf
East Ayrshire Council Chapter 6 – Climate Change State of the Environment Report Page 14
IronsideFarrar July 2016
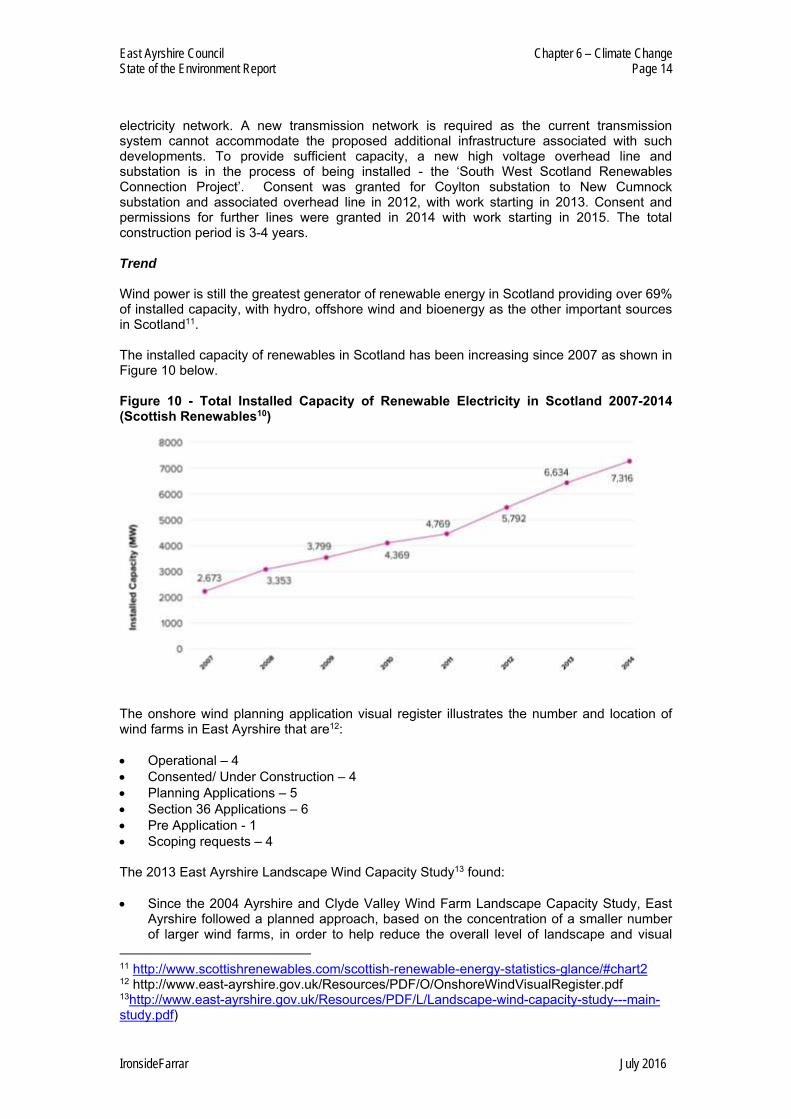
electricity network. A new transmission network is required as the current transmission system cannot accommodate the proposed additional infrastructure associated with such developments. To provide sufficient capacity, a new high voltage overhead line and substation is in the process of being installed - the ‘South West Scotland Renewables Connection Project’. Consent was granted for Coylton substation to New Cumnock substation and associated overhead line in 2012, with work starting in 2013. Consent and permissions for further lines were granted in 2014 with work starting in 2015. The total construction period is 3-4 years. Trend Wind power is still the greatest generator of renewable energy in Scotland providing over 69% of installed capacity, with hydro, offshore wind and bioenergy as the other important sources in Scotland11. The installed capacity of renewables in Scotland has been increasing since 2007 as shown in Figure 10 below. Figure 10 - Total Installed Capacity of Renewable Electricity in Scotland 2007-2014 (Scottish Renewables10)
The onshore wind planning application visual register illustrates the number and location of wind farms in East Ayrshire that are12: Operational – 4 Consented/ Under Construction – 4 Planning Applications – 5 Section 36 Applications – 6 Pre Application - 1 Scoping requests – 4 The 2013 East Ayrshire Landscape Wind Capacity Study13 found: Since the 2004 Ayrshire and Clyde Valley Wind Farm Landscape Capacity Study, East
Ayrshire followed a planned approach, based on the concentration of a smaller number of larger wind farms, in order to help reduce the overall level of landscape and visual
11 http://www.scottishrenewables.com/scottish-renewable-energy-statistics-glance/#chart2 12 http://www.east-ayrshire.gov.uk/Resources/PDF/O/OnshoreWindVisualRegister.pdf 13http://www.east-ayrshire.gov.uk/Resources/PDF/L/Landscape-wind-capacity-study---main-study.pdf)
East Ayrshire Council Chapter 6 – Climate Change State of the Environment Report Page 15
IronsideFarrar July 2016
impact. However, interest in single and smaller turbines has significantly increased in East Ayrshire, largely as a result of the Feed-In Tariff - a UK Government scheme set up to encourage uptake of a range of small-scale renewable and low-carbon electricity generation technologies. The tariffs are currently under review with larger schemes likely to be most affected by changes which may reduce the number of projects brought forward.
There is some limited scope to site additional wind farm development with turbines above 50m height within upland areas of East Ayrshire although this will be limited by potential cumulative and other landscape and visual constraints.
There is no scope to accommodate turbines above 50m height within the smaller scale, well-settled lowlands and valleys due to their increased landscape sensitivity to tall turbines, including potential cumulative effects with wind farm development in adjacent upland areas.
In terms of hydro schemes, according to the East Ayrshire planning portal14, there are 4 approved micro-hydro schemes, 1 approved with conditions and 1 pending a decision. PRESSURES Anthropogenic climate change is a global scale issue with global pressures. The primary man-made pressure is the increase in greenhouse gas emissions in the atmosphere from the burning of fossil fuels. 3.1 Future climate change in West of Scotland The Met Office website provides information on the projected changes in the climate of West Scotland based on UKCP09 emissions scenarios15. UKCP09 is the fifth generation of climate change information for the UK, and its
projections are based on a methodology designed by the Met Office. UKCP09 reflects current understanding of how the climate system operates, how it might
change in the future, and allows a measure of the uncertainty in future climate projections to be included.
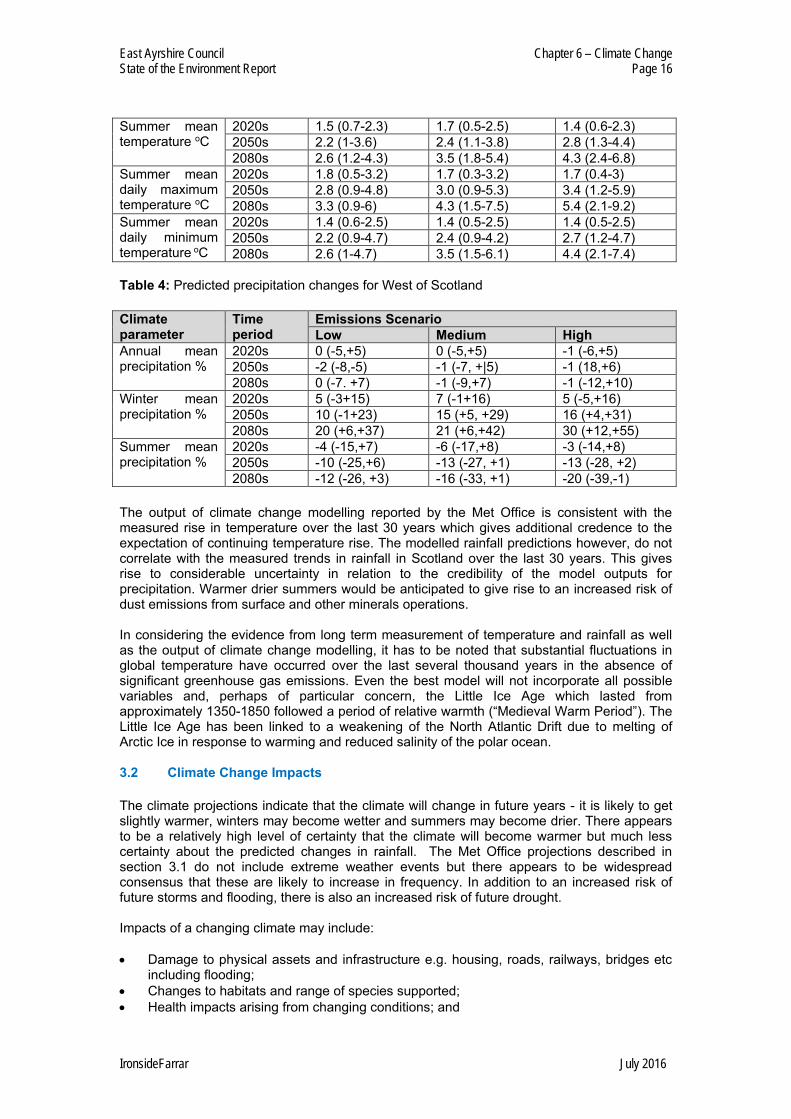
Tables 3 and 4 show the summary outcomes (medium estimate and 90th percentile confidence limits) for temperature and precipitation relative to a 1960-1991 baseline for low, medium and high emissions scenarios. These projections show a progressive increase in mean temperature of about 3oC per century with a slightly greater increase in mean summer temperature than in mean winter temperature.
The projections for rainfall show a possible slight decrease in annual mean precipitation but with a marked change in the seasonal distribution of rainfall. Winter precipitation is predicted to increase by about 20-30% over a century whereas summer precipitation is predicted to reduce by about 20% over a century. There is substantially more uncertainty in the rainfall projections than in the temperature projections such that winters may not become much wetter than at present and summers could become marginally wetter rather than drier.
Table 3: Predicted temperature changes for West of Scotland Climate parameter
Time period
Emissions Scenario Low Medium High
Winter mean temperature oC
2020s 1.2 (0.4-2) 1.2 (0.5-2) 1.1 (0.3-2) 2050s 1.8 (0.8-2.8) 2.0 (1-3) 2.2 (1.2-3.3) 2080s 2.3 (1.3-3.6) 2.6 (1.4-4) 3.1 (1.9-4.8)
14 http://eplanning.east-ayrshire.gov.uk/online/search.do?action=simple&searchType=Application 15 http://ukclimateprojections.metoffice.gov.uk/21708
East Ayrshire Council Chapter 6 – Climate Change State of the Environment Report Page 16
IronsideFarrar July 2016
Summer mean temperature oC
2020s 1.5 (0.7-2.3) 1.7 (0.5-2.5) 1.4 (0.6-2.3) 2050s 2.2 (1-3.6) 2.4 (1.1-3.8) 2.8 (1.3-4.4) 2080s 2.6 (1.2-4.3) 3.5 (1.8-5.4) 4.3 (2.4-6.8)
Summer mean daily maximum temperature oC
2020s 1.8 (0.5-3.2) 1.7 (0.3-3.2) 1.7 (0.4-3) 2050s 2.8 (0.9-4.8) 3.0 (0.9-5.3) 3.4 (1.2-5.9) 2080s 3.3 (0.9-6) 4.3 (1.5-7.5) 5.4 (2.1-9.2)
Summer mean daily minimum temperature oC
2020s 1.4 (0.6-2.5) 1.4 (0.5-2.5) 1.4 (0.5-2.5) 2050s 2.2 (0.9-4.7) 2.4 (0.9-4.2) 2.7 (1.2-4.7) 2080s 2.6 (1-4.7) 3.5 (1.5-6.1) 4.4 (2.1-7.4)
Table 4: Predicted precipitation changes for West of Scotland Climate parameter
Time period
Emissions Scenario Low Medium High
Annual mean precipitation %
2020s 0 (-5,+5) 0 (-5,+5) -1 (-6,+5) 2050s -2 (-8,-5) -1 (-7, +|5) -1 (18,+6) 2080s 0 (-7. +7) -1 (-9,+7) -1 (-12,+10)
Winter mean precipitation %
2020s 5 (-3+15) 7 (-1+16) 5 (-5,+16) 2050s 10 (-1+23) 15 (+5, +29) 16 (+4,+31) 2080s 20 (+6,+37) 21 (+6,+42) 30 (+12,+55)
Summer mean precipitation %
2020s -4 (-15,+7) -6 (-17,+8) -3 (-14,+8) 2050s -10 (-25,+6) -13 (-27, +1) -13 (-28, +2) 2080s -12 (-26, +3) -16 (-33, +1) -20 (-39,-1)
The output of climate change modelling reported by the Met Office is consistent with the measured rise in temperature over the last 30 years which gives additional credence to the expectation of continuing temperature rise. The modelled rainfall predictions however, do not correlate with the measured trends in rainfall in Scotland over the last 30 years. This gives rise to considerable uncertainty in relation to the credibility of the model outputs for precipitation. Warmer drier summers would be anticipated to give rise to an increased risk of dust emissions from surface and other minerals operations. In considering the evidence from long term measurement of temperature and rainfall as well as the output of climate change modelling, it has to be noted that substantial fluctuations in global temperature have occurred over the last several thousand years in the absence of significant greenhouse gas emissions. Even the best model will not incorporate all possible variables and, perhaps of particular concern, the Little Ice Age which lasted from approximately 1350-1850 followed a period of relative warmth (“Medieval Warm Period”). The Little Ice Age has been linked to a weakening of the North Atlantic Drift due to melting of Arctic Ice in response to warming and reduced salinity of the polar ocean. 3.2 Climate Change Impacts The climate projections indicate that the climate will change in future years - it is likely to get slightly warmer, winters may become wetter and summers may become drier. There appears to be a relatively high level of certainty that the climate will become warmer but much less certainty about the predicted changes in rainfall. The Met Office projections described in section 3.1 do not include extreme weather events but there appears to be widespread consensus that these are likely to increase in frequency. In addition to an increased risk of future storms and flooding, there is also an increased risk of future drought. Impacts of a changing climate may include: Damage to physical assets and infrastructure e.g. housing, roads, railways, bridges etc
including flooding; Changes to habitats and range of species supported; Health impacts arising from changing conditions; and
East Ayrshire Council Chapter 6 – Climate Change State of the Environment Report Page 17
IronsideFarrar July 2016
Socio-economic impacts – increased vulnerability of populations to events such as heatwaves, drought, high rainfall and winds.
3.3 Climate Change Mitigation and Adaptation Climate Change and a need to reduce global emissions are a key aim of the UN Framework on Climate Change (UNFCC) and commitments to stabilising and reducing emissions have been set through the Kyoto Protocol. The Scottish Government has committed to its own targets via the Climate Change (Scotland) Act, 200916 to contribute to a reduction in emissions – a cut of greenhouse gas emissions by 80% of 1990 levels by 2050. The importance of adaptation to climate change is recognised by the Scottish Government and is an element that is addressed as part of progress reporting under the Climate Change Act. The Scottish Climate Change Adaptation Programme (2015) addresses the impacts identified in the Climate Change Risk Assessment. Adaptation in relation to flooding follows a hierarchy of reducing risk, avoiding increasing risk or accepting risk by maintaining current levels of management17. CONCLUSIONS 4.1 Conclusions Current emissions of greenhouse gases per head of population in East Ayrshire are lower than the Scottish national average. Emissions have dropped substantially since 1990 but the rate of decrease has flattened out in recent years. Future reductions are required in order to meet the Scottish Government’s international obligations which will rely on the continued growth of the renewables sector at national level. Long term measurements of temperature and rainfall in Scotland show substantial year on year variability. In general the weather has become warmer and wetter over the last 30 years but there are no consistent trends over the last century. It seems certain that the climate will continue to change in future years. It is likely to get slightly warmer, and it is predicted that winters will become wetter and summers will become drier, although this is at odds with the trend over recent years. There appears to be a relatively high level of certainty that the climate will become warmer during the remainder of the 21st Century but much less certainty about the predicted changes in rainfall. It is also likely that there will be an increased frequency of severe weather events.
16 http://www.gov.scot/Topics/Environment/climatechange 17 http://apps.sepa.org.uk/FRMStrategies/pdf/pva/PVA_12_06_Full.pdf
East Ayrshire Council Chapter 6 – Climate Change State of the Environment Report Page 18
IronsideFarrar July 2016
MINERALS 5.1 Summary The use of coal as a fuel is a major source of greenhouse gas emissions worldwide. Surface coaling has been an important source of CO2 and methane emissions in East Ayrshire in recent years, accounting for up to 20% of CO2 emissions. The future of surface coaling operations in East Ayrshire will therefore have a substantial influence on the overall trend of greenhouse gas emissions in East Ayrshire. Current levels of emissions from other minerals operations are very much smaller. The impact of unconventional gas exploration and exploitation on greenhouse gas emissions is difficult to predict. It seems probable that fugitive emissions of methane and CO2 are inevitable and flaring may contribute further to CO2 emissions. It seems likely that unconventional gas operations would increase greenhouse gas emissions in East Ayrshire and the increase is likely to be substantial if large scale commercial exploitation of unconventional gas is undertaken in the future. As well as contributing to local greenhouse emissions, the use of the recovered gas elsewhere will contribute to global emissions. Arguably, the replacement of coal by gas as a fuel source will lower CO2 emissions but the benefit is small in comparison to that gained by the use of renewable energy or other measures designed to improve energy efficiency. 5.2 Current emissions of greenhouse gases from Opencast Coal Sites (OCCSs) and
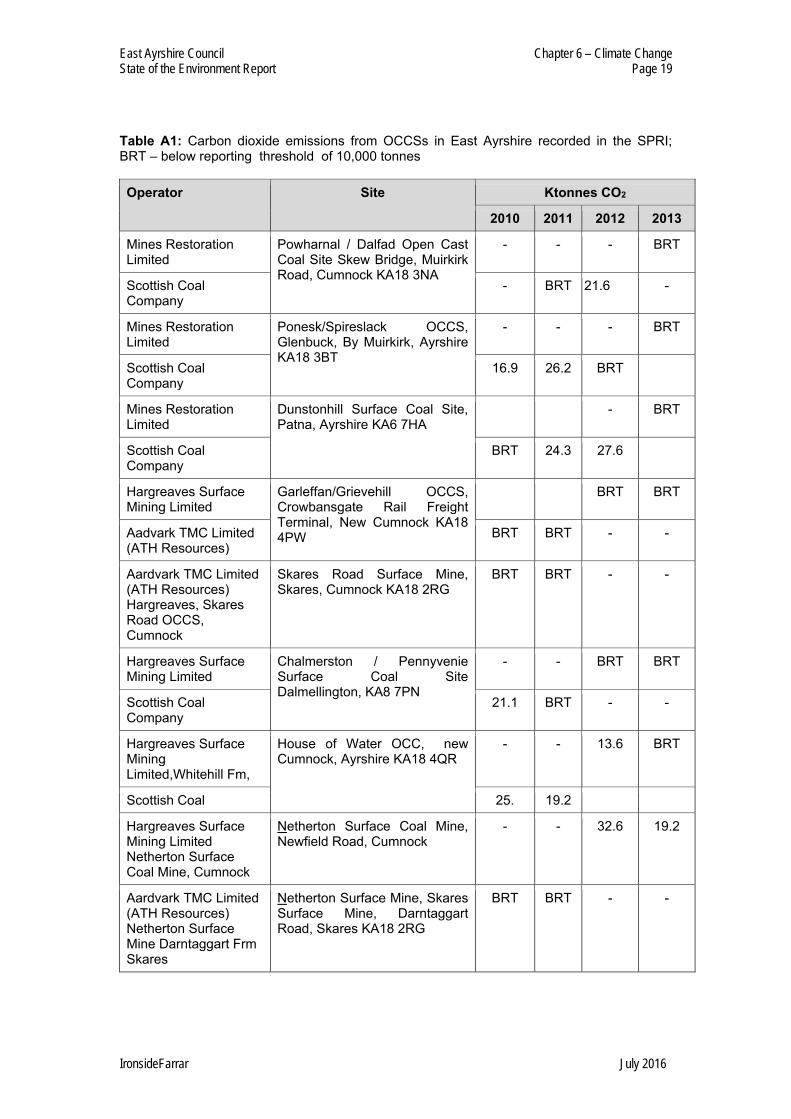
other surface minerals operations Information about CO2 releases from OCCSs in East Ayrshire is available from the SPRI. Emissions from other surface minerals operations are below reporting thresholds. Carbon dioxide The emissions data recorded in the SPRI indicate that the direct contribution of CO2 emissions from OCCSs to total greenhouse gas emissions for East Ayrshire has varied substantially from year to year, partly in response to the economic fortunes of the industry that have driven the extent of coaling that has been undertaken. In some years, the surface coal industry may have accounted for about 20% of total CO2 emissions from East Ayrshire (Table A1). In 2012, OCCSs were the second biggest direct source of CO2 after road transport (summed across all road types). In addition to the direct emissions from individual OCCSs, there has been and is an indirect contribution from vehicles serving OCCSs including coal transport and worker travel. Given that OCCS has represented an important component of the East Ayrshire economy and there is relatively little road freight transport through the local authority area that neither starts nor ends its journey in East Ayrshire, road transport associated with OCCSs might have historically accounted for 10% of total transport emissions of CO2. Further afield, the combustion of coal from East Ayrshire OCCSs has contributed to global emissions of CO2.
East Ayrshire Council Chapter 6 – Climate Change State of the Environment Report Page 19
IronsideFarrar July 2016
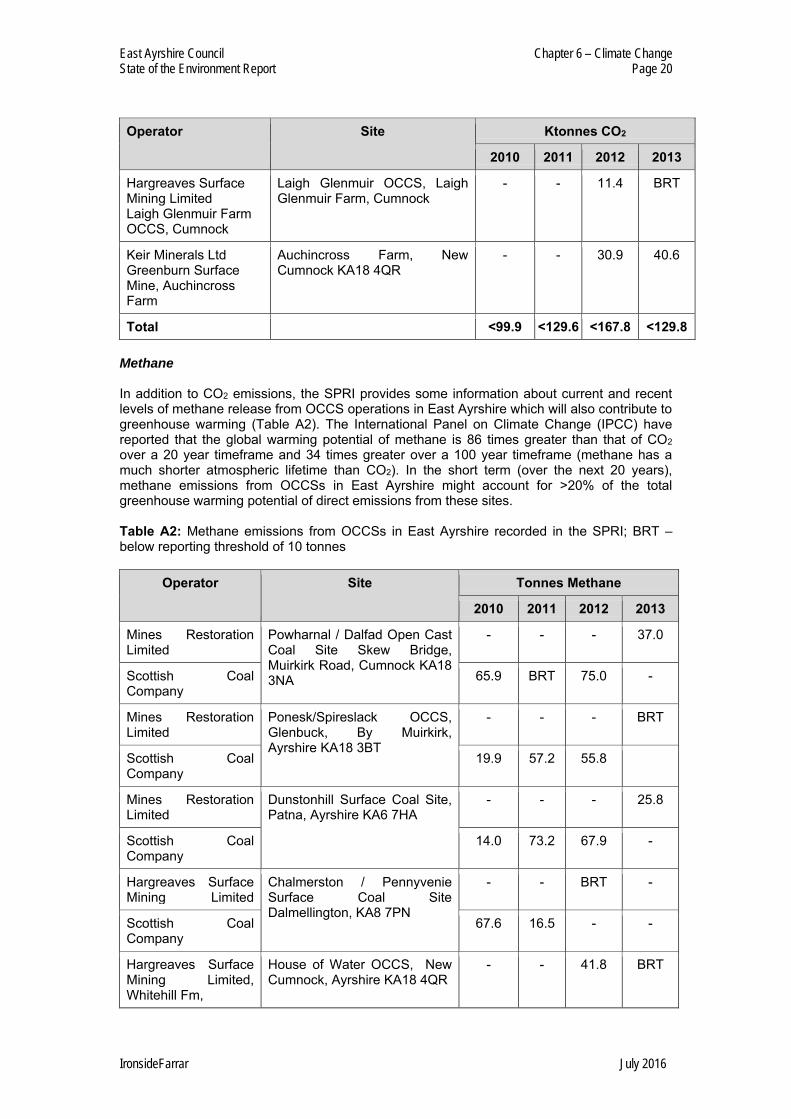
Table A1: Carbon dioxide emissions from OCCSs in East Ayrshire recorded in the SPRI; BRT – below reporting threshold of 10,000 tonnes Operator Site Ktonnes CO2
2010 2011 2012 2013
Mines Restoration Limited
Powharnal / Dalfad Open Cast Coal Site Skew Bridge, Muirkirk Road, Cumnock KA18 3NA
- - - BRT
Scottish Coal Company
- BRT 21.6 21.6 -
Mines Restoration Limited
Ponesk/Spireslack OCCS, Glenbuck, By Muirkirk, Ayrshire KA18 3BT
- - - BRT
Scottish Coal Company
16.9 26.2 BRT
Mines Restoration Limited
Dunstonhill Surface Coal Site, Patna, Ayrshire KA6 7HA
- BRT
Scottish Coal Company
BRT 24.3 27.6
Hargreaves Surface Mining Limited
Garleffan/Grievehill OCCS, Crowbansgate Rail Freight Terminal, New Cumnock KA18 4PW
BRT BRT
Aadvark TMC Limited (ATH Resources)
BRT BRT - -
Aardvark TMC Limited (ATH Resources) Hargreaves, Skares Road OCCS, Cumnock
Skares Road Surface Mine, Skares, Cumnock KA18 2RG
BRT BRT - -
Hargreaves Surface Mining Limited
Chalmerston / Pennyvenie Surface Coal Site Dalmellington, KA8 7PN
- - BRT BRT
Scottish Coal Company
21.1 BRT - -
Hargreaves Surface Mining Limited,Whitehill Fm,
House of Water OCC, new Cumnock, Ayrshire KA18 4QR
- - 13.6 BRT
Scottish Coal 25. 19.2
Hargreaves Surface Mining Limited Netherton Surface Coal Mine, Cumnock
Netherton Surface Coal Mine, Newfield Road, Cumnock
- - 32.6 19.2
Aardvark TMC Limited (ATH Resources) Netherton Surface Mine Darntaggart Frm Skares
Netherton Surface Mine, Skares Surface Mine, Darntaggart Road, Skares KA18 2RG
BRT BRT - -
East Ayrshire Council Chapter 6 – Climate Change State of the Environment Report Page 20
IronsideFarrar July 2016
Operator Site Ktonnes CO2
2010 2011 2012 2013
Hargreaves Surface Mining Limited Laigh Glenmuir Farm OCCS, Cumnock
Laigh Glenmuir OCCS, Laigh Glenmuir Farm, Cumnock
- - 11.4 BRT
Keir Minerals Ltd Greenburn Surface Mine, Auchincross Farm
Auchincross Farm, New Cumnock KA18 4QR
- - 30.9 40.6
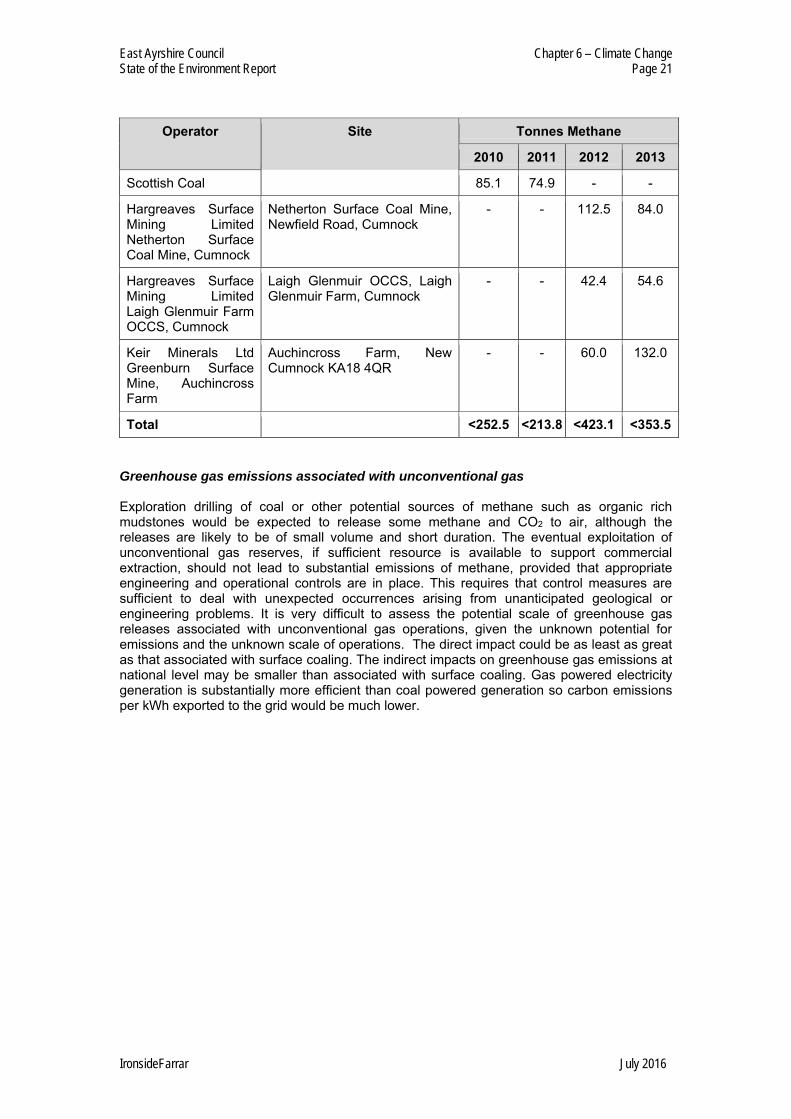
Total <99.9 <129.6 <167.8 <129.8 Methane In addition to CO2 emissions, the SPRI provides some information about current and recent levels of methane release from OCCS operations in East Ayrshire which will also contribute to greenhouse warming (Table A2). The International Panel on Climate Change (IPCC) have reported that the global warming potential of methane is 86 times greater than that of CO2 over a 20 year timeframe and 34 times greater over a 100 year timeframe (methane has a much shorter atmospheric lifetime than CO2). In the short term (over the next 20 years), methane emissions from OCCSs in East Ayrshire might account for >20% of the total greenhouse warming potential of direct emissions from these sites. Table A2: Methane emissions from OCCSs in East Ayrshire recorded in the SPRI; BRT – below reporting threshold of 10 tonnes
Operator Site Tonnes Methane
2010 2011 2012 2013
Mines Restoration Limited
Powharnal / Dalfad Open Cast Coal Site Skew Bridge, Muirkirk Road, Cumnock KA18 3NA
- - - 37.0
Scottish Coal Company
65.9 BRT 75.0 -
Mines Restoration Limited
Ponesk/Spireslack OCCS, Glenbuck, By Muirkirk, Ayrshire KA18 3BT
- - - BRT
Scottish Coal Company
19.9 57.2 55.8
Mines Restoration Limited
Dunstonhill Surface Coal Site, Patna, Ayrshire KA6 7HA
- - - 25.8
Scottish Coal Company
14.0 73.2 67.9 -
Hargreaves Surface Mining Limited
Chalmerston / Pennyvenie Surface Coal Site Dalmellington, KA8 7PN
- - BRT -
Scottish Coal Company
67.6 16.5 - -
Hargreaves Surface Mining Limited, Whitehill Fm,
House of Water OCCS, New Cumnock, Ayrshire KA18 4QR
- - 41.8 BRT
East Ayrshire Council Chapter 6 – Climate Change State of the Environment Report Page 21
IronsideFarrar July 2016
Operator Site Tonnes Methane
2010 2011 2012 2013
Scottish Coal 85.1 74.9 - -
Hargreaves Surface Mining Limited Netherton Surface Coal Mine, Cumnock
Netherton Surface Coal Mine, Newfield Road, Cumnock
- - 112.5 84.0
Hargreaves Surface Mining Limited Laigh Glenmuir Farm OCCS, Cumnock
Laigh Glenmuir OCCS, Laigh Glenmuir Farm, Cumnock
- - 42.4 54.6
Keir Minerals Ltd Greenburn Surface Mine, Auchincross Farm
Auchincross Farm, New Cumnock KA18 4QR
- - 60.0 132.0
Total <252.5 <213.8 <423.1 <353.5 Greenhouse gas emissions associated with unconventional gas Exploration drilling of coal or other potential sources of methane such as organic rich mudstones would be expected to release some methane and CO2 to air, although the releases are likely to be of small volume and short duration. The eventual exploitation of unconventional gas reserves, if sufficient resource is available to support commercial extraction, should not lead to substantial emissions of methane, provided that appropriate engineering and operational controls are in place. This requires that control measures are sufficient to deal with unexpected occurrences arising from unanticipated geological or engineering problems. It is very difficult to assess the potential scale of greenhouse gas releases associated with unconventional gas operations, given the unknown potential for emissions and the unknown scale of operations. The direct impact could be as least as great as that associated with surface coaling. The indirect impacts on greenhouse gas emissions at national level may be smaller than associated with surface coaling. Gas powered electricity generation is substantially more efficient than coal powered generation so carbon emissions per kWh exported to the grid would be much lower.
East Ayrshire Council Chapter 6 – Climate Change State of the Environment Report Page 22
IronsideFarrar July 2016
5.3 Conclusions - Climate Change and Minerals / Unconventional Gas Surface coaling has been an important source of CO2 and methane emissions in East Ayrshire in recent years, accounting for up to 20% of CO2 emissions. The future of surface coaling operations in East Ayrshire will therefore have a substantial influence on the overall trend of greenhouse gas emissions in East Ayrshire. Current levels of emissions from other minerals operations are very much smaller. The impact of unconventional gas exploration and exploitation on greenhouse gas emissions is difficult to predict. It seems probable that fugitive emissions of methane and CO2 are inevitable and flaring may contribute further to CO2 emissions. It seems likely that unconventional gas operations would increase greenhouse gas emissions in East Ayrshire and the increase is likely to be substantial if large scale commercial exploitation of unconventional gas is undertaken in the future. As well as contributing to local greenhouse emissions, the use of the recovered gas elsewhere will contribute to global emissions. Arguably, the replacement of coal by gas as a fuel source will lower CO2 emissions but the benefit is small in comparison to that gained by the use of renewable energy or other measures designed to improve energy efficiency.
East Ayrshire Council Chapter 6 – Climate Change State of the Environment Report Page 23
IronsideFarrar July 2016
REFERENCES References and sources of further information and guidance Reference Available From: Date
Accessed / Frequency of Updates
Climate Change 2013: The Physical Science Basis was published by the IPCC in September 2013.
http://www.climatechange2013.org/ May 2016
Met Office Data - Temperatures http://www.metoffice.gov.uk/research/news/2014-temperatures May 2016
National Atmospheric Emissions Inventory (NAEI) datasets for greenhouse gas emissions for Local Authorities
http://naei.defra.gov.uk/data/local-authority May 2016
Scottish Pollutant Release Inventory (SPRI) is a database of annual mass releases of specified pollutants to air, land and water
http://www.sepa.org.uk/air/process_industry_regulation/pollutant_release_inventory.aspx
May 2016
Local Authority Emissions Statistics from UK Government
https://www.gov.uk/government/statistics/local-authority-emissions-estimates
May 2016
Scottish Government information on Climate Change
http://www.gov.scot/Topics/Environment/climatechange May 2016
UK Climate Projections - map data and key facts
http://ukclimateprojections.metoffice.gov.uk/21708 May 2016
GLOSSARY OF KEY TERMS Acid Deposition - deposition of acidic compounds in rain AQMA – Under section 83(1) of the Environment Act 1995, Local Authorities have a duty to designate any relevant areas where the air quality objectives are not (or are unlikely to be) being met as Air Quality Management Areas (AQMAs) GWh – Giga Watt Hours Greenhouse Gas Emissions – Gases which contribute to climate change and global warming. The GHG inventory covers the seven direct greenhouse gases under the Kyoto Protocol: Carbon dioxide (CO2), Methane (CH4), Nitrous oxide (N2O), Hydrofluorocarbons (HFCs), Perfluorocarbons (PFCs), Sulphur hexafluoride (SF6) and Nitrogen trifluoride (NF3).
Kyoto Protocol - international agreement linked to the United Nations Framework Convention on Climate Change, which commits countries to internationally binding emission reduction targets Local Air Quality Management (LAQM) – Monitoring and reporting of air quality by Scottish local authorities as prescribed under Part IV of the Environment Act 1995
East Ayrshire Council Chapter 6 – Climate Change State of the Environment Report Page 24
IronsideFarrar July 2016
NO2 – Nitrogen dioxide is a brown gas. The concentration of NO2 is measured in micrograms in each cubic metre of air (μg m-3). A microgram (μg) is one millionth of a gram. A concentration of 1 μg m-3 means that one cubic metre of air contains one microgram of pollutant (https://uk-air.defra.gov.uk/assets/documents/reports/aqeg/nd-summary.pdf) NO – Nitrogen Oxide is a nitric oxide (nitrogen monoxide), a colourless gas. NOX - Together, NO and NO2 are known as NOX or Nitrogen Oxides. NOX is released into the atmosphere when fuels are burned OCCS – Opencast Coal Site Per Capita – per head of population PM10 – Particulate matter less than 10 µm in size that can penetrate to the lungs PM2.5 - Particulate matter which are a sub-fraction of PM10 which are less than 25 µm in size PAH - Polycyclic aromatic hydrocarbons Sulphur Dioxide (SO2) – pollutant which together with particulate matter forms smog. Formed through fuel combustion. Coal has a high sulphur content, relative to other fuels. SPRI - The Scottish Pollutant Release Inventory (SPRI) is a database of annual mass releases of specified pollutants to air, water and land UKCP09 - UK Climate Projections (UKCP09) website provides a comprehensive source of climate information for the UK and its regions - http://ukclimateprojections.metoffice.gov.uk/21678 µm - A micron is a unit of length equivalent to a millionth of a meter µmgm-3 – micrograms per cubic metre Unconventional gas - The term unconventional gas refers to natural gas held in rocks that cannot be exploited using traditional methods. Shale and coal are source rocks for unconventional gas.