Embed Size (px)
Citation preview
Soda Taxes, Consumption and Weight Outcomes
UIC Cancer Center
Chicago, IL, U.S.A., October 7, 2010
Lisa M. Powell, PhD
University of Illinois at Chicago
2www.bridgingthegapresearch.org
Presentation Outline
• Objectives• Individual-level and Tax Data• Models• Empirical Results• Policy Implications

Taxation: Overview of Empirical StudiesObjectives, Data and Models

4www.bridgingthegapresearch.org
Objectives
• Empirical findings on association of state-level soda taxes with consumption and weight outcomes, using national data sets including:
• A.C. Nielsen Homescan Data
• Early Childhood Longitudinal Study-Kindergarten Cohort (ECLS-K)
• Monitoring the Future (MTF)
• National Longitudinal Survey of Youth 1997 (NLSY97)
5www.bridgingthegapresearch.org
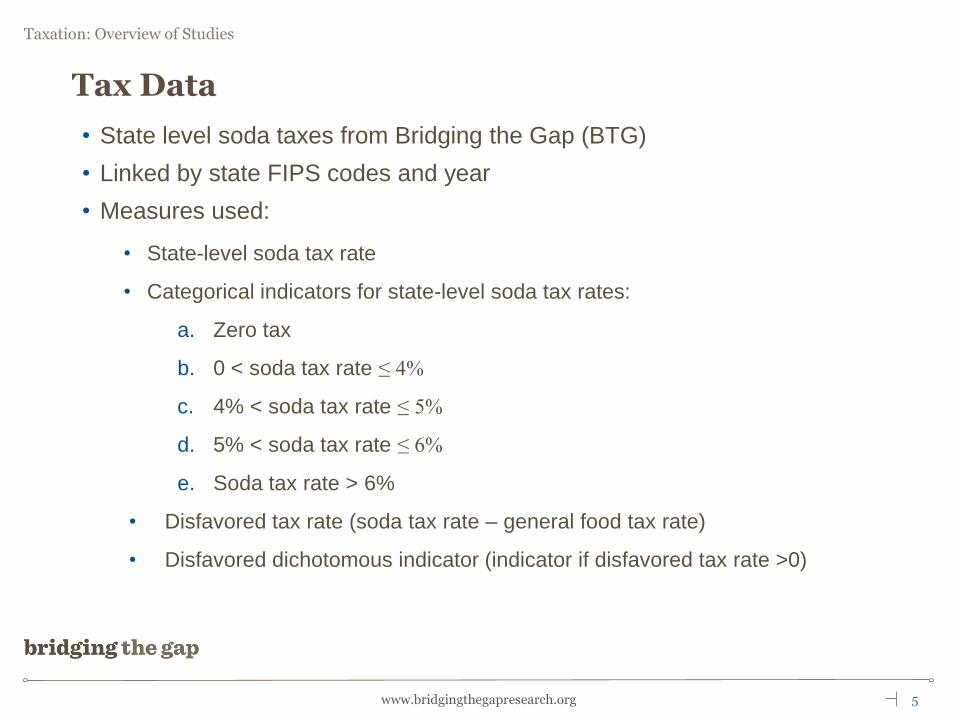
Tax Data
• State level soda taxes from Bridging the Gap (BTG)
• Linked by state FIPS codes and year
• Measures used:
• State-level soda tax rate
• Categorical indicators for state-level soda tax rates:
a. Zero tax
b. 0 < soda tax rate ≤ 4%
c. 4% < soda tax rate ≤ 5%
d. 5% < soda tax rate ≤ 6%
e. Soda tax rate > 6%
• Disfavored tax rate (soda tax rate – general food tax rate)
• Disfavored dichotomous indicator (indicator if disfavored tax rate >0)

6www.bridgingthegapresearch.org
Models
istiititststist wvDXOCTaxWeightnConsumptio 43210/
Cross-Sectional Model:
Random Effects Models: Assumes vi and independent variables are not correlated
Fixed Effects Models: Difference out the constant individual-specific residual vi and provide within person effects
Longitudinal Model:
istititststist DXOCTaxWeightnConsumptio 43210/
Soda Taxes and ConsumptionA.C. Nielsen Homescan Data
8www.bridgingthegapresearch.org
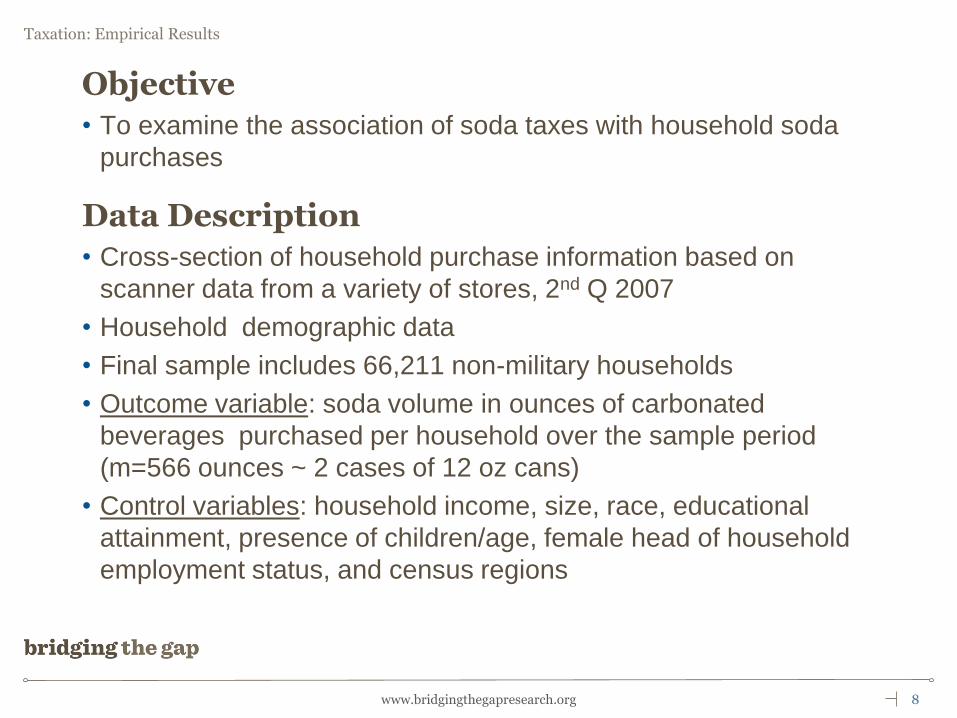
Objective
• To examine the association of soda taxes with household soda
purchases
Data Description
• Cross-section of household purchase information based on
scanner data from a variety of stores, 2nd Q 2007
• Household demographic data
• Final sample includes 66,211 non-military households
• Outcome variable: soda volume in ounces of carbonated
beverages purchased per household over the sample period
(m=566 ounces ~ 2 cases of 12 oz cans)
• Control variables: household income, size, race, educational
attainment, presence of children/age, female head of household
employment status, and census regions
9www.bridgingthegapresearch.org
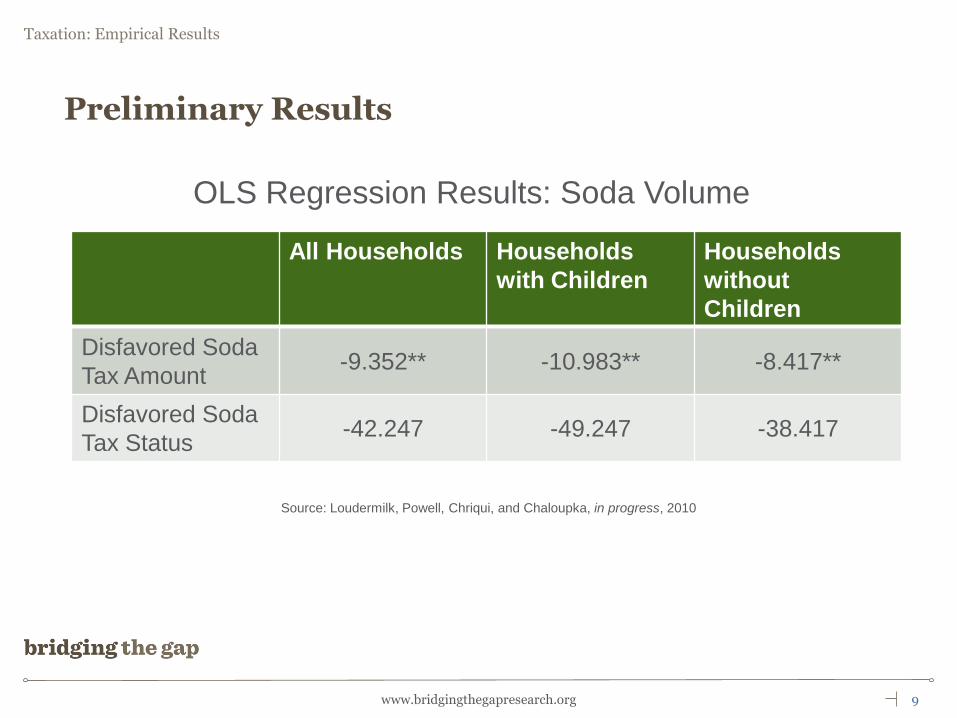
Preliminary Results
All Households Households
with Children
Households
without
Children
Disfavored Soda
Tax Amount-9.352** -10.983** -8.417**
Disfavored Soda
Tax Status-42.247 -49.247 -38.417
OLS Regression Results: Soda Volume
Source: Loudermilk, Powell, Chriqui, and Chaloupka, in progress, 2010
10www.bridgingthegapresearch.org
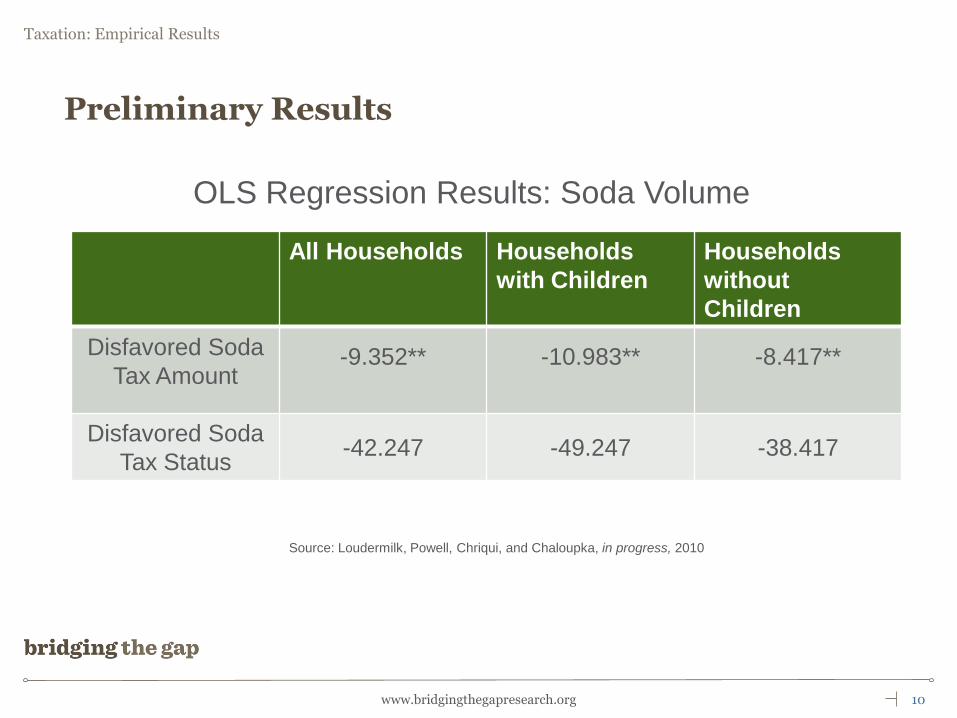
Preliminary Results
All Households Households
with Children
Households
without
Children
Disfavored Soda
Tax Amount-9.352** -10.983** -8.417**
Disfavored Soda
Tax Status-42.247 -49.247 -38.417
OLS Regression Results: Soda Volume
Source: Loudermilk, Powell, Chriqui, and Chaloupka, in progress, 2010
11www.bridgingthegapresearch.org
Policy Simulation Example: Household Soda Purchases
• Study results imply very small tax elasticities for purchases of -0.06.
• If tax rate went up 1 percentage point from its currents average, soda
purchases would be expected to fall by about 9.4 liquid ounces per
household per quarter.
• Consider a large tax increase such as the one recently proposed in NY
(soda tax of 18%) then rates would increase 14 points from the mean with
an implied decrease in soda volume of 132 liquid ounces, 23% of mean
purchases, for the average household.
• Consider the imposition of an excise or other, non-sales tax of 1 cent per
liquid ounce (~25% tax depending on the quantity and unit size
purchased), the implied reduction in household consumption would be 197
liquid ounces or 35% of quarterly regular soda purchases.
Soda Taxes, Children’s Consumption, and WeightEarly Childhood Longitudinal Study-Kindergarten Cohort
13www.bridgingthegapresearch.org
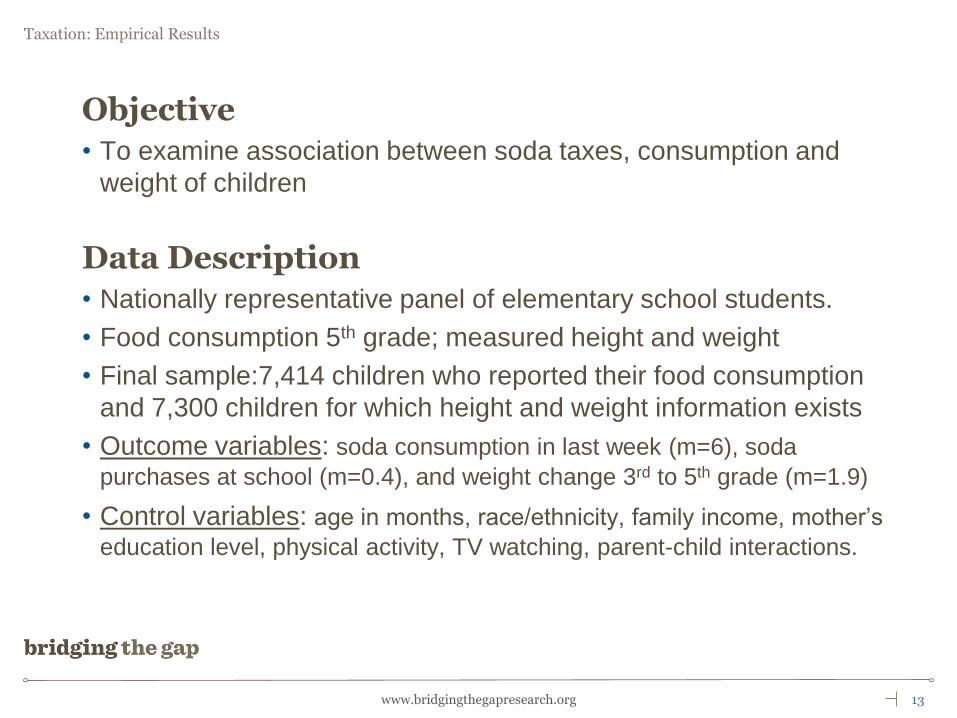
Objective
• To examine association between soda taxes, consumption and
weight of children
Data Description
• Nationally representative panel of elementary school students.
• Food consumption 5th grade; measured height and weight
• Final sample:7,414 children who reported their food consumption
and 7,300 children for which height and weight information exists
• Outcome variables: soda consumption in last week (m=6), soda
purchases at school (m=0.4), and weight change 3rd to 5th grade (m=1.9)
• Control variables: age in months, race/ethnicity, family income, mother’s
education level, physical activity, TV watching, parent-child interactions.
14www.bridgingthegapresearch.org
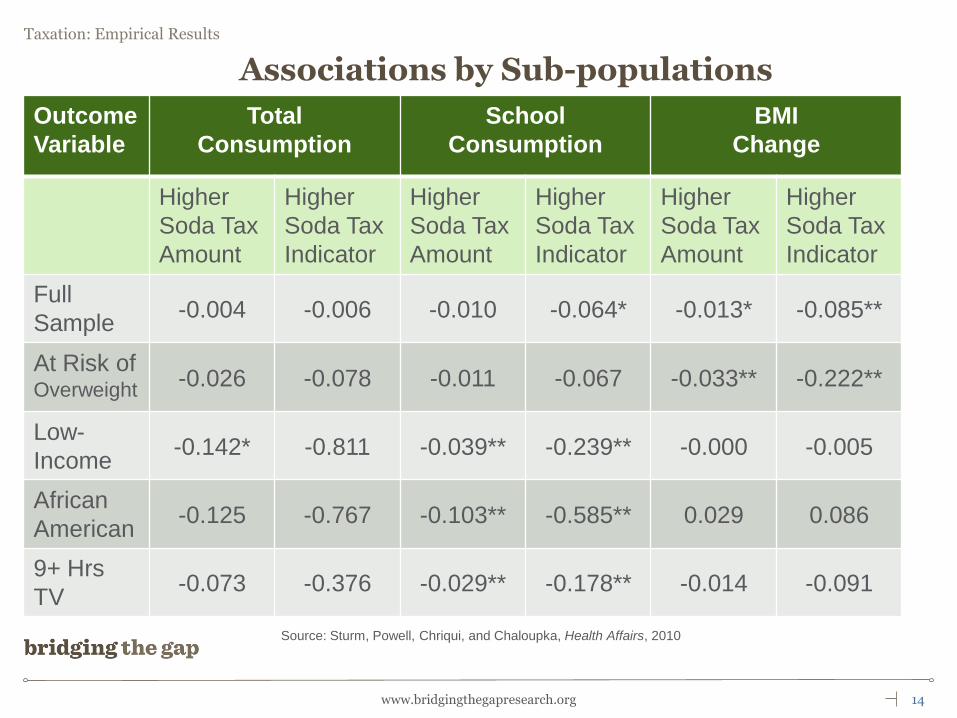
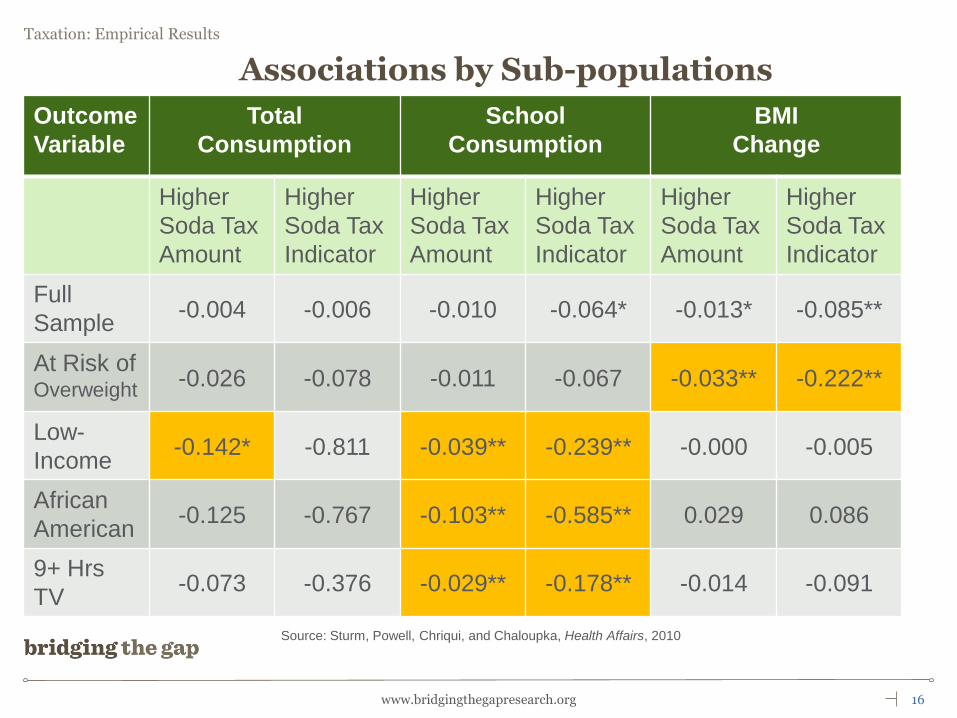
Associations by Sub-populations
Outcome
Variable
Total
Consumption
School
Consumption
BMI
Change
Higher
Soda Tax
Amount
Higher
Soda Tax
Indicator
Higher
Soda Tax
Amount
Higher
Soda Tax
Indicator
Higher
Soda Tax
Amount
Higher
Soda Tax
Indicator
Full
Sample-0.004 -0.006 -0.010 -0.064* -0.013* -0.085**
At Risk of Overweight
-0.026 -0.078 -0.011 -0.067 -0.033** -0.222**
Low-
Income-0.142* -0.811 -0.039** -0.239** -0.000 -0.005
African
American-0.125 -0.767 -0.103** -0.585** 0.029 0.086
9+ Hrs
TV -0.073 -0.376 -0.029** -0.178** -0.014 -0.091
Source: Sturm, Powell, Chriqui, and Chaloupka, Health Affairs, 2010
15www.bridgingthegapresearch.org
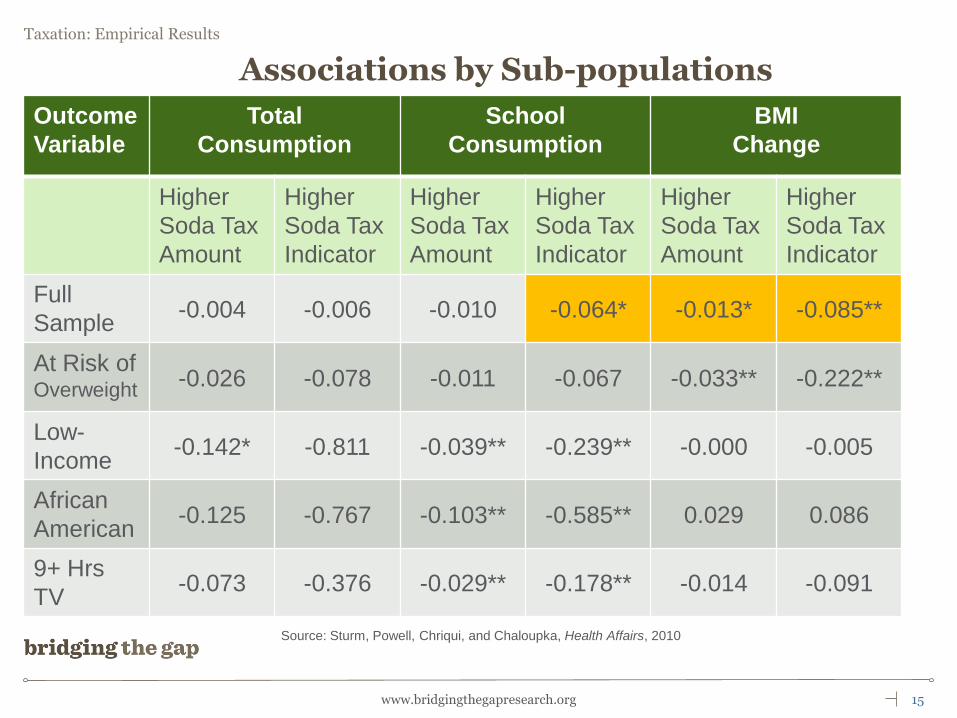
Associations by Sub-populations
Outcome
Variable
Total
Consumption
School
Consumption
BMI
Change
Higher
Soda Tax
Amount
Higher
Soda Tax
Indicator
Higher
Soda Tax
Amount
Higher
Soda Tax
Indicator
Higher
Soda Tax
Amount
Higher
Soda Tax
Indicator
Full
Sample-0.004 -0.006 -0.010 -0.064* -0.013* -0.085**
At Risk of Overweight
-0.026 -0.078 -0.011 -0.067 -0.033** -0.222**
Low-
Income-0.142* -0.811 -0.039** -0.239** -0.000 -0.005
African
American-0.125 -0.767 -0.103** -0.585** 0.029 0.086
9+ Hrs
TV -0.073 -0.376 -0.029** -0.178** -0.014 -0.091
Source: Sturm, Powell, Chriqui, and Chaloupka, Health Affairs, 2010
16www.bridgingthegapresearch.org
Associations by Sub-populations
Outcome
Variable
Total
Consumption
School
Consumption
BMI
Change
Higher
Soda Tax
Amount
Higher
Soda Tax
Indicator
Higher
Soda Tax
Amount
Higher
Soda Tax
Indicator
Higher
Soda Tax
Amount
Higher
Soda Tax
Indicator
Full
Sample-0.004 -0.006 -0.010 -0.064* -0.013* -0.085**
At Risk of Overweight
-0.026 -0.078 -0.011 -0.067 -0.033** -0.222**
Low-
Income-0.142* -0.811 -0.039** -0.239** -0.000 -0.005
African
American-0.125 -0.767 -0.103** -0.585** 0.029 0.086
9+ Hrs
TV -0.073 -0.376 -0.029** -0.178** -0.014 -0.091
Source: Sturm, Powell, Chriqui, and Chaloupka, Health Affairs, 2010

17www.bridgingthegapresearch.org
• Assuming a linear extrapolation, an 18% differential soda tax would correspond to a -0.23 BMI units in the change in BMI between 3rd and 5th grade, or a 20% reduction in the excess BMI gain.
Policy Simulation Example: Children’s BMI
Soda Taxes and Adolescents’ WeightMonitoring the Future
19www.bridgingthegapresearch.org
Objective
• To examine association of soda taxes with youths’ BMI
Data Description
• Cross-section individual-level data for 8th, 10th, and 12th grade
students,1997-2006
• Estimation sample includes 153,673 observations
• Outcome variable: body mass index (BMI)
• Control variables: gender, age, grade, race, ethnicity, student’s
hours work and income, parents’ education, work, marital status
• Neighborhood controls: Food store and restaurant availability and
per capita income

20www.bridgingthegapresearch.org
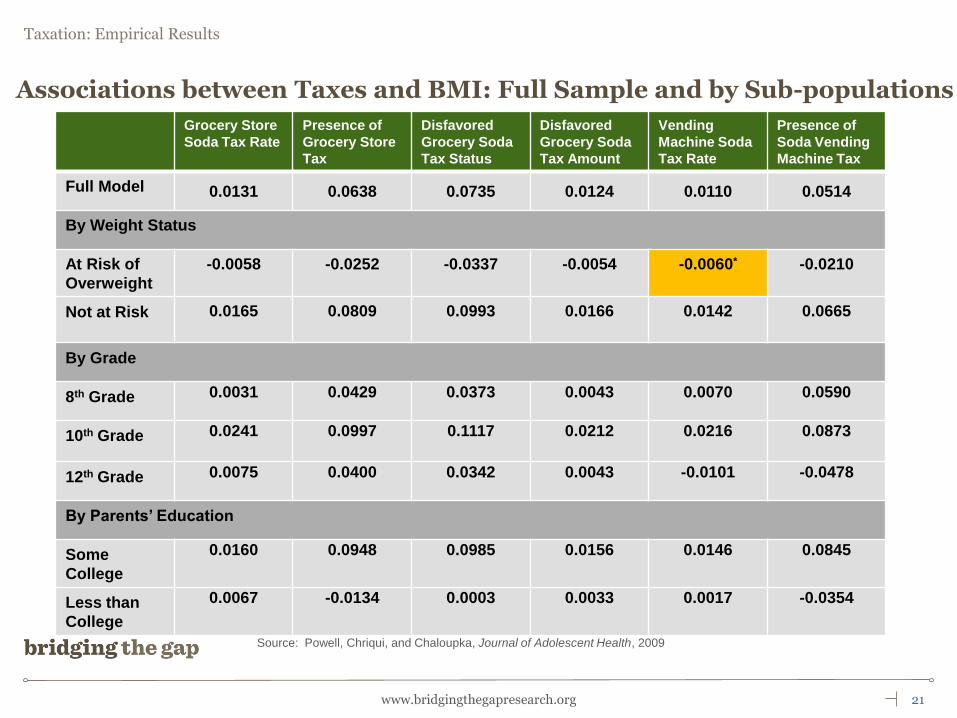
Associations between Taxes and BMI: Full Sample and by Sub-populations
Grocery Store
Soda Tax Rate
Presence of
Grocery Store
Tax
Disfavored
Grocery Soda
Tax Status
Disfavored
Grocery Soda
Tax Amount
Vending
Machine Soda
Tax Rate
Presence of
Soda Vending
Machine Tax
Full Model 0.0131 0.0638 0.0735 0.0124 0.0110 0.0514
By Weight Status
At Risk of
Overweight
-0.0058 -0.0252 -0.0337 -0.0054 -0.0060* -0.0210
Not at Risk 0.0165 0.0809 0.0993 0.0166 0.0142 0.0665
By Grade
8th Grade 0.0031 0.0429 0.0373 0.0043 0.0070 0.0590
10th Grade 0.0241 0.0997 0.1117 0.0212 0.0216 0.0873
12th Grade 0.0075 0.0400 0.0342 0.0043 -0.0101 -0.0478
By Parents’ Education
Some
College
0.0160 0.0948 0.0985 0.0156 0.0146 0.0845
Less than
College
0.0067 -0.0134 0.0003 0.0033 0.0017 -0.0354
Source: Powell, Chriqui, and Chaloupka, Journal of Adolescent Health, 2009
21www.bridgingthegapresearch.org
Associations between Taxes and BMI: Full Sample and by Sub-populations
Grocery Store
Soda Tax Rate
Presence of
Grocery Store
Tax
Disfavored
Grocery Soda
Tax Status
Disfavored
Grocery Soda
Tax Amount
Vending
Machine Soda
Tax Rate
Presence of
Soda Vending
Machine Tax
Full Model 0.0131 0.0638 0.0735 0.0124 0.0110 0.0514
By Weight Status
At Risk of
Overweight
-0.0058 -0.0252 -0.0337 -0.0054 -0.0060* -0.0210
Not at Risk 0.0165 0.0809 0.0993 0.0166 0.0142 0.0665
By Grade
8th Grade 0.0031 0.0429 0.0373 0.0043 0.0070 0.0590
10th Grade 0.0241 0.0997 0.1117 0.0212 0.0216 0.0873
12th Grade 0.0075 0.0400 0.0342 0.0043 -0.0101 -0.0478
By Parents’ Education
Some
College
0.0160 0.0948 0.0985 0.0156 0.0146 0.0845
Less than
College
0.0067 -0.0134 0.0003 0.0033 0.0017 -0.0354
Source: Powell, Chriqui, and Chaloupka, Journal of Adolescent Health, 2009
Soda Taxes and Adolescents’ WeightNational Longitudinal Survey of Youth 97
23www.bridgingthegapresearch.org
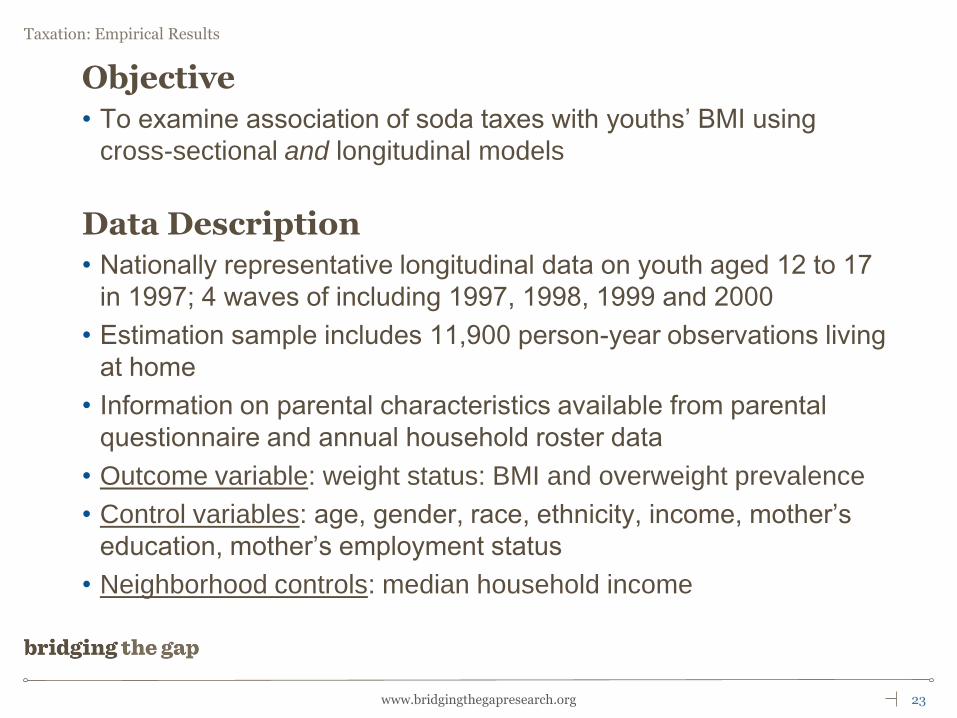
Objective
• To examine association of soda taxes with youths’ BMI using
cross-sectional and longitudinal models
Data Description
• Nationally representative longitudinal data on youth aged 12 to 17
in 1997; 4 waves of including 1997, 1998, 1999 and 2000
• Estimation sample includes 11,900 person-year observations living
at home
• Information on parental characteristics available from parental
questionnaire and annual household roster data
• Outcome variable: weight status: BMI and overweight prevalence
• Control variables: age, gender, race, ethnicity, income, mother’s
education, mother’s employment status
• Neighborhood controls: median household income
24www.bridgingthegapresearch.org
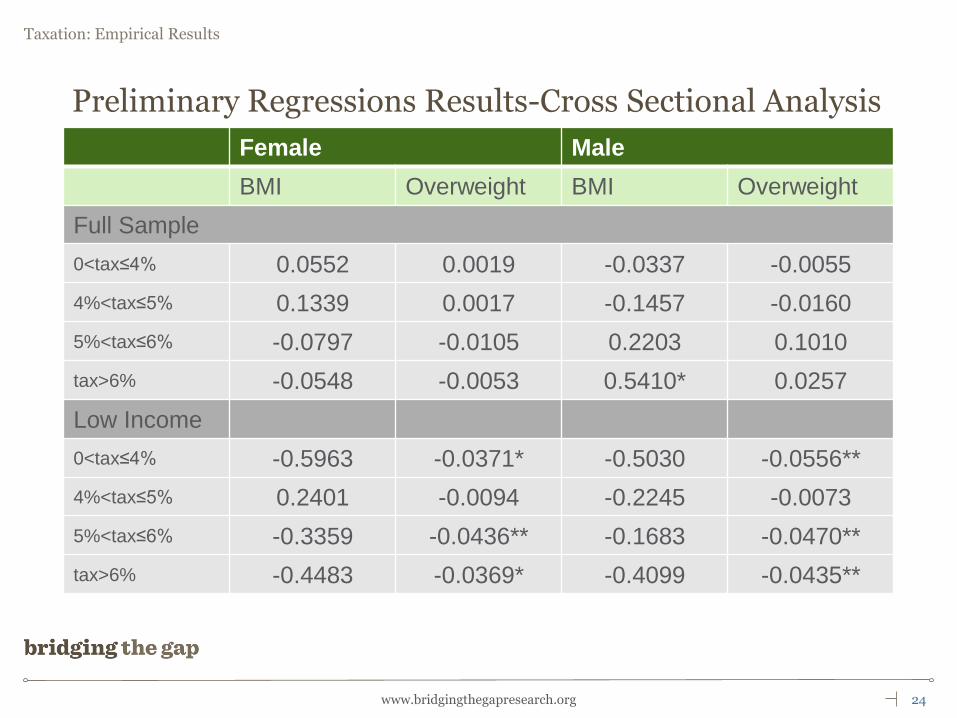
Preliminary Regressions Results-Cross Sectional Analysis
Female Male
BMI Overweight BMI Overweight
Full Sample
0<tax≤4% 0.0552 0.0019 -0.0337 -0.0055
4%<tax≤5% 0.1339 0.0017 -0.1457 -0.0160
5%<tax≤6% -0.0797 -0.0105 0.2203 0.1010
tax>6% -0.0548 -0.0053 0.5410* 0.0257
Low Income
0<tax≤4% -0.5963 -0.0371* -0.5030 -0.0556**
4%<tax≤5% 0.2401 -0.0094 -0.2245 -0.0073
5%<tax≤6% -0.3359 -0.0436** -0.1683 -0.0470**
tax>6% -0.4483 -0.0369* -0.4099 -0.0435**
25www.bridgingthegapresearch.org
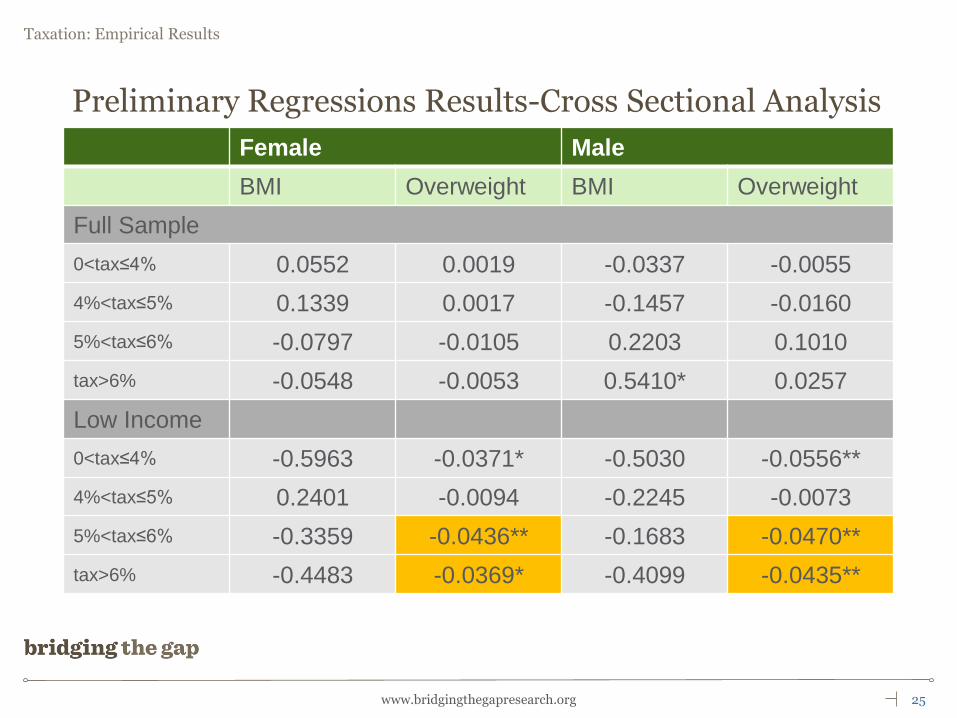
Preliminary Regressions Results-Cross Sectional Analysis
Female Male
BMI Overweight BMI Overweight
Full Sample
0<tax≤4% 0.0552 0.0019 -0.0337 -0.0055
4%<tax≤5% 0.1339 0.0017 -0.1457 -0.0160
5%<tax≤6% -0.0797 -0.0105 0.2203 0.1010
tax>6% -0.0548 -0.0053 0.5410* 0.0257
Low Income
0<tax≤4% -0.5963 -0.0371* -0.5030 -0.0556**
4%<tax≤5% 0.2401 -0.0094 -0.2245 -0.0073
5%<tax≤6% -0.3359 -0.0436** -0.1683 -0.0470**
tax>6% -0.4483 -0.0369* -0.4099 -0.0435**
26www.bridgingthegapresearch.org
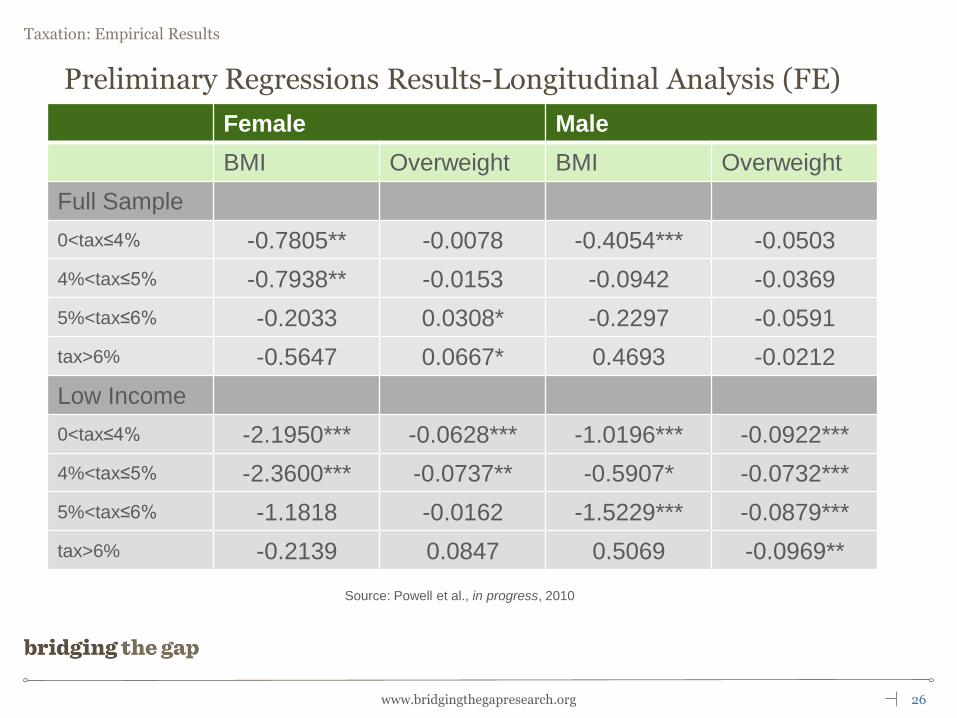
Preliminary Regressions Results-Longitudinal Analysis (FE)
Female Male
BMI Overweight BMI Overweight
Full Sample
0<tax≤4% -0.7805** -0.0078 -0.4054*** -0.0503
4%<tax≤5% -0.7938** -0.0153 -0.0942 -0.0369
5%<tax≤6% -0.2033 0.0308* -0.2297 -0.0591
tax>6% -0.5647 0.0667* 0.4693 -0.0212
Low Income
0<tax≤4% -2.1950*** -0.0628*** -1.0196*** -0.0922***
4%<tax≤5% -2.3600*** -0.0737** -0.5907* -0.0732***
5%<tax≤6% -1.1818 -0.0162 -1.5229*** -0.0879***
tax>6% -0.2139 0.0847 0.5069 -0.0969**
Source: Powell et al., in progress, 2010
27www.bridgingthegapresearch.org
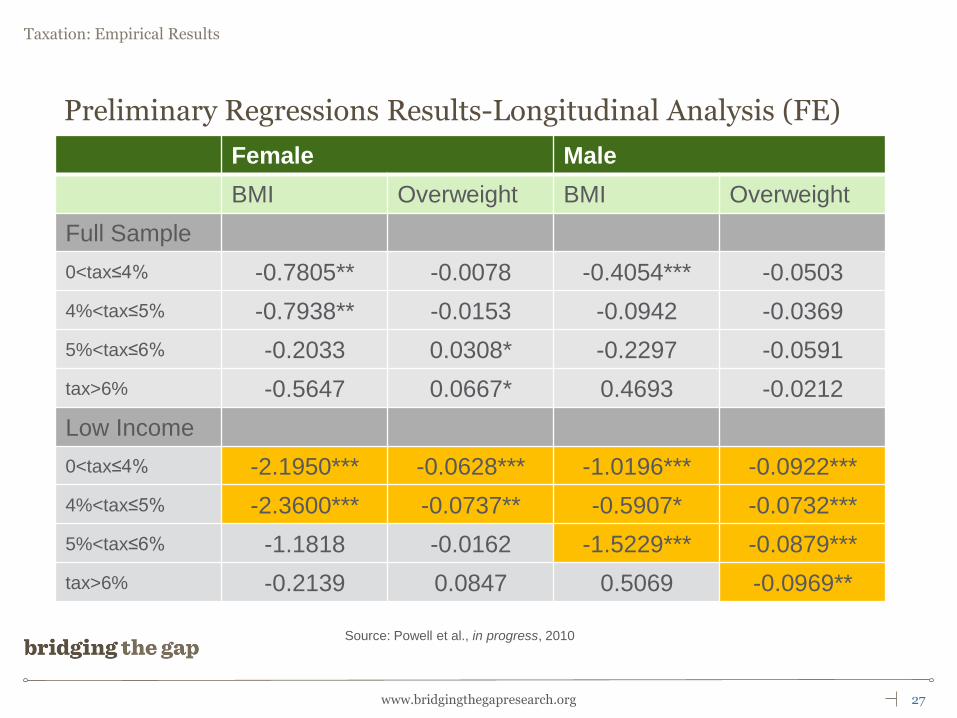
Preliminary Regressions Results-Longitudinal Analysis (FE)
Female Male
BMI Overweight BMI Overweight
Full Sample
0<tax≤4% -0.7805** -0.0078 -0.4054*** -0.0503
4%<tax≤5% -0.7938** -0.0153 -0.0942 -0.0369
5%<tax≤6% -0.2033 0.0308* -0.2297 -0.0591
tax>6% -0.5647 0.0667* 0.4693 -0.0212
Low Income
0<tax≤4% -2.1950*** -0.0628*** -1.0196*** -0.0922***
4%<tax≤5% -2.3600*** -0.0737** -0.5907* -0.0732***
5%<tax≤6% -1.1818 -0.0162 -1.5229*** -0.0879***
tax>6% -0.2139 0.0847 0.5069 -0.0969**
Source: Powell et al., in progress, 2010
28www.bridgingthegapresearch.org
Summary: Policy Implications of Empirical Results
• Generally very small associations between soda taxes and consumption or
weight outcomes based on the existing low tax rates which range up to
just 7%. Consistent with previous findings by others researchers such as
Fletcher, Frisvold and Tefft.
• Larger associations for populations at greater risk for obesity.
• Substantial increases in soda tax rates may have some measureable
effects on outcomes and even greater effects at the population level.
Policy Implications
30www.bridgingthegapresearch.org
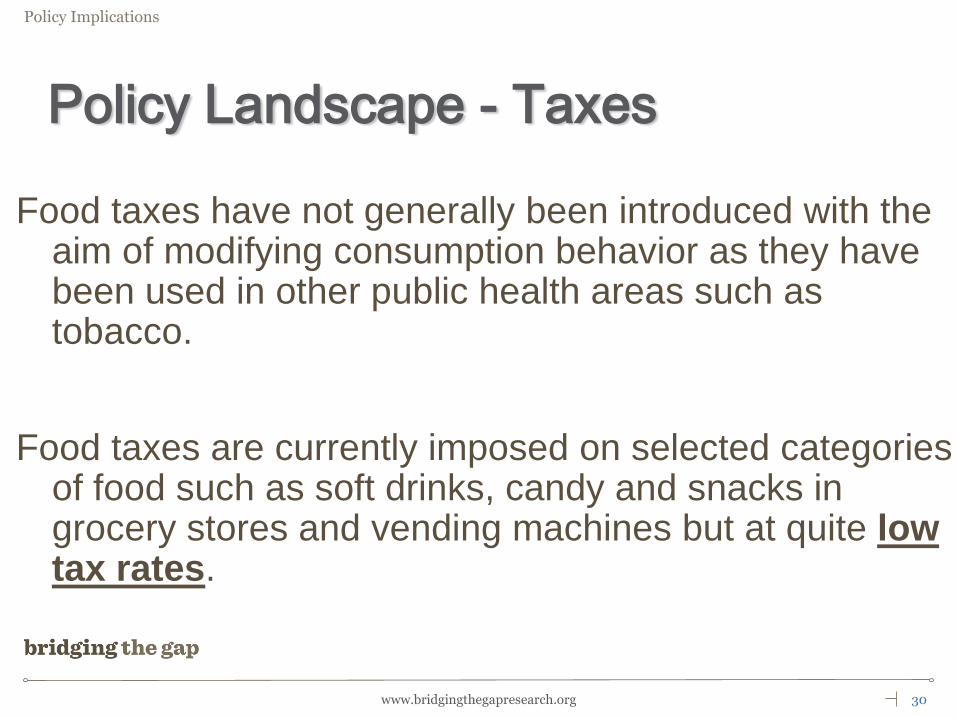
Policy Landscape - Taxes
Food taxes have not generally been introduced with the aim of modifying consumption behavior as they have been used in other public health areas such as tobacco.
Food taxes are currently imposed on selected categories of food such as soft drinks, candy and snacks in grocery stores and vending machines but at quite low tax rates.
31www.bridgingthegapresearch.org
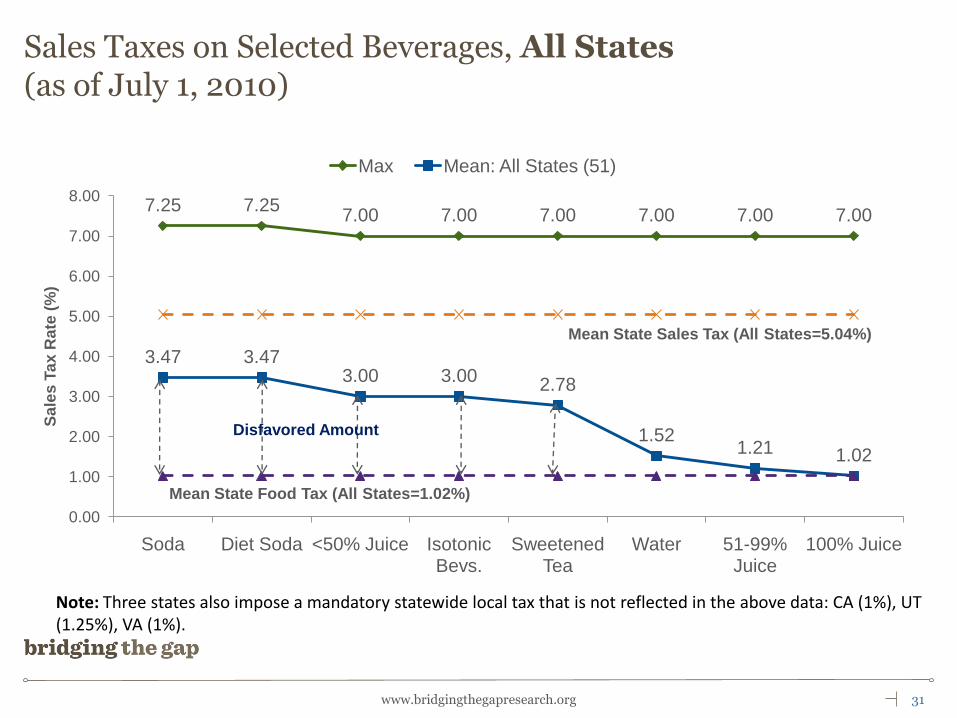
Sales Taxes on Selected Beverages, All States(as of July 1, 2010)
7.25 7.257.00 7.00 7.00 7.00 7.00 7.00
3.47 3.473.00 3.00
2.78
1.521.21 1.02
0.00
1.00
2.00
3.00
4.00
5.00
6.00
7.00
8.00
Soda Diet Soda <50% Juice Isotonic Bevs.
Sweetened Tea
Water 51-99% Juice
100% Juice
Sa
les
Ta
x R
ate
(%
)
Max Mean: All States (51)
Mean State Sales Tax (All States=5.04%)
Mean State Food Tax (All States=1.02%)
Note: Three states also impose a mandatory statewide local tax that is not reflected in the above data: CA (1%), UT (1.25%), VA (1%).
Disfavored Amount
32www.bridgingthegapresearch.org
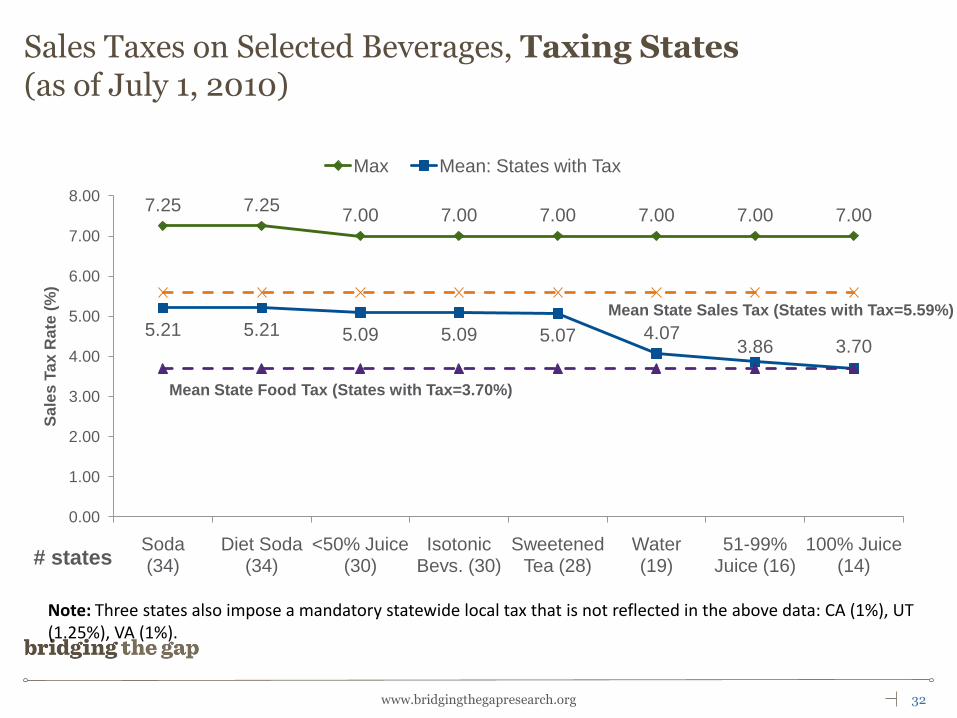
Sales Taxes on Selected Beverages, Taxing States(as of July 1, 2010)
7.25 7.257.00 7.00 7.00 7.00 7.00 7.00
5.21 5.21 5.09 5.09 5.07 4.073.86 3.70
0.00
1.00
2.00
3.00
4.00
5.00
6.00
7.00
8.00
Soda (34)
Diet Soda (34)
<50% Juice (30)
Isotonic Bevs. (30)
Sweetened Tea (28)
Water (19)
51-99% Juice (16)
100% Juice (14)
Sa
les
Ta
x R
ate
(%
)
Max Mean: States with Tax
Mean State Sales Tax (States with Tax=5.59%)
Mean State Food Tax (States with Tax=3.70%)
Note: Three states also impose a mandatory statewide local tax that is not reflected in the above data: CA (1%), UT (1.25%), VA (1%).
# states

33www.bridgingthegapresearch.org
Sales taxes applied to vending machines sales, selected beverages (as of July 1, 2010)
Mean all
states (%) Max (%) N
Mean taxing
states (%)
Soda 4.14 8.00 40 5.28
Diet Soda 4.14 8.00 40 5.28
≤ 50% fruit juice 4.02 8.00 39 5.26
Isotonic beverages 4.02 8.00 39 5.26
Sweetened teas (bottle/can) 3.90 8.00 38 5.24
Bottled water 3.38 8.00 34 5.07
>51% fruit juice, but < 100%
fruit juice 3.30 8.00 33 5.10
100% fruit juice 3.30 8.00 33 5.10
34www.bridgingthegapresearch.org
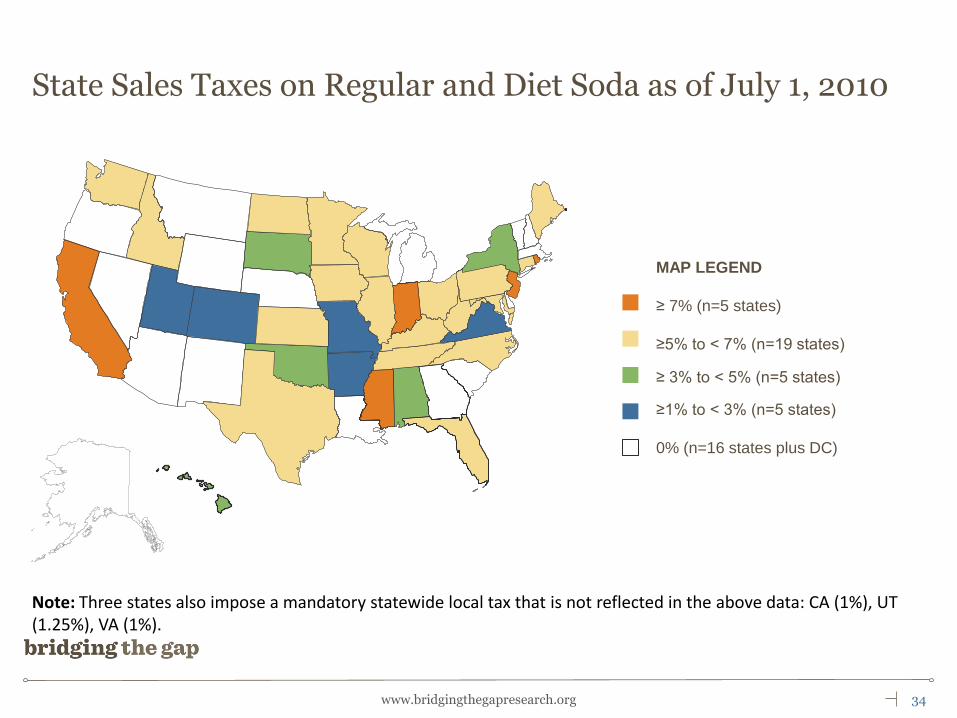
MAP LEGEND
≥ 7% (n=5 states)
≥5% to < 7% (n=19 states)
≥ 3% to < 5% (n=5 states)
≥1% to < 3% (n=5 states)
0% (n=16 states plus DC)
State Sales Taxes on Regular and Diet Soda as of July 1, 2010
Note: Three states also impose a mandatory statewide local tax that is not reflected in the above data: CA (1%), UT (1.25%), VA (1%).

35www.bridgingthegapresearch.org
Map Legend
States with excise taxes (N=3)*
States with other license/privilege fees/
Taxes (N=4)*
States with current SSB legislative
proposals (N=8 ;includes RI with an
existing tax)
States with SSB legislative proposal
that died (N=1)
States with Non-Sales* Taxes on Selected Beverages (as of 7/1/10) or SSB-related Legislative Proposals in 2010
*Additional excise/ad valorem (non-sales) taxes may be applied at the manufacturer, distributor, wholesaler,
and/or retailer levels and are applied to bottles, syrup, powders and/or mixes. Taxes apply to regular and
diet soda, isotonics, and sweetened tea in AL, AR, RI, TN, and WV. Taxes only apply to regular and
diet soda in VA and WA.
36www.bridgingthegapresearch.org
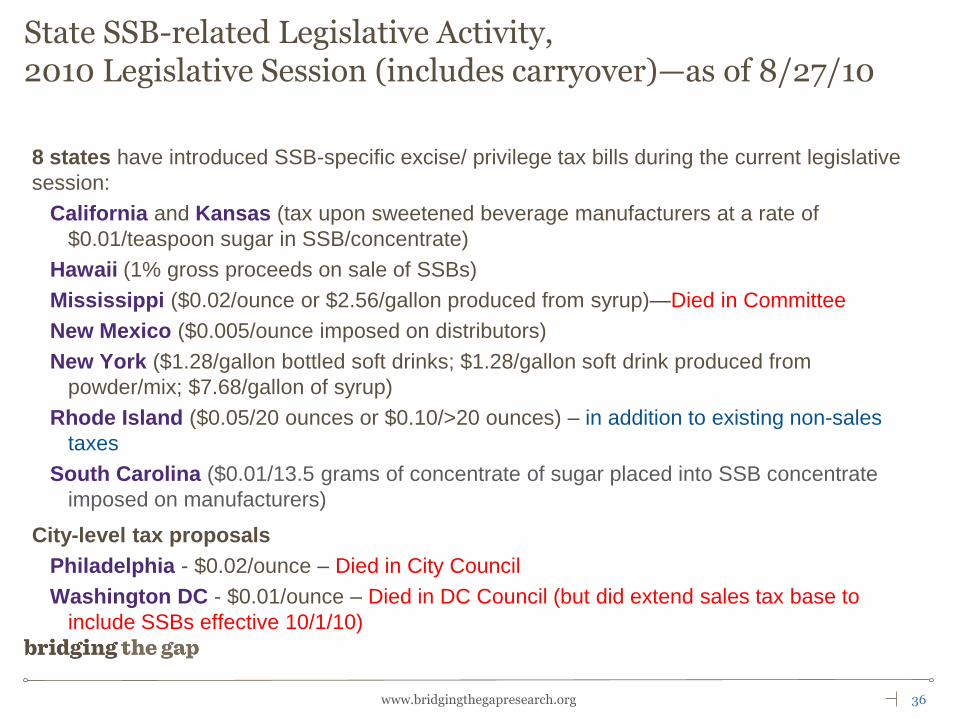
State SSB-related Legislative Activity, 2010 Legislative Session (includes carryover)—as of 8/27/10
8 states have introduced SSB-specific excise/ privilege tax bills during the current legislative
session:
California and Kansas (tax upon sweetened beverage manufacturers at a rate of
$0.01/teaspoon sugar in SSB/concentrate)
Hawaii (1% gross proceeds on sale of SSBs)
Mississippi ($0.02/ounce or $2.56/gallon produced from syrup)—Died in Committee
New Mexico ($0.005/ounce imposed on distributors)
New York ($1.28/gallon bottled soft drinks; $1.28/gallon soft drink produced from
powder/mix; $7.68/gallon of syrup)
Rhode Island ($0.05/20 ounces or $0.10/>20 ounces) – in addition to existing non-sales
taxes
South Carolina ($0.01/13.5 grams of concentrate of sugar placed into SSB concentrate
imposed on manufacturers)
City-level tax proposals
Philadelphia - $0.02/ounce – Died in City Council
Washington DC - $0.01/ounce – Died in DC Council (but did extend sales tax base to
include SSBs effective 10/1/10)
37www.bridgingthegapresearch.org
Future Research and Tax Policy Design Implications
• Evidence as we go … jurisdictions that adopt higher taxes on sugar
sweetened beverages will provide natural experiments for researchers to
examine the effectiveness of these efforts in promoting healthier dietary
intake and curbing the obesity epidemic.
• Tax Policy Design: Implications for Potential Impact on Health Outcomes
Issues of applicability to food stamp purchases
Excise tax rather than a sales tax
Incorporated at shelf price
Applicable regardless of where items are sold
Applied on a per unit basis rather than a function of price so that quantity
discounts are still taxed.
38www.bridgingthegapresearch.org
ImpacTeen
http://www.impacteen.org
Bridging the Gap
http://www.bridgingthegapresearch.org
Contact: [email protected]
Research studies presented were supported by:
The Robert Wood Johnson Foundation
Bridging the Gap ImpacTeen Project
The National Research Initiative of the USDA
Cooperative State Research, Education and Extension
Service, Grant Number 2005-35215-15372.
National Heart, Lung and Blood Institute, NIH
Award Number R01HL096664
.