Embed Size (px)
Citation preview
ROYAL GOVERNMENT OF BHUTAN MINISTRY OF WORKS & HUMAN SETTLEMENT
DEPARTMENT OF ROADS
SOClO ECONOMIC IMPACT MONITORING
Second Annual Report 2004
Bhutan Rural Access Project (BRAP)
KYINGKHOR CONSULTANCY SERVICES THIMPHU
June 2005
Table of Content
................................................................................................................................. 1 Introduction 4
................................................................................................................................. 2 Background 4 ................................................................................................................ 1.1 THE BHUTAN RURAL ACCESS PROJECT 4
1.1.1 The Project Areas (BRAP) ............................................................................................................................... 5 ............................................................................................................... 1.1.2 Present status of construction works 6
........................................................................................................... 2.1.1 Difficulties encountered by the Project 7
3 Objectives of the Study ................................................................................................................. 7 ............................................................................................................................... 4 Methodology 8
................................................................ 5 Second annual socio-economic impact monitoring survey 9 5.1 SURVEY METHODOLOGY ..................................................................................................................................... 9 5.2 RESULTS OF THE SECOND ANNUAL MONITORING SURVEY ................................................................................... 10
.......................................................................................................................................... 5.2.1 Dakpai-Buli Road 10 5.2.1 . 1 Agriculture and farming systems .......................................................................................................................... 10 5.2.1.2 Livestock ownership .............................................................................................................................................. I I
......................................................... 5.2.1.3 Main sources of income and their distribution among sample households I2 5.2.1.4 Expenditure pattern ................................................................................................................................................ 13 5.2.1 . 5 Access to social services .................................................................................................................................... 14
........................................................................................................................................................ 5.2.1 . 6 Transportation 18 5.2.1 . 7 Traffic volume survey ...................................................................................................................................... 19
............................................................................ 5.2.1.8 Change in price with control village with and without transport 21 5.2.2 Lhuentse-Dungkhar Road .............................................................................................................................. 21
5.2.2.1 Agriculture and cropping pattern .......................................................................................................................... 21 5.2.2.2 Livestock ownership .............................................................................................................................................. 22
................... ......................................................................... 5.2.2.3 Main sources of income and their distribution ...... 22 5.2.2.4 Expenditure pattern ............................................................................................................................................ 24 5.2.2.5 Access to Social services ............................................................................................................ ................... 25 5.2.2.6 Transportation .................................... ... ............................................................................................................... 29
........................................................................................................................................ 5.2.2.7 Traffic volume survey 30 5.2.2.8 Cost of transportation ........................................................................................................................................... 31 5.2.2.9 Change in price with control village with and without transport ...................................................................... 32
................................................................................................................................. 5.2.3 Bartsham-Ramjar Road 32 5.2.3.1 Agriculture and cropping pattern ........................................................................................................................ 32 5.2.3.2 Livestock ownership .......................................................................................................................................... 33 5.2.3.3 Main sources of income and their distribution ..................................................................................................... 33 5.2.3.4 Expenditure pattern ................................................................................................................................................ 35 5.2.3.5 Access to social services ............................. .. ................................................................................................... 36 5.2.3.6 Transportation ...................................................................................................................................................... 38
5.2.4 Gomkora-Tomijangsa Road .......................................................................................................................... 39 5.2.4.1 Agriculture and cropping pattern .......................................................................................................................... 39 5.2.4.2 Livestock ownership ........................................................................................................................................... 40 5.2.4.3 Main sources of income and their distribution ....................................................................................................... 40 5.2.4.4 Expenditure pattern .............................................................................................................................................. 41 5.2.4.5 Access to social services ....................... ... .......................................................................................................... 43 5.2.4.6 Transportation ...................................................................................................................................................... 46
An nexures
Annexure 1 Second Annual Survey questionnaire and checklist for focus groups
Annexure 2 Second Annual Monitoring survey checklist of questions for focus groups
Annexure 3 List of households in the surveyed project areas
Annexure 4 Terms of Reference
ABBREVIATIONS AND ACRONYMS AV :Average BHU : Basic Health Unit BRAP : Bhutan Rural Access Project CA :Commission Agent CGI :Corrugated galvanized Iron sheet DE :District Engineer DHSO :District Health Supervisory Officer DoR : Department of Roads DYT : Dzongkhag Yargay Tshogdu (District Development Committee) FCB : Food Corporation of Bhutan GYT :Geog Yargay Tsogchung or Block Development Committee H Hs : House holds KGS : Kilograms KM : Kilometers MT : Metric Ton Nu :Ngultrum (National currency) ORC :Outreach Clinic PRA : Participatory Rural Appraisal QTY :Quantity RGoB : Royal Government of Bhutan RNR : Renewable Natural Resources WFP :World Food Program
Glossary Rimdo Local Rituals Tsamdo Grazing land registered in an individual or Community Land Tseri Slash and burn system of land use Kamzhing Dryland Chuzing Wetland
1 IN'TRODUC'TION
This is the second annual monitoring report for the Bhutan Rural Access Project. The main purpose of the monitoring study is to assess the impact of project intervention through improvement of road access to rural communities of the project area. This study is expected to bring out how the project has contributed in terms of reducing the poverty through economic opportunities, access to welfare services, improving the livelihood and reducing the vulnerability of the poorer sections in remote areas of the country.
This report starts with background including a description of the BRAP. The project implementation progress is updated. In addition to the household surveys traffic surveys were conducted on some of the roads.
2 BACKGROUND
The Kingdom of Bhutan covers an estimated area of 46,500 square kilometres. The terrain is among the most rugged and mountainous in the world. Forests and very steep terrain with high altitudes cover about 72 percent of the land in the country. This has most obviously resulted in very limited area being available and suitable for agricultural and other activities. Besides natural difficulties, lack of a well-developed transportation network in Bhutan has been identified as one of the major constraints in the development of rural and specifically remote rural areas of the country.
More than 85 percent of Bhutanese population lives in rural areas that are scattered and most are inaccessible by roads. The villages are connected to the urban centres through mule tracks and foot trails. Concerted efforts are being made by RGoB to develop both the emerging urban centres and rural areas to minimize rural-urban migration of the growiug population. The rural segment of the country's population derives a living from agriculture and other such traditional activities, which are in one way or other related to cultivation. Most of the rural settlements in the country are located in far off hinterlands without an access road. This has proved to be a major bottleneck in the over-all development.
National highways, district roads, feeder roads, forest and "farm to market" roads form the typology of road network in Bhutan. The total road network in Bhutan today consists of about 3,746 (Road Master Plan 2001) and the main routes consist of an east-west highway and four north-south highways. However, there are areas that are accessible only by mule tracks, foot trails, and cantilevers and suspension bridges.
Many feeder roads have already been constructed with the objective of increasing accessibility to remote parts of the country. Construction of roads, in general leads to increased spatial mobility of people and goods between rural and urban communities. The movement of goods between two areas or regions activates the flow of capital, trade, and technology and consumption behaviour. The main aim of developing feeder road network, therefore, has been to provide the population residing in the remote and difficult areas with better access to health, education, agricultural market and other social facilities or services.
1.1 The Bhutan Rural Access Project
Rural road infrastructure is critical not only for economic development of the area and its population, but also contributes significantly to overall social development of the area with better access to social services such as health, education, and RNR. Besides providing improved transport services, it would reduce travel time and transport costs and it opens new economic and employment opportunities through linkages to new markets, production centres and other areas of
economic opportunities. Thus, there is a strong link between transport and poverty reduction and overall social development in the area.
' The Royal Government of Bhutan (RGoB) is implementing the Rural Access Project in selected Dzongkhags with credit from the World Bank. The project, being implemented through the Department of Roads (DoR), is carrying out environment friendly road construction in the four Dzongkhags of Zhemgang, Trashigang, Trashiyangtse and Lhuentse. Besides providing improved transport services, it would reduce travel time and transportation costs. It also opens up new economic and employment opportunities by developing linkages to new markets, production centres and other areas of economic opportunities. Very remote areas would benefit through the proposed access road development. The project also aims to provide a framework and a guiding line towards 'sustainable development' through environmental friendly road construction methods and by encouraging and ensuring community participation in construction and maintenance.
The project has been prepared using extensive participatory processes through detailed Social, Environmental and Technical Assessments and a Quality at Entry Review by an independent Quality Assurance Group (QAG) from the World Bank has commended the project objectives, design and preparatory work. However, the QAG team has emphasised the need for close and effective monitoring of the project and its impacts so that the good intentions of the project could be converted into results on the ground for the communities. In particular the Bank review has emphasised the need for paying specific attention to the following aspects:
Monitoring of project outcomes rather than merely project outputs How the poorer sections of the community benefit Are there adverse impacts on vulnerable households (poor, landless/marginal farmers, portering households, households affected directly or indirectly due to land acquisitionlroad construction) and marginalised local social groups (including indigenous communities if any in accordance with Bank OD 4.20) Impact on women
Also the BRAP has been a pioneering project in one sense that the cost-benefit evaluation during appraisal has considered social benefits of qualitative nature and quantified these. Such benefits are often not considered in conventional evaluation which considers only narrow direct economic benefits. Given such a background, there is much to learn from the project and hence there is a need to continuously monitor the project Impacts, both positive and negative, on a systematic manner on a continuous basis and take remedial actions where necessary.
1 .I .I The Project Areas (BRAP)
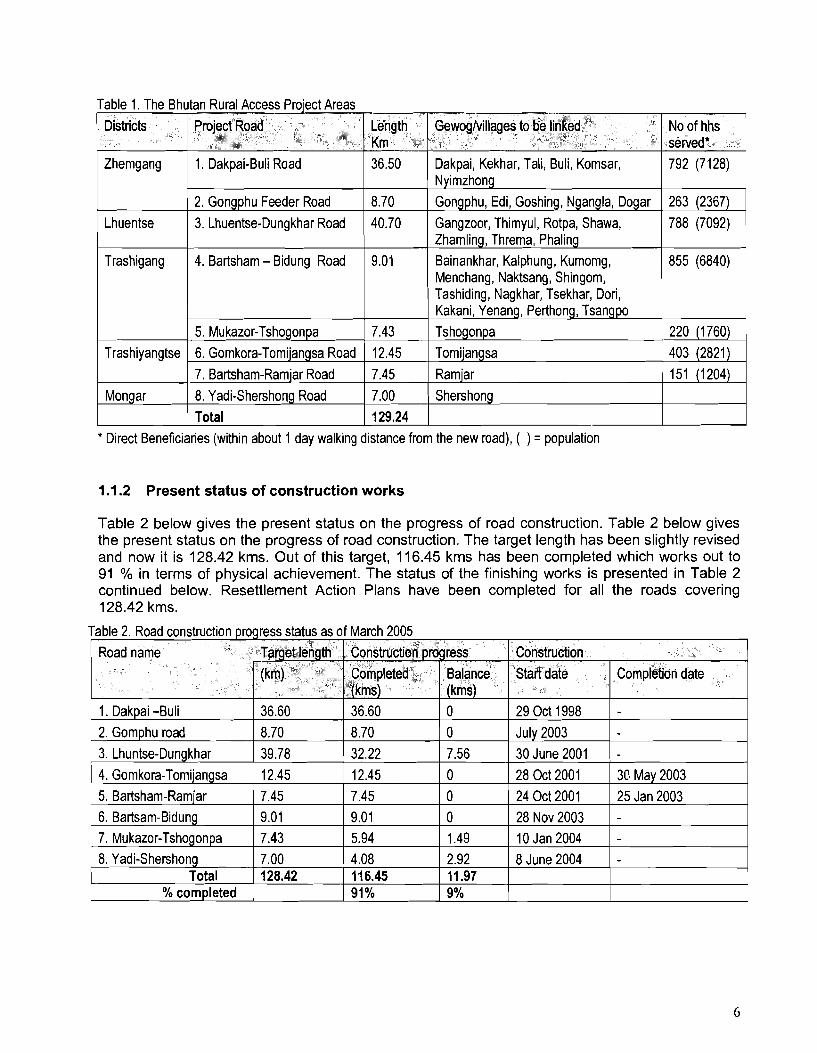
The BRAP area covers four districts of Zhemgang, Lhuentse, Trashigang and Trashiyangtse (Table 1). In total the project supports construction of 121.7 kms of rural access roads. In Zhemgang, the feeder road of 37 km will pass through two major villages of Kekhar and Tali and connect Buli with Dakpai under Nangkhor Geog in middle Kheng. In addition, the project influence will undoubtedly spread across to other remote neighbouring Geogs, Bardo and Shingkhar. In Lhuentse, the proposed road of 47 km will connect the remote Dungkar Geog with Gangzoor. Contrary to Dungkar, which is gently sloping, Gangzoor is highly rugged with scattered villages. In Trashigang, four feeder roads are proposed covering a total length of the 20 kms. In Trashiyangtse, three feeder roads of about 20 kms are proposed. The first feeder road of 12.7 kms will connect Tomijaqgsa with Gomkora, the second Bartsham with Ramjar (7 km) and the third Toetsho with Khamdang Geog (5km).
The planned feeder roads of 121.7 kms will directly benefit about 4,248 households of the four districts.
1 Mongar 1 8. Yadi-Shershong Road 1 7.00 ( Shershong
Zhemgang 1. Dakpai-Buli Road 36.50 Dakpai, Kekhar, Tali, Buli, Komsar, Nyimzhong
2. Gongphu Feeder Road 8.70 Gongphu, Edi, Goshing, Ngangla, Dogar Lhuentse 3. Lhuentse-Dungkhar Road 40.70 Gangzoor, Thimyul, Rotpa, Shawa,
Zhamling, Threma, Phaling
Trashigang 4. Bartsham - Bidung Road 9.01 Bainankhar, Kalphung, Kumomg,
/ Total 1 129.24 1
Trashiyangtse
* Direct Beneficiaries (within about 1 day walking distance from the new road), ( ) = population
1.1.2 Present status of construction works
5. Mukazor-Tshogonpa 6. Gomkora-Tomijangsa Road
7. Bartsham-Ramjar Road
Tab le 2 below g ives t he present status on the progress o f road construction. Table 2 be low gives the present status on the progress o f road construction. T h e target length h a s b e e n slightly revised a n d n o w i t is 128.42 kms. O u t o f this target, 116.45 k m s has been completed which works ou t t o 91 Oh in te rms o f physical achievement. T h e status o f the finishing works is presented i n Table 2 cont inued below. Resett lement Act ion Plans have b e e n completed fo r all the roads covering 128.42 kms.
7.43 12.45
7.45
2. Gom p hu road 1 8.70 8 . 7 0 10 I I - I July 2003 I I I I
Menchang, Naktsang, Shingom, Tashiding, Nagkhar, Tsekhar, Dori, Kakani, Yenang, Perthong, Tsangpo Tshogonpa Tomijangsa
Ramjar
Table 2. Road construction progress status as of March 2005
1 3. Lhuntse-Dungkhar 1 39.78 ( 32.22 1 7.56 1 30 June 2001 1 -
Road name
1. Dak~a i -Buli
Target length -,
(km) :& - 4 2-** ,
36.60
4. Gomkora-Tornijangsa 5. Bartsharn-Ramjar 6. Bartsam-Bidung 7. Mukazor-Tshogonpa 8. Yadi-Shershong
Total % completed
12.45 7.45 9.01 7.43
: Construction progress
7.00 128.42
=Completed % * . fkms) 36.60
Construction
12.45 7.45 9.01 5.94
Balance (kms) 0
start d d e
29 Oct 1998
4.08 11 6.45 91 %
Completion date
0 0 0 1.49 2.92 11.97 9%
28 Oct 2001 24 Oct 2001 28 Nov2003 10 Jan 2004 8 June 2004
30 May 2003
25 Jan 2003 -
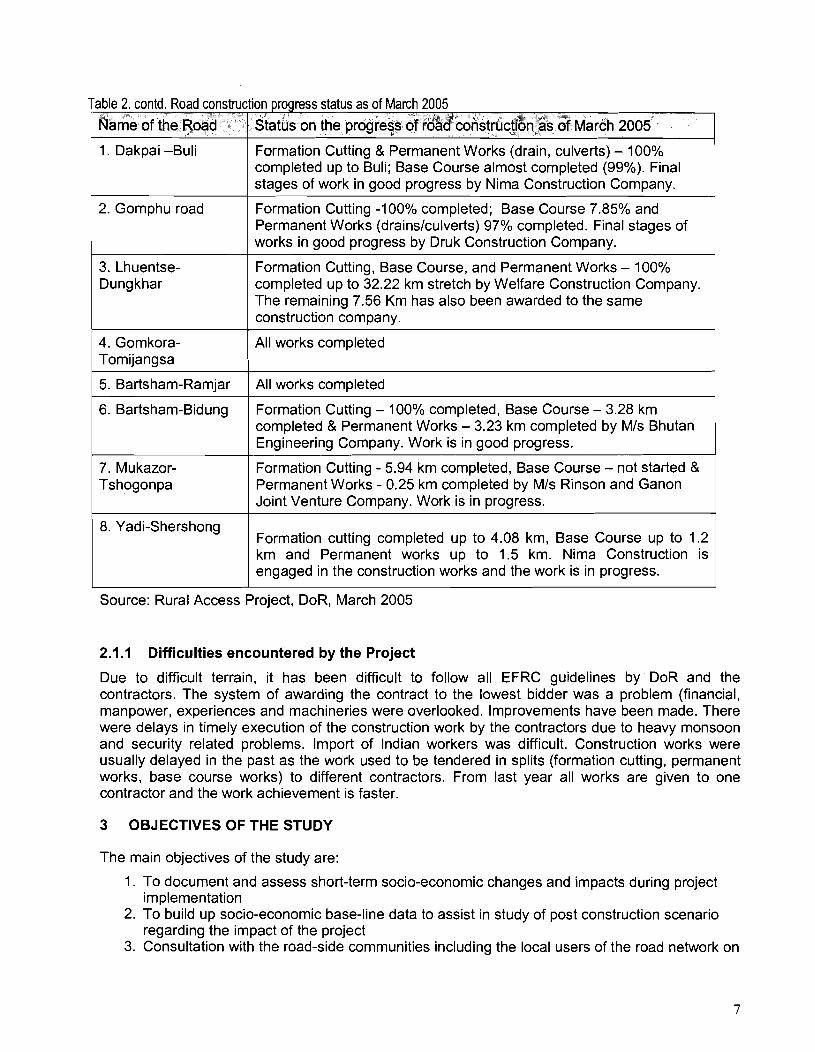
Table 2. contd. Road construction progress status as of March 2005 I Name of the Road 1 Status on the progress of ~oadconstructiofl'as bi March 2005
1 1. Dakpai -Buli Formation Cutting & Permanent Works (drain, culverts) - 100% completed up to Buli; Base Course almost completed (99%). Final stages of work in good progress by Nima Construction Company.
2. Gomphu road Formation Cutting -100% completed; Base Course 7.85% and Permanent Works (drainslculverts) 97% completed. Final stages of works in good progress by Druk Construction Company.
3. Lhuentse- Dungkhar
Formation Cutting, Base Course, and Permanent Works - 100% completed up to 32.22 km stretch by Welfare Construction Company. The remaining 7.56 Km has also been awarded to the same construction company.
5. Bartsham-Ramjar I All works completed ~ 4. Gomkora- Tomijangsa
6. Bartsham-Bidung
All works completed
7. Mukazor- Tshogonpa
Formation Cutting - 100% completed, Base Course - 3.28 km completed & Permanent Works - 3.23 km completed by MIS Bhutan Engineering Company. Work is in good progress.
Formation Cutting - 5.94 km completed, Base Course - not started & Permanent Works - 0.25 km completed by MIS Rinson and Ganon Joint Venture Company. Work is in progress.
I engaged in the construction works and the work is in progress.
Source: Rural Access Project, DoR, March 2005
8. Yadi-Shershong
2.1 .I Difficulties encountered by the Project
Formation cutting completed up to 4.08 km, Base Course up to 1.2 km and Permanent works up to 1.5 km. Nima Construction is
Due to difficult terrain, it has been difficult to follow all EFRC guidelines by DoR and the contractors. The system of awarding the contract to the lowest bidder was a problem (financial, manpower, experiences and machineries were overlooked. Improvements have been made. There were delays in timely execution of the construction work by the contractors due to heavy monsoon and security related problems. Import of Indian workers was difficult. Construction works were usually delayed in the past as the work used to be tendered in splits (formation cutting, permanent works, base course works) to different contractors. From last year all works are given to one contractor and the work achievement is faster.
3 OBJECTIVES OF THE STUDY
The main objectives of the study are:
1. To document and assess short-term socio-economic changes and impacts during project implementation
2. To build up socio-economic base-line data to assist in study of post construction scenario regarding the impact of the project
3. Consultation with the road-side communities including the local users of the road network on
the outcome of improved transportation in the area 4. Assessment of any short-term impact of the project on -
Reducing poverty through employment and economic opportunities Changes occurring in the agricultural output and practices Opening of new shops and commercial enterprises Improvement in access to welfare services Reducing the vulnerability of the poor people and1 or indigenous groups, if any and Enhancing their participation in the project.
5. Identification of current role of transportation in community life and potential improvements which could be assisted or would result due to the project.
As per the terms of reference outlined the scope of work includes preparation of annual monitorirrg report documenting progress includiug key activities, outputs, outcome, major findings, lessons learnt and remediallsupportive actions needed for each project.
4 METHODOLOGY
The method comprises a set of surveys and methodologies, which in combination will reveal short term as well as long term socio-economic changes in the project areas. The methodologies, chosen to present here, are all common methodologies well known to social scientists. The main characteristics are based on standardized methodologies, involving both structured and non- structured interviews. To obtain a clear picture of socio-economic impact, the whole set of methods are used.
The set of surveys could grouped into :
Baseline survey, including traffic volume survey. Annual surveys on socio-economic effects, including traffic volume survey
Baseline survey was carried out in June-July 2003. The purpose of this survey was to prepare a data bank and thereby obtain information to measure social and economic changes during and after the project implementation. The survey is statistical in character and is detailed, but only comprise variables and parameters relevant to the purpose, such as:
Changes in agriculture and livestock production Incomes and expenditure Access to services Economic and social conditions
Traffic volume survey was implemented at the sane time as the baseline survey. This is a repetitive study to be carried out before the road construction and on an annual basis. Some of the key indicators for transport providers are:
Ownership Tonnage transported Passengers transported Operational rarrge Cost of transportation Operational frequency
Annual impact monitoring surveys on socio-economic effects is implemented every year starting from 2003. The procedure is to repeat the baseline study, but focus on qualitative data and on
traffic volume count. Variables like family structure, demographic situation, health, family planning, education level, need not be thoroughly reviewed. Impact related to these variables can only be seen in long perspectives and does not show in a study of immediate results after and input. Study on these variables will be carried out in the impact survey at a later stage.
The field survey will include PRA exercises, interviews with road side communities particularly the poor and other vulnerable among them and also group discussions with different economic and social groups. A semi-structured questionnaire will be used to carry out individual and group household interviews. Discussions will be carried out with the project contractors, project management staff and others to assess the steps taken to involve vulnerable sections of the road side communities in project design and implementation. Similar discussions will also be held with officials of the Dzongkhag Administration to find out increase, if any, in the demand for services from them by the local population after improved road transport.
The long term objective of creating rural access is to raise the living standards of the people. By creating the access it is assumed that the beneficiaries will have improved access to services. Compared to the baseline data, the scenario during each monitoring will map a progressive change in the socio- economic status of the household areas in the project areas. During such monitoring, the sample population will be visited to make a true comparison with the baseline data. The suggested indicators will be monitored at the community and household level. As indicated, it will be possible to monitor mainly the short term indicators during the initial years of evaluation.
5 SECOND ANNUAL SOCIO-ECONOMIC IMPACT MONITORING SURVEY
5.1 Survey Methodology
It followed almost the same pattern as the first Annual Monitoring survey with much more emphasis on the qualitative aspects and short term effects. The survey was carried out in December 2004- January 2005. For the completed roads and the roads nearing completion, the second annual impact monitoring was conducted on the following four roads:
Total length (kms) status
Dakpai-Buli 37 Nearing completion
Lhuentse-Dungkhar 40 Nearing completion
Bartsham-Ramjar 7.5 Completed
Gomkora-Tomijangsa 12.45 Completed
The survey aimed at measuring immediate socio-economic effects of the project inputs. The qualitative data collection did not include all parameters specially those of long term in nature. Recall methods was also used durirlg the survey to capture the information of the past. Attempts were made to include the same households surveyed covered by the Social Assessment.
The main features of the second a,nnual monitoring survey were:
Quantitative, repetitive of baseline survey, but with reduced number of quantitative parameters Qualitative, emphasis on qualitative methodologies: Comparatively small sample size with emphasis on density of information through e.g. observation, dialogue Separate focus group discussions were conducted involving the beneficiaries of each road. Two villages for Lhuentse-Dungkhar raod and one village for Dakpai-Buli road were
selected as control villages to compare the change in prices with and without transport Changes at the geog level as observed by the Gup and geog staff were collected. (Questionnaire No 2 Annexure 1)
A separate traffic volume survey was conducted in February 2005 on two roads (Dakpai-Buli and Lhuentse - Dungkhar)
Quantitative aspects, based on numeric traffic count of providers and users of transport services Key Indicators: ownership of vehicles, tonnage, operational length, frequency, fares, purpose of journey
As with the first annual survey, the second annual monitoring survey consisted of household level interviews and focus group discussions with semi-structured interviewing with the help of checklist (Annexure 1 and 2). The monitoring focussed on "after the road" scenario. For the semi-structured interview, following numbers of sample households from each of the roads (within the baseline sample) were randomly taken.
Following sample households were included for the household survey.
Name of the Road Nos of Villages covered by survey Geog, Dzongkhag Total direct sample hhs beneficiary hhs
Dakpai-Buli 41 Buli, Kikhar, Tali Nangkhor, Zhemgang 284 Lhuentse-Dungkhar 35 Gangjur, Thimyul, Lingabi, Gangjur, Lhuentse 566
Rotpa, Shawa, Thrima Bartsham-Ramjar 15 Ramjar Ramjar, Trashiyangtse 301 Gornkora-Tomijangsa 29 Bainankhar, Tomijangsa Tomijangsa, 557
Trashiyangtse
The same households from the baseline and first annual monitoring survey were visited during the second annual monitoring survey. Findings from the household interviews, focused group discussions, and traffic volume surveys were compared with the baseline surveylthe first annual monitoring survey. A detailed list of the households covered by the survey is given on Annexure 3.
5.2 Results of the second annual monitoring survey
As in the first annual monitoring, emphasis was given to look at the short term impacts of the road. The variables and parameters used were cropping pattern, income and expenditure patterns, transport, access to social services, and traffic volume with tonnage transported, cost of transportation, time saved etc.
5.2.1 Dakpai-Buli Road
The Dakpai-Buli road passes through two major villages of Kikhar and Tali and connects Buli with Dakpai under Nangkhor Geog of Zhemgang. Except for proper Kikhar the households are quite scattered. It also indirectly serves the far flung geogs of Badro and Shingkhar.
41 households of Buli, Kikhar and Tali were covered by the survey. The construction of the road up to Buli has been almost completed
5.2.1.1 Aqriculture and farminq systems
Among the 41 households surveyed, there was not much change in the cereal crops production
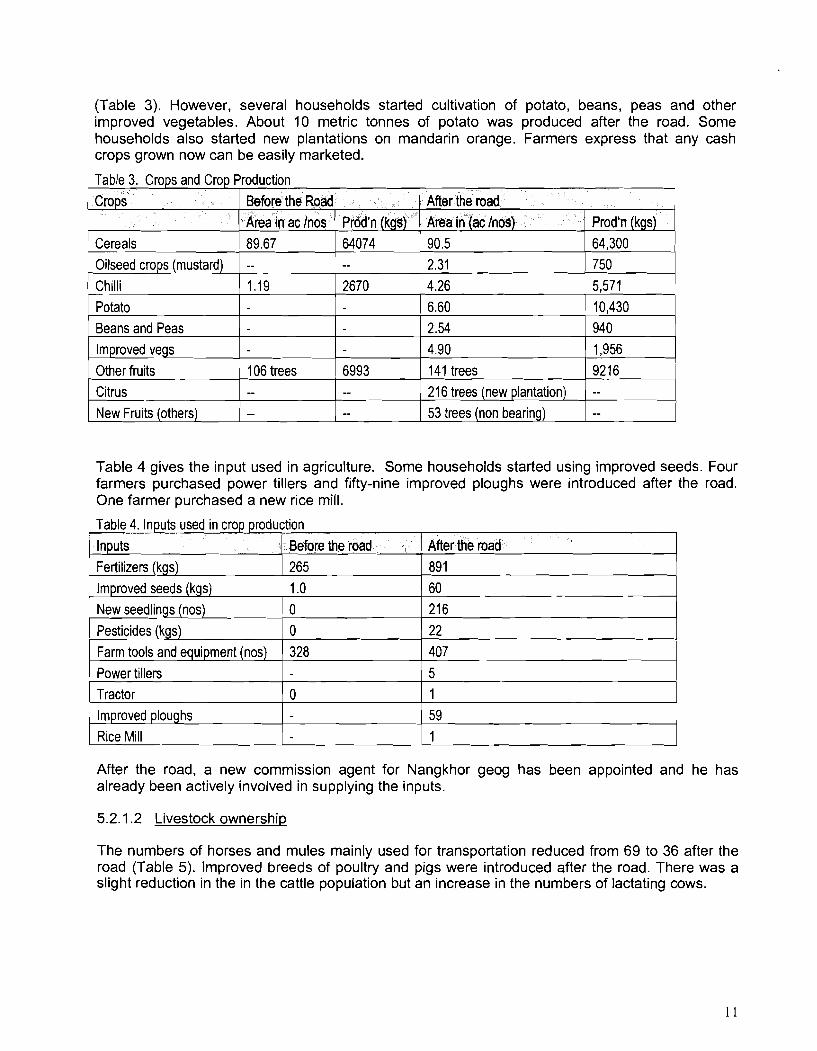
(Table 3). However, several households started cultivation of potato, beans, peas and other improved vegetables. About 1 0 metric tonnes of potato was produced after the road. Some households also started new plantations on mandarin orange. Farmers express that any cash crops grown now can be easily marketed.
Table 3. Crops and Crop Production
Crops Before the Road After the road
Citrus -- pp
New Fruits (others) --
Cereals 1 89.67
1 potato Beans and Peas
Table 4 gives the input used in agriculture. Some households started using improved seeds. Four farmers purchased power tillers and fifty-nine improved ploughs were introduced after the road. One farmer purchased a new rice mill.
64074 --
2670 Oilseed crops (mustard) Chilli
Table 4, Inputs used in crop production Inputs I Before the road 1 After the road
I I
--
1.19
4.90 1,956 ---- Other fruits I 106 trees 6993 141 trees 9216
90.5 2.31 4.26
I 6.60 ) 10,430
1 Rice Mill I I - 1 I
64,300 750 5.571
2.54
New seedlings (nos) 0 216 Pesticides (kgs) 0 22
After the road, a new commission agent for Nangkhor geog has been appointed and he has already been actively involved in supplying the inputs.
940
,
5.2.1.2 Livestock ownership
The numbers of horses and mules mainly used for transportation reduced from 69 to 36 after the road (Table 5). Improved breeds of poultry and pigs were introduced after the road. There was a slight reduction in the in the cattle population but an increase in the numbers of lactating cows.
Farm tools and equipment (nos) Power tillers Tractor
I lm~roved ~louahs
328
0
407 5 1 59
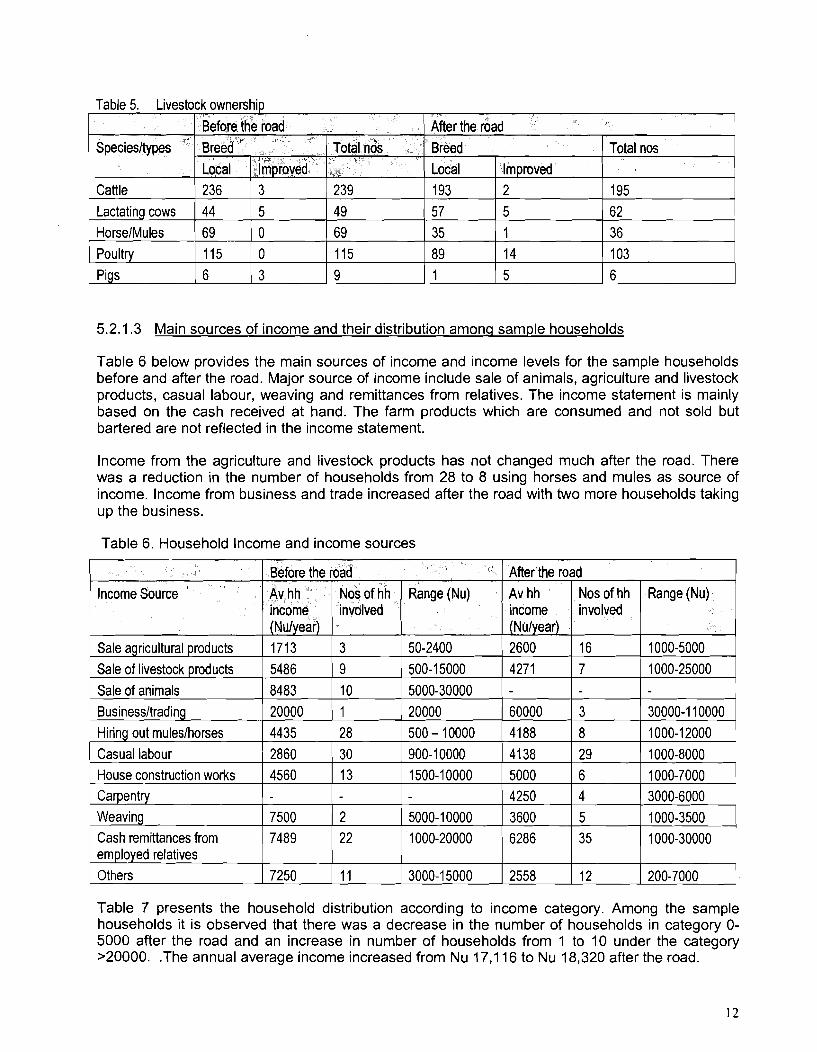
Table 5. Livestock ownership
Cattle
HorselMules
5.2.1.3 Main sources of income and their distribution amonq sample households
~ Speciesltypes
Poultry Pigs
Table 6 below provides the main sources of income and income levels for the sample households before and after the road. Major source of income include sale of animals, agriculture and livestock products, casual labour, weaving and remittances from relatives. The income statement is mainly based on the cash received at hand. The farm products which are consumed and not sold but bartered are not reflected in the income statement.
236
69
lncome from the agriculture and livestock products has not changed much after the road. There was a reduction in the number of households from 28 to 8 using horses and mules as source of income. lncome from business and trade increased after the road with two more households taking up the business.
Breed Total nos
115 6
Table 6. Household lncome and income sources
/ Breed Local I improved
I
3 I 239
0 3
Total nos
193
35 v v v
0
Table 7 presents the household distribution according to income category. Amorlg the sample households it is observed that there was a decrease in the number of households in category O- 5000 after the road and an increase in number of households from 1 to 10 under the category >20000. .The annual average income increased from Nu 17,116 to Nu 18,320 after the road.
69 115 9
Income Source
Sale agricultural products Sale of livestock products Sale of animals
1 Businessltrading
2 5 1
After the road
195
36 89 1
Before the road
Hiring out muleslhorses 4435 28 500 - I0000 41 88
House construction works Carpentry Weaving Cash remittances from
7250 11 2558 12 Others 3000-1 5000 200-7000
20000
Range (Nu)
1000-5000 1000-25000
Av hh income (Nulyear) 2600 4271
14 5
Range (Nu)
50-2400 500-1 5000 5000-30000
Nos of hh involved
16 7
Av hh income (Nulyear) 1713 5486 8483
1
103 6
Nos of hh involved
3 9 10
20000 60000 3 30000-1 I0000
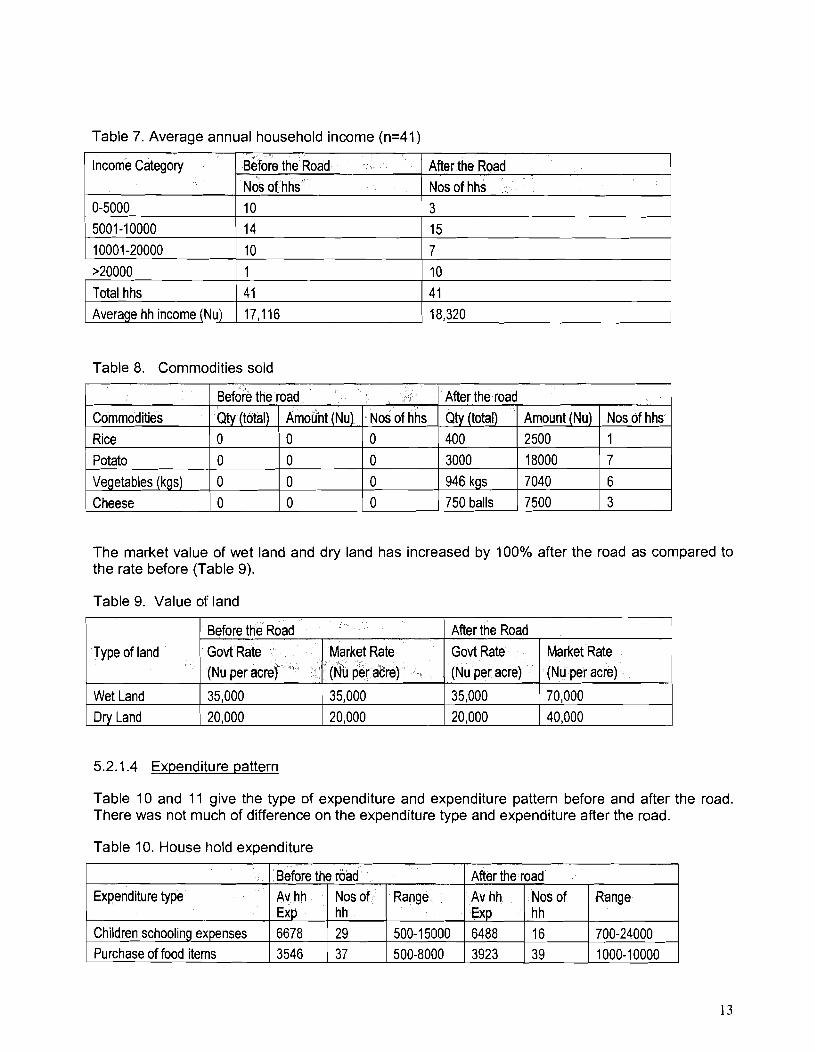
Table 7. Average annual household income (n=41)
Table 8. Commodities sold
Income Category
0-5000 5001 -1 0000 10001 -20000
>20000 Total hhs
Average hh income (Nu)
The market value of wet land and dry land has increased by 100% after the road as compared to the rate before (Table 9).
Before the Road Nos of hhs 10 14
10 1 4 1
17,116
Commodities Rice Potato
Vegetables (kgs) Cheese
Table 9. Value of land
After the Road Nos of hhs 3 15 7 10
4 1 18,320
5.2.1.4 Expenditure pattern
Before the road
Table 10 and 11 give the type of expenditure and expenditure pattern before and after the road. There was not much of difference on the expenditure type and expenditure after the road.
Qty (total) 0 0 0 0
After the road
Type of land
Wet Land Dry Land
Table 10. House hold expenditure
Qty (total) 400 3000 946 kgs 750 balls
After the Road
Amount (Nu) 0 0 0 0
Govt Rate (Nu per acre)
35,000 20,000
Before the Road
Nos of hhs 0
0 0 0
Amount (Nu) 2500 18000 7040 7500
Market Rate (Nu per acre)
70,000 40,000
Govt Rate (Nu per acre)
35,000 20,000
Expenditure type
Children schooling expenses Purchase of food items
Nos of hhs 1
7
6 3
Market Rate (Nu per acre)
35,000 20,000
Before the road Av hh Exp 6678 3546
After the road Av hh Exp 6488 3923
Nosof hh
29 37
Range
500-1 5000 500-8000
Nos of hh 16 39
Range
700-24000 1000-1 0000
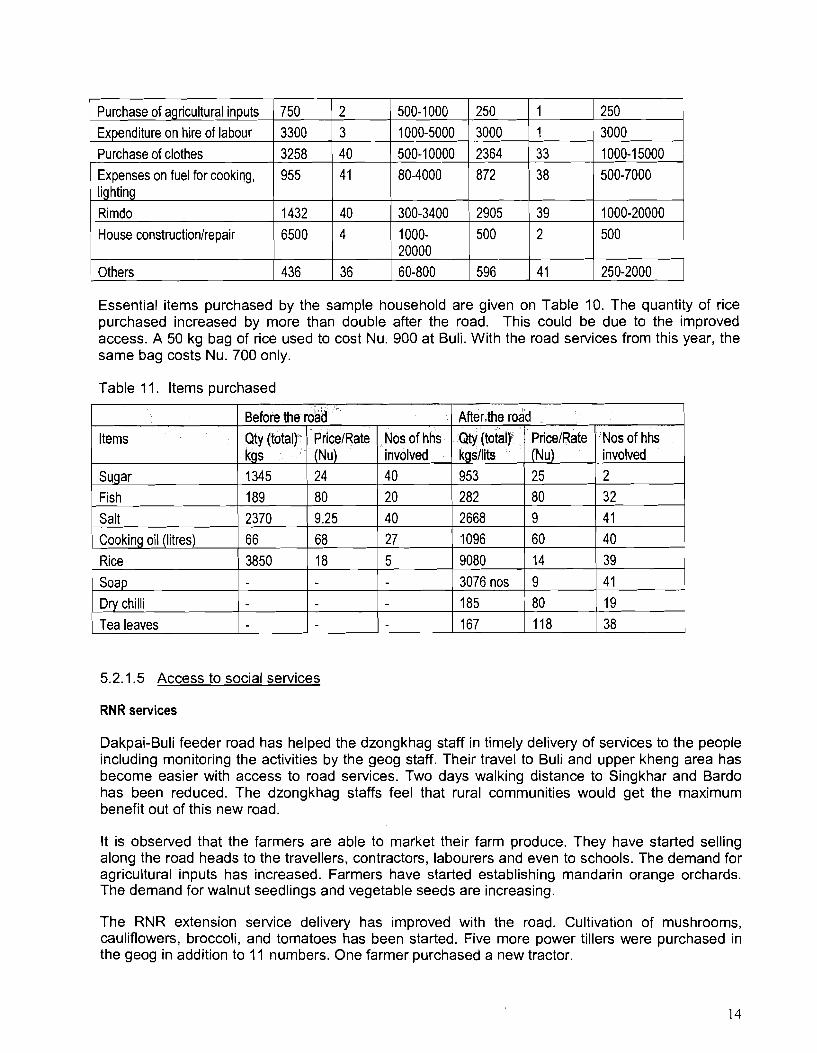
Essential items purchased by the sample household are given on Table 10. The quantity of rice purchased increased by more than double after the road. This could be due to the improved access. A 5 0 kg bag of rice used to cost Nu. 9 0 0 at Buli. With the road services from this year, the same bag costs Nu. 700 only.
I
Table 11. ltems purchased
5.2.1.5 Access to social services
Purchase of agricultural inputs Expenditure on hire of labour
Purchase of clothes
Expenses on fuel for cookiqg, lighting
Rimdo
House constructionlrepair
RNR services
2 3
40 41
40 4
750 3300 3258 955
1432
6500
1 Others
Items
Sugar Fish
Salt
Cooking oil (litres)
Rice
Soap Dry chilli
Tea leaves
Dakpai-Buli feeder road has helped the dzongkhag staff in timely delivery of services to the people including monitoring the activities by the geog staff. Their travel to Buli and upper kheng area has become easier with access to road services. Two days walking distance to Singkhar and Bardo has been reduced. The dzongkhag staffs feel that rural communities would get the maximum benefit out of this new road.
36 436
After the road
It is observed that the farmers are able to market their farm produce. They have started selling along the road heads to the travellers, contractors, labourers and even to schools. The demand for agricultural inputs has increased. Farmers have started establishing mandarin orange orchards. The demand for walnut seedlings and vegetable seeds are increasing.
500-1000 1000-5000 500-10000 80-4000
300-3400
1000- 20000
Before the road
The RNR extension service delivery has improved with the road. Cultivation of mushrooms, cauliflowers, broccoli, and tomatoes has been started. Five more power tillers were purchased in the geog in addition to 1 1 numbers. One farmer purchased a new tractor.
60-800
Nos of hhs involved 2 32 4 1
40 39 41 19 38
Qty (total) kgsllits 953 282 2668 1096 9080
3076 nos 185 167
250
3000 2364 872
2905 500
Nos of hhs involved 40 20 40 27 5
PricelRate (Nu) 25 80 9 60 14
9 80 118
Qty (total) kgs 1345 189 2370 66
3850
596
PricelRate (Nu) 24 80 9.25
68 18
1 1 33
38
39 2
250 3000 1000-1 5000 500-7000
1000-20000 500
41 250-2000
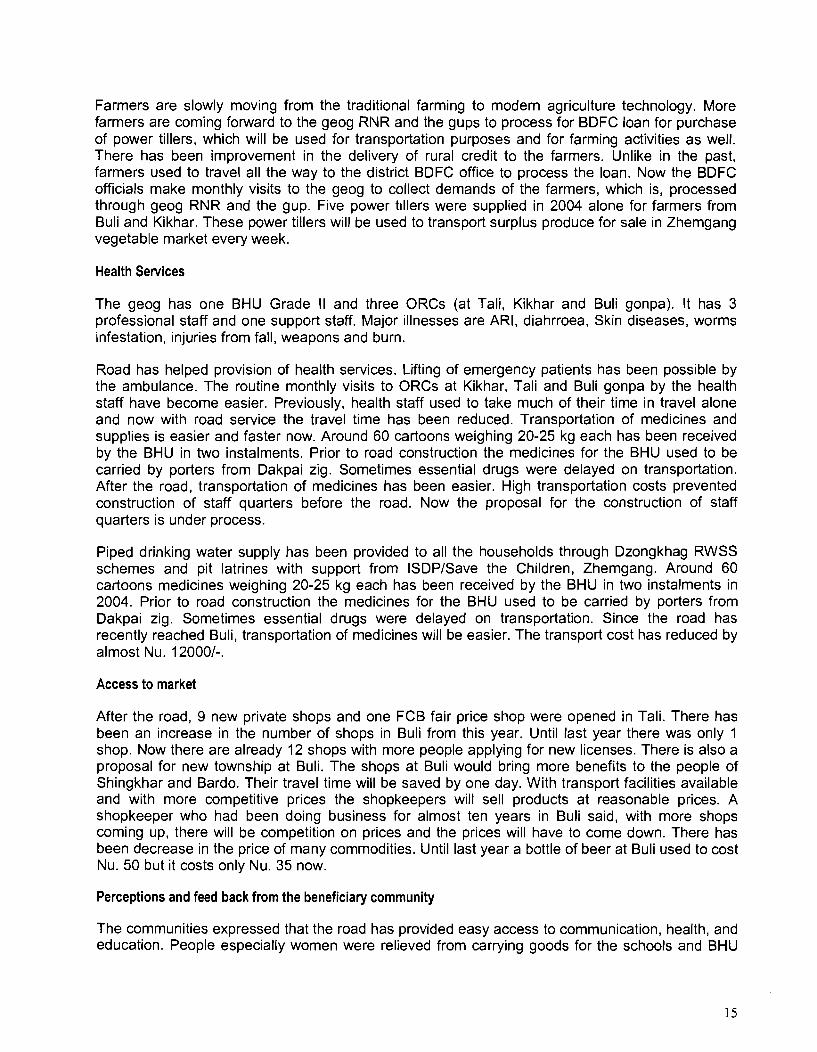
Farmers are slowly moving from the traditional farming to modern agriculture technology. More farmers are coming forward to the geog RlVR and the gups to process for BDFC loan for purchase of power tillers, which will be used for transportation purposes and for farming activities as well. There has been improvement in the delivery of rural credit to the farmers. Unlike in the past, farmers used to travel all the way to the district BDFC office to process the loan. Now the BDFC officials make monthly visits to the geog to collect demands of the farmers, which is, processed through geog RNR and the gup. Five power tillers were supplied in 2004 alone for farmers from Buli and Kikhar. These power tillers will be used to transport surplus produce for sale in Zhemgang vegetable market every week.
Health Services
The geog has one BHU Grade II and three ORCs (at Tali, Kikhar and Buli gonpa). It has 3 professional staff and one support staff. Major illnesses are ARI, diahrroea, Skin diseases, worms infestation, injuries from fall, weapons and burn.
Road has helped provision of health services. Lifting of emergency patients has been possible by the ambulance. The routine monthly visits to ORCs at Kikhar, Tali and Buli gonpa by the health staff have become easier. Previously, health staff used to take much of their time in travel alone and now with road service the travel time has been reduced. Transportation of medicines and supplies is easier and faster now. Around 60 cartoons weighing 20-25 kg each has been received by the BHU in two instalments. Prior to road construction the medicines for the BHU used to be carried by porters from Dakpai zig. Sometimes essential drugs were delayed on transportation. After the road, transportation of medicines has been easier. High transportation costs prevented construction of staff quarters before the road. Now the proposal for the construction of staff quarters is under process.
Piped drinking water supply has been provided to all the households through Dzongkhag RWSS schemes and pit latrines with support from ISDPlSave the Children, Zhemgang. Around 60 cartoons medicines weighing 20-25 kg each has been received by the BHU in two instalments in 2004. Prior to road construction the medicines for the BHU used to be carried by porters from Dakpai zig. Sometimes essential drugs were delayed on transportation. Since the road has recently reached Buli, transportation of medicines will be easier. The transport cost has reduced by almost Nu. 120001-.
Access to market
After the road, 9 new private shops and one FCB fair price shop were opened in Tali. There has been an increase in the number of shops in Buli from this year. Until last year there was only 1 shop. Now there are already 12 shops with more people applying for new licenses. There is also a proposal for new township at Buli. The shops at Buli would bring more benefits to the people of Shingkhar and Bardo. Their travel time will be saved by one day. With transport facilities available and with more competitive prices the shopkeepers will sell products at reasonable prices. A shopkeeper who had been doing business for almost ten years in Buli said, with more shops coming up, there will be competition on prices and the prices will have to come down. There has been decrease in the price of many commodities. Until last year a bottle of beer at Buli used to cost Nu. 50 but it costs only Nu. 35 now.
Perceptions and feed back from the beneficiary community
The communities expressed that the road has provided easy access to communication, health, and education. People especially women were relieved from carrying goods for the schools and BHU
and they will have more time for farming and household activities.
With availability of transport services the travel time has been saved. Transportation of household and consumables items is easier and cheaper now. Framers expressed that they do not have to carry loads from Dakpai any more. People could easily hire taxis for transportation of goods or could take it by bus. Visits by relatives and family members staying outside have increased. Access to market has improved. Farmers' report that now it is possible to sell vegetables and livestock products. Farmers have started planting more oranges seedling and walnut after the road. Road has helped most farmers to earn income through wage labour. Road has also provided employment for students on vacation.
The community is willing to take up any maintenance works of the road. Road have eased farmers form carrying goods for schoolslBHU. There is a proposal to supply power along the project road by June 2005. The telephone facilities in Kikhar and Buli have helped farmers to make calls outside especially to their relatives and family members staying in other districts.
Farmers' living standard would further improve with electricity supply in the geog, which is expected to be completed by June 2005. Had there been no road in the geog, electricity supply would not have come to their villages so early said one farmer. The telephone facilities in Kikhar and Buli have helped farmers to make calls outside especially to their relatives and family members staying in other districts. Movement of people from the village to outside the geog has increased especially with the introduction of bus services from Tali to Gelephu. Access to health services has improved with the road. Patient referral to the hospital has become easier with road facility and telephone services.
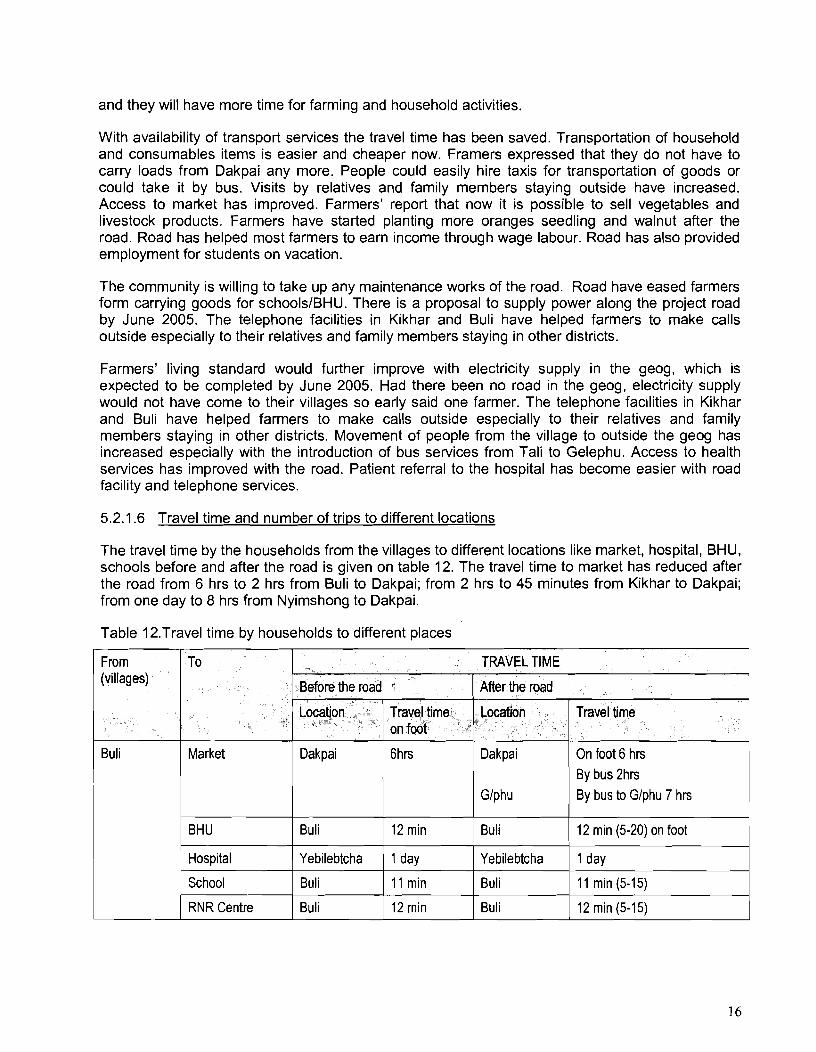
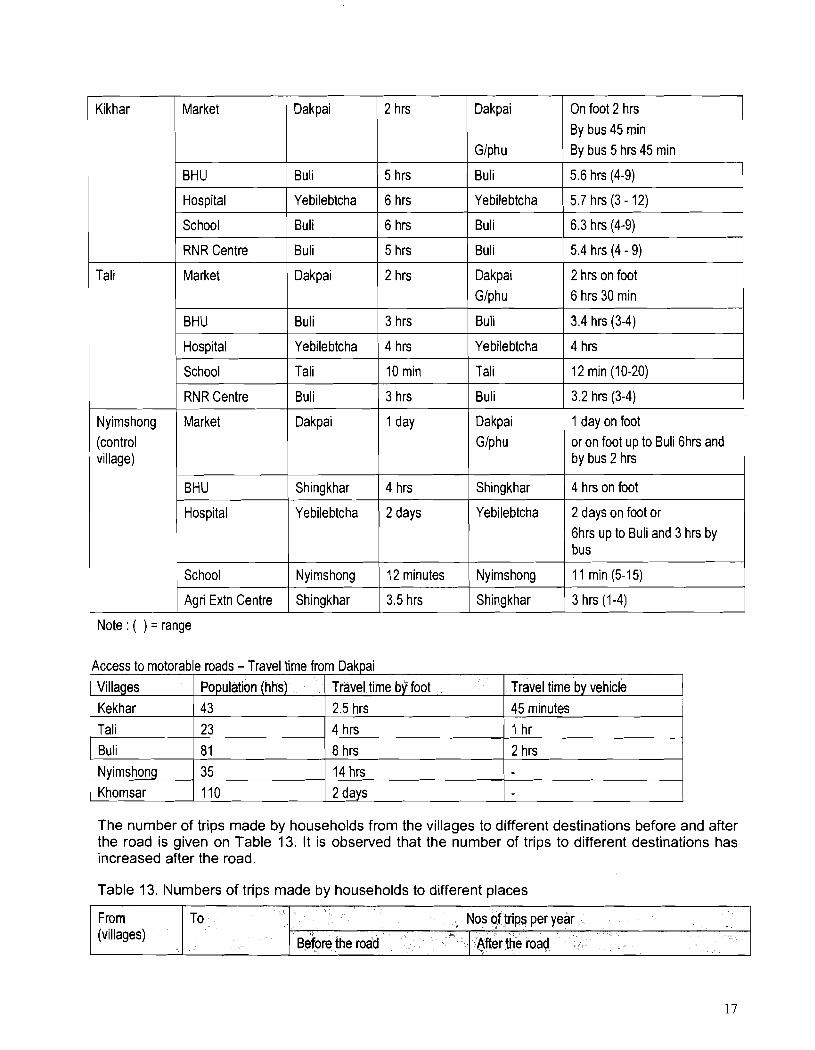
5.2.1.6 Travel time and number of trips to different locations
The travel time by the households from the villages to different locations like market, hospital, BHU, schools before and after the road is given on table 12. The travel time to market has reduced after the road from 6 hrs to 2 hrs from Buli to Dakpai; from 2 hrs to 45 minutes from Kikhar to Dakpai; from one day to 8 hrs from Nyimshong to Dakpai.
Table 12.Travel time by households to different places
Buli
From (villages)
1 Market Dakpai
To
Dakpai On foot 6 hrs By bus 2hrs
TRAVEL TIME
1 Hospital 1 Yebilebtcha 1 1 day 1 Yebilebtcha 1 1 day 1
Before the road
BHU
Location , , . After the road
Travel time onfoot
Location
Buli
School
RNR Centre
Travel time
12 min
Buli
Buli
Glphu
Buli
11 min
12 rnin
By bus to Glphu 7 hrs
12 min (5-20) on foot
Buli
Buli
11 min (5-15)
12 min (5-15)
I BHU 1 Buli ( 5 hrs ( Buli 1 5.6 hrs (4-9) 1
Kikhar
Glphu
Tali
Dakpai By bus 45 rnin By bus 5 hrs 45 rnin
1 Hospital
On foot 2 hrs Market 1 Dakpai
1 Yebilebtcha
2 hrs
6 hrs I Yebilebtcha 1 5.7 hrs (3 - 12)
I School / Buli 16hrs I Buli 1 6.3 hrs (4-9) 1
Market Dakpai
I
BHU 1 Buli
Buli
Dakpai Glphu
Buli
5.4 hrs (4- 9)
2 hrs on foot J 1 6 hrs 30 rnin
1 Hospital I Yebilebtcha 4 hrs 1 Yebilebtcha 1 4 hrs
(control village)
Shing khar
Nyirnshong
IGlphu I or on foot up to Buli 6hrs and by bus 2 hrs
- - -
4 hrs I shingkharP ( 4 hrs on foot
School
RNR Centre
Market
Hospital Yebilebtcha
Tali
Buli
Dakpai
2 days
10 min
3 hrs
1 day
1 bus
Yebilebtcha
( School I Nyimshong 1 12 minutes ( Nyimshong I 11 min (5-15)
Tali
Buli
Dakpai
2 days on foot or 6hrs up to Buli and 3 hrs by
I Agri Extn Centre I Shingkhar 1 3.5 hrs I Shingkhar 1 3 hrs (1-4)
12 min (1 0-20)
3.2 hrs (3-4)
1 day on foot
Note : ( ) = range
1 Tali 1 23 1 4 h n I l h r
Access to rnotorable roads - Travel time from Dakpai
Buli 1 81 18hrs 2 h r s
Villa g es Kekhar
1 Nyirnshong 1 35 1 14 hrs ( Khornsar 1 110 1 2 days
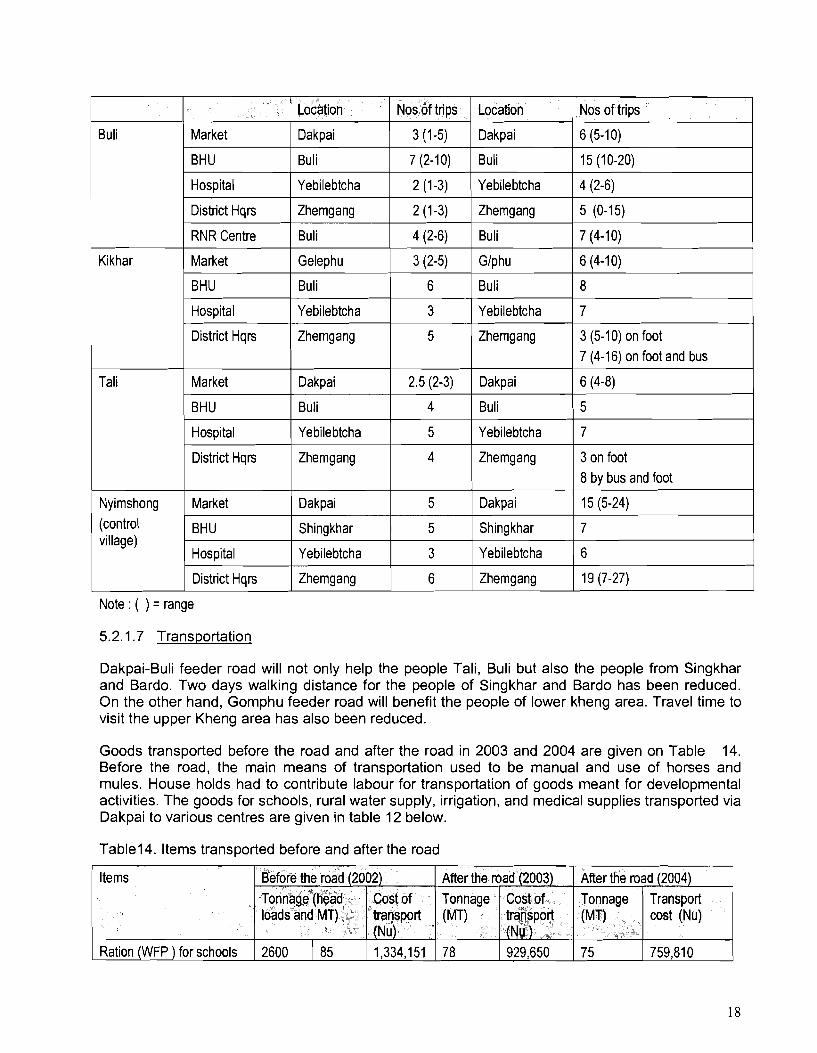
T h e number o f trips m a d e b y households f rom the vil lages t o different destinations before a n d after the road is g iven o n Tab le 13. I t is observed that the number o f tr ips t o different destinations has increased after the road.
I Travel time by vehicle 45 rr~inutes
Population (hhs) 43
Tab le 13. IVumbers o f tr ips m a d e b y households t o different places
Travel time by foot 2.5 hrs
From (villages)
To Nos of trips per year
Before the road Aff er the road
Note : ( ) = range
Buli
Kikhar
Tali
Nyirnshong (control village)
5.2.1.7 Transportation
Dakpai-Buli feeder road will not only help the people Tali, Buli but also the people from Singkhar and Bardo. Two days walking distance for the people of Singkhar and Bardo has been reduced. On the other hand, Gomphu feeder road will benefit the people of lower kheng area. Travel time to visit the upper Kheng area has also been reduced.
Market
BHU
Hospital
District Hqrs
RNR Centre
Market
BHU
Hospital
District Hqrs
Market
BHU
Hospital
District Hqrs
Market
BHU
Hospital
District Hqrs
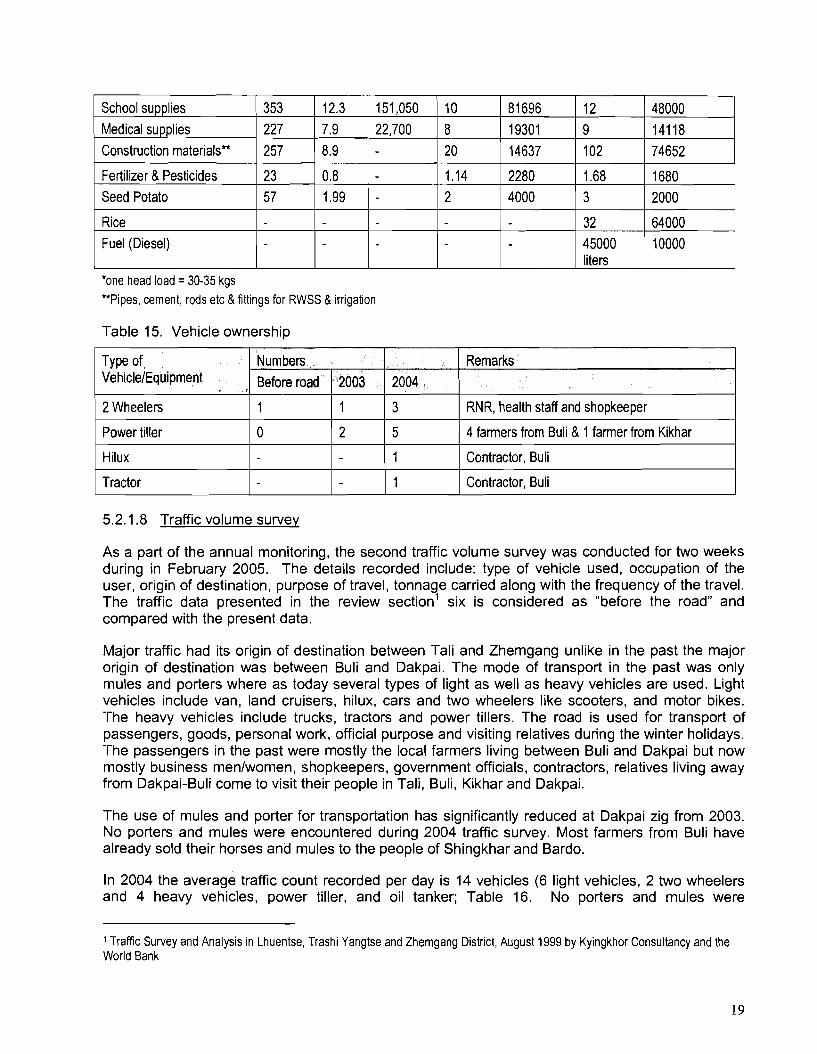
Goods transported before the road and after the road in 2003 and 2004 are given on Table 14. Before the road, the main means of transportation used to be manual and use of horses and mules. House holds had to contribute labour for transportation of goods meant for developmental activities. The goods for schools, rural water supply, irrigation, and medical supplies transported via Dakpai to various centres are given in table 12 below.
Tablel4. Items transported before and after the road
Location
Dakpai
Buli
Yeb~lebtcha
Zherngang
Buli
Gelephu
Buli
Yebilebtcha
Zherngang
Dakpai
Buli
Yebilebtcha
Zherngang
Dakpai
Shingkhar
Yebilebtcha
Zherngang
Nos of trips
3 (1-5)
7 (2-10)
2 (1-3)
2 (1-3)
4 (2-6)
3 (2-5)
6
3
5
2.5 (2-3)
4
5
4
5
5
3
6
Items
Ration (WFP ) for schools
Location
Dakpai
Buli
Yebilebtcha
Zherngang
Buli
Glphu
Buli
Yebilebtcha
Zherngang
Dakpai
Buli
Yebilebtcha
Zherngang
Dakpai
Shingkhar
Yebilebtcha
Zherngang
Nos of trips
6 (5-10)
15 (1 0-20)
4 (2-6)
5 (0-15)
7 (4- 1 0)
6 (4-10)
8
7
3 (5-10) on foot 7 (4-16) on foot and bus
6 (4-8)
5
7
3 on foot 8 by bus and foot
15 (5-24)
7
6
19 (7-27)
Before the road (2002)
Tonnage (head loads and MT)
2600 / 85
Cost of transport (Nu) 1,334,151
After the road (2003) Tonnage (MT)
78
After the road (2004) Cost of transport (Nu f 929,650
Tonnage (MT)
75
Transport cost (Nu)
759,810
*one head load = 30-35 kgs
**Pipes, cement, rods etc & fittings for RWSS & irrigation
School supplies Medical supplies Construction materials**
Fertilizer & Pesticides Seed Potato
Rice Fuel (Diesel)
Table 15. Vehicle ownership
5.2.1.8 Traffic volume survey
353 227
257
23 57
Type of VehiclelEquipment
2 Wheelers
Power tiller
Hilux
Tractor
As a part of the annual monitoring, the second traffic volume survey was conducted for two weeks during in February 2005. The details recorded include: type of vehicle used, occupation of the user, origin of destination, purpose of travel, tonnage carried along with the frequency of the travel. The traffic data presented in the review section' six is considered as "before the road" and compared with the present data.
12.3 7.9 8.9
0.8 1.99
151,050 22,700
-
Major traffic had its origin of destination between Tali and Zhemgang unlike in the past the major origin of destination was between Buli and Dakpai. The mode of transport in the past was only mules and porters where as today several types of light as well as heavy vehicles are used. Light vehicles include van, land cruisers, hilux, cars and two wheelers like scooters, and motor bikes. The heavy vehicles include trucks, tractors and power tillers. The road is used for transport of passengers, goods, personal work, official purpose and visiting relatives during the winter holidays. The passengers in the past were mostly the local farmers living between Buli and Dakpai but now mostly business menlwomen, shopkeepers, government officials, contractors, relatives living away from Dakpai-Buli come to visit their people in Tali, Buli, Kikhar and Dakpai.
The use of mules and porter for transportation has significantly reduced at Dakpai zig from 2003. No porters and mules were encountered during 2004 traffic survey. Most farmers from Buli have already sold their horses and mules to the people of Shingkhar and Bardo.
10 8 20
1 .I4 2
Numbers
In 2004 the average traffic count recorded per day is 14 vehicles (6 light vehicles, 2 two wheelers and 4 heavy vehicles, power tiller, and oil tanker; Table 16. No porters and mules were
2004
3
5
1
1
Before road
1
0
Traffic Survey and Analysis in Lhuentse, Trashi Yangtse and Zhemgang District, August 1999 by Kyingkhor Consultancy and the World Bank
19
81 696 19301 14637
2280 4000
Remarks
RNR, health staff and shopkeeper
4 farmers from Buli & 1 farmer from Kikhar
Contractor, Buli
Contractor, Buli
2003
1
2
12 9 102
1.68 3
32 45000 liters
48000 14118 74652
1680 2000
64000 10000
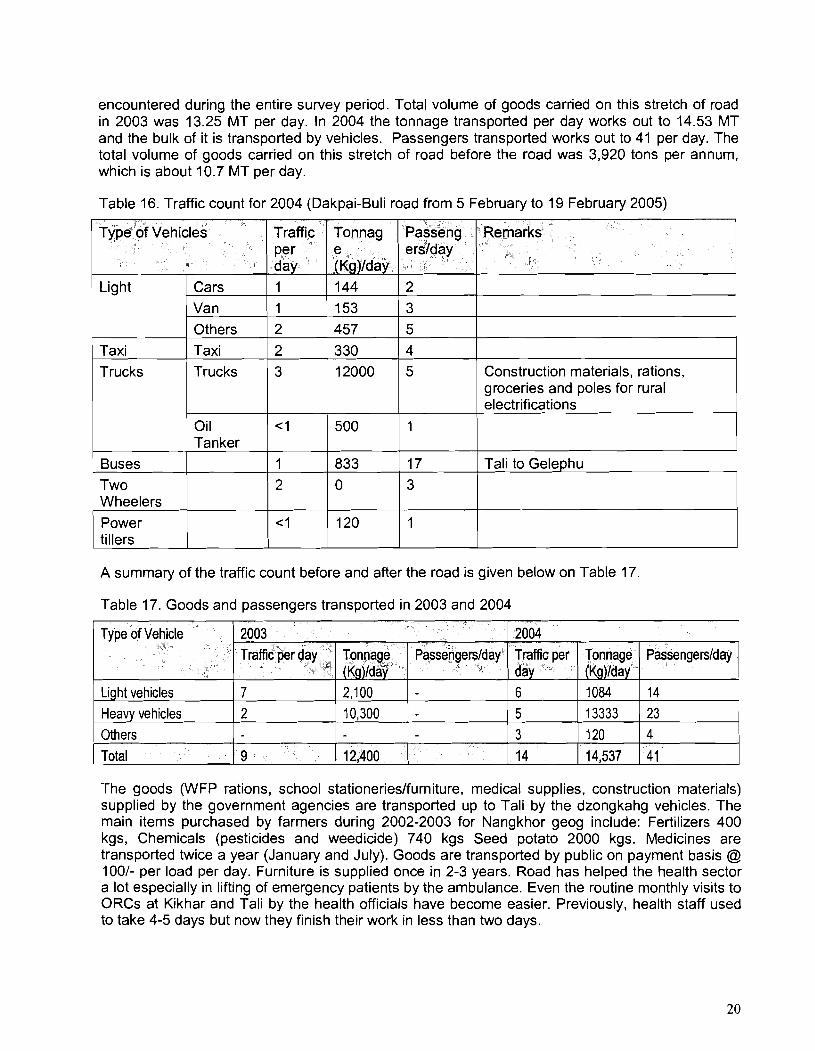
encountered during the entire survey period. Total volume of goods carried on this stretch of road in 2003 was 13.25 MT per day. In 2004 the tonnage transported per day works out to 14.53 MT and the bulk of it is transported by vehicles. Passengers transported works out to 41 per day. The total volume of goods carried on this stretch of road before the road was 3,920 tons per annum, which is about 10.7 MT per day.
Table 16. Traffic count for 2004 (Dakpai-Buli road from 5 February to 19 February 2005)
A summary of the traffic count before and after the road is given below on Table 17.
Table 17. Goods and passengers transported in 2003 and 2004
8
ema arks
Construction materials, rations, groceries and poles for rural electrifications
Tali to Gelephu
Type of Vehicles Traffic
da pe: 1 1 2 2
3
< 1
1 2
< 1
Light
Taxi Trucks
Buses Two Wheelers Power tillers
Cars Van Others Taxi Trucks
Oil Tanker
Type of Vehicle
Light vehicles Heavy vehicles
The goods (WFP rations, school stationerieslfurniture, medical supplies, construction materials) supplied by the government agencies are transported up to Tali by the dzongkahg vehicles. The main items purchased by farmers during 2002-2003 for Nangkhor geog include: Fertilizers 400 kgs, Chemicals (pesticides and weedicide) 740 kgs Seed potato 2000 kgs. Medicines are transported twice a year (January and July). Goods are transported by public on payment basis @ loo/- per load per day. Furniture is supplied once in 2-3 years. Road has helped the health sector a lot especially in lifting of emergency patients by the ambulance. Even the routine monthly visits to ORCs at Kikhar and Tali by the health officials have become easier. Previously, health staff used to take 4-5 days but now they finish their work in less than two days.
Tonnag e (Kg)/day 144 153 457 330 12000
500
833 0
120
0
1 Others I Total
Passeng e rslday
2
3 5 4 5
1
17 3
1
Traffic per day
2003
7 2
Traffic per day
9
Tonnage (Kg)lda y
2,100 10,300
Passengerslday Tonnage (Kg)/day
12,400
~assen~erslda~'
6 5 3
14
1084 13333
14 23
120 14,537
4
41
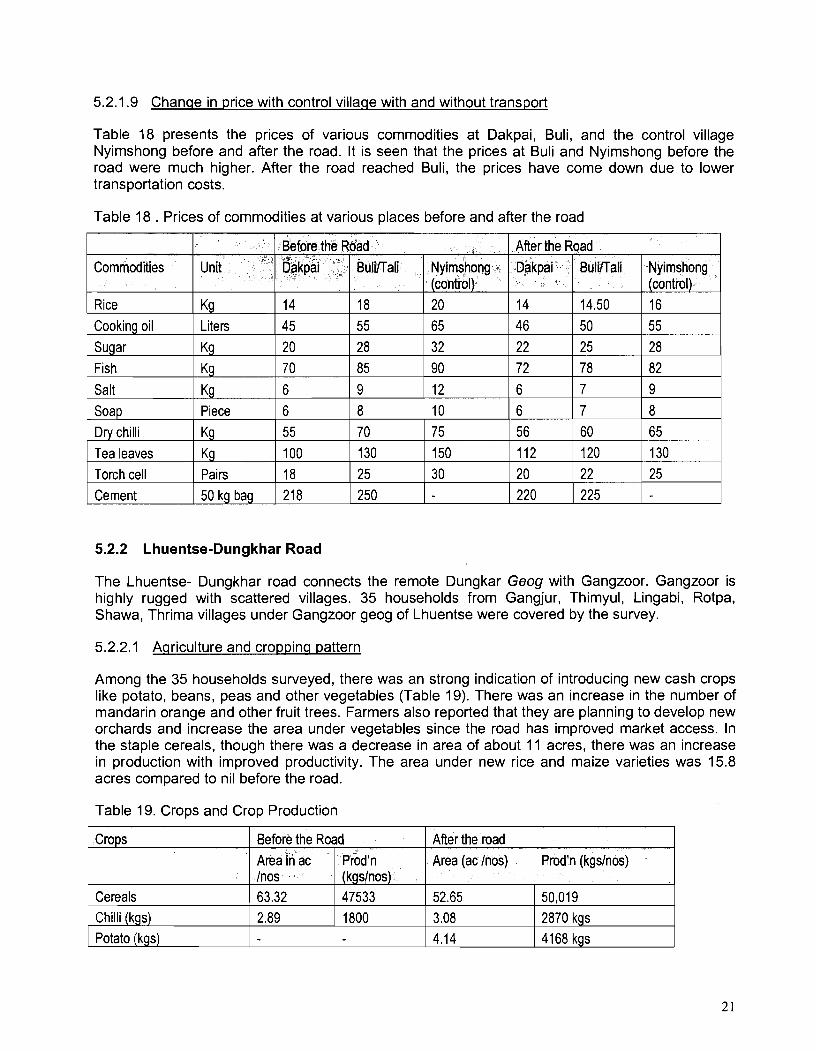
5.2.1.9 Chanqe in price with control village with and without transport
Table 18 presents the prices of various commodities at Dakpai, Buli, and the control village Nyimshong before and after the road. It is seen that the prices at Buli and Nyimshong before the road were much higher. After the road reached Buli, the prices have come down due to lower transportation costs.
Table 1 8 . Prices of commodities at various places before and after the road
5.2.2 Lhuentse-Dungkhar Road
Commodities
Rice Cooking oil Sugar Fish
Salt Soap Dry chilli Tea leaves Torch cell Cement
The Lhuentse- Dungkhar road connects the remote Dungkar Geog with Gangzoor. Gangzoor is highly rugged with scattered villages. 3 5 households from Gangjur, Thimyul, Lingabi, Rotpa, Shawa, Thrima villages under Gangzoor geog of Lhuentse were covered by the survey.
5.2.2.1 Aqriculture and croppins pattern
Unit
Kg Liters
Kg
Kg
Kg Piece
Kg Kg Pairs 50 kg bag
Among the 3 5 households surveyed, there was an strong indication of introducing new cash crops like potato, beans, peas and other vegetables (Table 19). There was an increase in the number of mandarin orange and other fruit trees. Farmers also reported that they are planning to develop new orchards and increase the area under vegetables since the road has improved market access. In the staple cereals, though there was a decrease in area of about 1 1 acres, there was an increase in production with improved productivity. The area under new rice and maize varieties was 15.8 acres compared to nil before the road.
Table 19. Crops and Crop Production
Before the Road After the Road Nyimshong (control) 20 65 32 90 12 10 75 150 30
Dakpai
14 45 20 70
6 6 55 100 18 218
Crops
Cereals Chilli (kgs) Potato (kgs)
Nyimshong (control) 16 55 28 82 9
8 65 130 25
Buliflali
18 55 28 85 9 8 70 130 25 250
Dakpai
14 46 22 72
6 6 56 112 20 220
After the road
BulilTali
14.50 50 25 78 7 7 60 120 22 225
Before the Road Area (ac Inos)
52.65 3.08 4.14
Area in ac lnos 63.32 2.89
Prod'n (kgslnos)
50,019 2870 kgs 4168 kgs
Prod'n (kgslnos) 47533 1800
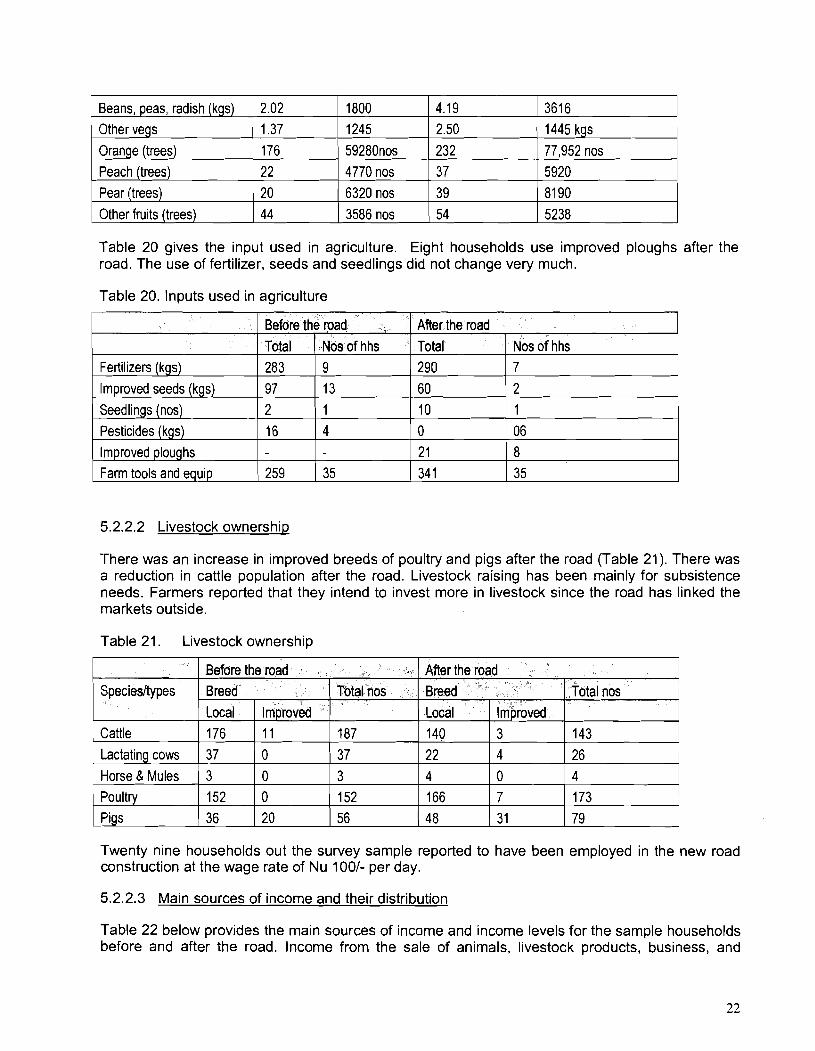
Table 20 gives the input used in agriculture. Eight households use improved ploughs after the road. The use of fertilizer, seeds and seedlings did not change very much.
Table 20. Inputs used in agriculture
3616 1445 kgs
77,952 nos 5920 81 90
5238
4.19
5.2.2.2 Livestock ownership
Other vegs
Orange (trees) Peach (trees) Pear (trees)
Other fruits (trees)
There was an increase in improved breeds of poultry and pigs after the road (Table 21). There was a reduction in cattle population after the road. Livestock raising has been mainly for subsistence needs. Farmers reported that they intend to invest more in livestock since the road has linked the markets outside.
Before the road
Table 21. Livestock ownership
1.37 176 22 20 44
Total 290 60 10 0 21 34 1
Nos of hhs 9 13 1 4
35
Nos of h hs 7 2 1 06 8 35
Fertilizers (kgs)
Improved seeds (kgs) Seedlings (nos) Pesticides (kgs)
Improved ploughs Farm tools and equip
Twenty nine households out the survey sample reported to have been employed in the new road construction at the wage rate of Nu 1001- per day.
1245
59280nos 4770 nos 6320 nos
3586 nos
Total 283 97 2 16
259
Speciesltypes
- Cattle
Lactating cows Horse & Mules Poultry Pigs
5.2.2.3 Main sources of income and their distribution
2.50 232 37 39
54
Table 22 below provides the main sources of income and income levels for the sample households before and after the road. Income from the sale of animals, livestock products, business, and
Before the road After the road Total nos
187 37 3 152 56
Breed Total nos
143 26 4 173 79
Local 176 37 3 152 36
Breed Improved 11
0 0 0 20
Local
140 22 4
166 48
Improved 3 4
0 7 31
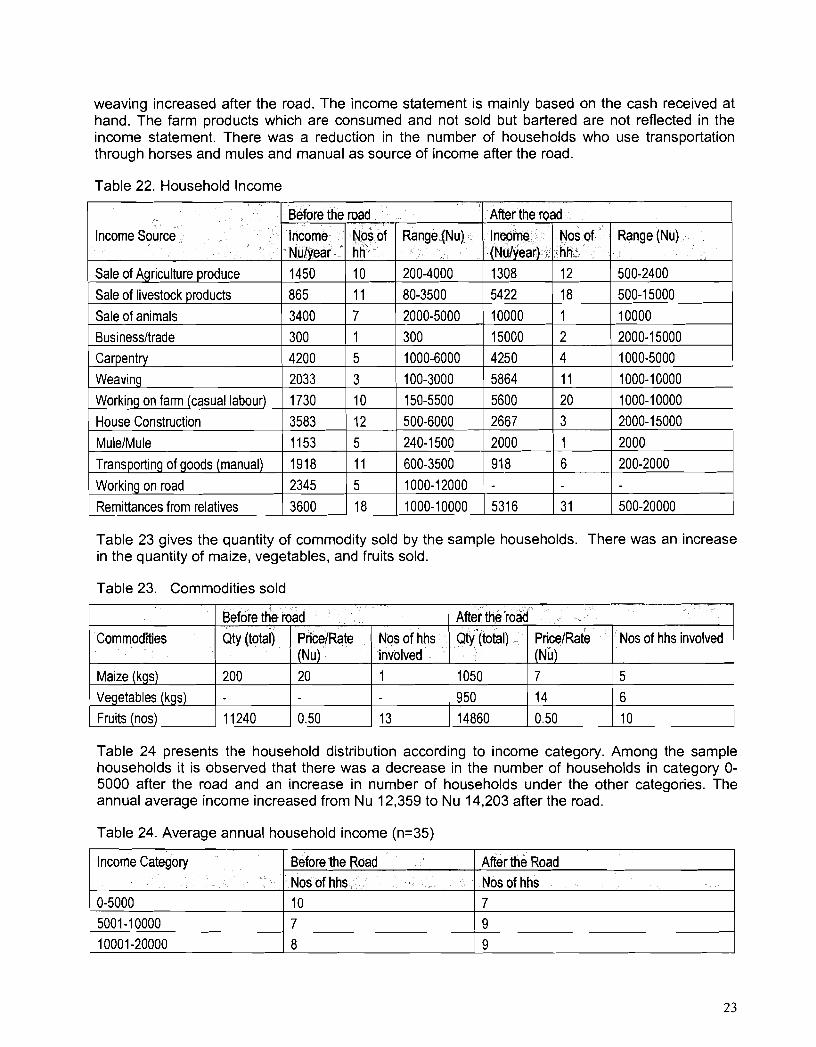
weaving increased after the road. The income statement is mainly based on the cash received at hand. The farm products which are consumed and not sold but bartered are not reflected in the income statement. There was a reduction in the number of households who use transportation through horses and mules and manual as source of income after the road.
Table 22. Household lncome
Table 23 gives the quantity of commodity sold by the sample households. There was an increase in the quantity of maize, vegetables, and fruits sold.
Table 23. Commodities sold
Income Source
Sale of Agriculture produce Sale of livestock products Sale of animals Businessltrade Carpentry Weaving Working on farm (casual labour) House Construction MulelMule
Transporting of goods (manual) Working or1 road Remittances from relatives
Table 24 presents the household distribution according to income category. Among the sample households it is observed that there was a decrease in the number of households in category O- 5000 after the road and an increase in number of households under the other categories. The annual average income increased from Nu 12,359 to Nu 14,203 after the road.
Table 24. Average annual household income (n=35)
Before the road After the road
Income Category
0-5000 5001-10000 10001 -20000
Range [Nu) .
200-4000 80-3500 2000-5000 300 1000-6000 100-3000 150-5500 500-6000 240-1 500
600-3500 1000-12000 1000-1 0000
Incom (Nulyear) 1308 5422
10000 15000 4250 5864 5600 2667 2000
918 - 531 6
income Nulyear 1450 865
3400 300 4200 2033 1730 3583 1153 1918 2345
3600
Nos of hh 10 11 7 1 5 3 10 12 5 11 5
18
Before the Road Nos of hhs 10 7 8
Nos of hh 12 18 1 2 4 11 20 3 1 6
3 1
After the Road Nos of hhs 7 9 9
Range (Nu)
500-2400 500-1 5000 10000 2000-1 5000 1000-5000 1000-1 0000 1000-1 0000 2000-1 5000 2000 200-2000
500-20000
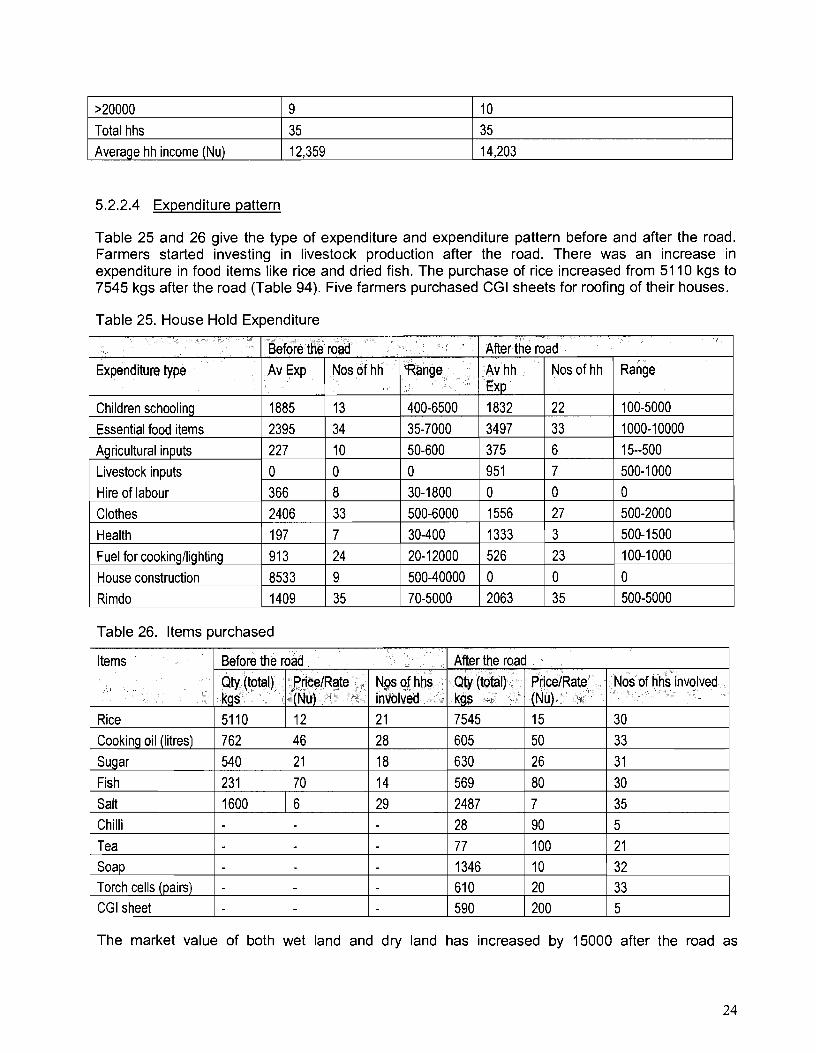
5.2.2.4 Expenditure pattern
>20000 Total hhs Average hh income (Nu)
Table 25 and 26 give the type of expenditure and expenditure pattern before and after the road. Farmers started investing in livestock production after the road. There was an increase in expenditure in food items like rice and dried fish. The purchase of rice increased from 5 1 1 0 kgs to 7 5 4 5 kgs after the road (Table 94). Five farmers purchased CGI sheets for roofing of their houses.
Table 25. House Hold Expenditure
9 35 12,359
Table 26. ltems purchased
10 35 14,203
The market value of both wet land and dry land has increased by 15000 after the road as
Items
Rice Cooking oil (litres) Sugar Fish Salt Chilli Tea Soap Torch cells (pairs) CGI sheet
After the road
Qty (total) kgs 7545 605 630 569 2487 28 77 1346 61 0 590
Before the road
Qty (total) kgs 5110 762 540 23 1 1600
-
PricelRate -
"Nu) 15 50 26 80 7 90 100 10 20 200
Nos of hhs involved
30 33 31 30 35 5 21 32 33 5
JricelRate (Nu) 12 46 2 1 70 6
Nos of hhs involved - 21 28 18 14 29
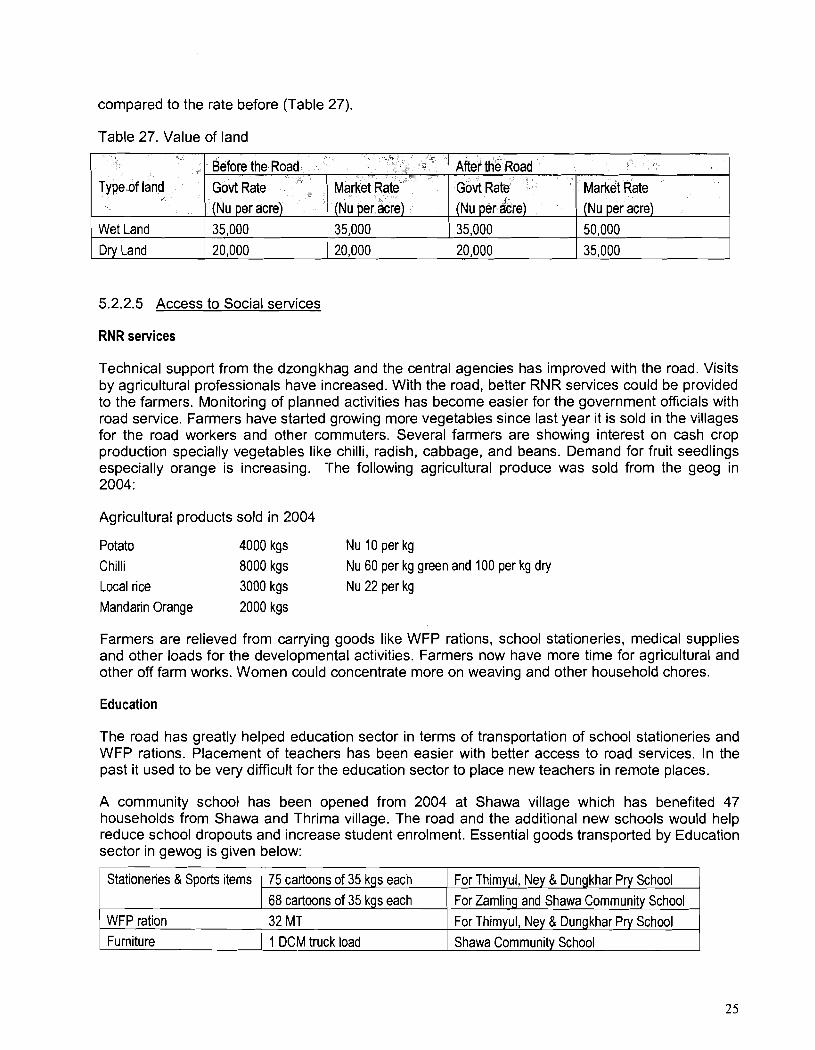
compared to the rate before (Table 27).
Table 27. Value of land
5.2.2.5 Access to Social services
Type of land
Wet Land Dry Land
RNR services
Technical support from the dzongkhag and the central agencies has improved with the road. Visits by agricultural professionals have increased. With the road, better RNR services could be provided to the farmers. Monitoring of planned activities has become easier for the government officials with road service. Farmers have started growing more vegetables since last year it is sold in the villages for the road workers and other commuters. Several farmers are showing interest on cash crop production specially vegetables like chilli, radish, cabbage, and beans. Demand for fruit seedlings especially orange is increasing. The following agricultural produce was sold from the geog in 2004:
Before the Road I
Agricultural products sold in 2004
Govt Rate (Nu per acre) 35,000 20,000
After the Road
Potato 4000 kgs Nu 10 per kg Chilli 8000 kgs Nu 60 per kg green and 100 per kg dry Local rice 3000 kgs Nu 22 per kg Mandarin Orange 2000 kgs
Market Rate (Nu per acre) 35,000 20,000
Govt Rate (Nu per acre) 35,000 20,000
Farmers are relieved from carrying goods like WFP rations, school stationeries, medical supplies and other loads for the developmental activities. Farmers now have more time for agricultural and other off farm works. Women could concentrate more on weaving and other household chores.
Market Rate (Nu per acre) 50,000 35,000
Education
The road has greatly helped education sector in terms of transportation of school stationeries and WFP rations. Placement of teachers has been easier with better access to road services. In the past it used to be very difficult for the education sector to place new teachers in remote places.
A community school has been opened from 2004 at Shawa village which has benefited 47 households from Shawa and Thrima village. The road and the additional new schools would help reduce school dropouts and increase student enrolment. Essential goods transported by Education sector in gewog is given below:
Stationeries & Sports items
WFP ration Furniture
75 cartoons of 35 kgs each 68 cartoons of 35 kgs each 32 MT 1 DCM truck load
For Thimyul, Ney & Dungkhar Pry School For Zamling and Shawa Community School For Thimyul, Ney & Dungkhar Pry School Shawa Community School
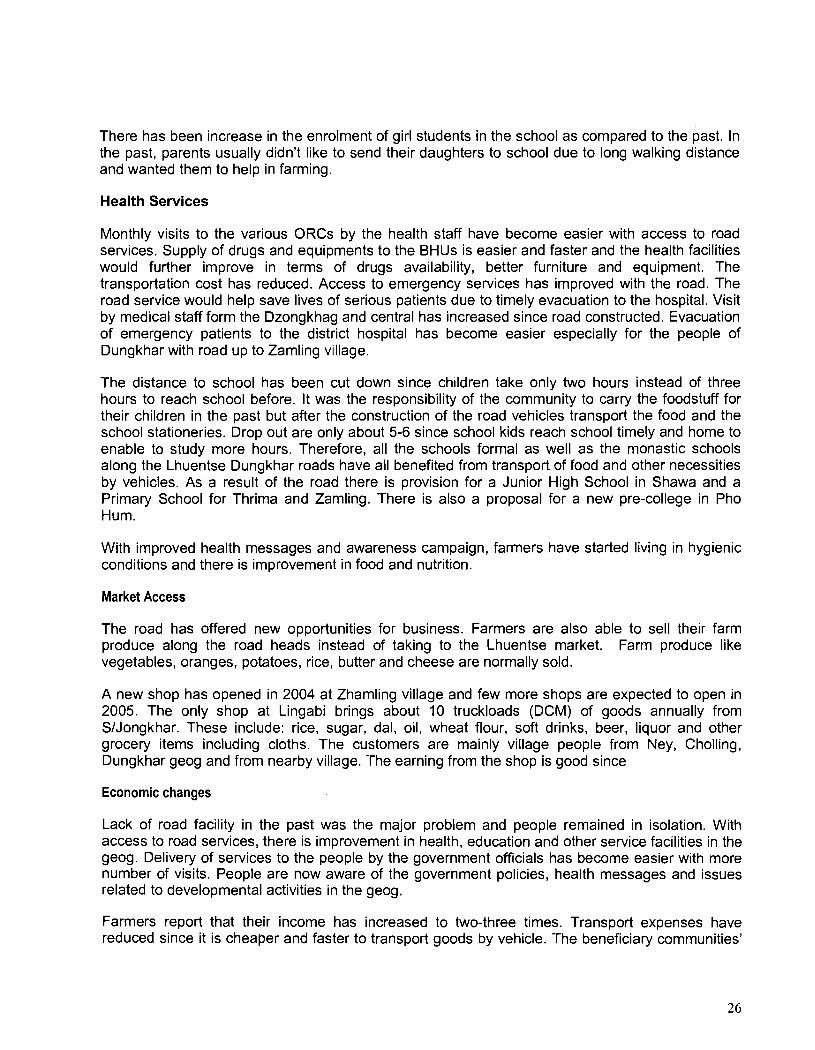
There has been increase in the enrolment of girl students in the school as compared to the past. In the past, parents usually didn't like to send their daughters to school due to long walking distance and wanted them to help in farming.
Health Services
Monthly visits to the various ORCs by the health staff have become easier with access to road services. Supply of drugs and equipments to the BHUs is easier and faster and the health facilities would further improve in terms of drugs availability, better furniture and equipment. The transportation cost has reduced. Access to emergency services has improved with the road. The road service would help save lives of serious patients due to timely evacuation to the hospital. Visit by medical staff form the Dzongkhag and central has increased since road constructed. Evacuation of emergency patients to the district hospital has become easier especially for the people of Dungkhar with road up to Zamling village.
The distance to school has been cut down since children take only two hours instead of three hours to reach school before. It was the responsibility of the community to carry the foodstuff for their children in the past but after the construction of the road vehicles transport the food and the school stationeries. Drop out are only about 5-6 since school kids reach school timely and home to enable to study more hours. Therefore, all the schools formal as well as the monastic schools along the Lhuentse Dungkhar roads have all benefited from transport of food and other necessities by vehicles. As a result of the road there is provision for a Junior High School in Shawa and a Primary School for Thrima and Zamling. There is also a proposal for a new pre-college in Pho Hum.
With improved health messages and awareness campaign, farmers have started living in hygienic conditions and there is improvement in food and nutrition.
Market Access
The road has offered new opportunities for business. Farmers are also able to sell their farm produce along the road heads instead of taking to the Lhuentse market. Farm produce like vegetables, oranges, potatoes, rice, butter and cheese are normally sold.
A new shop has opened in 2004 at Zhamling village and few more shops are expected to open in 2005. The only shop at Lingabi brings about 10 truckloads (DCM) of goods annually from SIJongkhar. These include: rice, sugar, dal, oil, wheat flour, soft drinks, beer, liquor and other grocery items including cloths. The customers are mainly village people from Ney, Cholling, Dungkhar geog and from nearby village. The earning from the shop is good since
Economic changes
Lack of road facility in the past was the major problem and people remained in isolation. With access to road services, there is improvement in health, education and other service facilities in the geog. Delivery of services to the people by the government officials has become easier with more number of visits. People are now aware of the government policies, health messages and issues related to developmental activities in the geog.
Farmers report that their income has increased to two-three times. Transport expenses have reduced since it is cheaper and faster to transport goods by vehicle. The beneficiary communities'
express that the road has helped them a lot especially in terms to transportation, easy access to market and others social facilities. After the road, farmers are relieved from carrying goods like school rations, construction materials etc. Some of the beneficiaries informed that their relatives living in other districts have been making visits at least once a year. They used to come home once in 3-5 years before the road.
Dasho Dzondag, Lhuentse summarised the benefit of road as follows:
Benefit of the road is huge. Immediate impact may not be visible but in the long term the road would definitely bring changes to the lives of the rural population. Since the road reduces the transportation cost, important developmental activities will immediately follow once the road is completed. There will be more employment opportunities for the youth, which would reduce rural urban migration. Farmers can earn cash income through wage labour and from sale of crops and livestock products. Road has helped in timely delivery of inputs and required materials at site.
The group discussions revealed that even students on winter vacation are employed on the road. lklost students make enough money for their school expenses. The beneficiary corr~munities are prepared to take up the routine maintenance of the road.
There are no gender-differentiated constraints to women's participation in any activities and there is no negative impact on women.
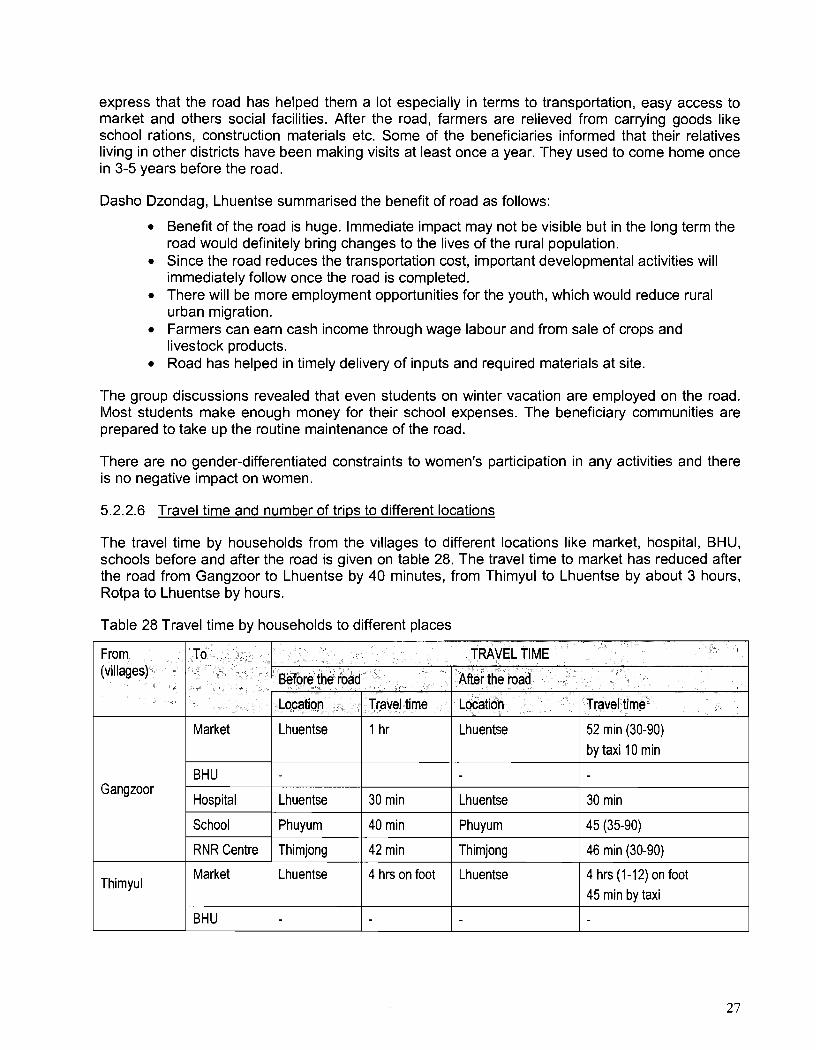
5.2.2.6 Travel time and number of trips to different locations
The travel time by households from the villages to different locations like market, hospital, BHU, schools before and after the road is given on table 28. The travel time to market has reduced after the road from Gangzoor to Lhuentse by 40 minutes, from Thimyul to Lhuentse by about 3 hours, Rotpa to Lhuentse by hours.
Table 28 Travel time by households to different places
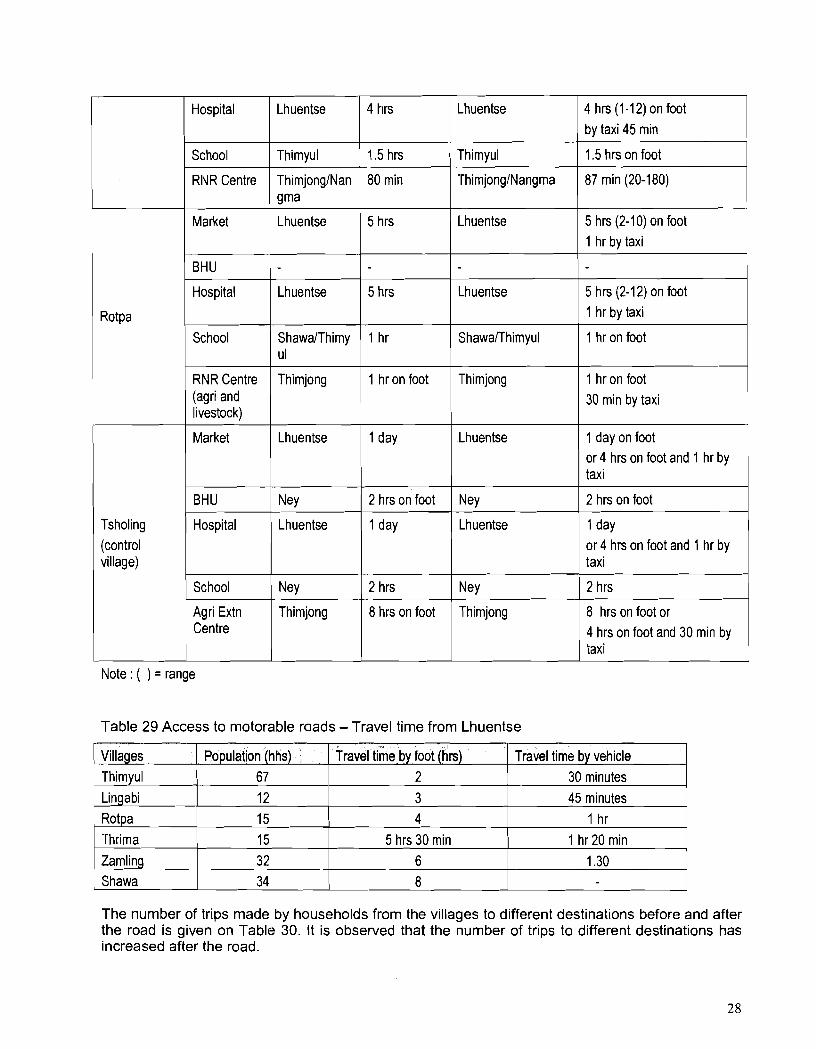
Note : ( ) = range
Tab le 29 Access t o motorable roads - Travel t ime f rom Lhuentse
4 hrs (1 -1 2) on foot by taxi 45 min
1.5 hrs on foot
87 min (20-180)
5 hrs (2-1 0) on foot 1 hr by taxi
5 hrs (2-1 2) on foot 1 hr by taxi
1 hr on foot
1 hr on foot 30 min by taxi
1 day on foot or 4 hrs on foot and 1 hr by taxi
2 hrs on foot
1 day or 4 hrs on foot and 1 hr by taxi
2 hrs
8 hrs on foot or 4 hrs on foot and 30 min by taxi
T h e number o f trips m a d e b y households f rom the vil lages to different destinations before and after the road is g iven o n Tab le 30. I t is observed that the number o f trips t o different destinations has increased after t he road.
Rotpa
Tsholing (control village)
4 hrs
1.5 hrs
80 min
5 hrs
5 hrs
1 hr
1 hr on foot
1 day
2 hrs on foot
1 day
2 hrs
8 hrs on foot
Travel time by vehicle 30 minutes 45 minutes
1 hr 1 hr 20 min
1.30
Villages 'rhimyul Lingabi Rotpa Thrima Zamling Shawa
Lhuentse
Thimyul
ThimjonglNangma
Lhuentse
Lhuentse
ShawaiThimyul
Thimjong
Lhuentse
Ney
Lhuentse
N ~ Y
Thimjong
Hospital
School
RlVR Centre
Market
BHU
Hospital
School
RNR Centre (agri and livestock)
Market
BHU
Hospital
School
Agri Extn Centre
Lhuentse
Thimyul
ThimjonglNan gma
Lhuentse
Lhuentse
ShawalThimy ul
Thimjong
Lhuentse
N ~ Y
Lhuentse
N ~ Y
Thimjong
Population (hhs) 67 12 15 15 32 34
Travel time by foot (hrs) 2
3 4
5 hrs 30 min 6 8
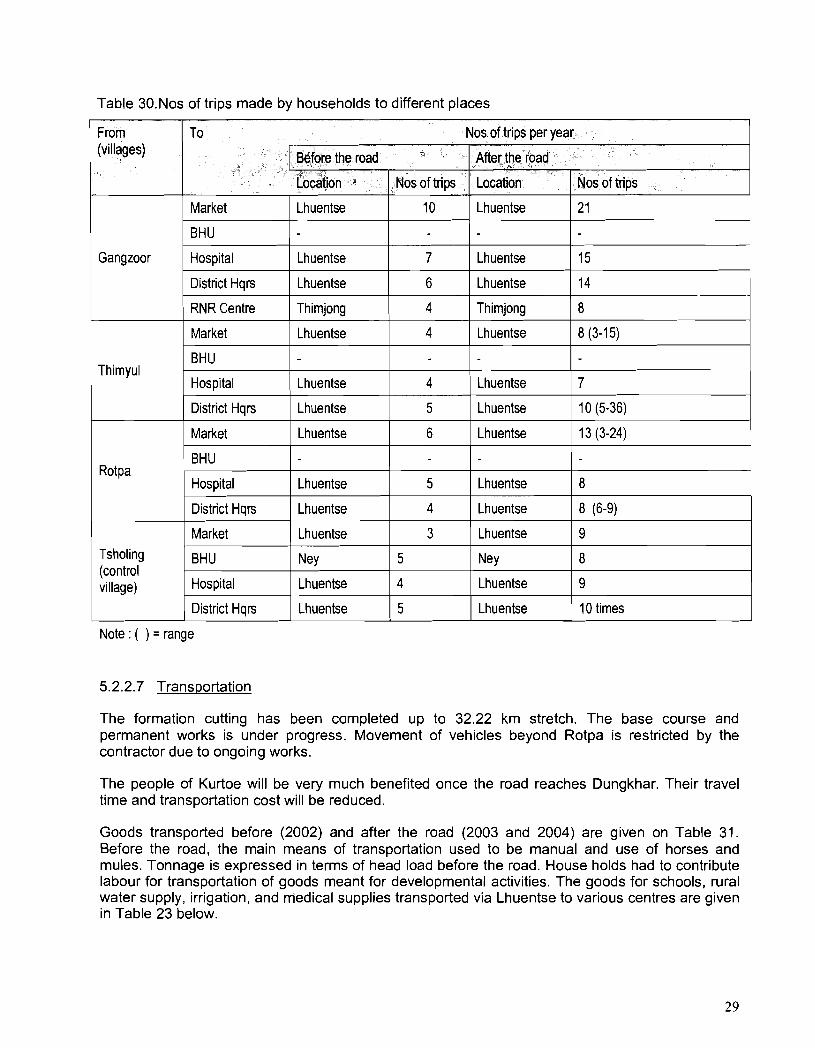
Table 30.Nos of trips made by households to different places
Note : ( ) = range
5.2.2.7 Transportation
From (villages)
Gangzoor
Thimyul
Rotpa
The formation cutting has been completed up to 32.22 km stretch. The base course and permanent works is under progress. Movement of vehicles beyond Rotpa is restricted by the contractor due to ongoing works.
To
Market
BHU
Hospital
District Hqrs
RNR Centre
Market
BHU
Hospital
District Hqrs
Market
BHU
Hospital
Nos of trips per year
The people of Kurtoe will be very much benefited once the road reaches Dungkhar. Their travel time and transportation cost will be reduced.
Tsholing (control village)
Goods transported before (2002) and after the road (2003 and 2004) are given on Table 31. Before the road, the main means of transportation used to be manual and use of horses and mules. Tonnage is expressed in terms of head load before the road. House holds had to contribute labour for transportation of goods meant for developmental activities. The goods for schools, rural water supply, irrigation, and medical supplies transported via Lhuentse to various centres are given in Table 23 below.
District Hqrs
Market Lhuentse 3 Lhuentse 9
BHU N ~ Y 5 NeY 8
Hospital Lhuentse 4 Lhuentse 9
District Hqrs Lhuentse 5 Lhuentse 10 times
Before the road
~ocation
Lhuentse
Lhuentse
Lhuentse
Thimjong
Lhuentse
Lhuentse
Lhuentse
Lhuentse
Lhuentse
After the road
Nos of trips
10
7
6
4
4
4
5
6
5
Location
Lhuentse
Lhuentse
Lhuentse
Thimjong
Lhuentse
Lhuentse
Lhuentse
Lhuentse
Lhuentse
Nos of trips
21
15
14
8
8 (3-1 5)
7
10 (5-36)
13 (3-24)
8
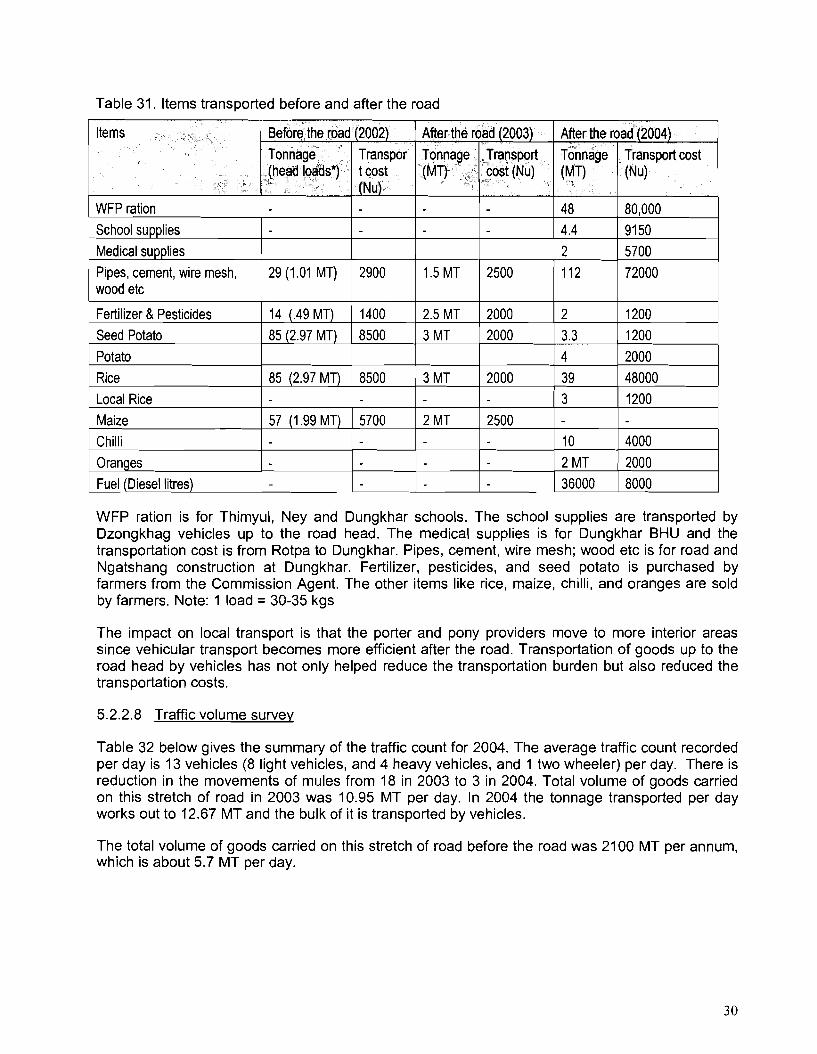
Table 31. ltems transported before and after the road
WFP ration is for Thimyul, Ney and Dungkhar schools. The school supplies are transported by Dzongkhag vehicles up to the road head. The medical supplies is for Dungkhar BHU and the transportation cost is from Rotpa to Dungkhar. Pipes, cement, wire mesh; wood etc is for road and Ngatshang construction at Dungkhar. Fertilizer, pesticides, and seed potato is purchased by farmers from the Commission Agent. The other items like rice, maize, chilli, and oranges are sold by farmers. Note: 1 load = 30-35 kgs
Items
WFP ration
School supplies Medical supplies
I Pipes, cement, wire mesh, wood etc
Fertilizer & Pesticides Seed Potato -- Potato Rice Local Rice Maize Chilli
Oranges Fuel (Diesel litres)
The impact on local transport is that the porter and pony providers move to more interior areas since vehicular transport becomes more efficient after the road. Transportation of goods up to the road head by vehicles has not only helped reduce the transportation burden but also reduced the transportation costs.
5.2.2.8 Traffic volume survey
Table 32 below gives the summary of the traffic count for 2004. The average traffic count recorded per day is 13 vehicles (8 light vehicles, and 4 heavy vehicles, and 1 two wheeler) per day. There is reduction in the movements of mules from 18 in 2003 to 3 in 2004. Total volume of goods carried on this stretch of road in 2003 was 10.95 MT per day. In 2004 the tonnage transported per day works out to 12.67 MT and the bulk of it is transported by vehicles.
Before the road (2002)
The total volume of goods carried on this stretch of road before the road was 21 00 MT per annum, which is about 5.7 MT per day.
Tonnage (head loads*)
a
29 (1 .O1 MT)
14 (.49 MT) 85 (2.97 MT)
Transpor t cost (Nu)
2900
1400 8500
After the road (2003)
85 (2.97 MT) 8500
Tonnage (MT) .
1.5 MT
2.5 MT
3 MT
After the road (2004)
57 (1.99 MT)
Transport cost (Nu)
2500
2000 2000
Tonnage (MT)
48 4.4 2 112
2 3.3
Transport cost (Nu)
80,000 91 50 5700 72000
1200 1200
5700 2 MT 2500 3
10 2 MT 36000
1200
4000 2000 8000
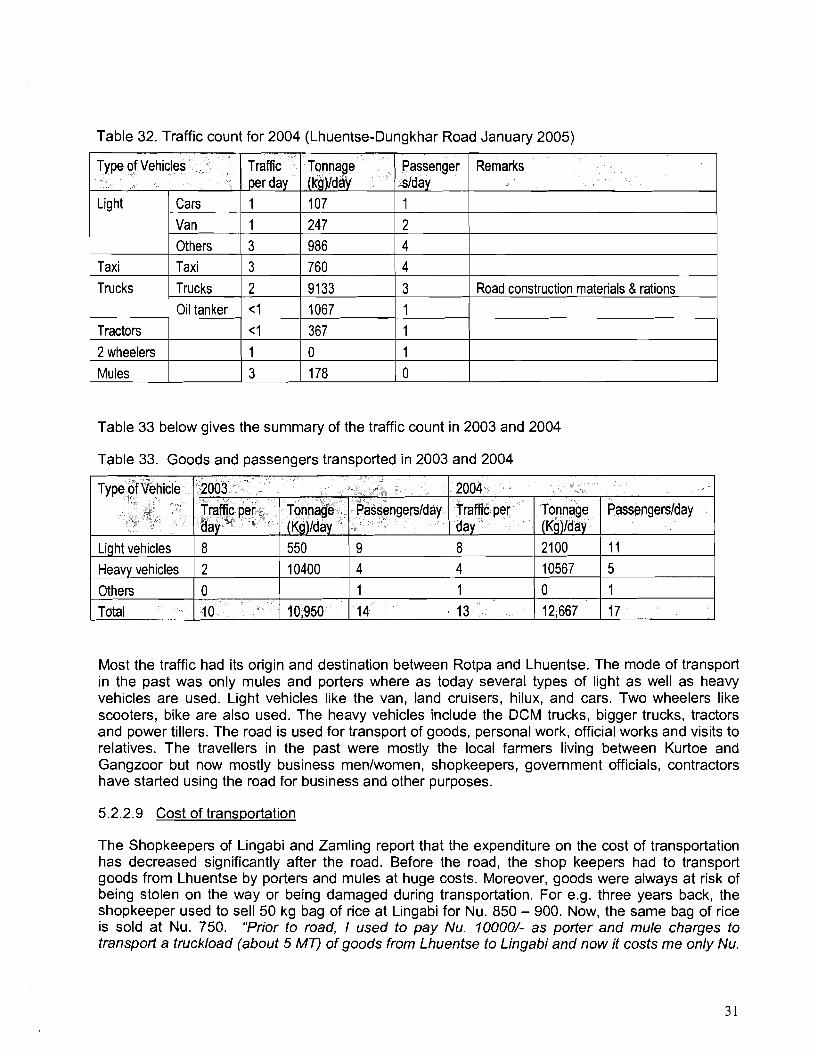
Table 32. Traffic count for 2004 (Lhuentse-Dungkhar Road January 2005)
Table 33 below gives the summary of the traffic count in 2003 and 2004
Table 33. Goods and passengers transported in 2003 and 2004
Type of Vehicles
Most the traffic had its origin and destination between Rotpa and Lhuentse. The mode of transport in the past was only mules and porters where as today several types of light as well as heavy vehicles are used. Light vehicles like the van, land cruisers, hilux, and cars. Two wheelers like scooters, bike are also used. The heavy vehicles include the DCM trucks, bigger trucks, tractors and power tillers. The road is used for transport of goods, personal work, official works and visits to relatives. The travellers in the past were mostly the local farmers living between Kurtoe and Gangzoor but now mostly business menlwomen, shopkeepers, government officials, contractors have started using the road for business and other purposes.
Traffic per day 1 1 3 3 2 (1 (1 1 3
Light
Taxi Trucks
Tractors
2 wheelers Mules
5.2.2.9 Cost of transportation
Cars Van Others Taxi Trucks
Oil tanker
Type of Vehicle
,I
Light vehicles Heavy vehicles Others Total
The Shopkeepers of Lingabi and Zamling report that the expenditure on the cost of transportation has decreased significantly after the road. Before the road, the shop keepers had to transport goods from Lhuentse by porters and mules at huge costs. Moreover, goods were always at risk of being stolen on the way or being damaged during transportation. For e.g. three years back, the shopkeeper used to sell 50 kg bag of rice at Lingabi for Nu. 850 - 900. Now, the same bag of rice is sold at Nu. 750. "Prior to road, I used to pay Nu. 10000/- as porter and mule charges to transport a truckload (about 5 MT) of goods from Lhuentse to Lingabi and now it costs me only Nu.
Tonnage (kg)/day 107 247 986 760 91 33 1067 367 0 178
2004 Traffic per day 8 4 1
, 13
2003 '
Passenger slday, 1 2 4 4 3 1 1 1 0
Remarks
Road construction materials & rations
Tonnage (Kg)lday 21 00 10567 0
, 12,667
Passengerslday
9 4 1
, 14
Traffic per day 8 2 0 10
Passengerslday
11 5 1
, 17
Tonnage. (Kg)lday
550 10400
10,950
120OJYsays one shop keeper.
"The transportation cost of health supplies has reduced to almost 50% as compared to earlier years" says one health official. Until 2003, the transportation of WFP rations and stationeries for Dungkhar School used to cost around Nu. 90,000/- and now with the road up to Rotpa, the transportation cost has been reduced to almost 50%.
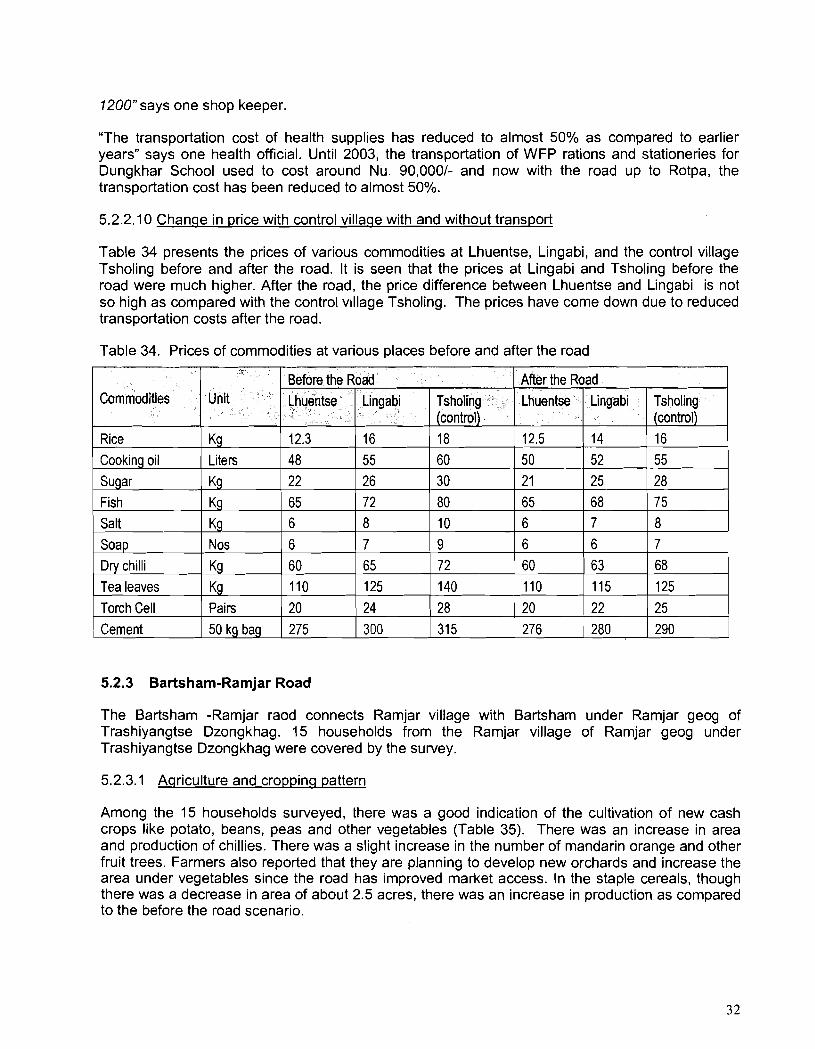
5.2.2.10 Chanqe in price with control villaqe with and without transport
Table 34 presents the prices of various commodities at Lhuentse, Lingabi, and the control village Tsholing before and after the road. It is seen that the prices at Lingabi and Tsholing before the road were much higher. After the road, the price difference between Lhuentse and Lingabi is not so high as compared with the control village Tsholing. The prices have come down due to reduced transportation costs after the road.
Table 34. Prices of commodities at various places before and after the road
5.2.3 Bartsham-Ramjar Road
The Bartsham -Ramjar raod connects Ramjar village with Bartsham under Rarr~jar geog of Trashiyangtse Dzongkhag. 15 households from the Ramjar village of Ramjar geog under Trashiyangtse Dzongkhag were covered by the survey.
5.2.3.1 Aqriculture and croppinq pattern
Among the 15 households surveyed, .there was a good indication of the cultivation of new cash crops like potato, beans, peas and other vegetables (Table 35). There was an increase in area and production of chillies. There was a slight increase in the number of mandarin orange and other fruit trees. Farmers also reported that they are planning to develop new orchards and increase the area under vegetables since the road has improved market access. In the staple cereals, though there was a decrease in area of about 2.5 acres, there was an increase in production as compared to the before the road scenario.
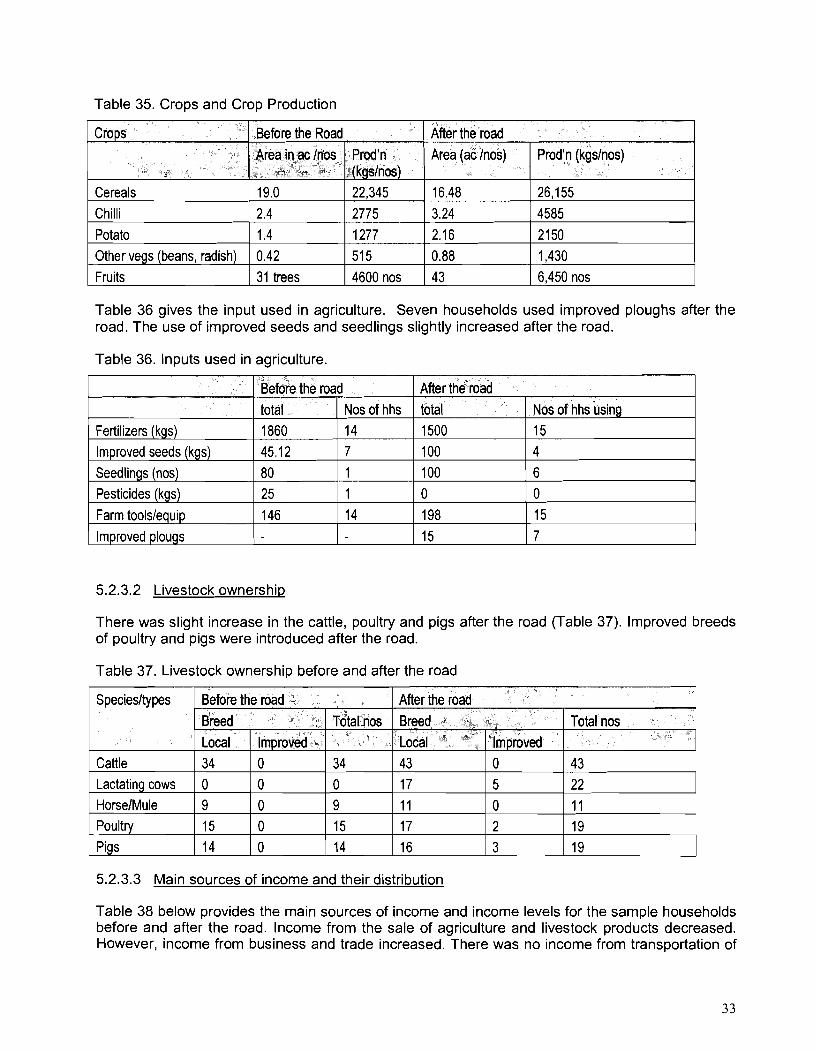
Table 35. Crops and Crop Production
Table 36 gives the input used in agriculture. Seven households used improved ploughs after the road. The use of improved seeds and seedlings slightly increased after the road.
Table 36. Inputs used in agriculture.
Crops
Cereals Chilli Potato Other vegs (beans, radish) Fruits
5.2.3.2 Livestock ownership
After the road
There was slight increase in the cattle, poultry and pigs after the road (Table 37). lmproved breeds of poultry and pigs were introduced after the road.
Before the Road Area (ac /nos)
16.48 3.24 2.16 0.88 43
Fertilizers (kgs) Improved seeds (kgs) Seedlings (nos) Pesticides (kgs)
Farm toolslequip Improved plougs
Table 37. Livestock ownership before and after the road
Area in, ac /nos -
19.0 2.4 1.4 0.42 31 trees
Prod'n (kgslnos)
26,155 4585 2150 1,430 6,450 nos
After the road
Prod'n (kg slnos) 22,345 2775 1277 515 4600 nos
total 1500 100 100 0 198 15
Before the road
5.2.3.3 Main sources of income and their distribution
Nos of hhs using 15 4 6 0 15 7
total 1860 45.12 80 25 146
Speciesltypes
Cattle Lactating cows HorselMule Poultry Pigs
Table 38 below provides the main sources of income and income levels for the sample households before and after the road. Income from the sale of agriculture and livestock products decreased. However, income from business and trade increased. There was no income from transportation of
Nos of hhs 14 7 1 1 14
Before the road After the road
~otal nos
34 0 9 15 14
Breed Total nos
43 22 11 19 19
Local 34 0 9 15 14
Breed , ,
Improved 0 0 0 0 0
Y o c a l 43 17 11 17 16
'Improved 0 5 0 2 3
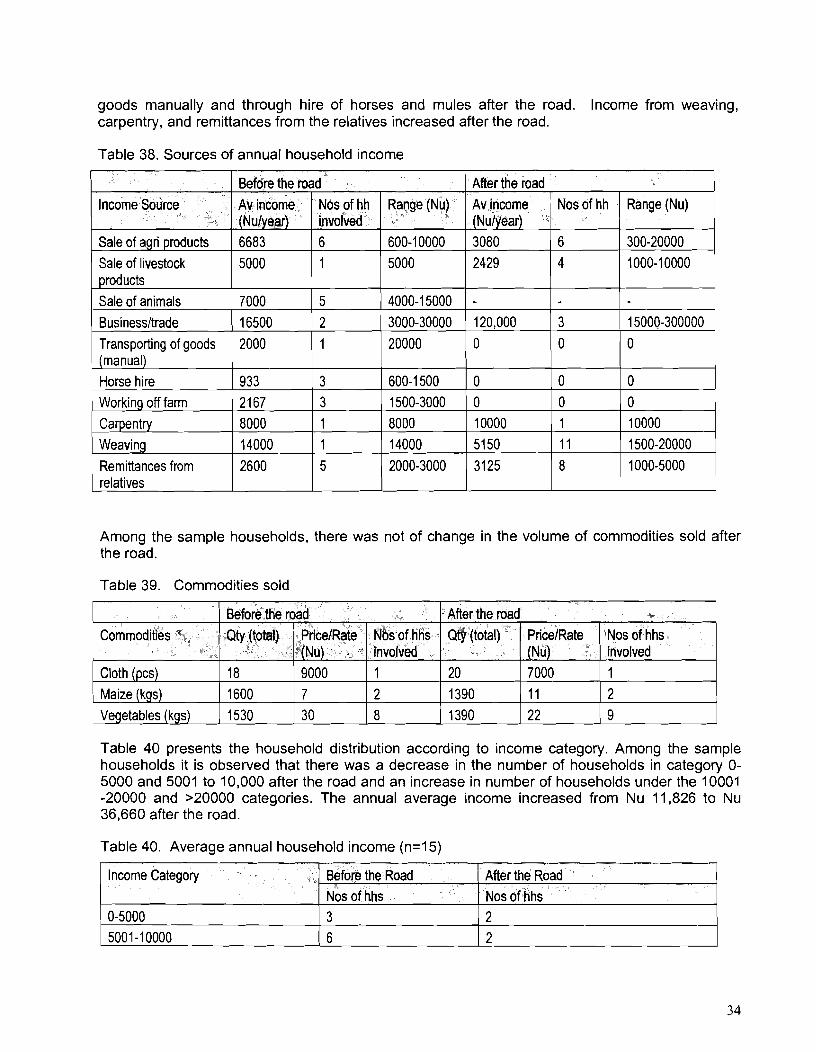
goods manually and through hire of horses and mules after the road. lncome from weaving, carpentry, and remittances from the relatives increased after the road.
Table 38. Sources of annual household income
Among the sample households, there was not of change in the volume of commodities sold after the road.
Table 39. Commodities sold
1
Table 40 presents the household distribution according to income category. Among the sample households it is observed that there was a decrease in the number of households in category O- 5000 and 5001 to 10,000 after the road and an increase in number of households under the 10001 -20000 and >20000 categories. The annual average income increased from Nu 11,826 to Nu 36,660 after the road.
Income Source -
Sale of agri products Sale of livestock products Sale of animals Businessltrade
Table 40. Average annual household income (n=15)
After the road
Transporting of goods (manual)
Before the road Range (Nu)
300-20000 1000-1 0000
15000-300000
0
Av income (Nulyear) 3080 2429
- 120,000
Income Category
0-5000
Range (Nu)
600-10000 5000
4000-15000 3000-30000
Av income (Nulyear) 6683 5000
7000 16500
0
Nos of t~h
6 4
3
Horse hire 0
20000
Nos of hh involved 6 1
5
2 2000
Before the Road Nos of hhs 3
1
0 10000 1500-20000 1000-5000
Working off farm Carpentry Weaving
Remittances from relatives
After the Road Nos of hhs 2
2167 8000 14000
2600
3 1 1
5
1500-3000 8000 14000 2000-3000
0 10000 5150
31 25
0 1 11
8
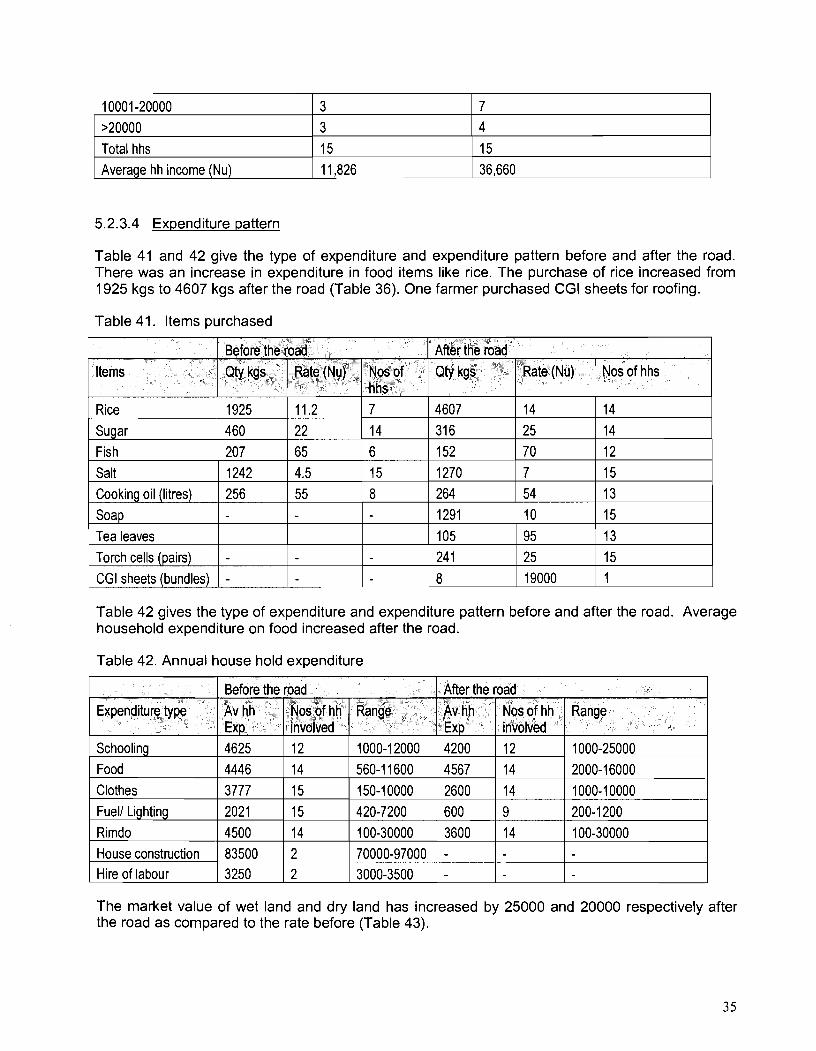
1 Total hhs 1 15 1 15 1 Average hh income (Nu) 1 11,826 1 36,660
5.2.3.4 Expenditure pattern
Table 4 1 and 4 2 give the type of expenditure and expenditure pattern before and after the road. There was an increase in expenditure in food items like rice. The purchase of rice increased from 1925 kgs to 4 6 0 7 kgs after the road (Table 36). One farmer purchased CGI sheets for roofing.
Table 41. ltems purchased
Table 4 2 gives the type of expenditure and expenditure pattern before and after the road. Average household expenditure on food increased after the road.
Table 42. Annual house hold expenditure
Items
Rice
The market value of wet land and dry land has increased by 25000 and 20000 respectively after the road as compared to the rate before (Table 43).
After the road
Expenditure type
Schooling Food
Clothes Fuel1 Lighting
Rimdo House construction Hire of labour
Qty kgs
4607
Before the road
Qty kgs % -
1925
Rate (Nu)
14
Before the road ,
Nos of hhs
14
Rate (NU) ': 11.2
After the road Av hh Exp 4625 4446 3777 2021 4500 83500 3250
.Nos of h hs 7
Av hh Ex p 4200 4567 2600 600 3600 - -
Nos of hh involved 12 14 15 15 14 2 2
Nosof hh involved 12 14 14 9 14
Range
1000-12000 560-1 1600 150-10000 420-7200 100-30000 70000-97000 3000-3500
~ a n ~ e
1000-25000 2000-1 6000 1000-1 0000 200-1 200 100-30000
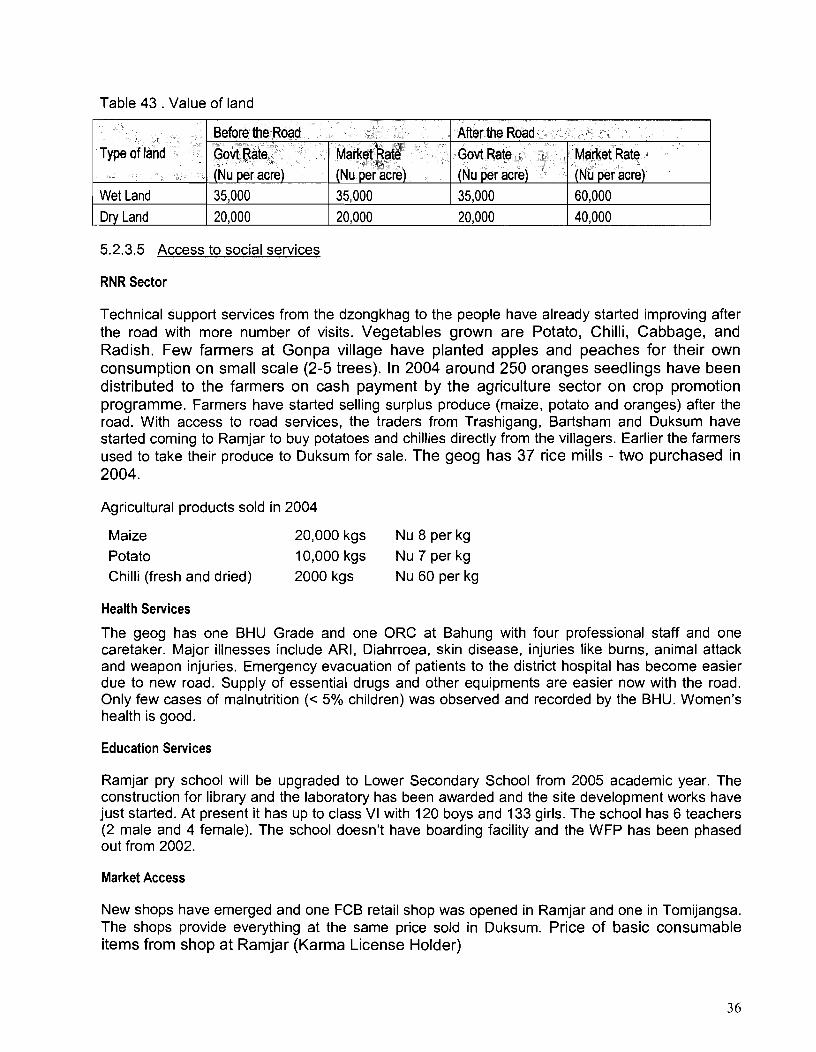
Table 43 . Value of land
5.2.3.5 Access to social services
Type of land
Wet Land
Dry Land
RNR Sector
Technical support services from the dzongkhag to the people have already started improving after the road with more number of visits. Vegetables grown are Potato, Chilli, Cabbage, and Radish. Few farmers at Gonpa village have planted apples and peaches for their own consumption on small scale (2-5 trees). In 2004 around 250 oranges seedlings have been distributed to the farmers on cash payment by the agriculture sector on crop promotion programme. Farmers have started selling surplus produce (maize, potato and oranges) after the road. With access to road services, the traders from Trashigang, Bartsham and Duksum have started coming to Ramjar to buy potatoes and chillies directly from the villagers. Earlier the farmers used to take their produce to Duksum for sale. The geog has 37 rice mills - two purchased in 2004.
Agricultural products sold in 2004
Before the Road
Maize 20,000 kgs Nu 8 per kg Potato 10,000 kgs Nu 7 per kg Chilli (fresh and dried) 2000 kgs Nu 60 per kg
Govt Rate (Nu per acre) 35,000 20,000
After the Road
Health Services
~arkdt R& ' (Nu per acre) 35,000 20,000
Govt Rate (Nu per acre) 35,000 20,000
The geog has one BHU Grade and one ORC at Bahung with four professional staff and one caretaker. Major illnesses include ARI, Diahrroea, skin disease, injuries like burns, animal attack and weapon injuries. Emergency evacuation of patients to the district hospital has become easier due to new road. Supply of essential drugs and other equipments are easier now with the road. Only few cases of malnutrition (< 5% children) was observed and recorded by the BHU. Women's health is good.
Market Rate (Nu per acre) 60,000 40,000
Education Services
Ramjar pry school will be upgraded to Lower Secondary School from 2005 academic year. The construction for library and the laboratory has been awarded and the site development works have just started. At present it has up to class VI with 120 boys and 133 girls. The school has 6 teachers (2 male and 4 female). The school doesn't have boarding facility and the WFP has been phased out from 2002.
Market Access
New shops have emerged and one FCB retail shop was opened in Ramjar and one in Tomijangsa. The shops provide everything at the same price sold in Duksum. Price of basic consumable items from shop at Ramjar (Karma License Holder)
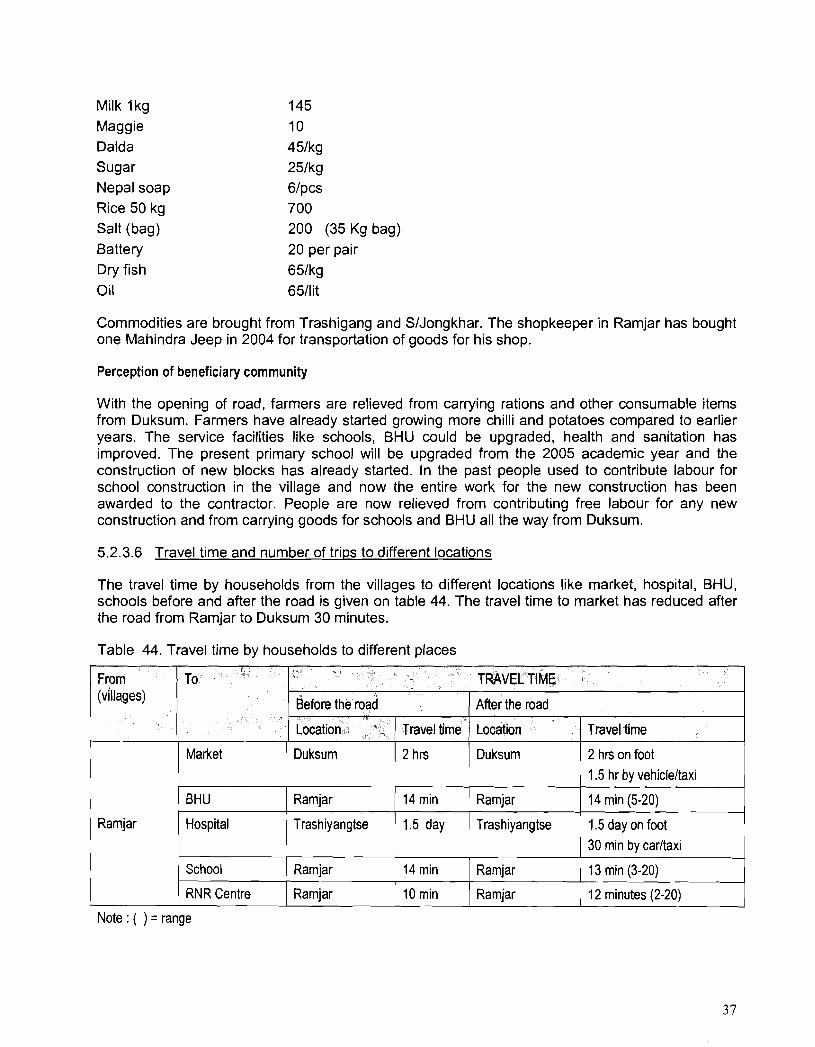
Milk 1 kg Maggie Dalda Sugar Nepal soap Rice 50 kg Salt (bag) Battery Dry fish Oil
145 10 45lkg 25lkg 6/pcs 700 200 (35 Kg bag) 20 per pair 65lkg 65llit
Commodities are brought from Trashigang and SIJongkhar. The shopkeeper in Ramjar has bought one Mahindra Jeep in 2004 for transportation of goods for his shop.
Perception of beneficiary community
With the opening of road, farmers are relieved 'from carrying rations and other consumable items from Duksum. Farmers have already started growing more chilli and potatoes compared to earlier years. The service facilities like schools, BHU could be upgraded, health and sanitation has improved. The present primary school will be upgraded from the 2005 academic year and the construction of new blocks has already started. In the past people used to contribute labour for school construction in the village and now the entire work for the new construction has been awarded to the contractor. People are now relieved from contributing free labour for any new construction and from carrying goods for schools and BHU all the way from Duksum.
5.2.3.6 Travel time and number of trips to different locations
The travel time by households from the villages to different locations like market, hospital, BHU, schools before and after the road is given on table 44. The travel time to market has reduced after the road from Ramjar to Duksum 30 minutes.
Table 44. Travel time by households to different places
I Market 1 Duksum ( 2 hn I Duksum / 2 hn on foot
From (villages)
14 min (5-20)
Ramjar 1.5 day on foot
To
I School
RNR Centre
TRAVEL*TIME
Note : ( ) = range
Ramjar
Ramjar
After the road
Location I Travel time
Before the road
Location
14 min
10 min
Travel time
Ramjar
Ramjar
30 min by carltaxi
I 13 min (3-20)
1 12 minutes (2-20)
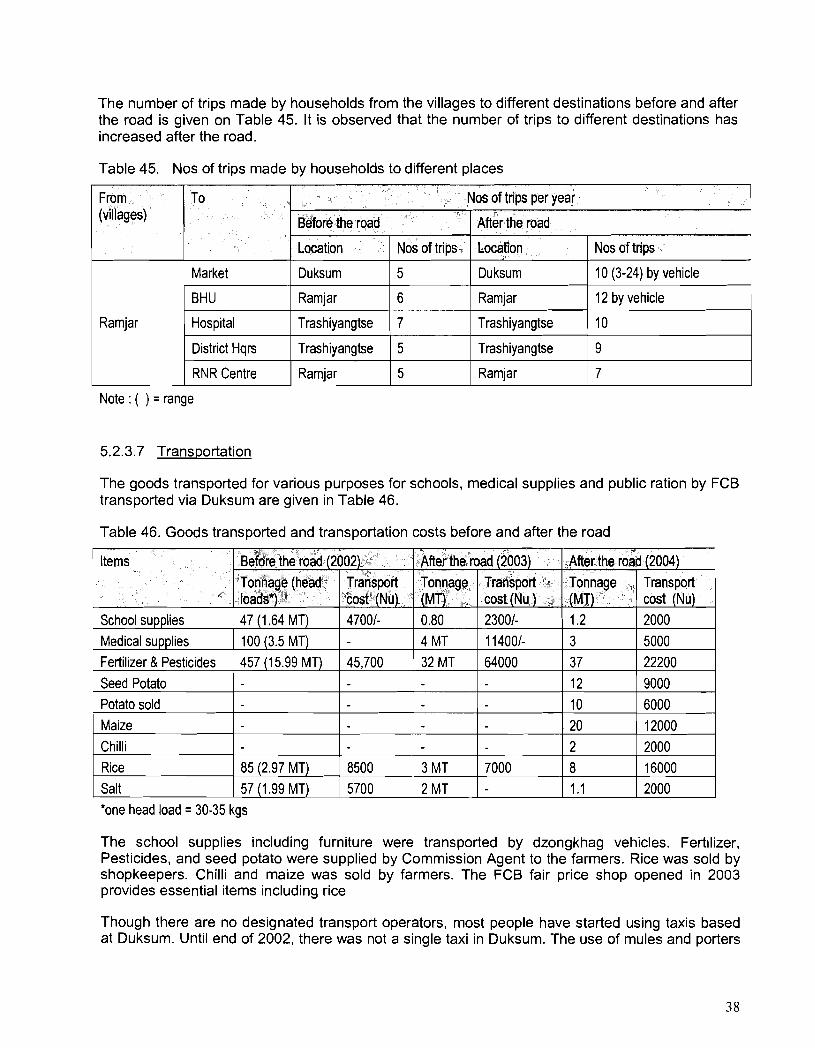
The number of trips made by households from the villages to different destinations before and after the road is given on Table 45. It is observed that the number of trips to different destinations has increased after the road.
Table 45. Nos of trips made by households to different places
Note : ( ) = range
From (villages)
Ramjar
5.2.3.7 Transportation
The goods transported for various purposes for schools, medical supplies and public ration by FCB transported via Duksum are given in Table 46.
To
Market
BHU -
Table 46. Goods transported and transportation costs before and after the road
Hospital
District Hqrs Trashiyangtse 5
RhlR Centre Ramjar 5 Ramjar 7
Nos of trips per year
'one head load = 30-35 kgs
Items
School supplies Medical supplies Fertilizer & Pesticides Seed Potato Potato sold Maize Chilli Rice Salt
The school supplies includirrg furniture were transported by dzongkhag vehicles. Fertilizer, Pesticides, and seed potato were supplied by Commission Agent to the farmers. Rice was sold by shopkeepers. Chilli and maize was sold by farmers. The FCB fair price shop opened in 2003 provides essential items including rice
Before the road !
Though there are no designated transport operators, most people have started using taxis based at Duksum. Until end of 2002, there was not a single taxi in Duksum. The use of mules and porters
Location
Duksum
Ramjar
After the road
Nos of trips
5
6
Location
Duksum
Ramjar
~efore the road (2002)
Nos of trips
10 (3-24) by vehicle
12 by vehicle
Tonnage (head loads*) 47 (1 -64 MT) 100 (3.5 MT) 457 (15.99 MT)
85 (2.97 MT) 57 (1.99 MT)
Transport cost (Nu) 47001-
45,700
8500 5700
After the road (2003) Tonnage (MT) ,I
0.80 4 MT 32 MT
3 MT 2 MT
~ f t & the road (2004) Transport - cost (Nu ) 23001- 1 14001- 64000
7000
Tonnage (MT) 1.2 3 37 12 10 20 2 8 1.1
Transport cost (Nu) 2000 5000 22200 9000 6000 12000 2000 16000 2000
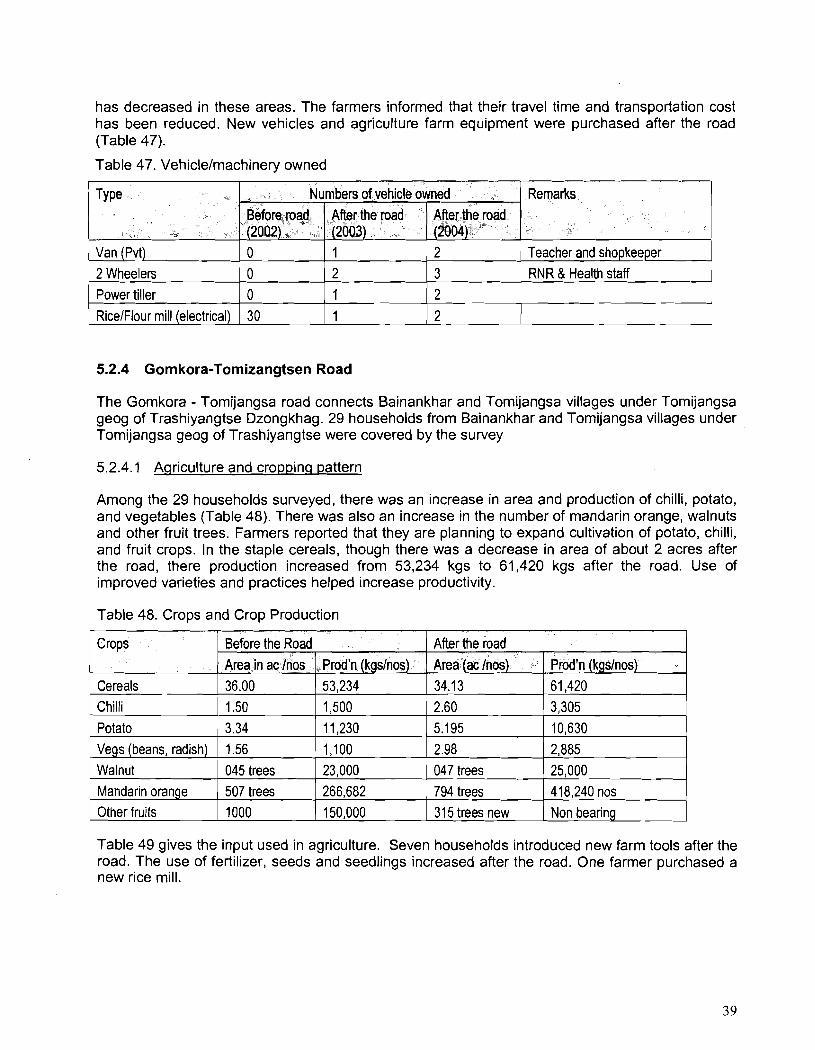
has decreased in these areas. The farmers informed that their travel time and transportation cost has been reduced. New vehicles and agriculture farm equipment were purchased after the road (Table 47).
Table 47. Vehiclelmachinery owned
5.2.4 Gomkora-Tomizangtsen Road
The Gomkora - Tomijangsa road connects Bainankhar and Tomijangsa villages under Tomijangsa geog of Trashiyangtse Dzongkhag. 29 households from Bainankhar and Tomijangsa villages under Tomijangsa geog of Trashiyangtse were covered by the survey
Remarks Type
5.2.4.1 Aqriculture and croppinq pattern
Among the 29 households surveyed, there was an increase in area and production of chilli, potato, and vegetables (Table 48). There was also an increase in the number of mandarin orange, walnuts and other fruit trees. Farmers reported that they are planning to expand cultivation of potato, chilli, and fruit crops. In the staple cereals, though there was a decrease in area of about 2 acres after the road, there production increased from 53,234 kgs to 61,420 kgs after the road. Use of improved varieties and practices helped increase productivity.
Numbers of vehicle owned
Teacher and shopkeeper
Table 48. Crops and Crop Production
2 Wheelers Power tiller
, Crops Before the Road After the road Area in ac /nos Prod'n (kgslnos) Area (ac /nos) Prod'n (kgslnos)
After the road {2004jL
Before road (2002)
) potato ) 3.34 1 11,230 1 5.195 1 10,630
After the road (2003)
0 0
I Vegs (beans, radish) 1 1.56 1 1,100 1 2.98 ( 2,885
RicelFlour mill (electrical) 30 1
23,000 047 trees -
Other fruits 1000 150,000 315 trees new
2
2 1 --
Table 49 gives the input used in agriculture. Seven households introduced new farm tools after the road. The use of fertilizer, seeds and seedlings increased after the road. One farmer purchased a new rice mill.
3 2
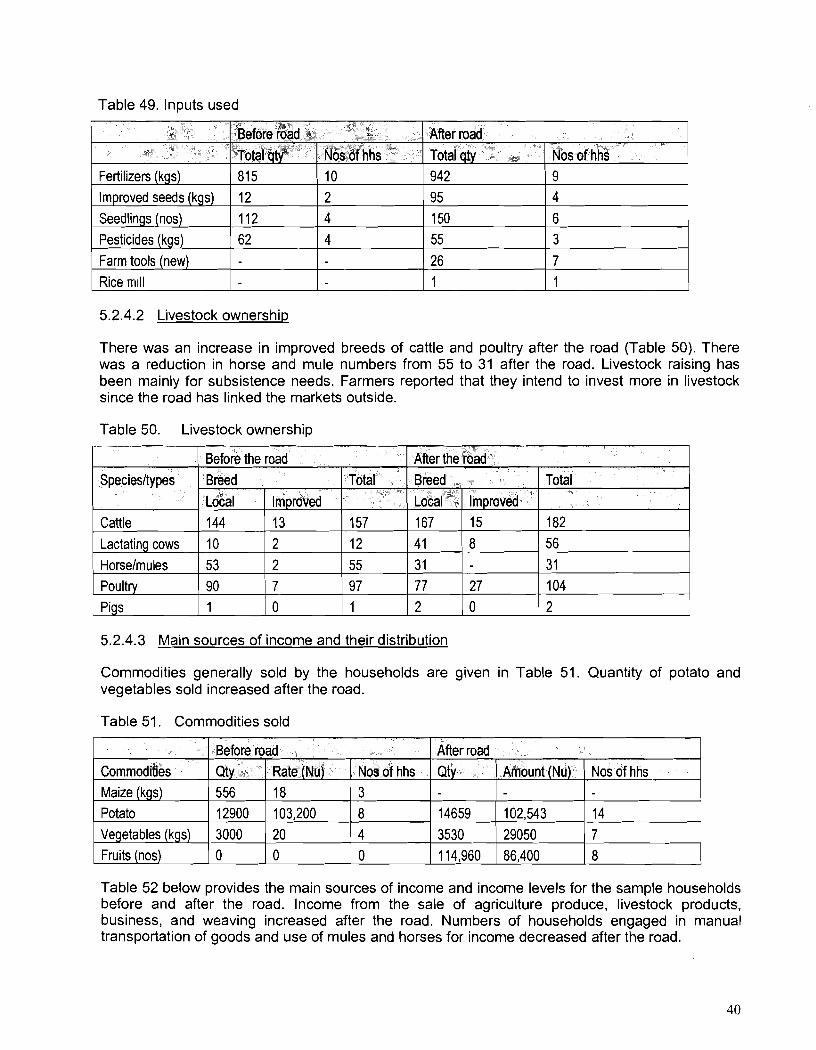
Table 49. Inputs used
5.2.4.2 Livestock owners hi^
Fertilizers (kgs) Improved seeds (kgs) Seedlings (nos) Pesticides (kgs) Farm tools (new) Rice rr~~ll
There was an increase in improved breeds of cattle and poultry after the road (Table 50). There was a reduction in horse and mule numbers from 55 to 31 after the road. I-ivestock raising has been mainly for subsistence needs. Farmers reported that they intend to invest more in livestock since the road has linked the markets outside.
Table 50. Livestock ownership
Before road A % -*
5.2.4.3 Main sources of income and their distribution
$6 4'
Total qty 815 12 112 62
After road
Speciesltypes
Cattle Lactating cows Horselmules Poultry Pigs
Commodities generally sold by the households are given in Table 51. Quantity of potato and vegetables sold increased after the road.
.k&'of hhs 10 2 4 4
Total qty 942 95 150 55 26 1
Table 51. Commodities sold
Nos of hhs 9 4 6 3
7 1
Table 52 below provides the main sources of income and income levels for the sample households before and after the road. Income from the sale of agriculture produce, livestock products, business, and weaving increased after the road. Numbers of households engaged in manual transportation of goods and use of mules and horses for income decreased after the road.
Before the road After the road Total
157 12 55 97 1
Breed Total
182 56
31 104 2
Breed
Local 144 10 53 90 1
Local 167 41 31 77 2
lm proved 13 2 2 7 0
Improved 15 8
27 0
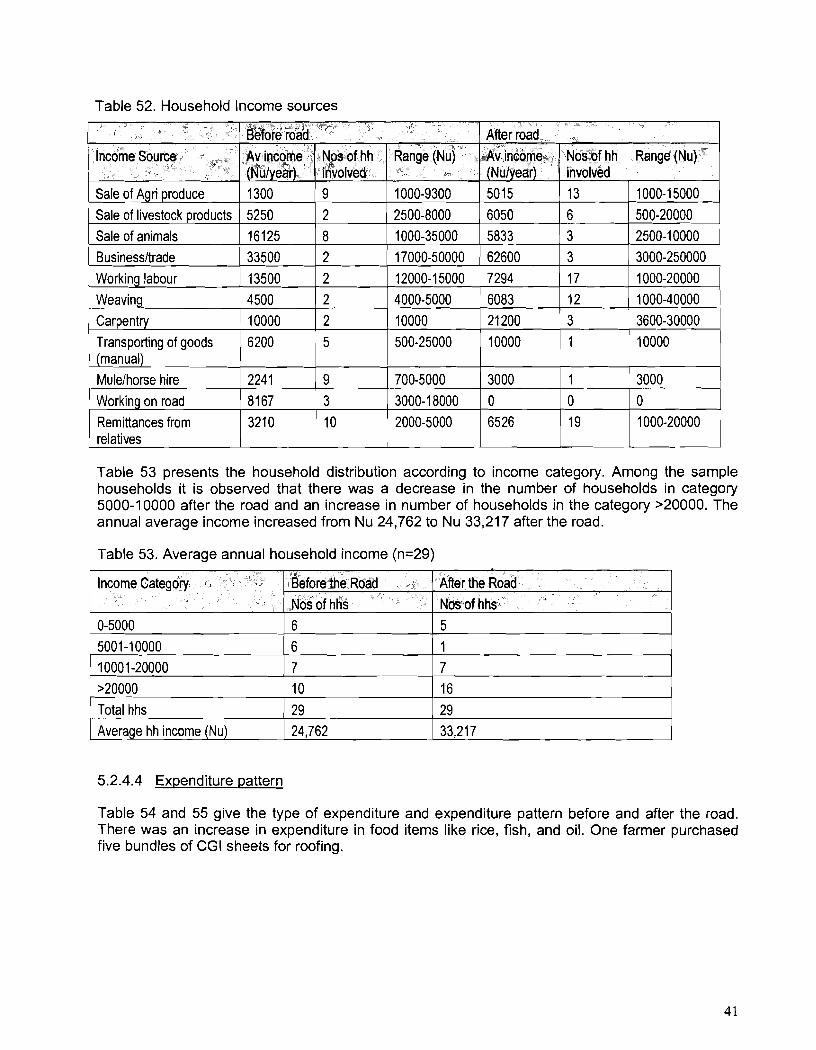
Table 52. Household Income sources
~efore road ' After road Income Source
Sale of livestock products
Weaving Carpentry Transporting of goods (manual)
Table 53 presents the household distribution according to income category. Among the sample households it is observed that there was a decrease in the number of households in category 5000-10000 after the road and an increase in number of households in the category >20000. The annual average income increased from Nu 24,762 to Nu 33,217 after the road.
Sale of animals 16125 8 1000-35000 5833 Businessltrade 33500 2 17000-50000 62600 Working labour 13500 2 12000-15000 7294 17 1000-20000
5250
Mulelhorse hire 1 Working on road 1
Remittances from relatives
Table 53. Average annual household income (n=29)
4500 10000 6200
2
2241 8167 3210
I 1 Total hhs 1 29 1 29
2 2 5
Income Category
1 Average hh income (Nu) 1 24,762 1 33,217
2500-8000
9 ppppp
3 I 10
5.2.4.4 Expenditure pattern
~efore the Road Nos of hhs
Table 54 and 55 give the type of expenditure and expenditure pattern before and after the road. There was an increase in expenditure in food items like rice, fish, and oil. One farmer purchased five bundles of CGI sheets for roofing.
6050
4000-5000 ( 6083
700-5000 3000-18000 2000-5000
After the Road Nosoof hhs
12 3 1
I0000 500-25000
6
1000-40000 1 3600-30000
I 10000
21 200 10000
3000 0 6526
500-20000
1 ( 3000 0
1 19
I
1000-20000
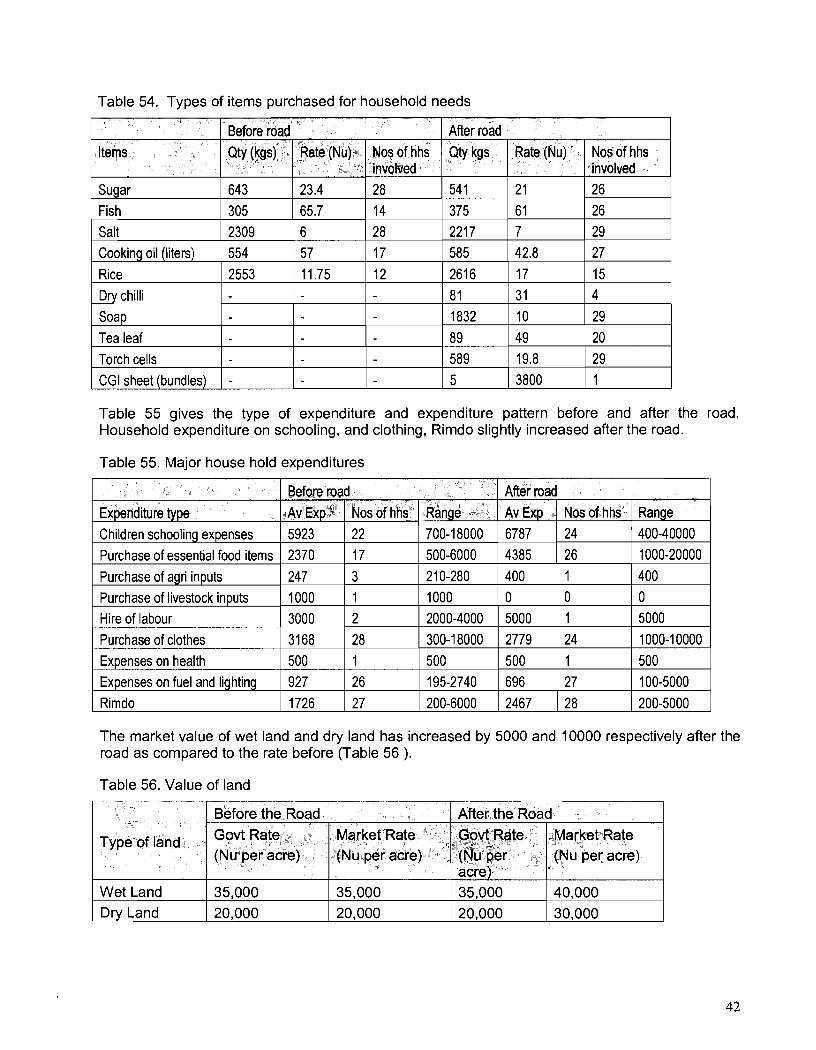
Table 54. Types of items purchased for household needs
Table 55 gives the type of expenditure and expenditure pattern before and after the road. Household expenditure on schooling, and clothing, Rimdo slightly increased after the road.
Table 55. Major house hold expenditures
The market value of wet land and dry land has increased by 5000 and 10000 respectively after the road as compared to the rate before (Table 56 ).
Items
Sugar Fish Salt Cooking oil (liters) Rice Dry chilli Soap Tea leaf Torch cells CGI sheet (bundles)
Table 56. Value of land
After road
Qty kgs
54 1 375 2217 585 2616 81 1832 89 589 5
Before road
Qty (kgs) ,
643 305 2309 554 2553
-
Type of land
Wet Land Dry Land
" Rate (Nu)
21 61 7 42.8 17 31 10 49 19.8 3800
Nos of hhs involved 26 26 29 27
15 4 29 20 29 1
Rate (Nu)
23.4 65.7 6 57 11.75
Nos of hhs involved 28 14 28 17 12
Before the Road Govt Rate, (Nu per acre)
35,000 20,000
After the Road Market Rate (Nu per acre)
35,000 20,000
Govt Rate (Nuaper acre) 35,000 20,000
Market Rate (Nu per acre)
40,000 30,000
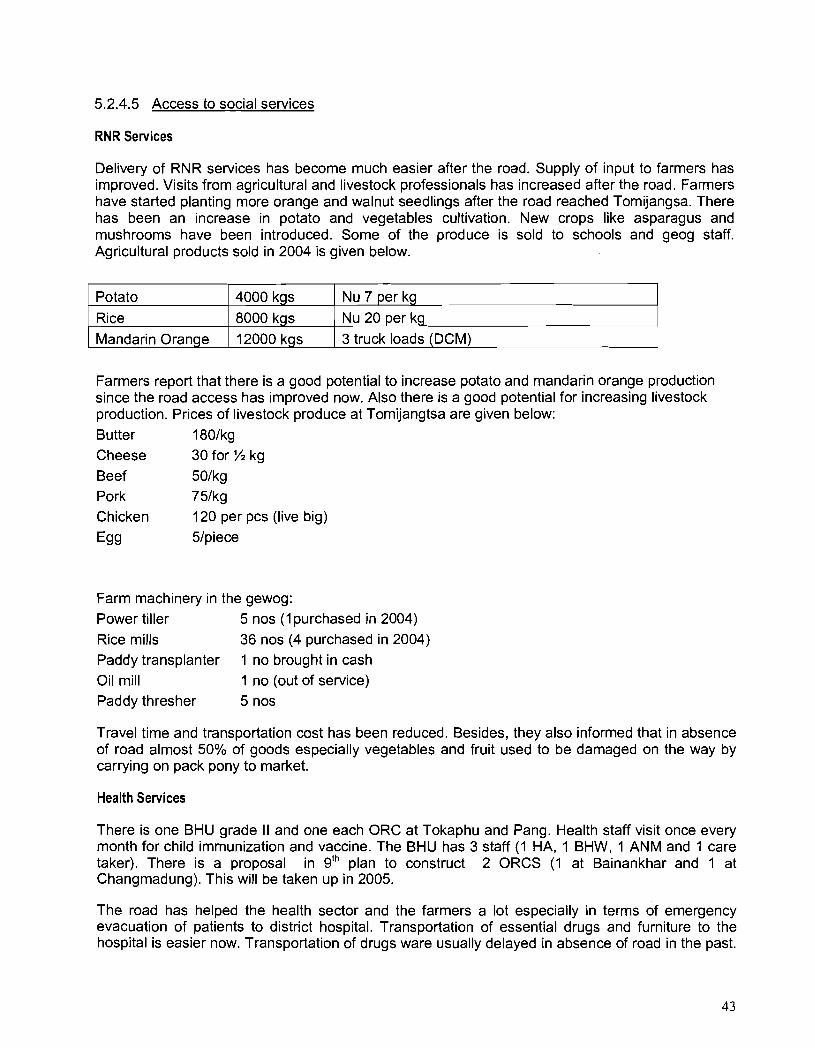
5.2.4.5 Access to social services
RNR Services
Delivery of RNR services has become much easier after the road. Supply of input to farmers has improved. Visits from agricultural and livestock professionals has increased after the road. Farmers have started planting more orange and walnut seedlings after the road reached Tomijangsa. There has been an increase in potato and vegetables cultivation. New crops like asparagus and mushrooms have been introduced. Some of the produce is sold to schools and geog staff. Agricultural products sold in 2004 is given below.
Farmers report that there is a good potential to increase potato and mandarin orange production since the road access has improved now. Also there is a good potential for increasing livestock production. Prices of livestock produce at Tomijangtsa are given below: Butter 180lkg Cheese 30 for 1/2 kg Beef 50lkg Pork 75lkg Chicken 120 per pcs (live big)
Egg 51piece
Potato Rice Mandarin Orange
Farm machinery in the gewog: Power tiller 5 nos ( I purchased in 2004) Rice mills 36 nos (4 purchased in 2004) Paddy transplanter 1 no brought in cash Oil mill 1 no (out of service) Paddy thresher 5 nos
Travel time and transportation cost has been reduced. Besides, they also informed that in absence of road almost 50% of goods especially vegetables and fruit used to be damaged on the way by carrying on pack pony to market.
4000 kgs 8000 kgs 12000 kgs
Health Services
Nu 7 per kg Nu 20 per kg 3 truck loads (DCM)
There is one BHU grade II and one each ORC at Tokaphu and Pang. Health staff visit once every month for child immunization and vaccine. The BHU has 3 staff (1 HA, 1 BHW, 1 ANM and 1 care taker). There is a proposal in gth plan to construct 2 ORCS (1 at Bainankhar and 1 at Changmadung). This will be taken up in 2005.
The road has helped the health sector and the farmers a lot especially in terms of emergency evacuation of patients to district hospital. Transportation of essential drugs and furniture to the hospital is easier now. Transportation of drugs ware usually delayed in absence of road in the past.
With the road it is expected that the health facilities would further improve in terms of drugs availability, better furniture and equipments. Health of people would improve death cases could be reduced with access to better health facilities and road services. Visit by medical staff form the Dzongkhag and central has increased since road constructed. Major illness include: cough and cold (ARI), skin disease, worms, sore eyes and injuries. Overall, health condition of the people is good including women and children. No malnutrition children in the geog so far.
Delivery system after road- The evacuation of critical cases to the District Hospital has greatly improved after the road. Nine emergency cases were lifted by the ambulance after the road. Before the road, only two patients were actually referred to the district hospital in a year. Also the number of out patients visiting BHU have increased after the road. People around Duksum and near by high way used to go to Trashigang hospital. After road it is faster and nearer for them to come to this BHU so the number has gone up.
Education Services
Tomijangsa Pry School has 5 permanent teachers and 2 on apprentice with classes form PP to VI. Parents of the school children are now relieved from carrying loads of school supplies all the way from Duksum. Farmers used to complain when they were asked for their services especially during peak agricultural seasons. Even senior students were engaged in carrying school goods form Duksum before and now students can concentrate on studies. The head teacher feels that the delivery system has greatly improved after the road. Not only that it is cost saving- for household items - a load of about 30-35 kgs would cost them Nu.100 to transport. After road, the taxis are available which carry about 400 kgs and charge only Nu. 300 from Duksum to Tomijangsa. The mule track is risky and slippery as well as chances of being attacked by wild animals. There were no school drop outs after the road as compared to 6 boys and 4 girls dropping out before the road.
Market Access
Access to market has become easier and faster after the road. Compared to old days, the road has helped a lot to the farmers. Now people have more access to main shops and town. Farmers' income has started increasing slowly form sale of vegetables and livestock products.
Prior to road construction, majority of the farmers from Tomijangsa and Ramjar used to take rations and other consumable items from Duksum. With the opening of the two new roads (Gomkora- Tomijangsa and Bartsham-Ramjar road), new shops have come up in these two geogs and most farmers do not come to Duksum for purchase of goods. The farmers get everything from the shops in the geog at the same rate. With better road services and availability of taxis, most,farmers have started buying goods in bulk from Trashigang and other places. The transport from Duksum to Tomijangsa is mostly by vehicle. In fact the old mule track is no more used due to risk from falling boulders. Tomijangsa people now ravel and transport materials by taxi. There are two Taxis stationed at Duksum.
The salelincome of the shopkeepers at Duksum has started decreasing. A shopkeeper in Duksum told that until 2004 he used to bring 8-9 truckloads of rations (rice, sugar, dal, flour and oil) from SIJongkhar per year. In 2004 he had difficulty in disposing 5 truckloads of goods brought from SlJongkhar. In Tomijangsa and Ramjar, the sale of goods by the shopkeepers has been increasing with more people buying goods from the shops.
Perception of the beneficiary community
Access to social services (district hospital, Market, Dzongkhag HQ and visiting relatives) has improved and visit by the farmers to these places have increased after the road has opened. Visit
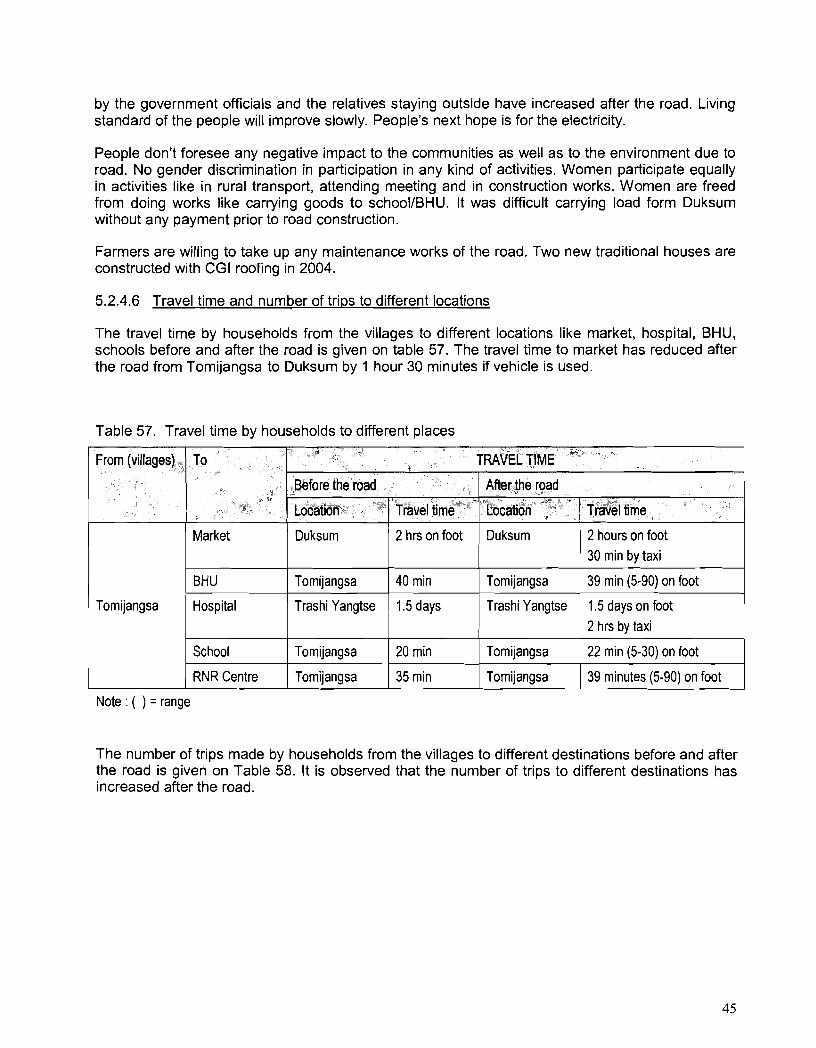
by the government officials and the relatives staying outside have increased after the road. Living standard of the people will improve slowly. People's next hope is for the electricity.
People don't foresee any negative impact to the communities as well as to the environment due to road. No gender discrimination in participation in any kind of activities. Women participate equally in activities like in rural transport, attending meeting and in construction works. Women are freed from doing works like carrying goods to school1BHU. It was difficult carrying load form Duksum without any payment prior to road construction.
Farmers are willing to take up any maintenance works of the road. Two new traditional houses are constructed with CGI roofing in 2004.
5.2.4.6 Travel time and number of trips to different locations
The travel time by households from the villages to different locations like market, hospital, BHU, schools before and after the road is given on table 57. The travel time to market has reduced after the road from Tomijangsa to Duksum by 1 hour 30 minutes if vehicle is used.
Table 57. Travel time by households to different places
I I Market / Duksum / 2 hn on foot 1 Duksum / 2 houn on foot I
From (villages) To
i
I
1 I 1 1 1 2 hrs by taxi 1
30 min by taxi
BHU
Tomijangsa Hospital
I / TRAVEL TIME
The number of trips made by households from the villages to different destinations before and after the road is given on Table 58. It is observed that the number of trips to different destinations has increased after the road.
Before the road % -
Location , ' I Travel time
Tomijangsa
School
RNR Centre
After the road
Location I Tkvel time
40 min
Note : ( ) = range
Tomijangsa
Tomijangsa
Trashi Yangtse , 1.5 days
Tomijangsa
20 min
35 min
39 min (5-90) on foot
Trashi Yangtse 1.5 days on foot
Tomijangsa
Tomijangsa
22 min (5-30) on foot
39 minutes (5-90) on foot
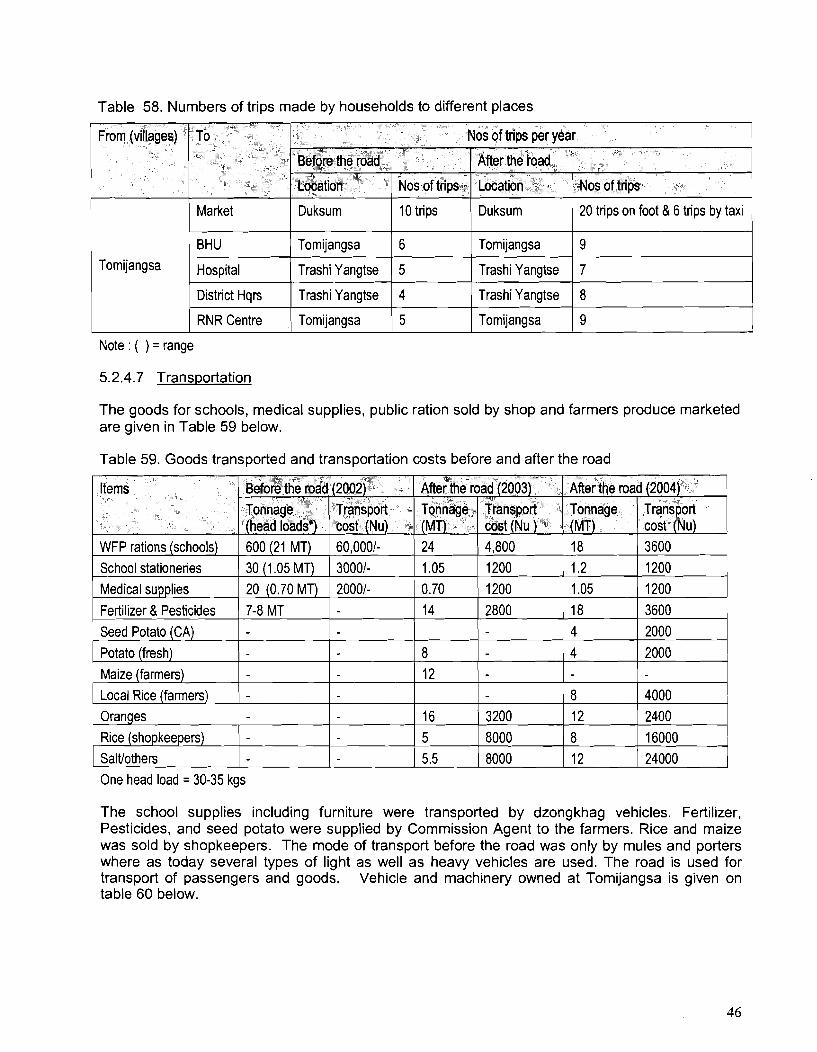
Table 58. Numbers of trips made by households to different places
Note : ( ) = range
5.2.4.7 Transportation
From (villagesj
Tomijangsa
The goods for schools, medical supplies, public ration sold by shop and farmers produce marketed are given in Table 59 below.
-Bid
To v -
Market
BHU
Hospital
District Hqrs
RNR Centre
Nos of trips per year
Table 59. Goods transported and transportation costs before and after the road
~efore the=r~ad
One head load = 30-35 kgs
~ocation*
Duksum
Tomijangsa
Trashi Yangtse
Trashi Yangtse
Tomijangsa
After the road
The school supplies including furniture were transported by dzongkhag vehicles. Fertilizer, Pesticides, and seed potato were supplied by Commission Agent to the farmers. Rice and maize was sold by shopkeepers. The mode of transport before the road was only by mules and porters where as today several types of light as well as heavy vehicles are used. The road is used for transport of passengers and goods. Vehicle and machinery owned at Tomijangsa is given on table 60 below.
Nos of trips
10 trips
6
5
4
5
Locati~n
Duksum
Tomijangsa
Trashi Yangtse
Trashi Yangtse
Tomijangsa
Nos of trips
20 trips on foot & 6 trips by taxi
9
7
8
9
Items After the road (2004) Tonnage (MT)
*- , *
~ f i e r the road (2003)
3600
Transport cost (Nu)
~onnaje (MT) -
Before the road (2002)
School stationeries
ran sport cost (Nu )
Tonnage, (head loads') -
Tt;ansport cost (Nu)
30 (1.05 MT) 30001- 0.70
2800
3200
8000 8000
Fertilizer & Pesticides Seed Potato (CA)
Potato (fresh) Maize (farmers) Local Rice (farmers) Oranges Rice (shopkeepers) Saltlothers
1.05
0 18 4
4
8 12
8 12
7-8 MT
1200 1200 3600 2000
2000
4000 2400
16000 24000
14
8 12
16 5 5.5
1.2 1200
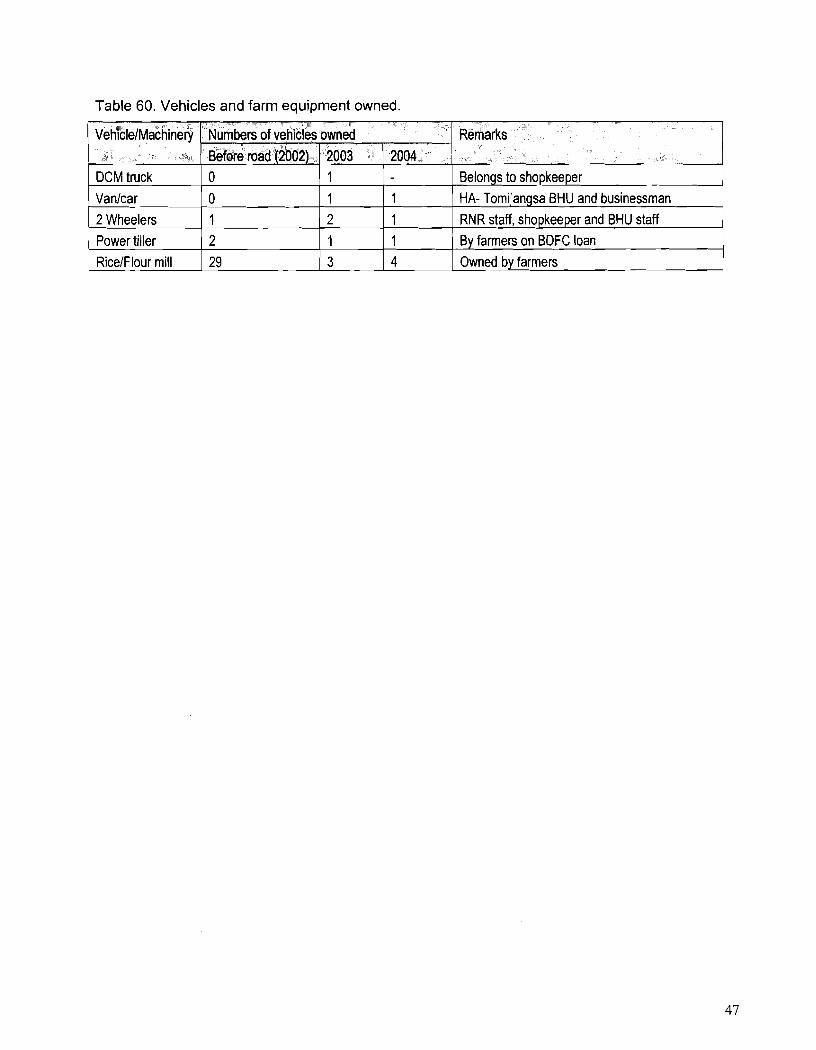
Table 60. Vehicles a n d f a rm equipment owned.
1 VehiclelMachinerv I Numbers of vehicles owned I Remarks
DCM truck Vanlcar 2 Wheelers
1
0 0 1
Power tiller RicelFlour mill
1 1 2
2
29
1
1
Belongs to shopkeeper HA- Tomijangsa BHU and businessman
RNR staff, shopkeeper and BHU staff 1 3
1 4
By farmers on BDFC loan Owned by farmers
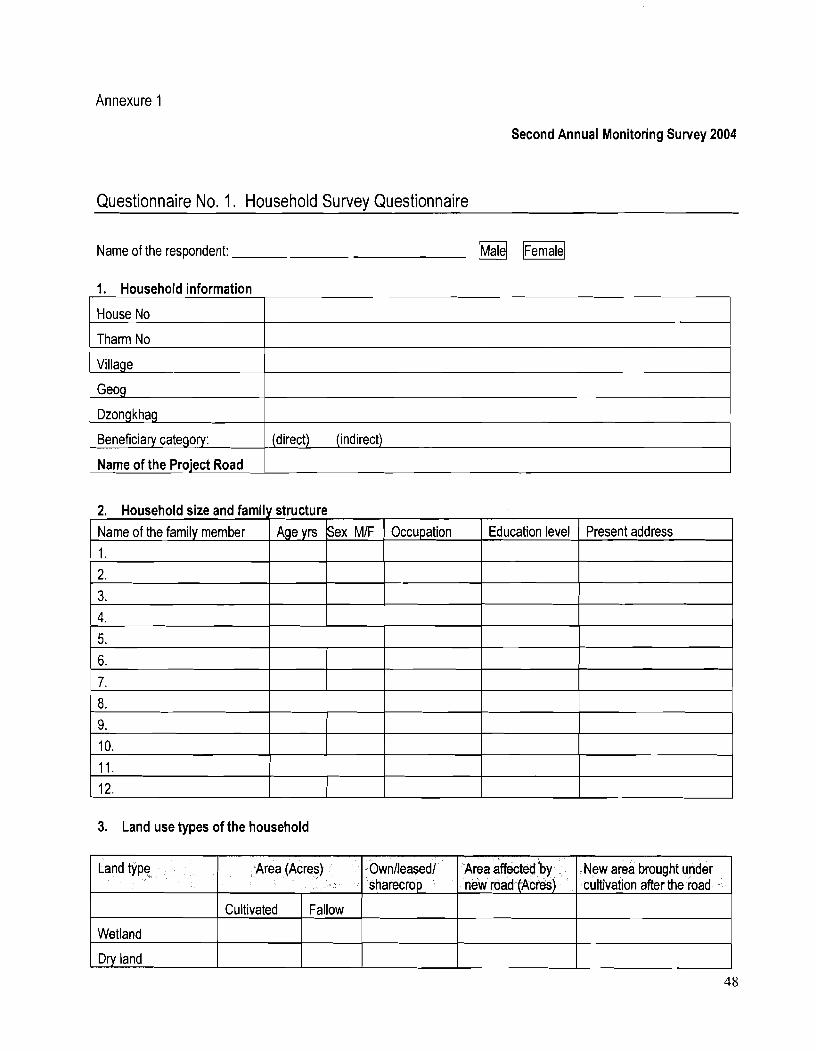
Annexure 1
Second Annual Monitoring Survey 2004
Questionnaire No. 1. Household Survev Questionnaire
Name of the respondent: ale(
1. Household information I I I
House No
Tharm No I
Village
Geog
Dzong khag
Beneficiary category:
1 Name of the Project Road I
3. Land use types of the household
Land type
Wetland
Dry land
Area (Acres) Ownlleasedl sharecrop
Cultivated Fallow
Area affected by new road (Acres)
New area brought under cultivation after the road
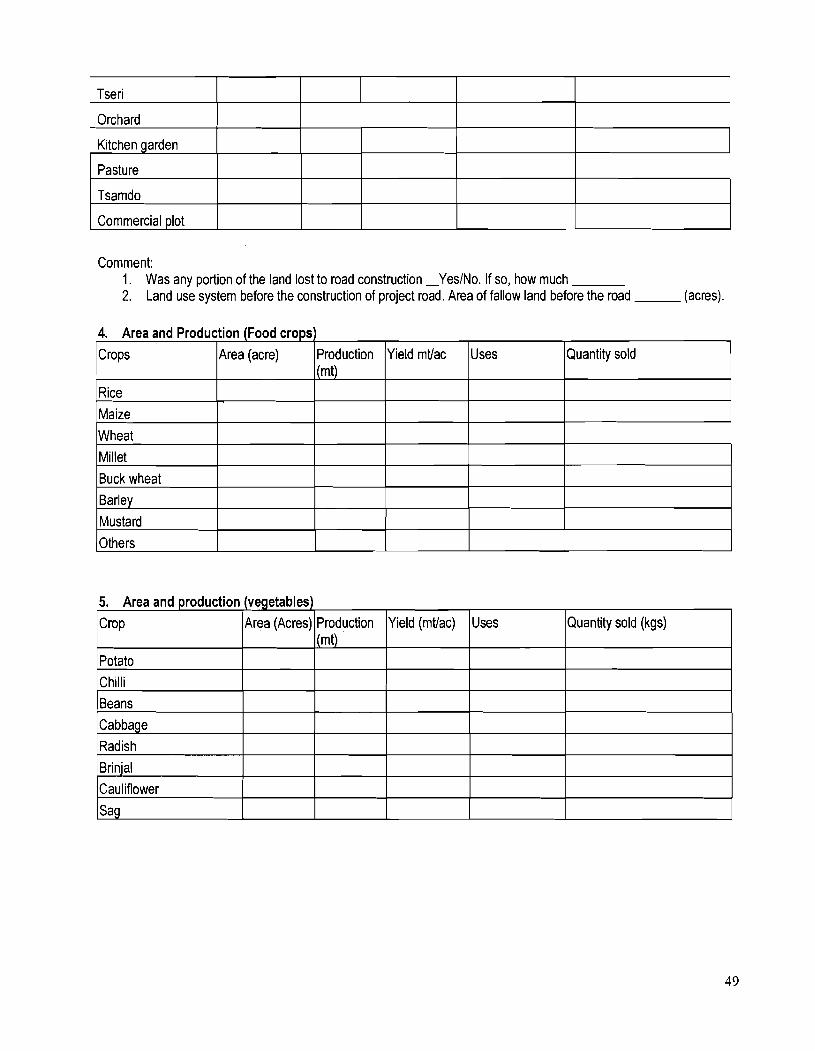
Tseri
Orchard
Kitchen garden
Pasture
Tsamdo
Commercial plot
Comment: 1. Was any portion of the land lost to road construction -YeslNo. If so, how much 2. Land use system before the construction of project road. Area of fallow land before the road (acres).
4. Area and Production (Food crops) -
Chilli Beans
5. Area and production (vegetables)
Cabbage
Crops
Rice Maize
Wheat Millet Buck wheat Barley Mustard
Radish Brinjal Cauliflower
Sag
Others
Yield mtlac Area (acre)
Uses Crop
Potato
Uses Production (mt)
Quantity sold (kgs) Production (m t)
Area (Acres)
Quantity sold
Yield (mtlac)
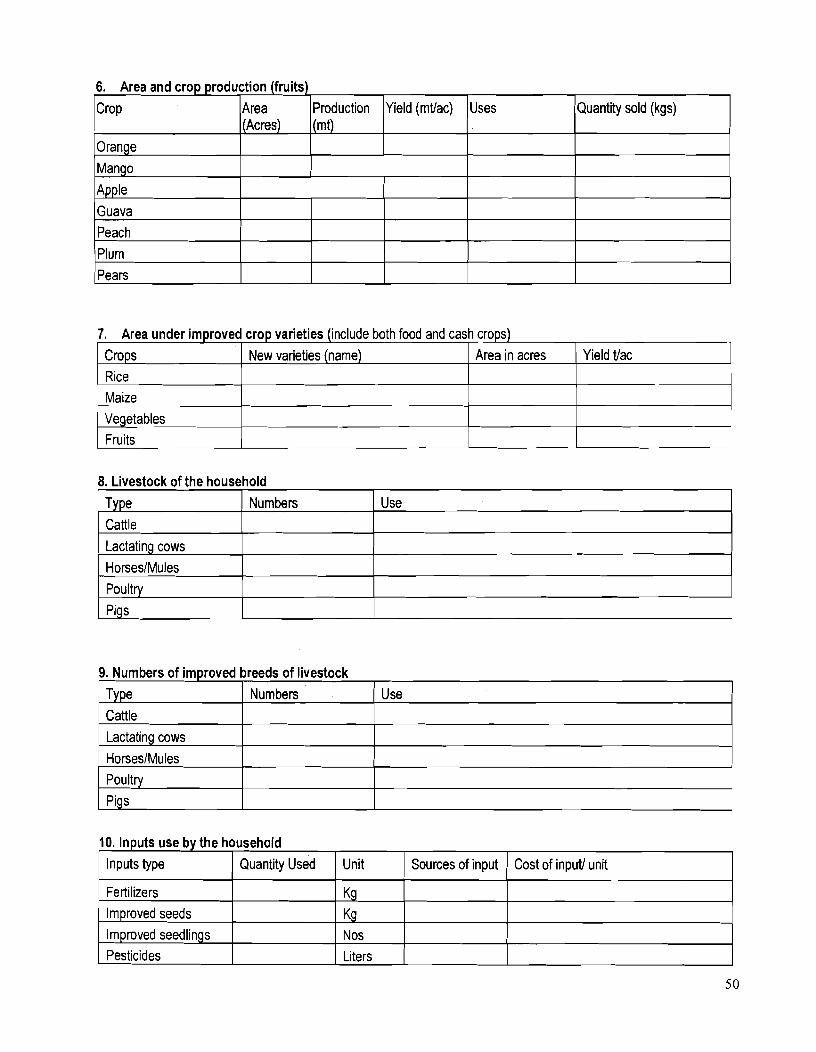
6. Area and crop production (fruits) I I I I I I
I
-
Guava Peach Plum
Pears
Maize Vegetables Fruits
Area (Acres)
-
7. Area under improved crop varieties (include both food and cash crops)
8. Livestock of the household I I
Production (m t)
Yield tlac Crops Rice
Lactating cows
HorseslMules
Poultry Pigs
Type Cattle
9. Numbers of im~roved breeds of livestock
Yield (mtlac)
New varieties (name)
1 Type I Numbers 1 use
Area in acres
Numbers
Cattle Lactating cows
Uses
Use
HorseslMules Poultry Pigs
Quantity sold (kgs)
10. Inputs use by the household
Inputs type
Fertilizers Improved seeds Improved seedlings Pesticides
Nos Liters
Quantity Used Unit
Kg Kg
Sources of input Cost of inputl unit
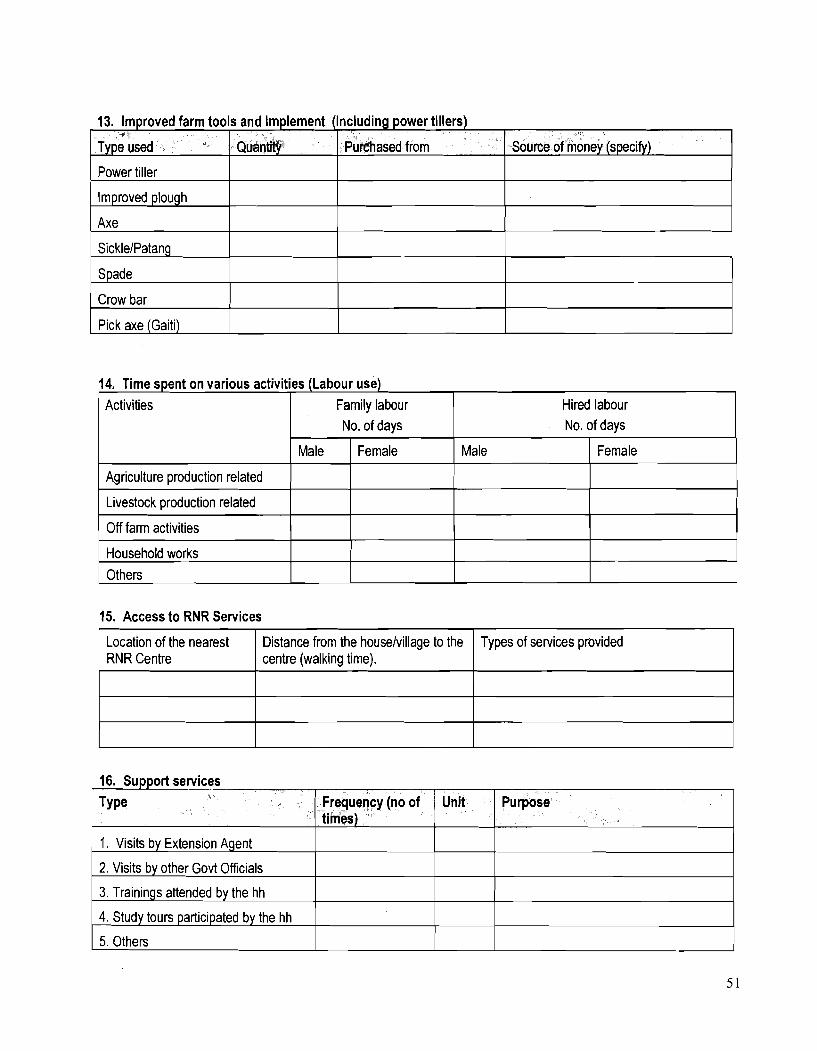
13. lmproved farm tools and implement (including power tillers)
Crow bar I I I
Power tiller
lmproved plough
Axe
I Pick axe (Gaiti)
Source of money (specify) Type used
,
1 Agriculture production related 1
I I Quantity
14. Time spent on various activities (Labour use)
I Livestock production related I
Purchased from
I off farm activities I I I I I
Hired labour No, of days
Male I Female
Activities
Household works Others
Family labour No. of days
Male 1 Female
15. Access to RNR Services
I 1. Visits by Extension Agent
2. Visits by other Govt Officials
3. Trainings attended by the hh
4. Study tours participated by the hh
5. Others
Types of services provided Location of the nearest RNR Centre
16. Support services
Distance from the houselvillage to the centre (walking time).
TY pe --
Frequency (no of Unit Purpose
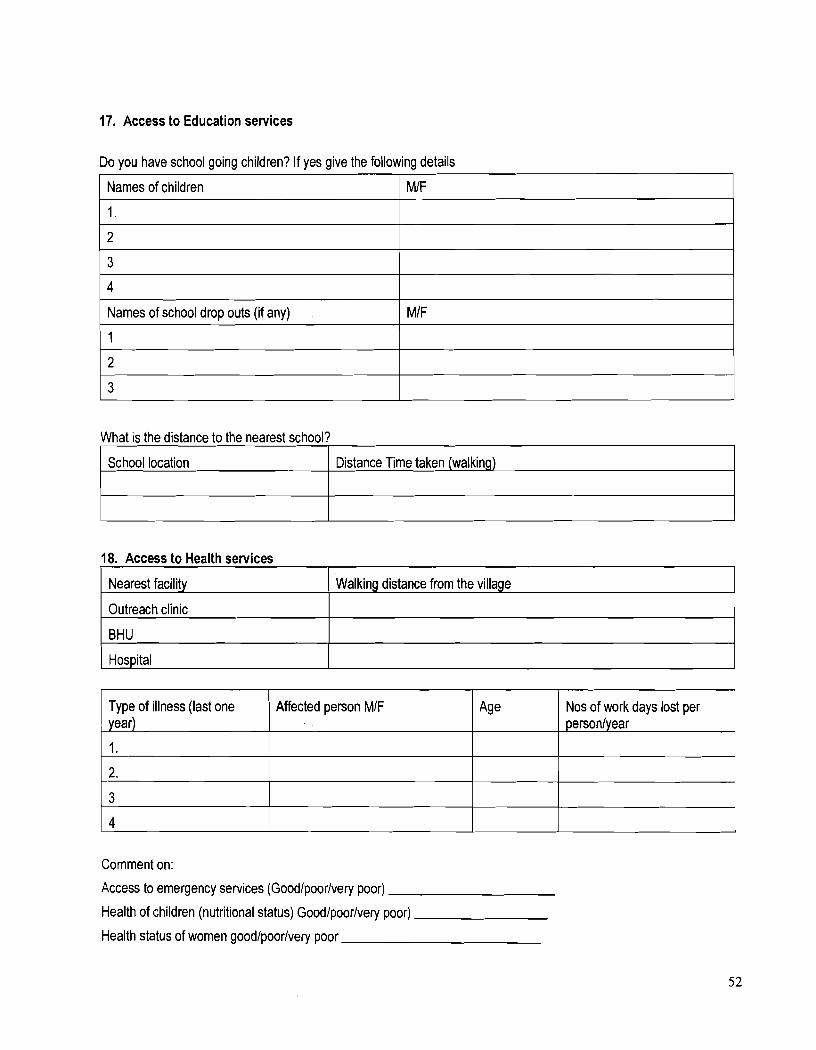
17. Access to Education services
Do you have school going children? If yes give the following details
Names of children
1.
2
3
4
Names of school drop outs (if any)
1
2
3
MIF
MIF
What is the distance to the nearest school?
Hospital
School location
18. Access to Health services
Distance Time taken (walking)
Nearest facility
Outreach clinic
BHU
Comment on:
Access to emergency services (Goodlpoorlvery poor)
Health of children (nutritional status) Goodlpoorlvery poor)
Health status of women goodlpoorlvery poor
Walking distance from the village
Type of illness (last one year)
1.
2.
3
4
Affected person MIF Age Nos of work days lost per personlyear
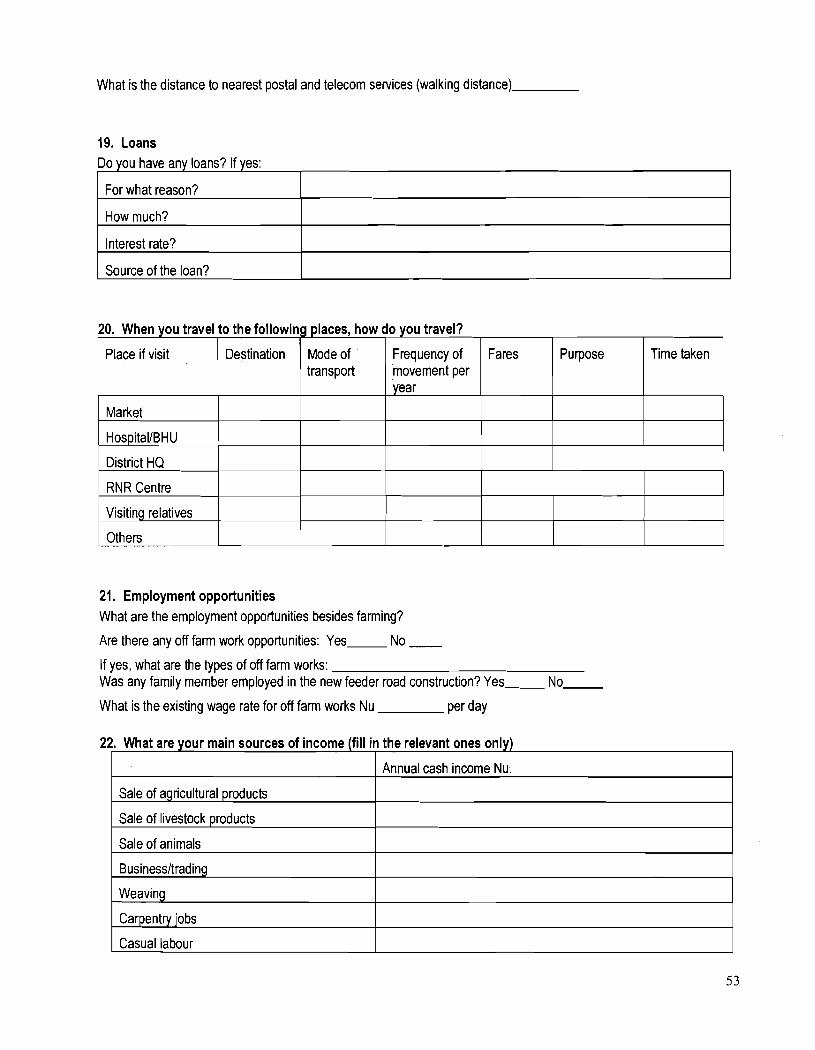
What is the distance to nearest postal and telecom services (walking distance)
19. Loans Do you have any loans? If yes:
For what reason?
How much?
Interest rate?
Source of the loan?
Place if visit
1 Market
Visiting relatives
I Others
o the followir
Destination
laces, how do ou travel?
Mode of Frequency of transport movement per
Fares Purpose Time taken
21. Employment opportunities What are the employment opportunities besides farming?
Are there any off farm work opportunities: Yes No
If yes, what are the types of off farm works: Was any family mernber employed in the new feeder road construction? Yes No
What is the existing wage rate for off farm works Nu per day
I Sale of animals I
22. What are your main sources of income (fill in the relevant ones only)
Businessltrading
Weaving
Carpentry jobs
Casual labour
Sale of agricultural products
Sale of livestock products
Annual cash income Nu.
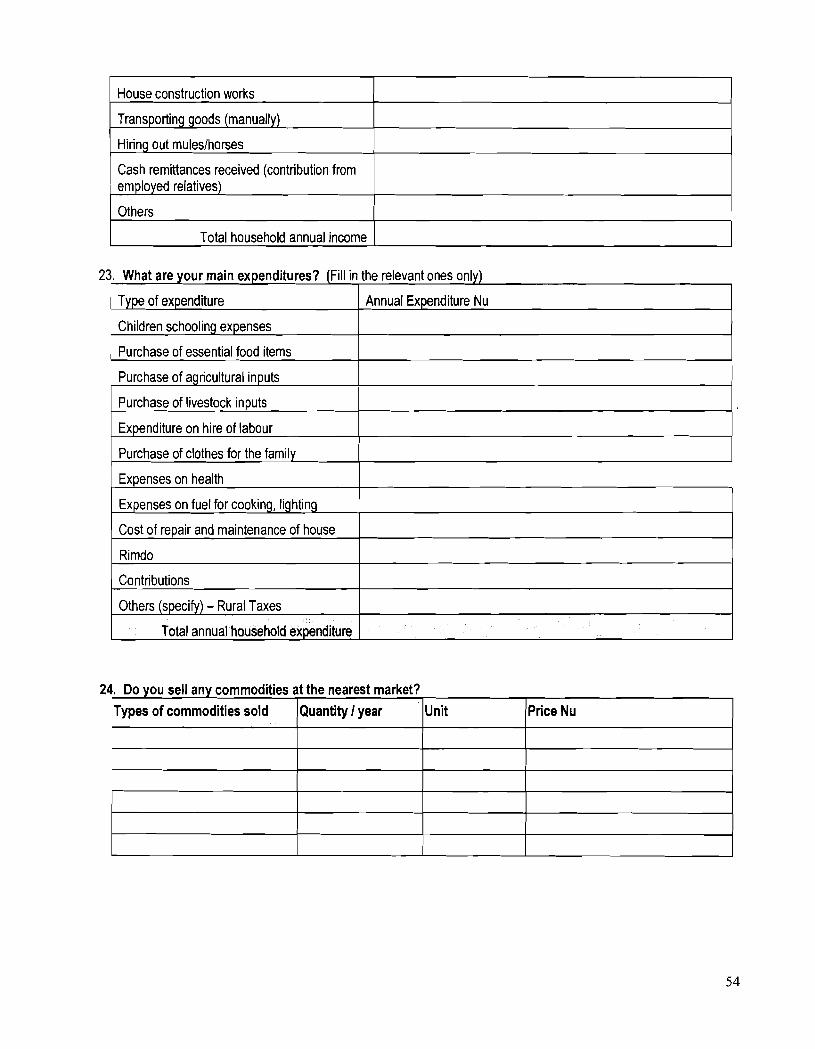
House construction works
Transporting goods (manually)
Hiring out muleslhorses
Cash remittances received (contribution from employed relatives)
Others
Total household annual income
23. What are vour main ex~enditures? (Fill in the relevant ones onlvl
Contributions
' Type of expenditure
Children schooling expenses
Purchase of essential food items
Purchase of agricultural inputs
Purchase of livestock inputs
Expenditure on hire of labour
Others (specify) - Rural Taxes
Total annual household expenditure
Annual Expenditure Nu
Expenses on health
Expenses on fuel for cooking, lighting
Cost of repair and maintenance of house
Rimdo 1
24. Do you sell any commodities at the nearest market?
Types of commodities sold Quantity I year Unit Price Nu
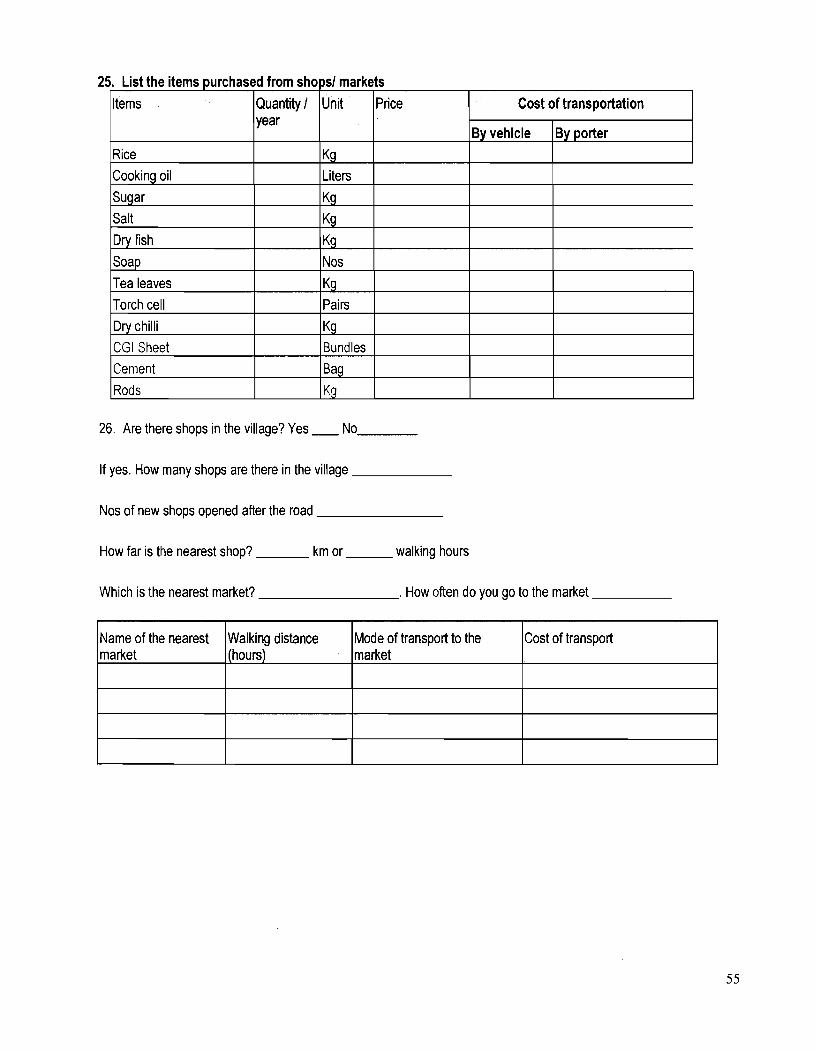
26. Are there shops in the village? Yes - No
If yes. How many shops are there in the village
Nos of new shops opened after the road
How far is the nearest shop? km or walking hours
Which is the nearest market? . How often do you go to the market
25. markets Unit
Kg Liters
Kg
Kg Kg Nos
Kg Pairs
Kg Bundles
Bag
Kg
List the items purchased Items
Rice Cooking oil Sugar Salt
Dry lish
Soap Tea leaves Torch cell Dry chilli CGI Sheet Cement
Rods
Name of the nearest market
from s h o ~ s l Quantity / year
Price
Mode of transport to the market
Walking distance (hours)
Cost of transport
Cost of transportation
By vehicle By porter
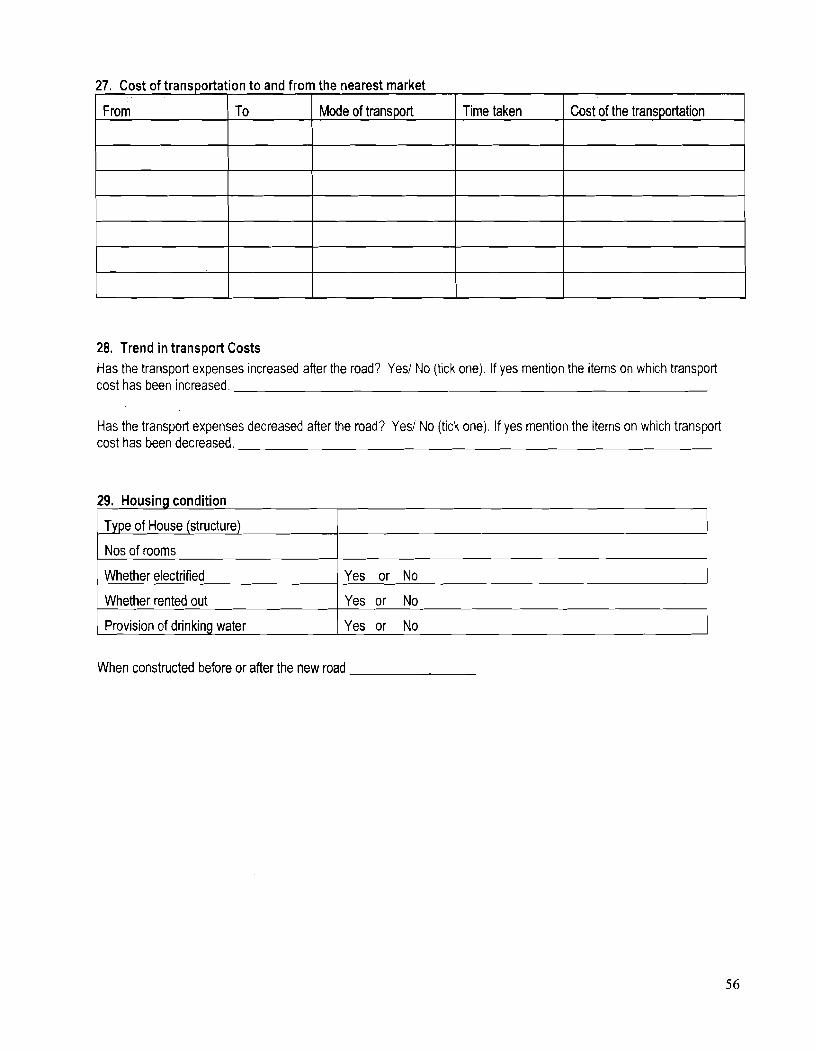
28. Trend in transport Costs Has the transport expenses increased after the road? Yes/ No (tick one). If yes mention the items on which transport cost has been increased.
27. Cost of transportation to and from the nearest market
Has the transport expenses decreased after the road? Yes1 No (tick one). If yes mention the items on which transport cost has been decreased.
29. Housing condition
Type of House (structure)
From Time taken
When constructed before or after the new road
To Cost of the transportation
Nos of rooms
Whether electrified
Whether rented out
Provision of drinkina water
Mode of transport
Yes or No
Yes or No
Yes or No
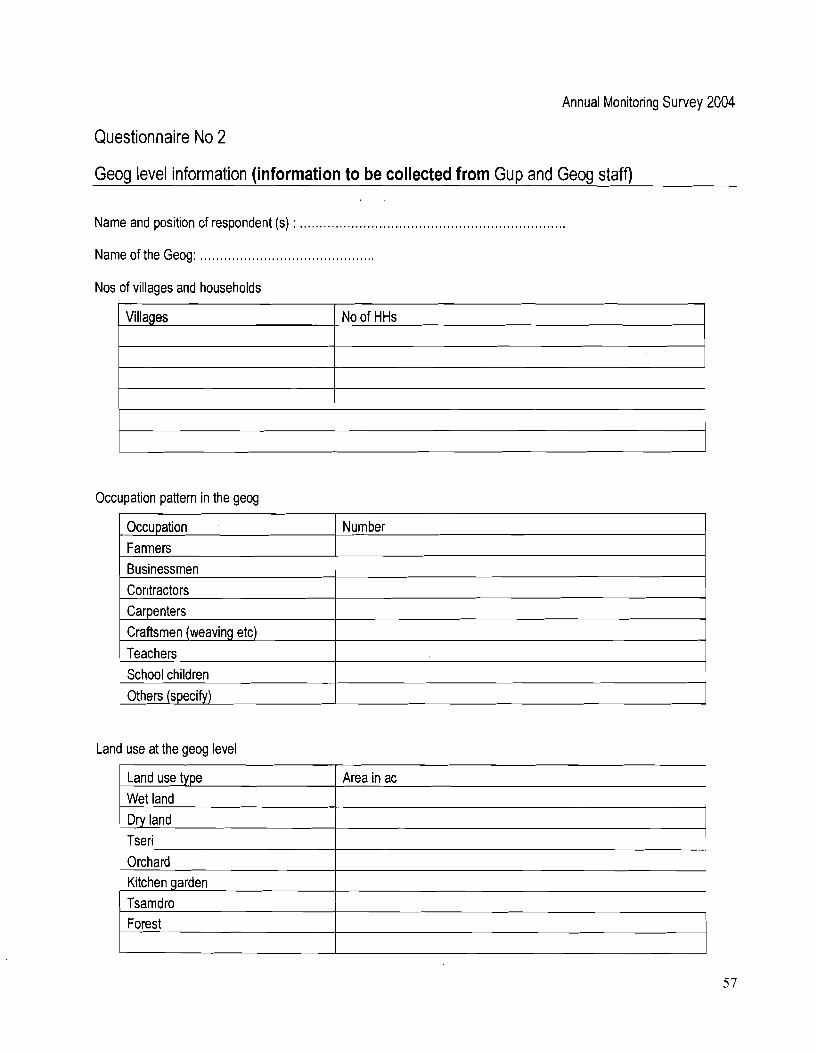
Annual Monitoring Survey 2004
Questionnaire No 2
Geog level informa,l:ion (information to be collected from Gup and Geog staff)
................................................................ Name and position of respondent (s) :
Name of the Geog: ............................................
Nos of villages and households
Occupation pattern in the geog
Villages No of HHs
Land use at the geog level
Occupation Farmers Businessmen
Cor~tractors Carpenters Craftsmen (weaving etc) Teachers School children
Others (specify)
Number
Tseri
Land use type Wet land Drv land
Area in ac
Orchard Kitchen garden Tsamdro Forest
-
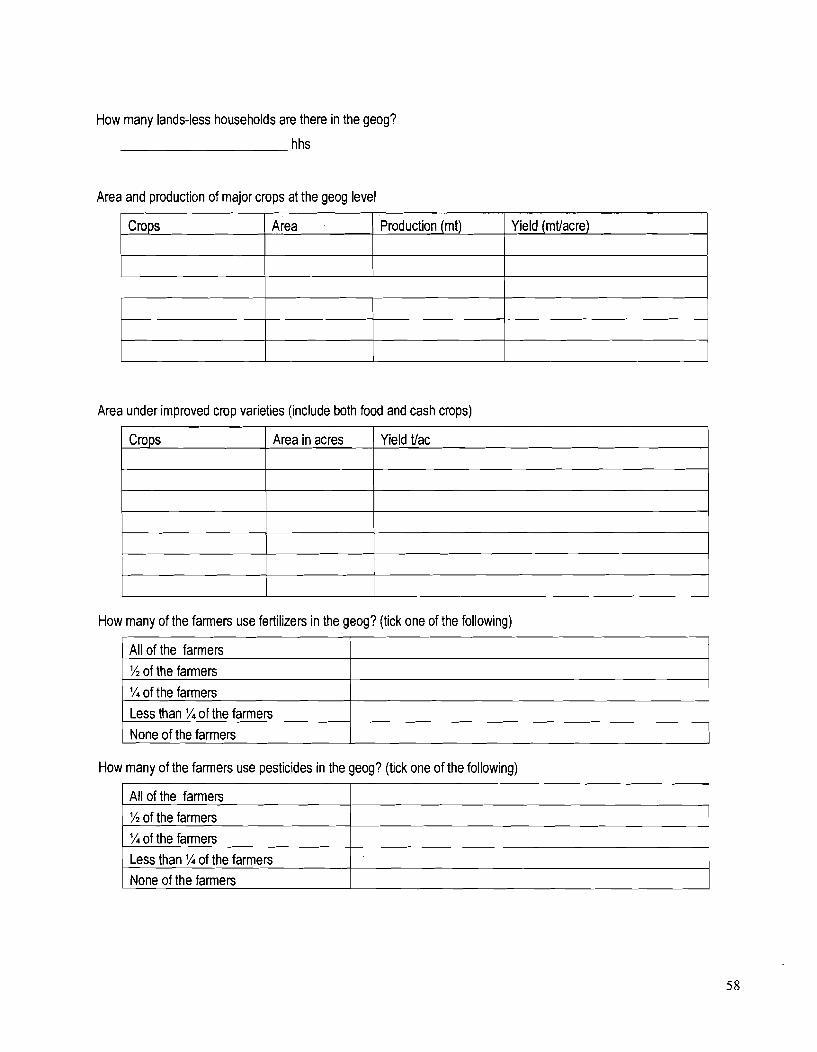
How many lands-less households are there in the geog?
hhs
Area and production of major crops at the geog level
Area under improved crop varieties (include both food and cash crops)
Crops
How many of the farmers use fertilizers in the geog? (tick one of the following)
All of the farmers
Production (mt) Area
---
?h of the farmers
?h of the farmers Less than 1/4 of the farmers
I None of the farmers
Yield (mffacre)
Yield ffac Crops
How many of the farmers use pesticides in the geog? (tick one of the following)
Area in acres
I All of the farmers I 1 ' ?h of the farmers 1/4 of the farmers Less than 1/4 of the farmers None of the farmers
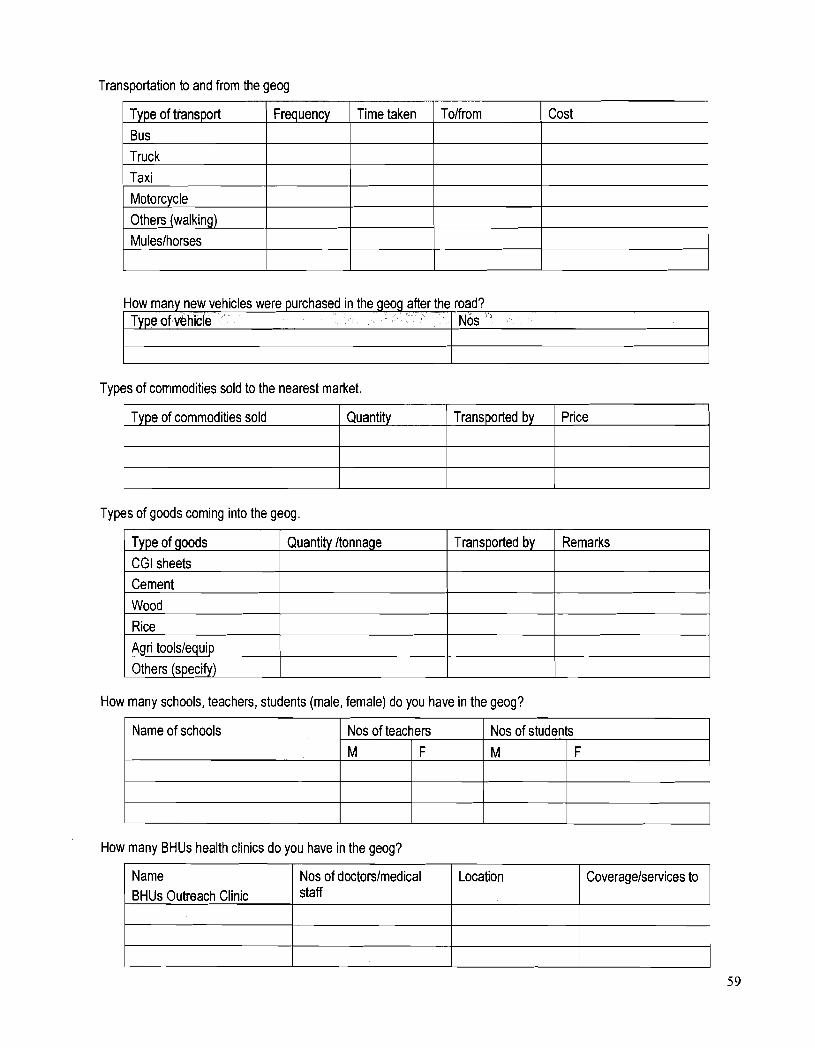
Transportation to and from the geog
Types of corr~modities sold to the nearest market.
Type of transport Bus Truck Taxi Motorcycle Others (walking) Muleslhorses
Types of goods coming into the geog.
Tolfrom Frequency Cost
Type of commodities sold
How many schools, teachers, students (male, female) do you have in the geog?
Time taken
Quantity Transported by
Type of goods CGI sheets Cement Wood Rice Agri toolslequip Others (specify)
Price
How many BHUs health clinics do you have in the geog?
Quantity ltonnage
Name of schools
Transported by
Name BHUs Outreach Clinic
Remarks
Nos of teachers Nos of students M
59
Nos of doctorslmedical staff
M F F
Location Coveragelservices to
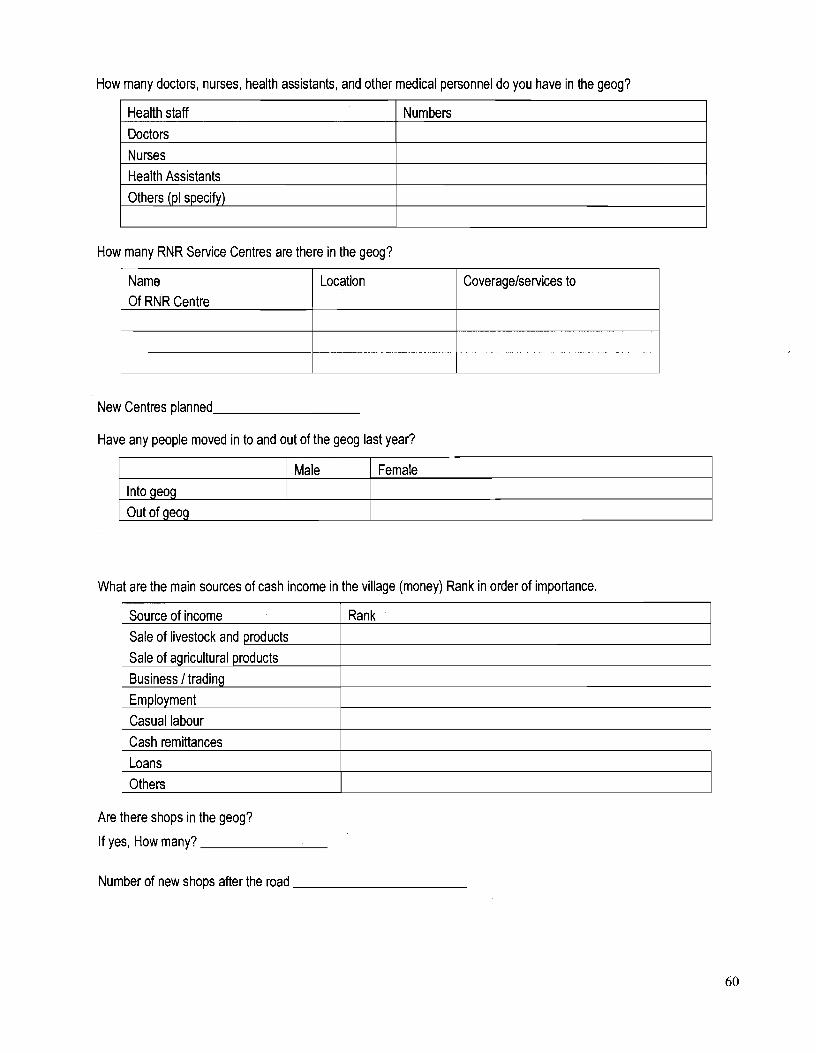
How many doctors, nurses, health assistants, and other medical personnel do you have in the geog?
How many RNR Service Centres are there in the geog?
Health staff Doctors Nurses Health Assistants Others (pl specify)
Nurr~bers
New Centres planned
Have any people moved in to and out of the geog last year?
Name Of RNR Centre
What are the niain sources of cash income in the village (money) Rank in order of importance.
Location
Into geog Out of geog
Coverage/services to
Are there shops in the geog?
If yes, How many?
Male
Source of income Sale of livestock and products Sale of agricultural products Business /trading Employment Casual labour Cash remittances Loans Others
Number of new shops after the road
Female
Rank
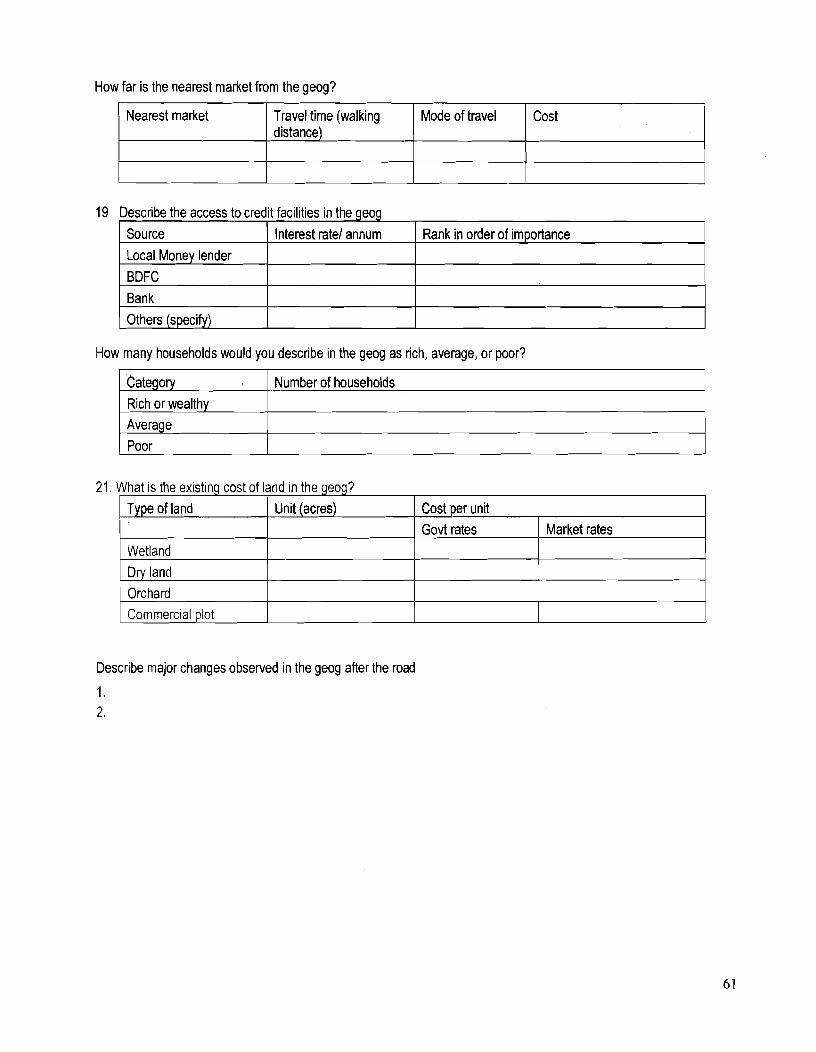
How far is the nearest market from the geog?
Nearest market
1 BDFC
19 Describe the access to credit facilities in the geog
Bank
Others (specify)
Travel time (walking distance)
How many households would you describe in the geog as rich, average, or poor?
Rank in order of importance Source Local Monev lender
Mode of travel
Interest ratel annum
Cost
Category Rich or wealthy Average Poor
I Orchard Commercial lot
Number of households
21. What is the existing cost of land in the geog?
Describe major changes observed in the geog after the road
1. 2.
Type of land
Wetland
Unit (acres) Cost per unit Govt rates Market rates
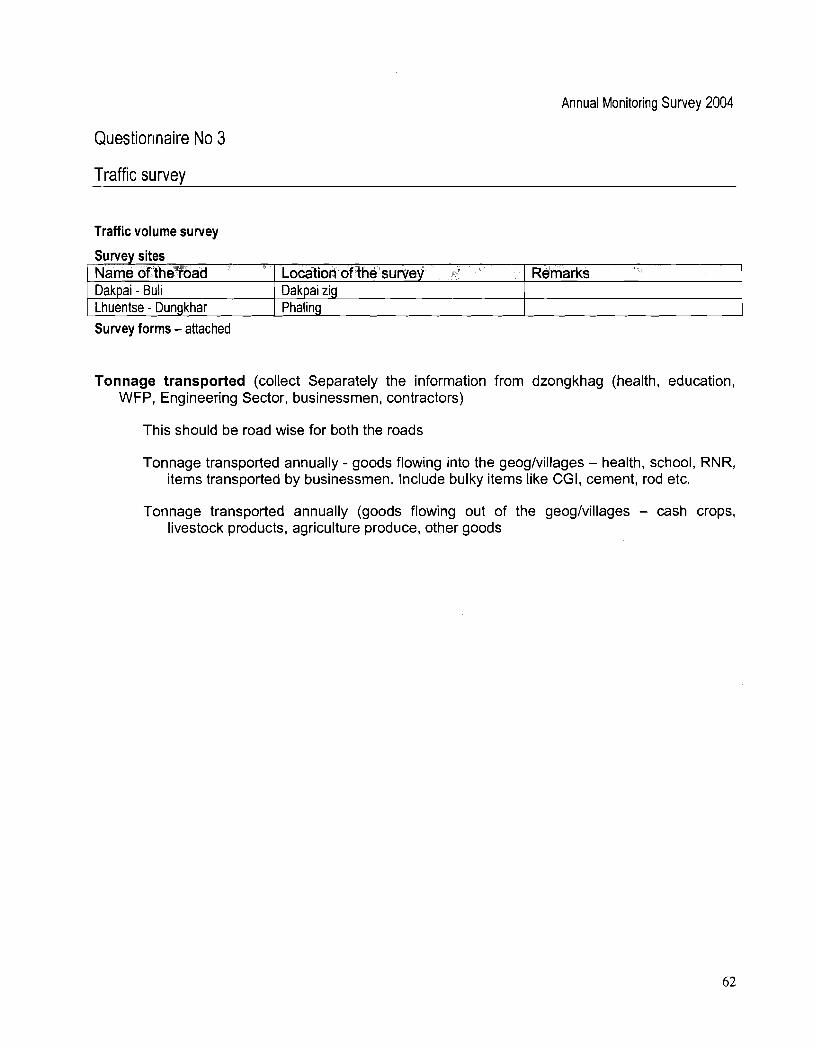
Annual Monitoring Survey 2004
Questior~naire No 3
Traffic survey
Survey forms - attached
Traffic volume survey
Survey sites
Tonnage transported (collect Separately the information from dzongkhag (health, education, WFP, Engineering Sector, businessmen, contractors)
Name of the road Dakpai - Buli Lhuentse - Dungkhar
This should be road wise for both the roads
Tonnage transported annually - goods flowing into the geoglvillages - health, school, RNR, items transported by businessmen. Include bulky items like CGI, cement, rod etc.
Location of the survey Dakpai zig Phaling
Tonnage transported annually (goods flowing out of the geoglvillages - cash crops, livestock products, agriculture produce, other goods
Remarks
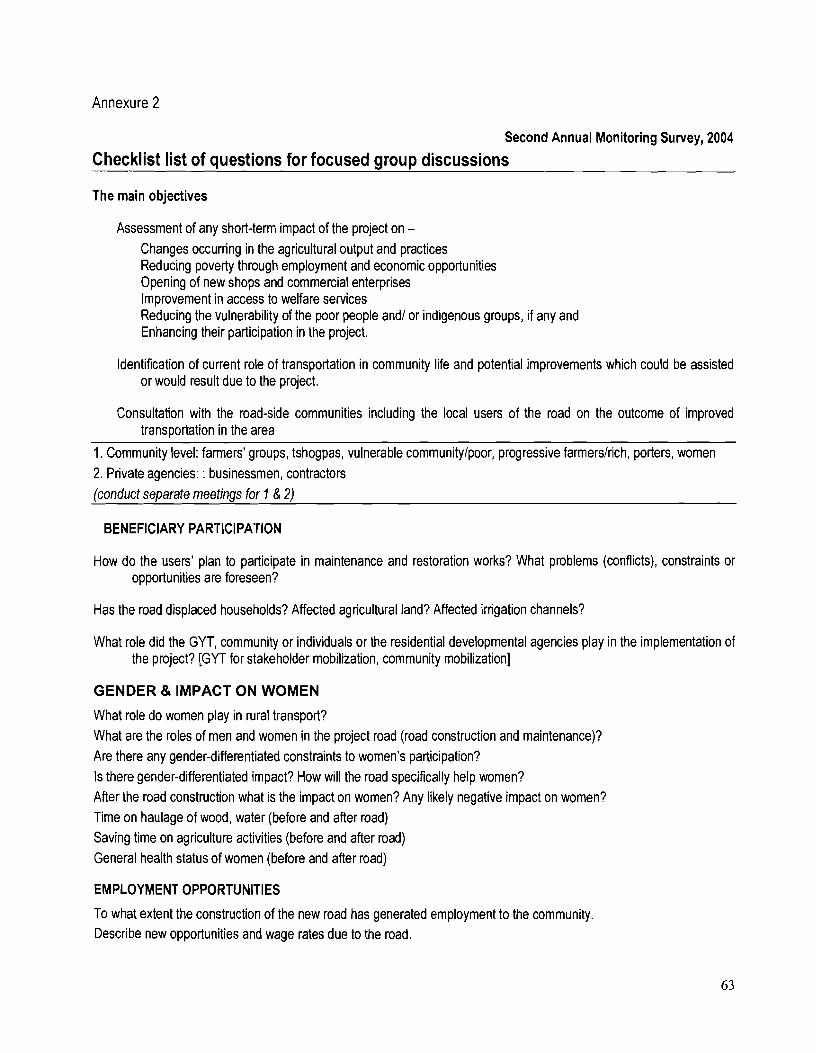
Annexure 2
Second Annual Monitoring Survey, 2004
Checklist list of questions for focused group discussions
The main objectives
Assessment of any short-term impact of the project on - Changes occurring in the agricultural output and practices Reducing poverty through employment and economic opportunities Opening of new shops and commercial enterprises Improvement in access to welfare services Reducing the vulnerability of the poor people and1 or indigenous groups, if any and Enhancing their participation in the project.
Identification of current role of transportation in community life and potential improvements which could be assisted or would result due to the project.
Consultation with the road-side communities including the local users of the road on the outcome of improved transportation in the area
1. Community level: farmers' groups, tshogpas, vulnerable communitylpoor, progressive farmerslrich, porters, women 2. Private agencies: : businessmen, contractors (conduct separate meetings for 7 & 2)
BENEFICIARY PARTICIPATION
How do the users' plan to participate in maintenance and restoration works? What problems (conflicts), constraints or opportunities are foreseen?
Has the road displaced households? Affected agricultural land? Affected irrigation channels?
What role did the GYT, community or individuals or the residential developmental agencies play in the implementation of the project? [GYT for stakeholder mobilization, community mobilization]
G E N D E R & I M P A C T O N W O M E N
What role do women play in rural transport? What are the roles of men and women in the project road (road construction and maintenance)? Are there any gender-differentiated constraints to women's participation? Is there gender-differentiated impact? How will the road specifically help women? After the road construction what is the impact on women? Any likely negative impact on women? Time on haulage of wood, water (before and after road) Saving time on agriculture activities (before and after road) General health status of women (before and after road)
EMPLOYMENT OPPORTUNITIES
To what extent the construction of the new road has generated employment to the community. Describe new opportunities and wage rates due to the road.
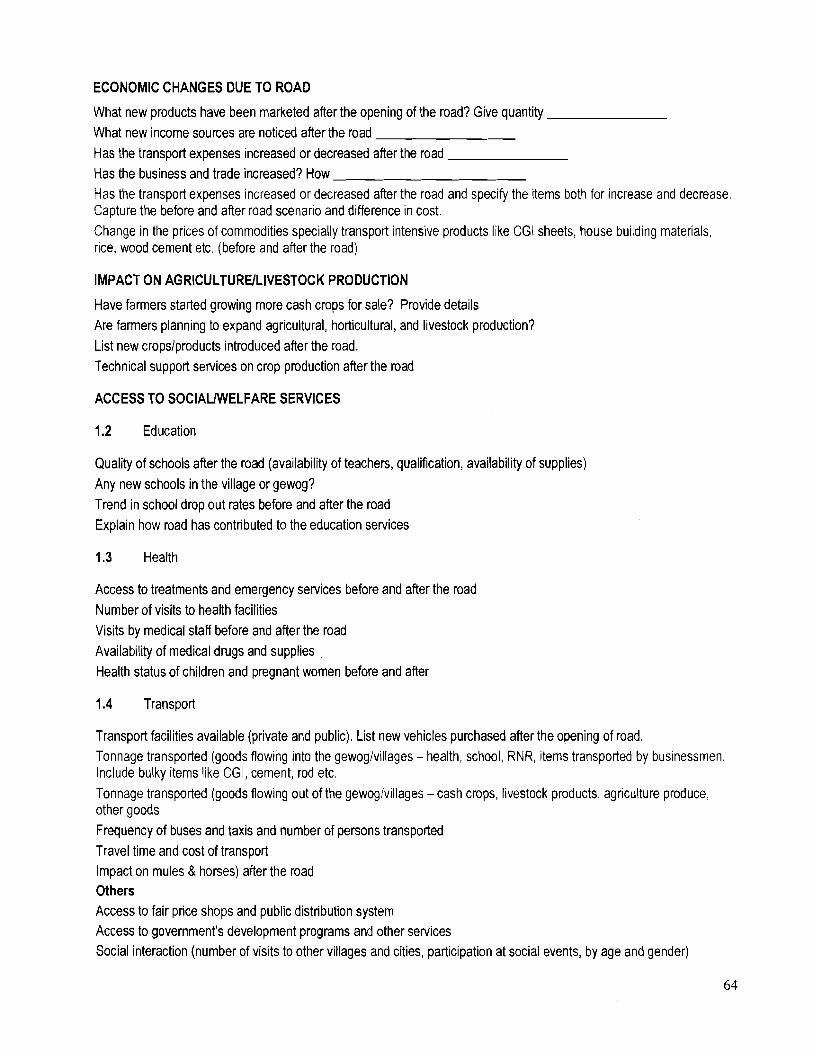
ECONOMIC CHANGES DUE TO ROAD
What new products have been marketed after the opening of the road? Give quantity What new income sources are noticed after the road Has the transport expenses increased or decreased after the road Has the business and trade increased? How Has the transport expenses increased or decreased after the road and specify the items both for increase and decrease. Capture the before and after road scenario and difference in cost. Change in the prices of commodities specially transport intensive products like CGI sheets, house building materials, rice, wood cement etc. (before and after the road)
IMPACT ON AGRlCULTllRElLlVESTOCK PRODUCTION
Have farmers started growing more cash crops for sale? Provide details Are farmers planning to expand agricultural, horticultural, and livestock production? List new cropslproducts introduced after the road. Technical support services on crop production after the road
ACCESS TO SOCIAWELFARE SERVICES
1.2 Education
Quality of schools after the road (availability of teachers, qualification, availability of supplies) Any new schools in the village or gewog? Trend in school drop out rates before and after the road Explain how road has contributed to the education services
1.3 Health
Access to treatments and emergency services before and after the road Number of visits to health facilities Visits by medical staff before and after the road Availability of medical drugs and supplies Health status of children and pregnant women before and after
1.4 Transport
Transport facilities available (private and public). List new vehicles purchased after the opening of road. Tonnage transported (goods flowing into the gewog/villages - health, school, RNR, items transported by businessmen. Include bulky items like CGI, cement, rod etc. Tonnage transported (goods flowing out of the gewoglvillages -cash crops, livestock products, agriculture produce, other goods Frequency of buses and taxis and number of persons transported Travel time and cost of transport Impact on mules & horses) after the road Others Access to fair price shops and public distribution system Access to government's development programs and other services Social interaction (number of visits to other villages and cities, participation at social events, by age and gender)
Changes in the housirlg conditions (before and after the road) Changes in the availability of infrastructure - drinking water, health, school, electrification - street lights Changes in the area under common properties -village wood lots, grazing land - impact on livestock
ADVERSE SOCIAL IMPACTS
Loss of landlhouse due to road Impact on irrigation channels due to road construction Conflict with outsiders (before and after road) Road accidents Introduction of new diseases Loss of income to non-motorised transporters (porters) Impact on biodiversity (use of forest products - before and after the road)
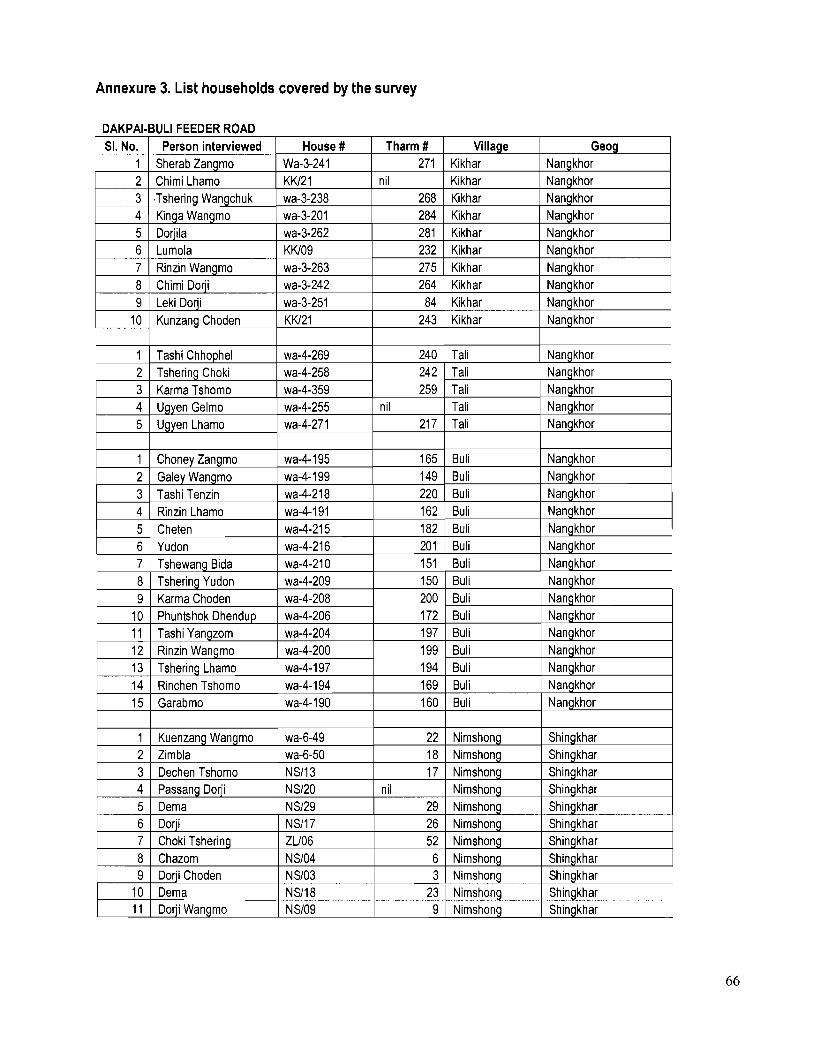
Annexwe 3. List households covered by the survey
DAKPAI-BULI FEEDER ROAD
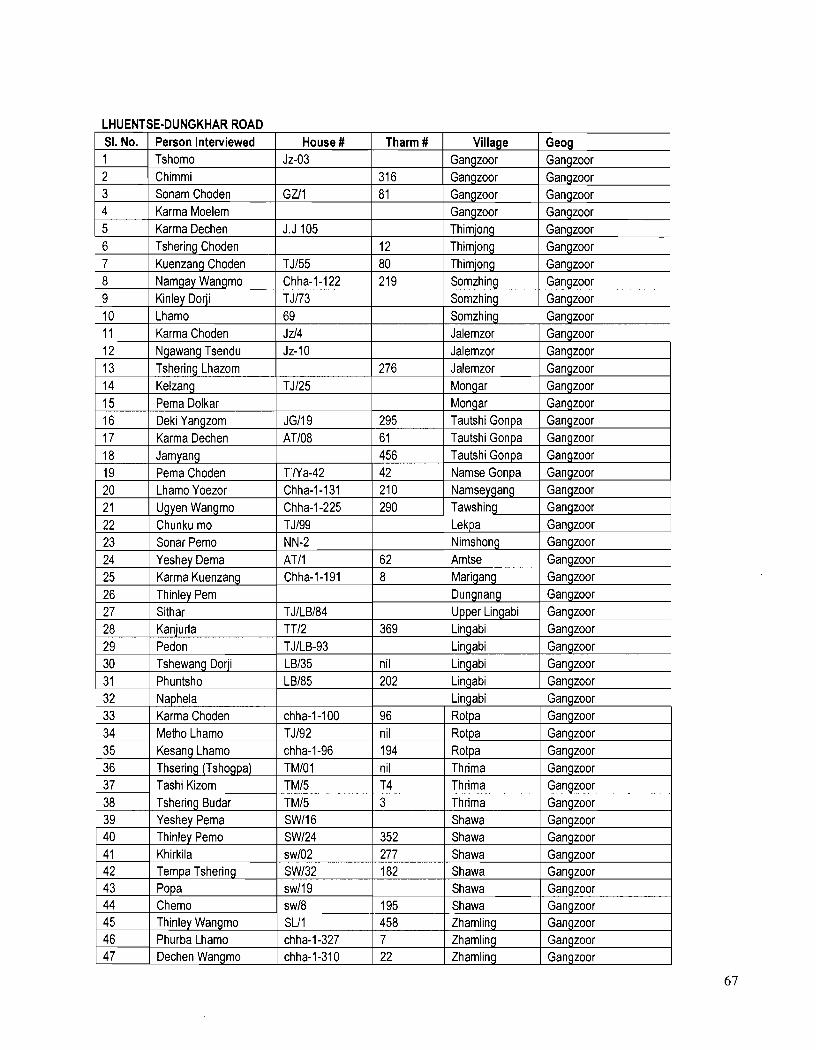
LHUENTSE-DUNGKHARROAD SI. No. 1 2 3 4 5 6 7 8
Person Interviewed Tshomo Chimmi Sonam Choden
9 10 11
Karma Moelem Karma Dechen Tshering Choden Kuenzang Choden Namgay Wangmo
12 13 14 15 16
House # Jz-03
GZl l
Kinley Dorji Lhamo Karma Choden
17 18 19
47 I Dechen Wangmo I chha-1-310 1 22 I Zhamling I Gangzoor
J.J 105
TJ155 Chha-1-122
Ngawang Tsendu Tshering Lhazom Kelzang Pema Dolkar Deki Yangzom
38 39
Tharm #
31 6 8 1
TJ173 69 Jz/4
Karma Dechen Jamyang Pema Choden
12 80 21 9
Jz-1 0
TJl25
JGll9
Tshering Budar Yeshey Pema
Village Gangzoor Gangzoor Gangzoor
Somzhing Somzhing Jalemzor
AT108
TjNa-42
Geog Gangzoor Gangzoor Gangzoor
Gangzoor 'rhimjong Thimjong Thimjong Somzhing
Gangzoor Gangzoor Ganazoor
276
295
TM15 SWll6
Gangzoor Gangzoor Gangzoor Gangzoor Gangzoor
6 1 456 42
Jalemzor Jalemzor Mongar Mongar Tautshi Gonpa
3
Gangzoor Gangzoor Gangzoor Gangzoor Gangzoor
Tautshi Gonpa Tautshi Gonpa Namse Gonpa
Gangzoor Gangzoor Gangzoor
Thrima Shawa
Gangzoor Gangzoor
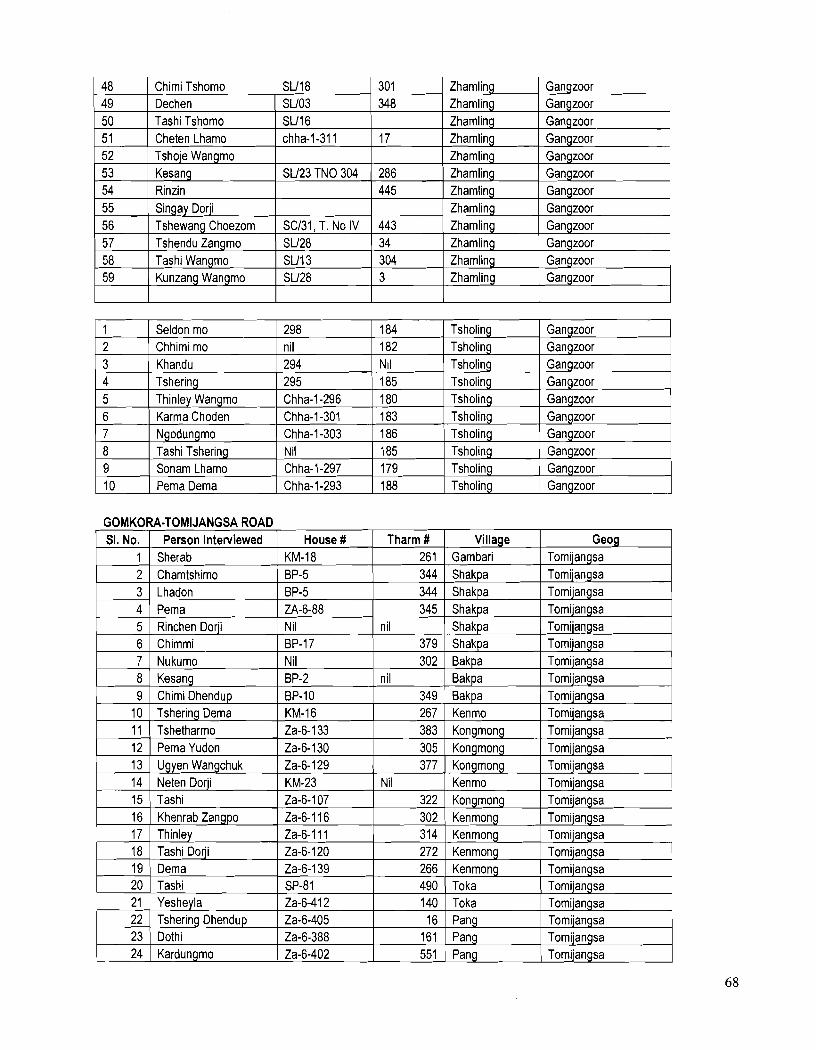
GOMKORA-TOMIJANGSA ROAD
56 57 58 59
Tshewang Choezom Tshendu Zangmo Tashi Wangmo Kunzang Wangmo
SI. No. 1 2
5 Rinchen Dorji
3 4
SC131, T. No IV SU28 SU13 SU28
Person Interviewed Sherab Chamtshimo Lhadon Pema
7 8
443 34 304 3
House # KM-18 BP-5
16 Khenrab Zangpo Za-6-116 302 Kenmong Tomijangsa
BP-5 ZA-6-88
Nukumo Kesang
18 19 20 21 22 23 24
Zhamling Zhamling Zhamling Zhamling
Tharm # 261 344
Gangzoor Gangzoor Gangzoor Gangzoor
344 345
Nil BP-2
TashiDorji Dema Tashi Yesheyla Tshering Dhendup Dothi Kardungmo
Village Gambari Shakpa
Geog Tomijangsa Tomijangsa
Shakpa Shakpa
302 nil
Za-6-120 Za-6-139 SP-81 Za-6-412 Za-6-405 Za-6-388 Za-6-402
Tomijangsa Tomijangsa
Bakpa Bakpa
272 266 490 140 16
161 551
Tomijangsa Tomijangsa
Kenmong Kenmong Toka Toka Pang Pang Pang
Tomijangsa Tomijangsa Tomijangsa Tomijangsa Tomijangsa Tomijangsa Tomijangsa
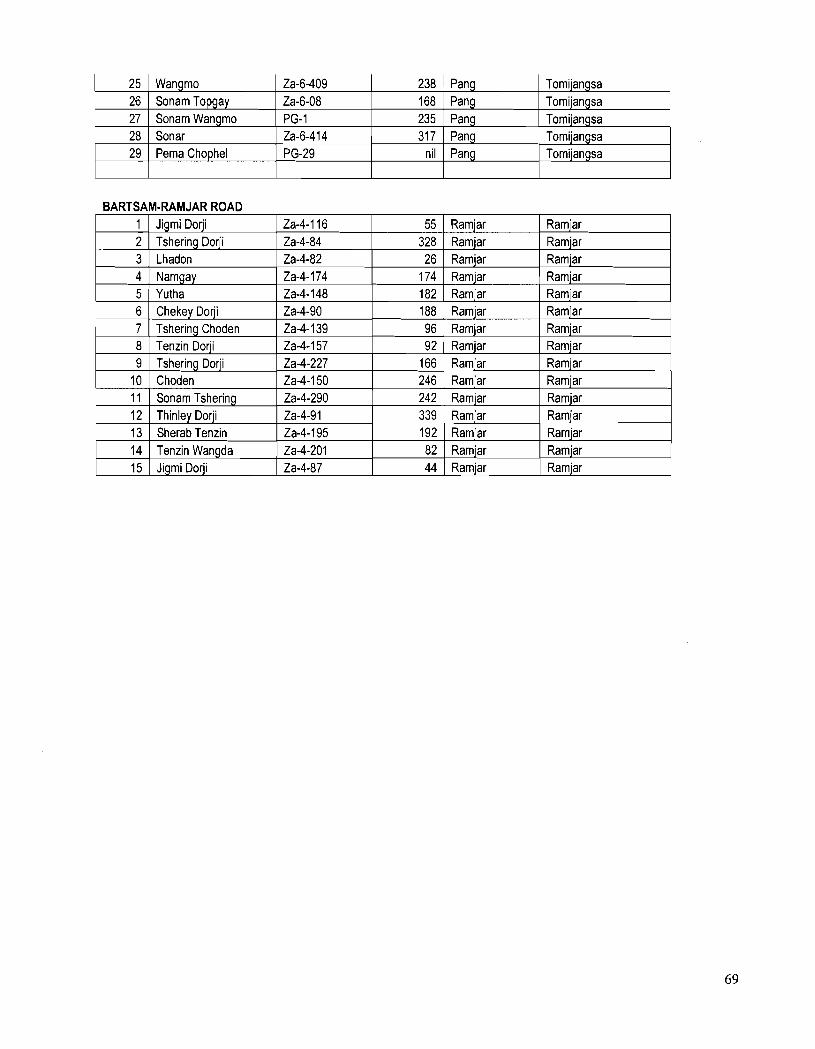
BARTSAM-RAMJAR ROAD 1 I Jigmi Dorji I Za-4-116 55 1 Ramjar I Ramjar 2 3 4 5 6 7 8 9
10 11 12 13 14 15
Tshering Dorji Lhadon Namgay Yutha Chekey Dorji Tshering Choden Tenzin Dorji Tshering Dorji Choden Sonam Tshering Thinley Dorji Sherab Tenzin Tenzin Wangda Jigmi Dorji
Za-4-84 Za-4-82 Za-4-174 Za-4-148 Za-4-90 Za-4-139 Za-4-157 Za-4-227 Za-4-150 Za-4-290 Za-4-91 Za-4-195 Za-4-201 Za-4-87
328 26
174 182 188 96 92
166 246 242 339 192 82 44
Ramjar Ramjar Ramjar Ramjar Ramjar Ramjar Ramjar Ramjar
Ramjar Ramjar Ramjar Ramjar Ramjar Ramjar Ramjar Ramjar
Ramjar Ramjar Ramjar Ramjar Ramjar Ramjar
Ramjar Ramjar Ramjar Ramjar Ramjar Ramjar