Embed Size (px)
Citation preview
INDIAN RAILWAYSBANKRUPTCY TO BILLIONS
IN RAILWAYS
Presentation forJoint workshop by Planning Commission, Indian
Railways and The World Bank 25th March, 2009

“Indian Railways is today on the verge of
a financial crisis. To put it bluntly, the Business As Usual Low Growth will rapidly drive IR to fatal bankruptcy, and in sixteen years the Govt. of India will be
saddled with an additional financial liability of over Rs. 61,000 crores (12.20 billion US $). On a pure operating level,
IR is in a terminal debt trap.”
Expert Group on IR headed by Dr. Rakesh Mohan (July 2001)
IN FINANCIAL CRISIS
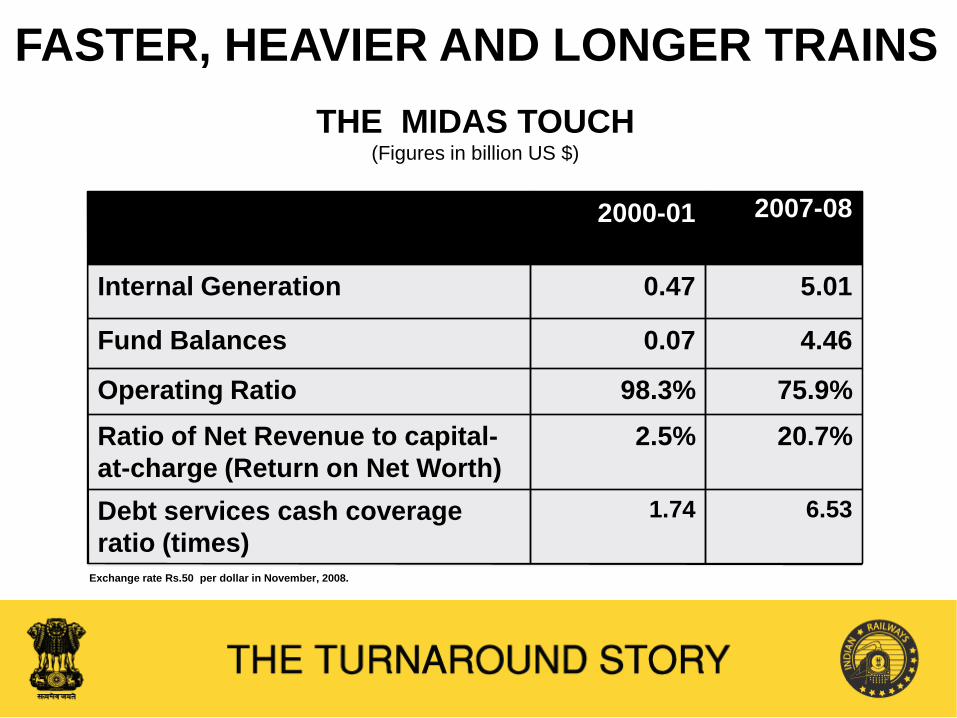
2000-01 2007-08
Internal Generation 0.47 5.01
Fund Balances 0.07 4.46
Operating Ratio 98.3% 75.9%Ratio of Net Revenue to capital-at-charge (Return on Net Worth)
2.5% 20.7%
Debt services cash coverage ratio (times)
1.74 6.53
Exchange rate Rs.50 per dollar in November, 2008.
FASTER, HEAVIER AND LONGER TRAINSTHE MIDAS TOUCH
(Figures in billion US $)
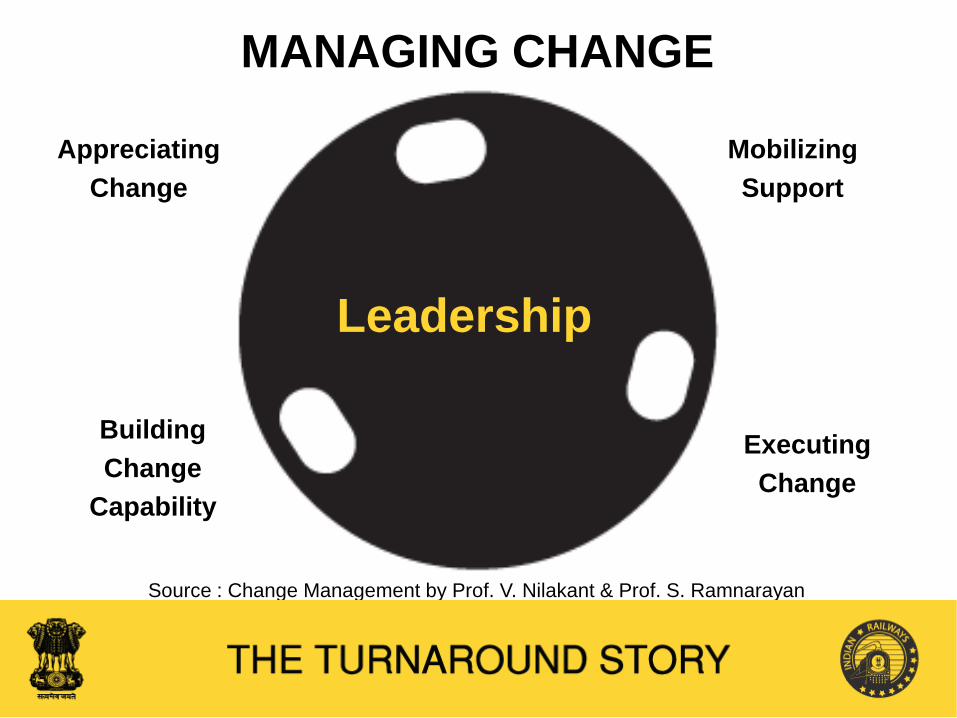
Leadership
AppreciatingChange
MobilizingSupport
BuildingChange
Capability
ExecutingChange
MANAGING CHANGE
Source : Change Management by Prof. V. Nilakant & Prof. S. Ramnarayan

LEADERSHIP FOR CHANGE
‘Can-Do’Attitude
Integrity Humility
Visionary Passionate

Do Reality Check
SCANNING BUSINESS ENVIRONMENT
Revenuestreams Cost centres
Socio-political context Organization

ReflectionAnd
Learning
Cross functionalcoordination
GuidingCoalition
Inclusiveinnovation
ResourceLeveraging
EXECUTION

INCLUSIVE INNOVATION
Garib Rath
Low Cost Scalability
Resource efficient Aspirational
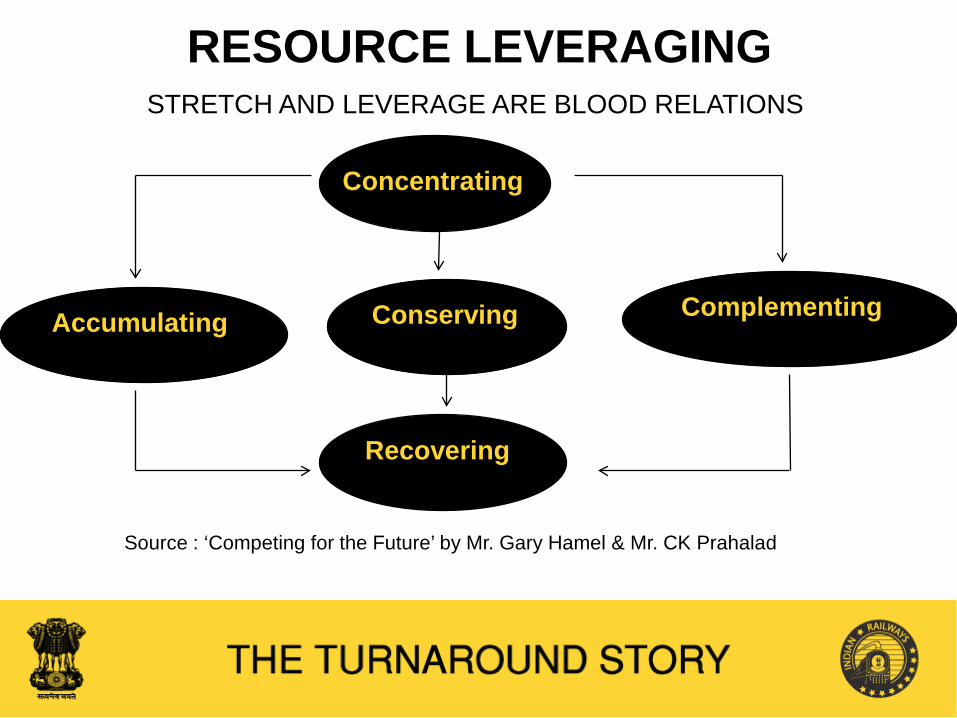
STRETCH AND LEVERAGE ARE BLOOD RELATIONS
RESOURCE LEVERAGING
Source : ‘Competing for the Future’ by Mr. Gary Hamel & Mr. CK Prahalad
Concentrating
Recovering
Accumulating ComplementingConserving

COMMUNICATION
Peformance
Ownership and involvement
Safeguard organizational
identity
Create and celebrate success
Transparency

RAILWAY REFORMS WITH A HUMAN FACE
1.15 Billion US $20%
4.59 Billion US $80%
Annual Plan(2007-08)
# It includes allocation for new lines & metropolitan transport projects but does not include gauge conversion works as it has become an operational necessity.
# Allocation for Schemes Sanctioned on Socio Economic Considerations
others
Traffic Earnings(2007-08)
3.16 Billion US $22%
11.19 Billion US $78%
* Social conscience consists of passenger earnings other than earnings from AC classes.
* Social Conscience
Market Driven

Class Earnings per Coach KM Fare IndexSub-urban $ 0.44 100General(Ordinary) $ 0.44 100General(Mail/Express) $ 0.40 182Sleeper $ 0.32 2913AC $ 0.80 8192AC $ 0.74 13101AC $ 0.74 2550
16 Coach 24 Coach % Increase
Cost/TKM - $7.17 $10.23 50
Earn/TKM - $4.89 $13.23 171
Cost/TKM(Goods) - $13.89
Cost/Coach Km(Passenger) – $0.76
Cost/Wagon Km(Goods) - $0.36
Cost/PKM - 0.78 US Cent
Cost/NTKM - 1.08 US Cent
Cost & Earnings per Train Kilometer at same distance (1385 km) for different rake composition
200
250
300
350
400
450
500
550
600
650
700
16Coaches 16+1Coaches 16+2Coaches 16+3Coaches 16+4Coaches 16+5Coaches 16+6Coaches 16+7Coaches 16+8Coaches
Cost/TKM Earnings/TKM
Un
it in
Ru
pe
es

Seating CapacityStandard AC Train Garib Rath
3AC : 64 75
Chair Car : 70 102
Total No. of passengersStandard AC Train Garib Rath
17 - coach : 816 123324 - coach : 1302 1920
COST COMPARISON BETWEEN GARIB RATH AND A STANDARD AC TRAIN

REDUCTION IN PASSENGER LOSSESPassenger losses are being reduced by Increasing length, seating capacity and occupancy
Optimizing layout of coaches
Standard composition of trains
Reducing losses on catering and parcel services
Increasing non-passenger fare income
LOSSES ON COACHING SERVICES – 1.31 Billion US $(Figures in Billion US $)
Passenger (Mail & Express trains) 0.39 30%Passenger (Ordinary trains) 0.45 34%Suburban services 0.16 12%Parcel, Luggage and Catering services 0.31 24%

Index of Operating expenses at constant prices and GTKMs (1982-83 to 2007-08)
IR IS A PLAY ON VOLUMESHOW LONG IS LONG-TERM
1982-8380
100
120
140
160
180
200
220
240
260
280
300
Inde
x
Operating Exp.
GTKMs
80
100
120
140
160
180
200
220
240
260
280
300
Inde
x
Operating Exp.
GTKMs
GTKMs - Gross Tonne Kilometers
1982-831982-
832007-
08412 1174
GTKM (Billion)
Operating expenses at current prices (Billion US $)
Operating expenses at constant prices (Billion US $)
0.78 11.08
0.69 0.67
2007-08
Break-up of Optg. Exp.
22%17%
14%47%
Stores & Others
Lease charges & Depreciation Reserve Fund
Energy
Salary & Pension
Long Term Variable Cost may be taken as 78.5% – Finance Code, para 217
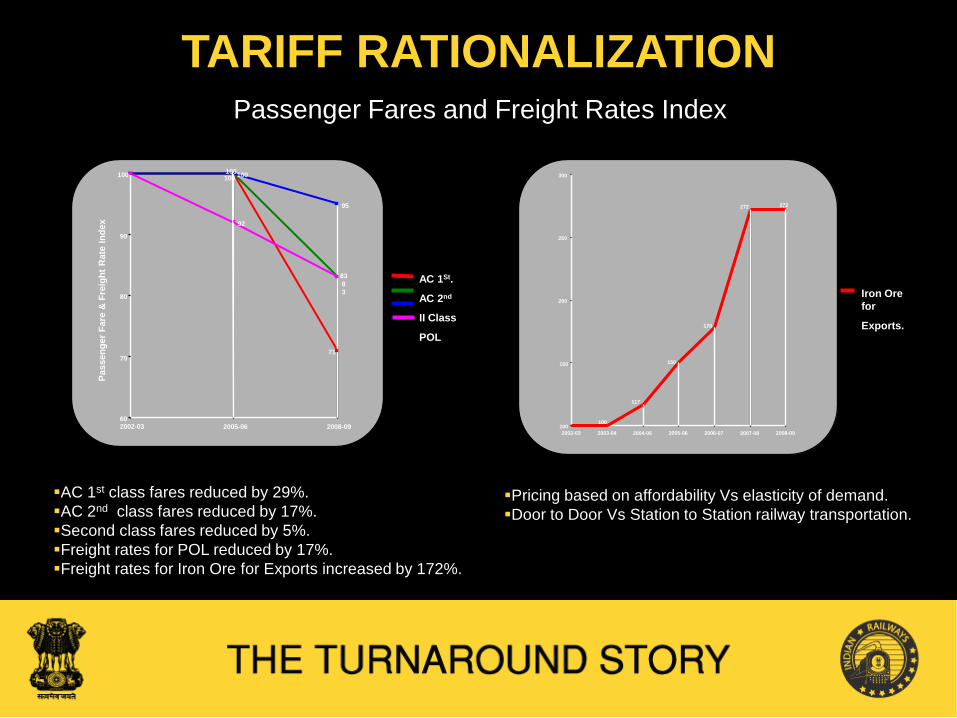
Passenger Fares and Freight Rates Index
Pricing based on affordability Vs elasticity of demand.Door to Door Vs Station to Station railway transportation.
Iron Ore for
Exports.
100
117
150
178
272 272
100
150
200
250
300
2002-03 2003-04 2004-05 2005-06 2006-07 2007-08 2008-09
AC 1st class fares reduced by 29%.AC 2nd class fares reduced by 17%.Second class fares reduced by 5%.Freight rates for POL reduced by 17%.Freight rates for Iron Ore for Exports increased by 172%.
AC 1St.
AC 2nd
II Class
POL
Pass
enge
r Far
e &
Fre
ight
Rat
e In
dex
83
71
100 100
83
95
100
92
60
70
80
90
100
2002-03 2005-06 2008-09
TARIFF RATIONALIZATION
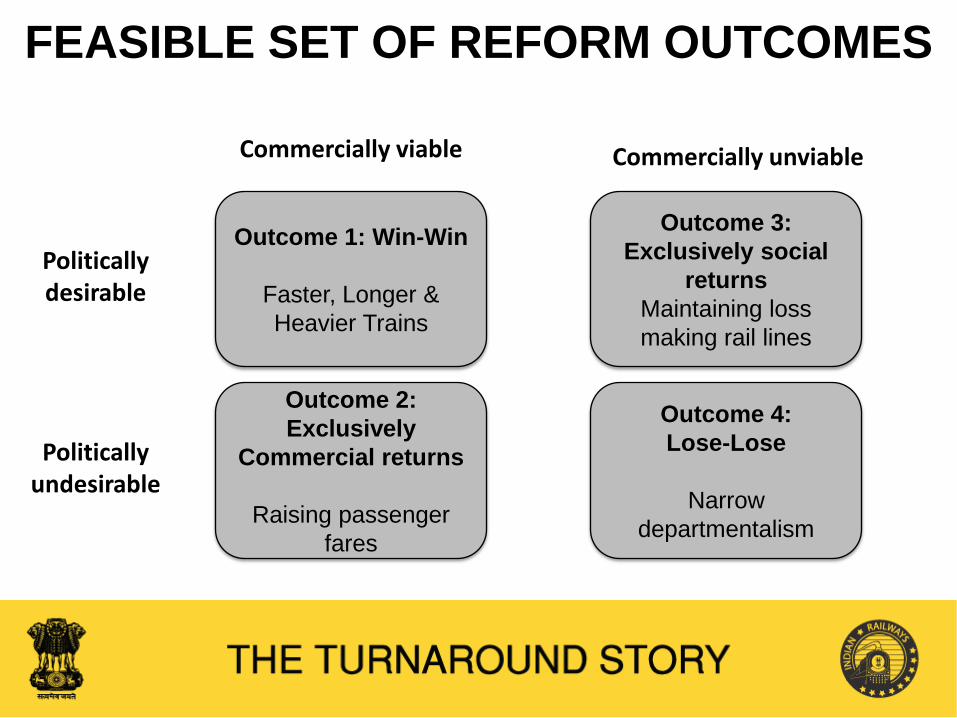
FEASIBLE SET OF REFORM OUTCOMES
Politicallydesirable
Politicallyundesirable
Commercially viable Commercially unviable
Outcome 1: Win-Win
Faster, Longer & Heavier Trains
Outcome 3: Exclusively social
returnsMaintaining loss making rail lines
Outcome 2: Exclusively
Commercial returns
Raising passenger fares
Outcome 4: Lose-Lose
Narrow departmentalism

FREIGHT BUSINESS IS A PLAY ON VOLUMES
ITEM 2000-01 2007-08 VARIATION
Freight loading (Million Tonnes) 492 790 61%
NTKMs/Wagon per day 2,042 3,350 64%
Freight unit cost (US cents per NTKMs) 1.22 1.10 -12%
NTKMs – Net Tonne Kilometers
Driven by :
Improved wagon turnaround and axle load
Tariff rationalization and dynamic pricing policy
Efficiency improvements and targeted investments
Higher Market Share and Margins

Full rake placement
Round the clock working
Electrification of diesel
sidings on electrified routes
Commercial, Operational and Investment Issues
REDUCING TURN ROUND TIME OF WAGONS TO 5 DAYS
Amendment in
Preferential Tariff
Schedule (PTS)
Faster train examination
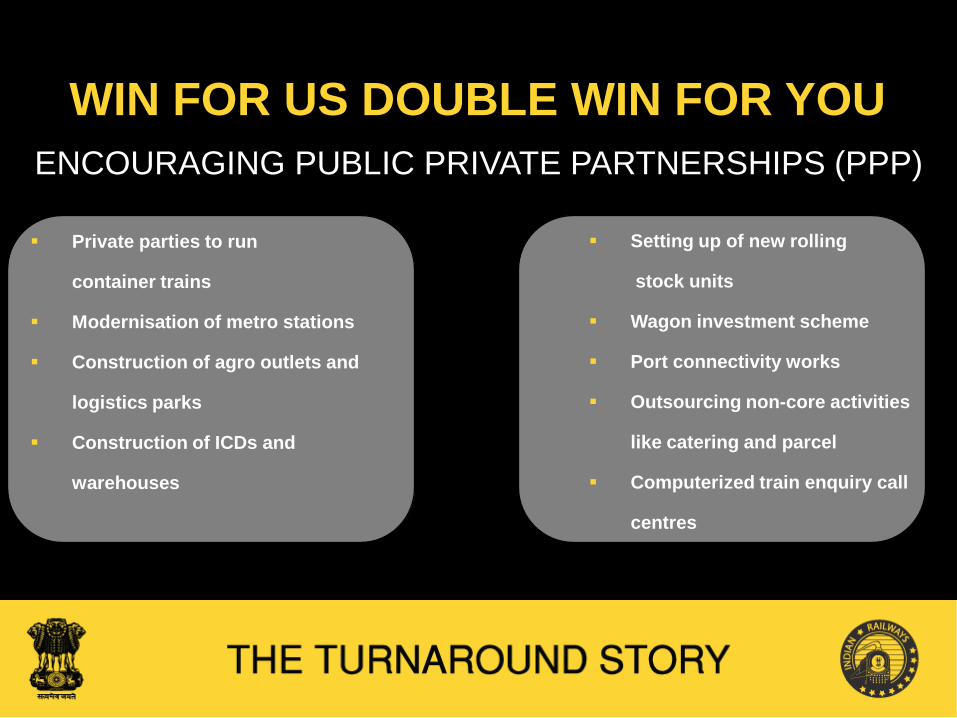
WIN FOR US DOUBLE WIN FOR YOU
Setting up of new rolling
stock units
Wagon investment scheme
Port connectivity works
Outsourcing non-core activities
like catering and parcel
Computerized train enquiry call
centres
ENCOURAGING PUBLIC PRIVATE PARTNERSHIPS (PPP)
Private parties to run
container trains
Modernisation of metro stations
Construction of agro outlets and
logistics parks
Construction of ICDs and
warehouses

CateringYatri NiwasParcelAdvertising Up gradation of R. Rooms, Toilet *PSOs-e.g.UBL
Port Links
Suburban servicesNew RollingStock Units
Multi .Modal Logistics e.g.*ICD * F.V.
Budget HotelsFood Plaza
Increasing Degree of Cooperation between Public and Private sector
BOT- Annuity
*PFOs
*PPOs
Capacity Augmentation ProjectsDoubling, GC, RE, etc.(Without Maintenance)
New Rly. NetworkDFC
(With Maintenance)
Fixed Annuity
OR
GTKMs Based Payment
• PSO-Private Service Operators, UBL-Uneconomic Branch Lines like Hill Rly etc., LPVP-Least
Present Value of Payments, PFO-Private Freight Operator, Private Passenger Operator, ICD-Inland Container Depot, F.V.-Freight Village
With Strategic Investor
WithRailway’sAsset
With Builders/ Developers
With Lessee’s Investment (Land etc.
may be given by Rly)
GTKMs - Gross Tonne Kilometers
Fixed Annuity
OR
GTKMs Based Payment With Lessee’s Rolling Assets(Except Track
& Locos)
Lease/ Service
AgreementSPV/ JV BOT- Annuity License BOOT/
BOO

ERP for Railways
Commercial Portal for Railways
Throughput optimization and
reduction in cost of operations.
MIS and LRDSS for investment
optimization
PRIORITIES FOR IT
Ticketing and other passenger
revenue enhancement
applications – integrated
passenger information,
reservation and distribution
system
Integration of different softwares
including PRS, FOIS etc.

De-risking the business model
of Railways
Diversification of IR’s freight
portfolio by capturing
Piece - meal traffic of heavy
commodities
CAGR of 40% per annum for next
5 years in container traffic
Container traffic to go up
from 22 MT to 100 MT by 2010-11
Domestic traffic : 40 MT
EXIM traffic : 60 MT
Creation of infrastructure
including ICDs, rolling stock etc.
PRIORITIES FOR CONTAINER BUSINESS

MISSION 2012
Deliver world class services and amenities
Double rail transport capacity
• Freight traffic from
728 to 1150 MT
• Passenger traffic
from 6000 to 9000
million passengers
Increase speed of trains
• Passenger trains
from 55 to 100 KMPH
• Goods train from
24 to 60 KMPH
Reduce unit cost
• 1.06 cent to 0.76
cent per PKM
• 1.38 cent to 0.88
cent per NTKM
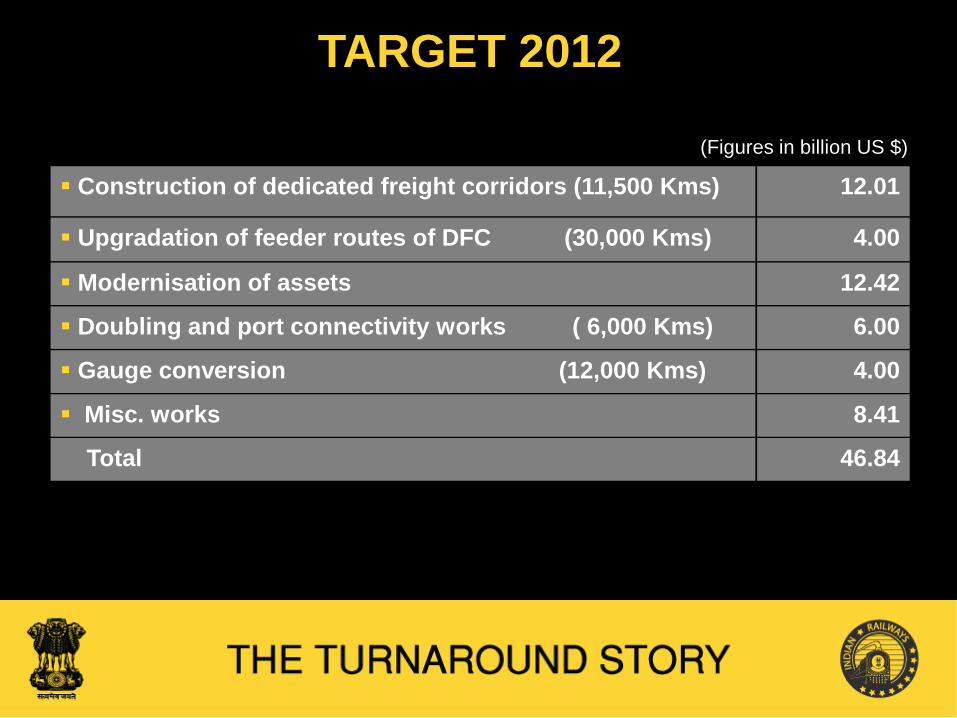
(Figures in billion US $)
TARGET 2012
Construction of dedicated freight corridors (11,500 Kms) 12.01
Upgradation of feeder routes of DFC (30,000 Kms) 4.00
Modernisation of assets 12.42
Doubling and port connectivity works ( 6,000 Kms) 6.00
Gauge conversion (12,000 Kms) 4.00
Misc. works 8.41
Total 46.84

Source Existing(2001-2006)
Proposed(2007-2012)
Internal generation 5.67 18.01
Borrowings 3.48 10.00
Public Private Partnerships (PPPs) 0.12 8.00
Budgetary support 7.50 10.83
TOTAL 16.77 46.84
(Figures in billion US $)
FUNDING PATTERN

THANK YOU