Embed Size (px)
Citation preview

Morgan Stanley Investment Funds
InveStMent ManageMent
Société d’Investissement à Capital Variable incorporated under the laws of Luxembourg
Annual ReportDecember 31, 2020
R.C.S. Luxembourg: B-29. 192


Morgan Stanley Investment Funds 31 December 2020
Table of contents
1 Shareholders’ information 2 Board of Directors’ Report
SCHEDULE OF INVESTMENTS
Equity Funds
7 Asia Opportunity Fund 9 Asian Property Fund 11 China A-shares Fund 14 China Equity Fund 16 Counterpoint Global Fund* 20 Developing Opportunity Fund 22 Emerging Europe, Middle East and Africa Equity Fund 24 Emerging Leaders Equity Fund 26 Emerging Markets Equity Fund 29 Emerging Markets Small Cap Equity Fund 32 Europe Opportunity Fund** 34 European Property Fund 36 Global Active Factor Equity Fund 38 Global Advantage Fund 40 Global Brands Fund 42 Global Brands Equity Income Fund 45 Global Endurance Fund 47 Global Infrastructure Fund 50 Global Infrastructure Unconstrained Fund 53 Global Opportunity Fund 56 Global Permanence Fund 59 Global Property Fund 63 Global Property Unconstrained Fund 65 Global Quality Fund 68 Global Sustain Fund 70 Indian Equity Fund 73 International Equity (ex US) Fund 76 Japanese Equity Fund 79 Latin American Equity Fund 81 Sustainable Asian Equity Fund*** 83 US Active Factor Equity Fund 85 US Advantage Fund 88 US Growth Fund 91 US Insight Fund 94 US Permanence Fund 97 US Property Fund Bond Funds
100 Emerging Markets Corporate Debt Fund 107 Emerging Markets Debt Fund 114 Emerging Markets Domestic Debt Fund 117 Emerging Markets Fixed Income Opportunities Fund 124 Euro Bond Fund 131 Euro Corporate Bond Fund 139 Euro Corporate Bond – Duration Hedged Fund
145 Euro Strategic Bond Fund 157 European Fixed Income Opportunities Fund 168 European High Yield Bond Fund 173 Global Asset Backed Securities Fund 187 Global Bond Fund 202 Global Convertible Bond Fund 207 Global Credit Fund 215 Global Fixed Income Opportunities Fund 232 Global High Yield Bond Fund 240 Short Maturity Euro Bond Fund 246 Sustainable Euro Corporate Bond Fund 250 Sustainable Euro Strategic Bond Fund 256 US Dollar Corporate Bond Fund 265 US Dollar High Yield Bond Fund 274 US Dollar Short Duration Bond Fund 280 US Dollar Short Duration High Yield Bond Fund Asset Allocation Funds
286 Global Balanced Defensive Fund 297 Global Balanced Fund 311 Global Balanced Income Fund 324 Global Balanced Risk Control Fund of Funds 327 Global Balanced Sustainable Fund 337 Global Multi-Asset Income Fund 351 Global Multi-Asset Opportunities Fund 358 Multi-Asset Risk Control Fund 366 Real Assets Fund Alternative Investment Funds
372 Liquid Alpha Capture Fund
STATEMENTS AND NOTES
374 Statement of assets and liabilities 388 Statement of operations and changes in net assets 403 Statement of share and net assets statistics 419 Notes to the financial statements
OTHER INFORMATION
436 Independent Auditor’s Report 438 Directors and service providers 440 Paying and information agents 441 Appendix 1: Fund expense ratios (unaudited) 446 Appendix 2: Portfolio turnover rate (unaudited) 447 Appendix 3: Sub-Advisers (unaudited) 449 Appendix 4: Hedged Share Classes (unaudited) 451 Appendix 5: Performance Summary (unaudited) 456 Appendix 6: Risk Measurement and Global Exposure (unaudited) 458 Appendix 7: Remuneration Policy of the Management
Company (unaudited) 462 Appendix 8: Securities Financing Transactions (unaudited)
* Formerly known as Global Counterpoint Fund prior to 15 May 2020.** Formerly known as European Champions Fund prior to 20 April 2020.*** Formerly known as Asian Equity Fund prior to 31 December 2020.

1 Morgan Stanley Investment Funds 31 December 2020
The annual general meeting of shareholders of Morgan Stanley Investment Funds (the “Company”) is held at the registered office of the Company and will be held on the second Tuesday of the month of May at 10.30 am. If such day is a legal or a bank holiday in Luxembourg, the annual general meeting shall be held on the next following business day.
notices of all general meetings are sent by mail to all registered shareholders at their registered address at least 8 days prior to the meeting. Such notices will indicate the time and place of the meeting as well as the conditions of admission thereto. Said notices will also contain the agenda and requirements of Luxembourg law with regard to the necessary quorum and majorities at the meeting.
to the extent required by law, further notices will be published in the Mémorial and in one Luxembourg newspaper.
audited financial statements in respect of the preceding financial period are made available at the registered office of the Company and are available to shareholders upon request. In addition, unaudited semi-annual reports are also made available at the registered office.
The annual and semi-annual reports are also available on the Company’s website (www.morganstanleyinvestmentfunds.com).
The Company’s financial year end is 31 December.
any other notices relevant to the Company are also published in a Luxembourg newspaper or mailed to affected shareholders.
The net asset value per share of each Class of Share is available on each dealing day during Luxembourg business hours at the registered office of the Company. net asset value per share information is also available from market information providers, such as Bloomberg, www.fundinfo.com and Morningstar, as well as being available at www.morganstanleyinvestmentfunds.com.
no subscriptions can be received on the basis of financial reports alone. Subscriptions are only valid if made on the basis of the current prospectus and the latest Key Investor Information Document.
Carnegie Fund Services S.a., 11, rue du général-Dufour, 1204 geneva, web: carnegie-fund-services-ch, is the representative in Switzerland and Banque Cantonale de genève, 17, quai de l’Ile, 1204 geneva is the paying agent in Switzerland. The Prospectus, the latest Key Investor Information Document, the articles and the annual and semi-annual reports of the Company may be obtained free of charge from the representative in Switzerland.
a list of purchases and sales (securities transactions) carried out by the Company during the reporting period may be obtained free of charge from the representative in Switzerland.
The investment objectives set out in this annual report are summaries only. The complete investment objectives and policies for each Fund are set out in the Company’s current prospectus.
Shareholders’ information

Morgan Stanley Investment Funds 31 December 2020 2
Board of Directors’ Report
Activities and Outlook
Overall, 2020 was a positive year for the Morgan Stanley Investment Funds range. assets under Management increased by $36.35bn (48.5%) from $74.91bn on 31 December 2019 to $111.26bn on 31 December 2020.
Morgan Stanley Investment Funds Overviewa number of important changes to Morgan Stanley Investment Funds occurred during 2020. These changes included:
• Inthetwelvemonthsto31December2020,foursub-fundswere launched:
– On 30 June 2020, the global Balanced Sustainable Fund commenced operations.
– On 31 July 2020, the Sustainable euro Corporate Bond Fund commenced operations.
– On 31 July 2020, the Sustainable euro Strategic Bond Fund commenced operations.
– On 30 October 2020, the US Permanence Fund commenced operations.
• Inthetwelvemonthsto31December2020,onesub-fundwas closed:
– On 16 October 2020, Breakout nations Fund was closed.
• Inthetwelvemonthsto31December2020,49shareclasseswere launched. For a complete list, please refer to note 1 of the annual Report.
• Inthetwelvemonthsto31December2020,27shareclasseswere closed. For a complete list, please refer to note 1 of the annual Report.
• Inthetwelvemonthsto31December2020,twofundsmerged:
– On 20 april 2020, eurozone equity alpha Fund merged into european Champions Fund.
– On 9 november 2020, global Buy and Hold 2020 Bond Fund merged into european Fixed Income Opportunities Fund.
• Inthetwelvemonthsto31December2020,threefundschanged their names:
– On 20 april 2020, european Champions Fund was renamed as the europe Opportunity Fund.
– On 15 May 2020, global Counterpoint Fund was renamed as the Counterpoint global Fund.
– On 31 December 2020, asian equity Fund was renamed as the Sustainable asian equity Fund.
Directors
HENRY KELLYIndependent Non-Executive Director and ChairmanHenry Kelly is an independent board member of several investment funds and investment management companies domiciled in Luxembourg and internationally. He is the Managing Director of the Luxembourg-based consultancy firm that he founded in 1999, KellyConsult Sàrl, which provides advisory services to the investment fund sector. He is a member and was the founding Chairman of the Fund governance Forum for aLFI (association of the Luxembourg Fund Industry). He is a member of the Management Committee of the Luxembourg Institute of Directors (ILa) and is a founding member of the ILa Investment Funds Committee. He is a regular speaker at conferences on investment funds and corporate governance matters. From 1993 – 1999 he was a Managing Director of Flemings Luxembourg (now JP Morgan asset Management) following 5 years’ experience in the capital markets division of BnP Paribas based in Paris. Prior to these posts, he acquired seven years’ experience with Price Waterhouse in Paris, Frankfurt and new York. He has a master’s degree in Modern Languages from Cambridge University, is a Member of the Institute of Chartered accountants and holds the InSeaD Certificate in Corporate governance. He obtained the qualification of ILa certified director in 2013.
WILLIAM JONESIndependent Non-Executive DirectorWilliam Jones is the founder of Beaumont governance (“Bg”) which provides directorship and corporate governance services from Luxembourg. Mr. Jones has over 30 years’ experience in the funds industry and has held senior positions with Commodities Corporation, goldman Sachs asset Management International and Bank of Bermuda/HSBC. Mr. Jones acts as director of investment funds and related entities sponsored by major US international banks and asset managers. He also acts as advisor and director of non-financial start-up and early stage companies. He completed the first cohort of the InSeaD International Directors Program (“IIDP”) in 2011, was a member of the IIDP advisory Board (2011-2017) and served as its first President (2011-2015). Mr. Jones was accredited in 2011 as a certified director by IIDP and the Institut Luxembourgeois des administrateurs (“ILa”). He sits on the Board of Directors of ILa and its Fund governance Committee and co-chaired the alternative Investment task Force of ILa’s Fund governance Committee which issued the “ILa guide for Board Members in the Context of aIF and aIFM” in July 2014. He sits on multiple committees of aLFI, the Luxembourg fund industry association. He was co-vice chair of the alternative Investment Management association’s (“aIMa”) working group which issued “aIMa’s Fund Director guide” in april 2015. He served

3 Morgan Stanley Investment Funds 31 December 2020
Board of Directors’ Report (continued)
on the Board of governors of the International School of Luxembourg from 2011 to 2015 and was its Chairman during 2014-15. Mr Jones has law and business degrees (1988) from Columbia University and a bachelor degree (1984) from Princeton University.
ANDREW MACKNon-Executive Director and Chairman of the Board of Directors of Morgan Stanley Investment Management (ACD) Limited and MSIM Fund Management (Ireland) Ltd Mr. Mack joined Morgan Stanley in 1996 and has over 30 years of investment experience. Mr. Mack joined Morgan Stanley as a portfolio manager in the asset management business, where he launched and co-managed a global equity arbitrage fund. He subsequently headed the global market risk oversight team for all of Morgan Stanley before taking over as market risk manager of the european equities business. Mr. Mack was appointed as european head of multi asset class prime brokerage in 2004 and took over prime brokerage sales for europe in 2006 before running the european listed derivative business. Mr. Mack rejoined Morgan Stanley Investment Management (MSIM) in 2008 as global chief risk officer, taking over as head of MSIM eMea at the beginning of 2009. Mr. Mack was an employee of Morgan Stanley until 30 June 2010. Mr. Mack provided services as a consultant and senior adviser to Morgan Stanley between 1 July 2010 and 31 December 2013. Mr. Mack assumed a non-executive Director role of Morgan Stanley Investment Management (aCD) Limited which was the Management Company between 1st april 2014 and 31 December 2018. Mr. Mack has been involved in taking and managing risk for most of his investment career, his previous experience includes portfolio management, trading and risk management positions at Cargill, Bankers trust and Black River asset Management, a Minneapolis based hedge fund.
CARINE FEIPELIndependent Non-Executive DirectorCarine Feipel is a Luxembourg attorney and certified independent director. She is the current Chair of the Luxembourg Institute of Directors (ILa).Ms. Feipel obtained the InSeaD IDP Certificate on Corporate governance in 2014 and was admitted by ILa as a Certified Director in the same year. Ms. Feipel serves the Board of Directors of a Luxembourg based bank, four insurance companies, both active in the life insurance and the non-life insurance fields. Ms. Feipel is further a member of the Board of Directors of various Luxembourg companies active in the financial and investment funds sectors. In 2014, Ms. Feipel was elected to the Board of Directors of ILa and became a member of the Management Committee of such association. She was appointed as Chair of such professional association in June 2019.
Since January 2014, Ms. Feipel practices as an independent lawyer, notably advising insurance and reinsurance companies as well as other financial institutions. Ms. Feipel has 20 years of experience as a lawyer with the Luxembourg law firm arendt & Medernach where she headed the insurance law practice and was co-head of the employment law practice. Ms. Feipel was also a member of the Board of such firm and headed its new York office from 2007 to 2012. Since 2010, Ms. Feipel has been a member of various committees within the Haut Comité pour la Place Financière, a government lead think tank coordinating promotion and innovation initiatives for the Luxembourg financial sector.
SUSANNE VAN DOOTINGHIndependent Non-Executive DirectorMs van Dootingh is an independent non-executive director of various Luxembourg domiciled investment funds and management companies. Prior to becoming an independent non-executive director in 2017, Ms van Dootingh worked at State Street global advisors (SSga) from 2002 to 2017 with her final position being Senior Managing Director, Head of european governance and Regulatory Strategy, eMea. During her tenure at SSga she held various other senior positions, amongst others in global Product Development and Fixed Income Strategy, and was the chairwoman of the SSga flagship Luxembourg Sicav and Management Company and various other boards for a decade. Before joining SSga in 2002 Ms van Dootingh gained experience in global fixed income portfolio management and strategy at Fortis Investment Management, Barclays global Investors and aBn aMRO asset Management. She graduated from the vrije Universiteit amsterdam with a Master’s degree in Financial Sector Management.
DIANE HOSIEExecutive Director and Chief Executive Officer of Morgan Stanley Investment Management (ACD) Limited Diane Hosie is a Managing Director of Morgan Stanley and global Head of Investment Management Client Services based in London. Diane is CeO of Morgan Stanley (aCD) Limited, an executive Director of Morgan Stanley Investment Management Limited, an executive Director on the Morgan Stanley Liquidity Funds Board, the Morgan Stanley Investment Funds and the Morgan Stanley asset Management Boards. Diane is also a non-executive Director of MSIM Fund Management (Ireland) Ltd. Diane joined Morgan Stanley in 1997 as a Senior associate within Investment Management Operations and was named Managing Director in 2014.
ZOË PARISHExecutive Director Zoë Parish is a Managing Director of Morgan Stanley and the Head of International Product and Board governance for Morgan Stanley Investment Management. Before returning to Morgan Stanley in 2019, Zoë spent 4 years at Coutts and Co and was most

Morgan Stanley Investment Funds 31 December 2020 4
Board of Directors’ Report (continued)
recently Head of europe and americas. Prior to that she was Head of Delivery responsible for developing and implementation of strategies for Coutts products for england and Wales. Prior to this, she was business lead for several strategic projects for the firm including a web based investment platform. From 1993 to 2014, Zoë held leadership and product roles in Morgan Stanley’s Private Wealth Management business in eMea. In her latest role with Morgan Stanley as Managing Director, she is Head of Product and also headed up the alternatives platform, the Private Investment Club and Strategic Lead Management for eMea. Zoë received a B. a. (Hons) and an LLB (Hons) both from the University of London. She also sits on the Board of Morgan Stanley asset Management S.a and is the Chairman of the Board of trustees for the University of London Boat Club.
Structure of the Company
Morgan Stanley Investment Funds (the “Company”) is registered in the grand Duchy of Luxembourg as an undertaking for collective investment pursuant to Part I of the Law of 17th December 2010 on Undertakings for collective investment, as amended (the “2010 Law”). Such registration however does not imply a positive assessment by the supervisory authority of the quality of the shares of the Company (the “Shares”) offered for sale. any representation to the contrary is unauthorised and unlawful. The Company is an Undertaking for Collective Investment in transferable Securities (“UCItS”) for the purpose of the Directive 2009/65/eC of the european Parliament and of the Council of 13 July 2009 on the coordination of laws, regulations and administrative provisions relating to undertakings for collective investment in transferable securities (the “UCItS Directive” or the “UCItS Iv Directive”). Since 1 January 2019, the Company has appointed MSIM Fund Management (Ireland) Limited as management company (the “Management Company”).
Distribution of the Funds
all of the Funds and Share Classes are registered for distribution in the grand Duchy of Luxembourg and a number of the Funds and Share Classes are registered for distribution in other jurisdictions. For a full list of countries in which Funds and Share Classes are registered for sale, please refer to www.morganstanleyinvestmentfunds.com.
Role and Responsibility of the Board
The responsibility of the Board is governed by Luxembourg law. With respect to the financial statements of the Company, the duties of the Directors are governed by the law of 10 December 2010 on,
inter alia, the accounting and annual accounts of undertakings for collective investment and by the law of 17 December 2010 relating to undertakings for collective investment.
The matters reserved for the Board include determination of each Fund’s investment objective and policies, investment restrictions and powers, amendments to the Prospectus, reviewing and approving key investment and financial data, including the annual accounts, as well as the appointment of the auditor, the Custodian and the Management Company.
Prior to each Board meeting, the Directors receive detailed and timely information allowing them to be prepared for the items under discussion during the meeting. For each quarterly meeting, the Board receives reports consolidated by the Management Company on the basis of information received from the Investment adviser, the Distributor, the Custodian, the administrator, the transfer agent, Risk Management, the auditor as well as proposals for changes to existing Funds or proposals to launch new ones as appropriate. Senior representatives of the Management Company and other service providers attend Board meetings by invitation to enable the Directors to question the reports presented to them.
The Board can take independent professional advice if necessary and at the Company’s expense.
Board Evaluation
The Board carries out an annual review of its performance.
Board Composition
The Board as a whole has a breadth of investment knowledge, financial skills, as well as legal and other experience relevant to the Company’s business. Directors are elected annually by shareholders at the annual general Meeting. The Board takes into account the nature and requirements of the fund industry and of the Company’s business when making the recommendation to shareholders that Directors be elected.
Tabular Summary of Board Composition
Director Residence Executive Non-ExecutiveIndependent
non-executive
Length of service on Board
Henry Kelly Luxembourg X 8 yearsWilliam Jones Luxembourg X 12.5 yearsAndrew Mack United Kingdom X 11.5 yearsCarine Feipel Luxembourg X 5 yearsSusanne Van Dootingh Belgium X 2.25 yearsDiane Hosie United Kingdom X 2.25 yearsZoë Parish United Kingdom X 9 months

5 Morgan Stanley Investment Funds 31 December 2020
Board of Directors’ Report (continued)
Board Meetings
The Board meets at least quarterly and additional meetings are convened as required from time to time by the business of the Company.
at the quarterly board meetings, the agenda includes, amongst other matters, those items highlighted under the section above called ‘Role and Responsibility of the Board’ and the approval of the annual report and accounts.
In certain circumstances, when it may not be appropriate to wait until the next Board meeting to discuss a particular issue, authority may be delegated to one or more Board members to deal with particular business issues.
The following table captures the Directors’ attendance of Board Meetings throughout 2020.
Director Number of board meetings attended
Henry Kelly 8 of 8William Jones 8 of 8Andrew Mack 8 of 8Carine Feipel 8 of 8Susanne van Dootingh 8 of 8Diane Hosie 8 of 8Zoë Parish* 6 of 6
* Appointed on 27 March 2020.
Internal Control
all administrative services are provided by the Management Company and custody of assets is provided by J.P. Morgan Bank Luxembourg S.a. The Management Company may delegate some of its responsibilities to any other party subject to approval by the Company but the Management Company’s liability to the Company for the performance of collective portfolio management and other delegated services has not been affected by such delegation. In particular, the Management Company has delegated the investment management, distribution, central administration and transfer agency functions. The Board is responsible for the oversight of the design, implementation and maintenance of internal controls comprising monitoring the services provided by the Management Company and the Custodian, including the operational and compliance controls established by them to meet the Company’s obligations to shareholders as set out in the Prospectus, articles of Incorporation as well as all relevant regulations. The Management Company formally reports to the Board on a quarterly basis on the various activities it is responsible for and in addition shall inform the Board without delay of any material administrative or accounting matters.
Corporate Governance and ALFI Code of Conduct
The Board is responsible for ensuring that a high level of corporate governance is met and considers that the Company has complied with the best practices in the Luxembourg funds industry.
In particular the Board has adopted the aLFI Code of Conduct (the “Code”) which sets out principles of good governance. These principles were last amended in august 2013 and are set out below:
1. The Board should ensure that high standards of corporate governance are applied at all times;
2. The Board should have good professional standing and appropriate experience and use best efforts to ensure that it is collectively competent to fulfil its responsibilities;
3. The Board should act fairly and independently in the best interests of the investors;
4. The Board should act with due care and diligence in the performance of their duties;
5. The Board should ensure compliance with all applicable laws and regulations and with the Fund’s constitutional documents;
6. The Board should ensure that investors are properly informed, are fairly and equitably treated, and receive the benefits and services to which they are entitled;
7. The Board should ensure that an effective risk management process and appropriate internal controls are in place;
8. The Board should identify and manage fairly and effectively, to the best of its ability, any actual, potential or apparent conflict of interest and ensure appropriate disclosure;
9. The Board should ensure that shareholder rights are exercised in a considered way and in the best interests of the Fund;
10. The Board should ensure that the remuneration of the Board members is reasonable and fair and adequately disclosed.
The Board considers that the Company has been in compliance with the principles of the Code in all material aspects throughout the financial year ended 31 December 2020. The Board undertakes an annual review of ongoing compliance with the principles of the Code.

Morgan Stanley Investment Funds 31 December 2020 6
Board of Directors’ Report (continued)
Proxy Voting Policy
The Board delegates responsibility for proxy voting to the Management Company. The Management Company manages the voting rights of the shares entrusted in a prudent and diligent manner, based exclusively on the reasonable judgment of what will best serve the financial interests of clients. So far, as is practicable, the Management Company will vote at all of the meetings called by companies in which the funds are invested.
a copy of the proxy voting policy is available from the Fund’s registered office upon request or on the website: http://www.morganstanley.com/im/en-gb/institutional-investor/ about-us/proxy-voting-en-gb.html
Directors’ and Officers’ Indemnity Insurance
The Fund has taken out Directors’ and Officers’ Indemnity Insurance which indemnifies the Directors against certain liabilities arising in the course of their duties and responsibilities but does not cover against any fraudulent or dishonest actions on their part.
Annual General Meeting
The next annual general Meeting of the Company will be held on 11 May 2021 at the Registered Office of the Company to consider matters relating to the year ended 31 December 2020. at this meeting shareholders will, amongst other matters, be requested to consider the usual matters at such meetings including:
1. The adoption of the financial statements and approval of the allocation of the results;
2. The approval of Directors’ fees;
3. The election of the Directors, all of whom wish to stand for election;
4. The election of the auditor.
Board of Directors
Luxembourg, 7 april 2021

7 Morgan Stanley Investment Funds 31 December 2020
The accompanying notes are an integral part of these financial statements.
Please refer to the full prospectus for the Fund’s investment objective and policy.
SCHEDULE OF INVESTMENTSAs at 31 December 2020
Investments Currency
Quantity/ Nominal
Value
Market Value USD
% of Net Assets
transferable securities and money market instruments admitted to official exchange listing or dealt in on another regulated market
Equities
ChinaAlibaba Group Holding Ltd., ADR USD 1,390,852 328,032,444 4.61 China East Education Holdings Ltd., Reg. S HKD 38,485,500 92,517,397 1.30 China Resources Beer Holdings Co. Ltd. HKD 30,051,333 276,721,127 3.89 Foshan Haitian Flavouring & Food Co.
Ltd. ‘A’ CNY 12,162,950 373,422,433 5.24 Haidilao International Holding Ltd., Reg. S HKD 18,556,000 142,869,347 2.01 Hangzhou Tigermed Consulting Co. Ltd.,
Reg. S ‘H’ HKD 4,207,000 97,390,665 1.37 Huazhu Group Ltd., ADR USD 1,050,702 47,281,590 0.66 HUYA, Inc., ADR USD 14,031,353 274,172,638 3.85 Inner Mongolia Yili Industrial Group Co.
Ltd. ‘A’ CNY 22,884,022 155,446,969 2.18 Kweichow Moutai Co. Ltd. ‘A’ CNY 964,898 295,146,313 4.14 Meituan Dianping, Reg. S ‘B’ HKD 15,489,500 588,505,473 8.26 New Frontier Health Corp. USD 907,879 7,962,099 0.11 Shenzhou International Group Holdings Ltd. HKD 11,928,200 233,829,265 3.28 TAL Education Group, ADR USD 5,916,298 425,145,174 5.97 Tencent Holdings Ltd. HKD 4,165,500 302,988,822 4.26 Trip.com Group Ltd., ADR USD 8,956,122 297,791,056 4.18 Tsingtao Brewery Co. Ltd. ‘H’ HKD 13,108,000 137,269,113 1.93
4,076,491,925 57.24
Hong KongAIA Group Ltd. HKD 23,330,200 285,839,624 4.02 Alphamab Oncology, Reg. S HKD 8,554,000 17,959,904 0.25
303,799,528 4.27
IndiaHDFC Bank Ltd. INR 26,025,584 512,066,487 7.19 ICICI Bank Ltd., ADR USD 20,362,175 299,833,027 4.21 ICICI Bank Ltd. INR 10,473,133 76,762,957 1.08 IndusInd Bank Ltd. INR 14,756,480 180,909,867 2.54 Kotak Mahindra Bank Ltd. INR 9,189,164 251,206,115 3.52
1,320,778,453 18.54
South KoreaNAVER Corp. KRW 1,141,708 306,350,573 4.30
306,350,573 4.30
INVESTMENT AIM
To seek long-term appreciation, measured in US Dollars through investment primarily in equity securities, including depositary receipts (including American Depositary Receipts (ADRs), Global Depositary Receipts (GDRs)), of issuers located in Asia, excluding Japan, and China A-Shares via Stock Connect.
SCHEDULE OF INVESTMENTSEquity Funds
Asia Opportunity Fund

Morgan Stanley Investment Funds 31 December 2020 8
The accompanying notes are an integral part of these financial statements.
Asia Opportunity Fund (continued)
SCHEDULE OF INVESTMENTSAs at 31 December 2020
Investments Currency
Quantity/ Nominal
Value
Market Value USD
% of Net Assets
transferable securities and money market instruments admitted to official exchange listing or dealt in on another regulated market
Equities (continued)
TaiwanNien Made Enterprise Co. Ltd. TWD 8,463,000 98,113,016 1.38 Silergy Corp. TWD 891,000 76,362,376 1.07 Taiwan Semiconductor Manufacturing
Co. Ltd. TWD 18,379,000 346,403,627 4.86
520,879,019 7.31
Total Equities 6,528,299,498 91.66
Total Transferable securities and money market instruments admitted to official exchange listing or dealt in on another regulated market 6,528,299,498 91.66
Total Investments 6,528,299,498 91.66
Cash 636,154,176 8.93
Other Assets/(Liabilities) (42,522,279) (0.59)
Total Net Assets 7,121,931,395 100.00
The country disclosed within the Schedule of Investments refers to the country of risk. The country of incorporation may differ.
Forward Currency Exchange Contracts
Currency Purchased
Amount Purchased
Currency Sold
Amount Sold
Maturity Date Counterparty
Unrealised Gain/(Loss)
USD
% of Net Assets
USD 2,377,757 EUR 1,935,174 05/01/2021 J.P. Morgan 3,415 0.00
Unrealised Gain on Forward Currency Exchange Contracts – Assets 3,415 0.00
EUR Hedged Share ClassUSD 4,749,225 EUR 3,862,258 05/01/2021 J.P. Morgan 10,467 0.00EUR 696,150,687 USD 847,357,718 08/01/2021 J.P. Morgan 6,845,706 0.09
Unrealised Gain on NAV Hedged Share Classes Forward Currency Exchange Contracts – Assets 6,856,173 0.09
GBP Hedged Share ClassGBP 10,826 USD 14,728 05/01/2021 J.P. Morgan 60 0.00GBP 51,723,436 USD 69,487,382 08/01/2021 J.P. Morgan 1,165,414 0.02
Unrealised Gain on NAV Hedged Share Classes Forward Currency Exchange Contracts – Assets 1,165,474 0.02
Total Unrealised Gain on Forward Currency Exchange Contracts – Assets 8,025,062 0.11
HKD 182,105,532 USD 23,491,362 04/01/2021 J.P. Morgan (5,662) 0.00USD 2,175,083 EUR 1,775,468 04/01/2021 J.P. Morgan (3,310) 0.00USD 169,101 GBP 125,295 04/01/2021 J.P. Morgan (2,043) 0.00USD 187,008 GBP 137,420 05/01/2021 J.P. Morgan (698) 0.00
Unrealised Loss on Forward Currency Exchange Contracts – Liabilities (11,713) 0.00
EUR Hedged Share ClassUSD 4,374,240 EUR 3,565,569 04/01/2021 J.P. Morgan (499) 0.00EUR 3,862,258 USD 4,749,643 08/01/2021 J.P. Morgan (10,505) 0.00
GBP Hedged Share ClassUSD 26,857 GBP 19,892 04/01/2021 J.P. Morgan (314) 0.00USD 306,467 GBP 225,277 05/01/2021 J.P. Morgan (1,246) 0.00USD 18,295 GBP 13,479 08/01/2021 J.P. Morgan (117) 0.00
Unrealised Loss on NAV Hedged Share Classes Forward Currency Exchange Contracts – Liabilities (12,681) 0.00
Total Unrealised Loss on Forward Currency Exchange Contracts – Liabilities (24,394) 0.00
Net Unrealised Gain on Forward Currency Exchange Contracts – Assets 8,000,668 0.11
DERIVATIVES
Over-the-counter (OtC) and exchange traded derivatives as at 31 December 2020, expressed in US Dollars.

9 Morgan Stanley Investment Funds 31 December 2020
The accompanying notes are an integral part of these financial statements.
Please refer to the full prospectus for the Fund’s investment objective and policy.
INVESTMENT AIM
To seek long-term capital appreciation, measured in US Dollars, through investment primarily in the equity securities of companies in the Asian and Oceanian real estate industry.
SCHEDULE OF INVESTMENTSAs at 31 December 2020
Investments Currency
Quantity/ Nominal
Value
Market Value USD
% of Net Assets
transferable securities and money market instruments admitted to official exchange listing or dealt in on another regulated market
Equities
AustraliaDexus, REIT AUD 351,105 2,551,430 3.01 Goodman Group, REIT AUD 124,667 1,822,476 2.15 GPT Group (The), REIT AUD 288,250 1,002,768 1.18 Mirvac Group, REIT AUD 475,766 970,993 1.14 Scentre Group, REIT AUD 732,792 1,574,869 1.86 Stockland, REIT AUD 585,988 1,893,581 2.23 Vicinity Centres, REIT AUD 843,971 1,047,180 1.23
10,863,297 12.80
ChinaChina Resources Land Ltd. HKD 494,746 2,041,797 2.41 China Resources Mixc Lifestyle Services
Ltd., Reg. S HKD 219,067 1,015,679 1.20 KWG Group Holdings Ltd. HKD 517,820 706,553 0.83 KWG Living Group Holdings Ltd., Reg. S HKD 275,000 223,436 0.26 Longfor Group Holdings Ltd., Reg. S HKD 509,000 2,980,259 3.51 Poly Developments and Holdings Group
Co. Ltd. ‘A’ CNY 24,600 59,580 0.07 Shimao Group Holdings Ltd. HKD 399,500 1,272,607 1.50
8,299,911 9.78
Hong KongCK Asset Holdings Ltd. HKD 149,000 764,803 0.90 ESR Cayman Ltd., Reg. S HKD 611,200 2,191,334 2.58 Hang Lung Properties Ltd. HKD 511,000 1,347,704 1.59 Hongkong Land Holdings Ltd. USD 408,200 1,685,866 1.99 Link REIT HKD 437,568 3,984,103 4.70 New World Development Co. Ltd. HKD 371,038 1,727,452 2.04 Sun Hung Kai Properties Ltd. HKD 452,323 5,833,498 6.87 Swire Properties Ltd. HKD 1,098,450 3,194,532 3.76 Wharf Real Estate Investment Co. Ltd. HKD 517,122 2,691,020 3.17
23,420,312 27.60
JapanActivia Properties, Inc., REIT JPY 109 460,281 0.54 Advance Residence Investment Corp., REIT JPY 404 1,214,524 1.43 Daiwa Office Investment Corp., REIT JPY 101 643,778 0.76 GLP J-Reit, REIT JPY 1,316 2,080,793 2.45 Hulic Co. Ltd. JPY 35,900 393,424 0.46 Japan Hotel REIT Investment Corp. JPY 926 475,680 0.56 Japan Prime Realty Investment Corp., REIT JPY 148 491,344 0.58 Japan Real Estate Investment Corp., REIT JPY 432 2,499,190 2.95 Japan Retail Fund Investment Corp., REIT JPY 577 1,051,566 1.24 Kenedix Office Investment Corp., REIT JPY 31 210,648 0.25 LaSalle Logiport REIT JPY 614 991,748 1.17 Mitsubishi Estate Co. Ltd. JPY 298,200 4,791,245 5.65 Mitsubishi Estate Logistics REIT
Investment Corp. JPY 163 680,486 0.80 Mitsui Fudosan Co. Ltd. JPY 236,000 4,925,363 5.80 Mitsui Fudosan Logistics Park, Inc., REIT JPY 383 1,942,124 2.29 Mori Trust Sogo Reit, Inc. JPY 289 373,034 0.44
Asian Property Fund
Morgan Stanley Investment Funds 31 December 2020 10
The accompanying notes are an integral part of these financial statements.
Asian Property Fund (continued)
SCHEDULE OF INVESTMENTSAs at 31 December 2020
Investments Currency
Quantity/ Nominal
Value
Market Value USD
% of Net Assets
transferable securities and money market instruments admitted to official exchange listing or dealt in on another regulated market
Equities (continued)
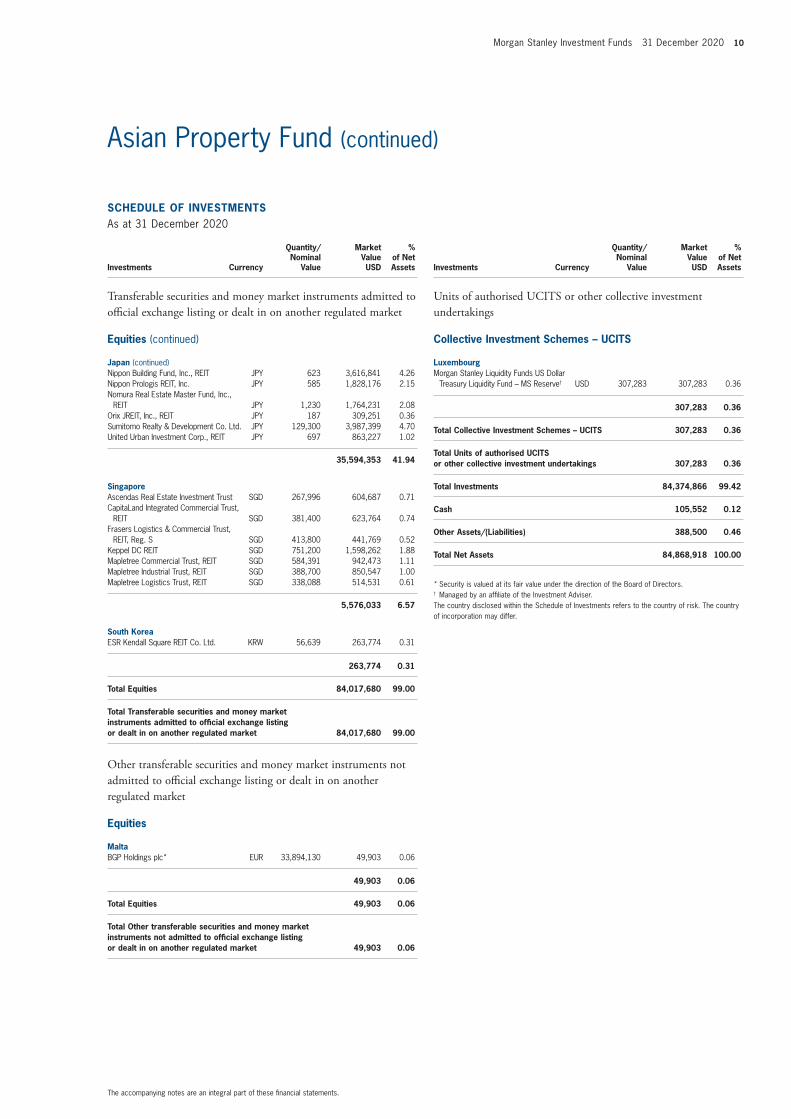
Japan (continued)Nippon Building Fund, Inc., REIT JPY 623 3,616,841 4.26 Nippon Prologis REIT, Inc. JPY 585 1,828,176 2.15 Nomura Real Estate Master Fund, Inc.,
REIT JPY 1,230 1,764,231 2.08 Orix JREIT, Inc., REIT JPY 187 309,251 0.36 Sumitomo Realty & Development Co. Ltd. JPY 129,300 3,987,399 4.70 United Urban Investment Corp., REIT JPY 697 863,227 1.02
35,594,353 41.94
SingaporeAscendas Real Estate Investment Trust SGD 267,996 604,687 0.71 CapitaLand Integrated Commercial Trust,
REIT SGD 381,400 623,764 0.74 Frasers Logistics & Commercial Trust,
REIT, Reg. S SGD 413,800 441,769 0.52 Keppel DC REIT SGD 751,200 1,598,262 1.88 Mapletree Commercial Trust, REIT SGD 584,391 942,473 1.11 Mapletree Industrial Trust, REIT SGD 388,700 850,547 1.00 Mapletree Logistics Trust, REIT SGD 338,088 514,531 0.61
5,576,033 6.57
South KoreaESR Kendall Square REIT Co. Ltd. KRW 56,639 263,774 0.31
263,774 0.31
Total Equities 84,017,680 99.00
Total Transferable securities and money market instruments admitted to official exchange listing or dealt in on another regulated market 84,017,680 99.00
Other transferable securities and money market instruments not admitted to official exchange listing or dealt in on another regulated market
Equities
MaltaBGP Holdings plc* EUR 33,894,130 49,903 0.06
49,903 0.06
Total Equities 49,903 0.06
Total Other transferable securities and money market instruments not admitted to official exchange listing or dealt in on another regulated market 49,903 0.06
SCHEDULE OF INVESTMENTSAs at 31 December 2020
Investments Currency
Quantity/ Nominal
Value
Market Value USD
% of Net Assets
Units of authorised UCItS or other collective investment undertakings
Collective Investment Schemes – UCITS
LuxembourgMorgan Stanley Liquidity Funds US Dollar
Treasury Liquidity Fund – MS Reserve† USD 307,283 307,283 0.36
307,283 0.36
Total Collective Investment Schemes – UCITS 307,283 0.36
Total Units of authorised UCITS or other collective investment undertakings 307,283 0.36
Total Investments 84,374,866 99.42
Cash 105,552 0.12
Other Assets/(Liabilities) 388,500 0.46
Total Net Assets 84,868,918 100.00
* Security is valued at its fair value under the direction of the Board of Directors.† Managed by an affiliate of the Investment Adviser.The country disclosed within the Schedule of Investments refers to the country of risk. The country of incorporation may differ.

11 Morgan Stanley Investment Funds 31 December 2020
The accompanying notes are an integral part of these financial statements.
Please refer to the full prospectus for the Fund’s investment objective and policy.
China A-shares Fund
INVESTMENT AIM
To provide capital appreciation over the long term, measured in US Dollars, by investing primarily in China A-shares of companies listed on the Shanghai Stock Exchange and/or the Shenzhen Stock Exchange via Stock Connect. The Fund may also invest in issuers of other countries including, but not limited to, those that are listed on the Hong Kong Exchange (including China H-shares and red chips) and depositary receipts (including American Depositary Receipts (ADRs) and Global Depositary Receipts (GDRs)) of issuers located in any country. The Fund may make use of exchange traded and over-the-counter options, futures and other derivatives for investment or efficient portfolio management (including hedging) purposes.
SCHEDULE OF INVESTMENTSAs at 31 December 2020
Investments Currency
Quantity/ Nominal
Value
Market Value USD
% of Net Assets
transferable securities and money market instruments admitted to official exchange listing or dealt in on another regulated market
Equities
BanksBank of Communications Co. Ltd. ‘A’ CNY 2,170,143 1,488,425 2.86 Industrial & Commercial Bank of China
Ltd. ‘A’ CNY 2,578,000 1,969,445 3.79
3,457,870 6.65
BeveragesKweichow Moutai Co. Ltd. ‘A’ CNY 2,800 856,474 1.65
856,474 1.65
Capital MarketsHuatai Securities Co. Ltd., Reg. S ‘H’ HKD 1,097,800 1,727,283 3.32
1,727,283 3.32
Commercial Services & SuppliesFocused Photonics Hangzhou, Inc. ‘A’ CNY 203,091 362,846 0.70
362,846 0.70
Communications EquipmentGuangzhou Haige Communications Group,
Inc. Co. ‘A’ CNY 272,600 451,975 0.87
451,975 0.87
Electronic Equipment, Instruments & ComponentsFoxconn Industrial Internet Co. Ltd. ‘A’ CNY 1,417,600 2,971,101 5.71 Unisplendour Corp. Ltd. ‘A’ CNY 220,820 691,341 1.33
3,662,442 7.04
Food ProductsChacha Food Co. Ltd. ‘A’ CNY 172,700 1,423,766 2.74 Inner Mongolia Yili Industrial Group Co.
Ltd. ‘A’ CNY 189,923 1,290,112 2.48
2,713,878 5.22
Gas UtilitiesShenzhen Gas Corp. Ltd. ‘A’ CNY 1,110,600 1,230,996 2.37
1,230,996 2.37
Healthcare ServicesShanghai Pharmaceuticals Holding Co.
Ltd. ‘H’ HKD 1,578,100 2,780,133 5.35
2,780,133 5.35
Hotels, Restaurants & LeisureGuangzhou Restaurant Group Co. Ltd. ‘A’ CNY 266,528 1,580,341 3.04
1,580,341 3.04

Morgan Stanley Investment Funds 31 December 2020 12
The accompanying notes are an integral part of these financial statements.
China A-shares Fund (continued)
SCHEDULE OF INVESTMENTSAs at 31 December 2020
Investments Currency
Quantity/ Nominal
Value
Market Value USD
% of Net Assets
transferable securities and money market instruments admitted to official exchange listing or dealt in on another regulated market
Equities (continued)
Household DurablesHaier Smart Home Co. Ltd. ‘A’ CNY 306,218 1,369,377 2.64 Midea Group Co. Ltd. ‘A’ CNY 37,400 563,642 1.08
1,933,019 3.72
Industrial Power and Renewable Electricity ProducersChina Yangtze Power Co. Ltd. ‘A’ CNY 19,000 55,733 0.11 Guangxi Guiguan Electric Power Co.
Ltd. ‘A’ CNY 2,084,983 1,423,632 2.74 Huaneng Lancang River Hydropower,
Inc. ‘A’ CNY 2,610,900 1,782,730 3.42
3,262,095 6.27
InsuranceChina Pacific Insurance Group Co. Ltd. ‘H’ HKD 393,000 1,538,267 2.96
1,538,267 2.96
Interactive Media & ServicesBaidu, Inc., ADR USD 2,382 516,989 0.99
516,989 0.99
MachineryWeichai Power Co. Ltd. ‘A’ CNY 300,852 727,270 1.40
727,270 1.40
MediaGuangdong South New Media Co. Ltd. ‘A’ CNY 87,300 939,572 1.80 Shandong Publishing & Media Co. Ltd. ‘A’ CNY 869,700 752,278 1.45
1,691,850 3.25
PharmaceuticalsChina Resources Sanjiu Medical
& Pharmaceutical Co. Ltd. ‘A’ CNY 1,177,305 4,495,167 8.64 Jiangsu Hengrui Medicine Co. Ltd. ‘A’ CNY 50,600 863,436 1.66 Jiangsu Nhwa Pharmaceutical Co. Ltd. ‘A’ CNY 508,271 1,242,684 2.39 Joincare Pharmaceutical Group Industry
Co. Ltd. ‘A’ CNY 319,200 679,752 1.31 Yunnan Baiyao Group Co. Ltd. ‘A’ CNY 74,891 1,302,472 2.50
8,583,511 16.50
Real EstateJinke Smart Services Group Co. Ltd.,
Reg. S ‘H’ HKD 74,200 597,130 1.15
597,130 1.15
SCHEDULE OF INVESTMENTSAs at 31 December 2020
Investments Currency
Quantity/ Nominal
Value
Market Value USD
% of Net Assets
transferable securities and money market instruments admitted to official exchange listing or dealt in on another regulated market
Equities (continued)
Real Estate Management & DevelopmentChina Merchants Property Operation
& Service Co. Ltd. ‘A’ CNY 275,000 906,436 1.74 China Merchants Shekou Industrial Zone
Holdings Co. Ltd. ‘A’ CNY 686,842 1,397,469 2.69 China Vanke Co. Ltd. ‘A’ CNY 271,200 1,191,604 2.29
3,495,509 6.72
SoftwareBeijing Thunisoft Corp. Ltd. ‘A’ CNY 545,960 1,995,142 3.84
1,995,142 3.84
Transportation InfrastructureGuangzhou Baiyun International Airport Co.
Ltd. ‘A’ CNY 124,000 268,240 0.52 Jiangsu Expressway Co. Ltd. ‘H’ HKD 896,000 1,001,861 1.92 Shenzhen Airport Co. Ltd. ‘A’ CNY 670,111 838,165 1.61
2,108,266 4.05
Total Equities 45,273,286 87.06
Corporate Bonds
Capital MarketsUBS AG 0% 01/12/2021 USD 214,323 271,681 0.52
271,681 0.52
Total Corporate Bonds 271,681 0.52
Warrants
Capital MarketsShanghai Milkground Co. Ltd. 15/12/2021 USD 124,100 1,084,847 2.09 Southern Publishing Co. Ltd. 01/12/2021 USD 7,100 9,000 0.02
1,093,847 2.11
Total Warrants 1,093,847 2.11
Total Transferable securities and money market instruments admitted to official exchange listing or dealt in on another regulated market 46,638,814 89.69

13 Morgan Stanley Investment Funds 31 December 2020
The accompanying notes are an integral part of these financial statements.
China A-shares Fund (continued)
Forward Currency Exchange Contracts
Currency Purchased
Amount Purchased
Currency Sold
Amount Sold
Maturity Date Counterparty
Unrealised Gain/(Loss)
USD
% of Net Assets
USD 497 EUR 405 05/01/2021 J.P. Morgan 1 0.00
Unrealised Gain on Forward Currency Exchange Contracts – Assets 1 0.00
EUR Hedged Share ClassUSD 18,908 EUR 15,376 05/01/2021 J.P. Morgan 42 0.00EUR 6,486,767 USD 7,890,773 08/01/2021 J.P. Morgan 68,737 0.13
Unrealised Gain on NAV Hedged Share Classes Forward Currency Exchange Contracts – Assets 68,779 0.13
Total Unrealised Gain on Forward Currency Exchange Contracts – Assets 68,780 0.13
USD 18,767 EUR 15,319 04/01/2021 J.P. Morgan (29) 0.00
Unrealised Loss on Forward Currency Exchange Contracts – Liabilities (29) 0.00
EUR Hedged Share ClassEUR 15,376 USD 18,909 08/01/2021 J.P. Morgan (42) 0.00USD 4,701 EUR 3,836 08/01/2021 J.P. Morgan (5) 0.00
Unrealised Loss on NAV Hedged Share Classes Forward Currency Exchange Contracts – Liabilities (47) 0.00
Total Unrealised Loss on Forward Currency Exchange Contracts – Liabilities (76) 0.00
Net Unrealised Gain on Forward Currency Exchange Contracts – Assets 68,704 0.13
SCHEDULE OF INVESTMENTSAs at 31 December 2020
Investments Currency
Quantity/ Nominal
Value
Market Value USD
% of Net Assets
Other transferable securities and money market instruments not admitted to official exchange listing or dealt in on another regulated market
Equities
Industrial Power and Renewable Electricity ProducersChina Yangtze Power Co. Ltd.* USD 61,975 1,716,708 3.30
1,716,708 3.30
Total Equities 1,716,708 3.30
Participation Notes
Capital MarketsYunnan Baiyao Group Co. Ltd.
02/04/2021* USD 59,800 988,015 1.90
988,015 1.90
Total Participation Notes 988,015 1.90
Total Other transferable securities and money market instruments not admitted to official exchange listing or dealt in on another regulated market 2,704,723 5.20
Total Investments 49,343,537 94.89
Cash 2,240,139 4.31
Other Assets/(Iiabilities) 417,904 0.80
Total Net Assets 52,001,580 100.00
* Security is valued at its fair value under the direction of the Board of Directors.
DERIVATIVES
Over-the-counter (OtC) and exchange traded derivatives as at 31 December 2020, expressed in US Dollars.

Morgan Stanley Investment Funds 31 December 2020 14
The accompanying notes are an integral part of these financial statements.
Please refer to the full prospectus for the Fund’s investment objective and policy.
China Equity Fund
INVESTMENT AIM
To seek to provide an attractive risk-adjusted annualized return, measured in US Dollars, by investing primarily in equity securities of companies located in China, including China A-shares of companies listed on the Shanghai Stock Exchange and/or the Shenzhen Stock Exchange via Stock Connect, and in issuers of other countries including, but not limited to, those that are listed on the Hong Kong Exchange (including China H shares and red chips) and depositary receipts (including American Depositary Receipts (ADRs) and Global Depositary Receipts (GDRs)), where the underlying companies are located in China. The Fund may make use of exchange traded and over-the-counter options, futures and other derivatives for investment or efficient portfolio management (including hedging) purposes.
SCHEDULE OF INVESTMENTSAs at 31 December 2020
Investments Currency
Quantity/ Nominal
Value
Market Value USD
% of Net Assets
transferable securities and money market instruments admitted to official exchange listing or dealt in on another regulated market
Equities
BanksChina Construction Bank Corp. ‘H’ HKD 395,000 300,049 2.11 China Merchants Bank Co. Ltd. ‘H’ HKD 96,000 606,664 4.25 Industrial & Commercial Bank of China
Ltd. ‘H’ HKD 225,000 145,959 1.03
1,052,672 7.39
BeveragesChina Resources Beer Holdings Co. Ltd. HKD 86,000 791,912 5.56 Kweichow Moutai Co. Ltd. ‘A’ CNY 4,500 1,376,475 9.68
2,168,387 15.24
Capital MarketsHong Kong Exchanges & Clearing Ltd. HKD 10,940 599,635 4.21
599,635 4.21
Diversified Consumer ServicesNew Oriental Education & Technology
Group, Inc., ADR USD 3,400 609,518 4.28 TAL Education Group, ADR USD 4,600 330,556 2.32
940,074 6.60
Electronic Equipment, Instruments & ComponentsUniversal Scientific Industrial Shanghai Co.
Ltd. ‘A’ CNY 87,100 257,890 1.81
257,890 1.81
Food ProductsChina Mengniu Dairy Co. Ltd. HKD 109,000 657,889 4.61 Inner Mongolia Yili Industrial Group Co.
Ltd. ‘A’ CNY 49,600 336,924 2.37 Yihai International Holding Ltd. HKD 18,000 266,963 1.88
1,261,776 8.86
Health Care Equipment & SuppliesShandong Weigao Group Medical Polymer
Co. Ltd. ‘H’ HKD 100,000 225,951 1.59
225,951 1.59
InsurancePing An Insurance Group Co. of China
Ltd. ‘H’ HKD 45,000 551,336 3.87
551,336 3.87
Interactive Media & ServicesTencent Holdings Ltd. HKD 17,800 1,294,731 9.09
1,294,731 9.09

15 Morgan Stanley Investment Funds 31 December 2020
The accompanying notes are an integral part of these financial statements.
China Equity Fund (continued)
SCHEDULE OF INVESTMENTSAs at 31 December 2020
Investments Currency
Quantity/ Nominal
Value
Market Value USD
% of Net Assets
transferable securities and money market instruments admitted to official exchange listing or dealt in on another regulated market
Equities (continued)
Internet & Direct Marketing RetailAlibaba Group Holding Ltd., ADR USD 1,013 238,916 1.68 Alibaba Group Holding Ltd. HKD 25,340 760,145 5.34 JD Health International, Inc., Reg. S HKD 4,000 77,381 0.54 Meituan Dianping, Reg. S ‘B’ HKD 23,000 873,857 6.15
1,950,299 13.71
PharmaceuticalsCSPC Pharmaceutical Group Ltd. HKD 341,760 349,523 2.46 Jiangsu Hengrui Medicine Co. Ltd. ‘A’ CNY 16,438 280,497 1.97 Joincare Pharmaceutical Group Industry
Co. Ltd. ‘A’ CNY 57,000 121,384 0.85
751,404 5.28
Real Estate Management & DevelopmentChina Resources Land Ltd. HKD 46,000 189,840 1.33
189,840 1.33
Semiconductors & Semiconductor EquipmentHua Hong Semiconductor Ltd., Reg. S HKD 59,000 334,800 2.35
334,800 2.35
Tech Hardware, Storage & PeripheralsXiaomi Corp., Reg. S ‘B’ HKD 124,200 531,790 3.74
531,790 3.74
Textiles, Apparel & Luxury GoodsShenzhou International Group Holdings Ltd. HKD 30,800 603,774 4.24
603,774 4.24
Wireless Telecommunication ServicesChina Mobile Ltd. HKD 40,000 228,015 1.60
228,015 1.60
Total Equities 12,942,374 90.91
Total Transferable securities and money market instruments admitted to official exchange listing or dealt in on another regulated market 12,942,374 90.91
Total Investments 12,942,374 90.91
Cash 1,304,981 9.17
Other Assets/(liabilities) (11,590) (0.08)
Total Net Assets 14,235,765 100.00

Morgan Stanley Investment Funds 31 December 2020 16
The accompanying notes are an integral part of these financial statements.
Please refer to the full prospectus for the Fund’s investment objective and policy.
Counterpoint Global Fund
SCHEDULE OF INVESTMENTSAs at 31 December 2020
Investments Currency
Quantity/ Nominal
Value
Market Value USD
% of Net Assets
transferable securities and money market instruments admitted to official exchange listing or dealt in on another regulated market
Equities
ArgentinaGlobant SA USD 39 8,412 0.09
8,412 0.09
AustraliaAfterpay Ltd. AUD 280 25,542 0.26 Brookfield Infrastructure Partners LP USD 600 30,060 0.31 Redbubble Ltd. AUD 3,512 14,987 0.15
70,589 0.72
BrazilB3 SA - Brasil Bolsa Balcao BRL 174 2,071 0.02 Magazine Luiza SA BRL 1,126 5,391 0.06
7,462 0.08
CanadaBrookfield Asset Management, Inc. ‘A’ USD 706 29,108 0.30 Canada Goose Holdings, Inc. USD 1,243 36,986 0.38 Canadian National Railway Co. USD 91 9,947 0.10 Colliers International Group, Inc. CAD 461 40,600 0.41 Constellation Software, Inc. CAD 33 42,793 0.43 FirstService Corp. CAD 541 73,262 0.75 Score Media and Gaming, Inc. CAD 184 214 – Shopify, Inc. ‘A’ USD 157 180,236 1.83
413,146 4.20
ChinaAlibaba Group Holding Ltd., ADR USD 240 56,604 0.58 China East Education Holdings Ltd., Reg. S HKD 1,500 3,606 0.04 Foshan Haitian Flavouring & Food Co.
Ltd. ‘A’ CNY 2,060 63,245 0.64 Hangzhou Tigermed Consulting Co. Ltd.,
Reg. S ‘H’ HKD 200 4,630 0.05 Huazhu Group Ltd., ADR USD 43 1,935 0.02 HUYA, Inc., ADR USD 534 10,434 0.11 Inner Mongolia Yili Industrial Group Co.
Ltd. ‘A’ CNY 500 3,396 0.03 Meituan Dianping, Reg. S ‘B’ HKD 1,500 56,991 0.58 New Frontier Health Corp. USD 767 6,727 0.07 Shenzhou International Group Holdings Ltd. HKD 300 5,881 0.06 TAL Education Group, ADR USD 1,615 116,054 1.18 Trip.com Group Ltd., ADR USD 786 26,135 0.26
355,638 3.62
DenmarkChr Hansen Holding A/S DKK 345 35,437 0.36 DSV PANALPINA A/S DKK 836 140,791 1.43 Novo Nordisk A/S ‘B’ DKK 28 1,948 0.02
178,176 1.81
FinlandRevenio Group OYJ EUR 222 13,687 0.14
13,687 0.14
* Formerly known as Global Counterpoint Fund prior to 15 May 2020.
INVESTMENT AIM
To seek long term appreciation, measured in US Dollars, by investing primarily in the equity securities, including depositary receipts (including ADRs and GDRs), of established and emerging companies located throughout the world, with capitalisations within the range of companies included in the MSCI All Country World Index.
*

17 Morgan Stanley Investment Funds 31 December 2020
The accompanying notes are an integral part of these financial statements.
Counterpoint Global Fund (continued)
SCHEDULE OF INVESTMENTSAs at 31 December 2020
Investments Currency
Quantity/ Nominal
Value
Market Value USD
% of Net Assets
transferable securities and money market instruments admitted to official exchange listing or dealt in on another regulated market
Equities (continued)
FranceChristian Dior SE EUR 93 51,872 0.53 Dassault Systemes SE EUR 98 19,978 0.20 EssilorLuxottica SA EUR 45 7,042 0.07 Getlink SE EUR 947 16,476 0.17 Hermes International EUR 163 175,912 1.79 L’Oreal SA EUR 29 11,059 0.11 Pernod Ricard SA EUR 101 19,431 0.20 Remy Cointreau SA EUR 69 12,894 0.13
314,664 3.20
Germanyadidas AG EUR 64 23,235 0.24 CompuGroup Medical SE & Co. KgaA EUR 162 15,563 0.16 HelloFresh SE EUR 120 9,237 0.10 Puma SE EUR 38 4,273 0.04 Zalando SE, Reg. S EUR 216 23,949 0.24
76,257 0.78
Hong KongAIA Group Ltd. HKD 3,000 36,756 0.37
36,756 0.37
IndiaHDFC Bank Ltd., ADR USD 3,224 231,612 2.36 ICICI Bank Ltd., ADR USD 1,870 27,536 0.28
259,148 2.64
ItalyBrunello Cucinelli SpA EUR 148 6,456 0.07 Davide Campari-Milano NV EUR 1,940 22,165 0.22 Moncler SpA EUR 1,610 98,390 1.00
127,011 1.29
JapanBASE, Inc. JPY 400 37,748 0.38 Demae-Can Co. Ltd. JPY 500 15,274 0.16 Freee KK JPY 100 9,782 0.10 Keyence Corp. JPY 100 56,247 0.57 Mercari, Inc. JPY 100 4,441 0.04 Pigeon Corp. JPY 800 33,012 0.34
156,504 1.59
MexicoGrupo Aeroportuario del Sureste SAB
de CV ‘B’ MXN 1,060 17,152 0.17
17,152 0.17
NetherlandsAdyen NV, Reg. S EUR 55 128,553 1.31 ASML Holding NV EUR 125 60,971 0.62 JDE Peet’s BV EUR 232 10,518 0.11 Just Eat Takeaway.com NV, Reg. S EUR 43 4,875 0.05
204,917 2.09
SCHEDULE OF INVESTMENTSAs at 31 December 2020
Investments Currency
Quantity/ Nominal
Value
Market Value USD
% of Net Assets
transferable securities and money market instruments admitted to official exchange listing or dealt in on another regulated market
Equities (continued)
New ZealandRyman Healthcare Ltd. NZD 2,657 29,177 0.30 Xero Ltd. AUD 341 38,704 0.39
67,881 0.69
PolandDino Polska SA, Reg. S PLN 248 19,181 0.19
19,181 0.19
SingaporeSea Ltd., ADR USD 1,317 256,960 2.62
256,960 2.62
South KoreaNAVER Corp. KRW 81 21,734 0.22
21,734 0.22
SpainAena SME SA, Reg. S EUR 95 16,575 0.17
16,575 0.17
SwedenAddLife AB ‘B’ SEK 2,032 35,626 0.36 Cellavision AB SEK 243 9,098 0.09 Evolution Gaming Group AB, Reg. S SEK 55 5,620 0.06 Vitrolife AB SEK 663 17,447 0.18
67,791 0.69
SwitzerlandKuehne + Nagel International AG CHF 92 20,862 0.21 Straumann Holding AG CHF 23 26,769 0.27
47,631 0.48
TaiwanTaiwan Semiconductor Manufacturing Co.
Ltd., ADR USD 420 45,801 0.47
45,801 0.47
United KingdomAbcam plc USD 741 16,072 0.16 Abcam plc GBP 641 13,571 0.14 Angle plc GBP 12,180 7,944 0.08 ASOS plc GBP 21 1,372 0.02 Atlassian Corp. plc ‘A’ USD 157 36,638 0.37 Blue Prism Group plc GBP 544 12,781 0.13 boohoo Group plc GBP 643 3,013 0.03 Diageo plc GBP 376 14,781 0.15 Fevertree Drinks plc GBP 304 10,493 0.11 Intertek Group plc GBP 83 6,403 0.07 Rentokil Initial plc GBP 850 5,917 0.06 Rightmove plc GBP 3,876 34,456 0.35 Royalty Pharma plc ‘A’ USD 3,623 178,179 1.81 Victoria plc GBP 10,339 92,501 0.94
434,121 4.42

Morgan Stanley Investment Funds 31 December 2020 18
The accompanying notes are an integral part of these financial statements.
Counterpoint Global Fund (continued)
SCHEDULE OF INVESTMENTSAs at 31 December 2020
Investments Currency
Quantity/ Nominal
Value
Market Value USD
% of Net Assets
transferable securities and money market instruments admitted to official exchange listing or dealt in on another regulated market
Equities (continued)
United States of America10X Genomics, Inc. ‘A’ USD 389 55,530 0.57 4D Molecular Therapeutics, Inc. USD 123 5,086 0.05 Activision Blizzard, Inc. USD 271 24,946 0.25 Adaptive Biotechnologies Corp. USD 64 3,664 0.04 Adobe, Inc. USD 80 39,941 0.41 Alnylam Pharmaceuticals, Inc. USD 56 7,196 0.07 Alphabet, Inc. ‘C’ USD 21 36,726 0.37 Alteryx, Inc. ‘A’ USD 56 6,849 0.07 Amazon.com, Inc. USD 70 229,058 2.33 American Tower Corp., REIT USD 4 885 0.01 ANSYS, Inc. USD 3 1,094 0.01 Anterix, Inc. USD 662 23,832 0.24 Appfolio, Inc. ‘A’ USD 492 86,863 0.88 Appian Corp. USD 1,012 159,734 1.63 ASML Holding NV, NYRS USD 75 36,376 0.37 At Home Group, Inc. USD 1,863 28,765 0.29 Autodesk, Inc. USD 3 908 0.01 Avalara, Inc. USD 9 1,507 0.02 Ball Corp. USD 124 11,450 0.12 Berkeley Lights, Inc. USD 46 3,933 0.04 Berkshire Hathaway, Inc. ‘B’ USD 11 2,523 0.03 BigCommerce Holdings, Inc. USD 150 9,635 0.10 Bill.com Holdings, Inc. USD 36 4,923 0.05 C3.ai, Inc. ‘A’ USD 30 4,192 0.04 Cadence Design Systems, Inc. USD 11 1,499 0.02 Cardlytics, Inc. USD 848 119,475 1.22 Carvana Co. USD 666 161,285 1.64 Chegg, Inc. USD 11 996 0.01 Chewy, Inc. ‘A’ USD 118 10,652 0.11 Cintas Corp. USD 24 8,398 0.09 Cloudflare, Inc. ‘A’ USD 291 21,927 0.22 Colgate-Palmolive Co. USD 16 1,358 0.01 ContextLogic, Inc. ‘A’ USD 567 10,127 0.10 Copart, Inc. USD 67 8,473 0.09 CoStar Group, Inc. USD 9 8,310 0.08 Costco Wholesale Corp. USD 148 55,368 0.56 Coupa Software, Inc. USD 286 97,841 1.00 Covetrus, Inc. USD 8,628 251,592 2.56 Danaher Corp. USD 5 1,105 0.01 Datadog, Inc. ‘A’ USD 72 7,045 0.07 DexCom, Inc. USD 101 36,763 0.37 DocuSign, Inc. USD 32 7,184 0.07 DoorDash, Inc. ‘A’ USD 198 27,811 0.28 DraftKings, Inc. ‘A’ USD 111 5,270 0.05 Dragoneer Growth Opportunities Corp. USD 572 8,094 0.08 Dropbox, Inc. ‘A’ USD 486 10,896 0.11 Ecolab, Inc. USD 236 51,170 0.52 Editas Medicine, Inc. USD 57 4,197 0.04 EPAM Systems, Inc. USD 227 81,087 0.83 Equinix, Inc., REIT USD 1 703 0.01 EVI Industries, Inc. USD 196 6,060 0.06 Exact Sciences Corp. USD 64 8,544 0.09 Facebook, Inc. ‘A’ USD 165 45,332 0.46 Farfetch Ltd. ‘A’ USD 2,102 133,876 1.36 Fastenal Co. USD 174 8,512 0.09 Fastly, Inc. ‘A’ USD 3,340 294,321 3.00 Floor & Decor Holdings, Inc. ‘A’ USD 382 35,576 0.36 GameStop Corp. ‘A’ USD 2,823 54,907 0.56 GoodRx Holdings, Inc. ‘A’ USD 120 4,818 0.05 Guardant Health, Inc. USD 178 22,426 0.23 Guidewire Software, Inc. USD 7 899 0.01 HealthEquity, Inc. USD 81 5,592 0.06 HEICO Corp. ‘A’ USD 412 48,356 0.49 Home Depot, Inc. (The) USD 6 1,588 0.02 IAC Corp. USD 64 12,107 0.12 IDEXX Laboratories, Inc. USD 2 990 0.01
SCHEDULE OF INVESTMENTSAs at 31 December 2020
Investments Currency
Quantity/ Nominal
Value
Market Value USD
% of Net Assets
transferable securities and money market instruments admitted to official exchange listing or dealt in on another regulated market
Equities (continued)
United States of America (continued)Illumina, Inc. USD 9 3,259 0.03 Inspire Medical Systems, Inc. USD 85 15,905 0.16 Intellia Therapeutics, Inc. USD 75 4,028 0.04 Intercontinental Exchange, Inc. USD 245 27,832 0.28 Intuitive Surgical, Inc. USD 201 163,960 1.67 Linde plc USD 26 6,801 0.07 Lululemon Athletica, Inc. USD 3 1,051 0.01 Madison Square Garden Sports Corp. ‘A’ USD 5 931 0.01 Martin Marietta Materials, Inc. USD 164 45,948 0.47 Mastercard, Inc. ‘A’ USD 233 83,500 0.85 Match Group, Inc. USD 10 1,508 0.02 MercadoLibre, Inc. USD 52 87,524 0.89 MicroStrategy, Inc. ‘A’ USD 202 78,376 0.80 Moderna, Inc. USD 109 11,925 0.12 MongoDB, Inc. USD 112 40,512 0.41 NanoString Technologies, Inc. USD 1,046 69,329 0.71 Netflix, Inc. USD 2 1,078 0.01 NIKE, Inc. ‘B’ USD 10 1,416 0.01 Northern Star Acquisition Corp. USD 729 12,386 0.13 Nuance Communications, Inc. USD 92 4,005 0.04 NVIDIA Corp. USD 3 1,565 0.02 Okta, Inc. USD 375 97,178 0.99 Opendoor Technologies Inc USD 167 3,908 0.04 Outset Medical, Inc. USD 99 5,823 0.06 Overstock.com, Inc. Preference USD 75 3,495 0.04 Overstock.com, Inc. USD 4,330 216,760 2.21 Party City Holdco, Inc. USD 9,611 61,414 0.63 Passage Bio, Inc. USD 209 5,296 0.05 Peloton Interactive, Inc. ‘A’ USD 47 7,205 0.07 Penumbra, Inc. USD 16 2,809 0.03 Pinterest, Inc. ‘A’ USD 875 57,698 0.59 Pool Corp. USD 3 1,099 0.01 Progressive Corp. (The) USD 10 974 0.01 Quotient Ltd. USD 870 4,524 0.05 RedBall Acquisition Corp. ‘A’ USD 87 949 0.01 Redfin Corp. USD 995 69,794 0.71 Relay Therapeutics, Inc. USD 55 2,310 0.02 Ribbit LEAP Ltd. USD 564 7,789 0.08 Roku, Inc. USD 21 7,057 0.07 Rollins, Inc. USD 23 881 0.01 Roper Technologies, Inc. USD 24 10,164 0.10 Royal Gold, Inc. USD 110 11,758 0.12 S&P Global, Inc. USD 108 35,144 0.36 salesforce.com, Inc. USD 138 30,523 0.31 Schrodinger, Inc. USD 132 10,593 0.11 Seer, Inc. USD 251 13,998 0.14 Service Corp. International USD 19 925 0.01 ServiceNow, Inc. USD 125 68,255 0.69 Sherwin-Williams Co. (The) USD 13 9,422 0.10 Skillz, Inc. USD 7,827 147,930 1.51 Smartsheet, Inc. ‘A’ USD 489 34,254 0.35 Snap, Inc. ‘A’ USD 1,192 59,278 0.60 Snowflake, Inc. ‘A’ USD 277 82,452 0.84 Spotify Technology SA USD 626 199,813 2.03 Square, Inc. ‘A’ USD 783 169,324 1.72 Starbucks Corp. USD 14 1,492 0.02 Stitch Fix, Inc. ‘A’ USD 1,525 92,095 0.94 Synopsys, Inc. USD 5 1,293 0.01 Take-Two Interactive Software, Inc. USD 5 1,037 0.01 Teladoc Health, Inc. USD 19 3,752 0.04 Texas Pacific Land Trust USD 36 25,920 0.26 Trade Desk, Inc. (The) ‘A’ USD 79 63,710 0.65 Twilio, Inc. ‘A’ USD 378 130,614 1.33 Twitter, Inc. USD 2,752 148,415 1.51 Tyler Technologies, Inc. USD 21 9,040 0.09 Uber Technologies, Inc. USD 2,836 148,053 1.51

19 Morgan Stanley Investment Funds 31 December 2020
The accompanying notes are an integral part of these financial statements.
Counterpoint Global Fund (continued)
Option Purchased Contracts
Quantity Security Description Currency Counterparty
Market Value USD
% of Net Assets
963,767 Foreign Exchange USD/CNH, Call, 7.641, 11/11/2021 USD BNP Paribas 2,644 0.04
735,821 Foreign Exchange USD/CNH, Call, 7.746, 07/01/2021 USD NatWest Markets 0 0.00
822,548 Foreign Exchange USD/CNH, Call, 7.995, 10/09/2021 USD BNP Paribas 793 0.00
875,226 Foreign Exchange USD/CNH, Call, 8.060, 23/07/2021 USD NatWest Markets 536 0.00
608,017 Foreign Exchange USD/CNH, Call, 8.485, 28/05/2021 USD NatWest Markets 81 0.00
Total Market Value on Option Purchased Contracts – Assets 4,054 0.04
SCHEDULE OF INVESTMENTSAs at 31 December 2020
Investments Currency
Quantity/ Nominal
Value
Market Value USD
% of Net Assets
transferable securities and money market instruments admitted to official exchange listing or dealt in on another regulated market
Equities (continued)
United States of America (continued)Unity Software, Inc. USD 137 21,071 0.21 Utz Brands, Inc. USD 2,861 63,114 0.64 Vail Resorts, Inc. USD 3 822 0.01 Veeva Systems, Inc. ‘A’ USD 663 180,197 1.83 Verisk Analytics, Inc. USD 43 8,864 0.09 Visa, Inc. ‘A’ USD 239 52,379 0.53 Vroom, Inc. USD 387 16,316 0.17 Walt Disney Co. (The) USD 410 74,643 0.76 Waste Connections, Inc. USD 88 8,944 0.09 Watsco, Inc. USD 4 904 0.01 Wayfair, Inc. ‘A’ USD 251 57,040 0.58 Workday, Inc. ‘A’ USD 49 11,751 0.12 Zillow Group, Inc. ‘A’ USD 5 679 0.01 Zillow Group, Inc. ‘A’ USD 96 13,041 0.13 Zillow Group, Inc. ‘C’ USD 266 34,423 0.35 Zoetis, Inc. USD 6 981 0.01 Zoom Video Communications, Inc. ‘A’ USD 421 144,614 1.47 ZoomInfo Technologies, Inc. ‘A’ USD 702 33,029 0.34 Zynga, Inc. ‘A’ USD 788 7,644 0.08
5,927,658 60.34
Total Equities 9,144,852 93.08
Total Transferable securities and money market instruments admitted to official exchange listing or dealt in on another regulated market 9,144,852 93.08
Other transferable securities and money market instruments not admitted to official exchange listing or dealt in on another regulated market
Equities
CanadaTopicus.com, Inc.* CAD 61 231 0.00
231 0.00
Total Equities 231 0.00
Total Other transferable securities and money market instruments not admitted to official exchange listing or dealt in on another regulated market 231 0.00
Total Investments 9,145,083 93.08
Cash 666,296 6.78
Other Assets/(Liabilities) 13,342 0.14
Total Net Assets 9,824,721 100.00
* Security is valued at its fair value under the direction of the Board of Directors.The country disclosed within the Schedule of Investments refers to the country of risk. The country of incorporation may differ.
DERIVATIVES
Over-the-counter (OtC) and exchange traded derivatives as at 31 December 2020, expressed in US Dollars.

Morgan Stanley Investment Funds 31 December 2020 20
The accompanying notes are an integral part of these financial statements.
Please refer to the full prospectus for the Fund’s investment objective and policy.
Developing Opportunity Fund
INVESTMENT AIM
To seek long term appreciation, measured in US Dollars, through investing primarily in equity securities of issuers located in developing markets including depositary receipts (including American Depositary Receipts (ADRs), Global Depositary Receipts (GDRs)) and China A-Shares via Stock Connect.
SCHEDULE OF INVESTMENTSAs at 31 December 2020
Investments Currency
Quantity/ Nominal
Value
Market Value USD
% of Net Assets
transferable securities and money market instruments admitted to official exchange listing or dealt in on another regulated market
Equities
ArgentinaGlobant SA USD 36,841 7,946,604 2.12
7,946,604 2.12
BrazilB3 SA - Brasil Bolsa Balcao BRL 485,178 5,776,768 1.54 Magazine Luiza SA BRL 3,124,421 14,958,361 4.00
20,735,129 5.54
ChinaAlibaba Group Holding Ltd., ADR USD 63,189 14,903,126 3.98 China East Education Holdings Ltd., Reg. S HKD 2,021,000 4,858,392 1.30 China Resources Beer Holdings Co. Ltd. HKD 964,000 8,876,783 2.37 Foshan Haitian Flavouring & Food Co.
Ltd. ‘A’ CNY 614,800 18,875,364 5.05 Haidilao International Holding Ltd., Reg. S HKD 690,000 5,312,559 1.42 Hangzhou Tigermed Consulting Co. Ltd.,
Reg. S ‘H’ HKD 22,900 530,127 0.14 Huazhu Group Ltd., ADR USD 61,715 2,777,175 0.74 HUYA, Inc., ADR USD 610,975 11,938,452 3.19 Kweichow Moutai Co. Ltd. ‘A’ CNY 36,400 11,134,157 2.98 Meituan Dianping, Reg. S ‘B’ HKD 796,900 30,277,285 8.09 Shenzhou International Group Holdings Ltd. HKD 424,800 8,327,382 2.23 TAL Education Group, ADR USD 285,999 20,551,888 5.49 Tencent Holdings Ltd. HKD 169,800 12,350,859 3.30 Trip.com Group Ltd., ADR USD 321,291 10,682,926 2.86 Tsingtao Brewery Co. Ltd. ‘H’ HKD 540,000 5,654,968 1.51
167,051,443 44.65
Hong KongAlphamab Oncology, Reg. S HKD 729,000 1,530,602 0.41
1,530,602 0.41
IndiaHDFC Bank Ltd. INR 1,282,226 25,228,443 6.74 ICICI Bank Ltd., ADR USD 1,274,925 18,773,271 5.02 IndusInd Bank Ltd. INR 824,587 10,109,181 2.70 Kotak Mahindra Bank Ltd. INR 326,298 8,920,077 2.39
63,030,972 16.85
MexicoGrupo Aeroportuario del Sureste SAB
de CV ‘B’ MXN 142,300 2,302,535 0.62
2,302,535 0.62
South KoreaNAVER Corp. KRW 53,431 14,336,956 3.83
14,336,956 3.83

21 Morgan Stanley Investment Funds 31 December 2020
The accompanying notes are an integral part of these financial statements.
Developing Opportunity Fund (continued)
SCHEDULE OF INVESTMENTSAs at 31 December 2020
Investments Currency
Quantity/ Nominal
Value
Market Value USD
% of Net Assets
transferable securities and money market instruments admitted to official exchange listing or dealt in on another regulated market
Equities (continued)
TaiwanNien Made Enterprise Co. Ltd. TWD 214,000 2,480,939 0.66 Silergy Corp. TWD 73,000 6,256,401 1.67 Taiwan Semiconductor Manufacturing Co.
Ltd., ADR USD 161,725 17,636,111 4.72
26,373,451 7.05
United States of AmericaEPAM Systems, Inc. USD 40,313 14,400,207 3.85 MercadoLibre, Inc. USD 12,893 21,700,853 5.80
36,101,060 9.65
Total Equities 339,408,752 90.72
Total Transferable securities and money market instruments admitted to official exchange listing or dealt in on another regulated market 339,408,752 90.72
Units of authorised UCItS or other collective investment undertakings
Collective Investment Schemes – UCITS
LuxembourgMorgan Stanley Liquidity Funds US Dollar
Treasury Liquidity Fund – MS Reserve† USD 33,427,778 33,427,778 8.93
33,427,778 8.93
Total Collective Investment Schemes – UCITS 33,427,778 8.93
Total Units of authorised UCITS or other collective investment undertakings 33,427,778 8.93
Total Investments 372,836,530 99.65
Cash 2,852,548 0.76
Other Assets/(Liabilities) (1,547,549) (0.41)
Total Net Assets 374,141,529 100.00
† Managed by an affiliate of the Investment Adviser.The country disclosed within the Schedule of Investments refers to the country of risk. The country of incorporation may differ.
Forward Currency Exchange Contracts
Currency Purchased
Amount Purchased
Currency Sold
Amount Sold
Maturity Date Counterparty
Unrealised Gain/(Loss)
USD
% of Net Assets
USD 3,392 EUR 2,768 04/01/2021 J.P. Morgan (5) 0.00EUR 128 USD 157 05/01/2021 J.P. Morgan 0 0.00
Unrealised Loss on Forward Currency Exchange Contracts – Liabilities (5) 0.00
Total Unrealised Loss on Forward Currency Exchange Contracts – Liabilities (5) 0.00
Net Unrealised Loss on Forward Currency Exchange Contracts – Liabilities (5) 0.00
DERIVATIVES
Over-the-counter (OtC) and exchange traded derivatives as at 31 December 2020, expressed in US Dollars.

Morgan Stanley Investment Funds 31 December 2020 22
The accompanying notes are an integral part of these financial statements.
Please refer to the full prospectus for the Fund’s investment objective and policy.
SCHEDULE OF INVESTMENTSAs at 31 December 2020
Investments Currency
Quantity/ Nominal
Value
Market Value EUR
% of Net Assets
transferable securities and money market instruments admitted to official exchange listing or dealt in on another regulated market
Equities
HungaryRichter Gedeon Nyrt. HUF 90,912 1,857,552 3.03
1,857,552 3.03
Poland11 bit studios SA PLN 19,207 1,977,949 3.22 Allegro.eu SA, Reg. S PLN 154,436 2,868,244 4.67 Dino Polska SA, Reg. S PLN 39,284 2,476,374 4.03 Grupa Kety SA PLN 18,341 1,965,738 3.20 Jeronimo Martins SGPS SA EUR 90,704 1,253,529 2.04 LiveChat Software SA PLN 73,235 1,673,479 2.73 LPP SA PLN 1,470 2,642,585 4.31
14,857,898 24.20
RussiaLUKOIL PJSC, ADR USD 65,979 3,667,472 5.97 Novatek PJSC, Reg. S, GDR USD 26,037 3,467,526 5.65 Novolipetskiy Metallurgicheskiy Kombinat
PAO, Reg. S, GDR USD 135,249 3,057,857 4.98 Ozon Holdings plc USD 14,138 497,562 0.81 TCS Group Holding plc, Reg. S, GDR USD 109,854 2,945,699 4.80 X5 Retail Group NV, Reg. S, GDR USD 87,387 2,572,594 4.19 Yandex NV ‘A’ USD 51,486 2,899,639 4.72
19,108,349 31.12
SloveniaKrka dd Novo mesto EUR 21,506 1,965,870 3.20
1,965,870 3.20
South AfricaAnglo American Platinum Ltd. ZAR 6,180 496,112 0.81 Capitec Bank Holdings Ltd. ZAR 44,386 3,537,251 5.76 Clicks Group Ltd. ZAR 192,115 2,700,193 4.39 Northam Platinum Ltd. ZAR 278,656 3,247,838 5.29
9,981,394 16.25
United KingdomAnglo American plc ZAR 121,039 3,265,479 5.32 Avast plc, Reg. S GBP 439,448 2,629,608 4.28 Mondi plc ZAR 153,883 2,937,085 4.78
8,832,172 14.38
United States of AmericaEPAM Systems, Inc. USD 10,170 2,960,883 4.82
2,960,883 4.82
Total Equities 59,564,118 97.00
Total Transferable securities and money market instruments admitted to official exchange listing or dealt in on another regulated market 59,564,118 97.00
INVESTMENT AIM
To seek long-term capital appreciation, measured in Euro, by investing primarily in equity securities of issuers in Central, Eastern and Southern Europe (including the Russian Federation), the Middle East and Africa.
Emerging Europe, Middle East and Africa Equity Fund

23 Morgan Stanley Investment Funds 31 December 2020
The accompanying notes are an integral part of these financial statements.
(continued)
SCHEDULE OF INVESTMENTSAs at 31 December 2020
Investments Currency
Quantity/ Nominal
Value
Market Value EUR
% of Net Assets
Units of authorised UCItS or other collective investment undertakings
Collective Investment Schemes − UCITS
LuxembourgMorgan Stanley Liquidity Funds Euro
Liquidity Fund – MS Reserve† EUR 50,742 50,742 0.08 Morgan Stanley Liquidity Funds US Dollar
Liquidity Fund – MS Reserve† USD 1,389,845 1,389,845 2.27
1,440,587 2.35
Total Collective Investment Schemes − UCITS 1,440,587 2.35
Total Units of authorised UCITS or other collective investment undertakings 1,440,587 2.35
Total Investments 61,004,705 99.35
Cash 569,144 0.93
Other Assets/(Liabilities) (169,015) (0.28)
Total Net Assets 61,404,834 100.00
† Managed by an affiliate of the Investment Adviser.The country disclosed within the Schedule of Investments refers to the country of risk. The country of incorporation may differ.
Emerging Europe, Middle East and Africa Equity Fund (continued)
Forward Currency Exchange Contracts
Currency Purchased
Amount Purchased
Currency Sold
Amount Sold
Maturity Date Counterparty
Unrealised Gain/(Loss)
EUR
% of Net Assets
ZAR 3,763,365 USD 256,046 04/01/2021 State Street 655 0.00PLN 107,405 USD 28,821 05/01/2021 Citibank 61 0.00
Unrealised Gain on Forward Currency Exchange Contracts – Assets 716 0.00
Total Unrealised Gain on Forward Currency Exchange Contracts – Assets 716 0.00
PLN 8,133 USD 2,196 04/01/2021 State Street (6) 0.00ZAR 1,602,529 USD 109,681 05/01/2021 Citibank (251) 0.00
Unrealised Loss on Forward Currency Exchange Contracts – Liabilities (257) 0.00
Total Unrealised Loss on Forward Currency Exchange Contracts – Liabilities (257) 0.00
Net Unrealised Gain on Forward Currency Exchange Contracts – Assets 459 0.00
DERIVATIVES
Over-the-counter (OtC) and exchange traded derivatives as at 31 December 2020, expressed in euro.

Morgan Stanley Investment Funds 31 December 2020 24
The accompanying notes are an integral part of these financial statements.
Please refer to the full prospectus for the Fund’s investment objective and policy.
Emerging Leaders Equity Fund
SCHEDULE OF INVESTMENTSAs at 31 December 2020
Investments Currency
Quantity/Nominal
Value
Market Value USD
% of Net Assets
transferable securities and money market instruments admitted to official exchange listing or dealt in on another regulated market
Equities
BrazilPagseguro Digital Ltd. ‘A’ USD 571,441 31,886,408 3.26 StoneCo Ltd. ‘A’ USD 412,796 34,212,532 3.50
66,098,940 6.76
ChinaAgora, Inc., ADR USD 186,987 7,434,603 0.76 Alibaba Group Holding Ltd. HKD 1,594,700 47,837,565 4.89 Bilibili, Inc., ADR USD 30,460 2,728,302 0.28 Kingdee International Software Group Co. Ltd. HKD 6,346,000 25,862,322 2.64 Li Ning Co. Ltd. HKD 6,083,500 41,817,791 4.27 Meituan Dianping, Reg. S ‘B’ HKD 1,729,500 65,710,334 6.72 New Oriental Education & Technology
Group, Inc., ADR USD 73,498 13,175,986 1.35 Pinduoduo, Inc., ADR USD 178,595 31,686,325 3.24 Ping An Healthcare and Technology Co.
Ltd., Reg. S HKD 1,279,700 15,513,736 1.59 Tencent Holdings Ltd. HKD 816,600 59,397,593 6.07 Wuliangye Yibin Co. Ltd. ‘A’ CNY 494,611 22,099,576 2.26
333,264,133 34.07
GermanyDelivery Hero SE, Reg. S EUR 302,867 46,685,727 4.77 Global Fashion Group SA EUR 1,172,346 14,026,589 1.44
60,712,316 6.21
IndiaAarti Industries Ltd. INR 1,532,483 25,922,268 2.65 Apollo Hospitals Enterprise Ltd. INR 1,005,814 33,244,493 3.40 AU Small Finance Bank Ltd., Reg. S INR 1,941,474 22,675,539 2.32 Bajaj Finance Ltd. INR 623,815 45,250,032 4.62 HDFC Life Insurance Co. Ltd., Reg. S INR 1,664,890 15,428,868 1.58 Kotak Mahindra Bank Ltd. INR 1,283,472 35,086,545 3.59 PI Industries Ltd. INR 272,106 8,182,071 0.83 SRF Ltd. INR 129,082 9,856,110 1.01
195,645,926 20.00
PolandAllegro.eu SA, Reg. S PLN 253,420 5,774,731 0.59
5,774,731 0.59
SingaporeSea Ltd., ADR USD 363,509 70,924,241 7.25
70,924,241 7.25
TaiwanSilergy Corp. TWD 321,000 27,511,024 2.81 Taiwan Semiconductor Manufacturing
Co. Ltd. TWD 2,778,000 52,359,175 5.35 Voltronic Power Technology Corp. TWD 640,042 25,492,427 2.61
105,362,626 10.77
INVESTMENT AIM
To seek long-term capital appreciation, measured in US Dollars, through investment primarily in a concentrated portfolio of equity securities in emerging and frontier countries.

25 Morgan Stanley Investment Funds 31 December 2020
The accompanying notes are an integral part of these financial statements.
Emerging Leaders Equity Fund (continued)
Forward Currency Exchange Contracts
Currency Purchased
Amount Purchased
Currency Sold
Amount Sold
Maturity Date Counterparty
Unrealised Gain/(Loss)
USD
% of Net Assets
USD 148,703 EUR 121,024 05/01/2021 J.P. Morgan 213 0.00
Unrealised Gain on Forward Currency Exchange Contracts – Assets 213 0.00
EUR Hedged Share ClassEUR 174 USD 214 04/01/2021 J.P. Morgan 0 0.00USD 549,265 EUR 446,684 05/01/2021 J.P. Morgan 1,211 0.00EUR 90,986,471 USD 110,726,526 08/01/2021 J.P. Morgan 917,342 0.09
Unrealised Gain on NAV Hedged Share Classes Forward Currency Exchange Contracts – Assets 918,553 0.09
GBP Hedged Share ClassGBP 12,344,680 USD 16,582,292 08/01/2021 J.P. Morgan 280,203 0.03
Unrealised Gain on NAV Hedged Share Classes Forward Currency Exchange Contracts – Assets 280,203 0.03
Total Unrealised Gain on Forward Currency Exchange Contracts – Assets 1,198,969 0.12
USD 245,283 EUR 200,218 04/01/2021 J.P. Morgan (374) 0.00EUR 41,351 USD 50,808 05/01/2021 J.P. Morgan (73) 0.00
Unrealised Loss on Forward Currency Exchange Contracts – Liabilities (447) 0.00
EUR Hedged Share ClassUSD 1,185,678 EUR 966,480 04/01/2021 J.P. Morgan (135) 0.00EUR 446,684 USD 549,313 08/01/2021 J.P. Morgan (1,215) 0.00USD 152,120 EUR 124,453 08/01/2021 J.P. Morgan (589) 0.00
GBP Hedged Share ClassUSD 347 GBP 257 04/01/2021 J.P. Morgan (4) 0.00USD 236 GBP 174 05/01/2021 J.P. Morgan (1) 0.00USD 58,832 GBP 43,467 08/01/2021 J.P. Morgan (542) 0.00
USD Hedged Share ClassBRL 267,190 USD 52,245 29/01/2021 J.P. Morgan (812) 0.00
Unrealised Loss on NAV Hedged Share Classes Forward Currency Exchange Contracts – Liabilities (3,298) 0.00
Total Unrealised Loss on Forward Currency Exchange Contracts – Liabilities (3,745) 0.00
Net Unrealised Gain on Forward Currency Exchange Contracts – Assets 1,195,224 0.12
SCHEDULE OF INVESTMENTSAs at 31 December 2020
Investments Currency
Quantity/Nominal
Value
Market Value USD
% of Net Assets
transferable securities and money market instruments admitted to official exchange listing or dealt in on another regulated market
Equities (continued)
United States of AmericaAdvanced Micro Devices, Inc. USD 102,797 9,379,198 0.96 MercadoLibre, Inc. USD 37,309 62,796,643 6.42 NIKE, Inc. ‘B’ USD 207,516 29,386,341 3.00 NVIDIA Corp. USD 35,697 18,617,057 1.90
120,179,239 12.28
Total Equities 957,962,152 97.93
Total Transferable securities and money market instruments admitted to official exchange listing or dealt in on another regulated market 957,962,152 97.93
Units of authorised UCItS or other collective investment undertakings
Collective Investment Schemes − UCITS
LuxembourgMorgan Stanley Liquidity Funds US Dollar
Liquidity Fund – MS Reserve† USD 19,609,886 19,609,886 2.01
19,609,886 2.01
Total Collective Investment Schemes − UCITS 19,609,886 2.01
Total Units of authorised UCITS or other collective investment undertakings 19,609,886 2.01
Total Investments 977,572,038 99.94
Cash 12,225,970 1.25
Other Assets/(Liabilities) (11,627,177) (1.19)
Total Net Assets 978,170,831 100.00
† Managed by an affiliate of the Investment Adviser.The country disclosed within the Schedule of Investments refers to the country of risk. The country of incorporation may differ.
DERIVATIVES
Over-the-counter (OtC) and exchange traded derivatives as at 31 December 2020, expressed in US Dollars.

Morgan Stanley Investment Funds 31 December 2020 26
The accompanying notes are an integral part of these financial statements.
Please refer to the full prospectus for the Fund’s investment objective and policy.
SCHEDULE OF INVESTMENTSAs at 31 December 2020
Investments Currency
Quantity/ Nominal
Value
Market Value USD
% of Net Assets
transferable securities and money market instruments admitted to official exchange listing or dealt in on another regulated market
Equities
ArgentinaGlobant SA USD 36,561 7,886,208 1.03
7,886,208 1.03
BrazilHapvida Participacoes e Investimentos SA,
Reg. S BRL 2,770,170 8,128,988 1.06 Localiza Rent a Car SA BRL 532,594 7,057,078 0.92 Lojas Renner SA BRL 1,087,035 9,083,574 1.18 Pagseguro Digital Ltd. ‘A’ USD 177,804 9,921,463 1.29 Petroleo Brasileiro SA BRL 1,198,731 6,638,943 0.87 Petroleo Brasileiro SA Preference BRL 1,408,105 7,688,381 1.00 Rumo SA BRL 1,597,034 5,884,849 0.77
54,403,276 7.09
ChinaAlibaba Group Holding Ltd., ADR USD 26,264 6,194,364 0.81 Alibaba Group Holding Ltd. HKD 1,270,012 38,097,625 4.97 Anhui Conch Cement Co. Ltd. ‘A’ CNY 843,178 6,663,429 0.87 China Construction Bank Corp. ‘H’ HKD 13,446,166 10,213,959 1.33 China International Capital Corp. Ltd.,
Reg. S ‘H’ HKD 1,654,800 4,481,725 0.58 China Mengniu Dairy Co. Ltd. HKD 2,419,618 14,604,040 1.90 China Resources Beer Holdings Co. Ltd. HKD 1,848,000 17,016,904 2.22 China Resources Land Ltd. HKD 734,000 3,029,189 0.39 Hua Hong Semiconductor Ltd., Reg. S HKD 1,044,000 5,924,252 0.77 Jiangsu Hengrui Medicine Co. Ltd. ‘A’ CNY 256,432 4,375,742 0.57 Joincare Pharmaceutical Group Industry
Co. Ltd. ‘A’ CNY 1,081,100 2,302,255 0.30 Kweichow Moutai Co. Ltd. ‘A’ CNY 86,167 26,357,058 3.44 New Oriental Education & Technology
Group, Inc., ADR USD 57,801 10,361,985 1.35 Ping An Insurance Group Co. of China
Ltd. ‘A’ CNY 392,095 5,221,210 0.68 Ping An Insurance Group Co. of China
Ltd. ‘H’ HKD 307,500 3,767,464 0.49 Shandong Weigao Group Medical Polymer
Co. Ltd. ‘H’ HKD 1,240,000 2,801,794 0.37 Shenzhou International Group Holdings Ltd. HKD 584,800 11,463,872 1.49 TAL Education Group, ADR USD 81,039 5,823,463 0.76 Tencent Holdings Ltd. HKD 783,050 56,957,243 7.43 Universal Scientific Industrial Shanghai
Co. Ltd. ‘A’ CNY 1,266,410 3,749,655 0.49 Yihai International Holding Ltd. HKD 242,000 3,589,166 0.47
242,996,394 31.68
Germanyadidas AG EUR 24,899 9,039,592 1.18
9,039,592 1.18
HungaryRichter Gedeon Nyrt. HUF 317,959 7,971,029 1.04
7,971,029 1.04
INVESTMENT AIM
To seek to maximise total return, measured in US Dollars, through investment primarily in equity securities located in and or deriving a significant portion of earnings from emerging countries.
Emerging Markets Equity Fund

27 Morgan Stanley Investment Funds 31 December 2020
The accompanying notes are an integral part of these financial statements.
Emerging Markets Equity Fund (continued)
SCHEDULE OF INVESTMENTSAs at 31 December 2020
Investments Currency
Quantity/ Nominal
Value
Market Value USD
% of Net Assets
transferable securities and money market instruments admitted to official exchange listing or dealt in on another regulated market
Equities (continued)
IndiaBharti Airtel Ltd. INR 709,771 4,955,798 0.65 Eicher Motors Ltd. INR 84,296 2,922,555 0.38 HDFC Bank Ltd., ADR USD 91,592 6,579,969 0.86 Housing Development Finance Corp. Ltd. INR 296,197 10,381,790 1.35 ICICI Bank Ltd. INR 1,220,100 8,942,738 1.17 ICICI Prudential Life Insurance Co. Ltd.,
Reg. S INR 508,578 3,475,428 0.45 Infosys Ltd., ADR USD 143,680 2,438,250 0.32 Infosys Ltd. INR 361,507 6,218,962 0.81 Mahindra & Mahindra Ltd. INR 420,308 4,148,992 0.54 Marico Ltd. INR 324,957 1,792,398 0.24 Reliance Industries Ltd. INR 276,574 4,233,511 0.55 Reliance Industries Ltd. INR 206,849 5,625,489 0.73 Shree Cement Ltd. INR 9,396 3,090,820 0.40
64,806,700 8.45
IndonesiaBank Central Asia Tbk. PT IDR 4,036,000 9,678,672 1.26
9,678,672 1.26
MexicoGrupo Aeroportuario del Centro Norte SAB
de CV MXN 1,449,722 9,207,642 1.20
9,207,642 1.20
PolandAllegro.eu SA, Reg. S PLN 309,817 7,059,860 0.92 Jeronimo Martins SGPS SA EUR 224,326 3,803,741 0.50 LPP SA PLN 3,272 7,216,859 0.94
18,080,460 2.36
RussiaLUKOIL PJSC, ADR USD 100,464 6,851,645 0.89 Novatek PJSC, Reg. S, GDR USD 55,635 9,090,759 1.19 Novolipetskiy Metallurgicheskiy Kombinat
PAO, Reg. S, GDR USD 311,264 8,634,463 1.13 TCS Group Holding plc, Reg. S, GDR USD 259,631 8,541,860 1.11 X5 Retail Group NV, Reg. S, GDR EUR 32,609 1,197,084 0.16 X5 Retail Group NV, Reg. S, GDR USD 151,414 5,469,074 0.71 Yandex NV ‘A’ USD 168,165 11,620,201 1.51
51,405,086 6.70
SingaporeSea Ltd., ADR USD 49,749 9,706,527 1.27
9,706,527 1.27
SCHEDULE OF INVESTMENTSAs at 31 December 2020
Investments Currency
Quantity/ Nominal
Value
Market Value USD
% of Net Assets
transferable securities and money market instruments admitted to official exchange listing or dealt in on another regulated market
Equities (continued)
South AfricaAnglo American Platinum Ltd. ZAR 53,435 5,263,085 0.69 Capitec Bank Holdings Ltd. ZAR 104,888 10,255,787 1.34 Clicks Group Ltd. ZAR 478,392 8,249,748 1.07
23,768,620 3.10
South KoreaKakao Corp. KRW 20,101 7,182,204 0.94 LG Chem Ltd. KRW 5,040 3,808,701 0.50 NCSoft Corp. KRW 4,768 4,072,937 0.53 Samsung Biologics Co. Ltd., Reg. S KRW 5,617 4,255,373 0.55 Samsung Electronics Co. Ltd. KRW 754,814 56,086,631 7.31 Samsung SDI Co. Ltd. KRW 7,359 4,238,112 0.55
79,643,958 10.38
TaiwanASE Technology Holding Co. Ltd. TWD 3,104,439 8,975,494 1.17 Delta Electronics, Inc. TWD 1,011,000 9,455,654 1.23 MediaTek, Inc. TWD 416,000 11,050,925 1.44 Taiwan Semiconductor Manufacturing
Co. Ltd. TWD 3,927,639 74,027,335 9.65
103,509,408 13.49
United KingdomAnglo American plc ZAR 425,184 14,074,136 1.83 Avast plc, Reg. S GBP 1,494,374 10,971,505 1.43 Mondi plc ZAR 438,220 10,262,220 1.34
35,307,861 4.60
United States of AmericaASML Holding NV, NYRS USD 18,774 9,105,766 1.19 EPAM Systems, Inc. USD 21,424 7,652,867 1.00 MercadoLibre, Inc. USD 6,108 10,280,680 1.34
27,039,313 3.53
Total Equities 754,450,746 98.36
Total Transferable securities and money market instruments admitted to official exchange listing or dealt in on another regulated market 754,450,746 98.36

Morgan Stanley Investment Funds 31 December 2020 28
The accompanying notes are an integral part of these financial statements.
Emerging Markets Equity Fund (continued)
Forward Currency Exchange Contracts
Currency Purchased
Amount Purchased
Currency Sold
Amount Sold
Maturity Date Counterparty
Unrealised Gain/(Loss)
USD
% of Net Assets
EUR 2,006 USD 2,457 04/01/2021 J.P. Morgan 4 0.00GBP 68,500 USD 92,449 04/01/2021 J.P. Morgan 1,117 0.00ZAR 7,940,614 USD 540,252 04/01/2021 State Street 1,696 0.00PLN 264,383 USD 70,944 05/01/2021 Citibank 184 0.00
Unrealised Gain on Forward Currency Exchange Contracts – Assets 3,001 0.00
Total Unrealised Gain on Forward Currency Exchange Contracts – Assets 3,001 0.00
PLN 24,400 USD 6,588 04/01/2021 State Street (24) 0.00USD 370 EUR 302 04/01/2021 J.P. Morgan (1) 0.00USD 30,465 HUF 9,073,635 04/01/2021 State Street (148) 0.00EUR 31,969 USD 39,280 05/01/2021 J.P. Morgan (56) 0.00USD 53 GBP 39 05/01/2021 J.P. Morgan 0 0.00USD 247,436 HUF 73,565,731 05/01/2021 J.P. Morgan (762) 0.00ZAR 7,200,298 USD 492,804 05/01/2021 Citibank (1,383) 0.00
Unrealised Loss on Forward Currency Exchange Contracts – Liabilities (2,374) 0.00
Total Unrealised Loss on Forward Currency Exchange Contracts – Liabilities (2,374) 0.00
Net Unrealised Gain on Forward Currency Exchange Contracts – Assets 627 0.00
SCHEDULE OF INVESTMENTSAs at 31 December 2020
Investments Currency
Quantity/ Nominal
Value
Market Value USD
% of Net Assets
Other transferable securities and money market instruments not admitted to official exchange listing or dealt in on another regulated market
Equities
BrazilBanco Nacional SA Preference* BRL 30,754,160 0 0.00Lojas Arapua SA Preference* BRL 11,491,000 0 0.00
0 0.00
Total Equities 0 0.00
Total Other transferable securities and money market instruments not admitted to official exchange listing or dealt in on another regulated market 0 0.00
Units of authorised UCItS or other collective investment undertakings
Collective Investment Schemes − UCITS
LuxembourgMorgan Stanley Liquidity Funds US Dollar
Liquidity Fund – MS Reserve† USD 10,204,607 10,204,607 1.33
10,204,607 1.33
Total Collective Investment Schemes − UCITS 10,204,607 1.33
Total Units of authorised UCITS or other collective investment undertakings 10,204,607 1.33
Total Investments 764,655,353 99.69
Cash 3,937,314 0.51
Other Assets/(Liabilities) (1,557,720) (0.20)
Total Net Assets 767,034,947 100.00
* Security is valued at its fair value under the direction of the Board of Directors.† Managed by an affiliate of the Investment Adviser.The country disclosed within the Schedule of Investments refers to the country of risk. The country of incorporation may differ.
DERIVATIVES
Over-the-counter (OtC) and exchange traded derivatives as at 31 December 2020, expressed in US Dollars.
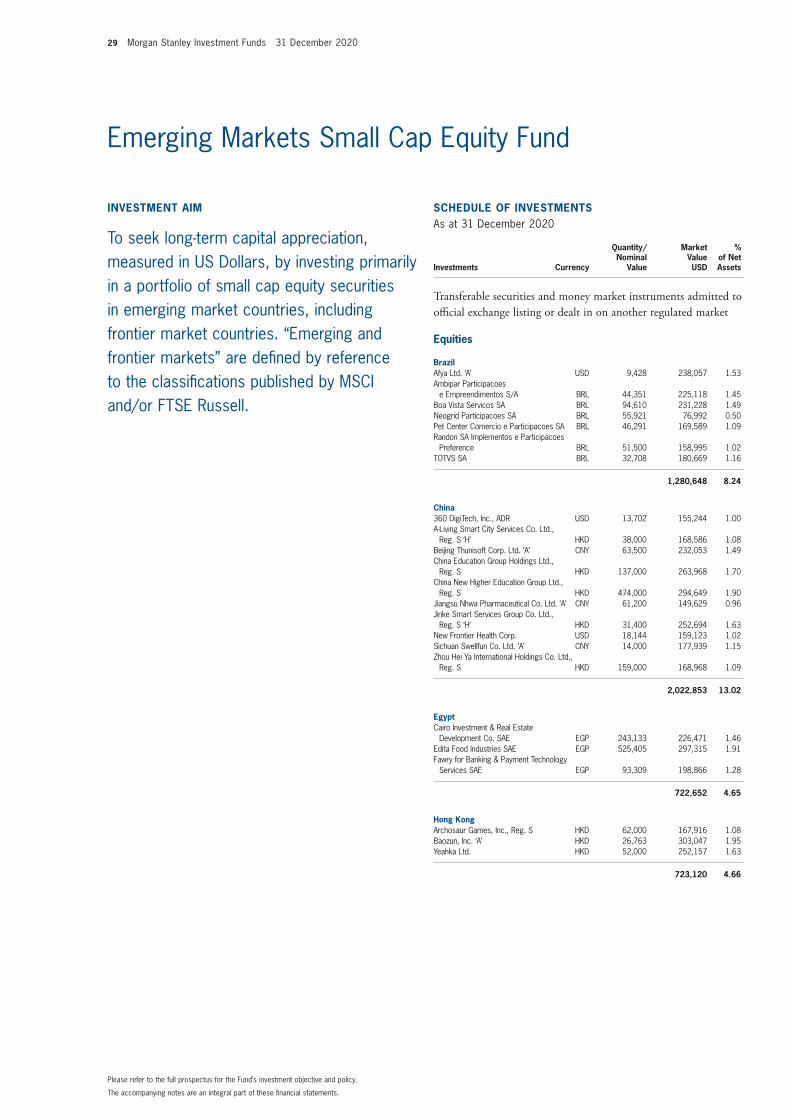
29 Morgan Stanley Investment Funds 31 December 2020
The accompanying notes are an integral part of these financial statements.
Please refer to the full prospectus for the Fund’s investment objective and policy.
INVESTMENT AIM
To seek long-term capital appreciation, measured in US Dollars, by investing primarily in a portfolio of small cap equity securities in emerging market countries, including frontier market countries. “Emerging and frontier markets” are defined by reference to the classifications published by MSCI and/or FTSE Russell.
SCHEDULE OF INVESTMENTSAs at 31 December 2020
Investments Currency
Quantity/Nominal
Value
Market Value USD
% of Net Assets
transferable securities and money market instruments admitted to official exchange listing or dealt in on another regulated market
Equities
BrazilAfya Ltd. ‘A’ USD 9,428 238,057 1.53 Ambipar Participacoes
e Empreendimentos S/A BRL 44,351 225,118 1.45 Boa Vista Servicos SA BRL 94,610 231,228 1.49 Neogrid Participacoes SA BRL 55,921 76,992 0.50 Pet Center Comercio e Participacoes SA BRL 46,291 169,589 1.09 Randon SA Implementos e Participacoes
Preference BRL 51,500 158,995 1.02 TOTVS SA BRL 32,708 180,669 1.16
1,280,648 8.24
China360 DigiTech, Inc., ADR USD 13,702 155,244 1.00 A-Living Smart City Services Co. Ltd.,
Reg. S ‘H’ HKD 38,000 168,586 1.08 Beijing Thunisoft Corp. Ltd. ‘A’ CNY 63,500 232,053 1.49 China Education Group Holdings Ltd.,
Reg. S HKD 137,000 263,968 1.70 China New Higher Education Group Ltd.,
Reg. S HKD 474,000 294,649 1.90 Jiangsu Nhwa Pharmaceutical Co. Ltd. ‘A’ CNY 61,200 149,629 0.96 Jinke Smart Services Group Co. Ltd.,
Reg. S ‘H’ HKD 31,400 252,694 1.63 New Frontier Health Corp. USD 18,144 159,123 1.02 Sichuan Swellfun Co. Ltd. ‘A’ CNY 14,000 177,939 1.15 Zhou Hei Ya International Holdings Co. Ltd.,
Reg. S HKD 159,000 168,968 1.09
2,022,853 13.02
EgyptCairo Investment & Real Estate
Development Co. SAE EGP 243,133 226,471 1.46 Edita Food Industries SAE EGP 525,405 297,315 1.91 Fawry for Banking & Payment Technology
Services SAE EGP 93,309 198,866 1.28
722,652 4.65
Hong KongArchosaur Games, Inc., Reg. S HKD 62,000 167,916 1.08 Baozun, Inc. ‘A’ HKD 26,763 303,047 1.95 Yeahka Ltd. HKD 52,000 252,157 1.63
723,120 4.66
Emerging Markets Small Cap Equity Fund

Morgan Stanley Investment Funds 31 December 2020 30
The accompanying notes are an integral part of these financial statements.
Emerging Markets Small Cap Equity Fund (continued)
SCHEDULE OF INVESTMENTSAs at 31 December 2020
Investments Currency
Quantity/Nominal
Value
Market Value USD
% of Net Assets
transferable securities and money market instruments admitted to official exchange listing or dealt in on another regulated market
Equities (continued)
IndiaBlue Star Ltd. INR 15,725 172,567 1.11 Can Fin Homes Ltd. INR 49,856 341,073 2.20 Cholamandalam Investment and Finance
Co. Ltd. INR 63,696 338,246 2.18 Dr Lal PathLabs Ltd., Reg. S INR 5,052 159,537 1.03 Gulf Oil Lubricants India Ltd. INR 14,085 138,748 0.89 Happiest Minds Technologies Ltd. INR 35,793 168,792 1.09 IndiaMart InterMesh Ltd., Reg. S INR 2,202 193,271 1.24 Info Edge India Ltd. INR 2,424 157,990 1.02 Spandana Sphoorty Financial Ltd. INR 23,248 239,058 1.54 SpiceJet Ltd. INR 109,915 142,966 0.92 Subros Ltd. INR 48,333 227,200 1.46 TCI Express Ltd. INR 14,271 181,018 1.17 Varun Beverages Ltd. INR 12,809 160,737 1.03
2,621,203 16.88
IndonesiaBank BTPN Syariah Tbk. PT IDR 861,500 228,803 1.47 Map Aktif Adiperkasa PT IDR 881,300 151,662 0.98 Mitra Keluarga Karyasehat Tbk. PT, Reg. S IDR 1,309,200 253,398 1.63 Nippon Indosari Corpindo Tbk. PT IDR 1,720,200 165,847 1.07
799,710 5.15
KazakhstanNAC Kazatomprom JSC, Reg. S, GDR USD 18,639 335,502 2.16
335,502 2.16
MexicoGrupo Aeroportuario del Centro Norte SAB
de CV MXN 26,071 165,585 1.07
165,585 1.07
PakistanMCB Bank Ltd. PKR 217,658 251,717 1.62
251,717 1.62
PhilippinesConverge ICT Solutions, Inc. PHP 682,700 211,745 1.36 Shakey’s Pizza Asia Ventures, Inc. PHP 1,497,500 239,745 1.55
451,490 2.91
SCHEDULE OF INVESTMENTSAs at 31 December 2020
Investments Currency
Quantity/Nominal
Value
Market Value USD
% of Net Assets
transferable securities and money market instruments admitted to official exchange listing or dealt in on another regulated market
Equities (continued)
Poland11 bit studios SA PLN 1,779 224,779 1.45 LiveChat Software SA PLN 6,320 177,191 1.14
401,970 2.59
RussiaDetsky Mir PJSC, Reg. S RUB 83,821 153,169 0.98 Ozon Holdings plc USD 3,945 170,345 1.10
323,514 2.08
South AfricaTransaction Capital Ltd. ZAR 116,486 197,880 1.27
197,880 1.27
South KoreaAfreecaTV Co. Ltd. KRW 5,851 324,874 2.09 Douzone Bizon Co. Ltd. KRW 1,599 152,618 0.98 Ezwel Co. Ltd. KRW 17,800 177,327 1.14 KINX, Inc. KRW 4,453 293,354 1.89 Nasmedia Co. Ltd. KRW 6,955 195,227 1.26 Settle Bank, Inc. KRW 7,890 240,028 1.55 Studio Dragon Corp. KRW 2,686 228,331 1.47 Webcash Corp. KRW 2,436 160,134 1.03
1,771,893 11.41
TaiwanAcer Cyber Security, Inc. TWD 43,128 219,321 1.41 ASPEED Technology, Inc. TWD 5,000 304,943 1.96 Chief Telecom, Inc. TWD 25,000 315,167 2.03 eCloudvalley Digital Technology Co. Ltd. TWD 38,777 234,427 1.51 Innodisk Corp. TWD 39,460 232,943 1.50 Merida Industry Co. Ltd. TWD 30,000 251,778 1.62 Poya International Co. Ltd. TWD 15,000 307,255 1.98 Sunny Friend Environmental Technology
Co. Ltd. TWD 39,000 323,151 2.08 Voltronic Power Technology Corp. TWD 5,250 209,104 1.35
2,398,089 15.44
ThailandSrisawad Corp. PCL THB 15,500 34,009 0.22 Srisawad Corp. PCL THB 61,800 135,390 0.87
169,399 1.09
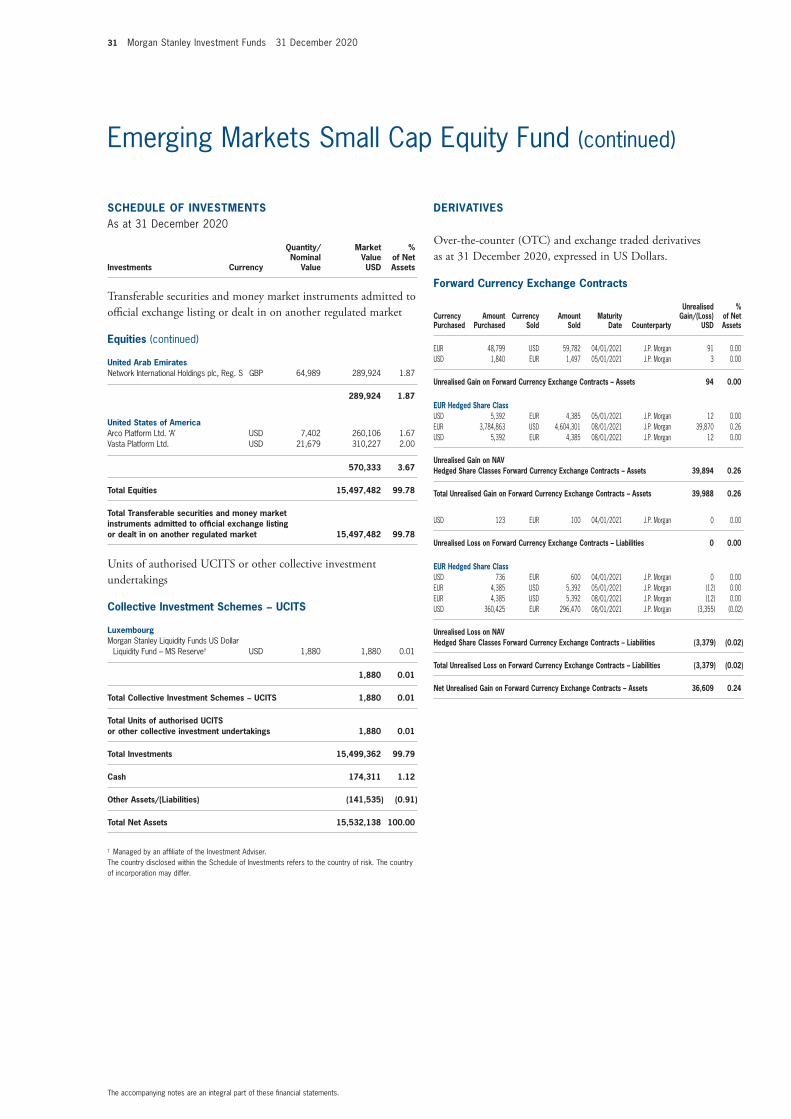
31 Morgan Stanley Investment Funds 31 December 2020
The accompanying notes are an integral part of these financial statements.
Emerging Markets Small Cap Equity Fund (continued)
SCHEDULE OF INVESTMENTSAs at 31 December 2020
Investments Currency
Quantity/Nominal
Value
Market Value USD
% of Net Assets
transferable securities and money market instruments admitted to official exchange listing or dealt in on another regulated market
Equities (continued)
United Arab EmiratesNetwork International Holdings plc, Reg. S GBP 64,989 289,924 1.87
289,924 1.87
United States of AmericaArco Platform Ltd. ‘A’ USD 7,402 260,106 1.67 Vasta Platform Ltd. USD 21,679 310,227 2.00
570,333 3.67
Total Equities 15,497,482 99.78
Total Transferable securities and money market instruments admitted to official exchange listing or dealt in on another regulated market 15,497,482 99.78
Units of authorised UCItS or other collective investment undertakings
Collective Investment Schemes − UCITS
LuxembourgMorgan Stanley Liquidity Funds US Dollar
Liquidity Fund – MS Reserve† USD 1,880 1,880 0.01
1,880 0.01
Total Collective Investment Schemes − UCITS 1,880 0.01
Total Units of authorised UCITS or other collective investment undertakings 1,880 0.01
Total Investments 15,499,362 99.79
Cash 174,311 1.12
Other Assets/(Liabilities) (141,535) (0.91)
Total Net Assets 15,532,138 100.00
† Managed by an affiliate of the Investment Adviser.The country disclosed within the Schedule of Investments refers to the country of risk. The country of incorporation may differ.
Forward Currency Exchange Contracts
Currency Purchased
Amount Purchased
Currency Sold
Amount Sold
Maturity Date Counterparty
Unrealised Gain/(Loss)
USD
% of Net Assets
EUR 48,799 USD 59,782 04/01/2021 J.P. Morgan 91 0.00USD 1,840 EUR 1,497 05/01/2021 J.P. Morgan 3 0.00
Unrealised Gain on Forward Currency Exchange Contracts – Assets 94 0.00
EUR Hedged Share ClassUSD 5,392 EUR 4,385 05/01/2021 J.P. Morgan 12 0.00EUR 3,784,863 USD 4,604,301 08/01/2021 J.P. Morgan 39,870 0.26 USD 5,392 EUR 4,385 08/01/2021 J.P. Morgan 12 0.00
Unrealised Gain on NAV Hedged Share Classes Forward Currency Exchange Contracts – Assets 39,894 0.26
Total Unrealised Gain on Forward Currency Exchange Contracts – Assets 39,988 0.26
USD 123 EUR 100 04/01/2021 J.P. Morgan 0 0.00
Unrealised Loss on Forward Currency Exchange Contracts – Liabilities 0 0.00
EUR Hedged Share ClassUSD 736 EUR 600 04/01/2021 J.P. Morgan 0 0.00EUR 4,385 USD 5,392 05/01/2021 J.P. Morgan (12) 0.00EUR 4,385 USD 5,392 08/01/2021 J.P. Morgan (12) 0.00USD 360,425 EUR 296,470 08/01/2021 J.P. Morgan (3,355) (0.02)
Unrealised Loss on NAV Hedged Share Classes Forward Currency Exchange Contracts – Liabilities (3,379) (0.02)
Total Unrealised Loss on Forward Currency Exchange Contracts – Liabilities (3,379) (0.02)
Net Unrealised Gain on Forward Currency Exchange Contracts – Assets 36,609 0.24
DERIVATIVES
Over-the-counter (OtC) and exchange traded derivatives as at 31 December 2020, expressed in US Dollars.

Morgan Stanley Investment Funds 31 December 2020 32
The accompanying notes are an integral part of these financial statements.
Please refer to the full prospectus for the Fund’s investment objective and policy.
INVESTMENT AIM
To seek long-term capital growth, measured in Euro, by investing primarily in equity securities, including depository receipts (American Depository Receipts (ADRs) and European Depository Receipts (EDRs)), of companies located in Europe.
SCHEDULE OF INVESTMENTSAs at 31 December 2020
Investments Currency
Quantity/ Nominal
Value
Market Value EUR
% of Net Assets
transferable securities and money market instruments admitted to official exchange listing or dealt in on another regulated market
Equities
DenmarkDSV PANALPINA A/S DKK 616,960 84,684,051 6.93
84,684,051 6.93
FranceDassault Systemes SE EUR 175,086 29,090,539 2.38 Hermes International EUR 63,019 55,431,512 4.53 Pernod Ricard SA EUR 160,105 25,104,464 2.05
109,626,515 8.96
Germanyadidas AG EUR 123,616 36,577,859 2.99 HelloFresh SE EUR 1,125,430 70,606,006 5.77 Puma SE EUR 468,906 42,975,938 3.52
150,159,803 12.28
ItalyDavide Campari-Milano NV EUR 4,055,703 37,766,512 3.09 Moncler SpA EUR 1,482,994 73,865,200 6.04
111,631,712 9.13
NetherlandsAdyen NV, Reg. S EUR 40,134 76,455,270 6.25 ASML Holding NV EUR 124,430 49,467,147 4.05 Just Eat Takeaway.com NV, Reg. S EUR 421,498 38,946,415 3.18
164,868,832 13.48
SwedenEvolution Gaming Group AB, Reg. S SEK 688,855 57,368,598 4.69 Vitrolife AB SEK 676,316 14,505,841 1.19
71,874,439 5.88
SwitzerlandChocoladefabriken Lindt & Spruengli AG CHF 314 25,553,388 2.09 Kuehne + Nagel International AG CHF 210,377 38,880,930 3.18 Straumann Holding AG CHF 43,089 40,874,485 3.34
105,308,803 8.61
United KingdomAbcam plc GBP 1,790,161 30,890,783 2.52 boohoo Group plc GBP 7,435,930 28,394,520 2.32 Diageo plc GBP 786,237 25,191,231 2.06 Fevertree Drinks plc GBP 811,249 22,822,570 1.87 Rightmove plc GBP 5,885,024 42,638,400 3.49
149,937,504 12.26
Europe Opportunity Fund
** Formerly known as European Champions Fund prior to 20 April 2020.
**

33 Morgan Stanley Investment Funds 31 December 2020
The accompanying notes are an integral part of these financial statements.
Europe Opportunity Fund (continued)
SCHEDULE OF INVESTMENTSAs at 31 December 2020
Investments Currency
Quantity/ Nominal
Value
Market Value EUR
% of Net Assets
transferable securities and money market instruments admitted to official exchange listing or dealt in on another regulated market
Equities (continued)
United States of AmericaEPAM Systems, Inc. USD 127,174 37,025,303 3.03 Farfetch Ltd. ‘A’ USD 1,447,659 75,147,443 6.14 Spotify Technology SA USD 244,968 63,728,738 5.21
175,901,484 14.38
Total Equities 1,123,993,143 91.91
Total Transferable securities and money market instruments admitted to official exchange listing or dealt in on another regulated market 1,123,993,143 91.91
Units of authorised UCItS or other collective investment undertakings
Collective Investment Schemes − UCITS
LuxembourgMorgan Stanley Liquidity Funds Euro
Liquidity Fund – MS Reserve† EUR 90,888,196 90,888,196 7.43
90,888,196 7.43
Total Collective Investment Schemes − UCITS 90,888,196 7.43
Total Units of authorised UCITS or other collective investment undertakings 90,888,196 7.43
Total Investments 1,214,881,339 99.34
Cash 696,151 0.06
Other Assets/(Liabilities) 7,429,470 0.60
Total Net Assets 1,223,006,960 100.00
† Managed by an affiliate of the Investment Adviser.The country disclosed within the Schedule of Investments refers to the country of risk. The country of incorporation may differ.
Forward Currency Exchange Contracts
Currency Purchased
Amount Purchased
Currency Sold
Amount Sold
Maturity Date Counterparty
Unrealised Gain/(Loss)
EUR
% of Net Assets
EUR 19,996 USD 24,496 04/01/2021 J.P. Morgan 31 0.00USD 5 EUR 4 04/01/2021 J.P. Morgan 0 0.00USD 150,482 EUR 122,472 05/01/2021 J.P. Morgan 176 0.00
Unrealised Gain on Forward Currency Exchange Contracts – Assets 207 0.00
USD Hedged Share ClassEUR 24,205 USD 29,695 04/01/2021 J.P. Morgan 3 0.00EUR 26,596 USD 32,499 08/01/2021 J.P. Morgan 110 0.00
Unrealised Gain on NAV Hedged Share Classes Forward Currency Exchange Contracts – Assets 113 0.00
Total Unrealised Gain on Forward Currency Exchange Contracts – Assets 320 0.00
USD 35,945 EUR 29,341 04/01/2021 J.P. Morgan (45) 0.00EUR 8,047 USD 9,887 05/01/2021 J.P. Morgan (12) 0.00
Unrealised Loss on Forward Currency Exchange Contracts – Liabilities (57) 0.00
USD Hedged Share ClassUSD 116,142,522 EUR 95,428,522 08/01/2021 J.P. Morgan (775,778) (0.06)
Unrealised Loss on NAV Hedged Share Classes Forward Currency Exchange Contracts – Liabilities (775,778) (0.06)
Total Unrealised Loss on Forward Currency Exchange Contracts – Liabilities (775,835) (0.06)
Net Unrealised Loss on Forward Currency Exchange Contracts – Liabilities (775,515) (0.06)
DERIVATIVES
Over-the-counter (OtC) and exchange traded derivatives as at 31 December 2020, expressed in euro.
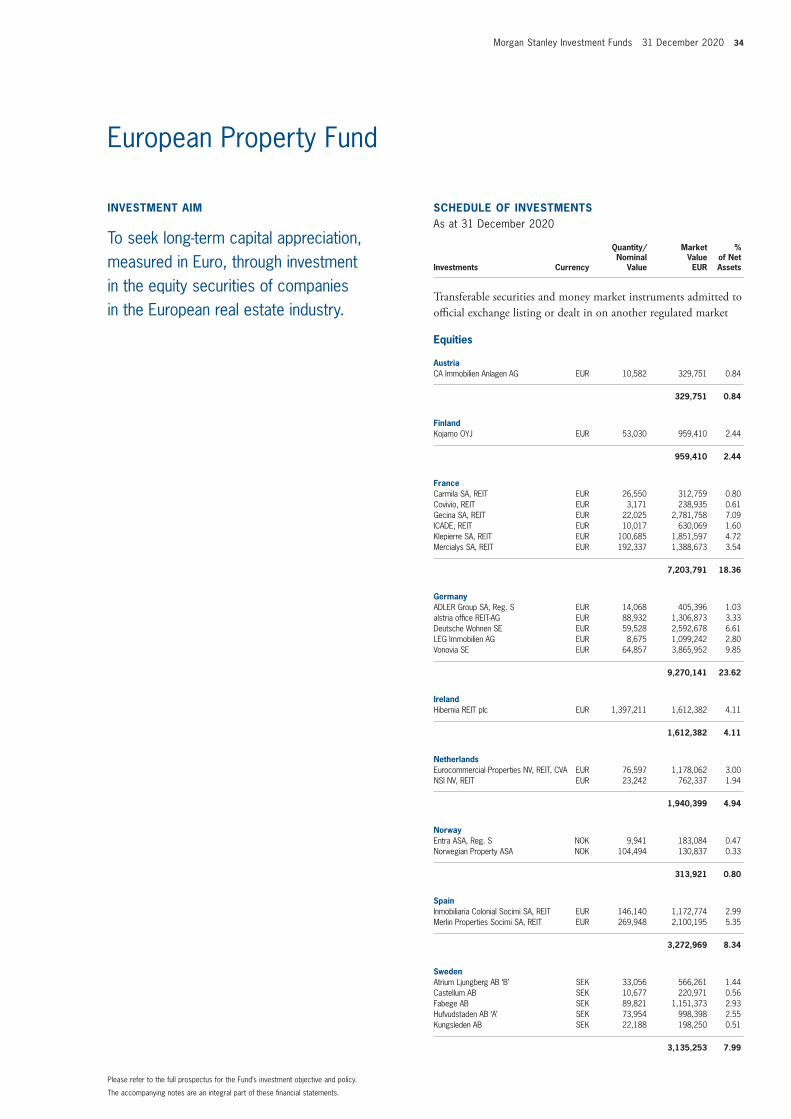
Morgan Stanley Investment Funds 31 December 2020 34
The accompanying notes are an integral part of these financial statements.
Please refer to the full prospectus for the Fund’s investment objective and policy.
INVESTMENT AIM
To seek long-term capital appreciation, measured in Euro, through investment in the equity securities of companies in the European real estate industry.
SCHEDULE OF INVESTMENTSAs at 31 December 2020
Investments Currency
Quantity/Nominal
Value
Market Value EUR
% of Net Assets
transferable securities and money market instruments admitted to official exchange listing or dealt in on another regulated market
Equities
AustriaCA Immobilien Anlagen AG EUR 10,582 329,751 0.84
329,751 0.84
FinlandKojamo OYJ EUR 53,030 959,410 2.44
959,410 2.44
FranceCarmila SA, REIT EUR 26,550 312,759 0.80 Covivio, REIT EUR 3,171 238,935 0.61 Gecina SA, REIT EUR 22,025 2,781,758 7.09 ICADE, REIT EUR 10,017 630,069 1.60 Klepierre SA, REIT EUR 100,685 1,851,597 4.72 Mercialys SA, REIT EUR 192,337 1,388,673 3.54
7,203,791 18.36
GermanyADLER Group SA, Reg. S EUR 14,068 405,396 1.03 alstria office REIT-AG EUR 88,932 1,306,873 3.33 Deutsche Wohnen SE EUR 59,528 2,592,678 6.61 LEG Immobilien AG EUR 8,675 1,099,242 2.80 Vonovia SE EUR 64,857 3,865,952 9.85
9,270,141 23.62
IrelandHibernia REIT plc EUR 1,397,211 1,612,382 4.11
1,612,382 4.11
NetherlandsEurocommercial Properties NV, REIT, CVA EUR 76,597 1,178,062 3.00 NSI NV, REIT EUR 23,242 762,337 1.94
1,940,399 4.94
NorwayEntra ASA, Reg. S NOK 9,941 183,084 0.47 Norwegian Property ASA NOK 104,494 130,837 0.33
313,921 0.80
SpainInmobiliaria Colonial Socimi SA, REIT EUR 146,140 1,172,774 2.99 Merlin Properties Socimi SA, REIT EUR 269,948 2,100,195 5.35
3,272,969 8.34
SwedenAtrium Ljungberg AB ‘B’ SEK 33,056 566,261 1.44 Castellum AB SEK 10,677 220,971 0.56 Fabege AB SEK 89,821 1,151,373 2.93 Hufvudstaden AB ‘A’ SEK 73,954 998,398 2.55 Kungsleden AB SEK 22,188 198,250 0.51
3,135,253 7.99
European Property Fund

35 Morgan Stanley Investment Funds 31 December 2020
The accompanying notes are an integral part of these financial statements.
European Property Fund (continued)
SCHEDULE OF INVESTMENTSAs at 31 December 2020
Investments Currency
Quantity/Nominal
Value
Market Value EUR
% of Net Assets
transferable securities and money market instruments admitted to official exchange listing or dealt in on another regulated market
Equities (continued)
SwitzerlandPSP Swiss Property AG CHF 10,019 1,091,161 2.78
1,091,161 2.78
United KingdomBritish Land Co. plc (The), REIT GBP 332,265 1,808,834 4.61 Capital & Counties Properties plc, REIT GBP 50,967 82,274 0.21 Derwent London plc, REIT GBP 26,353 908,314 2.31 Grainger plc GBP 90,732 286,465 0.73 Great Portland Estates plc, REIT GBP 108,494 806,840 2.06 Hammerson plc GBP 3,716,445 1,028,157 2.62 Helical plc GBP 16,496 68,592 0.17 Land Securities Group plc, REIT GBP 260,908 1,957,147 4.99 Segro plc, REIT GBP 86,744 915,102 2.33 St Modwen Properties plc GBP 121,926 542,952 1.38 Tritax Big Box REIT plc GBP 225,770 422,009 1.08 Urban & Civic plc, REIT GBP 76,983 294,821 0.75 Workspace Group plc, REIT GBP 16,855 144,298 0.37
9,265,805 23.61
Total Equities 38,394,983 97.83
Total Transferable securities and money market instruments admitted to official exchange listing or dealt in on another regulated market 38,394,983 97.83
Units of authorised UCItS or other collective investment undertakings
Collective Investment Schemes − UCITS
LuxembourgMorgan Stanley Liquidity Funds Euro
Liquidity Fund – MS Reserve† EUR 1,506,712 1,506,712 3.84
1,506,712 3.84
Total Collective Investment Schemes − UCITS 1,506,712 3.84
Total Units of authorised UCITS or other collective investment undertakings 1,506,712 3.84
Total Investments 39,901,695 101.67
Cash 377,170 0.96
Other Assets/(Liabilities) (1,032,941) (2.63)
Total Net Assets 39,245,924 100.00
† Managed by an affiliate of the Investment Adviser.The country disclosed within the Schedule of Investments refers to the country of risk. The country of incorporation may differ.
Forward Currency Exchange Contracts
Currency Purchased
Amount Purchased
Currency Sold
Amount Sold
Maturity Date Counterparty
Unrealised Gain/(Loss)
EUR
% of Net Assets
USD 926,184 EUR 756,022 04/01/2021 J.P. Morgan (1,149) 0.00
Unrealised Loss on Forward Currency Exchange Contracts – Liabilities (1,149) 0.00
USD Hedged Share ClassUSD 298,886 EUR 245,708 08/01/2021 J.P. Morgan (2,124) (0.01)
Unrealised Loss on NAV Hedged Share Classes Forward Currency Exchange Contracts – Liabilities (2,124) (0.01)
Total Unrealised Loss on Forward Currency Exchange Contracts – Liabilities (3,273) (0.01)
Net Unrealised Loss on Forward Currency Exchange Contracts – Liabilities (3,273) (0.01)
DERIVATIVES
Over-the-counter (OtC) and exchange traded derivatives as at 31 December 2020, expressed in euro.

Morgan Stanley Investment Funds 31 December 2020 36
The accompanying notes are an integral part of these financial statements.
Please refer to the full prospectus for the Fund’s investment objective and policy.
Global Active Factor Equity Fund
INVESTMENT AIM
To seek long-term capital appreciation, measured in US Dollars, through investment primarily in equity securities issued by mid to large capitalisation companies, including depositary receipts (such as American Depositary Receipts (ADRs) and Global Depositary Receipts (GDRs)) and closed-end Real Estate Investment Trusts (REITS), issued by companies worldwide.
SCHEDULE OF INVESTMENTSAs at 31 December 2020
Investments Currency
Quantity/ Nominal
Value
Market Value USD
% of Net Assets
transferable securities and money market instruments admitted to official exchange listing or dealt in on another regulated market
Equities
CanadaFranco-Nevada Corp. USD 1,512 191,344 1.45
191,344 1.45
ChinaAlibaba Group Holding Ltd., ADR USD 2,763 651,653 4.93 NetEase, Inc., ADR USD 2,340 223,704 1.69 Tencent Holdings Ltd. HKD 10,100 734,651 5.56
1,610,008 12.18
FranceLVMH Moet Hennessy Louis Vuitton SE EUR 1,060 664,454 5.02
664,454 5.02
IndiaHDFC Bank Ltd., ADR USD 6,337 455,250 3.44
455,250 3.44
IrelandCRH plc EUR 4,560 190,337 1.44
190,337 1.44
ItalyFerrari NV USD 2,863 654,367 4.95
654,367 4.95
JapanNippon Telegraph & Telephone Corp. JPY 4,800 123,012 0.93
123,012 0.93
SingaporeSea Ltd., ADR USD 770 150,235 1.14
150,235 1.14
TaiwanTaiwan Semiconductor Manufacturing Co.
Ltd., ADR USD 5,669 618,204 4.67
618,204 4.67
United KingdomDiageo plc GBP 8,677 341,106 2.58 Experian plc GBP 5,240 198,763 1.50 London Stock Exchange Group plc GBP 2,210 271,925 2.06 Ryanair Holdings plc EUR 7,891 157,377 1.19
969,171 7.33
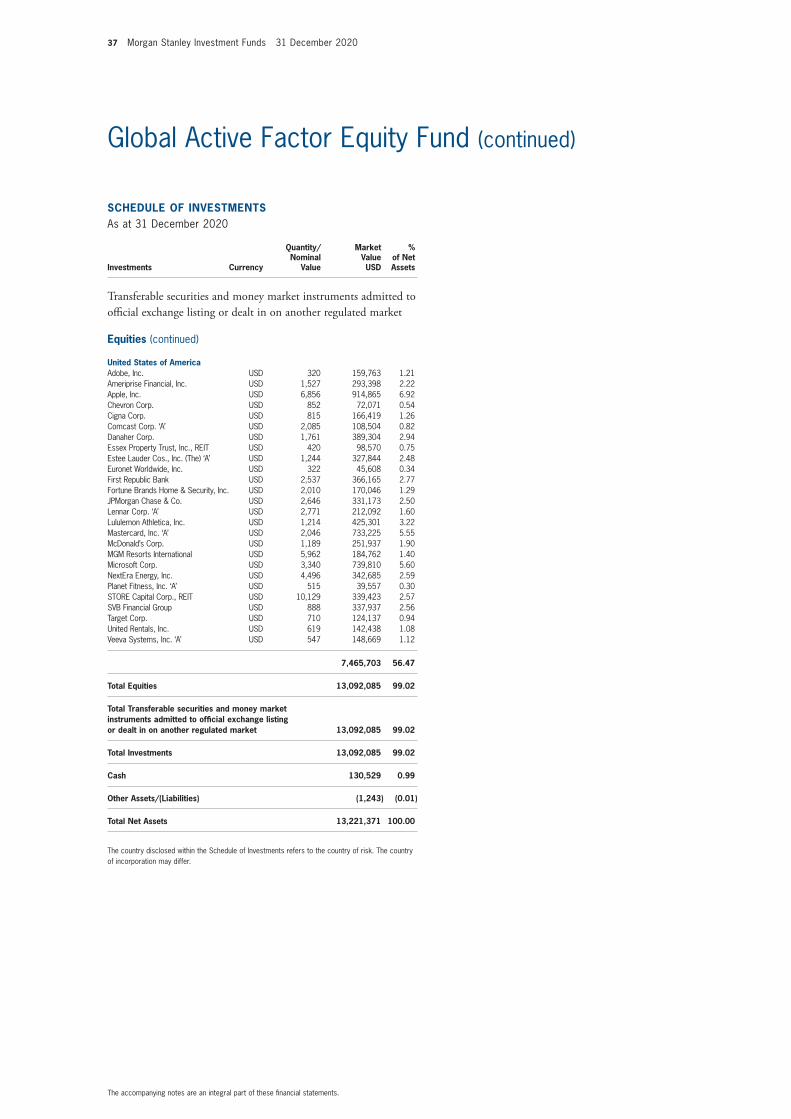
37 Morgan Stanley Investment Funds 31 December 2020
The accompanying notes are an integral part of these financial statements.
Global Active Factor Equity Fund (continued)
SCHEDULE OF INVESTMENTSAs at 31 December 2020
Investments Currency
Quantity/ Nominal
Value
Market Value USD
% of Net Assets
transferable securities and money market instruments admitted to official exchange listing or dealt in on another regulated market
Equities (continued)
United States of AmericaAdobe, Inc. USD 320 159,763 1.21 Ameriprise Financial, Inc. USD 1,527 293,398 2.22 Apple, Inc. USD 6,856 914,865 6.92 Chevron Corp. USD 852 72,071 0.54 Cigna Corp. USD 815 166,419 1.26 Comcast Corp. ‘A’ USD 2,085 108,504 0.82 Danaher Corp. USD 1,761 389,304 2.94 Essex Property Trust, Inc., REIT USD 420 98,570 0.75 Estee Lauder Cos., Inc. (The) ‘A’ USD 1,244 327,844 2.48 Euronet Worldwide, Inc. USD 322 45,608 0.34 First Republic Bank USD 2,537 366,165 2.77 Fortune Brands Home & Security, Inc. USD 2,010 170,046 1.29 JPMorgan Chase & Co. USD 2,646 331,173 2.50 Lennar Corp. ‘A’ USD 2,771 212,092 1.60 Lululemon Athletica, Inc. USD 1,214 425,301 3.22 Mastercard, Inc. ‘A’ USD 2,046 733,225 5.55 McDonald’s Corp. USD 1,189 251,937 1.90 MGM Resorts International USD 5,962 184,762 1.40 Microsoft Corp. USD 3,340 739,810 5.60 NextEra Energy, Inc. USD 4,496 342,685 2.59 Planet Fitness, Inc. ‘A’ USD 515 39,557 0.30 STORE Capital Corp., REIT USD 10,129 339,423 2.57 SVB Financial Group USD 888 337,937 2.56 Target Corp. USD 710 124,137 0.94 United Rentals, Inc. USD 619 142,438 1.08 Veeva Systems, Inc. ‘A’ USD 547 148,669 1.12
7,465,703 56.47
Total Equities 13,092,085 99.02
Total Transferable securities and money market instruments admitted to official exchange listing or dealt in on another regulated market 13,092,085 99.02
Total Investments 13,092,085 99.02
Cash 130,529 0.99
Other Assets/(Liabilities) (1,243) (0.01)
Total Net Assets 13,221,371 100.00
The country disclosed within the Schedule of Investments refers to the country of risk. The country of incorporation may differ.
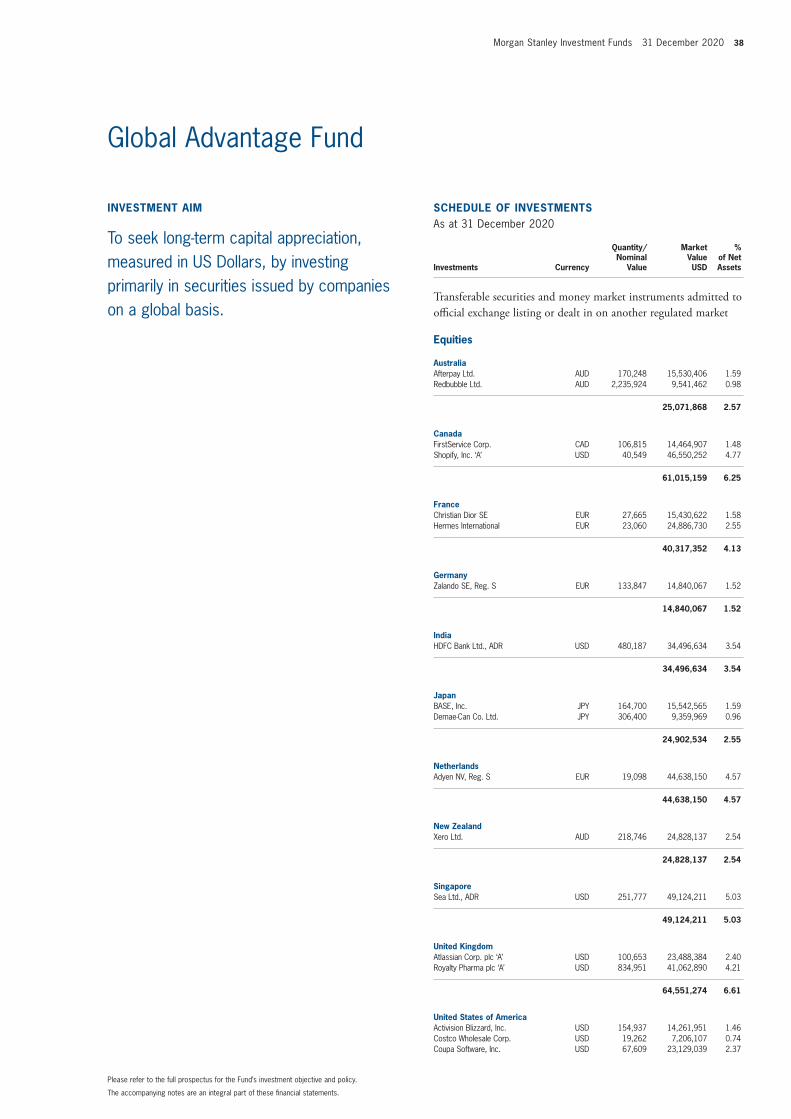
Morgan Stanley Investment Funds 31 December 2020 38
The accompanying notes are an integral part of these financial statements.
Please refer to the full prospectus for the Fund’s investment objective and policy.
INVESTMENT AIM
To seek long-term capital appreciation, measured in US Dollars, by investing primarily in securities issued by companies on a global basis.
SCHEDULE OF INVESTMENTSAs at 31 December 2020
Investments Currency
Quantity/Nominal
Value
Market Value USD
% of Net Assets
transferable securities and money market instruments admitted to official exchange listing or dealt in on another regulated market
Equities
AustraliaAfterpay Ltd. AUD 170,248 15,530,406 1.59 Redbubble Ltd. AUD 2,235,924 9,541,462 0.98
25,071,868 2.57
CanadaFirstService Corp. CAD 106,815 14,464,907 1.48 Shopify, Inc. ‘A’ USD 40,549 46,550,252 4.77
61,015,159 6.25
FranceChristian Dior SE EUR 27,665 15,430,622 1.58 Hermes International EUR 23,060 24,886,730 2.55
40,317,352 4.13
GermanyZalando SE, Reg. S EUR 133,847 14,840,067 1.52
14,840,067 1.52
IndiaHDFC Bank Ltd., ADR USD 480,187 34,496,634 3.54
34,496,634 3.54
JapanBASE, Inc. JPY 164,700 15,542,565 1.59 Demae-Can Co. Ltd. JPY 306,400 9,359,969 0.96
24,902,534 2.55
NetherlandsAdyen NV, Reg. S EUR 19,098 44,638,150 4.57
44,638,150 4.57
New ZealandXero Ltd. AUD 218,746 24,828,137 2.54
24,828,137 2.54
SingaporeSea Ltd., ADR USD 251,777 49,124,211 5.03
49,124,211 5.03
United KingdomAtlassian Corp. plc ‘A’ USD 100,653 23,488,384 2.40 Royalty Pharma plc ‘A’ USD 834,951 41,062,890 4.21
64,551,274 6.61
United States of AmericaActivision Blizzard, Inc. USD 154,937 14,261,951 1.46 Costco Wholesale Corp. USD 19,262 7,206,107 0.74 Coupa Software, Inc. USD 67,609 23,129,039 2.37
Global Advantage Fund

39 Morgan Stanley Investment Funds 31 December 2020
The accompanying notes are an integral part of these financial statements.
Global Advantage Fund (continued)
SCHEDULE OF INVESTMENTSAs at 31 December 2020
Investments Currency
Quantity/Nominal
Value
Market Value USD
% of Net Assets
transferable securities and money market instruments admitted to official exchange listing or dealt in on another regulated market
Equities (continued)
United States of America (continued)Ecolab, Inc. USD 59,576 12,917,268 1.32 Farfetch Ltd. ‘A’ USD 737,173 46,950,548 4.81 HEICO Corp. ‘A’ USD 97,566 11,451,321 1.17 IAC Corp. USD 31,882 6,031,118 0.62 Intercontinental Exchange, Inc. USD 50,966 5,789,738 0.59 Intuitive Surgical, Inc. USD 42,189 34,414,411 3.53 Martin Marietta Materials, Inc. USD 43,428 12,167,223 1.25 MercadoLibre, Inc. USD 27,696 46,616,522 4.78 Okta, Inc. USD 75,465 19,556,000 2.00 Royal Gold, Inc. USD 10,446 1,116,573 0.11 S&P Global, Inc. USD 30,128 9,803,952 1.00 Snowflake, Inc. ‘A’ USD 40,951 12,189,475 1.25 Spotify Technology SA USD 141,437 45,145,276 4.63 Square, Inc. ‘A’ USD 155,862 33,705,158 3.45 Texas Pacific Land Trust USD 2,692 1,938,240 0.20 Twilio, Inc. ‘A’ USD 67,865 23,450,072 2.40 Twitter, Inc. USD 634,116 34,197,876 3.50 Veeva Systems, Inc. ‘A’ USD 128,417 34,902,456 3.58 Zoom Video Communications, Inc. ‘A’ USD 62,965 21,628,478 2.22
458,568,802 46.98
Total Equities 842,354,188 86.29
Total Transferable securities and money market instruments admitted to official exchange listing or dealt in on another regulated market 842,354,188 86.29
Units of authorised UCItS or other collective investment undertakings
Collective Investment Schemes − UCITS
LuxembourgMorgan Stanley Liquidity Funds US Dollar
Treasury Liquidity Fund – MS Reserve† USD 87,349,653 87,349,653 8.95
87,349,653 8.95
Total Collective Investment Schemes − UCITS 87,349,653 8.95
Total Units of authorised UCITS or other collective investment undertakings 87,349,653 8.95
Total Investments 929,703,841 95.24
Cash 37,489,980 3.84
Other Assets/(Liabilities) 8,979,287 0.92
Total Net Assets 976,173,108 100.00
† Managed by an affiliate of the Investment Adviser.The country disclosed within the Schedule of Investments refers to the country of risk. The country of incorporation may differ.
Option Purchased Contracts
Quantity Security Description Currency Counterparty
Market Value USD
% of Net Assets
125,191,682 Foreign Exchange USD/CNH, Call, 7.641, 11/11/2021 USD BNP Paribas 352,080 0.03
63,777,170 Foreign Exchange USD/CNH, Call, 7.746, 07/01/2021 USD NatWest Markets 1 0.00
94,408,489 Foreign Exchange USD/CNH, Call, 7.995, 10/09/2021 USD BNP Paribas 93,792 0.01
98,939,480 Foreign Exchange USD/CNH, Call, 8.060, 23/07/2021 USD NatWest Markets 62,480 0.01
56,343,320 Foreign Exchange USD/CNH, Call, 8.485, 28/05/2021 USD NatWest Markets 7,762 0.00
Total Market Value on Option Purchased Contracts – Assets 516,115 0.05
Forward Currency Exchange Contracts
Currency Purchased
Amount Purchased
Currency Sold
Amount Sold
Maturity Date Counterparty
Unrealised Gain/(Loss)
USD
% of Net Assets
USD 1,347,469 EUR 1,096,659 05/01/2021 J.P. Morgan 1,935 0.00
Unrealised Gain on Forward Currency Exchange Contracts – Assets 1,935 0.00
EUR Hedged Share ClassUSD 942,194 EUR 766,229 05/01/2021 J.P. Morgan 2,076 0.00EUR 39,699,635 USD 48,342,269 08/01/2021 J.P. Morgan 370,696 0.04
Unrealised Gain on NAV Hedged Share Classes Forward Currency Exchange Contracts – Assets 372,772 0.04
Total Unrealised Gain on Forward Currency Exchange Contracts – Assets 374,707 0.04
USD 1,253,129 EUR 1,022,900 04/01/2021 J.P. Morgan (1,907) 0.00
Unrealised Loss on Forward Currency Exchange Contracts – Liabilities (1,907) 0.00
EUR Hedged Share ClassUSD 260,094 EUR 212,010 04/01/2021 J.P. Morgan (30) 0.00EUR 766,229 USD 942,276 08/01/2021 J.P. Morgan (2,084) 0.00USD 19,312 EUR 15,871 08/01/2021 J.P. Morgan (162) 0.00
Unrealised Loss on NAV Hedged Share Classes Forward Currency Exchange Contracts – Liabilities (2,276) 0.00
Total Unrealised Loss on Forward Currency Exchange Contracts – Liabilities (4,183) 0.00
Net Unrealised Gain on Forward Currency Exchange Contracts – Assets 370,524 0.04
Collateral received and paid by the Fund in respect of financial derivative instruments:
Type of Collateral Counterparty Currency Amount received Amount paid
Global Advantage Fund
Cash BNP Paribas USD 500,000 –NatWest USD 190,000 –
690,000 –
DERIVATIVES
Over-the-counter (OtC) and exchange traded derivatives as at 31 December 2020, expressed in US Dollars.

Morgan Stanley Investment Funds 31 December 2020 40
The accompanying notes are an integral part of these financial statements.
Please refer to the full prospectus for the Fund’s investment objective and policy.
INVESTMENT AIM
To seek an attractive long-term rate of return, measured in US Dollars, through investment primarily in equity securities of companies in the world’s developed countries, by investing in a concentrated portfolio of companies whose success the Company believes depends on intangible assets (for example, but not limited to, brand names, copyrights or methods of distribution) underpinning a strong business franchise.
SCHEDULE OF INVESTMENTSAs at 31 December 2020
Investments Currency
Quantity/Nominal
Value
Market Value USD
% of Net Assets
transferable securities and money market instruments admitted to official exchange listing or dealt in on another regulated market
Equities
FranceL’Oreal SA EUR 1,302,159 496,556,123 2.50 LVMH Moet Hennessy Louis Vuitton SE EUR 537,723 337,068,238 1.70 Pernod Ricard SA EUR 1,617,289 311,140,830 1.57
1,144,765,191 5.77
GermanySAP SE EUR 6,718,691 875,679,343 4.41
875,679,343 4.41
ItalyDavide Campari-Milano NV EUR 9,171,049 104,781,125 0.53
104,781,125 0.53
NetherlandsHeineken NV EUR 4,214,027 471,640,071 2.38
471,640,071 2.38
United KingdomBritish American Tobacco plc GBP 12,742,805 471,348,505 2.38 Experian plc GBP 4,799,442 182,051,836 0.92 Reckitt Benckiser Group plc GBP 17,742,568 1,585,460,602 7.99 RELX plc EUR 6,737,873 165,587,323 0.83 RELX plc GBP 17,299,923 423,576,415 2.13 Unilever plc GBP 5,816,518 348,942,481 1.76
3,176,967,162 16.01
United States of AmericaAbbott Laboratories USD 7,072,448 765,592,496 3.86 Accenture plc ‘A’ USD 3,686,684 953,671,417 4.81 Automatic Data Processing, Inc. USD 4,422,452 770,700,710 3.88 Baxter International, Inc. USD 10,038,616 798,270,744 4.02 Becton Dickinson and Co. USD 2,936,362 728,100,322 3.67 Coca-Cola Co. (The) USD 7,123,460 388,371,039 1.96 Danaher Corp. USD 3,577,052 790,778,886 3.99 FactSet Research Systems, Inc. USD 386,702 128,083,436 0.65 Fidelity National Information Services, Inc. USD 3,403,035 479,691,814 2.42 Fox Corp. ‘A’ USD 4,079,785 119,619,296 0.60 Fox Corp. ‘B’ USD 3,131,328 90,683,259 0.46 Intercontinental Exchange, Inc. USD 4,887,015 555,164,904 2.80 Microsoft Corp. USD 7,668,645 1,698,604,868 8.56 Moody’s Corp. USD 738,286 212,449,179 1.07 NIKE, Inc. ‘B’ USD 2,357,051 333,781,992 1.68 Philip Morris International, Inc. USD 18,887,998 1,543,338,317 7.78 Procter & Gamble Co. (The) USD 6,648,110 918,170,472 4.63 Roper Technologies, Inc. USD 416,712 176,469,198 0.89 Thermo Fisher Scientific, Inc. USD 1,542,203 711,880,905 3.59 Visa, Inc. ‘A’ USD 5,045,908 1,105,861,197 5.57 Zoetis, Inc. USD 1,753,306 286,753,196 1.44
13,556,037,647 68.33
Total Equities 19,329,870,539 97.43
Total Transferable securities and money market instruments admitted to official exchange listing or dealt in on another regulated market 19,329,870,539 97.43
Global Brands Fund

41 Morgan Stanley Investment Funds 31 December 2020
The accompanying notes are an integral part of these financial statements.
Global Brands Fund (continued)
Forward Currency Exchange Contracts
Currency Purchased
Amount Purchased
Currency Sold
Amount Sold
Maturity Date Counterparty
Unrealised Gain/(Loss)
USD
% of Net Assets
EUR 22,422 USD 27,469 04/01/2021 J.P. Morgan 42 0.00GBP 1,522 USD 2,071 05/01/2021 J.P. Morgan 8 0.00USD 392,517 EUR 319,456 05/01/2021 J.P. Morgan 563 0.00
Unrealised Gain on Forward Currency Exchange Contracts – Assets 613 0.00
CHF Hedged Share ClassCHF 83,958,124 USD 94,839,874 08/01/2021 J.P. Morgan 521,365 0.00
Unrealised Gain on NAV Hedged Share Classes Forward Currency Exchange Contracts – Assets 521,365 0.00
EUR Hedged Share ClassEUR 287,010 USD 352,104 04/01/2021 J.P. Morgan 40 0.00USD 3,076,812 EUR 2,502,185 05/01/2021 J.P. Morgan 6,781 0.00EUR 3,808,731,513 USD 4,633,221,923 08/01/2021 J.P. Morgan 40,236,797 0.21 USD 271,440 EUR 220,727 08/01/2021 J.P. Morgan 600 0.00
Unrealised Gain on NAV Hedged Share Classes Forward Currency Exchange Contracts – Assets 40,244,218 0.21
GBP Hedged Share ClassGBP 1,507 USD 2,050 05/01/2021 J.P. Morgan 8 0.00GBP 282,207,311 USD 379,084,257 08/01/2021 J.P. Morgan 6,403,201 0.03
Unrealised Gain on NAV Hedged Share Classes Forward Currency Exchange Contracts – Assets 6,403,209 0.03
USD Hedged Share ClassBRL 4,417,654 USD 850,000 29/01/2021 J.P. Morgan 377 0.00
Unrealised Gain on NAV Hedged Share Classes Forward Currency Exchange Contracts – Assets 377 0.00
Total Unrealised Gain on Forward Currency Exchange Contracts – Assets 47,169,782 0.24
USD 1,574,962 EUR 1,285,604 04/01/2021 J.P. Morgan (2,397) 0.00EUR 179,436 USD 220,474 05/01/2021 J.P. Morgan (317) 0.00
Unrealised Loss on Forward Currency Exchange Contracts – Liabilities (2,714) 0.00
CHF Hedged Share ClassUSD 154,573 CHF 136,611 04/01/2021 J.P. Morgan (577) 0.00USD 317,172 CHF 279,999 05/01/2021 J.P. Morgan (825) 0.00USD 260,458 CHF 230,894 08/01/2021 J.P. Morgan (1,796) 0.00
EUR Hedged Share ClassUSD 3,970,092 EUR 3,236,136 04/01/2021 J.P. Morgan (453) 0.00EUR 220,727 USD 271,416 05/01/2021 J.P. Morgan (598) 0.00EUR 2,502,185 USD 3,077,082 08/01/2021 J.P. Morgan (6,806) 0.00USD 8,104,903 EUR 6,633,301 08/01/2021 J.P. Morgan (34,411) 0.00
GBP Hedged Share ClassUSD 10,967 GBP 8,123 04/01/2021 J.P. Morgan (128) 0.00USD 4,520,222 GBP 3,340,232 08/01/2021 J.P. Morgan (42,443) 0.00
USD Hedged Share ClassBRL 112,059,974 USD 21,903,518 29/01/2021 J.P. Morgan (332,515) 0.00
Unrealised Loss on NAV Hedged Share Classes Forward Currency Exchange Contracts – Liabilities (420,552) 0.00
Total Unrealised Loss on Forward Currency Exchange Contracts – Liabilities (423,266) 0.00
Net Unrealised Gain on Forward Currency Exchange Contracts – Assets 46,746,516 0.24
SCHEDULE OF INVESTMENTSAs at 31 December 2020
Investments Currency
Quantity/Nominal
Value
Market Value USD
% of Net Assets
Units of authorised UCItS or other collective investment undertakings
Collective Investment Schemes − UCITS
LuxembourgMorgan Stanley Liquidity Funds US Dollar
Treasury Liquidity Fund – MS Reserve† USD 420,676,573 420,676,573 2.12
420,676,573 2.12
Total Collective Investment Schemes – UCITS 420,676,573 2.12
Total Units of authorised UCITS or other collective investment undertakings 420,676,573 2.12
Total Investments 19,750,547,112 99.55
Cash 2,947,888 0.01
Other Assets/(Liabilities) 87,106,578 0.44
Total Net Assets 19,840,601,578 100.00
† Managed by an affiliate of the Investment Adviser.The country disclosed within the Schedule of Investments refers to the country of risk. The country of incorporation may differ.
DERIVATIVES
Over-the-counter (OtC) and exchange traded derivatives as at 31 December 2020, expressed in US Dollars.

Morgan Stanley Investment Funds 31 December 2020 42
The accompanying notes are an integral part of these financial statements.
Please refer to the full prospectus for the Fund’s investment objective and policy.
SCHEDULE OF INVESTMENTSAs at 31 December 2020
Investments Currency
Quantity/ Nominal
Value
Market Value USD
% of Net Assets
transferable securities and money market instruments admitted to official exchange listing or dealt in on another regulated market
Equities
FranceL’Oreal SA EUR 31,098 11,858,692 2.51 LVMH Moet Hennessy Louis Vuitton SE EUR 12,942 8,112,610 1.71 Pernod Ricard SA EUR 38,219 7,352,731 1.55
27,324,033 5.77
GermanySAP SE EUR 161,028 20,987,555 4.44
20,987,555 4.44
ItalyDavide Campari-Milano NV EUR 219,883 2,512,209 0.53
2,512,209 0.53
NetherlandsHeineken NV EUR 101,335 11,341,562 2.40
11,341,562 2.40
United KingdomBritish American Tobacco plc GBP 305,575 11,303,031 2.39 Experian plc GBP 114,433 4,340,658 0.92 Reckitt Benckiser Group plc GBP 425,000 37,977,634 8.02 RELX plc EUR 161,588 3,971,123 0.84 RELX plc GBP 414,879 10,158,020 2.14 Unilever plc GBP 137,876 8,271,408 1.75
76,021,874 16.06
United States of AmericaAbbott Laboratories USD 168,328 18,221,506 3.85 Accenture plc ‘A’ USD 88,512 22,896,284 4.84 Automatic Data Processing, Inc. USD 105,616 18,405,700 3.89 Baxter International, Inc. USD 241,198 19,180,065 4.05 Becton Dickinson and Co. USD 70,544 17,492,090 3.70 Coca-Cola Co. (The) USD 170,250 9,282,030 1.96 Danaher Corp. USD 85,425 18,884,905 3.99 FactSet Research Systems, Inc. USD 9,227 3,056,167 0.65 Fidelity National Information Services, Inc. USD 81,589 11,500,786 2.43 Fox Corp. ‘A’ USD 97,780 2,866,910 0.61 Fox Corp. ‘B’ USD 75,121 2,175,504 0.46 Intercontinental Exchange, Inc. USD 116,064 13,184,870 2.79 Microsoft Corp. USD 183,660 40,680,690 8.60 Moody’s Corp. USD 17,700 5,093,352 1.08 NIKE, Inc. ‘B’ USD 56,633 8,019,799 1.69 Philip Morris International, Inc. USD 452,566 36,979,168 7.81 Procter & Gamble Co. (The) USD 158,608 21,905,351 4.63 Roper Technologies, Inc. USD 9,661 4,091,240 0.86 Thermo Fisher Scientific, Inc. USD 36,707 16,943,951 3.58 Visa, Inc. ‘A’ USD 121,018 26,522,305 5.60 Zoetis, Inc. USD 42,200 6,901,810 1.46
324,284,483 68.53
Total Equities 462,471,716 97.73
Total Transferable securities and money market instruments admitted to official exchange listing or dealt in on another regulated market 462,471,716 97.73
INVESTMENT AIM
To provide regular income and an attractive rate of return, measured in US Dollars, by investing primarily in equity securities of issuers located in the world’s developed markets.The Fund may make use of exchange traded and over-the-counter options, futures and other derivatives for investment or efficient portfolio management (including hedging) purposes.
Global Brands Equity Income Fund

43 Morgan Stanley Investment Funds 31 December 2020
The accompanying notes are an integral part of these financial statements.
Global Brands Equity Income Fund (continued)
Forward Currency Exchange Contracts
Currency Purchased
Amount Purchased
Currency Sold
Amount Sold
Maturity Date Counterparty
Unrealised Gain/(Loss)
USD
% of Net Assets
USD 115,351 EUR 93,880 05/01/2021 J.P. Morgan 166 0.00
Unrealised Gain on Forward Currency Exchange Contracts – Assets 166 0.00
CHF Hedged Share ClassCHF 17,315,461 USD 19,559,481 08/01/2021 J.P. Morgan 107,749 0.02
Unrealised Gain on NAV Hedged Share Classes Forward Currency Exchange Contracts – Assets 107,749 0.02
EUR Hedged Share ClassUSD 97,482 EUR 79,276 05/01/2021 J.P. Morgan 215 0.00EUR 139,839,400 USD 170,292,187 08/01/2021 J.P. Morgan 1,296,086 0.28 USD 231,032 EUR 187,868 08/01/2021 J.P. Morgan 511 0.00
Unrealised Gain on NAV Hedged Share Classes Forward Currency Exchange Contracts – Assets 1,296,812 0.28
GBP Hedged Share ClassGBP 564,668 USD 758,505 08/01/2021 J.P. Morgan 12,817 0.00
Unrealised Gain on NAV Hedged Share Classes Forward Currency Exchange Contracts – Assets 12,817 0.00
Total Unrealised Gain on Forward Currency Exchange Contracts – Assets 1,417,544 0.30
USD 20,419 EUR 16,668 04/01/2021 J.P. Morgan (31) 0.00
Unrealised Loss on Forward Currency Exchange Contracts – Liabilities (31) 0.00
EUR Hedged Share ClassUSD 216,336 EUR 176,342 04/01/2021 J.P. Morgan (25) 0.00EUR 187,868 USD 231,012 05/01/2021 J.P. Morgan (509) 0.00EUR 79,276 USD 97,491 08/01/2021 J.P. Morgan (215) 0.00USD 635,481 EUR 520,605 08/01/2021 J.P. Morgan (3,322) 0.00
Unrealised Loss on NAV Hedged Share Classes Forward Currency Exchange Contracts – Liabilities (4,071) 0.00
Total Unrealised Loss on Forward Currency Exchange Contracts – Liabilities (4,102) 0.00
Net Unrealised Gain on Forward Currency Exchange Contracts – Assets 1,413,442 0.30
SCHEDULE OF INVESTMENTSAs at 31 December 2020
Investments Currency
Quantity/ Nominal
Value
Market Value USD
% of Net Assets
Units of authorised UCItS or other collective investment undertakings
Collective Investment Schemes – UCITS
LuxembourgMorgan Stanley Liquidity Funds US Dollar
Treasury Liquidity Fund – MS Reserve† USD 8,850,123 8,850,123 1.87
8,850,123 1.87
Total Collective Investment Schemes – UCITS 8,850,123 1.87
Total Units of authorised UCITS or other collective investment undertakings 8,850,123 1.87
Total Investments 471,321,839 99.60
Cash 316,636 0.07
Other Assets/(Liabilities) 1,599,111 0.33
Total Net Assets 473,237,586 100.00
† Managed by an affiliate of the Investment Adviser.The country disclosed within the Schedule of Investments refers to the country of risk. The country of incorporation may differ.
DERIVATIVES
Over-the-counter (OtC) and exchange traded derivatives as at 31 December 2020, expressed in US Dollars.

Morgan Stanley Investment Funds 31 December 2020 44
The accompanying notes are an integral part of these financial statements.
Global Brands Equity Income Fund (continued)
Total Return Swap Contracts
Nominal Amount Ccy Security Description
Maturity Date Counterparty
Unrealised Gain/(Loss)
USD
% of Net Assets
96,442,670 USD Receive Morgan Stanley 1% Yield Global Overwriting (Even Months) Strategy
Pay a fixed charge of 0% 30/04/2021 Morgan Stanley (97,096) (0.02) 94,616,733 USD Receive Morgan Stanley 1% Yield Global
Overwriting (Odd Months) Strategy Pay a fixed charge of 0% 31/05/2021 Morgan Stanley (83,491) (0.02)
73,864,787 USD Receive Morgan Stanley 2% Yield Global Overwriting (Even Months) Strategy
Pay a fixed charge of 0% 30/04/2021 Morgan Stanley (169,416) (0.04) 71,330,169 USD Receive Morgan Stanley 2% Yield Global
Overwriting (Odd Months) Strategy Pay a fixed charge of 0% 31/05/2021 Morgan Stanley (129,694) (0.03)
109,527,157 USD Receive Morgan Stanley 3% Yield Global Overwriting (Even Months) Strategy
Pay a fixed charge of 0% 30/04/2021 Morgan Stanley (405,335) (0.09) 105,275,434 USD Receive Morgan Stanley 3% Yield Global
Overwriting (Odd Months) Strategy Pay a fixed charge of 0% 31/05/2021 Morgan Stanley (322,595) (0.06)
86,791,376 USD Receive Morgan Stanley 4% Yield Global Overwriting (Even Months) Strategy
Pay a fixed charge of 0% 30/04/2021 Morgan Stanley (527,887) (0.11) 83,083,382 USD Receive Morgan Stanley 4% Yield Global
Overwriting (Odd Months) Strategy Pay a fixed charge of 0% 31/05/2021 Morgan Stanley (377,956) (0.08)
Total Unrealised Loss on Total Return Swap Contracts (2,113,470) (0.45)
Net Unrealised Loss on Total Return Swap Contracts (2,113,470) (0.45)
Geographic Distribution based on Economic Exposure of Total Return Swap Contracts
Country Currency
Unrealised Gain/(Loss)
USD
% of Net Assets
United States of America USD (2,113,470) (0.45)
(2,113,470) (0.45)
Collateral received and paid by the Fund in respect of financial derivative instruments:
Type of Collateral Counterparty Currency Amount received Amount paid
Global Brands Equity Income Fund
Cash Morgan Stanley USD – 140,000
– 140,000
DERIVATIVES (continued)
Over-the-counter (OtC) and exchange traded derivatives as at 31 December 2020, expressed in US Dollars.

45 Morgan Stanley Investment Funds 31 December 2020
The accompanying notes are an integral part of these financial statements.
Please refer to the full prospectus for the Fund’s investment objective and policy.
SCHEDULE OF INVESTMENTSAs at 31 December 2020
Investments Currency
Quantity/ Nominal
Value
Market Value USD
% of Net Assets
transferable securities and money market instruments admitted to official exchange listing or dealt in on another regulated market
Equities
CanadaColliers International Group, Inc. CAD 9,743 858,057 3.86 Constellation Software, Inc. CAD 114 147,830 0.66 Score Media and Gaming, Inc. CAD 207,811 241,715 1.09
1,247,602 5.61
FinlandRevenio Group OYJ EUR 3,903 240,637 1.08
240,637 1.08
GermanyCompuGroup Medical SE & Co. KgaA EUR 1,783 171,288 0.77
171,288 0.77
JapanBASE, Inc. JPY 3,400 320,855 1.44 Freee KK JPY 4,700 459,758 2.07 Mercari, Inc. JPY 3,500 155,429 0.70
936,042 4.21
New ZealandRyman Healthcare Ltd. NZD 53,725 589,971 2.65
589,971 2.65
PolandDino Polska SA, Reg. S PLN 12,865 995,024 4.48
995,024 4.48
SwedenAddLife AB ‘B’ SEK 40,326 707,019 3.18 Cellavision AB SEK 6,031 225,790 1.02
932,809 4.20
United KingdomAngle plc GBP 80,315 52,384 0.24 ASOS plc GBP 3,890 254,143 1.14 Blue Prism Group plc GBP 7,936 186,448 0.84 Royalty Pharma plc ‘A’ USD 18,679 918,633 4.13 Victoria plc GBP 124,746 1,116,083 5.02
2,527,691 11.37
United States of AmericaAppfolio, Inc. ‘A’ USD 3,714 655,707 2.95 Appian Corp. USD 7,195 1,135,659 5.11 At Home Group, Inc. USD 59,654 921,058 4.14 Cardlytics, Inc. USD 7,386 1,040,613 4.68 Carvana Co. USD 4,447 1,076,930 4.85 DraftKings, Inc. ‘A’ USD 13,935 661,634 2.98 Fastly, Inc. ‘A’ USD 12,451 1,097,182 4.94 Floor & Decor Holdings, Inc. ‘A’ USD 11,587 1,079,097 4.85 GameStop Corp. ‘A’ USD 23,509 457,250 2.06 Northern Star Acquisition Corp. USD 23,849 405,194 1.82 Party City Holdco, Inc. USD 180,700 1,154,673 5.19 Skillz, Inc. USD 54,649 1,032,866 4.65
Global Endurance Fund
INVESTMENT AIM
To seek long-term capital appreciation, measured in US Dollars by investing primarily in equity securities, including depositary receipts (including American Depositary Receipts (ADRs) and Global Depositary Receipts (GDRs)), of established and emerging companies located throughout the world, with capitalizations within the range of companies included in the MSCI All Country World Index.

Morgan Stanley Investment Funds 31 December 2020 46
The accompanying notes are an integral part of these financial statements.
Global Endurance Fund (continued)
SCHEDULE OF INVESTMENTSAs at 31 December 2020
Investments Currency
Quantity/ Nominal
Value
Market Value USD
% of Net Assets
transferable securities and money market instruments admitted to official exchange listing or dealt in on another regulated market
Equities (continued)
United States of America (continued)Smartsheet, Inc. ‘A’ USD 12,978 909,109 4.09 Snowflake, Inc. ‘A’ USD 813 241,998 1.09 Stitch Fix, Inc. ‘A’ USD 14,663 885,499 3.98 Utz Brands, Inc. USD 15,020 331,341 1.49 Wayfair, Inc. ‘A’ USD 2,478 563,125 2.53 Zoom Video Communications, Inc. ‘A’ USD 580 199,230 0.90 ZoomInfo Technologies, Inc. ‘A’ USD 12,675 596,359 2.68
14,444,524 64.98
Total Equities 22,085,588 99.35
Total Transferable securities and money market instruments admitted to official exchange listing or dealt in on another regulated market 22,085,588 99.35
Other transferable securities and money market instruments not admitted to official exchange listing or dealt in on another regulated market
Equities
CanadaTopicus.com, Inc.* CAD 212 802 0.00
802 0.00
Total Equities 802 0.00
Total Other transferable securities and money market instruments not admitted to official exchange listing or dealt in on another regulated market 802 0.00
Units of authorised UCItS or other collective investment undertakings
Collective Investment Schemes – UCITS
LuxembourgMorgan Stanley Liquidity Funds US Dollar
Treasury Liquidity Fund – MS Reserve† USD 900,409 900,409 4.05
900,409 4.05
Total Collective Investment Schemes – UCITS 900,409 4.05
Total Units of authorised UCITS or other collective investment undertakings 900,409 4.05
Total Investments 22,986,799 103.40
Cash 107,650 0.48
Other Assets/(Liabilities) (864,555) (3.88)
Total Net Assets 22,229,894 100.00
* Security is valued at its fair value under the direction of the Board of Directors.† Managed by an affiliate of the Investment Adviser.
Forward Currency Exchange Contracts
Currency Purchased
Amount Purchased
Currency Sold
Amount Sold
Maturity Date Counterparty
Unrealised Gain/(Loss)
USD
% of Net Assets
USD 1,229 EUR 1,000 05/01/2021 J.P. Morgan 2 0.00
Unrealised Gain on Forward Currency Exchange Contracts – Assets 2 0.00
Total Unrealised Gain on Forward Currency Exchange Contracts – Assets 2 0.00
PLN 109,640 USD 29,593 04/01/2021 State Street (96) 0.00
Unrealised Loss on Forward Currency Exchange Contracts – Liabilities (96) 0.00
Total Unrealised Loss on Forward Currency Exchange Contracts – Liabilities (96) 0.00
Net Unrealised Loss on Forward Currency Exchange Contracts – Liabilities (94) 0.00
DERIVATIVES
Over-the-counter (OtC) and exchange traded derivatives as at 31 December 2020, expressed in US Dollars.

47 Morgan Stanley Investment Funds 31 December 2020
The accompanying notes are an integral part of these financial statements.
Please refer to the full prospectus for the Fund’s investment objective and policy.
InVEsTmEnT aIm
To seek to provide long-term capital appreciation, measured in US Dollars, by investing primarily in equity securities issued by companies located throughout the world that are engaged in the infrastructure business.
schEDUlE of InVEsTmEnTsAs at 31 December 2020
Investments Currency
Quantity/ Nominal
Value
Market Value USD
% of Net Assets
Transferable securities and money market instruments admitted to official exchange listing or dealt in on another regulated market
Equities
australiaAtlas Arteria Ltd. AUD 1,891,117 9,502,777 1.08 Sydney Airport AUD 1,259,233 6,239,976 0.71 Transurban Group AUD 1,933,209 20,414,949 2.32
36,157,702 4.11
BrazilEnergisa SA BRL 585,768 5,898,911 0.67
5,898,911 0.67
canadaCanadian National Railway Co. CAD 33,008 3,607,141 0.41 Enbridge, Inc. CAD 603,861 19,424,581 2.21 Gibson Energy, Inc. CAD 1,725,236 27,958,257 3.18 Keyera Corp. CAD 236,963 4,203,248 0.48 Pembina Pipeline Corp. CAD 206,726 4,926,032 0.56 TC Energy Corp. CAD 469,427 19,202,675 2.18
79,321,934 9.02
chinaChina Everbright Environment Group Ltd. HKD 44,752,000 25,279,409 2.87 China Gas Holdings Ltd. HKD 7,242,600 28,769,054 3.27 China Merchants Port Holdings Co. Ltd. HKD 1,729,315 2,116,512 0.24 China Tower Corp. Ltd., Reg. S ‘H’ HKD 30,082,000 4,422,745 0.50 Jiangsu Expressway Co. Ltd. ‘H’ HKD 7,018,000 7,847,166 0.89 Zhejiang Expressway Co. Ltd. ‘H’ HKD 2,974,000 2,512,249 0.29
70,947,135 8.06
DenmarkOrsted A/S, Reg. S DKK 27,621 5,599,978 0.64
5,599,978 0.64
franceAeroports de Paris EUR 8,005 1,042,077 0.12 Getlink SE EUR 560,238 9,747,026 1.10 Vinci SA EUR 412,411 41,168,448 4.68
51,957,551 5.90
hong KongPower Assets Holdings Ltd. HKD 1,569,500 8,501,410 0.97
8,501,410 0.97
IndiaAzure Power Global Ltd. USD 542,628 21,889,614 2.49
21,889,614 2.49
ItalyAtlantia SpA EUR 253,429 4,539,491 0.51 Infrastrutture Wireless Italiane SpA, Reg. S EUR 1,299,399 15,802,452 1.80 Snam SpA EUR 811,109 4,560,347 0.52 Terna Rete Elettrica Nazionale SpA EUR 1,107,358 8,475,284 0.96
33,377,574 3.79
Global Infrastructure Fund

Morgan Stanley Investment Funds 31 December 2020 48
The accompanying notes are an integral part of these financial statements.
Global Infrastructure Fund (continued)
schEDUlE of InVEsTmEnTsAs at 31 December 2020
Investments Currency
Quantity/ Nominal
Value
Market Value USD
% of Net Assets
Transferable securities and money market instruments admitted to official exchange listing or dealt in on another regulated market
Equities (continued)
United states of america (continued)Union Pacific Corp. USD 51,730 10,693,108 1.22 Waste Management, Inc. USD 139,113 16,248,398 1.85 Williams Cos., Inc. (The) USD 488,915 9,734,298 1.11 Xcel Energy, Inc. USD 92,320 6,085,734 0.69
378,101,802 42.97
Total Equities 846,239,634 96.18
Total Transferable securities and money market instruments admitted to official exchange listing or dealt in on another regulated market 846,239,634 96.18
Units of authorised UCITS or other collective investment undertakings
collective Investment schemes – UcITs
luxembourgMorgan Stanley Liquidity Funds US Dollar
Treasury Liquidity Fund – MS Reserve† USD 27,329,700 27,329,700 3.10
27,329,700 3.10
Total collective Investment schemes – UcITs 27,329,700 3.10
Total Units of authorised UcITs or other collective investment undertakings 27,329,700 3.10
Total Investments 873,569,334 99.28
cash 790,329 0.09
other assets/(liabilities) 5,510,988 0.63
Total net assets 879,870,651 100.00
† Managed by an affiliate of the Investment Adviser.The country disclosed within the Schedule of Investments refers to the country of risk. The country of incorporation may differ.
schEDUlE of InVEsTmEnTsAs at 31 December 2020
Investments Currency
Quantity/ Nominal
Value
Market Value USD
% of Net Assets
Transferable securities and money market instruments admitted to official exchange listing or dealt in on another regulated market
Equities (continued)
JapanCentral Japan Railway Co. JPY 38,100 5,406,541 0.61 East Japan Railway Co. JPY 207,000 13,819,762 1.57
19,226,303 2.18
mexicoGrupo Aeroportuario del Pacifico SAB de CV ‘B’ MXN 673,721 7,496,416 0.85 Grupo Aeroportuario del Sureste SAB de CV ‘B’ MXN 436,706 7,066,276 0.80 Promotora y Operadora de Infraestructura
SAB de CV MXN 2,720,303 24,507,049 2.79
39,069,741 4.44
new ZealandAuckland International Airport Ltd. NZD 1,438,162 7,880,853 0.90
7,880,853 0.90
spainAena SME SA, Reg. S EUR 59,110 10,312,973 1.17 Cellnex Telecom SA, Reg. S EUR 194,125 11,699,388 1.33 Ferrovial SA EUR 404,262 11,209,717 1.28
33,222,078 3.78
switzerlandFlughafen Zurich AG CHF 52,151 9,201,383 1.05
9,201,383 1.05
United KingdomNational Grid plc GBP 2,662,883 31,462,746 3.57 Pennon Group plc GBP 628,849 8,160,155 0.93 Severn Trent plc GBP 200,305 6,262,764 0.71
45,885,665 5.21
United states of americaAmeren Corp. USD 107,428 8,299,887 0.94 American Electric Power Co., Inc. USD 140,721 11,558,823 1.31 American Tower Corp., REIT USD 268,130 59,355,938 6.75 American Water Works Co., Inc. USD 104,934 15,938,950 1.81 Atmos Energy Corp. USD 164,288 15,484,144 1.76 Avangrid, Inc. USD 216,790 9,809,748 1.11 Cheniere Energy, Inc. USD 258,915 15,840,420 1.80 CMS Energy Corp. USD 81,897 4,928,562 0.56 Crown Castle International Corp., REIT USD 276,193 43,265,633 4.92 CSX Corp. USD 87,575 7,901,892 0.90 Edison International USD 260,965 16,130,247 1.83 Essential Utilities, Inc. USD 415,002 19,305,893 2.19 Eversource Energy USD 177,659 15,234,259 1.73 NiSource, Inc. USD 484,542 11,003,949 1.25 ONEOK, Inc. USD 628,536 23,714,663 2.70 Republic Services, Inc. USD 58,566 5,581,926 0.63 SBA Communications Corp., REIT ‘A’ USD 72,881 20,125,359 2.29 Sempra Energy USD 154,990 19,559,738 2.22 Targa Resources Corp. USD 474,363 12,300,233 1.40

49 Morgan Stanley Investment Funds 31 December 2020
The accompanying notes are an integral part of these financial statements.
Global Infrastructure Fund (continued)
forward currency Exchange contracts
currency Purchased
amount Purchased
currency sold
amount sold
maturity Date counterparty
Unrealised Gain/(loss)
UsD
% of net assets
EUR 41,193 USD 50,465 04/01/2021 J.P. Morgan 77 0.00USD 70,104 EUR 57,056 05/01/2021 J.P. Morgan 101 0.00USD 763,233 HKD 5,917,016 05/01/2021 J.P. Morgan 130 0.00
Unrealised Gain on forward currency Exchange contracts – assets 308 0.00
EUR hedged share classEUR 16,177 USD 19,846 04/01/2021 J.P. Morgan 2 0.00USD 1,082,952 EUR 880,700 05/01/2021 J.P. Morgan 2,387 0.00EUR 184,258,772 USD 224,159,198 08/01/2021 J.P. Morgan 1,933,338 0.22 USD 46,349 EUR 37,690 08/01/2021 J.P. Morgan 102 0.00
Unrealised Gain on naV hedged share classes forward currency Exchange contracts – assets 1,935,829 0.22
Total Unrealised Gain on forward currency Exchange contracts – assets 1,936,137 0.22
HKD 708,750 USD 91,428 04/01/2021 J.P. Morgan (22) 0.00USD 191,116 EUR 156,003 04/01/2021 J.P. Morgan (291) 0.00EUR 42,258 USD 51,922 05/01/2021 J.P. Morgan (74) 0.00
Unrealised loss on forward currency Exchange contracts – liabilities (387) 0.00
EUR hedged share classUSD 107,582 EUR 87,693 04/01/2021 J.P. Morgan (12) 0.00EUR 37,690 USD 46,345 05/01/2021 J.P. Morgan (102) 0.00EUR 880,700 USD 1,083,048 08/01/2021 J.P. Morgan (2,396) 0.00USD 3,933,406 EUR 3,215,464 08/01/2021 J.P. Morgan (12,092) 0.00
Unrealised loss on naV hedged share classes forward currency Exchange contracts – liabilities (14,602) 0.00
Total Unrealised loss on forward currency Exchange contracts – liabilities (14,989) 0.00
net Unrealised Gain on forward currency Exchange contracts – assets 1,921,148 0.22
DERIVaTIVEs
Over-the-counter (OTC) and exchange traded derivatives as at 31 December 2020, expressed in US Dollars.
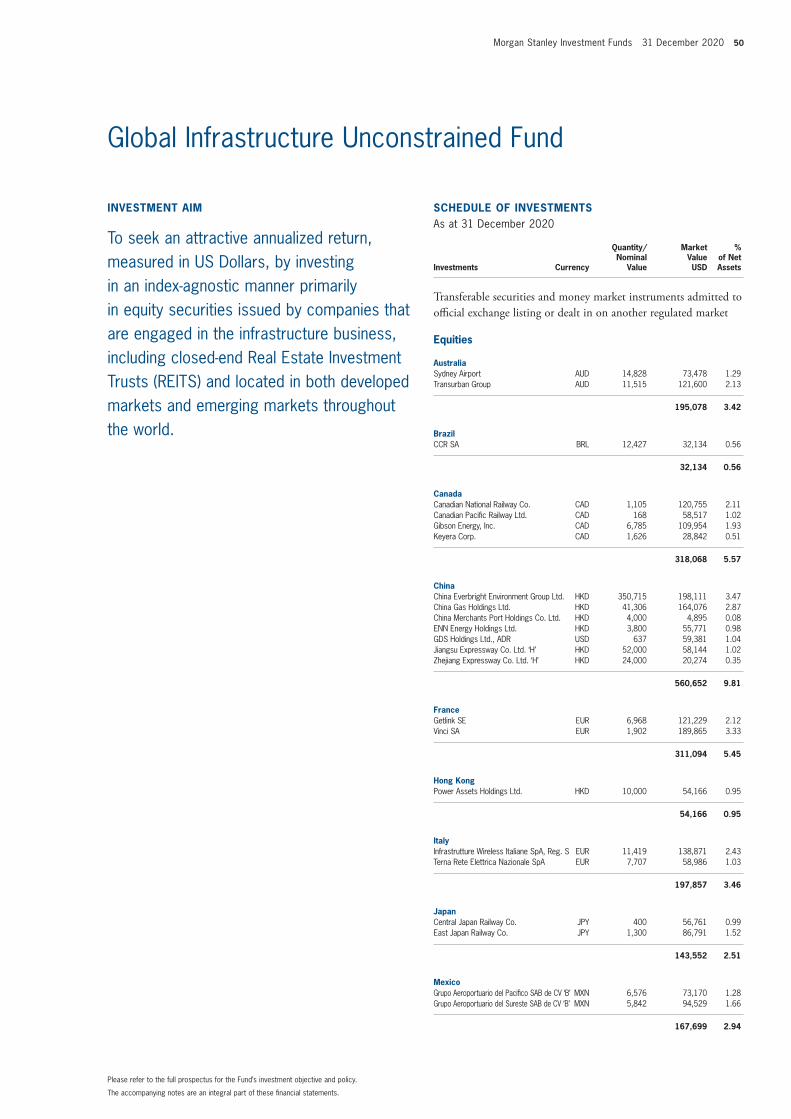
Morgan Stanley Investment Funds 31 December 2020 50
The accompanying notes are an integral part of these financial statements.
Please refer to the full prospectus for the Fund’s investment objective and policy.
Global Infrastructure Unconstrained Fund
InVEsTmEnT aIm
To seek an attractive annualized return, measured in US Dollars, by investing in an index-agnostic manner primarily in equity securities issued by companies that are engaged in the infrastructure business, including closed-end Real Estate Investment Trusts (REITS) and located in both developed markets and emerging markets throughout the world.
schEDUlE of InVEsTmEnTsAs at 31 December 2020
Investments Currency
Quantity/Nominal
Value
Market Value USD
% of Net Assets
Transferable securities and money market instruments admitted to official exchange listing or dealt in on another regulated market
Equities
australiaSydney Airport AUD 14,828 73,478 1.29 Transurban Group AUD 11,515 121,600 2.13
195,078 3.42
BrazilCCR SA BRL 12,427 32,134 0.56
32,134 0.56
canadaCanadian National Railway Co. CAD 1,105 120,755 2.11 Canadian Pacific Railway Ltd. CAD 168 58,517 1.02 Gibson Energy, Inc. CAD 6,785 109,954 1.93 Keyera Corp. CAD 1,626 28,842 0.51
318,068 5.57
chinaChina Everbright Environment Group Ltd. HKD 350,715 198,111 3.47 China Gas Holdings Ltd. HKD 41,306 164,076 2.87 China Merchants Port Holdings Co. Ltd. HKD 4,000 4,895 0.08 ENN Energy Holdings Ltd. HKD 3,800 55,771 0.98 GDS Holdings Ltd., ADR USD 637 59,381 1.04 Jiangsu Expressway Co. Ltd. ‘H’ HKD 52,000 58,144 1.02 Zhejiang Expressway Co. Ltd. ‘H’ HKD 24,000 20,274 0.35
560,652 9.81
franceGetlink SE EUR 6,968 121,229 2.12 Vinci SA EUR 1,902 189,865 3.33
311,094 5.45
hong KongPower Assets Holdings Ltd. HKD 10,000 54,166 0.95
54,166 0.95
ItalyInfrastrutture Wireless Italiane SpA, Reg. S EUR 11,419 138,871 2.43 Terna Rete Elettrica Nazionale SpA EUR 7,707 58,986 1.03
197,857 3.46
JapanCentral Japan Railway Co. JPY 400 56,761 0.99 East Japan Railway Co. JPY 1,300 86,791 1.52
143,552 2.51
mexicoGrupo Aeroportuario del Pacifico SAB de CV ‘B’ MXN 6,576 73,170 1.28 Grupo Aeroportuario del Sureste SAB de CV ‘B’ MXN 5,842 94,529 1.66
167,699 2.94

51 Morgan Stanley Investment Funds 31 December 2020
The accompanying notes are an integral part of these financial statements.
Global Infrastructure Unconstrained Fund (continued)
schEDUlE of InVEsTmEnTsAs at 31 December 2020
Investments Currency
Quantity/Nominal
Value
Market Value USD
% of Net Assets
Transferable securities and money market instruments admitted to official exchange listing or dealt in on another regulated market
Equities (continued)
new ZealandAuckland International Airport Ltd. NZD 12,634 69,232 1.21
69,232 1.21
spainAena SME SA, Reg. S EUR 497 86,712 1.52 Cellnex Telecom SA, Reg. S EUR 2,775 167,242 2.93 Ferrovial SA EUR 3,018 83,686 1.46
337,640 5.91
switzerlandFlughafen Zurich AG CHF 558 98,452 1.72
98,452 1.72
United KingdomNational Grid plc GBP 11,894 140,531 2.46 Pennon Group plc GBP 9,023 117,086 2.05 Severn Trent plc GBP 2,789 87,201 1.53
344,818 6.04
United states of americaAmeren Corp. USD 1,682 129,951 2.28 American Electric Power Co., Inc. USD 1,977 162,391 2.84 American Tower Corp., REIT USD 683 151,196 2.65 American Water Works Co., Inc. USD 610 92,656 1.62 Atmos Energy Corp. USD 887 83,600 1.46 Avangrid, Inc. USD 624 28,236 0.49 Cheniere Energy, Inc. USD 1,649 100,886 1.77 CMS Energy Corp. USD 1,154 69,448 1.22 Crown Castle International Corp., REIT USD 836 130,959 2.29 CSX Corp. USD 637 57,476 1.01 Dominion Energy, Inc. USD 220 16,324 0.29 Essential Utilities, Inc. USD 2,719 126,488 2.21 Eversource Energy USD 892 76,489 1.34 Kansas City Southern USD 170 34,457 0.60 NextEra Energy, Inc. USD 2,334 177,897 3.11 NiSource, Inc. USD 4,732 107,464 1.88 Norfolk Southern Corp. USD 255 60,139 1.05 ONEOK, Inc. USD 4,791 180,764 3.16 Republic Services, Inc. USD 1,018 97,026 1.70 SBA Communications Corp., REIT ‘A’ USD 494 136,413 2.39 Targa Resources Corp. USD 3,428 88,888 1.56 Union Pacific Corp. USD 470 97,154 1.70 Waste Connections, Inc. USD 1,192 121,155 2.12 Waste Management, Inc. USD 777 90,754 1.59
2,418,211 42.33
Total Equities 5,248,653 91.88
Total Transferable securities and money market instruments admitted to official exchange listing or dealt in on another regulated market 5,248,653 91.88
schEDUlE of InVEsTmEnTsAs at 31 December 2020
Investments Currency
Quantity/Nominal
Value
Market Value USD
% of Net Assets
Units of authorised UCITS or other collective investment undertakings
collective Investment schemes – UcITs
luxembourgMorgan Stanley Liquidity Funds US Dollar
Treasury Liquidity Fund – MS Reserve† USD 350,000 350,000 6.13
350,000 6.13
Total collective Investment schemes – UcITs 350,000 6.13
Total Units of authorised UcITs or other collective investment undertakings 350,000 6.13
Total Investments 5,598,653 98.01
cash 109,302 1.91
other assets/(liabilities) 4,470 0.08
Total net assets 5,712,425 100.00
† Managed by an affiliate of the Investment Adviser.The country disclosed within the Schedule of Investments refers to the country of risk. The country of incorporation may differ.

Morgan Stanley Investment Funds 31 December 2020 52
The accompanying notes are an integral part of these financial statements.
Global Infrastructure Unconstrained Fund (continued)
option Purchased contracts
Quantity security Description currency counterparty
market Value UsD
% of net assets
2 S&P 500 Index, Put, 3,500.000, 19/03/2021 USD Goldman Sachs 14,580 0.26
Total market Value on option Purchased contracts – assets 14,580 0.26
forward currency Exchange contracts
currency Purchased
amount Purchased
currency sold
amount sold
maturity Date counterparty
Unrealised Gain/(loss)
UsD
% of net assets
USD 4,572 HKD 35,443 05/01/2021 J.P. Morgan 1 0.00CAD 74,738 USD 58,184 06/01/2021 UBS 553 0.01 EUR 29,523 USD 36,191 06/01/2021 UBS 33 0.00
Unrealised Gain on forward currency Exchange contracts – assets 587 0.01
Total Unrealised Gain on forward currency Exchange contracts – assets 587 0.01
USD 196,447 AUD 257,836 06/01/2021 UBS (2,881) (0.05) USD 376,128 CAD 479,417 06/01/2021 UBS (654) (0.01) USD 96,895 CHF 85,582 06/01/2021 UBS (304) 0.00USD 899,493 EUR 733,147 06/01/2021 UBS (58) 0.00USD 346,920 GBP 256,322 06/01/2021 UBS (3,201) (0.06) USD 159,578 MXN 3,170,786 06/01/2021 UBS (31) 0.00USD 69,859 NZD 97,977 06/01/2021 UBS (971) (0.02)
Unrealised loss on forward currency Exchange contracts – liabilities (8,100) (0.14)
Total Unrealised loss on forward currency Exchange contracts – liabilities (8,100) (0.14)
net Unrealised loss on forward currency Exchange contracts – liabilities (7,513) (0.13)
DERIVaTIVEs
Over-the-counter (OTC) and exchange traded derivatives as at 31 December 2020, expressed in US Dollars.

53 Morgan Stanley Investment Funds 31 December 2020
The accompanying notes are an integral part of these financial statements.
Please refer to the full prospectus for the Fund’s investment objective and policy.
InVEsTmEnT aIm
To seek long-term capital appreciation measured in US Dollars through investment primarily in equity securities, including depositary receipts (including American Depositary Receipts (ADRs) and Global Depositary Receipts (GDRs)), of issuers located in any country.
schEDUlE of InVEsTmEnTsAs at 31 December 2020
Investments Currency
Quantity/Nominal
Value
Market Value USD
% of Net Assets
Transferable securities and money market instruments admitted to official exchange listing or dealt in on another regulated market
Equities
argentinaGlobant SA USD 375,169 80,923,953 0.39
80,923,953 0.39
canadaShopify, Inc. ‘A’ USD 358,420 411,466,160 1.97
411,466,160 1.97
chinaAlibaba Group Holding Ltd., ADR USD 1,659,523 391,398,500 1.87 China Resources Beer Holdings Co. Ltd. HKD 9,507,999 87,552,329 0.42 Foshan Haitian Flavouring & Food Co. Ltd. ‘A’ CNY 7,254,109 222,712,996 1.06 Meituan Dianping, Reg. S ‘B’ HKD 20,170,200 766,343,206 3.67 TAL Education Group, ADR USD 12,982,867 932,948,823 4.46 Trip.com Group Ltd., ADR USD 8,344,622 277,458,681 1.33
2,678,414,535 12.81
DenmarkDSV PANALPINA A/S DKK 4,796,723 807,816,232 3.86
807,816,232 3.86
franceHermes International EUR 504,298 544,246,671 2.60
544,246,671 2.60
IndiaHDFC Bank Ltd. INR 46,224,535 909,491,032 4.35 ICICI Bank Ltd. INR 36,798,332 269,713,827 1.29
1,179,204,859 5.64
ItalyMoncler SpA EUR 8,499,940 519,445,107 2.49
519,445,107 2.49
JapanKeyence Corp. JPY 772,400 434,455,315 2.08
434,455,315 2.08
south KoreaNAVER Corp. KRW 586,459 157,362,522 0.75
157,362,522 0.75
United KingdomFevertree Drinks plc GBP 3,180,790 109,791,489 0.53
109,791,489 0.53
Global Opportunity Fund

Morgan Stanley Investment Funds 31 December 2020 54
The accompanying notes are an integral part of these financial statements.
Global Opportunity Fund (continued)
schEDUlE of InVEsTmEnTsAs at 31 December 2020
Investments Currency
Quantity/Nominal
Value
Market Value USD
% of Net Assets
Transferable securities and money market instruments admitted to official exchange listing or dealt in on another regulated market
Equities (continued)
United states of americaAdobe, Inc. USD 1,238,520 618,343,495 2.96 Alphabet, Inc. ‘C’ USD 346,373 605,761,349 2.90 Amazon.com, Inc. USD 418,222 1,368,531,122 6.55 DoorDash, Inc. ‘A’ USD 1,126,757 158,264,288 0.76 EPAM Systems, Inc. USD 1,429,007 510,455,591 2.44 Facebook, Inc. ‘A’ USD 2,204,933 605,783,292 2.90 Farfetch Ltd. ‘A’ USD 5,878,681 374,413,193 1.79 Intuitive Surgical, Inc. USD 332,710 271,398,201 1.30 Martin Marietta Materials, Inc. USD 295,507 82,792,196 0.39 Mastercard, Inc. ‘A’ USD 3,897,463 1,396,733,815 6.68 salesforce.com, Inc. USD 2,191,210 484,651,828 2.32 ServiceNow, Inc. USD 1,966,259 1,073,656,064 5.13 Spotify Technology SA USD 1,793,522 572,474,287 2.74 Square, Inc. ‘A’ USD 2,576,781 557,228,891 2.66 Uber Technologies, Inc. USD 23,785,770 1,241,736,123 5.94 Veeva Systems, Inc. ‘A’ USD 592,345 160,993,448 0.77 Visa, Inc. ‘A’ USD 3,884,925 851,420,163 4.07 Walt Disney Co. (The) USD 4,062,511 739,600,440 3.54 Workday, Inc. ‘A’ USD 659,966 158,273,046 0.76 Zillow Group, Inc. ‘A’ USD 1,539,562 209,134,102 1.00 Zoom Video Communications, Inc. ‘A’ USD 1,465,521 503,406,464 2.41
12,545,051,398 60.01
Total Equities 19,468,178,241 93.13
Total Transferable securities and money market instruments admitted to official exchange listing or dealt in on another regulated market 19,468,178,241 93.13
Other transferable securities and money market instruments not admitted to official exchange listing or dealt in on another regulated market
Equities
United states of americaagilon health, Inc.* USD 81,338 47,947,124 0.23
47,947,124 0.23
Total Equities 47,947,124 0.23
Total other transferable securities and money market instruments not admitted to official exchange listing or dealt in on another regulated market 47,947,124 0.23
schEDUlE of InVEsTmEnTsAs at 31 December 2020
Investments Currency
Quantity/Nominal
Value
Market Value USD
% of Net Assets
Units of authorised UCITS or other collective investment undertakings
collective Investment schemes – UcITs
luxembourgMorgan Stanley Liquidity Funds US Dollar
Treasury Liquidity Fund – MS Reserve† USD 1,589,057,307 1,589,057,307 7.60
1,589,057,307 7.60
Total collective Investment schemes – UcITs 1,589,057,307 7.60
Total Units of authorised UcITs or other collective investment undertakings 1,589,057,307 7.60
Total Investments 21,105,182,672 100.96
cash 42,580,871 0.20
other assets/(liabilities) (243,829,256) (1.16)
Total net assets 20,903,934,287 100.00
* Security is valued at its fair value under the direction of the Board of Directors.† Managed by an affiliate of the Investment Adviser.The country disclosed within the Schedule of Investments refers to the country of risk. The country of incorporation may differ.

55 Morgan Stanley Investment Funds 31 December 2020
The accompanying notes are an integral part of these financial statements.
Global Opportunity Fund (continued)
forward currency Exchange contracts (continued)
currency Purchased
amount Purchased
currency sold
amount sold
maturity Date counterparty
Unrealised Gain/(loss)
UsD
% of net assets
USD 2,013,001 EUR 1,638,312 05/01/2021 J.P. Morgan 2,891 0.00
Unrealised Gain on forward currency Exchange contracts – assets 2,891 0.00
aUD hedged share classAUD 52,995 CNY 262,457 29/01/2021 J.P. Morgan 759 0.00AUD 192,762 DKK 890,600 29/01/2021 J.P. Morgan 2,116 0.00AUD 258,696 EUR 160,620 29/01/2021 J.P. Morgan 2,849 0.00AUD 26,186 GBP 14,785 29/01/2021 J.P. Morgan 49 0.00AUD 219,215 HKD 1,286,120 29/01/2021 J.P. Morgan 3,625 0.00AUD 261,628 INR 14,615,602 29/01/2021 J.P. Morgan 2,713 0.00AUD 104,163 JPY 8,178,926 29/01/2021 J.P. Morgan 1,150 0.00AUD 36,542 KRW 30,268,383 29/01/2021 J.P. Morgan 514 0.00AUD 3,690,114 USD 2,789,190 29/01/2021 J.P. Morgan 64,207 0.00GBP 318 AUD 561 29/01/2021 J.P. Morgan 1 0.00
Unrealised Gain on naV hedged share classes forward currency Exchange contracts – assets 77,983 0.00
EUR hedged share classUSD 8,323,163 EUR 6,768,725 05/01/2021 J.P. Morgan 18,343 0.00EUR 2,731,714,782 USD 3,323,374,306 08/01/2021 J.P. Morgan 28,543,839 0.14 USD 352,727 EUR 286,826 08/01/2021 J.P. Morgan 780 0.00
Unrealised Gain on naV hedged share classes forward currency Exchange contracts – assets 28,562,962 0.14
sEK hedged share classSEK 654,654,602 USD 78,172,571 08/01/2021 J.P. Morgan 1,992,136 0.01
Unrealised Gain on naV hedged share classes forward currency Exchange contracts – assets 1,992,136 0.01
Total Unrealised Gain on forward currency Exchange contracts – assets 30,635,972 0.15
forward currency Exchange contracts (continued)
currency Purchased
amount Purchased
currency sold
amount sold
maturity Date counterparty
Unrealised Gain/(loss)
UsD
% of net assets
USD 2,617,099 EUR 2,136,275 04/01/2021 J.P. Morgan (3,982) 0.00USD 35,676 GBP 26,434 04/01/2021 J.P. Morgan (431) 0.00EUR 2,657 USD 3,265 05/01/2021 J.P. Morgan (5) 0.00USD 56,759 GBP 41,708 05/01/2021 J.P. Morgan (212) 0.00
Unrealised loss on forward currency Exchange contracts – liabilities (4,630) 0.00
aUD hedged share classCNY 10,810 AUD 2,168 29/01/2021 J.P. Morgan (20) 0.00DKK 15,151 AUD 3,291 29/01/2021 J.P. Morgan (45) 0.00EUR 5,702 AUD 9,195 29/01/2021 J.P. Morgan (110) 0.00GBP 225 AUD 400 29/01/2021 J.P. Morgan (2) 0.00HKD 149,748 AUD 25,478 29/01/2021 J.P. Morgan (387) 0.00INR 744,127 AUD 13,214 29/01/2021 J.P. Morgan (56) 0.00JPY 184,667 AUD 2,367 29/01/2021 J.P. Morgan (37) 0.00
EUR hedged share classUSD 4,165,498 EUR 3,395,417 04/01/2021 J.P. Morgan (475) 0.00EUR 286,826 USD 352,696 05/01/2021 J.P. Morgan (778) 0.00EUR 6,768,725 USD 8,323,894 08/01/2021 J.P. Morgan (18,410) 0.00USD 12,480,146 EUR 10,239,136 08/01/2021 J.P. Morgan (83,664) 0.00
Unrealised loss on naV hedged share classes forward currency Exchange contracts – liabilities (103,984) 0.00
Total Unrealised loss on forward currency Exchange contracts – liabilities (108,614) 0.00
net Unrealised Gain on forward currency Exchange contracts – assets 30,527,358 0.15
DERIVaTIVEs
Over-the-counter (OTC) and exchange traded derivatives as at 31 December 2020, expressed in US Dollars.
DERIVaTIVEs (continued)
Over-the-counter (OTC) and exchange traded derivatives as at 31 December 2020, expressed in US Dollars.

Morgan Stanley Investment Funds 31 December 2020 56
The accompanying notes are an integral part of these financial statements.
Please refer to the full prospectus for the Fund’s investment objective and policy.
Global Permanence Fund
InVEsTmEnT aIm
To seek long-term capital appreciation, measured in US Dollars by investing primarily in equity securities, including depositary receipts (including American Depositary Receipts (ADRs) and Global Depositary Receipts (GDRs)), of established companies located throughout the world, with capitalizations within the range of companies included in the MSCI All Country World Index. With a view to enhancing returns and/or as part of the investment strategy, the Fund may make use of exchange traded and over-the-counter options, futures and other derivatives for investment or efficient portfolio management (including hedging) purposes.
schEDUlE of InVEsTmEnTsAs at 31 December 2020
Investments Currency
Quantity/Nominal
Value
Market Value USD
% of Net Assets
Transferable securities and money market instruments admitted to official exchange listing or dealt in on another regulated market
Equities
canadaCanadian National Railway Co. USD 1,085 118,601 1.49 Constellation Software, Inc. CAD 294 381,245 4.79 FirstService Corp. CAD 2,845 385,271 4.84
885,117 11.12
DenmarkChr Hansen Holding A/S DKK 1,158 118,944 1.50
118,944 1.50
franceChristian Dior SE EUR 536 298,963 3.76 EssilorLuxottica SA EUR 492 76,996 0.97 Getlink SE EUR 11,290 196,424 2.47 Hermes International EUR 355 383,122 4.81 L'Oreal SA EUR 310 118,213 1.49 Remy Cointreau SA EUR 747 139,587 1.75
1,213,305 15.25
IndiaHDFC Bank Ltd., ADR USD 3,936 282,762 3.55
282,762 3.55
ItalyBrunello Cucinelli SpA EUR 1,774 77,387 0.97
77,387 0.97
mexicoGrupo Aeroportuario del Sureste SAB de CV 'B' MXN 12,050 194,979 2.45
194,979 2.45
netherlandsJDE Peet's BV EUR 2,514 113,973 1.43
113,973 1.43
spainAena SME SA, Reg. S EUR 1,132 197,501 2.48
197,501 2.48
United KingdomAbcam plc GBP 5,866 124,194 1.56 Intertek Group plc GBP 999 77,071 0.97 Rentokil Initial plc GBP 9,216 64,151 0.81 Royalty Pharma plc 'A' USD 7,856 386,358 4.85
651,774 8.19

57 Morgan Stanley Investment Funds 31 December 2020
The accompanying notes are an integral part of these financial statements.
Global Permanence Fund (continued)
schEDUlE of InVEsTmEnTsAs at 31 December 2020
Investments Currency
Quantity/Nominal
Value
Market Value USD
% of Net Assets
Transferable securities and money market instruments admitted to official exchange listing or dealt in on another regulated market
Equities (continued)
United states of americaAmazon.com, Inc. USD 84 274,870 3.45 Appfolio, Inc. 'A' USD 1,092 192,793 2.42 ASML Holding NV, NYRS USD 816 395,776 4.97 Ball Corp. USD 735 67,870 0.85 Costco Wholesale Corp. USD 706 264,122 3.32 Ecolab, Inc. USD 1,187 257,365 3.23 HEICO Corp. 'A' USD 2,347 275,467 3.46 Intercontinental Exchange, Inc. USD 1,484 168,582 2.12 Intuitive Surgical, Inc. USD 342 278,976 3.51 Linde plc USD 307 80,308 1.01 Martin Marietta Materials, Inc. USD 593 166,141 2.09 Roper Technologies, Inc. USD 175 74,109 0.93 Royal Gold, Inc. USD 534 57,079 0.72 S&P Global, Inc. USD 620 201,754 2.54 Sherwin-Williams Co. (The) USD 97 70,305 0.88 Texas Pacific Land Trust USD 235 169,200 2.13 Tyler Technologies, Inc. USD 172 74,039 0.93 Veeva Systems, Inc. 'A' USD 1,044 283,749 3.57 Walt Disney Co. (The) USD 1,589 289,286 3.63 Waste Connections, Inc. USD 956 97,168 1.22
3,738,959 46.98
Total Equities 7,474,701 93.92
Total Transferable securities and money market instruments admitted to official exchange listing or dealt in on another regulated market 7,474,701 93.92
Other transferable securities and money market instruments not admitted to official exchange listing or dealt in on another regulated market
Equities
canadaTopicus.com, Inc.* CAD 546 2,064 0.02
2,064 0.02
Total Equities 2,064 0.02
Total other transferable securities and money market instruments not admitted to official exchange listing or dealt in on another regulated market 2,064 0.02
schEDUlE of InVEsTmEnTsAs at 31 December 2020
Investments Currency
Quantity/Nominal
Value
Market Value USD
% of Net Assets
Units of authorised UCITS or other collective investment undertakings
collective Investment schemes – UcITs
luxembourgMorgan Stanley Liquidity Funds US Dollar
Treasury Liquidity Fund – MS Reserve† USD 300,032 300,032 3.77
300,032 3.77
Total collective Investment schemes – UcITs 300,032 3.77
Total Units of authorised UcITs or other collective investment undertakings 300,032 3.77
Total Investments 7,776,797 97.71
cash 177,782 2.23
other assets/(liabilities) 4,284 0.06
Total net assets 7,958,863 100.00
* Security is valued at its fair value under the direction of the Board of Directors.† Managed by an affiliate of the Investment Adviser.The country disclosed within the Schedule of Investments refers to the country of risk. The country of incorporation may differ.

Morgan Stanley Investment Funds 31 December 2020 58
The accompanying notes are an integral part of these financial statements.
Global Permanence Fund (continued)
option Purchased contracts
Quantity security Description currency counterparty
market Value UsD
% of net assets
1,103,232 Foreign Exchange USD/CNH, Call, 7.641, 11/11/2021 USD BNP Paribas 3,103 0.04
1,161,511 Foreign Exchange USD/CNH, Call, 7.746, 07/01/2021 USD NatWest Markets 0 0.00
937,567 Foreign Exchange USD/CNH, Call, 7.995, 10/09/2021 USD BNP Paribas 931 0.01
1,055,711 Foreign Exchange USD/CNH, Call, 8.060, 23/07/2021 USD NatWest Markets 667 0.01
802,253 Foreign Exchange USD/CNH, Call, 8.485, 28/05/2021 USD NatWest Markets 110 0.00
Total market Value on option Purchased contracts – assets 4,811 0.06
DERIVaTIVEs
Over-the-counter (OTC) and exchange traded derivatives as at 31 December 2020, expressed in US Dollars.

59 Morgan Stanley Investment Funds 31 December 2020
The accompanying notes are an integral part of these financial statements.
Please refer to the full prospectus for the Fund’s investment objective and policy.
InVEsTmEnT aIm
To seek to provide long-term capital appreciation, measured in US Dollars, primarily through investment in the equity securities of companies in the real estate industry located throughout the world.
schEDUlE of InVEsTmEnTsAs at 31 December 2020
Investments Currency
Quantity/Nominal
Value
Market Value USD
% of Net Assets
Transferable securities and money market instruments admitted to official exchange listing or dealt in on another regulated market
Equities
australiaDexus, REIT AUD 904,981 6,576,368 1.06 Goodman Group, REIT AUD 163,082 2,384,055 0.38 GPT Group (The), REIT AUD 688,985 2,396,851 0.39 Mirvac Group, REIT AUD 1,306,366 2,666,169 0.43 Scentre Group, REIT AUD 1,962,549 4,217,782 0.68 Stockland, REIT AUD 1,582,958 5,115,222 0.82 Vicinity Centres, REIT AUD 2,077,183 2,577,321 0.42
25,933,768 4.18
austriaCA Immobilien Anlagen AG EUR 44,323 1,694,616 0.27
1,694,616 0.27
canadaDream Office Real Estate Investment Trust CAD 5,625 87,177 0.01 First Capital Real Estate Investment Trust CAD 59,107 628,971 0.10 Granite Real Estate Investment Trust CAD 64,523 3,948,732 0.64 RioCan Real Estate Investment Trust CAD 173,181 2,270,226 0.37
6,935,106 1.12
chinaChina Resources Land Ltd. HKD 690,000 2,847,603 0.46 China Resources Mixc Lifestyle Services
Ltd., Reg. S HKD 505,169 2,342,157 0.38 KWG Group Holdings Ltd. HKD 930,853 1,270,127 0.20 KWG Living Group Holdings Ltd., Reg. S HKD 226,050 183,665 0.03 Longfor Group Holdings Ltd., Reg. S HKD 1,221,000 7,149,108 1.15 Shimao Group Holdings Ltd. HKD 567,000 1,806,177 0.29
15,598,837 2.51
finlandKojamo OYJ EUR 231,869 5,146,934 0.83
5,146,934 0.83
franceCarmila SA, REIT EUR 46,335 669,696 0.11 Gecina SA, REIT EUR 85,012 13,173,673 2.12 ICADE, REIT EUR 22,306 1,721,455 0.28 Klepierre SA, REIT EUR 372,439 8,403,500 1.35 Mercialys SA, REIT EUR 758,750 6,721,392 1.08
30,689,716 4.94
GermanyADLER Group SA, Reg. S EUR 36,024 1,273,686 0.20 alstria office REIT-AG EUR 384,241 6,927,911 1.12 Deutsche Wohnen SE EUR 296,487 15,843,690 2.55 LEG Immobilien AG EUR 48,555 7,548,852 1.22 Vonovia SE EUR 367,605 26,884,643 4.33
58,478,782 9.42
Global Property Fund
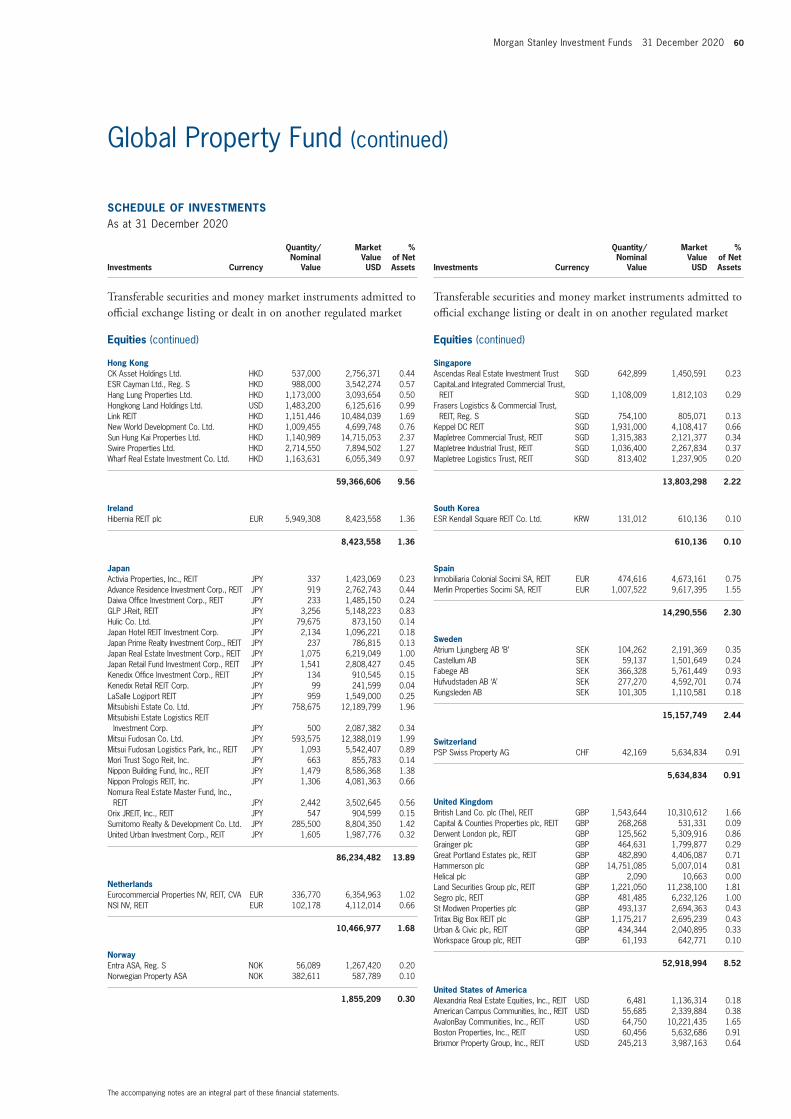
Morgan Stanley Investment Funds 31 December 2020 60
The accompanying notes are an integral part of these financial statements.
Global Property Fund (continued)
schEDUlE of InVEsTmEnTsAs at 31 December 2020
Investments Currency
Quantity/Nominal
Value
Market Value USD
% of Net Assets
Transferable securities and money market instruments admitted to official exchange listing or dealt in on another regulated market
Equities (continued)
hong KongCK Asset Holdings Ltd. HKD 537,000 2,756,371 0.44 ESR Cayman Ltd., Reg. S HKD 988,000 3,542,274 0.57 Hang Lung Properties Ltd. HKD 1,173,000 3,093,654 0.50 Hongkong Land Holdings Ltd. USD 1,483,200 6,125,616 0.99 Link REIT HKD 1,151,446 10,484,039 1.69 New World Development Co. Ltd. HKD 1,009,455 4,699,748 0.76 Sun Hung Kai Properties Ltd. HKD 1,140,989 14,715,053 2.37 Swire Properties Ltd. HKD 2,714,550 7,894,502 1.27 Wharf Real Estate Investment Co. Ltd. HKD 1,163,631 6,055,349 0.97
59,366,606 9.56
IrelandHibernia REIT plc EUR 5,949,308 8,423,558 1.36
8,423,558 1.36
JapanActivia Properties, Inc., REIT JPY 337 1,423,069 0.23 Advance Residence Investment Corp., REIT JPY 919 2,762,743 0.44 Daiwa Office Investment Corp., REIT JPY 233 1,485,150 0.24 GLP J-Reit, REIT JPY 3,256 5,148,223 0.83 Hulic Co. Ltd. JPY 79,675 873,150 0.14 Japan Hotel REIT Investment Corp. JPY 2,134 1,096,221 0.18 Japan Prime Realty Investment Corp., REIT JPY 237 786,815 0.13 Japan Real Estate Investment Corp., REIT JPY 1,075 6,219,049 1.00 Japan Retail Fund Investment Corp., REIT JPY 1,541 2,808,427 0.45 Kenedix Office Investment Corp., REIT JPY 134 910,545 0.15 Kenedix Retail REIT Corp. JPY 99 241,599 0.04 LaSalle Logiport REIT JPY 959 1,549,000 0.25 Mitsubishi Estate Co. Ltd. JPY 758,675 12,189,799 1.96 Mitsubishi Estate Logistics REIT
Investment Corp. JPY 500 2,087,382 0.34 Mitsui Fudosan Co. Ltd. JPY 593,575 12,388,019 1.99 Mitsui Fudosan Logistics Park, Inc., REIT JPY 1,093 5,542,407 0.89 Mori Trust Sogo Reit, Inc. JPY 663 855,783 0.14 Nippon Building Fund, Inc., REIT JPY 1,479 8,586,368 1.38 Nippon Prologis REIT, Inc. JPY 1,306 4,081,363 0.66 Nomura Real Estate Master Fund, Inc.,
REIT JPY 2,442 3,502,645 0.56 Orix JREIT, Inc., REIT JPY 547 904,599 0.15 Sumitomo Realty & Development Co. Ltd. JPY 285,500 8,804,350 1.42 United Urban Investment Corp., REIT JPY 1,605 1,987,776 0.32
86,234,482 13.89
netherlandsEurocommercial Properties NV, REIT, CVA EUR 336,770 6,354,963 1.02 NSI NV, REIT EUR 102,178 4,112,014 0.66
10,466,977 1.68
norwayEntra ASA, Reg. S NOK 56,089 1,267,420 0.20 Norwegian Property ASA NOK 382,611 587,789 0.10
1,855,209 0.30
schEDUlE of InVEsTmEnTsAs at 31 December 2020
Investments Currency
Quantity/Nominal
Value
Market Value USD
% of Net Assets
Transferable securities and money market instruments admitted to official exchange listing or dealt in on another regulated market
Equities (continued)
singaporeAscendas Real Estate Investment Trust SGD 642,899 1,450,591 0.23 CapitaLand Integrated Commercial Trust,
REIT SGD 1,108,009 1,812,103 0.29 Frasers Logistics & Commercial Trust,
REIT, Reg. S SGD 754,100 805,071 0.13 Keppel DC REIT SGD 1,931,000 4,108,417 0.66 Mapletree Commercial Trust, REIT SGD 1,315,383 2,121,377 0.34 Mapletree Industrial Trust, REIT SGD 1,036,400 2,267,834 0.37 Mapletree Logistics Trust, REIT SGD 813,402 1,237,905 0.20
13,803,298 2.22
south KoreaESR Kendall Square REIT Co. Ltd. KRW 131,012 610,136 0.10
610,136 0.10
spainInmobiliaria Colonial Socimi SA, REIT EUR 474,616 4,673,161 0.75 Merlin Properties Socimi SA, REIT EUR 1,007,522 9,617,395 1.55
14,290,556 2.30
swedenAtrium Ljungberg AB ‘B’ SEK 104,262 2,191,369 0.35 Castellum AB SEK 59,137 1,501,649 0.24 Fabege AB SEK 366,328 5,761,449 0.93 Hufvudstaden AB ‘A’ SEK 277,270 4,592,701 0.74 Kungsleden AB SEK 101,305 1,110,581 0.18
15,157,749 2.44
switzerlandPSP Swiss Property AG CHF 42,169 5,634,834 0.91
5,634,834 0.91
United KingdomBritish Land Co. plc (The), REIT GBP 1,543,644 10,310,612 1.66 Capital & Counties Properties plc, REIT GBP 268,268 531,331 0.09 Derwent London plc, REIT GBP 125,562 5,309,916 0.86 Grainger plc GBP 464,631 1,799,877 0.29 Great Portland Estates plc, REIT GBP 482,890 4,406,087 0.71 Hammerson plc GBP 14,751,085 5,007,014 0.81 Helical plc GBP 2,090 10,663 0.00 Land Securities Group plc, REIT GBP 1,221,050 11,238,100 1.81 Segro plc, REIT GBP 481,485 6,232,126 1.00 St Modwen Properties plc GBP 493,137 2,694,363 0.43 Tritax Big Box REIT plc GBP 1,175,217 2,695,239 0.43 Urban & Civic plc, REIT GBP 434,344 2,040,895 0.33 Workspace Group plc, REIT GBP 61,193 642,771 0.10
52,918,994 8.52
United states of americaAlexandria Real Estate Equities, Inc., REIT USD 6,481 1,136,314 0.18 American Campus Communities, Inc., REIT USD 55,685 2,339,884 0.38 AvalonBay Communities, Inc., REIT USD 64,750 10,221,435 1.65 Boston Properties, Inc., REIT USD 60,456 5,632,686 0.91 Brixmor Property Group, Inc., REIT USD 245,213 3,987,163 0.64

61 Morgan Stanley Investment Funds 31 December 2020
The accompanying notes are an integral part of these financial statements.
Global Property Fund (continued)
schEDUlE of InVEsTmEnTsAs at 31 December 2020
Investments Currency
Quantity/Nominal
Value
Market Value USD
% of Net Assets
Transferable securities and money market instruments admitted to official exchange listing or dealt in on another regulated market
Equities (continued)
United states of america (continued)Camden Property Trust, REIT USD 59,804 5,858,400 0.94 Cousins Properties, Inc., REIT USD 83,307 2,753,296 0.44 CubeSmart, REIT USD 126,849 4,267,200 0.69 Digital Realty Trust, Inc., REIT USD 72,258 9,959,320 1.60 Duke Realty Corp., REIT USD 99,243 3,888,341 0.63 Equity LifeStyle Properties, Inc., REIT USD 63,267 3,950,391 0.64 Equity Residential, REIT USD 135,217 7,900,729 1.27 Essex Property Trust, Inc., REIT USD 20,828 4,888,123 0.79 First Industrial Realty Trust, Inc., REIT USD 29,962 1,241,625 0.20 Gaming and Leisure Properties, Inc., REIT USD 91,467 3,807,771 0.61 Healthcare Realty Trust, Inc., REIT USD 137,875 4,030,086 0.65 Healthpeak Properties, Inc., REIT USD 263,643 7,827,561 1.26 Host Hotels & Resorts, Inc., REIT USD 287,162 4,152,363 0.67 Hudson Pacific Properties, Inc., REIT USD 93,249 2,197,879 0.35 Invitation Homes, Inc., REIT USD 272,980 8,022,882 1.29 JBG SMITH Properties, REIT USD 125,518 3,867,210 0.62 Kilroy Realty Corp., REIT USD 64,788 3,619,058 0.58 Mack-Cali Realty Corp., REIT USD 108,281 1,331,856 0.21 Medical Properties Trust, Inc., REIT USD 181,324 3,912,972 0.63 NETSTREIT Corp. USD 209,152 4,045,000 0.65 Prologis, Inc., REIT USD 185,244 18,246,534 2.94 Public Storage, REIT USD 58,956 13,497,387 2.17 QTS Realty Trust, Inc., REIT ‘A’ USD 31,902 1,930,709 0.31 Regency Centers Corp., REIT USD 65,778 2,963,299 0.48 RLJ Lodging Trust, REIT USD 248,519 3,519,029 0.57 Sabra Health Care REIT, Inc. USD 81,246 1,413,680 0.23 Simon Property Group, Inc., REIT USD 113,356 9,419,884 1.52 SL Green Realty Corp., REIT USD 66,660 3,844,282 0.62 Sunstone Hotel Investors, Inc., REIT USD 358,492 4,029,450 0.65 Ventas, Inc., REIT USD 119,145 5,785,681 0.93 VEREIT, Inc. USD 158,474 5,869,877 0.95 Weingarten Realty Investors, REIT USD 214,379 4,551,266 0.73
189,910,623 30.58
Total Equities 603,150,781 97.13
Total Transferable securities and money market instruments admitted to official exchange listing or dealt in on another regulated market 603,150,781 97.13
Other transferable securities and money market instruments not admitted to official exchange listing or dealt in on another regulated market
Equities
maltaBGP Holdings plc* EUR 3,475,560 5,117 0.00
5,117 0.00
Total Equities 5,117 0.00
Total other transferable securities and money market instruments not admitted to official exchange listing or dealt in on another regulated market 5,117 0.00
schEDUlE of InVEsTmEnTsAs at 31 December 2020
Investments Currency
Quantity/Nominal
Value
Market Value USD
% of Net Assets
Units of authorised UCITS or other collective investment undertakings
collective Investment schemes – UcITs
luxembourgMorgan Stanley Liquidity Funds US Dollar
Treasury Liquidity Fund – MS Reserve† USD 8,009,308 8,009,308 1.29
8,009,308 1.29
Total collective Investment schemes – UcITs 8,009,308 1.29
Total Units of authorised UcITs or other collective investment undertakings 8,009,308 1.29
Total Investments 611,165,206 98.42
cash 7,912,806 1.27
other assets/(liabilities) 1,909,730 0.31
Total net assets 620,987,742 100.00
* Security is valued at its fair value under the direction of the Board of Directors.† Managed by an affiliate of the Investment Adviser.The country disclosed within the Schedule of Investments refers to the country of risk. The country of incorporation may differ.

Morgan Stanley Investment Funds 31 December 2020 62
The accompanying notes are an integral part of these financial statements.
Global Property Fund (continued)
forward currency Exchange contracts
currency Purchased
amount Purchased
currency sold amount soldmaturity Date counterparty
Unrealised Gain/(loss)
UsD
% of net
assets
EUR hedged share classUSD 58,583 EUR 47,642 05/01/2021 J.P. Morgan 129 0.00EUR 61,262,356 USD 74,522,021 08/01/2021 J.P. Morgan 649,225 0.10 USD 3,789 EUR 3,081 08/01/2021 J.P. Morgan 8 0.00
Unrealised Gain on naV hedged share classes forward currency Exchange contracts – assets 649,362 0.10
Total Unrealised Gain on forward currency Exchange contracts – assets 649,362 0.10
EUR hedged share classEUR 3,081 USD 3,788 05/01/2021 J.P. Morgan (8) 0.00EUR 47,642 USD 58,588 08/01/2021 J.P. Morgan (130) 0.00USD 25,595 EUR 20,920 08/01/2021 J.P. Morgan (74) 0.00
Unrealised loss on naV hedged share classes forward currency Exchange contracts – liabilities (212) 0.00
Total Unrealised loss on forward currency Exchange contracts – liabilities (212) 0.00
net Unrealised Gain on forward currency Exchange contracts – assets 649,150 0.10
DERIVaTIVEs
Over-the-counter (OTC) and exchange traded derivatives as at 31 December 2020, expressed in US Dollars.

63 Morgan Stanley Investment Funds 31 December 2020
The accompanying notes are an integral part of these financial statements.
Please refer to the full prospectus for the Fund’s investment objective and policy.
Global Property Unconstrained Fund
schEDUlE of InVEsTmEnTsAs at 31 December 2020
Investments Currency
Quantity/ Nominal
Value
Market Value USD
% of Net Assets
Transferable securities and money market instruments admitted to official exchange listing or dealt in on another regulated market
Equities
Data centersDigital Realty Trust, Inc., REIT USD 170 23,431 0.58 QTS Realty Trust, Inc., REIT ‘A’ USD 258 15,614 0.39
39,045 0.97
DiversifiedBritish Land Co. plc (The), REIT GBP 15,506 103,571 2.57 China Resources Land Ltd. HKD 3,476 14,345 0.36 China Resources Mixc Lifestyle Services
Ltd., Reg. S HKD 26 121 0.00 CK Asset Holdings Ltd. HKD 2,491 12,786 0.32 GPT Group (The), REIT AUD 5,632 19,593 0.49 Great Portland Estates plc, REIT GBP 9,950 90,788 2.26 Hufvudstaden AB ‘A’ SEK 1,463 24,233 0.60 ICADE, REIT EUR 74 5,711 0.14 JBG SMITH Properties, REIT USD 552 17,007 0.42 Land Securities Group plc, REIT GBP 13,677 125,878 3.14 Mack-Cali Realty Corp., REIT USD 3,580 44,034 1.09 Merlin Properties Socimi SA, REIT EUR 6,285 59,994 1.49 Mitsubishi Estate Co. Ltd. JPY 7,493 120,392 2.99 Mitsui Fudosan Co. Ltd. JPY 4,960 103,516 2.57 New World Development Co. Ltd. HKD 2,897 13,488 0.34 Sumitomo Realty & Development Co. Ltd. JPY 1,440 44,407 1.10 Sun Hung Kai Properties Ltd. HKD 8,076 104,154 2.59 Swire Properties Ltd. HKD 37,053 107,758 2.68 UOL Group Ltd. SGD 983 5,738 0.14 Vornado Realty Trust, REIT USD 3,072 110,438 2.74 Wharf Real Estate Investment Co. Ltd. HKD 9,132 47,521 1.18
1,175,473 29.21
health careHealthcare Realty Trust, Inc., REIT USD 593 17,333 0.43 Healthpeak Properties, Inc., REIT USD 656 19,477 0.48 Ventas, Inc., REIT USD 1,102 53,513 1.33
90,323 2.24
IndustrialGLP J-Reit, REIT JPY 10 15,812 0.39 Prologis, Inc., REIT USD 2,487 244,969 6.09 Segro plc, REIT GBP 994 12,866 0.32
273,647 6.80
lodging/ResortsDiamondRock Hospitality Co., REIT USD 168 1,398 0.03 Host Hotels & Resorts, Inc., REIT USD 5,733 82,899 2.07 Japan Hotel REIT Investment Corp. JPY 82 42,123 1.05 RLJ Lodging Trust, REIT USD 2,761 39,096 0.97 Sunstone Hotel Investors, Inc., REIT USD 5,101 57,335 1.42
222,851 5.54
InVEsTmEnT aIm
To seek long term capital appreciation, measured in US Dollars, by investing in an index-agnostic manner in equity securities of companies in the real estate industry that may offer the highest total expected returns on a risk-adjusted basis worldwide, including in both developed markets and emerging markets. The Fund may also invest on an ancillary basis in preference shares, debt securities convertible into common shares, warrants and other equity linked instruments and may make use of exchange traded and over-the-counter options, futures and other derivatives for investment or efficient portfolio management (including hedging) purposes.

Morgan Stanley Investment Funds 31 December 2020 64
The accompanying notes are an integral part of these financial statements.
Global Property Unconstrained Fund (continued)
schEDUlE of InVEsTmEnTsAs at 31 December 2020
Investments Currency
Quantity/ Nominal
Value
Market Value USD
% of Net Assets
Transferable securities and money market instruments admitted to official exchange listing or dealt in on another regulated market
Equities (continued)
officeAlexandria Real Estate Equities, Inc., REIT USD 12 2,104 0.05 Boston Properties, Inc., REIT USD 1,814 169,010 4.20 Derwent London plc, REIT GBP 1,505 63,645 1.58 Dexus, REIT AUD 5,572 40,491 1.01 Gecina SA, REIT EUR 680 105,375 2.62 Hibernia REIT plc EUR 24,457 34,628 0.86 Hongkong Land Holdings Ltd. USD 39,765 164,229 4.08 Hudson Pacific Properties, Inc., REIT USD 1,917 45,184 1.12 Inmobiliaria Colonial Socimi SA, REIT EUR 1,666 16,404 0.41 Nippon Building Fund, Inc., REIT JPY 12 69,666 1.73 Paramount Group, Inc., REIT USD 1,013 8,975 0.22 SL Green Realty Corp., REIT USD 3,425 197,521 4.91
917,232 22.79
ResidentialAmerican Campus Communities, Inc., REIT USD 157 6,597 0.16 Apartment Income REIT Corp. USD 131 4,977 0.12 AvalonBay Communities, Inc., REIT USD 671 105,924 2.63 Camden Property Trust, REIT USD 437 42,809 1.06 China Overseas Land & Investment Ltd. HKD 1,518 3,301 0.08 Deutsche Wohnen SE EUR 2,207 117,937 2.94 Equity Residential, REIT USD 1,862 108,797 2.70 Essex Property Trust, Inc., REIT USD 117 27,459 0.68 Invitation Homes, Inc., REIT USD 1,775 52,167 1.30 Mid-America Apartment Communities, Inc.,
REIT USD 113 14,075 0.35
484,043 12.02
RetailBrixmor Property Group, Inc., REIT USD 1,219 19,821 0.49 Citycon OYJ EUR 1,595 15,496 0.38 Eurocommercial Properties NV, REIT, CVA EUR 2,994 56,498 1.40 Federal Realty Investment Trust, REIT USD 133 11,145 0.28 Hammerson plc GBP 180,938 61,416 1.53 Kimco Realty Corp., REIT USD 1,358 19,861 0.49 Klepierre SA, REIT EUR 4,992 112,637 2.80 Link REIT HKD 5,867 53,420 1.33 Mercialys SA, REIT EUR 2,374 21,030 0.52 Regency Centers Corp., REIT USD 1,512 68,116 1.69 RioCan Real Estate Investment Trust CAD 882 11,562 0.29 Scentre Group, REIT AUD 10,498 22,562 0.56 Simon Property Group, Inc., REIT USD 1,831 152,156 3.78 Weingarten Realty Investors, REIT USD 2,449 51,992 1.29
677,712 16.83
self storageCubeSmart, REIT USD 654 22,001 0.55 Public Storage, REIT USD 149 34,112 0.84
56,113 1.39
Total Equities 3,936,439 97.79
Total Transferable securities and money market instruments admitted to official exchange listing or dealt in on another regulated market 3,936,439 97.79
schEDUlE of InVEsTmEnTsAs at 31 December 2020
Investments Currency
Quantity/ Nominal
Value
Market Value USD
% of Net Assets
Units of authorised UCITS or other collective investment undertakings
collective Investment schemes – UcITs
mutual fundsMorgan Stanley Liquidity Funds US Dollar
Treasury Liquidity Fund – MS Reserve† USD 100,031 100,031 2.48
100,031 2.48
Total collective Investment schemes – UcITs 100,031 2.48
Total Units of authorised UcITs or other collective investment undertakings 100,031 2.48
Total Investments 4,036,470 100.27
cash 145,845 3.62
other assets/(liabilities) (156,694) (3.89)
Total net assets 4,025,621 100.00
† Managed by an affiliate of the Investment Adviser.

65 Morgan Stanley Investment Funds 31 December 2020
The accompanying notes are an integral part of these financial statements.
Please refer to the full prospectus for the Fund’s investment objective and policy.
InVEsTmEnT aIm
To seek an attractive long-term rate of return, measured in US Dollars, through investment primarily in equity securities of companies in the world’s developed countries. The strategy will invest in a concentrated portfolio of high quality businesses with strong managements that can sustain high cross-cycle returns on capital.
schEDUlE of InVEsTmEnTsAs at 31 December 2020
Investments Currency
Quantity/ Nominal
Value
Market Value USD
% of Net Assets
Transferable securities and money market instruments admitted to official exchange listing or dealt in on another regulated market
Equities
canadaConstellation Software, Inc. CAD 42,033 54,506,370 2.67
54,506,370 2.67
franceL’Oreal SA EUR 77,856 29,689,057 1.46 LVMH Moet Hennessy Louis Vuitton SE EUR 62,104 38,929,497 1.91 Pernod Ricard SA EUR 94,846 18,246,871 0.89 Sanofi EUR 46,152 4,456,445 0.22
91,321,870 4.48
GermanyHenkel AG & Co. KGaA Preference EUR 783,532 88,299,964 4.34 SAP SE EUR 700,853 91,345,545 4.48
179,645,509 8.82
hong KongAIA Group Ltd. HKD 2,658,600 32,572,941 1.60
32,572,941 1.60
netherlandsHeineken NV EUR 246,978 27,642,139 1.36
27,642,139 1.36
TaiwanTaiwan Semiconductor Manufacturing Co.
Ltd., ADR USD 419,278 45,722,266 2.24
45,722,266 2.24
United KingdomBritish American Tobacco plc GBP 834,669 30,873,892 1.52 Experian plc GBP 141,998 5,386,250 0.26 GlaxoSmithKline plc GBP 340,017 6,232,777 0.31 Prudential plc GBP 1,430,909 26,327,405 1.29 Reckitt Benckiser Group plc GBP 1,217,251 108,772,501 5.34 RELX plc EUR 430,849 10,588,376 0.52 RELX plc GBP 1,340,576 32,823,058 1.61 Unilever plc GBP 323,158 19,386,780 0.95
240,391,039 11.80
United states of americaAbbott Laboratories USD 569,023 61,596,740 3.02 Accenture plc ‘A’ USD 317,854 82,222,473 4.04 Alphabet, Inc. ‘A’ USD 32,029 55,949,538 2.75 Amphenol Corp. ‘A’ USD 289,845 37,627,678 1.85 Automatic Data Processing, Inc. USD 352,755 61,474,614 3.02 Baxter International, Inc. USD 877,760 69,799,475 3.43 Becton Dickinson and Co. USD 281,609 69,827,768 3.43 Cerner Corp. USD 432,337 33,596,908 1.65 Coca-Cola Co. (The) USD 344,806 18,798,823 0.92 Danaher Corp. USD 272,735 60,293,526 2.96 FactSet Research Systems, Inc. USD 26,719 8,849,867 0.43 Fidelity National Information Services, Inc. USD 236,440 33,328,582 1.64
Global Quality Fund

Morgan Stanley Investment Funds 31 December 2020 66
The accompanying notes are an integral part of these financial statements.
Global Quality Fund (continued)
schEDUlE of InVEsTmEnTsAs at 31 December 2020
Investments Currency
Quantity/ Nominal
Value
Market Value USD
% of Net Assets
Transferable securities and money market instruments admitted to official exchange listing or dealt in on another regulated market
Equities (continued)
United states of america (continued)Fox Corp. ‘A’ USD 239,622 7,025,717 0.34 Fox Corp. ‘B’ USD 318,256 9,216,694 0.45 Intercontinental Exchange, Inc. USD 384,148 43,639,213 2.14 Medtronic plc USD 582,651 67,476,812 3.31 Microsoft Corp. USD 540,590 119,740,685 5.88 Moody’s Corp. USD 35,556 10,231,595 0.50 NIKE, Inc. ‘B’ USD 185,377 26,251,237 1.29 Philip Morris International, Inc. USD 1,389,174 113,509,408 5.57 Procter & Gamble Co. (The) USD 537,340 74,212,027 3.64 Roper Technologies, Inc. USD 41,690 17,654,881 0.87 Stanley Black & Decker, Inc. USD 171,043 30,377,237 1.49 Texas Instruments, Inc. USD 178,817 29,048,822 1.43 Thermo Fisher Scientific, Inc. USD 112,006 51,701,970 2.54 Visa, Inc. ‘A’ USD 456,713 100,093,221 4.91 Zoetis, Inc. USD 158,653 25,947,698 1.27
1,319,493,209 64.77
Total Equities 1,991,295,343 97.74
Total Transferable securities and money market instruments admitted to official exchange listing or dealt in on another regulated market 1,991,295,343 97.74
Other transferable securities and money market instruments not admitted to official exchange listing or dealt in on another regulated market
Equities
canadaTopicus.com, Inc.* CAD 78,726 297,602 0.02
297,602 0.02
Total Equities 297,602 0.02
Total other transferable securities and money market instruments not admitted to official exchange listing or dealt in on another regulated market 297,602 0.02
schEDUlE of InVEsTmEnTsAs at 31 December 2020
Investments Currency
Quantity/ Nominal
Value
Market Value USD
% of Net Assets
Units of authorised UCITS or other collective investment undertakings
collective Investment schemes – UcITs
luxembourgMorgan Stanley Liquidity Funds US Dollar
Treasury Liquidity Fund – MS Reserve† USD 33,876,693 33,876,693 1.66
33,876,693 1.66
Total collective Investment schemes – UcITs 33,876,693 1.66
Total Units of authorised UcITs or other collective investment undertakings 33,876,693 1.66
Total Investments 2,025,469,638 99.42
cash 444,547 0.02
other assets/(liabilities) 11,359,798 0.56
Total net assets 2,037,273,983 100.00
* Security is valued at its fair value under the direction of the Board of Directors.† Managed by an affiliate of the Investment Adviser.The country disclosed within the Schedule of Investments refers to the country of risk. The country of incorporation may differ.

67 Morgan Stanley Investment Funds 31 December 2020
The accompanying notes are an integral part of these financial statements.
Global Quality Fund (continued)
forward currency Exchange contracts
currency Purchased
amount Purchased
currency sold
amount sold
maturity Date counterparty
Unrealised Gain/(loss)
UsD
% of net assets
EUR 27,792 USD 34,047 04/01/2021 J.P. Morgan 52 0.00USD 7,463 EUR 6,074 05/01/2021 J.P. Morgan 11 0.00
Unrealised Gain on forward currency Exchange contracts – assets 63 0.00
chf hedged share classCHF 2,130,531 USD 2,406,681 08/01/2021 J.P. Morgan 13,217 0.00
Unrealised Gain on naV hedged share classes forward currency Exchange contracts – assets 13,217 0.00
EUR hedged share classEUR 50,485 USD 61,935 04/01/2021 J.P. Morgan 7 0.00USD 37,503 EUR 30,499 05/01/2021 J.P. Morgan 83 0.00EUR 271,802,616 USD 330,713,870 08/01/2021 J.P. Morgan 2,798,299 0.14 USD 195,939 EUR 159,331 08/01/2021 J.P. Morgan 433 0.00
Unrealised Gain on naV hedged share classes forward currency Exchange contracts – assets 2,798,822 0.14
sGD hedged share classSGD 3,570,495 USD 2,679,627 08/01/2021 J.P. Morgan 23,785 0.00
Unrealised Gain on naV hedged share classes forward currency Exchange contracts – assets 23,785 0.00
Total Unrealised Gain on forward currency Exchange contracts – assets 2,835,887 0.14
USD 29,411 EUR 24,007 04/01/2021 J.P. Morgan (45) 0.00EUR 217,842 USD 267,663 05/01/2021 J.P. Morgan (384) 0.00
Unrealised loss on forward currency Exchange contracts – liabilities (429) 0.00
EUR hedged share classUSD 1,818,172 EUR 1,482,044 04/01/2021 J.P. Morgan (207) 0.00EUR 159,331 USD 195,922 05/01/2021 J.P. Morgan (432) 0.00EUR 30,499 USD 37,506 08/01/2021 J.P. Morgan (83) 0.00USD 1,576,016 EUR 1,291,605 08/01/2021 J.P. Morgan (8,834) 0.00
Unrealised loss on naV hedged share classes forward currency Exchange contracts – liabilities (9,556) 0.00
Total Unrealised loss on forward currency Exchange contracts – liabilities (9,985) 0.00
net Unrealised Gain on forward currency Exchange contracts – assets 2,825,902 0.14
DERIVaTIVEs
Over-the-counter (OTC) and exchange traded derivatives as at 31 December 2020, expressed in US Dollars.

Morgan Stanley Investment Funds 31 December 2020 68
The accompanying notes are an integral part of these financial statements.
Please refer to the full prospectus for the Fund’s investment objective and policy.
Global Sustain Fund
InVEsTmEnT aIm
To seek an attractive long-term rate of return, measured in US Dollars, by investing primarily in equity securities, including depositary receipts, of issuers located in any jurisdiction.
schEDUlE of InVEsTmEnTsAs at 31 December 2020
Investments Currency
Quantity/ Nominal
Value
Market Value USD
% of Net Assets
Transferable securities and money market instruments admitted to official exchange listing or dealt in on another regulated market
Equities
canadaConstellation Software, Inc. CAD 24,793 32,150,368 3.02
32,150,368 3.02
franceL’Oreal SA EUR 45,941 17,518,817 1.64 Sanofi EUR 26,446 2,553,630 0.24
20,072,447 1.88
GermanyHenkel AG & Co. KGaA Preference EUR 462,569 52,129,110 4.90 SAP SE EUR 413,754 53,926,551 5.06
106,055,661 9.96
hong KongAIA Group Ltd. HKD 1,557,400 19,081,132 1.79
19,081,132 1.79
TaiwanTaiwan Semiconductor Manufacturing Co.
Ltd., ADR USD 250,175 27,281,584 2.56
27,281,584 2.56
United KingdomExperian plc GBP 75,462 2,862,415 0.27 GlaxoSmithKline plc GBP 197,635 3,622,804 0.34 Prudential plc GBP 843,752 15,524,258 1.46 Reckitt Benckiser Group plc GBP 720,800 64,410,067 6.05 RELX plc EUR 254,017 6,242,622 0.59 RELX plc GBP 800,931 19,610,231 1.84 Unilever plc GBP 190,935 11,454,505 1.07
123,726,902 11.62
United states of americaAbbott Laboratories USD 334,860 36,248,595 3.40 Accenture plc ‘A’ USD 187,337 48,460,335 4.55 Alphabet, Inc. ‘A’ USD 18,916 33,043,225 3.10 Amphenol Corp. ‘A’ USD 170,910 22,187,536 2.08 Automatic Data Processing, Inc. USD 205,691 35,845,771 3.37 Baxter International, Inc. USD 516,949 41,107,785 3.86 Becton Dickinson and Co. USD 165,013 40,916,623 3.84 Cerner Corp. USD 255,274 19,837,343 1.86 Coca-Cola Co. (The) USD 202,735 11,053,112 1.04 Danaher Corp. USD 160,094 35,391,981 3.32 FactSet Research Systems, Inc. USD 15,742 5,214,065 0.49 Fidelity National Information Services, Inc. USD 141,427 19,935,550 1.87 Fox Corp. ‘A’ USD 138,423 4,058,562 0.38 Fox Corp. ‘B’ USD 191,688 5,551,284 0.52 Intercontinental Exchange, Inc. USD 226,830 25,767,888 2.42 Medtronic plc USD 342,323 39,644,427 3.72 Microsoft Corp. USD 318,492 70,545,978 6.63 Moody’s Corp. USD 20,557 5,915,482 0.56 NIKE, Inc. ‘B’ USD 108,399 15,350,382 1.44 Procter & Gamble Co. (The) USD 317,870 43,901,026 4.12 Roper Technologies, Inc. USD 23,127 9,793,822 0.92 Stanley Black & Decker, Inc. USD 99,797 17,723,947 1.67 Texas Instruments, Inc. USD 105,866 17,197,932 1.62

69 Morgan Stanley Investment Funds 31 December 2020
The accompanying notes are an integral part of these financial statements.
Global Sustain Fund (continued)
schEDUlE of InVEsTmEnTsAs at 31 December 2020
Investments Currency
Quantity/ Nominal
Value
Market Value USD
% of Net Assets
Transferable securities and money market instruments admitted to official exchange listing or dealt in on another regulated market
Equities (continued)
United states of america (continued)Thermo Fisher Scientific, Inc. USD 66,055 30,490,988 2.86 Visa, Inc. ‘A’ USD 271,256 59,448,465 5.58 Zoetis, Inc. USD 92,925 15,197,884 1.43
709,829,988 66.65
Total Equities 1,038,198,082 97.48
Total Transferable securities and money market instruments admitted to official exchange listing or dealt in on another regulated market 1,038,198,082 97.48
Other transferable securities and money market instruments not admitted to official exchange listing or dealt in on another regulated market
Equities
canadaTopicus.com, Inc.* CAD 45,846 173,308 0.01
173,308 0.01
Total Equities 173,308 0.01
Total other transferable securities and money market instruments not admitted to official exchange listing or dealt in on another regulated market 173,308 0.01
Units of authorised UCITS or other collective investment undertakings
collective Investment schemes – UcITs
luxembourgMorgan Stanley Liquidity Funds US Dollar
Treasury Liquidity Fund – MS Reserve† USD 22,998,913 22,998,913 2.16
22,998,913 2.16
Total collective Investment schemes – UcITs 22,998,913 2.16
Total Units of authorised UcITs or other collective investment undertakings 22,998,913 2.16
Total Investments 1,061,370,303 99.65
cash 312,773 0.03
other assets/(liabilities) 3,372,470 0.32
Total net assets 1,065,055,546 100.00
* Security is valued at its fair value under the direction of the Board of Directors.† Managed by an affiliate of the Investment Adviser.The country disclosed within the Schedule of Investments refers to the country of risk. The country of incorporation may differ.
forward currency Exchange contracts
currency Purchased
amount Purchased
currency sold
amount sold
maturity Date counterparty
Unrealised Gain/(loss)
UsD
% of net assets
EUR 292 USD 358 04/01/2021 J.P. Morgan 0 0.00GBP 4 USD 5 04/01/2021 J.P. Morgan 0 0.00USD 57,641 EUR 46,912 05/01/2021 J.P. Morgan 83 0.00
Unrealised Gain on forward currency Exchange contracts – assets 83 0.00
chf hedged share classCHF 12,910,071 USD 14,583,169 08/01/2021 J.P. Morgan 80,336 0.01
Unrealised Gain on naV hedged share classes forward currency Exchange contracts – assets 80,336 0.01
EUR hedged share classEUR 7 USD 9 04/01/2021 J.P. Morgan 0 0.00USD 384,052 EUR 312,326 05/01/2021 J.P. Morgan 846 0.00EUR 226,345,273 USD 275,347,004 08/01/2021 J.P. Morgan 2,387,273 0.22 USD 9 EUR 7 08/01/2021 J.P. Morgan 0 0.00
Unrealised Gain on naV hedged share classes forward currency Exchange contracts – assets 2,388,119 0.22
GBP hedged share classGBP 7,385,989 USD 9,922,976 08/01/2021 J.P. Morgan 166,083 0.02
Unrealised Gain on naV hedged share classes forward currency Exchange contracts – assets 166,083 0.02
Total Unrealised Gain on forward currency Exchange contracts – assets 2,634,621 0.25
USD 60,843 EUR 49,665 04/01/2021 J.P. Morgan (93) 0.00USD 114 GBP 84 05/01/2021 J.P. Morgan 0 0.00
Unrealised loss on forward currency Exchange contracts – liabilities (93) 0.00
chf hedged share classUSD 120,967 CHF 107,300 08/01/2021 J.P. Morgan (906) 0.00
EUR hedged share classUSD 322,353 EUR 262,760 04/01/2021 J.P. Morgan (37) 0.00EUR 312,326 USD 384,085 08/01/2021 J.P. Morgan (849) 0.00USD 915,417 EUR 749,075 08/01/2021 J.P. Morgan (3,727) 0.00
GBP hedged share classUSD 40,257 GBP 29,816 04/01/2021 J.P. Morgan (470) 0.00USD 30,201 GBP 22,200 05/01/2021 J.P. Morgan (123) 0.00USD 10,106 GBP 7,494 08/01/2021 J.P. Morgan (131) 0.00
Unrealised loss on naV hedged share classes forward currency Exchange contracts – liabilities (6,243) 0.00
Total Unrealised loss on forward currency Exchange contracts – liabilities (6,336) 0.00
net Unrealised Gain on forward currency Exchange contracts – assets 2,628,285 0.25
DERIVaTIVEs
Over-the-counter (OTC) and exchange traded derivatives as at 31 December 2020, expressed in US Dollars.

Morgan Stanley Investment Funds 31 December 2020 70
The accompanying notes are an integral part of these financial statements.
Please refer to the full prospectus for the Fund’s investment objective and policy.
schEDUlE of InVEsTmEnTsAs at 31 December 2020
Investments Currency
Quantity/ Nominal
Value
Market Value USD
% of Net Assets
Transferable securities and money market instruments admitted to official exchange listing or dealt in on another regulated market
Equities
auto componentsBalkrishna Industries Ltd. INR 66,434 1,498,236 1.72 Bharat Forge Ltd. INR 235,280 1,693,062 1.95 Varroc Engineering Ltd., Reg. S INR 176,547 961,101 1.11
4,152,399 4.78
automobilesEicher Motors Ltd. INR 74,865 2,595,581 2.99 Mahindra & Mahindra Ltd. INR 188,816 1,863,862 2.14
4,459,443 5.13
BanksAxis Bank Ltd. INR 599,251 5,093,265 5.86 HDFC Bank Ltd. INR 183,091 3,602,408 4.14 ICICI Bank Ltd. INR 988,576 7,245,780 8.34
15,941,453 18.34
chemicalsAarti Industries Ltd. INR 55,745 942,938 1.08 Gulf Oil Lubricants India Ltd. INR 26,399 260,050 0.30 SRF Ltd. INR 38,859 2,967,096 3.42
4,170,084 4.80
construction & EngineeringKEC International Ltd. INR 301,521 1,503,280 1.73 Voltas Ltd. INR 121,797 1,377,569 1.58
2,880,849 3.31
construction materialsRamco Cements Ltd. (The) INR 70,853 772,983 0.89 Shree Cement Ltd. INR 5,244 1,725,018 1.98
2,498,001 2.87
consumer financeCholamandalam Investment and Finance Co. Ltd. INR 577,741 3,067,988 3.53 SBI Cards & Payment Services Ltd. INR 130,079 1,516,502 1.74
4,584,490 5.27
Electric UtilitiesTata Power Co. Ltd. (The) INR 1,077,757 1,116,890 1.28
1,116,890 1.28
Equity Real Estate Investment Trusts (REITs)Mindspace Business Parks REIT, Reg. S INR 311,400 1,364,498 1.57
1,364,498 1.57
Gas UtilitiesIndraprastha Gas Ltd. INR 259,780 1,787,693 2.06 Mahanagar Gas Ltd., Reg. S INR 92,721 1,347,895 1.55
3,135,588 3.61
Indian Equity Fund
InVEsTmEnT aIm
To seek long-term capital appreciation, measured in US Dollars, by investment directly or indirectly, primarily in the equity securities of companies domiciled or exercising the predominant part of their economic activity in India.

71 Morgan Stanley Investment Funds 31 December 2020
The accompanying notes are an integral part of these financial statements.
Indian Equity Fund (continued)
schEDUlE of InVEsTmEnTsAs at 31 December 2020
Investments Currency
Quantity/ Nominal
Value
Market Value USD
% of Net Assets
Transferable securities and money market instruments admitted to official exchange listing or dealt in on another regulated market
Equities (continued)
healthcare servicesApollo Hospitals Enterprise Ltd. INR 62,650 2,070,728 2.38
2,070,728 2.38
InsuranceICICI Prudential Life Insurance Co. Ltd., Reg. S INR 202,700 1,385,174 1.59 SBI Life Insurance Co. Ltd., Reg. S INR 173,157 2,144,911 2.47
3,530,085 4.06
IT servicesInfosys Ltd. INR 462,186 7,950,930 9.14 Larsen & Toubro Infotech Ltd., Reg. S INR 37,938 1,901,853 2.19 Tech Mahindra Ltd. INR 160,805 2,143,791 2.47
11,996,574 13.80
oil, Gas & consumable fuelsPetronet LNG Ltd. INR 808,929 2,743,732 3.16 Reliance Industries Ltd. INR 392,430 6,006,917 6.91
8,750,649 10.07
Personal ProductsMarico Ltd. INR 416,696 2,298,411 2.64
2,298,411 2.64
PharmaceuticalsAlkem Laboratories Ltd. INR 37,941 1,520,875 1.75 Gland Pharma Ltd., Reg. S INR 73,820 2,366,052 2.72 Natco Pharma Ltd. INR 103,498 1,363,845 1.57
5,250,772 6.04
Real Estate management & DevelopmentSobha Ltd. INR 97,227 552,267 0.64
552,267 0.64
Thrifts & mortgage financeAavas Financiers Ltd. INR 49,612 1,152,333 1.33
1,152,333 1.33
schEDUlE of InVEsTmEnTsAs at 31 December 2020
Investments Currency
Quantity/ Nominal
Value
Market Value USD
% of Net Assets
Transferable securities and money market instruments admitted to official exchange listing or dealt in on another regulated market
Equities (continued)
Wireless Telecommunication servicesBharti Airtel Ltd. INR 747,264 5,217,583 6.00
5,217,583 6.00
Total Equities 85,123,097 97.92
Total Transferable securities and money market instruments admitted to official exchange listing or dealt in on another regulated market 85,123,097 97.92
Total Investments 85,123,097 97.92
cash 1,981,675 2.28
other assets/(liabilities) (175,400) (0.20)
Total net assets 86,929,372 100.00

Morgan Stanley Investment Funds 31 December 2020 72
The accompanying notes are an integral part of these financial statements.
Indian Equity Fund (continued)
forward currency Exchange contracts
currency Purchased
amount Purchased
currency sold
amount sold
maturity Date counterparty
Unrealised Gain/(loss)
UsD
% of net assets
EUR 16,353 USD 20,034 04/01/2021 J.P. Morgan 31 0.00USD 40 EUR 33 05/01/2021 J.P. Morgan 0 0.00
Unrealised Gain on forward currency Exchange contracts – assets 31 0.00
Total Unrealised Gain on forward currency Exchange contracts – assets 31 0.00
USD 5,337 EUR 4,356 04/01/2021 J.P. Morgan (8) 0.00EUR 9,415 USD 11,569 05/01/2021 J.P. Morgan (17) 0.00
Unrealised loss on forward currency Exchange contracts – liabilities (25) 0.00
Total Unrealised loss on forward currency Exchange contracts – liabilities (25) 0.00
net Unrealised Gain on forward currency Exchange contracts – assets 6 0.00
DERIVaTIVEs
Over-the-counter (OTC) and exchange traded derivatives as at 31 December 2020, expressed in US Dollars.

73 Morgan Stanley Investment Funds 31 December 2020
The accompanying notes are an integral part of these financial statements.
Please refer to the full prospectus for the Fund’s investment objective and policy.
InVEsTmEnT aIm
To seek an attractive long term rate of return, measured in US Dollars, by investing primarily in equity securities, including depositary receipts (including American Depositary Receipts (ADRs) and Global Depositary Receipts (GDRs)), of companies located in the world’s developed countries excluding the United States of America.
schEDUlE of InVEsTmEnTsAs at 31 December 2020
Investments Currency
Quantity/ Nominal
Value
Market Value USD
% of Net Assets
Transferable securities and money market instruments admitted to official exchange listing or dealt in on another regulated market
Equities
australiaAristocrat Leisure Ltd. AUD 27,171 651,157 0.60
651,157 0.60
canadaBarrick Gold Corp. CAD 115,762 2,639,287 2.41 Cameco Corp. CAD 84,605 1,123,714 1.03 Constellation Software, Inc. CAD 2,319 3,007,167 2.75
6,770,168 6.19
chinaTencent Holdings Ltd. HKD 36,600 2,662,199 2.43
2,662,199 2.43
finlandNeste OYJ EUR 24,559 1,779,676 1.63
1,779,676 1.63
franceAXA SA EUR 95,662 2,290,153 2.09 L’Oreal SA EUR 2,033 775,250 0.71 LVMH Moet Hennessy Louis Vuitton SE EUR 3,428 2,148,820 1.96 Pernod Ricard SA EUR 9,904 1,905,373 1.74 Safran SA EUR 17,467 2,484,920 2.27 Sanofi EUR 31,649 3,056,033 2.79 Thales SA EUR 17,958 1,650,301 1.51
14,310,850 13.07
Germanyadidas AG EUR 1,955 709,763 0.65 Bayer AG EUR 29,675 1,733,676 1.58 Deutsche Post AG EUR 56,128 2,781,597 2.54 Fresenius SE & Co. KGaA EUR 64,484 2,966,857 2.71 Henkel AG & Co. KGaA Preference EUR 37,762 4,255,580 3.89 Infineon Technologies AG EUR 20,100 775,639 0.71 SAP SE EUR 27,136 3,536,766 3.23
16,759,878 15.31
hong KongAIA Group Ltd. HKD 235,600 2,886,551 2.64 Minth Group Ltd. HKD 200,000 1,054,954 0.96
3,941,505 3.60
ItalyMoncler SpA EUR 40,740 2,489,687 2.27
2,489,687 2.27
JapanFANUC Corp. JPY 8,200 2,014,369 1.84 Hoya Corp. JPY 11,200 1,548,911 1.42 Keyence Corp. JPY 3,000 1,687,424 1.54 Kirin Holdings Co. Ltd. JPY 79,900 1,883,907 1.72 Lion Corp. JPY 76,500 1,852,287 1.69
International Equity (ex US) Fund

Morgan Stanley Investment Funds 31 December 2020 74
The accompanying notes are an integral part of these financial statements.
International Equity (ex US) Fund (continued)
schEDUlE of InVEsTmEnTsAs at 31 December 2020
Investments Currency
Quantity/ Nominal
Value
Market Value USD
% of Net Assets
Transferable securities and money market instruments admitted to official exchange listing or dealt in on another regulated market
Equities (continued)
Japan (continued)Shiseido Co. Ltd. JPY 11,200 773,660 0.71 Sumitomo Mitsui Financial Group, Inc. JPY 51,600 1,596,156 1.46
11,356,714 10.38
netherlandsHeineken NV EUR 14,086 1,576,526 1.44
1,576,526 1.44
norwayMowi ASA NOK 48,499 1,077,804 0.99
1,077,804 0.99
singaporeUnited Overseas Bank Ltd. SGD 82,800 1,416,226 1.29
1,416,226 1.29
south KoreaLG Household & Health Care Ltd. KRW 1,096 1,630,171 1.49 Samsung Electronics Co. Ltd. KRW 29,699 2,206,791 2.02
3,836,962 3.51
spainBankinter SA EUR 40,971 222,390 0.20 Grifols SA EUR 27,222 797,586 0.73
1,019,976 0.93
swedenBoliden AB SEK 6,839 241,961 0.22 Epiroc AB ‘A’ SEK 46,308 844,107 0.77 Hexagon AB ‘B’ SEK 22,066 2,012,851 1.84
3,098,919 2.83
switzerlandAlcon, Inc. CHF 6,985 461,706 0.42 Novartis AG CHF 32,368 3,042,232 2.78 Roche Holding AG CHF 6,536 2,290,310 2.09
5,794,248 5.29
TaiwanTaiwan Semiconductor Manufacturing Co. Ltd., ADR USD 20,798 2,268,022 2.07
2,268,022 2.07
United KingdomAnglo American plc GBP 29,201 967,049 0.88 Associated British Foods plc GBP 68,925 2,131,482 1.95 BHP Group plc GBP 49,106 1,291,200 1.18 British American Tobacco plc GBP 72,720 2,689,868 2.46 Experian plc GBP 12,273 465,538 0.43 GlaxoSmithKline plc GBP 135,524 2,484,261 2.27 Imperial Brands plc GBP 88,305 1,852,096 1.69 Legal & General Group plc GBP 365,983 1,330,753 1.22
schEDUlE of InVEsTmEnTsAs at 31 December 2020
Investments Currency
Quantity/ Nominal
Value
Market Value USD
% of Net Assets
Transferable securities and money market instruments admitted to official exchange listing or dealt in on another regulated market
Equities (continued)
United Kingdom (continued)M&G plc GBP 224,771 607,749 0.55 Man Group plc GBP 354,142 667,552 0.61 Prudential plc GBP 151,791 2,792,814 2.55 Reckitt Benckiser Group plc GBP 46,248 4,132,681 3.78 RELX plc EUR 68,336 1,679,399 1.53 RELX plc GBP 57,000 1,395,605 1.27 Unilever plc EUR 26,067 1,585,220 1.45
26,073,267 23.82
Total Equities 106,883,784 97.65
Total Transferable securities and money market instruments admitted to official exchange listing or dealt in on another regulated market 106,883,784 97.65
Other transferable securities and money market instruments not admitted to official exchange listing or dealt in on another regulated market
Equities
canadaTopicus.com, Inc.* CAD 4,273 16,153 0.02
16,153 0.02
Total Equities 16,153 0.02
Total other transferable securities and money market instruments not admitted to official exchange listing or dealt in on another regulated market 16,153 0.02
Units of authorised UCITS or other collective investment undertakings
collective Investment schemes – UcITs
luxembourgMorgan Stanley Liquidity Funds US Dollar
Treasury Liquidity Fund – MS Reserve† USD 2,302,656 2,302,656 2.10
2,302,656 2.10
Total collective Investment schemes – UcITs 2,302,656 2.10
Total Units of authorised UcITs or other collective investment undertakings 2,302,656 2.10
Total Investments 109,202,593 99.77
cash 156,899 0.14
other assets/(liabilities) 98,403 0.09
Total net assets 109,457,895 100.00
* Security is valued at its fair value under the direction of the Board of Directors.† Managed by an affiliate of the Investment Adviser.The country disclosed within the Schedule of Investments refers to the country of risk. The country of incorporation may differ.

75 Morgan Stanley Investment Funds 31 December 2020
The accompanying notes are an integral part of these financial statements.
International Equity (ex US) Fund (continued)
forward currency Exchange contracts
currency Purchased
amount Purchased
currency sold
amount sold
maturity Date counterparty
Unrealised Gain/(loss)
UsD
% of net assets
NOK 82,859 USD 9,664 05/01/2021 J.P. Morgan 47 0.00
Unrealised Gain on forward currency Exchange contracts – assets 47 0.00
Total Unrealised Gain on forward currency Exchange contracts – assets 47 0.00
HKD 449,774 USD 58,019 05/01/2021 J.P. Morgan (13) 0.00
Unrealised loss on forward currency Exchange contracts – liabilities (13) 0.00
Total Unrealised loss on forward currency Exchange contracts – liabilities (13) 0.00
net Unrealised Gain on forward currency Exchange contracts – assets 34 0.00
DERIVaTIVEs
Over-the-counter (OTC) and exchange traded derivatives as at 31 December 2020, expressed in US Dollars.

Morgan Stanley Investment Funds 31 December 2020 76
The accompanying notes are an integral part of these financial statements.
Please refer to the full prospectus for the Fund’s investment objective and policy.
InVEsTmEnT aIm
To seek long-term capital appreciation, measured in Yen, through investment primarily in the equity securities of companies domiciled in or exercising the predominant part of their economic activity in Japan and which are listed on any exchanges or over-the-counter markets.
schEDUlE of InVEsTmEnTsAs at 31 December 2020
Investments Currency
Quantity/ Nominal
Value
Market Value
JPY
% of Net Assets
Transferable securities and money market instruments admitted to official exchange listing or dealt in on another regulated market
Equities
auto componentsIchikoh Industries Ltd. JPY 372,500 257,025,000 2.58 Toyoda Gosei Co. Ltd. JPY 52,400 156,938,000 1.58
413,963,000 4.16
automobilesHonda Motor Co. Ltd. JPY 82,400 237,106,000 2.38
237,106,000 2.38
BanksMitsubishi UFJ Financial Group, Inc. JPY 452,100 206,202,810 2.07 Sumitomo Mitsui Financial Group, Inc. JPY 43,100 137,402,800 1.38
343,605,610 3.45
BeveragesAsahi Group Holdings Ltd. JPY 58,400 247,849,600 2.49
247,849,600 2.49
Building ProductsAGC, Inc. JPY 72,800 262,080,000 2.63
262,080,000 2.63
capital marketsSBI Holdings, Inc. JPY 82,600 202,122,200 2.03
202,122,200 2.03
chemicalsAsahi Kasei Corp. JPY 92,900 97,963,050 0.98 Denka Co. Ltd. JPY 62,800 253,084,000 2.54 Kaneka Corp. JPY 50,900 183,749,000 1.84
534,796,050 5.36
construction & EngineeringMaeda Corp. JPY 214,600 196,788,200 1.98 Penta-Ocean Construction Co. Ltd. JPY 280,700 248,980,900 2.50
445,769,100 4.48
Diversified financial servicesORIX Corp. JPY 127,500 202,023,750 2.03
202,023,750 2.03
Diversified Telecommunication servicesNippon Telegraph & Telephone Corp. JPY 111,000 293,650,500 2.95
293,650,500 2.95
Electronic Equipment, Instruments & componentsHitachi Ltd. JPY 63,100 256,501,500 2.58
256,501,500 2.58
Japanese Equity Fund

77 Morgan Stanley Investment Funds 31 December 2020
The accompanying notes are an integral part of these financial statements.
Japanese Equity Fund (continued)
schEDUlE of InVEsTmEnTsAs at 31 December 2020
Investments Currency
Quantity/ Nominal
Value
Market Value
JPY
% of Net Assets
Transferable securities and money market instruments admitted to official exchange listing or dealt in on another regulated market
Equities (continued)
food ProductsMegmilk Snow Brand Co. Ltd. JPY 122,400 270,136,800 2.71 Nichirei Corp. JPY 83,800 242,936,200 2.44
513,073,000 5.15
household DurablesSony Corp. JPY 48,400 497,794,000 5.00
497,794,000 5.00
InsuranceDai-ichi Life Holdings, Inc. JPY 194,500 301,864,000 3.03
301,864,000 3.03
IT servicesFujitsu Ltd. JPY 26,000 387,530,000 3.88 NEC Corp. JPY 54,600 302,484,000 3.04
690,014,000 6.92
machineryKubota Corp. JPY 95,600 215,195,600 2.16 Mitsubishi Heavy Industries Ltd. JPY 99,000 312,444,000 3.13
527,639,600 5.29
metals & miningNippon Steel Corp. JPY 142,800 189,638,400 1.90
189,638,400 1.90
multiline RetailRyohin Keikaku Co. Ltd. JPY 185,400 390,267,000 3.92
390,267,000 3.92
Paper & forest ProductsOji Holdings Corp. JPY 501,500 294,380,500 2.96
294,380,500 2.96
PharmaceuticalsTakeda Pharmaceutical Co. Ltd. JPY 78,300 294,016,500 2.95
294,016,500 2.95
Real Estate management & DevelopmentDaiwa House Industry Co. Ltd. JPY 101,000 309,464,000 3.10 Open House Co. Ltd. JPY 72,200 273,638,000 2.74
583,102,000 5.84
Road & RailCentral Japan Railway Co. JPY 17,200 250,948,000 2.52
250,948,000 2.52
schEDUlE of InVEsTmEnTsAs at 31 December 2020
Investments Currency
Quantity/ Nominal
Value
Market Value
JPY
% of Net Assets
Transferable securities and money market instruments admitted to official exchange listing or dealt in on another regulated market
Equities (continued)
semiconductors & semiconductor EquipmentRorze Corp. JPY 33,800 225,446,000 2.26 Tokyo Electron Ltd. JPY 6,700 257,280,000 2.59
482,726,000 4.85
specialty RetailKohnan Shoji Co. Ltd. JPY 39,200 126,028,000 1.27 Nojima Corp. JPY 74,800 211,609,200 2.12
337,637,200 3.39
Trading companies & DistributorsITOCHU Corp. JPY 127,000 376,428,000 3.78
376,428,000 3.78
Wireless Telecommunication servicesKDDI Corp. JPY 32,300 99,031,800 0.99 SoftBank Group Corp. JPY 52,800 425,462,400 4.28
524,494,200 5.27
Total Equities 9,693,489,710 97.31
Total Transferable securities and money market instruments admitted to official exchange listing or dealt in on another regulated market 9,693,489,710 97.31
Total Investments 9,693,489,710 97.31
cash 266,190,766 2.67
other assets/(liabilities) 1,310,988 (0.02)
Total net assets 9,960,991,464 100.00

Morgan Stanley Investment Funds 31 December 2020 78
The accompanying notes are an integral part of these financial statements.
Japanese Equity Fund (continued)
forward currency Exchange contracts
currency Purchased
amount Purchased
currency sold
amount sold
maturity Date counterparty
Unrealised Gain/(loss)
JPY
% of net assets
EUR hedged share classEUR 921,670 JPY 116,240,556 08/01/2021 J.P. Morgan 529,671 0.00
Unrealised Gain on naV hedged share classes forward currency Exchange contracts – assets 529,671 0.00
Total Unrealised Gain on forward currency Exchange contracts – assets 529,671 0.00
UsD hedged share classUSD 254,192 JPY 26,353,622 08/01/2021 J.P. Morgan (166,904) 0.00
Unrealised loss on naV hedged share classes forward currency Exchange contracts – liabilities (166,904) 0.00
Total Unrealised loss on forward currency Exchange contracts – liabilities (166,904) 0.00
net Unrealised Gain on forward currency Exchange contracts – assets 362,767 0.00
DERIVaTIVEs
Over-the-counter (OTC) and exchange traded derivatives as at 31 December 2020, expressed in Japanese Yen.

79 Morgan Stanley Investment Funds 31 December 2020
The accompanying notes are an integral part of these financial statements.
Please refer to the full prospectus for the Fund’s investment objective and policy.
InVEsTmEnT aIm
To seek to maximise total return, measured in US Dollars, through investment primarily in the equity and equity related securities of companies incorporated or exercising the predominant part of their economic activity in Latin American countries.
schEDUlE of InVEsTmEnTsAs at 31 December 2020
Investments Currency
Quantity/ Nominal
Value
Market Value USD
% of Net Assets
Transferable securities and money market instruments admitted to official exchange listing or dealt in on another regulated market
Equities
argentinaGlobant SA USD 29,779 6,423,330 2.77
6,423,330 2.77
BrazilAmbev SA BRL 964,386 2,910,826 1.25 Ambipar Participacoes e Empreendimentos S/A BRL 576,994 2,928,718 1.26 Atacadao SA BRL 1,722,005 6,414,312 2.77 B3 SA - Brasil Bolsa Balcao BRL 1,262,014 15,026,159 6.48 Banco BTG Pactual SA BRL 428,659 7,710,876 3.32 Boa Vista Servicos SA BRL 1,126,809 2,753,933 1.19 CCR SA BRL 2,148,529 5,555,676 2.40 Hapvida Participacoes e Investimentos SA,
Reg. S BRL 3,349,542 9,829,139 4.24 Itau Unibanco Holding SA Preference BRL 1,479,409 8,988,422 3.87 Klabin SA BRL 1,438,311 7,278,566 3.14 Localiza Rent a Car SA BRL 877,765 11,630,729 5.01 Lojas Americanas SA BRL 21,378 83,876 0.04 Lojas Americanas SA Preference BRL 1,006,878 5,079,998 2.19 Lojas Renner SA BRL 1,317,020 11,005,394 4.74 Pagseguro Digital Ltd. ‘A’ USD 200,201 11,171,216 4.82 Petroleo Brasileiro SA Preference BRL 1,416,710 7,735,365 3.33 Petroleo Brasileiro SA BRL 2,673,363 14,805,910 6.38 Randon SA Implementos e Participacoes
Preference BRL 2,164,100 6,681,178 2.88 Rede D’Or Sao Luiz SA BRL 342,472 4,504,128 1.94 Rumo SA BRL 2,052,570 7,563,436 3.26 StoneCo Ltd. ‘A’ USD 118,350 9,808,848 4.23 Telefonica Brasil SA BRL 625,266 5,586,353 2.41
165,053,058 71.15
mexicoControladora Vuela Cia de Aviacion SAB
de CV, ADR USD 338,943 4,101,210 1.77 Controladora Vuela Cia de Aviacion SAB
de CV ‘A’ MXN 3,151,346 3,788,545 1.63 Grupo Aeroportuario del Centro Norte SAB
de CV MXN 1,621,594 10,299,256 4.44 Grupo Financiero Banorte SAB de CV ‘O’ MXN 272,067 1,520,478 0.66 Megacable Holdings SAB de CV MXN 2,185,318 8,235,814 3.55 Prologis Property Mexico SA de CV, REIT MXN 3,051,223 6,771,074 2.92 Wal-Mart de Mexico SAB de CV MXN 2,040,396 5,916,692 2.55
40,633,069 17.52
PeruCia de Minas Buenaventura SAA, ADR USD 196,229 2,350,823 1.01
2,350,823 1.01
United states of americaMercadoLibre, Inc. USD 6,675 11,235,026 4.85 Vasta Platform Ltd. USD 190,173 2,721,376 1.17
13,956,402 6.02
Total Equities 228,416,682 98.47
Total Transferable securities and money market instruments admitted to official exchange listing or dealt in on another regulated market 228,416,682 98.47
Latin American Equity Fund
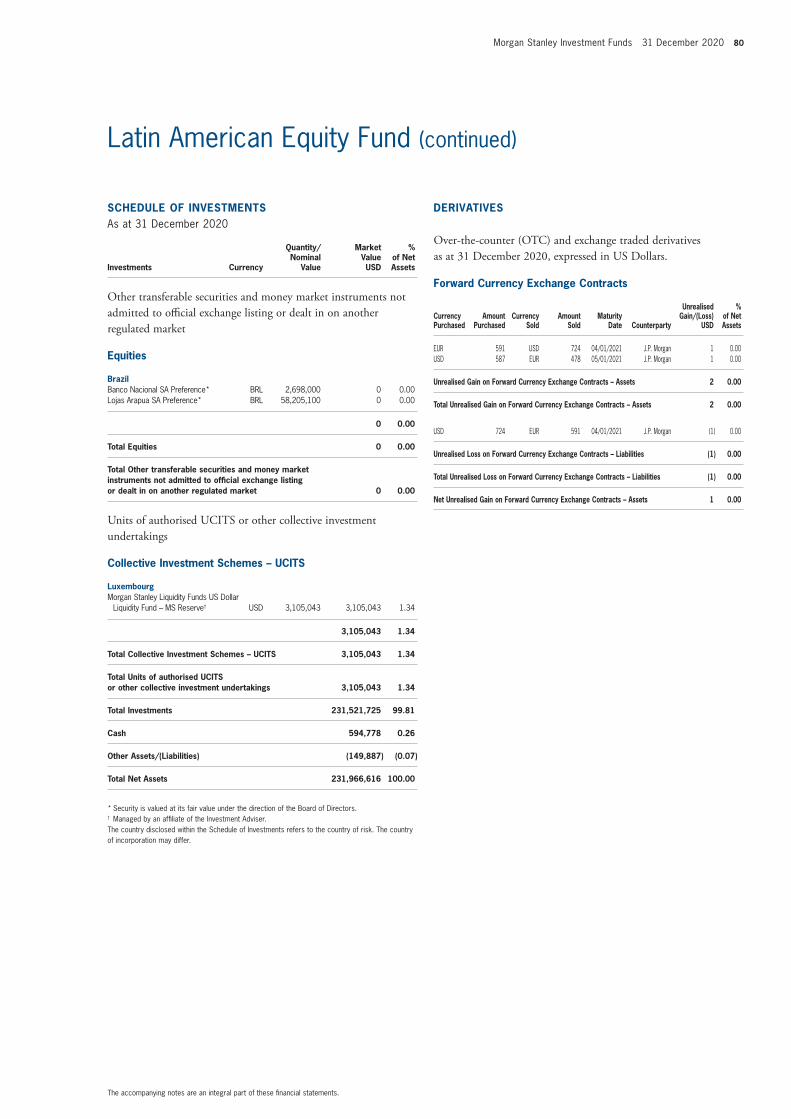
Morgan Stanley Investment Funds 31 December 2020 80
The accompanying notes are an integral part of these financial statements.
Latin American Equity Fund (continued)
schEDUlE of InVEsTmEnTsAs at 31 December 2020
Investments Currency
Quantity/ Nominal
Value
Market Value USD
% of Net Assets
Other transferable securities and money market instruments not admitted to official exchange listing or dealt in on another regulated market
Equities
BrazilBanco Nacional SA Preference* BRL 2,698,000 0 0.00 Lojas Arapua SA Preference* BRL 58,205,100 0 0.00
0 0.00
Total Equities 0 0.00
Total other transferable securities and money market instruments not admitted to official exchange listing or dealt in on another regulated market 0 0.00
Units of authorised UCITS or other collective investment undertakings
collective Investment schemes – UcITs
luxembourgMorgan Stanley Liquidity Funds US Dollar
Liquidity Fund – MS Reserve† USD 3,105,043 3,105,043 1.34
3,105,043 1.34
Total collective Investment schemes – UcITs 3,105,043 1.34
Total Units of authorised UcITs or other collective investment undertakings 3,105,043 1.34
Total Investments 231,521,725 99.81
cash 594,778 0.26
other assets/(liabilities) (149,887) (0.07)
Total net assets 231,966,616 100.00
* Security is valued at its fair value under the direction of the Board of Directors.† Managed by an affiliate of the Investment Adviser.The country disclosed within the Schedule of Investments refers to the country of risk. The country of incorporation may differ.
forward currency Exchange contracts
currency Purchased
amount Purchased
currency sold
amount sold
maturity Date counterparty
Unrealised Gain/(loss)
UsD
% of net assets
EUR 591 USD 724 04/01/2021 J.P. Morgan 1 0.00USD 587 EUR 478 05/01/2021 J.P. Morgan 1 0.00
Unrealised Gain on forward currency Exchange contracts – assets 2 0.00
Total Unrealised Gain on forward currency Exchange contracts – assets 2 0.00
USD 724 EUR 591 04/01/2021 J.P. Morgan (1) 0.00
Unrealised loss on forward currency Exchange contracts – liabilities (1) 0.00
Total Unrealised loss on forward currency Exchange contracts – liabilities (1) 0.00
net Unrealised Gain on forward currency Exchange contracts – assets 1 0.00
DERIVaTIVEs
Over-the-counter (OTC) and exchange traded derivatives as at 31 December 2020, expressed in US Dollars.

81 Morgan Stanley Investment Funds 31 December 2020
The accompanying notes are an integral part of these financial statements.
Please refer to the full prospectus for the Fund’s investment objective and policy.
Sustainable Asian Equity Fund
InVEsTmEnT aIm
To seek long-term capital appreciation, measured in US Dollars, through investment primarily in the equity securities of companies domiciled in or exercising the predominant part of their economic activity in Asia, excluding Japan, thereby taking advantage of the dynamic economic growth capabilities of the region, while incorporating environmental, social and corporate governance (ESG) considerations.
schEDUlE of InVEsTmEnTsAs at 31 December 2020
Investments Currency
Quantity/ Nominal
Value
Market Value USD
% of Net Assets
Transferable securities and money market instruments admitted to official exchange listing or dealt in on another regulated market
Equities
chinaAlibaba Group Holding Ltd., ADR USD 1,868 440,568 1.18 Alibaba Group Holding Ltd. HKD 62,720 1,881,465 5.04 China Mengniu Dairy Co. Ltd. HKD 125,000 754,460 2.02 Hua Hong Semiconductor Ltd., Reg. S HKD 49,000 278,054 0.74 JD Health International, Inc., Reg. S HKD 5,000 96,725 0.26 Jiangsu Hengrui Medicine Co. Ltd. ‘A’ CNY 44,538 759,994 2.03 New Oriental Education & Technology
Group, Inc., ADR USD 4,821 864,261 2.31 Ping An Insurance Group Co. of China Ltd. ‘A’ CNY 21,498 286,271 0.77 Ping An Insurance Group Co. of China Ltd. ‘H’ HKD 15,500 189,905 0.51 Shenzhou International Group Holdings Ltd. HKD 35,200 690,028 1.85 Tencent Holdings Ltd. HKD 42,300 3,076,804 8.23
9,318,535 24.94
hong KongAIA Group Ltd. HKD 79,400 972,802 2.60 Budweiser Brewing Co. APAC Ltd., Reg. S HKD 224,600 741,532 1.99 Hong Kong Exchanges & Clearing Ltd. HKD 21,001 1,151,090 3.08 Sun Hung Kai Properties Ltd. HKD 28,500 367,558 0.98
3,232,982 8.65
IndiaBharti Airtel Ltd. INR 53,796 375,617 1.00 Eicher Motors Ltd. INR 13,746 476,576 1.28 HDFC Bank Ltd., ADR USD 10,648 764,952 2.05 Housing Development Finance Corp. Ltd. INR 28,180 987,717 2.64 ICICI Bank Ltd. INR 134,062 982,609 2.63 ICICI Prudential Life Insurance Co. Ltd.,
Reg. S INR 55,420 378,719 1.01 Infosys Ltd., ADR USD 21,971 372,848 1.00 Infosys Ltd. INR 32,676 562,121 1.50 Mahindra & Mahindra Ltd. INR 56,685 559,556 1.50 Marico Ltd. INR 67,085 370,027 0.99 Reliance Industries Ltd. INR 45,406 695,029 1.86
6,525,771 17.46
IndonesiaBank Central Asia Tbk. PT IDR 306,400 734,773 1.97 Bank Rakyat Indonesia Persero Tbk. PT IDR 1,879,400 555,021 1.48
1,289,794 3.45
singaporeDBS Group Holdings Ltd. SGD 29,346 556,377 1.49 Sea Ltd., ADR USD 4,539 885,604 2.37 Singapore Telecommunications Ltd. SGD 310,800 543,600 1.45
1,985,581 5.31
south KoreaKakao Corp. KRW 1,599 571,332 1.53 LG Chem Ltd. KRW 753 569,038 1.52 NCSoft Corp. KRW 177 151,198 0.40 Samsung Electronics Co. Ltd. KRW 44,091 3,276,192 8.77 Samsung SDI Co. Ltd. KRW 1,094 630,044 1.69
5,197,804 13.91
*Formerly known as Asian Equity Fund prior to 31 December 2020.
*

Morgan Stanley Investment Funds 31 December 2020 82
The accompanying notes are an integral part of these financial statements.
Sustainable Asian Equity Fund (continued)
schEDUlE of InVEsTmEnTsAs at 31 December 2020
Investments Currency
Quantity/ Nominal
Value
Market Value USD
% of Net Assets
Transferable securities and money market instruments admitted to official exchange listing or dealt in on another regulated market
Equities (continued)
TaiwanASE Technology Holding Co. Ltd. TWD 330,755 956,273 2.56 Delta Electronics, Inc. TWD 83,000 776,280 2.08 MediaTek, Inc. TWD 28,000 743,812 1.99 Taiwan Semiconductor Manufacturing Co. Ltd. TWD 194,362 3,663,295 9.80
6,139,660 16.43
ThailandCP ALL PCL THB 184,200 358,061 0.96 Muangthai Capital PCL THB 194,000 381,966 1.02
740,027 1.98
United states of americaASML Holding NV, NYRS USD 2,677 1,298,398 3.48
1,298,398 3.48
Total Equities 35,728,552 95.61
Total Transferable securities and money market instruments admitted to official exchange listing or dealt in on another regulated market 35,728,552 95.61
Units of authorised UCITS or other collective investment undertakings
collective Investment schemes – UcITs
luxembourgMorgan Stanley Liquidity Funds US Dollar
Liquidity Fund – MS Reserve† USD 1,508,556 1,508,556 4.03
1,508,556 4.03
Total collective Investment schemes – UcITs 1,508,556 4.03
Total Units of authorised UcITs or other collective investment undertakings 1,508,556 4.03
Total Investments 37,237,108 99.64
cash 161,668 0.43
other assets/(liabilities) (28,786) (0.07)
Total net assets 37,369,990 100.00
† Managed by an affiliate of the Investment Adviser.The country disclosed within the Schedule of Investments refers to the country of risk. The country of incorporation may differ.
forward currency Exchange contracts
currency Purchased
amount Purchased
currency sold
amount sold
maturity Date counterparty
Unrealised Gain/(loss)
UsD
% of net assets
EUR 5,817 USD 7,126 04/01/2021 J.P. Morgan 11 0.00USD 25,984 EUR 21,148 05/01/2021 J.P. Morgan 37 0.00
Unrealised Gain on forward currency Exchange contracts – assets 48 0.00
Total Unrealised Gain on forward currency Exchange contracts – assets 48 0.00
USD 7,788 EUR 6,357 04/01/2021 J.P. Morgan (12) 0.00EUR 1,896 USD 2,329 05/01/2021 J.P. Morgan (3) 0.00
Unrealised loss on forward currency Exchange contracts – liabilities (15) 0.00
Total Unrealised loss on forward currency Exchange contracts – liabilities (15) 0.00
net Unrealised Gain on forward currency Exchange contracts – assets 33 0.00
DERIVaTIVEs
Over-the-counter (OTC) and exchange traded derivatives as at 31 December 2020, expressed in US Dollars.
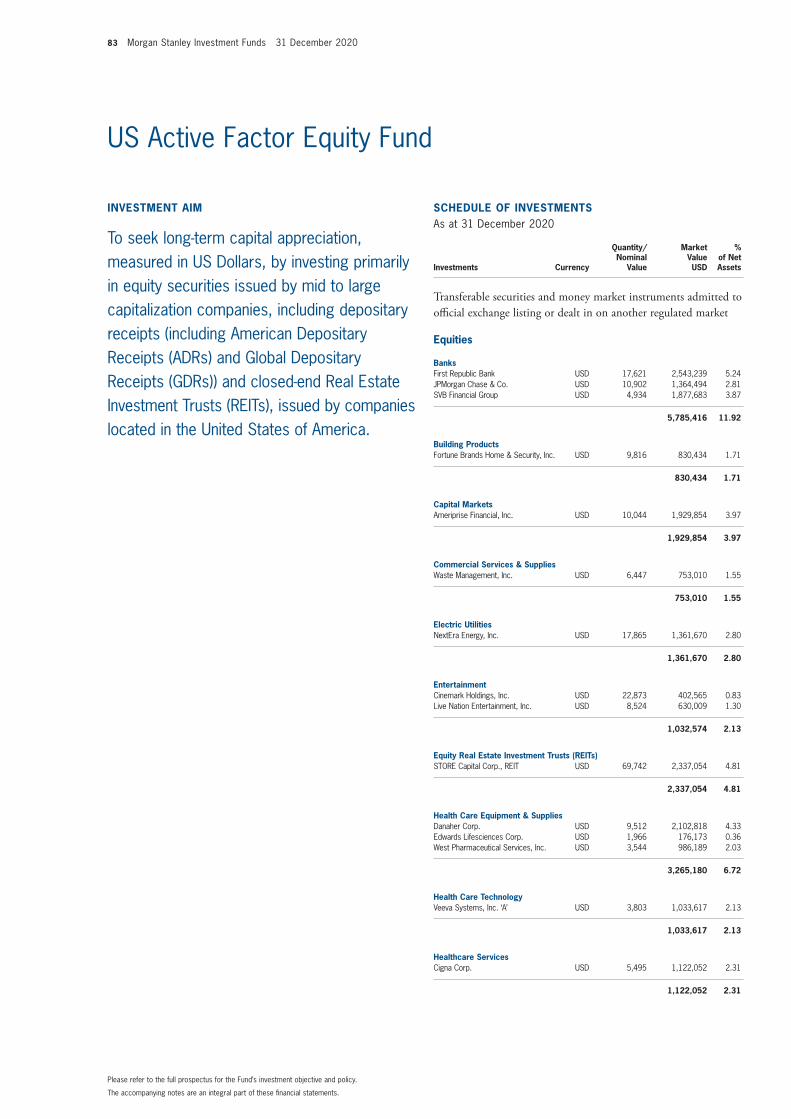
83 Morgan Stanley Investment Funds 31 December 2020
The accompanying notes are an integral part of these financial statements.
Please refer to the full prospectus for the Fund’s investment objective and policy.
US Active Factor Equity Fund
InVEsTmEnT aIm
To seek long-term capital appreciation, measured in US Dollars, by investing primarily in equity securities issued by mid to large capitalization companies, including depositary receipts (including American Depositary Receipts (ADRs) and Global Depositary Receipts (GDRs)) and closed-end Real Estate Investment Trusts (REITs), issued by companies located in the United States of America.
schEDUlE of InVEsTmEnTsAs at 31 December 2020
Investments Currency
Quantity/ Nominal
Value
Market Value USD
% of Net Assets
Transferable securities and money market instruments admitted to official exchange listing or dealt in on another regulated market
Equities
BanksFirst Republic Bank USD 17,621 2,543,239 5.24 JPMorgan Chase & Co. USD 10,902 1,364,494 2.81 SVB Financial Group USD 4,934 1,877,683 3.87
5,785,416 11.92
Building ProductsFortune Brands Home & Security, Inc. USD 9,816 830,434 1.71
830,434 1.71
capital marketsAmeriprise Financial, Inc. USD 10,044 1,929,854 3.97
1,929,854 3.97
commercial services & suppliesWaste Management, Inc. USD 6,447 753,010 1.55
753,010 1.55
Electric UtilitiesNextEra Energy, Inc. USD 17,865 1,361,670 2.80
1,361,670 2.80
EntertainmentCinemark Holdings, Inc. USD 22,873 402,565 0.83 Live Nation Entertainment, Inc. USD 8,524 630,009 1.30
1,032,574 2.13
Equity Real Estate Investment Trusts (REITs)STORE Capital Corp., REIT USD 69,742 2,337,054 4.81
2,337,054 4.81
health care Equipment & suppliesDanaher Corp. USD 9,512 2,102,818 4.33 Edwards Lifesciences Corp. USD 1,966 176,173 0.36 West Pharmaceutical Services, Inc. USD 3,544 986,189 2.03
3,265,180 6.72
health care TechnologyVeeva Systems, Inc. ‘A’ USD 3,803 1,033,617 2.13
1,033,617 2.13
healthcare servicesCigna Corp. USD 5,495 1,122,052 2.31
1,122,052 2.31
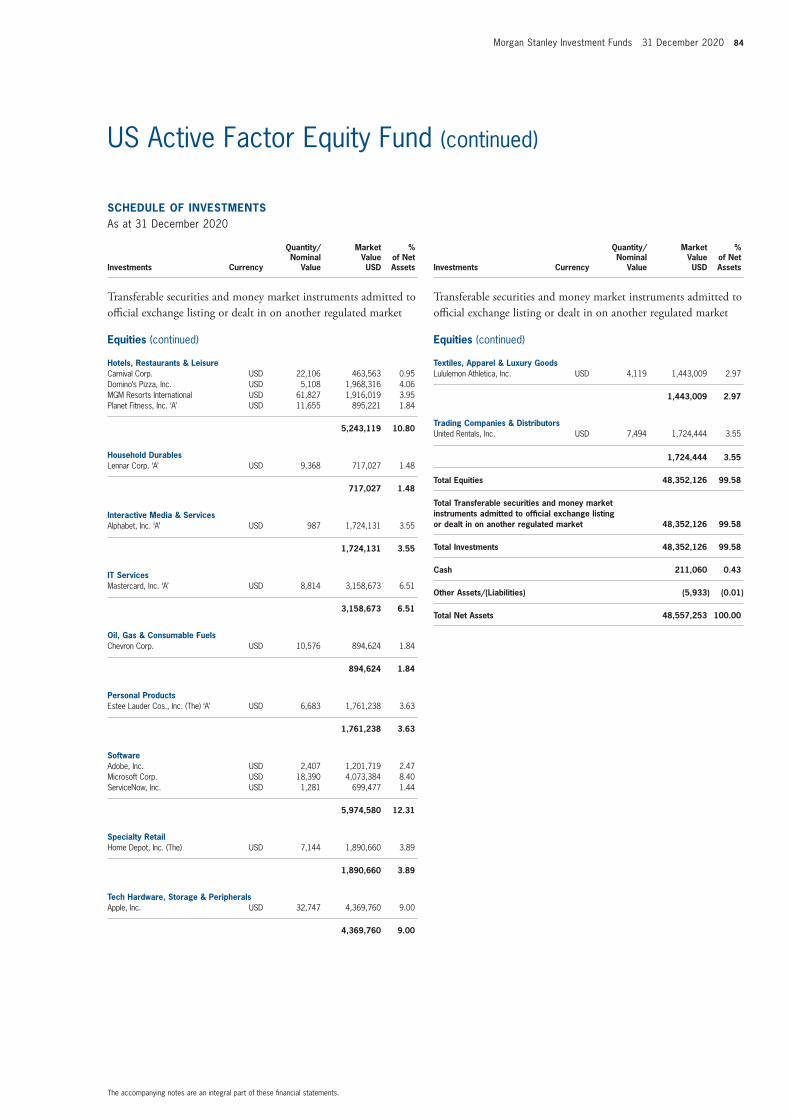
Morgan Stanley Investment Funds 31 December 2020 84
The accompanying notes are an integral part of these financial statements.
US Active Factor Equity Fund (continued)
schEDUlE of InVEsTmEnTsAs at 31 December 2020
Investments Currency
Quantity/ Nominal
Value
Market Value USD
% of Net Assets
Transferable securities and money market instruments admitted to official exchange listing or dealt in on another regulated market
Equities (continued)
hotels, Restaurants & leisureCarnival Corp. USD 22,106 463,563 0.95 Domino’s Pizza, Inc. USD 5,108 1,968,316 4.06 MGM Resorts International USD 61,827 1,916,019 3.95 Planet Fitness, Inc. ‘A’ USD 11,655 895,221 1.84
5,243,119 10.80
household DurablesLennar Corp. ‘A’ USD 9,368 717,027 1.48
717,027 1.48
Interactive media & servicesAlphabet, Inc. ‘A’ USD 987 1,724,131 3.55
1,724,131 3.55
IT servicesMastercard, Inc. ‘A’ USD 8,814 3,158,673 6.51
3,158,673 6.51
oil, Gas & consumable fuelsChevron Corp. USD 10,576 894,624 1.84
894,624 1.84
Personal ProductsEstee Lauder Cos., Inc. (The) ‘A’ USD 6,683 1,761,238 3.63
1,761,238 3.63
softwareAdobe, Inc. USD 2,407 1,201,719 2.47 Microsoft Corp. USD 18,390 4,073,384 8.40 ServiceNow, Inc. USD 1,281 699,477 1.44
5,974,580 12.31
specialty RetailHome Depot, Inc. (The) USD 7,144 1,890,660 3.89
1,890,660 3.89
Tech hardware, storage & PeripheralsApple, Inc. USD 32,747 4,369,760 9.00
4,369,760 9.00
schEDUlE of InVEsTmEnTsAs at 31 December 2020
Investments Currency
Quantity/ Nominal
Value
Market Value USD
% of Net Assets
Transferable securities and money market instruments admitted to official exchange listing or dealt in on another regulated market
Equities (continued)
Textiles, apparel & luxury GoodsLululemon Athletica, Inc. USD 4,119 1,443,009 2.97
1,443,009 2.97
Trading companies & DistributorsUnited Rentals, Inc. USD 7,494 1,724,444 3.55
1,724,444 3.55
Total Equities 48,352,126 99.58
Total Transferable securities and money market instruments admitted to official exchange listing or dealt in on another regulated market 48,352,126 99.58
Total Investments 48,352,126 99.58
cash 211,060 0.43
other assets/(liabilities) (5,933) (0.01)
Total net assets 48,557,253 100.00

85 Morgan Stanley Investment Funds 31 December 2020
The accompanying notes are an integral part of these financial statements.
Please refer to the full prospectus for the Fund’s investment objective and policy.
InVEsTmEnT aIm
To seek long-term capital appreciation, measured in US Dollars, by investing primarily in securities issued by US companies and on ancillary basis in securities issued by companies that are not from the US.
US Advantage Fund
schEDUlE of InVEsTmEnTsAs at 31 December 2020
Investments Currency
Quantity/ Nominal
Value
Market Value USD
% of Net Assets
Transferable securities and money market instruments admitted to official exchange listing or dealt in on another regulated market
Equities
aerospace & DefenseHEICO Corp. ‘A’ USD 3,023,784 354,901,528 2.29
354,901,528 2.29
capital marketsIntercontinental Exchange, Inc. USD 912,222 103,628,419 0.67 S&P Global, Inc. USD 481,837 156,794,578 1.01
260,422,997 1.68
chemicalsEcolab, Inc. USD 1,617,990 350,812,592 2.27 Sherwin-Williams Co. (The) USD 204,055 147,897,023 0.95
498,709,615 3.22
construction materialsMartin Marietta Materials, Inc. USD 1,233,482 345,584,652 2.23
345,584,652 2.23
EntertainmentActivision Blizzard, Inc. USD 2,669,614 245,737,969 1.59 Spotify Technology SA USD 2,372,695 757,340,517 4.89 Take-Two Interactive Software, Inc. USD 800,622 166,097,040 1.07
1,169,175,526 7.55
food & staples RetailingCostco Wholesale Corp. USD 997,392 373,134,321 2.41
373,134,321 2.41
health care Equipment & suppliesDanaher Corp. USD 711,971 157,395,429 1.02 Intuitive Surgical, Inc. USD 947,730 773,082,316 4.99
930,477,745 6.01
health care TechnologyVeeva Systems, Inc. ‘A’ USD 2,682,604 729,104,941 4.71
729,104,941 4.71
Industrial conglomeratesRoper Technologies, Inc. USD 361,111 152,923,286 0.99
152,923,286 0.99
Interactive media & servicesFacebook, Inc. ‘A’ USD 2,720,986 747,563,694 4.83 IAC Corp. USD 1,792,458 339,079,280 2.19 Match Group, Inc. USD 1,563,021 235,703,567 1.52 Twitter, Inc. USD 14,937,248 805,565,784 5.19
2,127,912,325 13.73

Morgan Stanley Investment Funds 31 December 2020 86
The accompanying notes are an integral part of these financial statements.
US Advantage Fund (continued)
schEDUlE of InVEsTmEnTsAs at 31 December 2020
Investments Currency
Quantity/ Nominal
Value
Market Value USD
% of Net Assets
Transferable securities and money market instruments admitted to official exchange listing or dealt in on another regulated market
Equities (continued)
Internet & Direct marketing RetailAmazon.com, Inc. USD 351,386 1,149,826,352 7.43 Chewy, Inc. ‘A’ USD 4,195,141 378,695,378 2.44 Farfetch Ltd. ‘A’ USD 4,096,765 260,922,963 1.68
1,789,444,693 11.55
IT servicesAdyen NV, Reg. S EUR 98,821 230,976,363 1.49 Okta, Inc. USD 2,172,048 562,864,519 3.63 Shopify, Inc. ‘A’ USD 653,479 750,193,892 4.84 Snowflake, Inc. ‘A’ USD 688,181 204,843,956 1.32 Square, Inc. ‘A’ USD 3,531,364 763,657,466 4.93 Twilio, Inc. ‘A’ USD 1,547,601 534,758,050 3.45
3,047,294,246 19.66
metals & miningRoyal Gold, Inc. USD 166,878 17,837,589 0.12
17,837,589 0.12
oil, Gas & consumable fuelsTexas Pacific Land Trust USD 46,603 33,554,160 0.22
33,554,160 0.22
Packaging & containersBall Corp. USD 1,407,285 129,948,697 0.84
129,948,697 0.84
PharmaceuticalsRoyalty Pharma plc ‘A’ USD 6,554,703 322,360,294 2.08 Zoetis, Inc. USD 981,175 160,471,171 1.04
482,831,465 3.12
softwareAvalara, Inc. USD 1,400,617 234,589,341 1.51 Coupa Software, Inc. USD 1,104,545 377,864,845 2.44 ServiceNow, Inc. USD 698,242 381,268,062 2.46 Tyler Technologies, Inc. USD 334,347 143,923,010 0.93 Workday, Inc. ‘A’ USD 1,625,600 389,851,391 2.52 Zoom Video Communications, Inc. ‘A’ USD 999,638 343,375,653 2.22
1,870,872,302 12.08
Textiles, apparel & luxury GoodsLululemon Athletica, Inc. USD 448,735 157,205,333 1.01
157,205,333 1.01
Total Equities 14,471,335,421 93.42
Total Transferable securities and money market instruments admitted to official exchange listing or dealt in on another regulated market 14,471,335,421 93.42
schEDUlE of InVEsTmEnTsAs at 31 December 2020
Investments Currency
Quantity/ Nominal
Value
Market Value USD
% of Net Assets
Units of authorised UCITS or other collective investment undertakings
collective Investment schemes – UcITs
mutual fundsMorgan Stanley Liquidity Funds US Dollar
Treasury Liquidity Fund – MS Reserve† USD 1,049,224,981 1,049,224,981 6.77
1,049,224,981 6.77
Total collective Investment schemes – UcITs 1,049,224,981 6.77
Total Units of authorised UcITs or other collective investment undertakings 1,049,224,981 6.77
Total Investments 15,520,560,402 100.19
cash (10,667,961) (0.07)
other assets/(liabilities) (19,421,917) (0.12)
Total net assets 15,490,470,524 100.00
† Managed by an affiliate of the Investment Adviser.
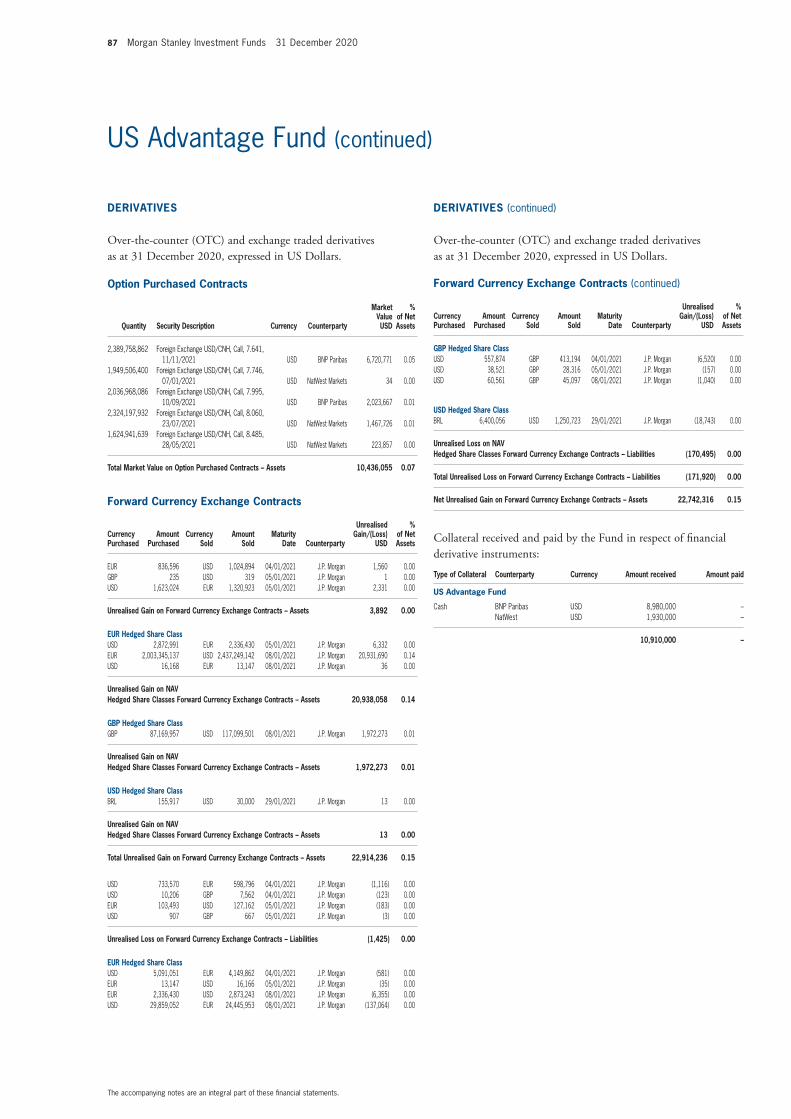
87 Morgan Stanley Investment Funds 31 December 2020
The accompanying notes are an integral part of these financial statements.
US Advantage Fund (continued)
option Purchased contracts
Quantity security Description currency counterparty
market Value UsD
% of net assets
2,389,758,862 Foreign Exchange USD/CNH, Call, 7.641, 11/11/2021 USD BNP Paribas 6,720,771 0.05
1,949,506,400 Foreign Exchange USD/CNH, Call, 7.746, 07/01/2021 USD NatWest Markets 34 0.00
2,036,968,086 Foreign Exchange USD/CNH, Call, 7.995, 10/09/2021 USD BNP Paribas 2,023,667 0.01
2,324,197,932 Foreign Exchange USD/CNH, Call, 8.060, 23/07/2021 USD NatWest Markets 1,467,726 0.01
1,624,941,639 Foreign Exchange USD/CNH, Call, 8.485, 28/05/2021 USD NatWest Markets 223,857 0.00
Total market Value on option Purchased contracts – assets 10,436,055 0.07
forward currency Exchange contracts (continued)
currency Purchased
amount Purchased
currency sold
amount sold
maturity Date counterparty
Unrealised Gain/(loss)
UsD
% of net assets
EUR 836,596 USD 1,024,894 04/01/2021 J.P. Morgan 1,560 0.00GBP 235 USD 319 05/01/2021 J.P. Morgan 1 0.00USD 1,623,024 EUR 1,320,923 05/01/2021 J.P. Morgan 2,331 0.00
Unrealised Gain on forward currency Exchange contracts – assets 3,892 0.00
EUR hedged share classUSD 2,872,991 EUR 2,336,430 05/01/2021 J.P. Morgan 6,332 0.00EUR 2,003,345,137 USD 2,437,249,142 08/01/2021 J.P. Morgan 20,931,690 0.14 USD 16,168 EUR 13,147 08/01/2021 J.P. Morgan 36 0.00
Unrealised Gain on naV hedged share classes forward currency Exchange contracts – assets 20,938,058 0.14
GBP hedged share classGBP 87,169,957 USD 117,099,501 08/01/2021 J.P. Morgan 1,972,273 0.01
Unrealised Gain on naV hedged share classes forward currency Exchange contracts – assets 1,972,273 0.01
UsD hedged share classBRL 155,917 USD 30,000 29/01/2021 J.P. Morgan 13 0.00
Unrealised Gain on naV hedged share classes forward currency Exchange contracts – assets 13 0.00
Total Unrealised Gain on forward currency Exchange contracts – assets 22,914,236 0.15
USD 733,570 EUR 598,796 04/01/2021 J.P. Morgan (1,116) 0.00USD 10,206 GBP 7,562 04/01/2021 J.P. Morgan (123) 0.00EUR 103,493 USD 127,162 05/01/2021 J.P. Morgan (183) 0.00USD 907 GBP 667 05/01/2021 J.P. Morgan (3) 0.00
Unrealised loss on forward currency Exchange contracts – liabilities (1,425) 0.00
EUR hedged share classUSD 5,091,051 EUR 4,149,862 04/01/2021 J.P. Morgan (581) 0.00EUR 13,147 USD 16,166 05/01/2021 J.P. Morgan (35) 0.00EUR 2,336,430 USD 2,873,243 08/01/2021 J.P. Morgan (6,355) 0.00USD 29,859,052 EUR 24,445,953 08/01/2021 J.P. Morgan (137,064) 0.00
forward currency Exchange contracts (continued)
currency Purchased
amount Purchased
currency sold
amount sold
maturity Date counterparty
Unrealised Gain/(loss)
UsD
% of net assets
GBP hedged share classUSD 557,874 GBP 413,194 04/01/2021 J.P. Morgan (6,520) 0.00USD 38,521 GBP 28,316 05/01/2021 J.P. Morgan (157) 0.00USD 60,561 GBP 45,097 08/01/2021 J.P. Morgan (1,040) 0.00
UsD hedged share classBRL 6,400,056 USD 1,250,723 29/01/2021 J.P. Morgan (18,743) 0.00
Unrealised loss on naV hedged share classes forward currency Exchange contracts – liabilities (170,495) 0.00
Total Unrealised loss on forward currency Exchange contracts – liabilities (171,920) 0.00
net Unrealised Gain on forward currency Exchange contracts – assets 22,742,316 0.15
Collateral received and paid by the Fund in respect of financial derivative instruments:
Type of collateral counterparty currency amount received amount paid
Us advantage fund
Cash BNP Paribas USD 8,980,000 –NatWest USD 1,930,000 –
10,910,000 –
DERIVaTIVEs
Over-the-counter (OTC) and exchange traded derivatives as at 31 December 2020, expressed in US Dollars.
DERIVaTIVEs (continued)
Over-the-counter (OTC) and exchange traded derivatives as at 31 December 2020, expressed in US Dollars.

Morgan Stanley Investment Funds 31 December 2020 88
The accompanying notes are an integral part of these financial statements.
Please refer to the full prospectus for the Fund’s investment objective and policy.
InVEsTmEnT aIm
To seek long-term capital appreciation, measured in US Dollars, by investing primarily in securities issued by US companies and on ancillary basis in securities issued by companies that are not from the US.
US Growth Fund
schEDUlE of InVEsTmEnTsAs at 31 December 2020
Investments Currency
Quantity/ Nominal
Value
Market Value USD
% of Net Assets
Transferable securities and money market instruments admitted to official exchange listing or dealt in on another regulated market
Equities
BiotechnologyAlnylam Pharmaceuticals, Inc. USD 165,262 21,236,167 0.31 Moderna, Inc. USD 312,191 34,153,695 0.50
55,389,862 0.81
EntertainmentNetflix, Inc. USD 133,783 72,095,659 1.06 Spotify Technology SA USD 1,030,873 329,044,353 4.81
401,140,012 5.87
food & staples RetailingCostco Wholesale Corp. USD 142,826 53,432,635 0.78
53,432,635 0.78
health care Equipment & suppliesDexCom, Inc. USD 288,375 104,965,616 1.54 Intuitive Surgical, Inc. USD 315,360 257,245,459 3.76
362,211,075 5.30
health care TechnologyVeeva Systems, Inc. ‘A’ USD 912,675 248,055,938 3.63
248,055,938 3.63
healthcare servicesGuardant Health, Inc. USD 532,431 67,080,982 0.98
67,080,982 0.98
hotels, Restaurants & leisureAirbnb, Inc. ‘A’ USD 254,510 37,214,452 0.54
37,214,452 0.54
Interactive media & servicesFacebook, Inc. ‘A’ USD 866,067 237,943,248 3.48 Pinterest, Inc. ‘A’ USD 1,516,595 100,004,274 1.46 Snap, Inc. ‘A’ USD 5,088,902 253,071,096 3.71 Twitter, Inc. USD 4,763,443 256,892,482 3.77 Zillow Group, Inc. ‘C’ USD 1,259,925 163,046,894 2.39
1,010,957,994 14.81
Internet & Direct marketing RetailAmazon.com, Inc. USD 154,557 505,750,689 7.40 Chewy, Inc. ‘A’ USD 740,125 66,811,084 0.98 DoorDash, Inc. ‘A’ USD 412,507 57,940,733 0.85 Wayfair, Inc. ‘A’ USD 420,805 95,627,936 1.40
726,130,442 10.63
IT servicesAdyen NV, Reg. S EUR 43,220 101,018,998 1.48 Fastly, Inc. ‘A’ USD 702,704 61,922,276 0.91 MongoDB, Inc. USD 182,142 65,882,583 0.96 Okta, Inc. USD 631,374 163,614,258 2.40

89 Morgan Stanley Investment Funds 31 December 2020
The accompanying notes are an integral part of these financial statements.
US Growth Fund (continued)
schEDUlE of InVEsTmEnTsAs at 31 December 2020
Investments Currency
Quantity/ Nominal
Value
Market Value USD
% of Net Assets
Transferable securities and money market instruments admitted to official exchange listing or dealt in on another regulated market
Equities (continued)
IT services (continued)Shopify, Inc. ‘A’ USD 291,736 334,912,928 4.90 Snowflake, Inc. ‘A’ USD 724,080 215,529,653 3.16 Square, Inc. ‘A’ USD 1,567,002 338,864,183 4.97 Twilio, Inc. ‘A’ USD 682,469 235,820,338 3.45
1,517,565,217 22.23
life sciences Tools & services10X Genomics, Inc. ‘A’ USD 571,308 81,554,217 1.19 Illumina, Inc. USD 299,041 108,297,698 1.59
189,851,915 2.78
metals & miningRoyal Gold, Inc. USD 64,700 6,915,783 0.10
6,915,783 0.10
oil, Gas & consumable fuelsTexas Pacific Land Trust USD 16,438 11,835,360 0.17
11,835,360 0.17
PharmaceuticalsRoyalty Pharma plc ‘A’ USD 1,114,869 54,829,257 0.80
54,829,257 0.80
Road & RailUber Technologies, Inc. USD 6,342,682 331,119,714 4.85
331,119,714 4.85
semiconductors & semiconductor EquipmentNVIDIA Corp. USD 199,998 104,304,957 1.53
104,304,957 1.53
softwareCloudflare, Inc. ‘A’ USD 877,261 66,101,616 0.97 Coupa Software, Inc. USD 494,766 169,259,449 2.48 Trade Desk, Inc. (The) ‘A’ USD 244,589 197,251,245 2.89 Unity Software, Inc. USD 394,886 60,733,467 0.89 Zoom Video Communications, Inc. ‘A’ USD 811,834 278,864,979 4.08
772,210,756 11.31
specialty RetailCarvana Co. USD 834,879 202,182,647 2.96
202,182,647 2.96
Total Equities 6,152,428,998 90.08
Total Transferable securities and money market instruments admitted to official exchange listing or dealt in on another regulated market 6,152,428,998 90.08
schEDUlE of InVEsTmEnTsAs at 31 December 2020
Investments Currency
Quantity/ Nominal
Value
Market Value USD
% of Net Assets
Other transferable securities and money market instruments not admitted to official exchange listing or dealt in on another regulated market
Equities
health care Technologyagilon health, Inc.* USD 28,270 16,664,600 0.24
16,664,600 0.24
Total Equities 16,664,600 0.24
Total other transferable securities and money market instruments not admitted to official exchange listing or dealt in on another regulated market 16,664,600 0.24
Units of authorised UCITS or other collective investment undertakings
collective Investment schemes – UcITs
mutual fundsMorgan Stanley Liquidity Funds US Dollar
Treasury Liquidity Fund – MS Reserve† USD 587,482,366 587,482,366 8.60
587,482,366 8.60
Total collective Investment schemes – UcITs 587,482,366 8.60
Total Units of authorised UcITs or other collective investment undertakings 587,482,366 8.60
Total Investments 6,756,575,964 98.92
cash (4,174,286) (0.06)
other assets/(liabilities) 77,821,441 1.14
Total net assets 6,830,223,119 100.00
* Security is valued at its fair value under the direction of the Board of Directors.† Managed by an affiliate of the Investment Adviser.

Morgan Stanley Investment Funds 31 December 2020 90
The accompanying notes are an integral part of these financial statements.
US Growth Fund (continued)
option Purchased contracts
Quantity security Description currency counterparty
market Value UsD
% of net assets
971,394,990 Foreign Exchange USD/CNH, Call, 7.641, 11/11/2021 USD BNP Paribas 2,731,875 0.04
529,972,839 Foreign Exchange USD/CNH, Call, 7.746, 07/01/2021 USD NatWest Markets 9 0.00
763,843,344 Foreign Exchange USD/CNH, Call, 7.995, 10/09/2021 USD BNP Paribas 758,856 0.01
825,143,887 Foreign Exchange USD/CNH, Call, 8.060, 23/07/2021 USD NatWest Markets 521,077 0.01
537,757,390 Foreign Exchange USD/CNH, Call, 8.485, 28/05/2021 USD NatWest Markets 74,083 0.00
Total market Value on option Purchased contracts – assets 4,085,900 0.06
forward currency Exchange contracts
currency Purchased
amount Purchased
currency sold
amount sold
maturity Date counterparty
Unrealised Gain/(loss)
UsD
% of net assets
USD 2,029,031 EUR 1,651,358 05/01/2021 J.P. Morgan 2,914 0.00
Unrealised Gain on forward currency Exchange contracts – assets 2,914 0.00
EUR hedged share classEUR 256,542 USD 314,725 04/01/2021 J.P. Morgan 36 0.00USD 2,155,368 EUR 1,752,831 05/01/2021 J.P. Morgan 4,750 0.00EUR 1,059,458,799 USD 1,289,017,860 08/01/2021 J.P. Morgan 10,978,463 0.16 USD 1,249,002 EUR 1,015,649 08/01/2021 J.P. Morgan 2,763 0.00
Unrealised Gain on naV hedged share classes forward currency Exchange contracts – assets 10,986,012 0.16
GBP hedged share classGBP 18,197,175 USD 24,457,374 08/01/2021 J.P. Morgan 399,468 0.01
Unrealised Gain on naV hedged share classes forward currency Exchange contracts – assets 399,468 0.01
Total Unrealised Gain on forward currency Exchange contracts – assets 11,388,394 0.17
USD 894,020 EUR 729,767 04/01/2021 J.P. Morgan (1,361) 0.00USD 861 GBP 633 05/01/2021 J.P. Morgan (3) 0.00
Unrealised loss on forward currency Exchange contracts – liabilities (1,364) 0.00
EUR hedged share classUSD 5,532,134 EUR 4,509,402 04/01/2021 J.P. Morgan (631) 0.00EUR 1,015,649 USD 1,248,893 05/01/2021 J.P. Morgan (2,752) 0.00EUR 1,752,831 USD 2,155,557 08/01/2021 J.P. Morgan (4,768) 0.00USD 14,367,732 EUR 11,754,677 08/01/2021 J.P. Morgan (55,705) 0.00
GBP hedged share classUSD 8,904 GBP 6,595 04/01/2021 J.P. Morgan (104) 0.00USD 767,827 GBP 564,413 05/01/2021 J.P. Morgan (3,121) 0.00USD 2,086,120 GBP 1,538,310 08/01/2021 J.P. Morgan (15,169) 0.00
Unrealised loss on naV hedged share classes forward currency Exchange contracts – liabilities (82,250) 0.00
Total Unrealised loss on forward currency Exchange contracts – liabilities (83,614) 0.00
net Unrealised Gain on forward currency Exchange contracts – assets 11,304,780 0.17
Collateral received and paid by the Fund in respect of financial derivative instruments:
Type of collateral counterparty currency amount received amount paid
Us Growth fund
Cash BNP Paribas USD 3,580,000 –NatWest USD 802,000 –
4,382,000 –
DERIVaTIVEs
Over-the-counter (OTC) and exchange traded derivatives as at 31 December 2020, expressed in US Dollars.
DERIVaTIVEs (continued)

91 Morgan Stanley Investment Funds 31 December 2020
The accompanying notes are an integral part of these financial statements.
Please refer to the full prospectus for the Fund’s investment objective and policy.
InVEsTmEnT aIm
To seek long term capital appreciation, measured in US Dollars, by investing primarily in securities issued by US companies and on an ancillary basis in securities issued by companies that are not from the US. Under normal market conditions, the Fund’s investment objective will be pursued by investing primarily in equity securities of established and emerging companies.
US Insight Fund
schEDUlE of InVEsTmEnTsAs at 31 December 2020
Investments Currency
Quantity/ Nominal
Value
Market Value USD
% of Net Assets
Transferable securities and money market instruments admitted to official exchange listing or dealt in on another regulated market
Equities
BiotechnologyAlnylam Pharmaceuticals, Inc. USD 2,802 360,057 0.32 Moderna, Inc. USD 5,281 577,741 0.51
937,798 0.83
EntertainmentSea Ltd., ADR USD 9,415 1,836,961 1.63 Spotify Technology SA USD 16,850 5,378,351 4.79
7,215,312 6.42
food & staples RetailingCostco Wholesale Corp. USD 2,287 855,590 0.76
855,590 0.76
health care Equipment & suppliesDexCom, Inc. USD 4,780 1,739,872 1.55 Intuitive Surgical, Inc. USD 5,184 4,228,693 3.76
5,968,565 5.31
health care TechnologyVeeva Systems, Inc. ‘A’ USD 15,085 4,099,952 3.65
4,099,952 3.65
healthcare servicesGuardant Health, Inc. USD 8,812 1,110,224 0.99
1,110,224 0.99
hotels, Restaurants & leisureAirbnb, Inc. ‘A’ USD 4,253 621,874 0.55
621,874 0.55
Interactive media & servicesPinterest, Inc. ‘A’ USD 25,067 1,652,918 1.47 Snap, Inc. ‘A’ USD 85,589 4,256,341 3.79 Twitter, Inc. USD 79,582 4,291,857 3.81 Zillow Group, Inc. ‘C’ USD 12,477 1,614,649 1.44
11,815,765 10.51
Internet & Direct marketing RetailAmazon.com, Inc. USD 2,538 8,304,996 7.39 DoorDash, Inc. ‘A’ USD 6,811 956,673 0.85 Overstock.com, Inc. Preference USD 650 30,290 0.03 Overstock.com, Inc. USD 21,818 1,092,209 0.97 Wayfair, Inc. ‘A’ USD 6,965 1,582,796 1.41
11,966,964 10.65
IT servicesAdyen NV, Reg. S EUR 715 1,671,184 1.49 Fastly, Inc. ‘A’ USD 11,626 1,024,483 0.91 MongoDB, Inc. USD 3,016 1,090,917 0.97 Okta, Inc. USD 10,453 2,708,790 2.41 Shopify, Inc. ‘A’ USD 4,821 5,534,508 4.92
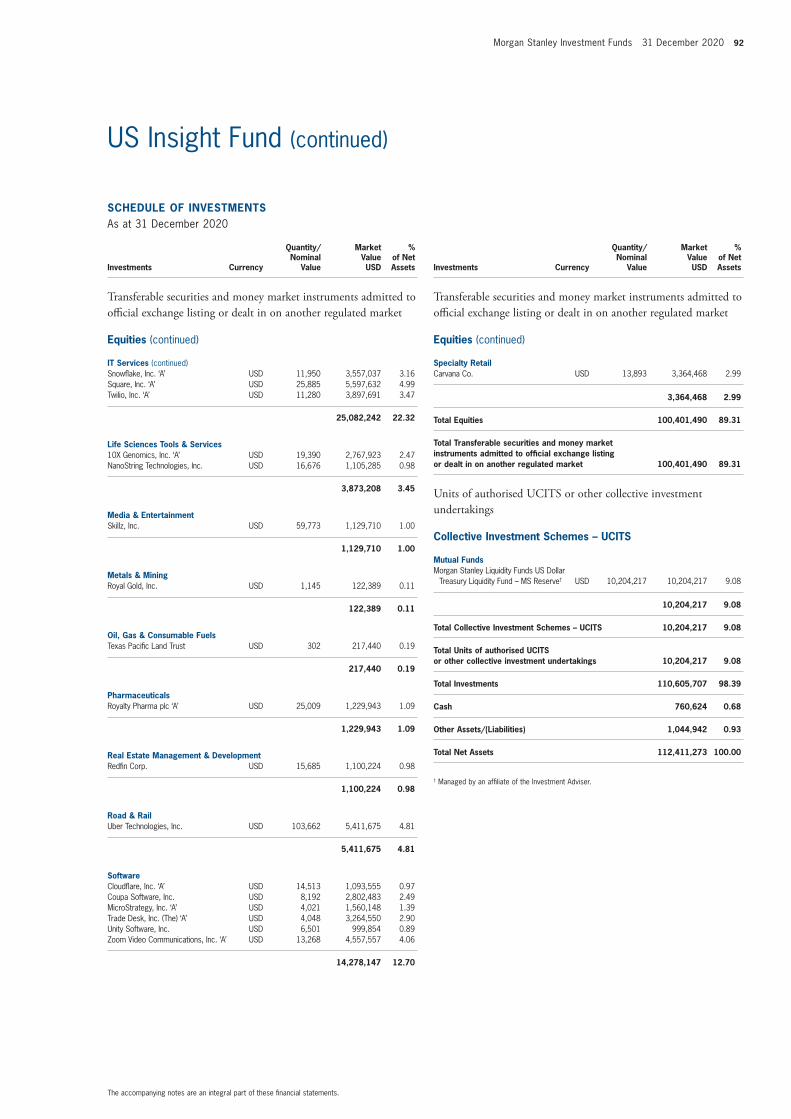
Morgan Stanley Investment Funds 31 December 2020 92
The accompanying notes are an integral part of these financial statements.
US Insight Fund (continued)
schEDUlE of InVEsTmEnTsAs at 31 December 2020
Investments Currency
Quantity/ Nominal
Value
Market Value USD
% of Net Assets
Transferable securities and money market instruments admitted to official exchange listing or dealt in on another regulated market
Equities (continued)
IT services (continued)Snowflake, Inc. ‘A’ USD 11,950 3,557,037 3.16 Square, Inc. ‘A’ USD 25,885 5,597,632 4.99 Twilio, Inc. ‘A’ USD 11,280 3,897,691 3.47
25,082,242 22.32
life sciences Tools & services10X Genomics, Inc. ‘A’ USD 19,390 2,767,923 2.47 NanoString Technologies, Inc. USD 16,676 1,105,285 0.98
3,873,208 3.45
media & EntertainmentSkillz, Inc. USD 59,773 1,129,710 1.00
1,129,710 1.00
metals & miningRoyal Gold, Inc. USD 1,145 122,389 0.11
122,389 0.11
oil, Gas & consumable fuelsTexas Pacific Land Trust USD 302 217,440 0.19
217,440 0.19
PharmaceuticalsRoyalty Pharma plc ‘A’ USD 25,009 1,229,943 1.09
1,229,943 1.09
Real Estate management & DevelopmentRedfin Corp. USD 15,685 1,100,224 0.98
1,100,224 0.98
Road & RailUber Technologies, Inc. USD 103,662 5,411,675 4.81
5,411,675 4.81
softwareCloudflare, Inc. ‘A’ USD 14,513 1,093,555 0.97 Coupa Software, Inc. USD 8,192 2,802,483 2.49 MicroStrategy, Inc. ‘A’ USD 4,021 1,560,148 1.39 Trade Desk, Inc. (The) ‘A’ USD 4,048 3,264,550 2.90 Unity Software, Inc. USD 6,501 999,854 0.89 Zoom Video Communications, Inc. ‘A’ USD 13,268 4,557,557 4.06
14,278,147 12.70
schEDUlE of InVEsTmEnTsAs at 31 December 2020
Investments Currency
Quantity/ Nominal
Value
Market Value USD
% of Net Assets
Transferable securities and money market instruments admitted to official exchange listing or dealt in on another regulated market
Equities (continued)
specialty RetailCarvana Co. USD 13,893 3,364,468 2.99
3,364,468 2.99
Total Equities 100,401,490 89.31
Total Transferable securities and money market instruments admitted to official exchange listing or dealt in on another regulated market 100,401,490 89.31
Units of authorised UCITS or other collective investment undertakings
collective Investment schemes – UcITs
mutual fundsMorgan Stanley Liquidity Funds US Dollar
Treasury Liquidity Fund – MS Reserve† USD 10,204,217 10,204,217 9.08
10,204,217 9.08
Total collective Investment schemes – UcITs 10,204,217 9.08
Total Units of authorised UcITs or other collective investment undertakings 10,204,217 9.08
Total Investments 110,605,707 98.39
cash 760,624 0.68
other assets/(liabilities) 1,044,942 0.93
Total net assets 112,411,273 100.00
† Managed by an affiliate of the Investment Adviser.

93 Morgan Stanley Investment Funds 31 December 2020
The accompanying notes are an integral part of these financial statements.
US Insight Fund (continued)
option Purchased contracts
Quantity security Description currency counterparty
market Value UsD
% of net assets
15,891,837 Foreign Exchange USD/CNH, Call, 7.641, 11/11/2021 USD BNP Paribas 44,693 0.04
2,247,534 Foreign Exchange USD/CNH, Call, 7.746, 07/01/2021 USD NatWest Markets 0 0.00
10,153,858 Foreign Exchange USD/CNH, Call, 7.995, 10/09/2021 USD BNP Paribas 10,088 0.01
5,659,935 Foreign Exchange USD/CNH, Call, 8.060, 23/07/2021 USD NatWest Markets 3,574 0.00
2,354,219 Foreign Exchange USD/CNH, Call, 8.485, 28/05/2021 USD NatWest Markets 324 0.00
Total market Value on option Purchased contracts – assets 58,679 0.05
forward currency Exchange contracts
currency Purchased
amount Purchased
currency sold
amount sold
maturity Date counterparty
Unrealised Gain/(loss)
UsD
% of net assets
USD 88,110 EUR 71,710 05/01/2021 J.P. Morgan 126 0.00
Unrealised Gain on forward currency Exchange contracts – assets 126 0.00
Total Unrealised Gain on forward currency Exchange contracts – assets 126 0.00
USD 19,270 EUR 15,729 04/01/2021 J.P. Morgan (29) 0.00
Unrealised loss on forward currency Exchange contracts – liabilities (29) 0.00
Total Unrealised loss on forward currency Exchange contracts – liabilities (29) 0.00
net Unrealised Gain on forward currency Exchange contracts – assets 97 0.00
DERIVaTIVEs
Over-the-counter (OTC) and exchange traded derivatives as at 31 December 2020, expressed in US Dollars.

Morgan Stanley Investment Funds 31 December 2020 94
The accompanying notes are an integral part of these financial statements.
Please refer to the full prospectus for the Fund’s investment objective and policy.
US Permanence Fund
InVEsTmEnT aIm
To seek long term capital appreciation, measured in US Dollars, by investing primarily in equity securities, including depositary receipts (including American Depositary Receipts (ADRs) and Global Depositary Receipts (GDRs)), of established companies located in the US, with capitalizations within the range of companies included in the S&P 500 Index.
*Fund commenced operations on 30 October 2020.
schEDUlE of InVEsTmEnTsAs at 31 December 2020
Investments Currency
Quantity/ Nominal
Value
Market Value USD
% of Net Assets
Transferable securities and money market instruments admitted to official exchange listing or dealt in on another regulated market
Equities
aerospace & DefenseHEICO Corp. ‘A’ USD 2,263 265,608 4.65
265,608 4.65
capital marketsIntercontinental Exchange, Inc. USD 1,097 124,619 2.18 S&P Global, Inc. USD 444 144,482 2.54
269,101 4.72
chemicalsEcolab, Inc. USD 1,144 248,042 4.35 Sherwin-Williams Co. (The) USD 172 124,664 2.18
372,706 6.53
commercial services & suppliesCintas Corp. USD 164 57,384 1.01 Copart, Inc. USD 456 57,670 1.01 Rollins, Inc. USD 1,354 51,858 0.91
166,912 2.93
construction materialsMartin Marietta Materials, Inc. USD 633 177,348 3.11
177,348 3.11
DistributorsPool Corp. USD 152 55,687 0.98
55,687 0.98
Diversified consumer servicesChegg, Inc. USD 645 58,412 1.02 Service Corp. International USD 1,160 56,480 0.99
114,892 2.01
EntertainmentMadison Square Garden Sports Corp. ‘A’ USD 321 59,757 1.05 Walt Disney Co. (The) USD 1,145 208,453 3.65
268,210 4.70
Equity Real Estate Investment Trusts (REITs)American Tower Corp., REIT USD 255 56,449 0.99 Equinix, Inc., REIT USD 80 56,246 0.99
112,695 1.98
food & staples RetailingCostco Wholesale Corp. USD 721 269,733 4.73
269,733 4.73
*

95 Morgan Stanley Investment Funds 31 December 2020
The accompanying notes are an integral part of these financial statements.
US Permanence Fund (continued)
schEDUlE of InVEsTmEnTsAs at 31 December 2020
Investments Currency
Quantity/ Nominal
Value
Market Value USD
% of Net Assets
Transferable securities and money market instruments admitted to official exchange listing or dealt in on another regulated market
Equities (continued)
food ProductsUtz Brands, Inc. USD 2,491 54,951 0.96
54,951 0.96
health care Equipment & suppliesIDEXX Laboratories, Inc. USD 116 57,421 1.01 Intuitive Surgical, Inc. USD 351 286,318 5.01
343,739 6.02
health care TechnologyVeeva Systems, Inc. ‘A’ USD 997 270,975 4.75
270,975 4.75
holding companies – DiversifiedRedBall Acquisition Corp. ‘A’ USD 5,218 56,928 1.00
56,928 1.00
hotels, Restaurants & leisureStarbucks Corp. USD 836 89,122 1.56 Vail Resorts, Inc. USD 201 55,074 0.97
144,196 2.53
household ProductsColgate-Palmolive Co. USD 989 83,927 1.47
83,927 1.47
Industrial conglomeratesRoper Technologies, Inc. USD 339 143,560 2.52
143,560 2.52
InsuranceProgressive Corp. (The) USD 586 57,100 1.00
57,100 1.00
Internet & Direct marketing RetailAmazon.com, Inc. USD 103 337,043 5.91
337,043 5.91
metals & miningRoyal Gold, Inc. USD 404 43,184 0.76
43,184 0.76
oil, Gas & consumable fuelsTexas Pacific Land Trust USD 125 90,000 1.58
90,000 1.58
schEDUlE of InVEsTmEnTsAs at 31 December 2020
Investments Currency
Quantity/ Nominal
Value
Market Value USD
% of Net Assets
Transferable securities and money market instruments admitted to official exchange listing or dealt in on another regulated market
Equities (continued)
Packaging & containersBall Corp. USD 1,366 126,136 2.21
126,136 2.21
PharmaceuticalsRoyalty Pharma plc ‘A’ USD 4,249 208,966 3.66
208,966 3.66
Professional servicesCoStar Group, Inc. USD 62 57,245 1.00 Verisk Analytics, Inc. USD 277 57,104 1.00
114,349 2.00
Real Estate management & DevelopmentFirstService Corp. CAD 1,478 200,151 3.51
200,151 3.51
semiconductors & semiconductor EquipmentASML Holding NV, NYRS USD 412 199,828 3.50
199,828 3.50
softwareANSYS, Inc. USD 155 56,536 0.99 Appfolio, Inc. ‘A’ USD 847 149,537 2.62 Autodesk, Inc. USD 190 57,517 1.01 Cadence Design Systems, Inc. USD 642 87,479 1.53 Constellation Software, Inc. CAD 153 198,402 3.47 Guidewire Software, Inc. USD 447 57,417 1.01 Synopsys, Inc. USD 332 85,849 1.50 Tyler Technologies, Inc. USD 330 142,052 2.49
834,789 14.62
specialty RetailHome Depot, Inc. (The) USD 315 83,365 1.46
83,365 1.46
Textiles, apparel & luxury GoodsNIKE, Inc. ‘B’ USD 620 87,798 1.54
87,798 1.54
Trading companies & DistributorsFastenal Co. USD 1,146 56,062 0.98 Watsco, Inc. USD 245 55,370 0.97
111,432 1.95
Total Equities 5,665,309 99.29
Total Transferable securities and money market instruments admitted to official exchange listing or dealt in on another regulated market 5,665,309 99.29

Morgan Stanley Investment Funds 31 December 2020 96
The accompanying notes are an integral part of these financial statements.
US Permanence Fund (continued)
schEDUlE of InVEsTmEnTsAs at 31 December 2020
Investments Currency
Quantity/ Nominal
Value
Market Value USD
% of Net Assets
Other transferable securities and money market instruments not admitted to official exchange listing or dealt in on another regulated market
Equities
softwareTopicus.com, Inc.* CAD 284 1,074 0.02
1,074 0.02
Total Equities 1,074 0.02
Total other transferable securities and money market instruments not admitted to official exchange listing or dealt in on another regulated market 1,074 0.02
Total Investments 5,666,383 99.31
cash 55,399 0.97
other assets/(liabilities) (15,787) (0.28)
Total net assets 5,705,995 100.00
* Security is valued at its fair value under the direction of the Board of Directors.

97 Morgan Stanley Investment Funds 31 December 2020
The accompanying notes are an integral part of these financial statements.
Please refer to the full prospectus for the Fund’s investment objective and policy.
InVEsTmEnT aIm
To seek to provide long-term capital appreciation, measured in US Dollars, by investing primarily in equity securities of companies in the US real estate industry.
schEDUlE of InVEsTmEnTsAs at 31 December 2020
Investments Currency
Quantity/ Nominal
Value
Market Value USD
% of Net Assets
Transferable securities and money market instruments admitted to official exchange listing or dealt in on another regulated market
Equities
apartmentsAmerican Campus Communities, Inc., REIT USD 3,177 133,498 0.18 Apartment Income REIT Corp. USD 19,001 721,848 0.95 AvalonBay Communities, Inc., REIT USD 22,694 3,582,474 4.74 Camden Property Trust, REIT USD 16,622 1,628,291 2.15 Equity Residential, REIT USD 51,632 3,016,857 4.00 Essex Property Trust, Inc., REIT USD 5,133 1,204,664 1.59 UDR, Inc., REIT USD 14,688 555,060 0.73
10,842,692 14.34
Data centersDigital Realty Trust, Inc., REIT USD 22,061 3,040,667 4.01 Equinix, Inc., REIT USD 4,166 2,928,990 3.87 QTS Realty Trust, Inc., REIT ‘A’ USD 15,708 950,648 1.26
6,920,305 9.14
DiversifiedJBG SMITH Properties, REIT USD 39,780 1,225,622 1.62 Mack-Cali Realty Corp., REIT USD 60,478 743,879 0.98 VEREIT, Inc. USD 39,047 1,446,301 1.91
3,415,802 4.51
free standingNETSTREIT Corp. USD 53,629 1,037,185 1.37
1,037,185 1.37
health careHealthcare Realty Trust, Inc., REIT USD 68,455 2,000,940 2.64 Healthcare Trust of America, Inc., REIT ‘A’ USD 17,918 488,803 0.65 Healthpeak Properties, Inc., REIT USD 69,381 2,059,921 2.72 Medical Properties Trust, Inc., REIT USD 61,363 1,324,214 1.75 Sabra Health Care REIT, Inc. USD 30,429 529,465 0.70 Ventas, Inc., REIT USD 36,354 1,765,350 2.33 Welltower, Inc., REIT USD 11,813 753,433 1.00
8,922,126 11.79
IndustrialDuke Realty Corp., REIT USD 19,931 780,897 1.03 First Industrial Realty Trust, Inc., REIT USD 3,396 140,730 0.19 Granite Real Estate Investment Trust CAD 6,441 394,182 0.52 Prologis, Inc., REIT USD 62,125 6,119,312 8.08
7,435,121 9.82
lodging/ResortsHost Hotels & Resorts, Inc., REIT USD 123,588 1,787,083 2.36 RLJ Lodging Trust, REIT USD 59,133 837,323 1.11 Sunstone Hotel Investors, Inc., REIT USD 156,112 1,754,699 2.32
4,379,105 5.79
manufactured homesEquity LifeStyle Properties, Inc., REIT USD 18,155 1,133,598 1.50
1,133,598 1.50
US Property Fund

Morgan Stanley Investment Funds 31 December 2020 98
The accompanying notes are an integral part of these financial statements.
US Property Fund (continued)
schEDUlE of InVEsTmEnTsAs at 31 December 2020
Investments Currency
Quantity/ Nominal
Value
Market Value USD
% of Net Assets
Transferable securities and money market instruments admitted to official exchange listing or dealt in on another regulated market
Equities (continued)
officeAlexandria Real Estate Equities, Inc., REIT USD 8,228 1,442,615 1.91 Boston Properties, Inc., REIT USD 23,072 2,149,617 2.84 Cousins Properties, Inc., REIT USD 22,313 737,445 0.97 Douglas Emmett, Inc., REIT USD 12,433 356,454 0.47 Highwoods Properties, Inc., REIT USD 8,190 318,100 0.42 Hudson Pacific Properties, Inc., REIT USD 72,318 1,704,535 2.25 Kilroy Realty Corp., REIT USD 14,088 786,956 1.04 Paramount Group, Inc., REIT USD 57,996 513,845 0.68 SL Green Realty Corp., REIT USD 25,440 1,467,125 1.94
9,476,692 12.52
Regional mallsSimon Property Group, Inc., REIT USD 43,261 3,594,989 4.75
3,594,989 4.75
self storageCubeSmart, REIT USD 60,148 2,023,379 2.67 Public Storage, REIT USD 14,529 3,326,269 4.40
5,349,648 7.07
shopping centersBrixmor Property Group, Inc., REIT USD 80,343 1,306,377 1.73 Regency Centers Corp., REIT USD 30,177 1,359,474 1.79 Weingarten Realty Investors, REIT USD 50,611 1,074,472 1.42
3,740,323 4.94
single family homesInvitation Homes, Inc., REIT USD 104,180 3,061,850 4.05
3,061,850 4.05
specialtyGaming and Leisure Properties, Inc., REIT USD 27,525 1,145,866 1.51
1,145,866 1.51
Total Equities 70,455,302 93.10
Total Transferable securities and money market instruments admitted to official exchange listing or dealt in on another regulated market 70,455,302 93.10
schEDUlE of InVEsTmEnTsAs at 31 December 2020
Investments Currency
Quantity/ Nominal
Value
Market Value USD
% of Net Assets
Units of authorised UCITS or other collective investment undertakings
collective Investment schemes – UcITs
mutual fundsMorgan Stanley Liquidity Funds US Dollar
Treasury Liquidity Fund – MS Reserve† USD 3,208,751 3,208,751 4.24
3,208,751 4.24
Total collective Investment schemes – UcITs 3,208,751 4.24
Total Units of authorised UcITs or other collective investment undertakings 3,208,751 4.24
Total Investments 73,664,053 97.34
cash 333,824 0.44
other assets/(liabilities) 1,679,683 2.22
Total net assets 75,677,560 100.00
† Managed by an affiliate of the Investment Adviser.

99 Morgan Stanley Investment Funds 31 December 2020
The accompanying notes are an integral part of these financial statements.
US Property Fund (continued)
forward currency Exchange contracts
currency Purchased
amount Purchased
currency sold
amount sold
maturity Date counterparty
Unrealised Gain/(loss)
UsD
% of net assets
USD 426 EUR 347 05/01/2021 J.P. Morgan 1 0.00
Unrealised Gain on forward currency Exchange contracts – assets 1 0.00
EUR 347 USD 426 05/01/2021 J.P. Morgan (1) 0.00
Unrealised loss on forward currency Exchange contracts – liabilities (1) 0.00
Total Unrealised Gain on forward currency Exchange contracts – assets 0 0.00
DERIVaTIVEs
Over-the-counter (OTC) and exchange traded derivatives as at 31 December 2020, expressed in US Dollars.

Morgan Stanley Investment Funds 31 December 2020 100
The accompanying notes are an integral part of these financial statements.
Please refer to the full prospectus for the Fund’s investment objective and policy.
InVEsTmEnT aIm
To seek to maximize total return, measured in US Dollars, primarily through investments across the credit spectrum of debt securities of corporate issuers, together with investing in debt securities of government and government related issuers located, in each case, in emerging markets countries. The Fund intends to invest its assets in emerging market countries’ corporate debt securities that provide a high level of current income, while at the same time holding the potential for capital appreciation.
schEDUlE of InVEsTmEnTsAs at 31 December 2020
Investments Currency
Quantity/ Nominal
Value
Market Value USD
% of Net Assets
Transferable securities and money market instruments admitted to official exchange listing or dealt in on another regulated market
convertible Bonds
chileLiberty Latin America Ltd. 2% 15/07/2024 USD 4,275,000 4,052,486 0.32
4,052,486 0.32
Total convertible Bonds 4,052,486 0.32
corporate Bonds
argentinaAeropuertos Argentina 2000 SA, Reg. S
9.375% 01/02/2027 USD 4,248,806 3,696,461 0.29 Banco Macro SA, Reg. S, FRN 6.75%
04/11/2026 USD 6,970,000 6,009,099 0.47 Pampa Energia SA, Reg. S 9.125%
15/04/2029 USD 3,960,000 3,525,019 0.27 Telecom Argentina SA, Reg. S 8%
18/07/2026 USD 4,167,000 3,884,425 0.30 Transportadora de Gas del Sur SA, Reg. S
6.75% 02/05/2025 USD 3,660,000 3,376,922 0.26 YPF SA, Reg. S 8.5% 28/07/2025 USD 9,195,000 7,140,492 0.56
27,632,418 2.15
armeniaArdshinbank CJSC, Reg. S 6.5%
28/01/2025 USD 6,220,000 5,971,200 0.46
5,971,200 0.46
BrazilAtento Luxco 1 SA, Reg. S 6.125%
10/08/2022 USD 3,957,000 3,912,484 0.30 Banco Daycoval SA, Reg. S 4.25%
13/12/2024 USD 3,180,000 3,316,136 0.25 Braskem Netherlands Finance BV, Reg. S
4.5% 31/01/2030 USD 6,780,000 6,958,043 0.54 BRF SA, Reg. S 5.75% 21/09/2050 USD 4,270,000 4,758,381 0.37 CSN Islands XI Corp., Reg. S 6.75%
28/01/2028 USD 6,140,000 6,686,460 0.52 Embraer Netherlands Finance BV 5.4%
01/02/2027 USD 3,560,000 3,786,985 0.29 GUSAP III LP, Reg. S 4.25% 21/01/2030 USD 3,100,000 3,460,406 0.27 Itau Unibanco Holding SA, Reg. S, FRN
4.5% 21/11/2029 USD 6,430,000 6,656,722 0.52 Itau Unibanco Holding SA, Reg. S, FRN
6.125% Perpetual USD 6,000,000 6,165,030 0.48 JSM Global Sarl, Reg. S 4.75%
20/10/2030 USD 3,710,000 3,999,881 0.31 Minerva Luxembourg SA, Reg. S 5.875%
19/01/2028 USD 2,990,000 3,229,977 0.25 Petrobras Global Finance BV 5.093%
15/01/2030 USD 6,350,000 7,104,063 0.55 Petrobras Global Finance BV 6.9%
19/03/2049 USD 7,820,000 9,931,400 0.77 Petrobras Global Finance BV 6.75%
03/06/2050 USD 5,630,000 7,002,313 0.54 Suzano Austria GmbH 3.75% 15/01/2031 USD 6,285,000 6,676,241 0.52 Virgolino de Oliveira Finance SA, Reg. S
10.5% 28/01/2018§ USD 7,575,000 113,625 0.01 Virgolino de Oliveira Finance SA, Reg. S
11.75% 09/02/2022§ USD 1,500,000 25,950 0.00
83,784,097 6.49
Emerging Markets Corporate Debt Fund
Bond Funds

101 Morgan Stanley Investment Funds 31 December 2020
The accompanying notes are an integral part of these financial statements.
Emerging Markets Corporate Debt Fund (continued)
schEDUlE of InVEsTmEnTsAs at 31 December 2020
Investments Currency
Quantity/ Nominal
Value
Market Value USD
% of Net Assets
Transferable securities and money market instruments admitted to official exchange listing or dealt in on another regulated market
corporate Bonds (continued)
chileAES Gener SA, Reg. S, FRN 7.125%
26/03/2079 USD 3,015,000 3,331,575 0.26 AES Gener SA, Reg. S, FRN 6.35%
07/10/2079 USD 3,150,000 3,468,938 0.27 Celulosa Arauco y Constitucion SA, Reg. S
4.2% 29/01/2030 USD 5,600,000 6,349,000 0.49 Cencosud SA, Reg. S 4.375%
17/07/2027 USD 3,000,000 3,368,120 0.26 Cencosud SA, Reg. S 6.625%
12/02/2045 USD 505,000 656,144 0.05 EnfraGen Energia Sur SA, Reg. S 5.375%
30/12/2030 USD 4,350,000 4,532,156 0.35 GNL Quintero SA, Reg. S 4.634%
31/07/2029 USD 3,350,000 3,736,925 0.29 Inversiones CMPC SA, Reg. S 3.85%
13/01/2030 USD 3,000,000 3,365,250 0.26 VTR Finance NV, Reg. S 6.375%
15/07/2028 USD 4,660,000 5,096,875 0.40
33,904,983 2.63
chinaChina Construction Bank Corp., Reg. S
2.45% 24/06/2030 USD 3,800,000 3,897,280 0.30 CNAC HK Finbridge Co. Ltd., Reg. S
3.35% 31/12/2164 USD 6,000,000 5,940,002 0.46 COSL Singapore Capital Ltd., Reg. S 4.5%
30/07/2025 USD 6,000,000 6,649,170 0.52 Country Garden Holdings Co. Ltd., Reg. S
3.875% 22/10/2030 USD 4,280,000 4,425,520 0.34 eHi Car Services Ltd., Reg. S 5.875%
14/08/2022 USD 4,300,000 3,913,075 0.30 Fantasia Holdings Group Co. Ltd., Reg. S
10.875% 09/01/2023 USD 3,600,000 3,771,129 0.29 Huarong Finance 2019 Co. Ltd., Reg. S
3.375% 24/02/2030 USD 6,220,000 6,430,176 0.50 Industrial & Commercial Bank of China
Macau Ltd., Reg. S, FRN 2.875% 12/09/2029 USD 4,120,000 4,262,346 0.33
JD.com, Inc. 4.125% 14/01/2050 USD 3,000,000 3,356,339 0.26 Kaisa Group Holdings Ltd., Reg. S 10.5%
15/01/2025 USD 3,790,000 3,800,888 0.29 Lenovo Group Ltd., Reg. S 3.421%
02/11/2030 USD 945,000 993,503 0.08 Meituan, Reg. S 3.05% 28/10/2030 USD 2,630,000 2,746,483 0.21 Pearl Holding III Ltd., Reg. S 9.5%
11/12/2022 USD 7,240,000 1,230,800 0.10 Prosus NV, Reg. S 4.027% 03/08/2050 USD 3,560,000 3,738,746 0.29 Redsun Properties Group Ltd., Reg. S
9.7% 16/04/2023 USD 6,130,000 6,482,450 0.50 Scenery Journey Ltd., Reg. S 11.5%
24/10/2022 USD 6,680,000 6,256,842 0.49 SF Holding Investment Ltd., Reg. S
2.875% 20/02/2030 USD 3,000,000 3,136,051 0.24 Sunac China Holdings Ltd., Reg. S 6.5%
10/01/2025 USD 4,740,000 4,899,975 0.38 Tingyi Cayman Islands Holding Corp.,
Reg. S 1.625% 24/09/2025 USD 5,940,000 5,933,863 0.46 Vigorous Champion International Ltd.,
Reg. S 4.375% 10/09/2023 USD 4,930,000 5,288,411 0.41 Wens Foodstuffs Group Co. Ltd., Reg. S
3.258% 29/10/2030 USD 3,800,000 3,719,981 0.29
schEDUlE of InVEsTmEnTsAs at 31 December 2020
Investments Currency
Quantity/ Nominal
Value
Market Value USD
% of Net Assets
Transferable securities and money market instruments admitted to official exchange listing or dealt in on another regulated market
corporate Bonds (continued)
china (continued)Yuzhou Group Holdings Co. Ltd., Reg. S
8.375% 30/10/2024 USD 5,950,000 6,493,225 0.50 Zhenro Properties Group Ltd., Reg. S
7.35% 05/02/2025 USD 6,430,000 6,671,125 0.52
104,037,380 8.06
colombiaBanco de Bogota SA, Reg. S 4.375%
03/08/2027 USD 6,200,000 6,858,812 0.53 Bancolombia SA, FRN 4.625%
18/12/2029 USD 3,350,000 3,525,908 0.27 Canacol Energy Ltd., Reg. S 7.25%
03/05/2025 USD 5,460,000 5,866,142 0.46 Credivalores-Crediservicios SAS, Reg. S
9.75% 27/07/2022 USD 3,460,000 2,780,197 0.22 Ecopetrol SA 6.875% 29/04/2030 USD 9,490,000 12,265,825 0.95 Ecopetrol SA 5.875% 28/05/2045 USD 5,800,000 7,025,250 0.54 Geopark Ltd., Reg. S 6.5% 21/09/2024 USD 6,830,000 7,103,200 0.55 Grupo Aval Ltd., Reg. S 4.375% 04/02/2030 USD 3,300,000 3,524,297 0.27 Grupo Energia Bogota SA ESP, Reg. S
4.875% 15/05/2030 USD 4,890,000 5,764,088 0.45 Millicom International Cellular SA, Reg. S
5.125% 15/01/2028 USD 6,190,000 6,588,636 0.51 Termocandelaria Power Ltd., Reg. S
7.875% 30/01/2029 USD 2,770,000 3,052,221 0.24 Transportadora de Gas Internacional SA
ESP, Reg. S 5.55% 01/11/2028 USD 2,860,000 3,381,979 0.26
67,736,555 5.25
EgyptAfrican Export-Import Bank (The), Reg. S
3.994% 21/09/2029 USD 7,340,000 7,887,564 0.61
7,887,564 0.61
GeorgiaBank of Georgia JSC, Reg. S 6%
26/07/2023 USD 1,775,000 1,885,937 0.15
1,885,937 0.15
GhanaKosmos Energy Ltd., Reg. S 7.125%
04/04/2026 USD 4,240,000 4,122,722 0.32
4,122,722 0.32
hong KongCK Hutchison International 20 Ltd., Reg. S
2.5% 08/05/2030 USD 6,000,000 6,341,228 0.49 CLP Power Hong Kong Financing Ltd.,
Reg. S 2.125% 30/06/2030 USD 3,000,000 3,041,192 0.24 Hongkong Land Finance Cayman Islands
Co. Ltd. (The), Reg. S 2.875% 27/05/2030 USD 6,520,000 6,963,393 0.54
Johnson Electric Holdings Ltd., Reg. S 4.125% 30/07/2024 USD 6,800,000 7,271,289 0.56
Li & Fung Ltd., Reg. S 4.5% 18/08/2025 USD 6,000,000 6,139,378 0.48 NWD Finance BVI Ltd., Reg. S 4.8%
31/12/2164 USD 1,960,000 1,976,170 0.15
31,732,650 2.46

Morgan Stanley Investment Funds 31 December 2020 102
The accompanying notes are an integral part of these financial statements.
Emerging Markets Corporate Debt Fund (continued)
schEDUlE of InVEsTmEnTsAs at 31 December 2020
Investments Currency
Quantity/ Nominal
Value
Market Value USD
% of Net Assets
Transferable securities and money market instruments admitted to official exchange listing or dealt in on another regulated market
corporate Bonds (continued)
IndiaAdani Ports & Special Economic Zone Ltd.,
Reg. S 4% 30/07/2027 USD 2,710,000 2,897,915 0.23 Adani Ports & Special Economic Zone Ltd.,
Reg. S 4.2% 04/08/2027 USD 290,000 312,778 0.02 Azure Power Energy Ltd., Reg. S 5.5%
03/11/2022 USD 6,810,000 6,997,275 0.54 GMR Hyderabad International Airport Ltd.,
Reg. S 5.375% 10/04/2024 USD 3,800,000 3,876,829 0.30 GMR Hyderabad International Airport Ltd.,
Reg. S 4.25% 27/10/2027 USD 857,000 831,707 0.06 Greenko Investment Co., Reg. S 4.875%
16/08/2023 USD 6,000,000 6,150,117 0.48 Network i2i Ltd., Reg. S, FRN 5.65%
Perpetual USD 3,650,000 3,889,075 0.30 Oil India International Pte. Ltd., Reg. S 4%
21/04/2027 USD 6,000,000 6,450,926 0.50 ONGC Videsh Vankorneft Pte. Ltd., Reg. S
3.75% 27/07/2026 USD 6,000,000 6,524,478 0.51 Power Finance Corp. Ltd., Reg. S 5.25%
10/08/2028 USD 3,000,000 3,461,577 0.27 Power Finance Corp. Ltd., Reg. S 4.5%
18/06/2029 USD 3,000,000 3,307,890 0.26 Vedanta Resources Ltd., Reg. S 7.125%
31/05/2023 USD 6,000,000 4,938,000 0.38
49,638,567 3.85
IndonesiaAPL Realty Holdings Pte. Ltd., Reg. S
5.95% 02/06/2024 USD 5,000,000 4,175,043 0.32 Bank Mandiri Persero Tbk. PT, Reg. S
4.75% 13/05/2025 USD 5,800,000 6,491,930 0.50 Indika Energy Capital III Pte. Ltd., Reg. S
5.875% 09/11/2024 USD 6,100,000 6,283,000 0.49 Indika Energy Capital IV Pte. Ltd., Reg. S
8.25% 22/10/2025 USD 5,340,000 5,788,560 0.45 Jababeka International BV, Reg. S 6.5%
05/10/2023 USD 4,445,000 4,333,930 0.34 LLPL Capital Pte. Ltd., Reg. S 6.875%
04/02/2039 USD 16,610,910 19,655,607 1.52
46,728,070 3.62
IsraelBank Leumi Le-Israel BM, Reg. S, FRN,
144A 3.275% 29/01/2031 USD 6,350,000 6,611,938 0.51 ICL Group Ltd., Reg. S, 144A 6.375%
31/05/2038 USD 4,900,000 6,500,368 0.51 Teva Pharmaceutical Finance Netherlands
III BV 7.125% 31/01/2025 USD 2,000,000 2,203,960 0.17 Teva Pharmaceutical Finance Netherlands
III BV 2.8% 21/07/2023 USD 8,045,000 7,980,157 0.62 Teva Pharmaceutical Finance Netherlands
III BV 4.1% 01/10/2046 USD 7,300,000 6,515,250 0.51 Teva Pharmaceutical Finance Netherlands
III BV 3.15% 01/10/2026 USD 7,000,000 6,741,945 0.52
36,553,618 2.84
schEDUlE of InVEsTmEnTsAs at 31 December 2020
Investments Currency
Quantity/ Nominal
Value
Market Value USD
% of Net Assets
Transferable securities and money market instruments admitted to official exchange listing or dealt in on another regulated market
corporate Bonds (continued)
JamaicaDigicel Ltd., Reg. S 6.75% 01/03/2023 USD 600,000 464,400 0.04
464,400 0.04
KuwaitBurgan Bank SAK, Reg. S 2.75%
15/12/2031 USD 3,690,000 3,686,310 0.29 Burgan Bank SAK, Reg. S, FRN 5.749%
Perpetual USD 3,780,000 3,917,592 0.30 Equate Petrochemical BV, Reg. S 4.25%
03/11/2026 USD 6,250,000 6,984,344 0.54 Kuwait Projects Co. SPC Ltd., Reg. S
4.229% 29/10/2026 USD 6,586,000 6,841,207 0.53 NBK Tier 1 Financing Ltd., Reg. S, FRN
5.75% Perpetual USD 5,500,000 5,555,000 0.43 Nbk Tier 2 Ltd., Reg. S 2.5% 24/11/2030 USD 2,300,000 2,345,393 0.18
29,329,846 2.27
latvia4finance SA, Reg. S 10.75% 01/05/2022 USD 8,060,000 6,701,079 0.52
6,701,079 0.52
macauMelco Resorts Finance Ltd., Reg. S 5.75%
21/07/2028 USD 6,200,000 6,613,850 0.51 Melco Resorts Finance Ltd., Reg. S
5.625% 17/07/2027 USD 4,520,000 4,768,832 0.37 MGM China Holdings Ltd., Reg. S 5.875%
15/05/2026 USD 1,875,000 1,985,156 0.15 MGM China Holdings Ltd., Reg. S 5.375%
15/05/2024 USD 4,896,000 5,067,874 0.39 Sands China Ltd. 5.125% 08/08/2025 USD 2,400,000 2,697,924 0.21 Sands China Ltd. 5.4% 08/08/2028 USD 11,300,000 13,257,612 1.03 Studio City Finance Ltd., Reg. S 6.5%
15/01/2028 USD 6,380,000 6,857,543 0.53
41,248,791 3.19
malaysiaGohl Capital Ltd., Reg. S 4.25%
24/01/2027 USD 6,335,000 6,745,218 0.52 Parkway Pantai Ltd., Reg. S, FRN 4.25%
Perpetual USD 14,100,000 14,302,264 1.11
21,047,482 1.63
mexicoAlpek SAB de CV, Reg. S 4.25%
18/09/2029 USD 3,600,000 3,951,990 0.30 Alpha Holding SA de CV, Reg. S 10%
19/12/2022 USD 6,440,000 5,530,350 0.43 Banco Mercantil del Norte SA, Reg. S, FRN
5.75% 04/10/2031 USD 3,100,000 3,343,536 0.26 BBVA Bancomer SA, Reg. S, FRN 5.125%
18/01/2033 USD 3,300,000 3,560,700 0.27 Cibanco SA Ibm, REIT, Reg. S 4.962%
18/07/2029 USD 3,870,000 4,402,164 0.34 Financiera Independencia SAB de CV
SOFOM ENR, Reg. S 8% 19/07/2024 USD 5,270,000 4,722,737 0.37 Fomento Economico Mexicano SAB de CV
3.5% 16/01/2050 USD 3,000,000 3,334,634 0.26

103 Morgan Stanley Investment Funds 31 December 2020
The accompanying notes are an integral part of these financial statements.
Emerging Markets Corporate Debt Fund (continued)
schEDUlE of InVEsTmEnTsAs at 31 December 2020
Investments Currency
Quantity/ Nominal
Value
Market Value USD
% of Net Assets
Transferable securities and money market instruments admitted to official exchange listing or dealt in on another regulated market
corporate Bonds (continued)
mexico (continued)Grupo Bimbo SAB de CV, Reg. S, FRN
5.95% Perpetual USD 1,660,000 1,787,837 0.14 Grupo Televisa SAB 5.25% 24/05/2049 USD 2,900,000 3,673,973 0.28 Industrias Penoles SAB de CV, Reg. S
4.75% 06/08/2050 USD 2,195,000 2,548,516 0.20 Minera Mexico SA de CV, Reg. S 4.5%
26/01/2050 USD 6,675,000 7,692,937 0.60 Sigma Finance Netherlands BV, Reg. S
4.875% 27/03/2028 USD 5,695,000 6,658,936 0.52 Total Play Telecomunicaciones SA de CV,
Reg. S 7.5% 12/11/2025 USD 4,340,000 4,340,000 0.34 Trust Fibra Uno, REIT, Reg. S 6.39%
15/01/2050 USD 3,200,000 3,754,400 0.29
59,302,710 4.60
moldovaAragvi Finance International DAC, Reg. S
12% 09/04/2024 USD 4,150,000 4,539,062 0.35
4,539,062 0.35
nigeriaAfrica Finance Corp., Reg. S 3.75%
30/10/2029 USD 3,650,000 3,896,375 0.30 Fidelity Bank plc, Reg. S 10.5%
16/10/2022 USD 5,330,000 5,689,775 0.44 First Bank of Nigeria Ltd., Reg. S 8.625%
27/10/2025 USD 5,830,000 6,325,550 0.49 IHS Netherlands Holdco BV, Reg. S
7.125% 18/03/2025 USD 11,020,000 11,598,550 0.90 United Bank for Africa plc, Reg. S 7.75%
08/06/2022 USD 7,540,000 7,797,302 0.61
35,307,552 2.74
omanBank Muscat SAOG, Reg. S 4.875%
14/03/2023 USD 3,200,000 3,262,320 0.25
3,262,320 0.25
PanamaAES Panama Generation Holdings SRL,
Reg. S 4.375% 31/05/2030 USD 3,470,000 3,758,530 0.29 Cable Onda SA, Reg. S 4.5% 30/01/2030 USD 6,360,000 7,039,725 0.55 Multibank, Inc., Reg. S 4.375%
09/11/2022 USD 6,310,000 6,527,853 0.51 Sable International Finance Ltd., Reg. S
5.75% 07/09/2027 USD 6,100,000 6,510,591 0.50
23,836,699 1.85
PeruAuna SAA, Reg. S 6.5% 20/11/2025 USD 2,560,000 2,721,024 0.21 Banco de Credito del Peru, Reg. S, FRN
3.125% 01/07/2030 USD 2,200,000 2,255,022 0.17 Banco Internacional del Peru SAA
Interbank, Reg. S 3.25% 04/10/2026 USD 3,260,000 3,457,263 0.27 Credicorp Ltd., Reg. S 2.75%
17/06/2025 USD 3,900,000 4,069,650 0.32 Hunt Oil Co. of Peru LLC Sucursal Del
Peru, Reg. S 6.375% 01/06/2028 USD 5,195,000 5,769,047 0.45
schEDUlE of InVEsTmEnTsAs at 31 December 2020
Investments Currency
Quantity/ Nominal
Value
Market Value USD
% of Net Assets
Transferable securities and money market instruments admitted to official exchange listing or dealt in on another regulated market
corporate Bonds (continued)
Peru (continued)Inkia Energy Ltd., Reg. S 5.875%
09/11/2027 USD 5,270,000 5,719,584 0.44 Intercorp Peru Ltd., Reg. S 3.875%
15/08/2029 USD 3,330,000 3,467,562 0.27 Lima Metro Line 2 Finance Ltd., Reg. S
4.35% 05/04/2036 USD 3,650,000 4,054,876 0.31 Nexa Resources SA, Reg. S 6.5%
18/01/2028 USD 2,780,000 3,282,138 0.25 Orazul Energy Egenor SCA, Reg. S
5.625% 28/04/2027 USD 5,000,000 5,278,175 0.41 Patrimonio EN Fideicomiso DS
093-2002-EF-Inretail Shopping Malls, Reg. S 5.75% 03/04/2028 USD 3,220,000 3,475,990 0.27
43,550,331 3.37
PhilippinesBDO Unibank, Inc., Reg. S 2.125%
13/01/2026 USD 2,940,000 3,031,724 0.24 Globe Telecom, Inc., Reg. S 2.5%
23/07/2030 USD 5,800,000 5,840,799 0.45 JGSH Philippines Ltd., Reg. S 4.125%
09/07/2030 USD 4,030,000 4,247,681 0.33 Jollibee Worldwide Pte. Ltd., Reg. S, FRN
3.9% Perpetual USD 6,290,000 6,054,125 0.47 Metropolitan Bank & Trust Co., Reg. S
2.125% 15/01/2026 USD 5,370,000 5,504,664 0.43 Petron Corp., Reg. S, FRN 4.6% Perpetual USD 5,700,000 5,523,766 0.43 Royal Capital BV, Reg. S 5% 31/12/2164 USD 2,920,000 3,024,390 0.23 San Miguel Corp., Reg. S 4.875%
26/04/2023 USD 3,000,000 3,031,500 0.24 Union Bank of the Philippines, Reg. S
2.125% 22/10/2025 USD 2,830,000 2,878,958 0.22
39,137,607 3.04
QatarMAR Sukuk Ltd., Reg. S 2.21%
02/09/2025 USD 5,970,000 6,085,326 0.47 Qatar Reinsurance Co. Ltd., Reg. S, FRN
4.95% Perpetual USD 7,510,000 7,585,100 0.59 QIB Sukuk Ltd., Reg. S 1.95%
27/10/2025 USD 7,020,000 7,050,713 0.55 QNB Finance Ltd., Reg. S 1.625%
22/09/2025 USD 4,000,000 4,060,570 0.31
24,781,709 1.92
RussiaAlfa Bank AO, Reg. S, FRN 5.95%
15/04/2030 USD 7,840,000 8,147,328 0.63 Credit Bank of Moscow, Reg. S, FRN
8.875% Perpetual USD 3,939,000 3,889,763 0.30 Credit Bank of Moscow, Reg. S, FRN 7.5%
05/10/2027 USD 4,095,000 4,123,051 0.32 Gazprom PJSC, Reg. S 4.599%
31/12/2164 USD 7,160,000 7,467,880 0.58 Sovcombank, Reg. S, FRN 8%
07/04/2030 USD 4,450,000 4,782,922 0.37 Sovcombank, Reg. S, FRN 7.75%
Perpetual USD 3,960,000 4,062,960 0.32
32,473,904 2.52
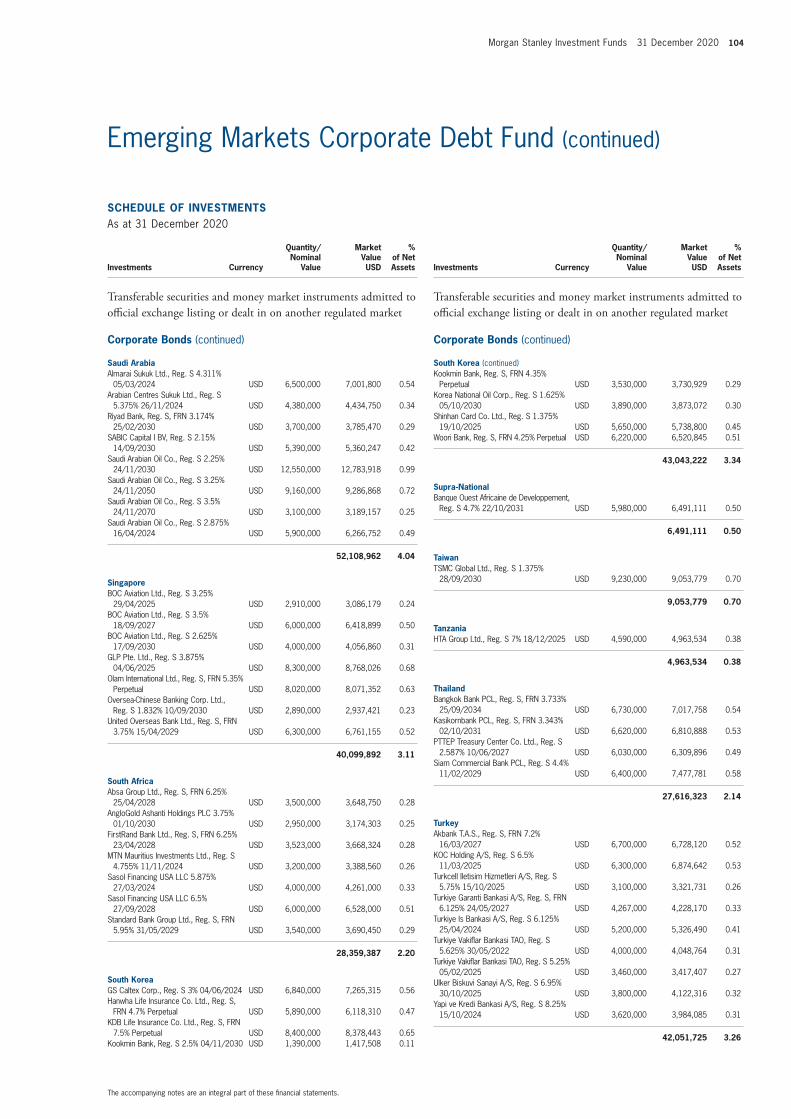
Morgan Stanley Investment Funds 31 December 2020 104
The accompanying notes are an integral part of these financial statements.
Emerging Markets Corporate Debt Fund (continued)
schEDUlE of InVEsTmEnTsAs at 31 December 2020
Investments Currency
Quantity/ Nominal
Value
Market Value USD
% of Net Assets
Transferable securities and money market instruments admitted to official exchange listing or dealt in on another regulated market
corporate Bonds (continued)
saudi arabiaAlmarai Sukuk Ltd., Reg. S 4.311%
05/03/2024 USD 6,500,000 7,001,800 0.54 Arabian Centres Sukuk Ltd., Reg. S
5.375% 26/11/2024 USD 4,380,000 4,434,750 0.34 Riyad Bank, Reg. S, FRN 3.174%
25/02/2030 USD 3,700,000 3,785,470 0.29 SABIC Capital I BV, Reg. S 2.15%
14/09/2030 USD 5,390,000 5,360,247 0.42 Saudi Arabian Oil Co., Reg. S 2.25%
24/11/2030 USD 12,550,000 12,783,918 0.99 Saudi Arabian Oil Co., Reg. S 3.25%
24/11/2050 USD 9,160,000 9,286,868 0.72 Saudi Arabian Oil Co., Reg. S 3.5%
24/11/2070 USD 3,100,000 3,189,157 0.25 Saudi Arabian Oil Co., Reg. S 2.875%
16/04/2024 USD 5,900,000 6,266,752 0.49
52,108,962 4.04
singaporeBOC Aviation Ltd., Reg. S 3.25%
29/04/2025 USD 2,910,000 3,086,179 0.24 BOC Aviation Ltd., Reg. S 3.5%
18/09/2027 USD 6,000,000 6,418,899 0.50 BOC Aviation Ltd., Reg. S 2.625%
17/09/2030 USD 4,000,000 4,056,860 0.31 GLP Pte. Ltd., Reg. S 3.875%
04/06/2025 USD 8,300,000 8,768,026 0.68 Olam International Ltd., Reg. S, FRN 5.35%
Perpetual USD 8,020,000 8,071,352 0.63 Oversea-Chinese Banking Corp. Ltd.,
Reg. S 1.832% 10/09/2030 USD 2,890,000 2,937,421 0.23 United Overseas Bank Ltd., Reg. S, FRN
3.75% 15/04/2029 USD 6,300,000 6,761,155 0.52
40,099,892 3.11
south africaAbsa Group Ltd., Reg. S, FRN 6.25%
25/04/2028 USD 3,500,000 3,648,750 0.28 AngloGold Ashanti Holdings PLC 3.75%
01/10/2030 USD 2,950,000 3,174,303 0.25 FirstRand Bank Ltd., Reg. S, FRN 6.25%
23/04/2028 USD 3,523,000 3,668,324 0.28 MTN Mauritius Investments Ltd., Reg. S
4.755% 11/11/2024 USD 3,200,000 3,388,560 0.26 Sasol Financing USA LLC 5.875%
27/03/2024 USD 4,000,000 4,261,000 0.33 Sasol Financing USA LLC 6.5%
27/09/2028 USD 6,000,000 6,528,000 0.51 Standard Bank Group Ltd., Reg. S, FRN
5.95% 31/05/2029 USD 3,540,000 3,690,450 0.29
28,359,387 2.20
south KoreaGS Caltex Corp., Reg. S 3% 04/06/2024 USD 6,840,000 7,265,315 0.56 Hanwha Life Insurance Co. Ltd., Reg. S,
FRN 4.7% Perpetual USD 5,890,000 6,118,310 0.47 KDB Life Insurance Co. Ltd., Reg. S, FRN
7.5% Perpetual USD 8,400,000 8,378,443 0.65 Kookmin Bank, Reg. S 2.5% 04/11/2030 USD 1,390,000 1,417,508 0.11
schEDUlE of InVEsTmEnTsAs at 31 December 2020
Investments Currency
Quantity/ Nominal
Value
Market Value USD
% of Net Assets
Transferable securities and money market instruments admitted to official exchange listing or dealt in on another regulated market
corporate Bonds (continued)
south Korea (continued)Kookmin Bank, Reg. S, FRN 4.35%
Perpetual USD 3,530,000 3,730,929 0.29 Korea National Oil Corp., Reg. S 1.625%
05/10/2030 USD 3,890,000 3,873,072 0.30 Shinhan Card Co. Ltd., Reg. S 1.375%
19/10/2025 USD 5,650,000 5,738,800 0.45 Woori Bank, Reg. S, FRN 4.25% Perpetual USD 6,220,000 6,520,845 0.51
43,043,222 3.34
supra-nationalBanque Ouest Africaine de Developpement,
Reg. S 4.7% 22/10/2031 USD 5,980,000 6,491,111 0.50
6,491,111 0.50
TaiwanTSMC Global Ltd., Reg. S 1.375%
28/09/2030 USD 9,230,000 9,053,779 0.70
9,053,779 0.70
TanzaniaHTA Group Ltd., Reg. S 7% 18/12/2025 USD 4,590,000 4,963,534 0.38
4,963,534 0.38
ThailandBangkok Bank PCL, Reg. S, FRN 3.733%
25/09/2034 USD 6,730,000 7,017,758 0.54 Kasikornbank PCL, Reg. S, FRN 3.343%
02/10/2031 USD 6,620,000 6,810,888 0.53 PTTEP Treasury Center Co. Ltd., Reg. S
2.587% 10/06/2027 USD 6,030,000 6,309,896 0.49 Siam Commercial Bank PCL, Reg. S 4.4%
11/02/2029 USD 6,400,000 7,477,781 0.58
27,616,323 2.14
TurkeyAkbank T.A.S., Reg. S, FRN 7.2%
16/03/2027 USD 6,700,000 6,728,120 0.52 KOC Holding A/S, Reg. S 6.5%
11/03/2025 USD 6,300,000 6,874,642 0.53 Turkcell Iletisim Hizmetleri A/S, Reg. S
5.75% 15/10/2025 USD 3,100,000 3,321,731 0.26 Turkiye Garanti Bankasi A/S, Reg. S, FRN
6.125% 24/05/2027 USD 4,267,000 4,228,170 0.33 Turkiye Is Bankasi A/S, Reg. S 6.125%
25/04/2024 USD 5,200,000 5,326,490 0.41 Turkiye Vakiflar Bankasi TAO, Reg. S
5.625% 30/05/2022 USD 4,000,000 4,048,764 0.31 Turkiye Vakiflar Bankasi TAO, Reg. S 5.25%
05/02/2025 USD 3,460,000 3,417,407 0.27 Ulker Biskuvi Sanayi A/S, Reg. S 6.95%
30/10/2025 USD 3,800,000 4,122,316 0.32 Yapi ve Kredi Bankasi A/S, Reg. S 8.25%
15/10/2024 USD 3,620,000 3,984,085 0.31
42,051,725 3.26

105 Morgan Stanley Investment Funds 31 December 2020
The accompanying notes are an integral part of these financial statements.
Emerging Markets Corporate Debt Fund (continued)
schEDUlE of InVEsTmEnTsAs at 31 December 2020
Investments Currency
Quantity/ Nominal
Value
Market Value USD
% of Net Assets
Transferable securities and money market instruments admitted to official exchange listing or dealt in on another regulated market
corporate Bonds (continued)
UkraineKernel Holding SA, Reg. S 6.75%
27/10/2027 USD 5,920,000 6,312,200 0.49 Metinvest BV, Reg. S 7.65% 01/10/2027 USD 3,410,000 3,742,475 0.29 Metinvest BV, Reg. S 7.75% 17/10/2029 USD 7,000,000 7,689,920 0.60 MHP SE, Reg. S 7.75% 10/05/2024 USD 3,060,000 3,371,722 0.26 VF Ukraine PAT, Reg. S 6.2% 11/02/2025 USD 6,300,000 6,646,500 0.51
27,762,817 2.15
United arab EmiratesAldar Sukuk Ltd., Reg. S 4.75%
29/09/2025 USD 6,280,000 7,029,204 0.55 DIB Tier 1 Sukuk 3 Ltd., Reg. S, FRN
6.25% Perpetual USD 4,360,000 4,692,123 0.36 DP World Crescent Ltd., Reg. S 4.848%
26/09/2028 USD 5,800,000 6,754,709 0.52 DP World Salaam, Reg. S, FRN 6%
Perpetual USD 5,900,000 6,433,749 0.50 Emirates NBD Bank PJSC, Reg. S, FRN
6.125% Perpetual USD 4,420,000 4,721,532 0.37 Galaxy Pipeline Assets Bidco Ltd., Reg. S
3.25% 30/09/2040 USD 10,860,000 11,506,813 0.89 MAF Global Securities Ltd., Reg. S, FRN
6.375% Perpetual USD 6,380,000 6,695,000 0.52 National Central Cooling Co. PJSC, Reg. S
2.5% 21/10/2027 USD 6,300,000 6,403,635 0.50 Rakfunding Cayman Ltd., Reg. S 4.125%
09/04/2024 USD 3,020,000 3,249,112 0.25
57,485,877 4.46
ZambiaFirst Quantum Minerals Ltd., Reg. S 7.5%
01/04/2025 USD 11,481,000 11,897,186 0.92
11,897,186 0.92
Total corporate Bonds 1,217,533,068 94.38
Total Transferable securities and money market instruments admitted to official exchange listing or dealt in on another regulated market 1,221,585,554 94.70
schEDUlE of InVEsTmEnTsAs at 31 December 2020
Investments Currency
Quantity/ Nominal
Value
Market Value USD
% of Net Assets
Units of authorised UCITS or other collective investment undertakings
collective Investment schemes – UcITs
luxembourgMorgan Stanley Liquidity Funds US Dollar
Liquidity Fund – MS Reserve† USD 50,691,402 50,691,402 3.93
50,691,402 3.93
Total collective Investment schemes – UcITs 50,691,402 3.93
Total Units of authorised UcITs or other collective investment undertakings 50,691,402 3.93
Total Investments 1,272,276,956 98.63
cash 532,453 0.04
other assets/(liabilities) 17,165,426 1.33
Total net assets 1,289,974,835 100.00
§ Security is currently in default.† Managed by an affiliate of the Investment Adviser.The country disclosed within the Schedule of Investments refers to the country of risk. The country of incorporation may differ.

Morgan Stanley Investment Funds 31 December 2020 106
The accompanying notes are an integral part of these financial statements.
Emerging Markets Corporate Debt Fund (continued)
forward currency Exchange contracts
currency Purchased
amount Purchased
currency sold
amount sold
maturity Date counterparty
Unrealised Gain/(loss)
UsD
% of net assets
EUR 29,775 USD 36,477 04/01/2021 J.P. Morgan 56 0.00USD 6,292 EUR 5,121 05/01/2021 J.P. Morgan 9 0.00
Unrealised Gain on forward currency Exchange contracts – assets 65 0.00
EUR hedged share classEUR 184,051 USD 225,794 04/01/2021 J.P. Morgan 26 0.00USD 210,706 EUR 171,354 05/01/2021 J.P. Morgan 464 0.00EUR 315,476,088 USD 383,771,015 08/01/2021 J.P. Morgan 3,330,167 0.26 USD 37,159 EUR 30,217 08/01/2021 J.P. Morgan 82 0.00
Unrealised Gain on naV hedged share classes forward currency Exchange contracts – assets 3,330,739 0.26
Total Unrealised Gain on forward currency Exchange contracts – assets 3,330,804 0.26
USD 182,108 EUR 148,651 04/01/2021 J.P. Morgan (277) 0.00
Unrealised loss on forward currency Exchange contracts – liabilities (277) 0.00
EUR hedged share classUSD 151,836 EUR 123,766 04/01/2021 J.P. Morgan (17) 0.00EUR 30,217 USD 37,156 05/01/2021 J.P. Morgan (82) 0.00EUR 171,354 USD 210,724 08/01/2021 J.P. Morgan (466) 0.00USD 54,152,016 EUR 44,546,409 08/01/2021 J.P. Morgan (508,126) (0.04)
Unrealised loss on naV hedged share classes forward currency Exchange contracts – liabilities (508,691) (0.04)
Total Unrealised loss on forward currency Exchange contracts – liabilities (508,968) (0.04)
net Unrealised Gain on forward currency Exchange contracts – assets 2,821,836 0.22
DERIVaTIVEs
Over-the-counter (OTC) and exchange traded derivatives as at 31 December 2020, expressed in US Dollars.

107 Morgan Stanley Investment Funds 31 December 2020
The accompanying notes are an integral part of these financial statements.
Please refer to the full prospectus for the Fund’s investment objective and policy.
InVEsTmEnT aIm
To seek to maximise total return, measured in US Dollars, through investment in the debt securities of government and government-related issuers located in emerging market countries together with investing in the debt securities of corporate issuers located in or organised under the laws of Emerging Market countries.
schEDUlE of InVEsTmEnTsAs at 31 December 2020
Investments Currency
Quantity/ Nominal
Value
Market Value USD
% of Net Assets
Transferable securities and money market instruments admitted to official exchange listing or dealt in on another regulated market
corporate Bonds
BrazilBraskem Netherlands Finance BV, Reg. S
4.5% 31/01/2030 USD 720,000 738,907 0.37 CSN Islands XI Corp., Reg. S 6.75%
28/01/2028 USD 1,590,000 1,731,510 0.87 Minerva Luxembourg SA, Reg. S 5.875%
19/01/2028 USD 990,000 1,069,457 0.54 Petrobras Global Finance BV 5.093%
15/01/2030 USD 423,000 473,231 0.24 Petrobras Global Finance BV 6.75%
03/06/2050 USD 360,000 447,750 0.22 Rumo Luxembourg Sarl, Reg. S 7.375%
09/02/2024 USD 569,000 591,197 0.30 Suzano Austria GmbH 3.75% 15/01/2031 USD 210,000 223,073 0.11
5,275,125 2.65
chileColbun SA, Reg. S 3.15% 06/03/2030 USD 1,540,000 1,663,200 0.84 Empresa Nacional del Petroleo, Reg. S
4.75% 06/12/2021 USD 300,000 311,197 0.16
1,974,397 1.00
chinaFufeng Group Ltd., Reg. S 5.875%
28/08/2021 USD 1,050,000 1,076,371 0.54 Sinopec Group Overseas Development
2013 Ltd., Reg. S 4.375% 17/10/2023 USD 630,000 686,898 0.35 Sinopec Group Overseas Development
2014 Ltd., Reg. S 4.375% 10/04/2024 USD 1,250,000 1,372,644 0.69 Sinopec Group Overseas Development
2012 Ltd., Reg. S 4.875% 17/05/2042 USD 1,040,000 1,350,502 0.68 Three Gorges Finance I Cayman Islands
Ltd., Reg. S 2.3% 02/06/2021 USD 2,170,000 2,179,645 1.10 Three Gorges Finance I Cayman Islands
Ltd., Reg. S 3.7% 10/06/2025 USD 1,822,000 1,990,799 1.00
8,656,859 4.36
colombiaGeopark Ltd., Reg. S 6.5% 21/09/2024 USD 930,000 967,200 0.49 Millicom International Cellular SA, Reg. S
6.625% 15/10/2026 USD 540,000 578,610 0.29 Termocandelaria Power Ltd., Reg. S
7.875% 30/01/2029 USD 670,000 738,263 0.37
2,284,073 1.15
IndiaExport-Import Bank of India, Reg. S
3.375% 05/08/2026 USD 560,000 607,076 0.31
607,076 0.31
IndonesiaPertamina Persero PT, Reg. S 6.5%
07/11/2048 USD 880,000 1,241,389 0.63 Pertamina Persero PT, 144A 6.45%
30/05/2044 USD 790,000 1,078,416 0.54
2,319,805 1.17
Emerging Markets Debt Fund

Morgan Stanley Investment Funds 31 December 2020 108
The accompanying notes are an integral part of these financial statements.
Emerging Markets Debt Fund (continued)
schEDUlE of InVEsTmEnTsAs at 31 December 2020
Investments Currency
Quantity/ Nominal
Value
Market Value USD
% of Net Assets
Transferable securities and money market instruments admitted to official exchange listing or dealt in on another regulated market
corporate Bonds (continued)
KazakhstanKazMunayGas National Co. JSC, Reg. S
6.375% 24/10/2048 USD 1,151,000 1,660,318 0.84
1,660,318 0.84
malaysiaPetronas Capital Ltd., Reg. S 3.5%
21/04/2030 USD 1,500,000 1,728,099 0.87
1,728,099 0.87
mexicoBanco Nacional de Comercio Exterior SNC,
Reg. S, FRN 3.8% 11/08/2026 USD 470,000 472,853 0.24 Orbia Advance Corp. SAB de CV, Reg. S
5.5% 15/01/2048 USD 1,410,000 1,713,502 0.86 Petroleos Mexicanos 6.5% 23/01/2029 USD 260,000 269,233 0.14 Petroleos Mexicanos 6.84% 23/01/2030 USD 1,512,000 1,575,489 0.80 Petroleos Mexicanos 6.625% 15/06/2035 USD 575,000 569,825 0.29 Petroleos Mexicanos 6.625% 15/06/2038 USD 1,625,000 1,535,625 0.77 Petroleos Mexicanos 6.35% 12/02/2048 USD 392,000 353,780 0.18 Petroleos Mexicanos 7.69% 23/01/2050 USD 729,000 736,290 0.37 Petroleos Mexicanos 6.95% 28/01/2060 USD 1,165,000 1,093,061 0.55 Petroleos Mexicanos, Reg. S 6.875%
16/10/2025 USD 690,000 757,206 0.38
9,076,864 4.58
nigeriaIHS Netherlands Holdco BV, Reg. S 8%
18/09/2027 USD 1,050,000 1,136,625 0.57
1,136,625 0.57
PanamaAeropuerto Internacional de Tocumen SA,
Reg. S 5.625% 18/05/2036 USD 1,250,000 1,457,813 0.74 AES Panama Generation Holdings SRL,
Reg. S 4.375% 31/05/2030 USD 520,000 563,238 0.28
2,021,051 1.02
PeruCorp. Financiera de Desarrollo SA, Reg. S
2.4% 28/09/2027 USD 310,000 314,650 0.16 Corp. Financiera de Desarrollo SA, FRN,
144A 5.25% 15/07/2029 USD 1,224,000 1,333,793 0.67
1,648,443 0.83
saudi arabiaSaudi Arabian Oil Co., Reg. S 3.5%
24/11/2070 USD 1,040,000 1,069,911 0.54
1,069,911 0.54
schEDUlE of InVEsTmEnTsAs at 31 December 2020
Investments Currency
Quantity/ Nominal
Value
Market Value USD
% of Net Assets
Transferable securities and money market instruments admitted to official exchange listing or dealt in on another regulated market
corporate Bonds (continued)
south africaEskom Holdings SOC Ltd., Reg. S 6.75%
06/08/2023 USD 270,000 276,116 0.14 Eskom Holdings SOC Ltd., Reg. S 7.125%
11/02/2025 USD 992,000 1,018,040 0.51 Eskom Holdings SOC Ltd., Reg. S 8.45%
10/08/2028 USD 1,230,000 1,360,872 0.69
2,655,028 1.34
UkraineNAK Naftogaz Ukraine, Reg. S 7.125%
19/07/2024 EUR 560,000 717,335 0.36
717,335 0.36
United arab EmiratesDP World Crescent Ltd., Reg. S 4.848%
26/09/2028 USD 830,000 966,622 0.49 Galaxy Pipeline Assets Bidco Ltd., Reg. S
3.25% 30/09/2040 USD 1,195,000 1,266,173 0.64
2,232,795 1.13
Total corporate Bonds 45,063,804 22.72
Government Bonds
angolaAngola Government Bond, Reg. S 8%
26/11/2029 USD 818,000 770,474 0.39 Angola Government Bond, Reg. S 9.375%
08/05/2048 USD 1,200,000 1,135,500 0.57
1,905,974 0.96
argentinaArgentina Government Bond 1%
09/07/2029 USD 180,721 78,749 0.04 Argentina Government Bond 0.125%
09/07/2030 USD 562,439 228,913 0.11 Argentina Government Bond 0.125%
09/07/2035 USD 1,763,260 647,116 0.33 Province of Santa Fe, Reg. S 6.9%
01/11/2027 USD 1,330,000 917,713 0.46 Provincia de Cordoba, Reg. S 7.45%
01/09/2024 USD 720,000 446,738 0.22 Provincia de Entre Rios Argentina, Reg. S
8.75% 08/02/2025 USD 990,000 567,394 0.29
2,886,623 1.45
armeniaArmenia Government Bond, Reg. S 7.15%
26/03/2025 USD 490,000 566,161 0.29 Armenia Government Bond, Reg. S 3.95%
26/09/2029 USD 510,000 516,910 0.26
1,083,071 0.55

109 Morgan Stanley Investment Funds 31 December 2020
The accompanying notes are an integral part of these financial statements.
Emerging Markets Debt Fund (continued)
schEDUlE of InVEsTmEnTsAs at 31 December 2020
Investments Currency
Quantity/ Nominal
Value
Market Value USD
% of Net Assets
Transferable securities and money market instruments admitted to official exchange listing or dealt in on another regulated market
Government Bonds (continued)
azerbaijanAzerbaijan Government Bond, Reg. S 3.5%
01/09/2032 USD 1,750,000 1,857,573 0.94
1,857,573 0.94
BahrainBahrain Government Bond, Reg. S 6.75%
20/09/2029 USD 1,750,000 2,016,623 1.02 Bahrain Government Bond, Reg. S 7.5%
20/09/2047 USD 370,000 436,420 0.22
2,453,043 1.24
BelarusBelarus Government Bond, Reg. S 6.2%
28/02/2030 USD 710,000 721,232 0.36 Belarus Government Bond, Reg. S 6.378%
24/02/2031 USD 680,000 693,077 0.35
1,414,309 0.71
BrazilBrazil Government Bond 6% 07/04/2026 USD 1,270,000 1,527,651 0.77 Brazil Government Bond 4.5%
30/05/2029 USD 500,000 556,642 0.28 Brazil Government Bond 3.875%
12/06/2030 USD 530,000 559,548 0.28 Brazil Government Bond 5% 27/01/2045 USD 2,436,000 2,708,333 1.37
5,352,174 2.70
chileChile Government Bond 3.86%
21/06/2047 USD 400,000 488,000 0.25 Chile Government Bond 3.5% 25/01/2050 USD 920,000 1,058,009 0.53
1,546,009 0.78
colombiaColombia Government Bond 3%
30/01/2030 USD 1,260,000 1,322,855 0.67 Colombia Government Bond 5%
15/06/2045 USD 1,670,000 2,043,663 1.03
3,366,518 1.70
costa RicaCosta Rica Government Bond, Reg. S
6.125% 19/02/2031 USD 1,020,000 953,710 0.48 Costa Rica Government Bond, Reg. S
7.158% 12/03/2045 USD 610,000 568,069 0.29
1,521,779 0.77
croatiaCroatia Government Bond, Reg. S 6%
26/01/2024 USD 500,000 575,685 0.29
575,685 0.29
schEDUlE of InVEsTmEnTsAs at 31 December 2020
Investments Currency
Quantity/ Nominal
Value
Market Value USD
% of Net Assets
Transferable securities and money market instruments admitted to official exchange listing or dealt in on another regulated market
Government Bonds (continued)
Dominican RepublicDominican Republic Government Bond,
Reg. S 4.875% 23/09/2032 USD 560,000 623,006 0.31 Dominican Republic Government Bond,
Reg. S 6.875% 29/01/2026 USD 1,470,000 1,775,040 0.90 Dominican Republic Government Bond,
Reg. S 9.75% 05/06/2026 DOP 41,000,000 760,743 0.38 Dominican Republic Government Bond,
Reg. S 6% 19/07/2028 USD 490,000 586,167 0.30 Dominican Republic Government Bond,
Reg. S 5.875% 30/01/2060 USD 1,996,000 2,200,610 1.11 Dominican Republic Government Bond,
144A 7.45% 30/04/2044 USD 739,000 955,165 0.48
6,900,731 3.48
EcuadorEcuador Government Bond, Reg. S 0%
31/07/2030 USD 335,294 160,106 0.08 Ecuador Government Bond, Reg. S 0.5%
31/07/2030 USD 1,096,200 704,319 0.36 Ecuador Government Bond, Reg. S 0.5%
31/07/2035 USD 3,130,740 1,710,198 0.86 Ecuador Government Bond, Reg. S 0.5%
31/07/2040 USD 1,896,600 972,027 0.49
3,546,650 1.79
EgyptEgypt Government Bond, Reg. S 5.25%
06/10/2025 USD 660,000 703,655 0.35 Egypt Government Bond, Reg. S 4.75%
16/04/2026 EUR 930,000 1,187,880 0.60 Egypt Government Bond, Reg. S 7.5%
31/01/2027 USD 390,000 452,058 0.23 Egypt Government Bond, Reg. S 6.588%
21/02/2028 USD 910,000 1,003,339 0.51 Egypt Government Bond, Reg. S 6.375%
11/04/2031 EUR 1,350,000 1,788,572 0.90 Egypt Government Bond, Reg. S 8.875%
29/05/2050 USD 360,000 423,497 0.21 Egypt Government Bond, Reg. S 8.15%
20/11/2059 USD 2,160,000 2,384,687 1.20 Egypt Treasury Bill 0% 02/03/2021 EGP 33,500,000 2,086,343 1.05
10,030,031 5.05
El salvadorEl Salvador Government Bond, Reg. S
6.375% 18/01/2027 USD 1,771,000 1,680,254 0.85 El Salvador Government Bond, Reg. S
8.625% 28/02/2029 USD 600,000 602,256 0.30 El Salvador Government Bond, Reg. S
7.125% 20/01/2050 USD 350,000 314,125 0.16
2,596,635 1.31
GabonGabon Government Bond, Reg. S 6.95%
16/06/2025 USD 440,000 473,599 0.24 Gabon Government Bond, Reg. S 6.625%
06/02/2031 USD 740,000 767,298 0.38
1,240,897 0.62

Morgan Stanley Investment Funds 31 December 2020 110
The accompanying notes are an integral part of these financial statements.
Emerging Markets Debt Fund (continued)
schEDUlE of InVEsTmEnTsAs at 31 December 2020
Investments Currency
Quantity/ Nominal
Value
Market Value USD
% of Net Assets
Transferable securities and money market instruments admitted to official exchange listing or dealt in on another regulated market
Government Bonds (continued)
GhanaGhana Government Bond, Reg. S 7.875%
11/02/2035 USD 450,000 464,300 0.23 Ghana Government Bond, Reg. S 8.627%
16/06/2049 USD 1,800,000 1,848,357 0.93 Ghana Government Bond, Reg. S 8.95%
26/03/2051 USD 360,000 376,506 0.19
2,689,163 1.35
GuatemalaGuatemala Government Bond, Reg. S
4.875% 13/02/2028 USD 1,900,000 2,187,394 1.10 Guatemala Government Bond, Reg. S
6.125% 01/06/2050 USD 340,000 450,928 0.23
2,638,322 1.33
hondurasHonduras Government Bond, Reg. S
5.625% 24/06/2030 USD 200,000 227,000 0.11
227,000 0.11
hungaryHungary Government Bond 5.375%
25/03/2024 USD 1,250,000 1,428,185 0.72 Hungary Government Bond 7.625%
29/03/2041 USD 482,000 856,447 0.43
2,284,632 1.15
IndonesiaIndonesia Government Bond 5.35%
11/02/2049 USD 503,000 693,925 0.35 Indonesia Government Bond 4.45%
15/04/2070 USD 950,000 1,175,716 0.59 Indonesia Government Bond, 144A
5.875% 15/01/2024 USD 1,000,000 1,150,880 0.58 Indonesia Government Bond, Reg. S
5.875% 15/01/2024 USD 1,020,000 1,173,898 0.59 Indonesia Government Bond, Reg. S
4.125% 15/01/2025 USD 1,988,000 2,227,604 1.12 Indonesia Government Bond, Reg. S 4.75%
08/01/2026 USD 1,974,000 2,313,033 1.17
8,735,056 4.40
IraqIraq Government Bond, Reg. S 6.752%
09/03/2023 USD 360,000 352,508 0.18
352,508 0.18
JamaicaJamaica Government Bond 8%
15/03/2039 USD 1,380,000 2,013,134 1.01 Jamaica Government Bond 7.875%
28/07/2045 USD 480,000 687,605 0.35
2,700,739 1.36
schEDUlE of InVEsTmEnTsAs at 31 December 2020
Investments Currency
Quantity/ Nominal
Value
Market Value USD
% of Net Assets
Transferable securities and money market instruments admitted to official exchange listing or dealt in on another regulated market
Government Bonds (continued)
JordanJordan Government Bond, Reg. S 7.375%
10/10/2047 USD 880,000 1,031,903 0.52
1,031,903 0.52
KazakhstanKazakhstan Government Bond, Reg. S
5.125% 21/07/2025 USD 1,310,000 1,551,783 0.78 Kazakhstan Government Bond, Reg. S
6.5% 21/07/2045 USD 450,000 728,017 0.37
2,279,800 1.15
KenyaKenya Government Bond, Reg. S 8%
22/05/2032 USD 1,540,000 1,798,846 0.91
1,798,846 0.91
lebanonLebanon Government Bond 6.85%
25/05/2029 USD 760,000 107,517 0.05 Lebanon Government Bond, Reg. S 6.85%
23/03/2027 USD 1,910,000 270,685 0.14
378,202 0.19
mexicoMexican Bonos 7.5% 03/06/2027 MXN 18,047,000 1,034,780 0.52 Mexico Government Bond 4.15%
28/03/2027 USD 252,000 291,220 0.15 Mexico Government Bond 3.75%
11/01/2028 USD 1,530,000 1,721,227 0.87 Mexico Government Bond 4.5%
22/04/2029 USD 500,000 587,437 0.29 Mexico Government Bond 3.771%
24/05/2061 USD 596,000 621,330 0.31
4,255,994 2.14
mongoliaMongolia Government Bond, Reg. S
5.625% 01/05/2023 USD 800,000 846,024 0.43 Mongolia Government Bond, Reg. S
5.125% 07/04/2026 USD 280,000 301,000 0.15
1,147,024 0.58
moroccoMorocco Government Bond, Reg. S 4%
15/12/2050 USD 775,000 801,563 0.40
801,563 0.40

111 Morgan Stanley Investment Funds 31 December 2020
The accompanying notes are an integral part of these financial statements.
Emerging Markets Debt Fund (continued)
schEDUlE of InVEsTmEnTsAs at 31 December 2020
Investments Currency
Quantity/ Nominal
Value
Market Value USD
% of Net Assets
Transferable securities and money market instruments admitted to official exchange listing or dealt in on another regulated market
Government Bonds (continued)
nigeriaNigeria Government Bond, Reg. S 6.5%
28/11/2027 USD 1,260,000 1,362,627 0.69 Nigeria Government Bond, Reg. S 7.143%
23/02/2030 USD 1,540,000 1,665,347 0.84 Nigeria Government Bond, Reg. S 9.248%
21/01/2049 USD 1,600,000 1,884,733 0.95
4,912,707 2.48
omanOman Government Bond, Reg. S 6%
01/08/2029 USD 2,660,000 2,751,398 1.39
2,751,398 1.39
PanamaPanama Government Bond 4%
22/09/2024 USD 470,000 521,117 0.26 Panama Government Bond 3.875%
17/03/2028 USD 1,790,000 2,058,241 1.04 Panama Government Bond 4.5%
01/04/2056 USD 930,000 1,200,639 0.60
3,779,997 1.90
ParaguayParaguay Government Bond, Reg. S 4.95%
28/04/2031 USD 880,000 1,068,109 0.54 Paraguay Government Bond, Reg. S 5.4%
30/03/2050 USD 540,000 679,050 0.34
1,747,159 0.88
PeruPeru Government Bond 2.783%
23/01/2031 USD 500,000 549,880 0.28 Peru Government Bond 6.55%
14/03/2037 USD 600,000 911,583 0.46 Peru Government Bond 5.625%
18/11/2050 USD 1,300,000 2,044,646 1.03
3,506,109 1.77
PhilippinesPhilippine Government Bond 9.5%
02/02/2030 USD 1,909,000 3,155,122 1.59 Philippine Government Bond 3.95%
20/01/2040 USD 747,000 891,791 0.45
4,046,913 2.04
PolandPoland Government Bond 3% 17/03/2023 USD 970,000 1,026,698 0.52
1,026,698 0.52
schEDUlE of InVEsTmEnTsAs at 31 December 2020
Investments Currency
Quantity/ Nominal
Value
Market Value USD
% of Net Assets
Transferable securities and money market instruments admitted to official exchange listing or dealt in on another regulated market
Government Bonds (continued)
QatarQatar Government Bond, Reg. S 4%
14/03/2029 USD 908,000 1,078,295 0.55 Qatar Government Bond, Reg. S 3.75%
16/04/2030 USD 830,000 978,230 0.49 Qatar Government Bond, Reg. S 4.817%
14/03/2049 USD 3,207,000 4,383,854 2.21
6,440,379 3.25
RomaniaRomania Government Bond, Reg. S
4.375% 22/08/2023 USD 720,000 786,402 0.40 Romania Government Bond, Reg. S
4.875% 22/01/2024 USD 540,000 603,976 0.30 Romania Government Bond, Reg. S 3%
14/02/2031 USD 450,000 483,828 0.24 Romania Government Bond, Reg. S 4%
14/02/2051 USD 1,000,000 1,090,743 0.55
2,964,949 1.49
RussiaRussian Foreign Bond - Eurobond, Reg. S
4.5% 04/04/2022 USD 2,600,000 2,718,721 1.37 Russian Foreign Bond - Eurobond, Reg. S
5.625% 04/04/2042 USD 3,600,000 5,015,524 2.53
7,734,245 3.90
saudi arabiaSaudi Government Bond, Reg. S 4.375%
16/04/2029 USD 1,190,000 1,415,481 0.71 Saudi Government Bond, Reg. S 5.25%
16/01/2050 USD 1,600,000 2,185,800 1.10
3,601,281 1.81
senegalSenegal Government Bond, Reg. S 6.25%
23/05/2033 USD 760,000 855,423 0.43
855,423 0.43
serbiaSerbia Government Bond, Reg. S 2.125%
01/12/2030 USD 360,000 356,899 0.18
356,899 0.18
sri lankaSri Lanka Government Bond, Reg. S 7.55%
28/03/2030 USD 420,000 242,252 0.12 Sri Lanka Government Bond, Reg. S 6.2%
11/05/2027 USD 1,680,000 964,269 0.49
1,206,521 0.61

Morgan Stanley Investment Funds 31 December 2020 112
The accompanying notes are an integral part of these financial statements.
Emerging Markets Debt Fund (continued)
schEDUlE of InVEsTmEnTsAs at 31 December 2020
Investments Currency
Quantity/ Nominal
Value
Market Value USD
% of Net Assets
Transferable securities and money market instruments admitted to official exchange listing or dealt in on another regulated market
Government Bonds (continued)
TurkeyTurkey Government Bond 6.375%
14/10/2025 USD 990,000 1,072,016 0.54 Turkey Government Bond 5.25%
13/03/2030 USD 2,030,000 2,041,754 1.03 Turkey Government Bond 7.25%
23/12/2023 USD 1,290,000 1,413,337 0.71 Turkey Government Bond 6.875%
17/03/2036 USD 1,800,000 1,966,275 0.99 Turkey Government Bond 4.875%
16/04/2043 USD 370,000 325,267 0.17
6,818,649 3.44
UkraineUkraine Government Bond, Reg. S 7.75%
01/09/2023 USD 896,000 987,205 0.50 Ukraine Government Bond, Reg. S 7.75%
01/09/2026 USD 2,722,000 3,080,964 1.55
4,068,169 2.05
United arab EmiratesAbu Dhabi Government Bond, Reg. S
3.125% 03/05/2026 USD 1,809,000 2,011,237 1.01 Abu Dhabi Government Bond, Reg. S 2.5%
30/09/2029 USD 1,370,000 1,481,402 0.75 Abu Dhabi Government Bond, Reg. S
3.125% 16/04/2030 USD 860,000 972,875 0.49 Abu Dhabi Government Bond, Reg. S 2.7%
02/09/2070 USD 830,000 777,071 0.39
5,242,585 2.64
UruguayUruguay Government Bond 4.375%
27/10/2027 USD 1,250,000 1,482,588 0.75 Uruguay Government Bond 5.1%
18/06/2050 USD 1,330,000 1,862,738 0.94
3,345,326 1.69
UzbekistanUzbekistan Government Bond, Reg. S
3.7% 25/11/2030 USD 550,000 581,465 0.29
581,465 0.29
VenezuelaPetroleos de Venezuela SA, Reg. S 6%
15/11/2026 USD 14,050,000 562,000 0.29 Venezuela Government Bond 0%
31/12/2050 USD 852,000 0 0.00
562,000 0.29
Total Government Bonds 145,147,326 73.16
Total Transferable securities and money market instruments admitted to official exchange listing or dealt in on another regulated market 190,211,130 95.88
schEDUlE of InVEsTmEnTsAs at 31 December 2020
Investments Currency
Quantity/ Nominal
Value
Market Value USD
% of Net Assets
Units of authorised UCITS or other collective investment undertakings
collective Investment schemes – UcITs
luxembourgMorgan Stanley Liquidity Funds US Dollar
Liquidity Fund – MS Reserve† USD 4,471,289 4,471,289 2.25
4,471,289 2.25
Total collective Investment schemes – UcITs 4,471,289 2.25
Total Units of authorised UcITs or other collective investment undertakings 4,471,289 2.25
Total Investments 194,682,419 98.13
cash 548,032 0.28
other assets/(liabilities) 3,161,963 1.59
Total net assets 198,392,414 100.00
† Managed by an affiliate of the Investment Adviser.The country disclosed within the Schedule of Investments refers to the country of risk. The country of incorporation may differ.

113 Morgan Stanley Investment Funds 31 December 2020
The accompanying notes are an integral part of these financial statements.
Emerging Markets Debt Fund (continued)
forward currency Exchange contracts
currency Purchased
amount Purchased
currency sold
amount sold
maturity Date counterparty
Unrealised Gain/(loss)
UsD
% of net assets
EUR 14,638 USD 17,933 04/01/2021 J.P. Morgan 27 0.00USD 14,099 EUR 11,475 05/01/2021 J.P. Morgan 20 0.00EUR 110,000 USD 134,155 05/03/2021 J.P. Morgan 987 0.00
Unrealised Gain on forward currency Exchange contracts – assets 1,034 0.00
EUR hedged share classEUR 6,794 USD 8,335 04/01/2021 J.P. Morgan 1 0.00EUR 27,691,932 USD 33,686,543 08/01/2021 J.P. Morgan 292,514 0.15
Unrealised Gain on naV hedged share classes forward currency Exchange contracts – assets 292,515 0.15
Total Unrealised Gain on forward currency Exchange contracts – assets 293,549 0.15
USD 35,145 EUR 28,688 04/01/2021 J.P. Morgan (53) 0.00USD 3,892,348 EUR 3,200,000 05/03/2021 BNP Paribas (39,058) (0.02)
Unrealised loss on forward currency Exchange contracts – liabilities (39,111) (0.02)
EUR hedged share classUSD 120 EUR 98 04/01/2021 J.P. Morgan 0 0.00USD 212,149 EUR 173,562 08/01/2021 J.P. Morgan (818) 0.00
Unrealised loss on naV hedged share classes forward currency Exchange contracts – liabilities (818) 0.00
Total Unrealised loss on forward currency Exchange contracts – liabilities (39,929) (0.02)
net Unrealised Gain on forward currency Exchange contracts – assets 253,620 0.13
DERIVaTIVEs
Over-the-counter (OTC) and exchange traded derivatives as at 31 December 2020, expressed in US Dollars.

Morgan Stanley Investment Funds 31 December 2020 114
The accompanying notes are an integral part of these financial statements.
Please refer to the full prospectus for the Fund’s investment objective and policy.
schEDUlE of InVEsTmEnTsAs at 31 December 2020
Investments Currency
Quantity/ Nominal
Value
Market Value USD
% of Net Assets
Transferable securities and money market instruments admitted to official exchange listing or dealt in on another regulated market
Government Bonds
BrazilBrazil Notas do Tesouro Nacional 10%
01/01/2023 BRL 2,495,200 5,309,309 3.16 Brazil Notas do Tesouro Nacional 10%
01/01/2025 BRL 2,829,800 6,308,696 3.76 Brazil Notas do Tesouro Nacional 10%
01/01/2027 BRL 1,475,700 3,367,588 2.01
14,985,593 8.93
chileBonos de la Tesoreria de la Republica
en pesos 4.5% 01/03/2026 CLP 1,385,000,000 2,234,972 1.33 Bonos de la Tesoreria de la Republica
en pesos 5% 01/03/2035 CLP 765,000,000 1,326,207 0.79 Bonos de la Tesoreria de la Republica
en pesos, Reg. S, 144A 2.8% 01/10/2033 CLP 750,000,000 1,017,281 0.61
4,578,460 2.73
chinaChina Government Bond 1.99%
09/04/2025 CNY 5,500,000 809,488 0.48 China Government Bond 3.29%
18/10/2023 CNY 25,170,000 3,902,106 2.32 China Government Bond 3.13%
21/11/2029 CNY 36,310,000 5,517,206 3.29 China Government Bond 2.68%
21/05/2030 CNY 22,850,000 3,357,973 2.00
13,586,773 8.09
colombiaColombian TES 7% 04/05/2022 COP 2,853,100,000 887,930 0.53 Colombian TES 6.25% 26/11/2025 COP 3,041,500,000 976,422 0.58 Colombian TES 7.5% 26/08/2026 COP 8,617,800,000 2,916,631 1.74 Colombian TES 6% 28/04/2028 COP 9,009,300,000 2,826,783 1.68 Colombian TES 7.75% 18/09/2030 COP 4,571,900,000 1,574,304 0.94
9,182,070 5.47
czech RepublicCzech Republic Government Bond 2.75%
23/07/2029 CZK 28,000,000 1,481,575 0.88 Czech Republic Government Bond 2%
13/10/2033 CZK 17,500,000 880,696 0.53
2,362,271 1.41
Dominican RepublicDominican Republic Government Bond,
Reg. S 8.9% 15/02/2023 DOP 9,000,000 159,794 0.09 Dominican Republic Government Bond,
Reg. S 9.75% 05/06/2026 DOP 46,850,000 869,288 0.52
1,029,082 0.61
EgyptEgypt Treasury Bill 0% 02/03/2021 EGP 24,500,000 1,525,833 0.91
1,525,833 0.91
InVEsTmEnT aIm
To seek to maximise total return, measured in US Dollars, primarily through investment in a portfolio of emerging market bonds and other emerging market debt securities, denominated in the local currency of issue. The Fund intends to invest its assets in emerging market debt securities that provide a high level of current income, while at the same time holding the potential for capital appreciation.
Emerging Markets Domestic Debt Fund
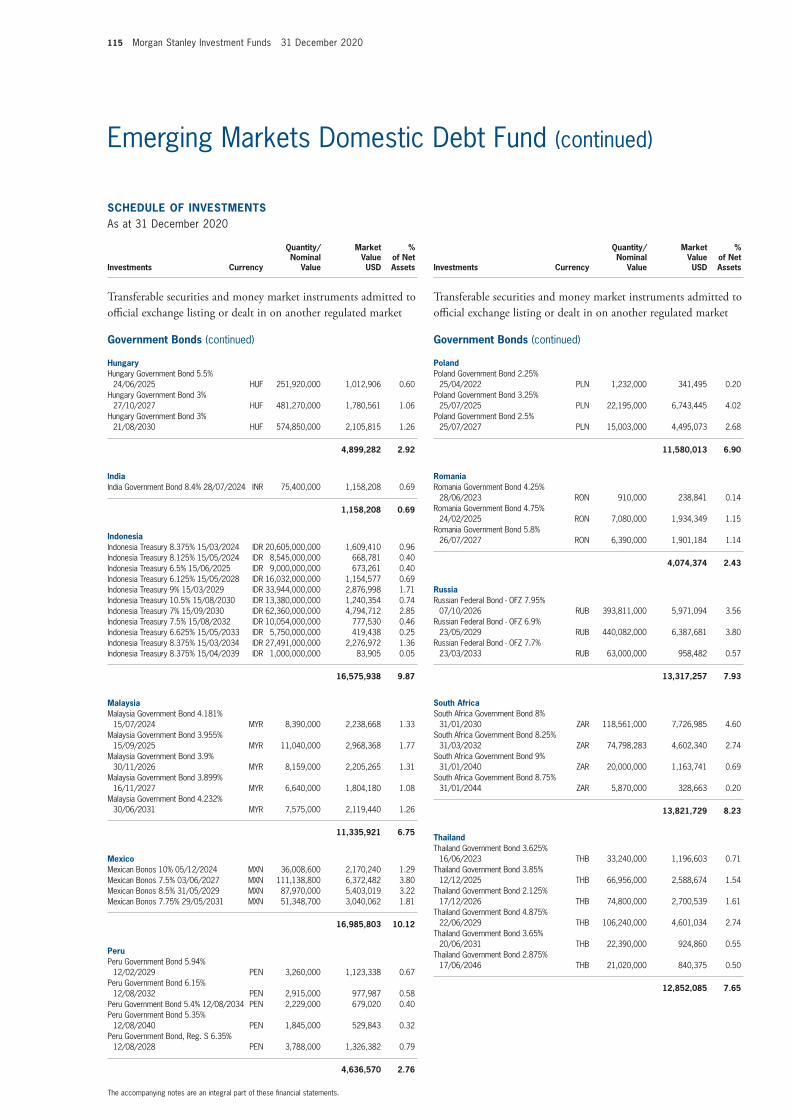
115 Morgan Stanley Investment Funds 31 December 2020
The accompanying notes are an integral part of these financial statements.
Emerging Markets Domestic Debt Fund (continued)
schEDUlE of InVEsTmEnTsAs at 31 December 2020
Investments Currency
Quantity/ Nominal
Value
Market Value USD
% of Net Assets
Transferable securities and money market instruments admitted to official exchange listing or dealt in on another regulated market
Government Bonds (continued)
hungaryHungary Government Bond 5.5%
24/06/2025 HUF 251,920,000 1,012,906 0.60 Hungary Government Bond 3%
27/10/2027 HUF 481,270,000 1,780,561 1.06 Hungary Government Bond 3%
21/08/2030 HUF 574,850,000 2,105,815 1.26
4,899,282 2.92
IndiaIndia Government Bond 8.4% 28/07/2024 INR 75,400,000 1,158,208 0.69
1,158,208 0.69
IndonesiaIndonesia Treasury 8.375% 15/03/2024 IDR 20,605,000,000 1,609,410 0.96 Indonesia Treasury 8.125% 15/05/2024 IDR 8,545,000,000 668,781 0.40 Indonesia Treasury 6.5% 15/06/2025 IDR 9,000,000,000 673,261 0.40 Indonesia Treasury 6.125% 15/05/2028 IDR 16,032,000,000 1,154,577 0.69 Indonesia Treasury 9% 15/03/2029 IDR 33,944,000,000 2,876,998 1.71 Indonesia Treasury 10.5% 15/08/2030 IDR 13,380,000,000 1,240,354 0.74 Indonesia Treasury 7% 15/09/2030 IDR 62,360,000,000 4,794,712 2.85 Indonesia Treasury 7.5% 15/08/2032 IDR 10,054,000,000 777,530 0.46 Indonesia Treasury 6.625% 15/05/2033 IDR 5,750,000,000 419,438 0.25 Indonesia Treasury 8.375% 15/03/2034 IDR 27,491,000,000 2,276,972 1.36 Indonesia Treasury 8.375% 15/04/2039 IDR 1,000,000,000 83,905 0.05
16,575,938 9.87
malaysiaMalaysia Government Bond 4.181%
15/07/2024 MYR 8,390,000 2,238,668 1.33 Malaysia Government Bond 3.955%
15/09/2025 MYR 11,040,000 2,968,368 1.77 Malaysia Government Bond 3.9%
30/11/2026 MYR 8,159,000 2,205,265 1.31 Malaysia Government Bond 3.899%
16/11/2027 MYR 6,640,000 1,804,180 1.08 Malaysia Government Bond 4.232%
30/06/2031 MYR 7,575,000 2,119,440 1.26
11,335,921 6.75
mexicoMexican Bonos 10% 05/12/2024 MXN 36,008,600 2,170,240 1.29 Mexican Bonos 7.5% 03/06/2027 MXN 111,138,800 6,372,482 3.80 Mexican Bonos 8.5% 31/05/2029 MXN 87,970,000 5,403,019 3.22 Mexican Bonos 7.75% 29/05/2031 MXN 51,348,700 3,040,062 1.81
16,985,803 10.12
PeruPeru Government Bond 5.94%
12/02/2029 PEN 3,260,000 1,123,338 0.67 Peru Government Bond 6.15%
12/08/2032 PEN 2,915,000 977,987 0.58 Peru Government Bond 5.4% 12/08/2034 PEN 2,229,000 679,020 0.40 Peru Government Bond 5.35%
12/08/2040 PEN 1,845,000 529,843 0.32 Peru Government Bond, Reg. S 6.35%
12/08/2028 PEN 3,788,000 1,326,382 0.79
4,636,570 2.76
schEDUlE of InVEsTmEnTsAs at 31 December 2020
Investments Currency
Quantity/ Nominal
Value
Market Value USD
% of Net Assets
Transferable securities and money market instruments admitted to official exchange listing or dealt in on another regulated market
Government Bonds (continued)
PolandPoland Government Bond 2.25%
25/04/2022 PLN 1,232,000 341,495 0.20 Poland Government Bond 3.25%
25/07/2025 PLN 22,195,000 6,743,445 4.02 Poland Government Bond 2.5%
25/07/2027 PLN 15,003,000 4,495,073 2.68
11,580,013 6.90
RomaniaRomania Government Bond 4.25%
28/06/2023 RON 910,000 238,841 0.14 Romania Government Bond 4.75%
24/02/2025 RON 7,080,000 1,934,349 1.15 Romania Government Bond 5.8%
26/07/2027 RON 6,390,000 1,901,184 1.14
4,074,374 2.43
RussiaRussian Federal Bond - OFZ 7.95%
07/10/2026 RUB 393,811,000 5,971,094 3.56 Russian Federal Bond - OFZ 6.9%
23/05/2029 RUB 440,082,000 6,387,681 3.80 Russian Federal Bond - OFZ 7.7%
23/03/2033 RUB 63,000,000 958,482 0.57
13,317,257 7.93
south africaSouth Africa Government Bond 8%
31/01/2030 ZAR 118,561,000 7,726,985 4.60 South Africa Government Bond 8.25%
31/03/2032 ZAR 74,798,283 4,602,340 2.74 South Africa Government Bond 9%
31/01/2040 ZAR 20,000,000 1,163,741 0.69 South Africa Government Bond 8.75%
31/01/2044 ZAR 5,870,000 328,663 0.20
13,821,729 8.23
ThailandThailand Government Bond 3.625%
16/06/2023 THB 33,240,000 1,196,603 0.71 Thailand Government Bond 3.85%
12/12/2025 THB 66,956,000 2,588,674 1.54 Thailand Government Bond 2.125%
17/12/2026 THB 74,800,000 2,700,539 1.61 Thailand Government Bond 4.875%
22/06/2029 THB 106,240,000 4,601,034 2.74 Thailand Government Bond 3.65%
20/06/2031 THB 22,390,000 924,860 0.55 Thailand Government Bond 2.875%
17/06/2046 THB 21,020,000 840,375 0.50
12,852,085 7.65

Morgan Stanley Investment Funds 31 December 2020 116
The accompanying notes are an integral part of these financial statements.
Emerging Markets Domestic Debt Fund (continued)
schEDUlE of InVEsTmEnTsAs at 31 December 2020
Investments Currency
Quantity/ Nominal
Value
Market Value USD
% of Net Assets
Transferable securities and money market instruments admitted to official exchange listing or dealt in on another regulated market
Government Bonds (continued)
TurkeyTurkey Government Bond 10.7%
17/02/2021 TRY 1,450,000 194,829 0.12 Turkey Government Bond 9.2%
22/09/2021 TRY 4,000,000 517,255 0.31 Turkey Government Bond 11%
02/03/2022 TRY 1,000,000 129,247 0.08 Turkey Government Bond 10.7%
17/08/2022 TRY 1,830,000 233,193 0.14 Turkey Government Bond 7.1%
08/03/2023 TRY 780,000 92,039 0.05 Turkey Government Bond 10.4%
20/03/2024 TRY 712,000 88,906 0.05 Turkey Government Bond 8% 12/03/2025 TRY 1,040,000 118,866 0.07 Turkey Government Bond 11%
24/02/2027 TRY 15,666,000 1,977,295 1.18
3,351,630 2.00
Total Government Bonds 161,838,892 96.40
Total Transferable securities and money market instruments admitted to official exchange listing or dealt in on another regulated market 161,838,892 96.40
Units of authorised UCITS or other collective investment undertakings
collective Investment schemes – UcITs
luxembourgMorgan Stanley Liquidity Funds US Dollar
Liquidity Fund – MS Reserve† USD 2,510,514 2,510,514 1.50
2,510,514 1.50
Total collective Investment schemes – UcITs 2,510,514 1.50
Total Units of authorised UcITs or other collective investment undertakings 2,510,514 1.50
Total Investments 164,349,406 97.90
cash 592,411 0.35
other assets/(liabilities) 2,940,376 1.75
Total net assets 167,882,193 100.00
† Managed by an affiliate of the Investment Adviser.The country disclosed within the Schedule of Investments refers to the country of risk. The country of incorporation may differ.
forward currency Exchange contracts
currency Purchased
amount Purchased
currency sold
amount sold
maturity Date counterparty
Unrealised Gain/(loss)
UsD
% of net assets
EUR 19 USD 23 04/01/2021 J.P. Morgan 0 0.00USD 15,328 EUR 12,475 05/01/2021 J.P. Morgan 22 0.00CNH 9,970,000 USD 1,515,766 05/03/2021 UBS 11,696 0.01 CZK 104,350,000 USD 4,807,493 05/03/2021 BNP Paribas 73,884 0.04 RON 4,200,000 USD 1,042,258 05/03/2021 J.P. Morgan 12,945 0.01 RUB 30,000,000 USD 395,494 05/03/2021 BNP Paribas 7,022 0.00ZAR 2,500,000 USD 168,129 05/03/2021 Citibank 1,232 0.00
Unrealised Gain on forward currency Exchange contracts – assets 106,801 0.06
EUR hedged share classEUR 1,097 USD 1,346 04/01/2021 J.P. Morgan 0 0.00USD 24,578 EUR 19,988 05/01/2021 J.P. Morgan 54 0.00EUR 19,388,268 USD 23,585,651 08/01/2021 J.P. Morgan 204,492 0.12 USD 10,846 EUR 8,819 08/01/2021 J.P. Morgan 24 0.00
Unrealised Gain on naV hedged share classes forward currency Exchange contracts – assets 204,570 0.12
Total Unrealised Gain on forward currency Exchange contracts – assets 311,371 0.18
USD 717 EUR 585 04/01/2021 J.P. Morgan (1) 0.00HUF 470,000,000 USD 1,596,388 05/03/2021 BNP Paribas (10,794) (0.01) PLN 6,600,000 USD 1,792,746 05/03/2021 Citibank (16,631) (0.01) USD 300,489 IDR 4,300,000,000 05/03/2021 J.P. Morgan (7,202) 0.00USD 1,141,781 INR 85,000,000 05/03/2021 BNP Paribas (15,167) (0.01) USD 508,361 ZAR 7,830,000 05/03/2021 J.P. Morgan (22,077) (0.01)
Unrealised loss on forward currency Exchange contracts – liabilities (71,872) (0.04)
EUR hedged share classEUR 8,819 USD 10,845 05/01/2021 J.P. Morgan (24) 0.00EUR 19,988 USD 24,580 08/01/2021 J.P. Morgan (55) 0.00USD 529,318 EUR 433,080 08/01/2021 J.P. Morgan (2,087) 0.00
Unrealised loss on naV hedged share classes forward currency Exchange contracts – liabilities (2,166) 0.00
Total Unrealised loss on forward currency Exchange contracts – liabilities (74,038) (0.04)
net Unrealised Gain on forward currency Exchange contracts – assets 237,333 0.14
DERIVaTIVEs
Over-the-counter (OTC) and exchange traded derivatives as at 31 December 2020, expressed in US Dollars.
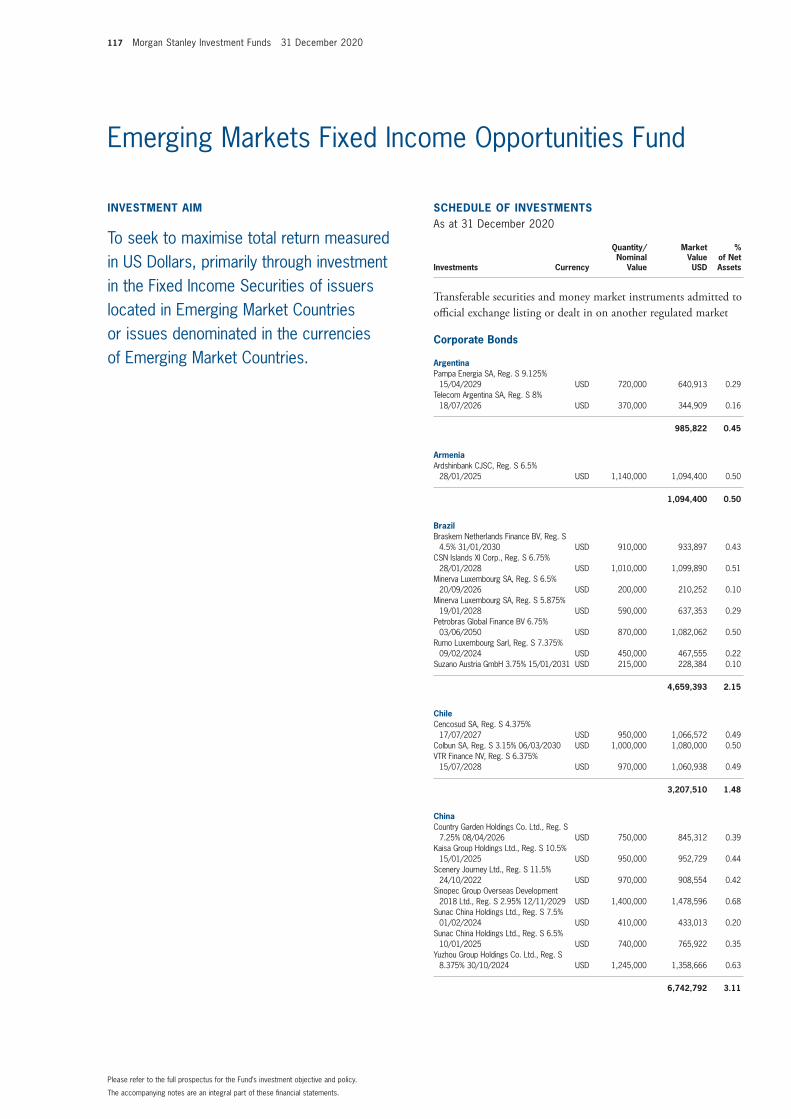
117 Morgan Stanley Investment Funds 31 December 2020
The accompanying notes are an integral part of these financial statements.
Please refer to the full prospectus for the Fund’s investment objective and policy.
InVEsTmEnT aIm
To seek to maximise total return measured in US Dollars, primarily through investment in the Fixed Income Securities of issuers located in Emerging Market Countries or issues denominated in the currencies of Emerging Market Countries.
schEDUlE of InVEsTmEnTsAs at 31 December 2020
Investments Currency
Quantity/ Nominal
Value
Market Value USD
% of Net Assets
Transferable securities and money market instruments admitted to official exchange listing or dealt in on another regulated market
corporate Bonds
argentinaPampa Energia SA, Reg. S 9.125%
15/04/2029 USD 720,000 640,913 0.29 Telecom Argentina SA, Reg. S 8%
18/07/2026 USD 370,000 344,909 0.16
985,822 0.45
armeniaArdshinbank CJSC, Reg. S 6.5%
28/01/2025 USD 1,140,000 1,094,400 0.50
1,094,400 0.50
BrazilBraskem Netherlands Finance BV, Reg. S
4.5% 31/01/2030 USD 910,000 933,897 0.43 CSN Islands XI Corp., Reg. S 6.75%
28/01/2028 USD 1,010,000 1,099,890 0.51 Minerva Luxembourg SA, Reg. S 6.5%
20/09/2026 USD 200,000 210,252 0.10 Minerva Luxembourg SA, Reg. S 5.875%
19/01/2028 USD 590,000 637,353 0.29 Petrobras Global Finance BV 6.75%
03/06/2050 USD 870,000 1,082,062 0.50 Rumo Luxembourg Sarl, Reg. S 7.375%
09/02/2024 USD 450,000 467,555 0.22 Suzano Austria GmbH 3.75% 15/01/2031 USD 215,000 228,384 0.10
4,659,393 2.15
chileCencosud SA, Reg. S 4.375%
17/07/2027 USD 950,000 1,066,572 0.49 Colbun SA, Reg. S 3.15% 06/03/2030 USD 1,000,000 1,080,000 0.50 VTR Finance NV, Reg. S 6.375%
15/07/2028 USD 970,000 1,060,938 0.49
3,207,510 1.48
chinaCountry Garden Holdings Co. Ltd., Reg. S
7.25% 08/04/2026 USD 750,000 845,312 0.39 Kaisa Group Holdings Ltd., Reg. S 10.5%
15/01/2025 USD 950,000 952,729 0.44 Scenery Journey Ltd., Reg. S 11.5%
24/10/2022 USD 970,000 908,554 0.42 Sinopec Group Overseas Development
2018 Ltd., Reg. S 2.95% 12/11/2029 USD 1,400,000 1,478,596 0.68 Sunac China Holdings Ltd., Reg. S 7.5%
01/02/2024 USD 410,000 433,013 0.20 Sunac China Holdings Ltd., Reg. S 6.5%
10/01/2025 USD 740,000 765,922 0.35 Yuzhou Group Holdings Co. Ltd., Reg. S
8.375% 30/10/2024 USD 1,245,000 1,358,666 0.63
6,742,792 3.11
Emerging Markets Fixed Income Opportunities Fund

Morgan Stanley Investment Funds 31 December 2020 118
The accompanying notes are an integral part of these financial statements.
Emerging Markets Fixed Income Opportunities Fund (continued)
schEDUlE of InVEsTmEnTsAs at 31 December 2020
Investments Currency
Quantity/ Nominal
Value
Market Value USD
% of Net Assets
Transferable securities and money market instruments admitted to official exchange listing or dealt in on another regulated market
corporate Bonds (continued)
colombiaBanco de Bogota SA, Reg. S 4.375%
03/08/2027 USD 1,400,000 1,548,764 0.71 Canacol Energy Ltd., Reg. S 7.25%
03/05/2025 USD 940,000 1,009,922 0.46 Geopark Ltd., Reg. S 6.5% 21/09/2024 USD 1,260,000 1,310,400 0.61 Grupo Aval Ltd., Reg. S 4.375%
04/02/2030 USD 1,080,000 1,151,820 0.53 Millicom International Cellular SA, Reg. S
6.625% 15/10/2026 USD 270,000 289,305 0.13 Termocandelaria Power Ltd., Reg. S
7.875% 30/01/2029 USD 680,000 749,282 0.35
6,059,493 2.79
Dominican RepublicAES Andres BV, Reg. S 7.95%
11/05/2026 USD 1,280,000 1,326,400 0.61
1,326,400 0.61
EgyptAfrican Export-Import Bank (The), Reg. S
3.994% 21/09/2029 USD 2,070,000 2,224,422 1.03
2,224,422 1.03
GhanaKosmos Energy Ltd., Reg. S 7.125%
04/04/2026 USD 985,000 957,755 0.44
957,755 0.44
IndiaGreenko Investment Co., Reg. S 4.875%
16/08/2023 USD 1,200,000 1,230,023 0.57
1,230,023 0.57
IndonesiaIndika Energy Capital III Pte. Ltd., Reg. S
5.875% 09/11/2024 USD 750,000 772,500 0.35 Jababeka International BV, 144A 6.5%
05/10/2023 USD 900,000 877,511 0.40 Jababeka International BV, Reg. S 6.5%
05/10/2023 USD 260,000 253,504 0.12 Pertamina Persero PT, Reg. S 6.5%
07/11/2048 USD 780,000 1,100,322 0.51
3,003,837 1.38
IsraelTeva Pharmaceutical Finance Netherlands
III BV 7.125% 31/01/2025 USD 1,340,000 1,476,653 0.68
1,476,653 0.68
schEDUlE of InVEsTmEnTsAs at 31 December 2020
Investments Currency
Quantity/ Nominal
Value
Market Value USD
% of Net Assets
Transferable securities and money market instruments admitted to official exchange listing or dealt in on another regulated market
corporate Bonds (continued)
mexicoFinanciera Independencia SAB de CV
SOFOM ENR, Reg. S 8% 19/07/2024 USD 1,530,000 1,371,117 0.63 Orbia Advance Corp. SAB de CV, Reg. S
5.5% 15/01/2048 USD 900,000 1,093,725 0.51 Petroleos Mexicanos 6.95% 28/01/2060 USD 514,000 482,260 0.22 Petroleos Mexicanos, Reg. S 6.875%
16/10/2025 USD 720,000 790,128 0.37 Petroleos Mexicanos 6.5% 13/03/2027 USD 2,360,000 2,498,060 1.15 Petroleos Mexicanos 6.75% 21/09/2047 USD 1,210,000 1,131,780 0.52 Petroleos Mexicanos 6.35% 12/02/2048 USD 1,594,000 1,438,585 0.66 Total Play Telecomunicaciones SA de CV,
Reg. S 7.5% 12/11/2025 USD 740,000 740,000 0.34 Trust Fibra Uno, REIT, Reg. S 6.39%
15/01/2050 USD 740,000 868,205 0.40
10,413,860 4.80
moldovaAragvi Finance International DAC, Reg. S
12% 09/04/2024 USD 1,470,000 1,607,812 0.74
1,607,812 0.74
nigeriaFidelity Bank plc, Reg. S 10.5%
16/10/2022 USD 1,140,000 1,216,950 0.56 First Bank of Nigeria Ltd., Reg. S 8.625%
27/10/2025 USD 930,000 1,009,050 0.46 IHS Netherlands Holdco BV, Reg. S 8%
18/09/2027 USD 1,462,000 1,582,615 0.73 United Bank for Africa plc, Reg. S 7.75%
08/06/2022 USD 1,510,000 1,561,529 0.72
5,370,144 2.47
PanamaAeropuerto Internacional de Tocumen SA,
Reg. S 5.625% 18/05/2036 USD 800,000 933,000 0.43 AES Panama Generation Holdings SRL,
Reg. S 4.375% 31/05/2030 USD 995,000 1,077,734 0.50
2,010,734 0.93
PeruCorp. Financiera de Desarrollo SA, Reg. S
2.4% 28/09/2027 USD 320,000 325,100 0.15 Lima Metro Line 2 Finance Ltd., Reg. S
4.35% 05/04/2036 USD 840,000 933,177 0.43
1,258,277 0.58
RussiaAlfa Bank AO, Reg. S, FRN 5.95%
15/04/2030 USD 1,100,000 1,143,120 0.53
1,143,120 0.53
saudi arabiaSaudi Arabian Oil Co., Reg. S 3.5%
24/11/2070 USD 1,060,000 1,090,486 0.50
1,090,486 0.50

119 Morgan Stanley Investment Funds 31 December 2020
The accompanying notes are an integral part of these financial statements.
schEDUlE of InVEsTmEnTsAs at 31 December 2020
Investments Currency
Quantity/ Nominal
Value
Market Value USD
% of Net Assets
Transferable securities and money market instruments admitted to official exchange listing or dealt in on another regulated market
corporate Bonds (continued)
south africaEskom Holdings SOC Ltd., Reg. S 7.125%
11/02/2025 USD 770,000 790,212 0.37 Eskom Holdings SOC Ltd., Reg. S 8.45%
10/08/2028 USD 1,360,000 1,504,704 0.69
2,294,916 1.06
supra-nationalBanque Ouest Africaine de Developpement,
Reg. S 4.7% 22/10/2031 USD 1,120,000 1,215,726 0.56
1,215,726 0.56
TanzaniaHTA Group Ltd., Reg. S 7% 18/12/2025 USD 670,000 724,525 0.33
724,525 0.33
UkraineNAK Naftogaz Ukraine, Reg. S 7.125%
19/07/2024 EUR 530,000 678,907 0.31
678,907 0.31
United arab EmiratesDP World Crescent Ltd., Reg. S 4.848%
26/09/2028 USD 800,000 931,684 0.43 DP World plc, Reg. S 4.7% 30/09/2049 USD 850,000 984,054 0.46 DP World Salaam, Reg. S 6% Perpetual USD 1,340,000 1,461,224 0.67 Galaxy Pipeline Assets Bidco Ltd., Reg. S
3.25% 30/09/2040 USD 1,215,000 1,287,364 0.59 MAF Global Securities Ltd., Reg. S, FRN
6.375% Perpetual USD 1,340,000 1,406,160 0.65
6,070,486 2.80
Total corporate Bonds 66,847,493 30.80
Government Bonds
angolaAngola Government Bond, Reg. S 8%
26/11/2029 USD 780,000 734,682 0.34
734,682 0.34
argentinaArgentina Government Bond 1%
09/07/2029 USD 74,603 32,508 0.02 Argentina Government Bond 0.125%
09/07/2030 USD 397,305 161,703 0.07 Argentina Government Bond 0.125%
09/07/2035 USD 727,894 267,137 0.12 Province of Santa Fe, Reg. S 6.9%
01/11/2027 USD 1,300,000 897,013 0.41 Provincia de Cordoba, Reg. S 7.45%
01/09/2024 USD 580,000 359,872 0.17 Provincia de Entre Rios Argentina, Reg. S
8.75% 08/02/2025 USD 1,520,000 871,150 0.40
2,589,383 1.19
schEDUlE of InVEsTmEnTsAs at 31 December 2020
Investments Currency
Quantity/ Nominal
Value
Market Value USD
% of Net Assets
Transferable securities and money market instruments admitted to official exchange listing or dealt in on another regulated market
Government Bonds (continued)
armeniaArmenia Government Bond, Reg. S 7.15%
26/03/2025 USD 490,000 566,161 0.26 Armenia Government Bond, Reg. S 3.95%
26/09/2029 USD 510,000 516,910 0.24
1,083,071 0.50
BahrainBahrain Government Bond, Reg. S 7.5%
20/09/2047 USD 1,350,000 1,592,344 0.73
1,592,344 0.73
BelarusBelarus Government Bond, Reg. S 6.2%
28/02/2030 USD 1,100,000 1,117,402 0.51 Belarus Government Bond, Reg. S 6.378%
24/02/2031 USD 650,000 662,499 0.31
1,779,901 0.82
BrazilBrazil Government Bond 4.5%
30/05/2029 USD 420,000 467,580 0.22 Brazil Government Bond 3.875%
12/06/2030 USD 520,000 548,990 0.25 Brazil Notas do Tesouro Nacional 10%
01/01/2025 BRL 1,970,300 4,392,545 2.02 Brazil Notas do Tesouro Nacional 10%
01/01/2023 BRL 1,277,200 2,717,638 1.25
8,126,753 3.74
chileBonos de la Tesoreria de la Republica
en pesos, Reg. S, 144A 2.8% 01/10/2033 CLP 660,000,000 895,207 0.41
Bonos de la Tesoreria de la Republica en pesos 4.5% 01/03/2026 CLP 640,000,000 1,032,767 0.48
Chile Government Bond 3.5% 25/01/2050 USD 840,000 966,008 0.44
2,893,982 1.33
chinaChina Government Bond 3.29%
18/10/2023 CNY 4,300,000 666,629 0.31 China Government Bond 3.13%
21/11/2029 CNY 27,050,000 4,110,174 1.89
4,776,803 2.20
colombiaColombian TES 7% 30/06/2032 COP 1,540,000,000 498,308 0.23 Colombian TES 7.5% 26/08/2026 COP 4,834,800,000 1,636,303 0.75 Colombian TES 6% 28/04/2028 COP 3,564,300,000 1,118,344 0.52 Colombian TES 7.75% 18/09/2030 COP 2,506,000,000 862,925 0.40
4,115,880 1.90
Emerging Markets Fixed Income Opportunities Fund (continued)

Morgan Stanley Investment Funds 31 December 2020 120
The accompanying notes are an integral part of these financial statements.
Emerging Markets Fixed Income Opportunities Fund (continued)
schEDUlE of InVEsTmEnTsAs at 31 December 2020
Investments Currency
Quantity/ Nominal
Value
Market Value USD
% of Net Assets
Transferable securities and money market instruments admitted to official exchange listing or dealt in on another regulated market
Government Bonds (continued)
costa RicaCosta Rica Government Bond, Reg. S
6.125% 19/02/2031 USD 1,030,000 963,060 0.44
963,060 0.44
Dominican RepublicDominican Republic Government Bond,
Reg. S 4.875% 23/09/2032 USD 280,000 311,503 0.14 Dominican Republic Government Bond,
Reg. S 8.9% 15/02/2023 DOP 8,000,000 142,039 0.07 Dominican Republic Government Bond,
Reg. S 9.75% 05/06/2026 DOP 35,300,000 654,981 0.30 Dominican Republic Government Bond,
Reg. S 5.875% 30/01/2060 USD 1,270,000 1,400,188 0.65
2,508,711 1.16
EcuadorEcuador Government Bond, Reg. S 0%
31/07/2030 USD 136,412 65,138 0.03 Ecuador Government Bond, Reg. S 0.5%
31/07/2030 USD 481,950 309,658 0.14 Ecuador Government Bond, Reg. S 0.5%
31/07/2035 USD 1,563,015 853,812 0.39 Ecuador Government Bond, Reg. S 0.5%
31/07/2040 USD 1,328,850 681,049 0.32
1,909,657 0.88
EgyptEgypt Government Bond, Reg. S 5.25%
06/10/2025 USD 690,000 735,639 0.34 Egypt Government Bond, Reg. S 4.75%
16/04/2026 EUR 270,000 344,868 0.16 Egypt Government Bond, Reg. S 6.375%
11/04/2031 EUR 1,190,000 1,576,593 0.73 Egypt Government Bond, Reg. S 8.875%
29/05/2050 USD 350,000 411,733 0.19 Egypt Government Bond, Reg. S 8.15%
20/11/2059 USD 750,000 828,017 0.38 Egypt Treasury Bill 0% 02/03/2021 EGP 34,700,000 2,161,077 1.00
6,057,927 2.80
El salvadorEl Salvador Government Bond, Reg. S
7.125% 20/01/2050 USD 320,000 287,200 0.14 El Salvador Government Bond, Reg. S
8.625% 28/02/2029 USD 480,000 481,805 0.22
769,005 0.36
GabonGabon Government Bond, Reg. S 6.625%
06/02/2031 USD 490,000 508,076 0.23
508,076 0.23
schEDUlE of InVEsTmEnTsAs at 31 December 2020
Investments Currency
Quantity/ Nominal
Value
Market Value USD
% of Net Assets
Transferable securities and money market instruments admitted to official exchange listing or dealt in on another regulated market
Government Bonds (continued)
GhanaGhana Government Bond, Reg. S 7.875%
11/02/2035 USD 520,000 536,525 0.25 Ghana Government Bond, Reg. S 8.95%
26/03/2051 USD 330,000 345,130 0.16
881,655 0.41
GuatemalaGuatemala Government Bond, Reg. S
4.875% 13/02/2028 USD 900,000 1,036,134 0.48 Guatemala Government Bond, Reg. S
6.125% 01/06/2050 USD 510,000 676,393 0.31
1,712,527 0.79
hondurasHonduras Government Bond, Reg. S
5.625% 24/06/2030 USD 190,000 215,650 0.10
215,650 0.10
hungaryHungary Government Bond 3%
21/08/2030 HUF 399,300,000 1,462,733 0.67
1,462,733 0.67
IndonesiaIndonesia Government Bond 4.45%
15/04/2070 USD 1,070,000 1,324,228 0.61 Indonesia Government Bond, Reg. S
3.85% 18/07/2027 USD 910,000 1,041,392 0.48 Indonesia Treasury 8.125% 15/05/2024 IDR 22,268,000,000 1,742,822 0.80 Indonesia Treasury 7% 15/09/2030 IDR 30,188,000,000 2,321,084 1.07 Indonesia Treasury 7.5% 15/08/2032 IDR 5,479,000,000 423,721 0.20 Indonesia Treasury 8.375% 15/04/2039 IDR 9,400,000,000 788,708 0.36 Indonesia Treasury 9% 15/03/2029 IDR 15,192,000,000 1,287,631 0.59 Indonesia Treasury 8.75% 15/05/2031 IDR 16,650,000,000 1,405,184 0.65 Indonesia Treasury 8.375% 15/03/2034 IDR 13,150,000,000 1,089,163 0.50
11,423,933 5.26
IraqIraq Government Bond, Reg. S 6.752%
09/03/2023 USD 230,000 225,214 0.10
225,214 0.10
JamaicaJamaica Government Bond 8%
15/03/2039 USD 730,000 1,065,807 0.49 Jamaica Government Bond 7.875%
28/07/2045 USD 260,000 372,453 0.17
1,438,260 0.66
JordanJordan Government Bond, Reg. S 7.375%
10/10/2047 USD 1,150,000 1,348,509 0.62
1,348,509 0.62

121 Morgan Stanley Investment Funds 31 December 2020
The accompanying notes are an integral part of these financial statements.
schEDUlE of InVEsTmEnTsAs at 31 December 2020
Investments Currency
Quantity/ Nominal
Value
Market Value USD
% of Net Assets
Transferable securities and money market instruments admitted to official exchange listing or dealt in on another regulated market
Government Bonds (continued)
lebanonLebanon Government Bond, Reg. S 6.85%
23/03/2027§ USD 960,000 136,051 0.06
136,051 0.06
malaysiaMalaysia Government Bond 4.181%
15/07/2024 MYR 1,546,000 412,513 0.19 Malaysia Government Bond 3.955%
15/09/2025 MYR 12,781,000 3,436,477 1.58 Malaysia Government Bond 4.498%
15/04/2030 MYR 567,000 162,008 0.08 Malaysia Government Bond 4.232%
30/06/2031 MYR 3,359,000 939,828 0.43
4,950,826 2.28
mexicoMexican Bonos 6.5% 10/06/2021 MXN 4,408,500 223,849 0.10 Mexican Bonos 8% 07/12/2023 MXN 5,218,000 288,535 0.13 Mexican Bonos 10% 05/12/2024 MXN 34,127,900 2,056,890 0.95 Mexican Bonos 7.5% 03/06/2027 MXN 123,744,700 7,095,279 3.27 Mexican Bonos 7.75% 29/05/2031 MXN 8,074,800 478,063 0.22 Mexico Government Bond 4.5%
22/04/2029 USD 610,000 716,674 0.33
10,859,290 5.00
mongoliaMongolia Government Bond, Reg. S
5.625% 01/05/2023 USD 200,000 211,506 0.10 Mongolia Government Bond, Reg. S
5.125% 07/04/2026 USD 290,000 312,475 0.14
523,981 0.24
moroccoMorocco Government Bond, Reg. S 4%
15/12/2050 USD 815,000 842,934 0.39
842,934 0.39
nigeriaNigeria Government Bond, Reg. S 7.143%
23/02/2030 USD 1,400,000 1,513,952 0.70 Nigeria Government Bond, Reg. S 9.248%
21/01/2049 USD 280,000 329,828 0.15
1,843,780 0.85
ParaguayParaguay Government Bond, Reg. S 4.95%
28/04/2031 USD 600,000 728,256 0.34
728,256 0.34
schEDUlE of InVEsTmEnTsAs at 31 December 2020
Investments Currency
Quantity/ Nominal
Value
Market Value USD
% of Net Assets
Transferable securities and money market instruments admitted to official exchange listing or dealt in on another regulated market
Government Bonds (continued)
PeruPeru Government Bond 5.94%
12/02/2029 PEN 2,380,000 820,105 0.38 Peru Government Bond 5.4%
12/08/2034 PEN 1,322,000 402,721 0.19 Peru Government Bond 6.15%
12/08/2032 PEN 1,762,000 591,154 0.27 Peru Government Bond, Reg. S 6.95%
12/08/2031 PEN 655,000 236,052 0.11
2,050,032 0.95
PolandPoland Government Bond 5.75%
23/09/2022 PLN 7,910,000 2,338,440 1.08 Poland Government Bond 4%
25/10/2023 PLN 9,502,000 2,834,648 1.31 Poland Government Bond 3.25%
25/07/2025 PLN 6,590,000 2,002,222 0.92
7,175,310 3.31
QatarQatar Government Bond, Reg. S 3.75%
16/04/2030 USD 660,000 777,869 0.36 Qatar Government Bond, Reg. S 4.817%
14/03/2049 USD 2,035,000 2,781,772 1.28
3,559,641 1.64
RomaniaRomania Government Bond 4.75%
24/02/2025 RON 7,930,000 2,166,580 1.00
2,166,580 1.00
RussiaRussian Federal Bond - OFZ 7.95%
07/10/2026 RUB 39,800,000 603,461 0.28 Russian Federal Bond - OFZ 6.9%
23/05/2029 RUB 250,453,000 3,635,263 1.68 Russian Federal Bond - OFZ 7.7%
23/03/2033 RUB 167,500,000 2,548,345 1.17 Russian Foreign Bond - Eurobond, Reg. S
5.625% 04/04/2042 USD 2,000,000 2,786,402 1.28
9,573,471 4.41
saudi arabiaSaudi Government Bond, Reg. S 5.25%
16/01/2050 USD 1,620,000 2,213,123 1.02
2,213,123 1.02
senegalSenegal Government Bond, Reg. S 6.25%
23/05/2033 USD 1,800,000 2,026,001 0.93
2,026,001 0.93
Emerging Markets Fixed Income Opportunities Fund (continued)

Morgan Stanley Investment Funds 31 December 2020 122
The accompanying notes are an integral part of these financial statements.
Emerging Markets Fixed Income Opportunities Fund (continued)
schEDUlE of InVEsTmEnTsAs at 31 December 2020
Investments Currency
Quantity/ Nominal
Value
Market Value USD
% of Net Assets
Transferable securities and money market instruments admitted to official exchange listing or dealt in on another regulated market
Government Bonds (continued)
serbiaSerbia Government Bond, Reg. S 3.125%
15/05/2027 EUR 460,000 635,280 0.29
635,280 0.29
south africaSouth Africa Government Bond 8%
31/01/2030 ZAR 82,931,000 5,404,868 2.49 South Africa Government Bond 8.25%
31/03/2032 ZAR 22,903,128 1,409,230 0.65 South Africa Government Bond 9%
31/01/2040 ZAR 5,500,000 320,029 0.15 South Africa Government Bond 8.75%
31/01/2044 ZAR 8,250,000 461,920 0.21
7,596,047 3.50
ThailandThailand Government Bond 3.625%
16/06/2023 THB 43,658,000 1,571,640 0.72 Thailand Government Bond 3.85%
12/12/2025 THB 42,000,000 1,623,817 0.75 Thailand Government Bond 4.875%
22/06/2029 THB 26,500,000 1,147,660 0.53
4,343,117 2.00
TurkeyTurkey Government Bond 10.7%
17/02/2021 TRY 350,000 47,028 0.02 Turkey Government Bond 7.25%
23/12/2023 USD 1,290,000 1,413,337 0.65 Turkey Government Bond 10.4%
20/03/2024 TRY 566,000 70,675 0.03 Turkey Government Bond 6.35%
10/08/2024 USD 310,000 333,421 0.16 Turkey Government Bond 8% 12/03/2025 TRY 5,250,000 600,046 0.28 Turkey Government Bond 6.375%
14/10/2025 USD 1,040,000 1,126,159 0.52 Turkey Government Bond 11%
24/02/2027 TRY 1,899,000 239,684 0.11 Turkey Government Bond 10.5%
11/08/2027 TRY 4,400,000 542,013 0.25
4,372,363 2.02
UkraineUkraine Government Bond, 144A 6.75%
20/06/2026 EUR 300,000 406,534 0.19 Ukraine Government Bond, Reg. S 7.75%
01/09/2023 USD 220,000 242,394 0.11 Ukraine Government Bond, Reg. S 7.75%
01/09/2026 USD 1,140,000 1,290,337 0.59
1,939,265 0.89
United arab EmiratesAbu Dhabi Government Bond, Reg. S
3.125% 16/04/2030 USD 890,000 1,006,812 0.46 Abu Dhabi Government Bond, Reg. S 2.7%
02/09/2070 USD 800,000 748,984 0.35
1,755,796 0.81
schEDUlE of InVEsTmEnTsAs at 31 December 2020
Investments Currency
Quantity/ Nominal
Value
Market Value USD
% of Net Assets
Transferable securities and money market instruments admitted to official exchange listing or dealt in on another regulated market
Government Bonds (continued)
UzbekistanUzbekistan Government Bond, Reg. S
3.7% 25/11/2030 USD 560,000 592,038 0.27
592,038 0.27
VenezuelaPetroleos de Venezuela SA, Reg. S 6%
15/11/2026 USD 6,490,000 259,600 0.12
259,600 0.12
Total Government Bonds 129,260,498 59.55
Total Transferable securities and money market instruments admitted to official exchange listing or dealt in on another regulated market 196,107,991 90.35
Units of authorised UCITS or other collective investment undertakings
collective Investment schemes – UcITs
luxembourgMorgan Stanley Liquidity Funds US Dollar
Liquidity Fund – MS Reserve† USD 15,671,987 15,671,987 7.22
15,671,987 7.22
Total collective Investment schemes – UcITs 15,671,987 7.22
Total Units of authorised UcITs or other collective investment undertakings 15,671,987 7.22
Total Investments 211,779,978 97.57
cash 458,304 0.21
other assets/(liabilities) 4,808,923 2.22
Total net assets 217,047,205 100.00
§ Security is currently in default.† Managed by an affiliate of the Investment Adviser.The country disclosed within the Schedule of Investments refers to the country of risk. The country of incorporation may differ.

123 Morgan Stanley Investment Funds 31 December 2020
The accompanying notes are an integral part of these financial statements.
forward currency Exchange contracts
currency Purchased
amount Purchased
currency sold
amount sold
maturity Date counterparty
Unrealised Gain/(loss)
UsD
% of net assets
USD 6,557 EUR 5,337 05/01/2021 J.P. Morgan 9 0.00CNH 15,500,000 USD 2,356,506 05/03/2021 UBS 18,183 0.01 CZK 76,000,000 USD 3,501,384 05/03/2021 BNP Paribas 53,811 0.02 RUB 40,000,000 USD 527,325 05/03/2021 BNP Paribas 9,363 0.00USD 1,466,792 PLN 5,400,000 05/03/2021 Citibank 13,607 0.01
Unrealised Gain on forward currency Exchange contracts – assets 94,973 0.04
EUR hedged share classEUR 102,186 USD 125,362 04/01/2021 J.P. Morgan 14 0.00USD 94,475 EUR 76,831 05/01/2021 J.P. Morgan 208 0.00EUR 134,383,294 USD 163,470,482 08/01/2021 J.P. Morgan 1,422,942 0.66 USD 86,706 EUR 70,507 08/01/2021 J.P. Morgan 192 0.00
Unrealised Gain on naV hedged share classes forward currency Exchange contracts – assets 1,423,356 0.66
GBP hedged share classGBP 16,075,355 USD 21,593,622 08/01/2021 J.P. Morgan 364,872 0.17
Unrealised Gain on naV hedged share classes forward currency Exchange contracts – assets 364,872 0.17
Total Unrealised Gain on forward currency Exchange contracts – assets 1,883,201 0.87
EUR 5,337 USD 6,557 05/01/2021 J.P. Morgan (9) 0.00HUF 390,000,000 USD 1,324,662 05/03/2021 BNP Paribas (8,957) (0.01) USD 3,685,567 EUR 3,030,000 05/03/2021 BNP Paribas (36,983) (0.02) USD 1,271,838 IDR 18,200,000,000 05/03/2021 J.P. Morgan (30,481) (0.01) USD 1,928,483 MXN 38,740,000 05/03/2021 UBS (8,675) 0.00USD 999,193 ZAR 15,390,000 05/03/2021 J.P. Morgan (43,393) (0.02)
Unrealised loss on forward currency Exchange contracts – liabilities (128,498) (0.06)
EUR hedged share classUSD 79,204 EUR 64,562 04/01/2021 J.P. Morgan (9) 0.00EUR 70,507 USD 86,699 05/01/2021 J.P. Morgan (191) 0.00EUR 76,831 USD 94,484 08/01/2021 J.P. Morgan (209) 0.00USD 779,566 EUR 637,898 08/01/2021 J.P. Morgan (3,159) 0.00
Unrealised loss on naV hedged share classes forward currency Exchange contracts – liabilities (3,568) 0.00
Total Unrealised loss on forward currency Exchange contracts – liabilities (132,066) (0.06)
net Unrealised Gain on forward currency Exchange contracts – assets 1,751,135 0.81
Emerging Markets Fixed Income Opportunities Fund (continued)
DERIVaTIVEs
Over-the-counter (OTC) and exchange traded derivatives as at 31 December 2020, expressed in US Dollars.

Morgan Stanley Investment Funds 31 December 2020 124
The accompanying notes are an integral part of these financial statements.
Please refer to the full prospectus for the Fund’s investment objective and policy.
Euro Bond Fund
InVEsTmEnT aIm
To provide an attractive rate of relative return, measured in Euro, through investment primarily in Euro denominated Fixed Income Securities whether issued by corporations, governments or government guaranteed issuers.
schEDUlE of InVEsTmEnTsAs at 31 December 2020
Investments Currency
Quantity/ Nominal
Value
Market Value EUR
% of Net Assets
Transferable securities and money market instruments admitted to official exchange listing or dealt in on another regulated market
corporate Bonds
australiaAusNet Services Holdings Pty. Ltd., Reg. S
1.5% 26/02/2027 EUR 1,900,000 2,072,140 0.26 Australia & New Zealand Banking Group
Ltd., Reg. S 0.45% 22/11/2023 EUR 3,000,000 3,075,912 0.38 BHP Billiton Finance Ltd., Reg. S, FRN
5.625% 22/10/2079 EUR 1,500,000 1,753,751 0.22 Commonwealth Bank of Australia, Reg. S
0.375% 11/04/2024 EUR 2,500,000 2,564,892 0.32 National Australia Bank Ltd., Reg. S
0.625% 30/08/2023 EUR 550,000 563,565 0.07 National Australia Bank Ltd., Reg. S
0.75% 30/01/2026 EUR 2,000,000 2,112,360 0.26 Optus Finance Pty. Ltd., Reg. S 1%
20/06/2029 EUR 2,500,000 2,636,513 0.33 Scentre Group Trust 1, REIT, Reg. S
1.45% 28/03/2029 EUR 2,000,000 2,127,100 0.26 Scentre Group Trust 1, REIT, Reg. S
2.25% 16/07/2024 EUR 200,000 213,674 0.03 SGSP Australia Assets Pty. Ltd., Reg. S
2% 30/06/2022 EUR 2,700,000 2,772,468 0.35 Transurban Finance Co. Pty. Ltd., Reg. S
1.75% 29/03/2028 EUR 2,000,000 2,217,162 0.28 Transurban Finance Co. Pty. Ltd., Reg. S
1.875% 16/09/2024 EUR 1,400,000 1,494,280 0.19 Westpac Banking Corp., Reg. S 0.375%
02/04/2026 EUR 2,000,000 2,075,186 0.26
25,679,003 3.21
austriaErste Group Bank AG, Reg. S 0.05%
16/09/2025 EUR 800,000 804,929 0.10 UNIQA Insurance Group AG, Reg. S
1.375% 09/07/2030 EUR 800,000 873,316 0.11 Vienna Insurance Group AG Wiener
Versicherung Gruppe, Reg. S, FRN 3.75% 02/03/2046 EUR 2,000,000 2,237,950 0.28
Vienna Insurance Group AG Wiener Versicherung Gruppe, Reg. S, FRN 5.5% 09/10/2043 EUR 1,000,000 1,142,500 0.14
5,058,695 0.63
BelgiumAnheuser-Busch InBev SA/NV, Reg. S
2.75% 17/03/2036 EUR 1,510,000 1,906,333 0.24 Euroclear Investments SA, Reg. S, FRN
2.625% 11/04/2048 EUR 1,000,000 1,118,500 0.14 FLUVIUS System Operator CVBA, Reg. S
0.25% 02/12/2030 EUR 1,000,000 1,014,645 0.13 ING Belgium SA, Reg. S 0.01%
20/02/2030 EUR 1,500,000 1,541,430 0.19
5,580,908 0.70
canadaBank of Montreal, Reg. S 0.125%
26/03/2023 EUR 5,150,000 5,220,488 0.65 Bank of Nova Scotia (The), Reg. S 0.01%
18/03/2025 EUR 3,000,000 3,054,951 0.38 Canadian Imperial Bank of Commerce,
Reg. S 0.75% 22/03/2023 EUR 2,000,000 2,045,888 0.26 Canadian Imperial Bank of Commerce,
Reg. S 0.04% 09/07/2027 EUR 2,550,000 2,608,872 0.33

125 Morgan Stanley Investment Funds 31 December 2020
The accompanying notes are an integral part of these financial statements.
Euro Bond Fund (continued)
schEDUlE of InVEsTmEnTsAs at 31 December 2020
Investments Currency
Quantity/ Nominal
Value
Market Value EUR
% of Net Assets
Transferable securities and money market instruments admitted to official exchange listing or dealt in on another regulated market
corporate Bonds (continued)
canada (continued)CPPIB Capital, Inc., Reg. S 0.25%
06/04/2027 EUR 3,000,000 3,101,531 0.39 CPPIB Capital, Inc., Reg. S 0.75%
15/07/2049 EUR 3,000,000 3,340,349 0.42 Royal Bank of Canada, Reg. S 0.625%
10/09/2025 EUR 4,000,000 4,195,892 0.52 Toronto-Dominion Bank (The), Reg. S
0.25% 12/01/2023 EUR 3,500,000 3,552,185 0.44
27,120,156 3.39
chinaBank of China Ltd., Reg. S 0%
16/10/2021 EUR 1,750,000 1,749,843 0.22 Bank of China Ltd., Reg. S, FRN 0%
17/04/2021 EUR 500,000 500,346 0.06 Bank of China Ltd., Reg. S 0.75%
12/07/2021 EUR 850,000 853,876 0.11 China Merchants Bank Co. Ltd., Reg. S
0.25% 19/06/2022 EUR 1,900,000 1,893,540 0.24 CNAC HK Finbridge Co. Ltd., Reg. S
1.125% 22/09/2024 EUR 2,000,000 1,957,732 0.25 CNAC HK Finbridge Co. Ltd., Reg. S
1.75% 14/06/2022 EUR 1,450,000 1,452,827 0.18 Export-Import Bank of China (The), Reg. S
0.3% 06/03/2022 EUR 650,000 653,270 0.08 Export-Import Bank of China (The), Reg. S
0.75% 08/06/2022 EUR 500,000 505,656 0.06 Export-Import Bank of China (The), Reg. S
0.625% 02/12/2021 EUR 1,000,000 1,005,977 0.13 Sinopec Group Overseas Development
2015 Ltd., Reg. S 1% 28/04/2022 EUR 1,400,000 1,417,307 0.18 State Grid Europe Development 2014 plc,
Reg. S 1.5% 26/01/2022 EUR 250,000 253,866 0.03 State Grid Europe Development 2014 plc,
Reg. S 2.45% 26/01/2027 EUR 375,000 411,938 0.05 State Grid Overseas Investment 2016 Ltd.,
Reg. S 0.797% 05/08/2026 EUR 1,500,000 1,523,906 0.19 Three Gorges Finance II Cayman Islands
Ltd., Reg. S 1.7% 10/06/2022 EUR 1,100,000 1,123,607 0.14 Triceratops Capital Co. Ltd., Reg. S
0.817% 25/01/2021 EUR 1,050,000 1,050,609 0.13
16,354,300 2.05
DenmarkDanske Bank A/S, Reg. S, FRN 1.375%
12/02/2030 EUR 2,650,000 2,694,560 0.34
2,694,560 0.34
franceAeroports de Paris, Reg. S 2.75%
02/04/2030 EUR 3,100,000 3,772,557 0.47 Aeroports de Paris, Reg. S 1.5%
02/07/2032 EUR 600,000 669,545 0.08 Agence Francaise de Developpement EPIC,
Reg. S 0% 25/03/2025 EUR 3,400,000 3,461,424 0.43 Agence Francaise de Developpement EPIC,
Reg. S 0.5% 31/05/2035 EUR 3,000,000 3,165,894 0.40 Airbus SE, Reg. S 2.375% 07/04/2032 EUR 650,000 771,607 0.10 Airbus SE, Reg. S 2.375% 09/06/2040 EUR 700,000 836,756 0.11 AXA Bank Europe SCF, Reg. S 0.125%
01/10/2024 EUR 4,300,000 4,397,060 0.55
schEDUlE of InVEsTmEnTsAs at 31 December 2020
Investments Currency
Quantity/ Nominal
Value
Market Value EUR
% of Net Assets
Transferable securities and money market instruments admitted to official exchange listing or dealt in on another regulated market
corporate Bonds (continued)
france (continued)AXA Home Loan SFH SA, Reg. S 0.01%
16/10/2029 EUR 4,200,000 4,305,554 0.54 AXA SA, Reg. S, FRN 3.25% 28/05/2049 EUR 2,500,000 2,929,583 0.37 AXA SA, Reg. S, FRN 5.125%
04/07/2043 EUR 1,000,000 1,122,414 0.14 Banque Federative du Credit Mutuel SA,
Reg. S 0.75% 15/06/2023 EUR 1,900,000 1,949,208 0.24 BNP Paribas SA, Reg. S, FRN 1.125%
17/04/2029 EUR 1,600,000 1,690,933 0.21 BNP Paribas SA, Reg. S 2.875%
01/10/2026 EUR 1,000,000 1,129,860 0.14 BNP Paribas SA, Reg. S, FRN 2.875%
20/03/2026 EUR 1,900,000 1,911,354 0.24 Caisse d’Amortissement de la Dette
Sociale, Reg. S 0% 25/02/2028 EUR 9,000,000 9,242,919 1.16 Cie de Financement Foncier SA, Reg. S
0.01% 10/11/2027 EUR 4,000,000 4,108,008 0.51 Cie de Financement Foncier SA, Reg. S
0.875% 11/09/2028 EUR 3,000,000 3,284,820 0.41 Credit Agricole Home Loan SFH SA,
Reg. S 0.125% 16/12/2024 EUR 4,000,000 4,098,300 0.51 Credit Agricole SA, Reg. S 2.625%
17/03/2027 EUR 2,150,000 2,418,976 0.30 Klepierre SA, REIT, Reg. S 2%
12/05/2029 EUR 800,000 896,739 0.11 SCOR SE, Reg. S, FRN 3% 08/06/2046 EUR 2,000,000 2,262,500 0.28 TOTAL SE, Reg. S 2% Perpetual EUR 750,000 778,500 0.10 TOTAL SE, Reg. S, FRN 2.708%
Perpetual EUR 1,250,000 1,310,469 0.17 TOTAL SE, Reg. S, FRN 3.369%
Perpetual EUR 2,000,000 2,253,750 0.28 Unibail-Rodamco-Westfield SE, REIT,
Reg. S 2.625% 09/04/2030 EUR 1,200,000 1,366,434 0.17
64,135,164 8.02
Germanyadidas AG, Reg. S 0% 09/09/2024 EUR 600,000 605,203 0.08 Allianz Finance II BV, FRN 5.75%
08/07/2041 EUR 400,000 411,378 0.05 Allianz SE, Reg. S, FRN 2.121%
08/07/2050 EUR 1,100,000 1,207,181 0.15 BMW Finance NV, Reg. S 0.125%
13/07/2022 EUR 1,050,000 1,056,067 0.13 Commerzbank AG 0.01% 11/03/2030 EUR 8,000,000 8,213,752 1.03 Deutsche Bahn Finance GMBH, Reg. S
1.125% 18/12/2028 EUR 2,350,000 2,602,355 0.33 Deutsche Bahn Finance GMBH, Reg. S
1.375% 28/03/2031 EUR 3,000,000 3,407,241 0.43 Investitionsbank Schleswig-Holstein, Reg. S
0.01% 17/10/2029 EUR 3,000,000 3,079,857 0.39 Kreditanstalt fuer Wiederaufbau, Reg. S
0% 15/09/2028 EUR 27,000,000 27,995,301 3.50 Kreditanstalt fuer Wiederaufbau 0.25%
15/09/2025 EUR 19,000,000 19,777,632 2.47 Kreditanstalt fuer Wiederaufbau, Reg. S
0% 04/07/2024 EUR 7,500,000 7,668,375 0.96 Kreditanstalt fuer Wiederaufbau, Reg. S
1.125% 15/09/2032 EUR 20,000,000 23,304,400 2.91 Muenchener Rueckversicherungs-
Gesellschaft AG, Reg. S 1.25% 26/05/2041 EUR 500,000 520,161 0.06
Muenchener Rueckversicherungs-Gesellschaft AG, Reg. S, FRN 3.25% 26/05/2049 EUR 1,500,000 1,782,757 0.22

Morgan Stanley Investment Funds 31 December 2020 126
The accompanying notes are an integral part of these financial statements.
Euro Bond Fund (continued)
schEDUlE of InVEsTmEnTsAs at 31 December 2020
Investments Currency
Quantity/ Nominal
Value
Market Value EUR
% of Net Assets
Transferable securities and money market instruments admitted to official exchange listing or dealt in on another regulated market
corporate Bonds (continued)
netherlands (continued)Stedin Holding NV, Reg. S 1.375%
19/09/2028 EUR 1,600,000 1,757,475 0.22 Stedin Holding NV, Reg. S 0.5%
14/11/2029 EUR 400,000 412,453 0.05
42,607,965 5.33
new ZealandANZ New Zealand Int’l Ltd., Reg. S
0.125% 22/09/2023 EUR 2,700,000 2,740,493 0.34 ASB Finance Ltd., Reg. S 0.75% 13/03/2024 EUR 1,500,000 1,545,754 0.19 ASB Finance Ltd., Reg. S 0.75% 09/10/2025 EUR 4,450,000 4,678,886 0.59 BNZ International Funding Ltd., Reg. S
0.625% 23/04/2022 EUR 2,600,000 2,631,972 0.33 BNZ International Funding Ltd., Reg. S
0.625% 03/07/2025 EUR 2,000,000 2,087,560 0.26
13,684,665 1.71
norwayAvinor A/S, Reg. S 1.25% 09/02/2027 EUR 1,350,000 1,452,106 0.18 DNB Bank ASA, Reg. S, FRN 1.25%
01/03/2027 EUR 3,105,000 3,152,396 0.40 SR-Boligkreditt A/S 0.01% 08/10/2026 EUR 4,000,000 4,088,300 0.51
8,692,802 1.09
PolandPKO Bank Hipoteczny SA, Reg. S 0.625%
24/01/2023 EUR 1,500,000 1,529,075 0.19 PKO Bank Hipoteczny SA, Reg. S 0.75%
27/08/2024 EUR 700,000 725,467 0.09 Powszechna Kasa Oszczednosci Bank
Polski SA, Reg. S 0.75% 25/07/2021 EUR 166,000 166,749 0.02
2,421,291 0.30
singaporeDBS Group Holdings Ltd., Reg. S, FRN
1.5% 11/04/2028 EUR 2,000,000 2,042,592 0.25 Temasek Financial I Ltd., Reg. S 1.5%
01/03/2028 EUR 5,000,000 5,502,670 0.69 United Overseas Bank Ltd., Reg. S
0.01% 01/12/2027 EUR 5,000,000 5,085,950 0.64
12,631,212 1.58
south KoreaExport-Import Bank of Korea, Reg. S
0.625% 11/07/2023 EUR 2,000,000 2,049,762 0.26 Export-Import Bank of Korea, Reg. S
0.829% 27/04/2025 EUR 1,850,000 1,930,179 0.24 Korea Development Bank (The), Reg. S
0.625% 17/07/2023 EUR 1,000,000 1,021,135 0.13 Korea Development Bank (The), Reg. S
0% 10/07/2024 EUR 1,600,000 1,607,440 0.20 Korea Housing Finance Corp., Reg. S
0.75% 30/10/2023 EUR 2,750,000 2,826,755 0.35 Korea Housing Finance Corp., Reg. S
0.1% 18/06/2024 EUR 2,200,000 2,225,848 0.28
11,661,119 1.46
schEDUlE of InVEsTmEnTsAs at 31 December 2020
Investments Currency
Quantity/ Nominal
Value
Market Value EUR
% of Net Assets
Transferable securities and money market instruments admitted to official exchange listing or dealt in on another regulated market
corporate Bonds (continued)
Germany (continued)Muenchener Rueckversicherungs-
Gesellschaft AG, Reg. S, FRN 6% 26/05/2041 EUR 1,000,000 1,023,172 0.13
Siemens Financieringsmaatschappij NV, Reg. S 0.25% 05/06/2024 EUR 1,300,000 1,323,257 0.17
103,978,089 13.01
hong KongCheung Kong Infrastructure Finance BVI
Ltd., Reg. S 1% 12/12/2024 EUR 2,000,000 2,029,200 0.25
2,029,200 0.25
IrelandDAA Finance plc, Reg. S 1.601%
05/11/2032 EUR 850,000 931,031 0.12 GAS Networks Ireland, Reg. S 0.125%
04/12/2024 EUR 650,000 655,203 0.08 GAS Networks Ireland, Reg. S 1.375%
05/12/2026 EUR 800,000 866,515 0.11
2,452,749 0.31
JapanSumitomo Mitsui Banking Corp., Reg. S
0.55% 06/11/2023 EUR 4,000,000 4,098,160 0.51 Sumitomo Mitsui Financial Group, Inc.,
Reg. S 0.819% 23/07/2023 EUR 1,000,000 1,025,871 0.13 Sumitomo Mitsui Financial Group, Inc.,
Reg. S 0.632% 23/10/2029 EUR 2,000,000 2,066,360 0.26
7,190,391 0.90
mexicoFomento Economico Mexicano SAB de CV,
Reg. S 1.75% 20/03/2023 EUR 300,000 312,219 0.04
312,219 0.04
netherlandsAchmea Bank NV, Reg. S 0.5%
20/02/2026 EUR 3,200,000 3,339,411 0.42 Alliander NV, Reg. S, FRN 1.625%
Perpetual EUR 2,000,000 2,112,516 0.26 BNG Bank NV, Reg. S 0.5% 26/11/2025 EUR 7,500,000 7,870,800 0.98 BNG Bank NV, Reg. S 0.05% 20/11/2029 EUR 6,700,000 6,923,519 0.87 BNG Bank NV, Reg. S 1.5% 15/07/2039 EUR 4,500,000 5,667,053 0.71 Cooperatieve Rabobank UA, Reg. S, FRN
2.5% 26/05/2026 EUR 2,500,000 2,525,818 0.32 de Volksbank NV, Reg. S 0.5%
30/01/2026 EUR 2,500,000 2,619,320 0.33 ING Groep NV, Reg. S, FRN 1.625%
26/09/2029 EUR 2,500,000 2,597,192 0.32 Nederlandse Waterschapsbank NV,
Reg. S 0% 02/10/2034 EUR 4,000,000 4,035,988 0.50 Royal Schiphol Group NV, Reg. S 2%
06/04/2029 EUR 600,000 693,700 0.09 Shell International Finance BV, Reg. S
0.5% 08/11/2031 EUR 2,000,000 2,052,720 0.26

127 Morgan Stanley Investment Funds 31 December 2020
The accompanying notes are an integral part of these financial statements.
Euro Bond Fund (continued)
schEDUlE of InVEsTmEnTsAs at 31 December 2020
Investments Currency
Quantity/ Nominal
Value
Market Value EUR
% of Net Assets
Transferable securities and money market instruments admitted to official exchange listing or dealt in on another regulated market
corporate Bonds (continued)
spainBanco Santander SA, Reg. S 1.375%
09/02/2022 EUR 3,000,000 3,055,311 0.38 CaixaBank SA, Reg. S 1.25%
11/01/2027 EUR 4,000,000 4,379,316 0.55 Deutsche Bank SA Espanola, Reg. S
0.875% 16/01/2025 EUR 2,800,000 2,930,802 0.37 Liberbank SA, Reg. S 0.25%
25/09/2029 EUR 2,400,000 2,494,860 0.31 Santander Consumer Finance SA, Reg. S
1% 27/02/2024 EUR 1,400,000 1,447,576 0.18
14,307,865 1.79
supra-nationalAsian Development Bank 0.025%
31/01/2030 EUR 4,000,000 4,109,580 0.51 Council of Europe Development Bank
0.625% 30/01/2029 EUR 4,000,000 4,339,753 0.54 Council of Europe Development Bank,
Reg. S 0% 09/04/2027 EUR 6,600,000 6,806,838 0.85 Council of Europe Development Bank,
Reg. S 0.05% 21/01/2030 EUR 3,000,000 3,113,619 0.39 European Bank for Reconstruction
& Development 0% 17/10/2024 EUR 6,000,000 6,121,962 0.77 European Investment Bank, Reg. S
0.05% 24/05/2024 EUR 3,000,000 3,073,602 0.39 European Investment Bank, Reg. S
0.01% 15/11/2035 EUR 3,000,000 3,069,516 0.38 International Bank for Reconstruction
& Development 0% 15/01/2027 EUR 6,000,000 6,157,480 0.77 International Bank for Reconstruction
& Development 0% 21/02/2030 EUR 6,000,000 6,152,814 0.77 Nordic Investment Bank, Reg. S 0%
30/04/2027 EUR 2,500,000 2,574,980 0.32
45,520,144 5.69
swedenSkandinaviska Enskilda Banken AB,
Reg. S, FRN 2.5% 28/05/2026 EUR 2,000,000 2,020,062 0.25 Svenska Handelsbanken AB, Reg. S 1%
15/04/2025 EUR 700,000 735,016 0.09 Volvo Treasury AB, Reg. S 0.125%
17/09/2024 EUR 400,000 402,292 0.05 Volvo Treasury AB, Reg. S 0%
11/02/2023 EUR 2,000,000 2,004,572 0.25
5,161,942 0.64
switzerlandCredit Suisse Group AG, Reg. S, FRN
3.25% 02/04/2026 EUR 2,800,000 3,168,021 0.40 UBS AG, Reg. S 0.75% 21/04/2023 EUR 1,200,000 1,227,092 0.15 UBS Group AG, Reg. S, FRN 1.25%
17/04/2025 EUR 1,600,000 1,667,514 0.21 Zurich Insurance Co. Ltd., Reg. S, FRN
4.25% 02/10/2043 EUR 1,500,000 1,665,418 0.21
7,728,045 0.97
schEDUlE of InVEsTmEnTsAs at 31 December 2020
Investments Currency
Quantity/ Nominal
Value
Market Value EUR
% of Net Assets
Transferable securities and money market instruments admitted to official exchange listing or dealt in on another regulated market
corporate Bonds (continued)
United arab EmiratesEmirates NBD Bank PJSC, Reg. S 1.75%
23/03/2022 EUR 580,000 591,344 0.07 Emirates Telecommunications Group Co.
PJSC, Reg. S 1.75% 18/06/2021 EUR 370,000 373,787 0.05 MDGH - GMTN BV, Reg. S 5.875%
14/03/2021 EUR 1,250,000 1,266,187 0.16
2,231,318 0.28
United KingdomBarclays plc, Reg. S, FRN 3.375%
02/04/2025 EUR 3,050,000 3,367,642 0.42 BP Capital Markets plc, Reg. S 0.831%
08/11/2027 EUR 750,000 785,047 0.10 BP Capital Markets plc, Reg. S, FRN
3.25% Perpetual EUR 1,300,000 1,389,375 0.17 BP Capital Markets plc, Reg. S, FRN
3.625% Perpetual EUR 1,100,000 1,205,875 0.15 CK Hutchison Finance 16 Ltd., Reg. S
1.25% 06/04/2023 EUR 1,500,000 1,541,588 0.19 CK Hutchison Group Telecom Finance SA,
Reg. S 0.375% 17/10/2023 EUR 1,500,000 1,514,870 0.19 CK Hutchison Group Telecom Finance SA,
Reg. S 1.5% 17/10/2031 EUR 550,000 592,334 0.08 Heathrow Funding Ltd., Reg. S 1.5%
12/10/2027 EUR 650,000 680,703 0.09 HSBC Holdings plc, Reg. S 0.309%
13/11/2026 EUR 650,000 658,489 0.08 HSBC Holdings plc, Reg. S, FRN 1.5%
04/12/2024 EUR 1,350,000 1,416,000 0.18 Lloyds Banking Group plc, Reg. S, FRN
0.625% 15/01/2024 EUR 550,000 556,363 0.07 Lloyds Banking Group plc, Reg. S, FRN
3.5% 01/04/2026 EUR 850,000 967,449 0.12 Lloyds Banking Group plc, Reg. S, FRN
1.75% 07/09/2028 EUR 2,250,000 2,317,930 0.29 Lloyds Banking Group plc, Reg. S, FRN
4.5% 18/03/2030 EUR 1,110,000 1,272,364 0.16 National Grid Electricity Transmission plc,
Reg. S 0.19% 20/01/2025 EUR 2,000,000 2,024,700 0.25 Santander UK Group Holdings plc, Reg. S,
FRN 0.391% 28/02/2025 EUR 1,950,000 1,967,275 0.25 Santander UK plc, Reg. S 0.375%
20/09/2023 EUR 2,750,000 2,809,653 0.35
25,067,657 3.14
United states of americaAmerican Honda Finance Corp. 0.35%
26/08/2022 EUR 2,100,000 2,120,286 0.27 AT&T, Inc. 1.6% 19/05/2028 EUR 1,400,000 1,529,689 0.19 AT&T, Inc. 1.3% 05/09/2023 EUR 2,000,000 2,070,310 0.26 Bank of America Corp., Reg. S 0.654%
26/10/2031 EUR 1,600,000 1,641,176 0.21 Bank of America Corp., Reg. S, FRN
3.648% 31/03/2029 EUR 1,800,000 2,240,325 0.28 Chubb INA Holdings, Inc. 0.875%
15/06/2027 EUR 950,000 1,000,286 0.13 Citigroup, Inc., Reg. S, FRN 1.25%
06/07/2026 EUR 1,900,000 2,002,419 0.25 Citigroup, Inc., Reg. S, FRN 0.5%
08/10/2027 EUR 2,650,000 2,692,448 0.34 Citigroup, Inc. 1.75% 28/01/2025 EUR 1,000,000 1,072,560 0.13 Coca-Cola Co. (The) 0.125% 15/03/2029 EUR 1,050,000 1,058,983 0.13

Morgan Stanley Investment Funds 31 December 2020 128
The accompanying notes are an integral part of these financial statements.
Euro Bond Fund (continued)
schEDUlE of InVEsTmEnTsAs at 31 December 2020
Investments Currency
Quantity/ Nominal
Value
Market Value EUR
% of Net Assets
Transferable securities and money market instruments admitted to official exchange listing or dealt in on another regulated market
corporate Bonds (continued)
United states of america (continued)Eli Lilly and Co. 1.7% 01/11/2049 EUR 1,100,000 1,306,350 0.16 Goldman Sachs Group, Inc. (The), Reg. S
3.375% 27/03/2025 EUR 3,000,000 3,418,839 0.43 Goldman Sachs Group, Inc. (The), Reg. S
1.625% 27/07/2026 EUR 1,200,000 1,298,917 0.16 Illinois Tool Works, Inc. 0.25%
05/12/2024 EUR 1,550,000 1,575,405 0.20 International Business Machines Corp.
0.3% 11/02/2028 EUR 3,000,000 3,052,773 0.38 JPMorgan Chase & Co., Reg. S, FRN
1.09% 11/03/2027 EUR 1,750,000 1,842,890 0.23 JPMorgan Chase & Co., Reg. S, FRN
0.389% 24/02/2028 EUR 1,500,000 1,526,293 0.19 Marsh & McLennan Cos., Inc. 1.349%
21/09/2026 EUR 2,000,000 2,139,714 0.27 Medtronic Global Holdings SCA 1.625%
15/10/2050 EUR 600,000 671,110 0.08 Metropolitan Life Global Funding I, Reg. S
0.875% 20/01/2022 EUR 3,000,000 3,040,635 0.38 PACCAR Financial Europe BV, Reg. S 0%
03/03/2023 EUR 2,250,000 2,253,676 0.28 PepsiCo, Inc. 0.25% 06/05/2024 EUR 1,550,000 1,574,120 0.20 Verizon Communications, Inc. 1.3%
18/05/2033 EUR 1,350,000 1,471,136 0.18
42,600,340 5.33
Total corporate Bonds 496,901,799 62.16
Government Bonds
austriaAustria Government Bond, Reg. S, 144A
2.1% 20/09/2117 EUR 5,000,000 11,203,950 1.40 Austria Government Bond, Reg. S, 144A
0.85% 30/06/2120 EUR 500,000 661,143 0.09
11,865,093 1.49
BelgiumBelgium Government Bond, Reg. S, 144A
1.45% 22/06/2037 EUR 13,000,000 16,154,684 2.02 Belgium Government Bond, Reg. S, 144A
1.6% 22/06/2047 EUR 1,000,000 1,334,863 0.17 Belgium Government Bond, Reg. S, 144A
1.7% 22/06/2050 EUR 3,000,000 4,157,073 0.52
21,646,620 2.71
canadaProvince of Quebec Canada, Reg. S 0.2%
07/04/2025 EUR 5,200,000 5,333,336 0.67 Province of Ontario Canada, Reg. S 0.01%
25/11/2030 EUR 6,000,000 6,030,864 0.75
11,364,200 1.42
schEDUlE of InVEsTmEnTsAs at 31 December 2020
Investments Currency
Quantity/ Nominal
Value
Market Value EUR
% of Net Assets
Transferable securities and money market instruments admitted to official exchange listing or dealt in on another regulated market
Government Bonds (continued)
chileChile Government Bond 1.25%
29/01/2040 EUR 4,500,000 4,747,230 0.59
4,747,230 0.59
chinaChina Government Bond, Reg. S 0.125%
12/11/2026 EUR 3,650,000 3,680,999 0.46 China Government Bond, Reg. S 0.25%
25/11/2030 EUR 4,140,000 4,142,617 0.52
7,823,616 0.98
EstoniaEstonia Government Bond, Reg. S 0.125%
10/06/2030 EUR 2,925,000 3,019,045 0.38
3,019,045 0.38
finlandFinland Government Bond, Reg. S, 144A
0% 15/09/2024 EUR 4,000,000 4,110,600 0.51 Finland Government Bond, Reg. S, 144A
0.5% 15/09/2027 EUR 7,200,000 7,755,458 0.97 Finland Government Bond, Reg. S, 144A
1.125% 15/04/2034 EUR 8,500,000 10,086,321 1.26 Finland Government Bond, Reg. S, 144A
0.125% 15/04/2036 EUR 2,200,000 2,301,378 0.29
24,253,757 3.03
franceFrance Government Bond OAT, Reg. S
0.25% 25/11/2026 EUR 4,000,000 4,205,510 0.53 France Government Bond OAT, Reg. S 0%
25/11/2029 EUR 7,000,000 7,262,024 0.91 France Government Bond OAT, Reg. S 0%
25/11/2030 EUR 14,500,000 15,002,050 1.88 France Government Bond OAT, Reg. S 4%
25/10/2038 EUR 7,000,000 12,054,735 1.51 France Government Bond OAT, Reg. S,
144A 0.5% 25/05/2040 EUR 9,950,000 10,740,545 1.34 France Government Bond OAT, Reg. S,
144A 2% 25/05/2048 EUR 6,000,000 8,747,868 1.09 Societe Du Grand Paris EPIC, Reg. S 1%
18/02/2070 EUR 2,000,000 2,256,528 0.28
60,269,260 7.54
GermanyBundesrepublik Deutschland, Reg. S 6.5%
04/07/2027 EUR 1 1 0.00 State of North Rhine-Westphalia Germany,
Reg. S 0% 12/10/2035 EUR 2,000,000 2,016,660 0.25 State of North Rhine-Westphalia Germany,
Reg. S 2.15% 21/03/2119 EUR 3,250,000 5,786,996 0.73 State of North Rhine-Westphalia Germany,
Reg. S 1.375% 15/01/2120 EUR 1,000,000 1,297,930 0.16
9,101,587 1.14

129 Morgan Stanley Investment Funds 31 December 2020
The accompanying notes are an integral part of these financial statements.
Euro Bond Fund (continued)
schEDUlE of InVEsTmEnTsAs at 31 December 2020
Investments Currency
Quantity/ Nominal
Value
Market Value EUR
% of Net Assets
Transferable securities and money market instruments admitted to official exchange listing or dealt in on another regulated market
Government Bonds (continued)
IcelandIceland Government Bond, Reg. S
0.625% 03/06/2026 EUR 1,465,000 1,513,087 0.19
1,513,087 0.19
IrelandIreland Government Bond, Reg. S 1.5%
15/05/2050 EUR 2,500,000 3,355,025 0.42
3,355,025 0.42
JapanJapan Finance Organization for
Municipalities, Reg. S 0.05% 12/02/2027 EUR 2,050,000 2,078,243 0.26
Japan Finance Organization for Municipalities, Reg. S 0.875% 22/09/2021 EUR 1,620,000 1,636,104 0.21
3,714,347 0.47
lithuaniaLithuania Government Bond, Reg. S 0.5%
28/07/2050 EUR 2,000,000 2,032,028 0.25
2,032,028 0.25
luxembourgLuxembourg Government Bond, Reg. S
0% 28/04/2030 EUR 1,655,000 1,718,430 0.22 State of the Grand-Duchy of Luxembourg,
Reg. S 0% 14/09/2032 EUR 1,665,000 1,718,396 0.21
3,436,826 0.43
mexicoMexico Government Bond 1.625%
08/04/2026 EUR 9,000,000 9,386,730 1.17
9,386,730 1.17
sloveniaSlovenia Government Bond, Reg. S
1.188% 14/03/2029 EUR 6,000,000 6,713,076 0.84 Slovenia Government Bond, Reg. S
0.275% 14/01/2030 EUR 6,913,000 7,216,453 0.90 Slovenia Government Bond, Reg. S
0.488% 20/10/2050 EUR 1,800,000 1,900,069 0.24
15,829,598 1.98
schEDUlE of InVEsTmEnTsAs at 31 December 2020
Investments Currency
Quantity/ Nominal
Value
Market Value EUR
% of Net Assets
Transferable securities and money market instruments admitted to official exchange listing or dealt in on another regulated market
Government Bonds (continued)
south KoreaKorea Government Bond 0% 16/09/2025 EUR 2,785,000 2,821,288 0.35
2,821,288 0.35
spainSpain Government Bond, Reg. S, 144A
1.25% 31/10/2030 EUR 55,000,000 61,499,339 7.69 Spain Government Bond, Reg. S, 144A
2.7% 31/10/2048 EUR 3,500,000 5,148,745 0.64 Spain Government Bond, Reg. S, 144A
3.45% 30/07/2066 EUR 3,000,000 5,436,930 0.68 Spain Government Inflation Linked Bond,
Reg. S, 144A 0.65% 30/11/2027 EUR 12,000,000 14,109,821 1.77
86,194,835 10.78
Total Government Bonds 282,374,172 35.32
Total Transferable securities and money market instruments admitted to official exchange listing or dealt in on another regulated market 779,275,971 97.48
Units of authorised UCITS or other collective investment undertakings
collective Investment schemes – UcITs
luxembourgMorgan Stanley Liquidity Funds Euro
Liquidity Fund – MS Reserve† EUR 13,887,792 13,887,792 1.74
13,887,792 1.74
Total collective Investment schemes – UcITs 13,887,792 1.74
Total Units of authorised UcITs or other collective investment undertakings 13,887,792 1.74
Total Investments 793,163,763 99.22
cash 2,813,714 0.35
other assets/(liabilities) 3,421,800 0.43
Total net assets 799,399,277 100.00
† Managed by an affiliate of the Investment Adviser.The country disclosed within the Schedule of Investments refers to the country of risk. The country of incorporation may differ.

Morgan Stanley Investment Funds 31 December 2020 130
The accompanying notes are an integral part of these financial statements.
Euro Bond Fund (continued)
financial futures contracts
security Descriptionnumber
of contracts currency
Global Exposure
EUR
Unrealised Gain/(loss)
EUR
% of net assets
Euro-Bobl, 08/03/2021 (160) EUR (21,628,800) 17,600 0.00Euro-Bund, 08/03/2021 (575) EUR (102,143,000) 92,000 0.01
Total Unrealised Gain on financial futures contracts 109,600 0.01
Euro-Buxl 30 Year Bond, 08/03/2021 17 EUR 3,829,080 (9,203) 0.00Euro-Schatz, 08/03/2021 354 EUR 39,745,350 (36,285) 0.00
Total Unrealised loss on financial futures contracts (45,488) 0.00
net Unrealised Gain on financial futures contracts 64,112 0.01
Collateral received and paid by the Fund in respect of financial derivative instruments:
Type of collateral counterparty currency amount received amount paid
Euro Bond fund
Cash Goldman Sachs EUR 1,516,240 –
1,516,240 –
DERIVaTIVEs
Over-the-counter (OTC) and exchange traded derivatives as at 31 December 2020, expressed in Euro.

131 Morgan Stanley Investment Funds 31 December 2020
The accompanying notes are an integral part of these financial statements.
Please refer to the full prospectus for the Fund’s investment objective and policy.
Euro Corporate Bond Fund
InVEsTmEnT aIm
To provide an attractive rate of relative return, measured in Euro, primarily through investment in Euro-denominated Fixed Income Securities of high quality issued by corporations and other non-government related issuers.
schEDUlE of InVEsTmEnTsAs at 31 December 2020
Investments Currency
Quantity/ Nominal
Value
Market Value EUR
% of Net Assets
Transferable securities and money market instruments admitted to official exchange listing or dealt in on another regulated market
corporate Bonds
australiaAPT Pipelines Ltd., Reg. S 1.375%
22/03/2022 EUR 22,710,000 23,133,996 0.65 Aurizon Network Pty. Ltd., Reg. S 2%
18/09/2024 EUR 7,946,000 8,520,893 0.24 Aurizon Network Pty. Ltd., Reg. S 3.125%
01/06/2026 EUR 23,837,000 27,356,438 0.77 Ausgrid Finance Pty. Ltd., Reg. S 1.25%
30/07/2025 EUR 17,162,000 18,059,075 0.51 AusNet Services Holdings Pty. Ltd.,
Reg. S 0.625% 25/08/2030 EUR 13,950,000 14,502,448 0.41 BHP Billiton Finance Ltd., Reg. S, FRN
4.75% 22/04/2076 EUR 11,969,000 12,131,778 0.34 BHP Billiton Finance Ltd., Reg. S, FRN
5.625% 22/10/2079 EUR 10,134,000 11,848,338 0.33 Commonwealth Bank of Australia, Reg. S,
FRN 2% 22/04/2027 EUR 19,914,000 20,354,796 0.57 Commonwealth Bank of Australia, Reg. S,
FRN 1.936% 03/10/2029 EUR 15,195,000 15,915,775 0.45 Glencore Finance Europe Ltd., Reg. S
3.75% 01/04/2026 EUR 3,750,000 4,383,431 0.12 Glencore Finance Europe Ltd., Reg. S
1.75% 17/03/2025 EUR 15,261,000 16,116,074 0.45 Goodman Australia Finance Pty. Ltd., REIT,
Reg. S 1.375% 27/09/2025 EUR 7,200,000 7,607,448 0.21 Optus Finance Pty. Ltd., Reg. S 1%
20/06/2029 EUR 18,000,000 18,982,890 0.53 Origin Energy Finance Ltd., Reg. S 1%
17/09/2029 EUR 11,700,000 11,714,274 0.33 Santos Finance Ltd., Reg. S 4.125%
14/09/2027 USD 10,969,000 9,479,262 0.27 Scentre Group Trust 1, REIT, Reg. S
1.45% 28/03/2029 EUR 8,300,000 8,827,465 0.25 Sydney Airport Finance Co. Pty. Ltd.,
Reg. S 1.75% 26/04/2028 EUR 6,700,000 7,286,444 0.20 Transurban Finance Co. Pty. Ltd., Reg. S
1.75% 29/03/2028 EUR 3,404,000 3,773,610 0.10 Transurban Finance Co. Pty. Ltd., Reg. S
1.875% 16/09/2024 EUR 3,139,000 3,350,390 0.09 Transurban Finance Co. Pty. Ltd., Reg. S
2% 28/08/2025 EUR 8,100,000 8,806,563 0.25
252,151,388 7.07
austriaCA Immobilien Anlagen AG, Reg. S 1%
27/10/2025 EUR 5,400,000 5,501,979 0.16 CA Immobilien Anlagen AG, Reg. S
0.875% 05/02/2027 EUR 6,500,000 6,544,070 0.18 UNIQA Insurance Group AG, Reg. S
1.375% 09/07/2030 EUR 9,500,000 10,370,627 0.29 UNIQA Insurance Group AG, Reg. S, FRN
6% 27/07/2046 EUR 3,200,000 3,934,048 0.11 Vienna Insurance Group AG Wiener
Versicherung Gruppe, Reg. S, FRN 5.5% 09/10/2043 EUR 12,100,000 13,824,250 0.39
40,174,974 1.13
BelgiumAnheuser-Busch InBev SA/NV, Reg. S
3.7% 02/04/2040 EUR 17,550,000 24,885,128 0.70 Anheuser-Busch InBev SA/NV, Reg. S
2.75% 17/03/2036 EUR 5,000,000 6,312,360 0.18

Morgan Stanley Investment Funds 31 December 2020 132
The accompanying notes are an integral part of these financial statements.
Euro Corporate Bond Fund (continued)
schEDUlE of InVEsTmEnTsAs at 31 December 2020
Investments Currency
Quantity/ Nominal
Value
Market Value EUR
% of Net Assets
Transferable securities and money market instruments admitted to official exchange listing or dealt in on another regulated market
corporate Bonds (continued)
Belgium (continued)Belfius Bank SA, Reg. S 3.125%
11/05/2026 EUR 9,000,000 10,329,174 0.29 FLUVIUS System Operator CVBA, Reg. S
0.25% 02/12/2030 EUR 11,900,000 12,074,276 0.34 Fluxys Belgium SA, Reg. S 1.75%
05/10/2027 EUR 6,700,000 6,984,884 0.19 KBC Group NV, Reg. S 0.125%
10/09/2026 EUR 13,900,000 13,943,437 0.39 Solvay Finance SACA, Reg. S, FRN
5.425% Perpetual EUR 2,796,000 3,108,523 0.09 UCB SA, Reg. S 1.875% 02/04/2022 EUR 3,800,000 3,879,488 0.11
81,517,270 2.29
BrazilVale SA 3.75% 10/01/2023 EUR 11,184,000 11,941,259 0.34
11,941,259 0.34
chinaCGNPC International Ltd., Reg. S 1.625%
11/12/2024 EUR 14,765,000 15,423,962 0.43 China Merchants Bank Co. Ltd., Reg. S
0.25% 19/06/2022 EUR 14,100,000 14,052,060 0.39 CNAC HK Finbridge Co. Ltd., Reg. S
1.75% 14/06/2022 EUR 18,345,000 18,380,773 0.52 CNRC Capital Ltd., Reg. S 1.871%
07/12/2021 EUR 20,522,000 20,637,641 0.58 State Grid Europe Development 2014 plc,
Reg. S 2.45% 26/01/2027 EUR 13,715,000 15,065,927 0.42 State Grid Overseas Investment 2016 Ltd.,
Reg. S 0.797% 05/08/2026 EUR 12,000,000 12,191,250 0.34 Three Gorges Finance II Cayman Islands
Ltd., Reg. S 1.7% 10/06/2022 EUR 19,129,000 19,539,527 0.55
115,291,140 3.23
DenmarkDanske Bank A/S, Reg. S 0.875%
22/05/2023 EUR 8,250,000 8,419,463 0.23 Danske Bank A/S, Reg. S, FRN 1.375%
12/02/2030 EUR 7,800,000 7,931,157 0.22 Nykredit Realkredit A/S, Reg. S, FRN 4%
03/06/2036 EUR 9,350,000 9,503,284 0.27 STG Global Finance BV, Reg. S 1.375%
24/09/2025 EUR 10,050,000 10,246,880 0.29
36,100,784 1.01
finlandKojamo OYJ, Reg. S 1.875%
27/05/2027 EUR 6,100,000 6,598,407 0.18 Sampo OYJ, Reg. S 2.5% 03/09/2052 EUR 8,750,000 9,490,040 0.27 SATO OYJ, Reg. S 1.375% 31/05/2024 EUR 7,100,000 7,341,499 0.20 Transmission Finance DAC, Reg. S 1.5%
24/05/2023 EUR 5,769,000 5,971,878 0.17
29,401,824 0.82
schEDUlE of InVEsTmEnTsAs at 31 December 2020
Investments Currency
Quantity/ Nominal
Value
Market Value EUR
% of Net Assets
Transferable securities and money market instruments admitted to official exchange listing or dealt in on another regulated market
corporate Bonds (continued)
franceAeroports de Paris, Reg. S 1.5%
02/07/2032 EUR 13,500,000 15,064,758 0.42 Airbus SE, Reg. S 2.375% 07/04/2032 EUR 6,800,000 8,072,197 0.23 Airbus SE, Reg. S 2.375% 09/06/2040 EUR 6,050,000 7,231,958 0.20 AXA SA, Reg. S, FRN 3.25% 28/05/2049 EUR 22,500,000 26,366,243 0.74 AXA SA, Reg. S, FRN 5.125%
04/07/2043 EUR 3,194,000 3,584,990 0.10 AXA SA, Reg. S, FRN 3.941% Perpetual EUR 2,354,000 2,639,422 0.07 BEL SA, Reg. S 1.5% 18/04/2024 EUR 8,100,000 8,391,665 0.23 BNP Paribas Cardif SA, Reg. S 1%
29/11/2024 EUR 6,900,000 7,087,618 0.20 BNP Paribas Cardif SA, Reg. S, FRN
4.032% Perpetual EUR 15,900,000 18,076,312 0.51 BNP Paribas SA, Reg. S, FRN 0.5%
19/02/2028 EUR 10,000,000 10,123,850 0.28 BNP Paribas SA, Reg. S, FRN 1.125%
17/04/2029 EUR 5,700,000 6,023,948 0.17 BNP Paribas SA, Reg. S 2.375%
17/02/2025 EUR 5,592,000 6,025,878 0.17 BNP Paribas SA, Reg. S 2.75%
27/01/2026 EUR 5,890,000 6,538,183 0.18 BNP Paribas SA, Reg. S 2.875%
01/10/2026 EUR 3,139,000 3,546,631 0.10 BPCE SA, Reg. S 0.5% 15/09/2027 EUR 10,500,000 10,671,486 0.30 BPCE SA, 144A 5.15% 21/07/2024 USD 14,000,000 12,993,837 0.36 Bureau Veritas SA, Reg. S 1.25%
07/09/2023 EUR 8,000,000 8,237,760 0.23 Credit Agricole Assurances SA, Reg. S,
FRN 2.625% 29/01/2048 EUR 10,700,000 11,607,360 0.33 Credit Agricole Assurances SA, Reg. S,
FRN 4.25% Perpetual EUR 8,800,000 9,880,200 0.28 Credit Agricole Assurances SA, Reg. S,
FRN 4.5% Perpetual EUR 12,000,000 13,762,500 0.39 Credit Agricole SA, Reg. S 4%
31/12/2164 EUR 9,800,000 10,632,383 0.30 Engie SA, Reg. S, FRN 1.375% Perpetual EUR 5,200,000 5,287,750 0.15 Engie SA, Reg. S, FRN 3.25% Perpetual EUR 3,200,000 3,516,762 0.10 Indigo Group SAS, Reg. S 1.625%
19/04/2028 EUR 9,000,000 9,320,166 0.26 Klepierre SA, REIT, Reg. S 2%
12/05/2029 EUR 9,300,000 10,424,593 0.29 Orange SA, Reg. S, FRN 5% Perpetual EUR 9,900,000 12,016,125 0.34 SCOR SE, Reg. S, FRN 3% 08/06/2046 EUR 7,400,000 8,371,250 0.23 SEB SA, Reg. S 1.375% 16/06/2025 EUR 6,200,000 6,398,363 0.18 Societe Generale SA 1% 24/11/2030 EUR 7,800,000 7,827,713 0.22 Sogecap SA, Reg. S, FRN 4.125%
Perpetual EUR 10,000,000 11,200,000 0.31 TOTAL SE, Reg. S 2% Perpetual EUR 13,800,000 14,324,400 0.40 TOTAL SE, Reg. S, FRN 2.708% Perpetual EUR 13,400,000 14,048,225 0.39 TOTAL SE, Reg. S, FRN 3.369% Perpetual EUR 11,600,000 13,071,750 0.37 TOTAL SE, Reg. S, FRN 3.875% Perpetual EUR 9,900,000 10,388,812 0.29 Unibail-Rodamco-Westfield SE, Reg. S
0.625% 04/05/2027 EUR 6,300,000 6,279,191 0.18 Unibail-Rodamco-Westfield SE, REIT, Reg. S
2.625% 09/04/2030 EUR 9,600,000 10,931,472 0.31
349,965,751 9.81

133 Morgan Stanley Investment Funds 31 December 2020
The accompanying notes are an integral part of these financial statements.
Euro Corporate Bond Fund (continued)
schEDUlE of InVEsTmEnTsAs at 31 December 2020
Investments Currency
Quantity/ Nominal
Value
Market Value EUR
% of Net Assets
Transferable securities and money market instruments admitted to official exchange listing or dealt in on another regulated market
corporate Bonds (continued)
GermanyADLER Group SA, Reg. S 1.5%
26/07/2024 EUR 11,200,000 11,031,440 0.31 Allianz Finance II BV, FRN 5.75%
08/07/2041 EUR 1,600,000 1,645,514 0.05 Allianz SE, Reg. S, FRN 2.121%
08/07/2050 EUR 20,000,000 21,948,740 0.62 Allianz SE, Reg. S, FRN 3.375% Perpetual EUR 4,600,000 5,071,500 0.14 Allianz SE, Reg. S, FRN 4.75% Perpetual EUR 4,900,000 5,489,225 0.15 Bayer AG, Reg. S 0.375% 06/07/2024 EUR 9,500,000 9,636,354 0.27 Bayer AG, Reg. S 1.375% 06/07/2032 EUR 22,800,000 24,381,682 0.68 Bayer AG, Reg. S, FRN 3.125%
12/11/2079 EUR 3,100,000 3,262,827 0.09 Clearstream Banking AG, Reg. S 0%
01/12/2025 EUR 2,100,000 2,115,266 0.06 Commerzbank AG, Reg. S, FRN 4%
05/12/2030 EUR 10,500,000 11,506,740 0.32 Continental AG 2.5% 27/08/2026 EUR 6,100,000 6,817,024 0.19 Continental AG, Reg. S 0% 12/09/2023 EUR 9,000,000 9,008,496 0.25 Daimler AG, Reg. S 0.375% 08/11/2026 EUR 9,000,000 9,114,057 0.26 Daimler AG, Reg. S 1.125% 06/11/2031 EUR 16,000,000 16,993,744 0.48 Daimler International Finance BV, Reg. S
0.25% 06/11/2023 EUR 9,000,000 9,069,615 0.26 Grand City Properties SA, Reg. S 1.375%
03/08/2026 EUR 7,400,000 7,886,787 0.22 Grand City Properties SA, Reg. S 1.5%
22/02/2027 EUR 11,800,000 12,632,584 0.36 Grand City Properties SA, Reg. S, FRN
2.5% Perpetual EUR 4,500,000 4,646,250 0.13 Merck Financial Services GmbH, Reg. S
0.005% 15/12/2023 EUR 5,000,000 5,030,660 0.14 Muenchener Rueckversicherungs-
Gesellschaft AG, Reg. S 1.25% 26/05/2041 EUR 6,200,000 6,449,990 0.18
Muenchener Rueckversicherungs-Gesellschaft AG, Reg. S, FRN 6% 26/05/2041 EUR 8,800,000 9,003,914 0.25
O2 Telefonica Deutschland Finanzierungs GmbH, Reg. S 1.75% 05/07/2025 EUR 6,700,000 7,136,974 0.20
Volkswagen Bank GmbH, Reg. S 1.25% 15/12/2025 EUR 5,500,000 5,774,010 0.16
Volkswagen International Finance NV, Reg. S 4.125% 16/11/2038 EUR 26,400,000 37,913,489 1.06
Volkswagen International Finance NV, Reg. S, FRN 2.7% Perpetual EUR 6,600,000 6,752,625 0.19
Volkswagen International Finance NV, Reg. S, FRN 3.875% Perpetual EUR 7,200,000 7,756,704 0.22
Volkswagen International Finance NV, Reg. S 1.875% 30/03/2027 EUR 6,900,000 7,559,585 0.21
Volkswagen International Finance NV, Reg. S, FRN 4.625% Perpetual EUR 4,144,000 4,612,272 0.13
Volkswagen Leasing GmbH, Reg. S 1.375% 20/01/2025 EUR 9,500,000 9,950,347 0.28
Vonovia Finance BV, Reg. S, FRN 4% Perpetual EUR 9,300,000 9,629,155 0.27
Wintershall Dea Finance BV, Reg. S 0.452% 25/09/2023 EUR 14,600,000 14,732,378 0.41
Wintershall Dea Finance BV, Reg. S 1.823% 25/09/2031 EUR 14,000,000 14,766,878 0.42
319,326,826 8.96
schEDUlE of InVEsTmEnTsAs at 31 December 2020
Investments Currency
Quantity/ Nominal
Value
Market Value EUR
% of Net Assets
Transferable securities and money market instruments admitted to official exchange listing or dealt in on another regulated market
corporate Bonds (continued)
hong KongCheung Kong Infrastructure Finance BVI
Ltd., Reg. S 1% 12/12/2024 EUR 15,770,000 16,000,242 0.45
16,000,242 0.45
IcelandArion Banki HF, Reg. S 1% 20/03/2023 EUR 9,169,000 9,308,827 0.26 Landsbankinn HF, Reg. S 1% 30/05/2023 EUR 2,750,000 2,798,810 0.08 Landsbankinn HF, Reg. S 0.5%
20/05/2024 EUR 10,950,000 10,947,974 0.31
23,055,611 0.65
IndiaNTPC Ltd., Reg. S 2.75% 01/02/2027 EUR 18,687,000 19,872,896 0.56 ONGC Videsh Ltd., Reg. S 2.75%
15/07/2021 EUR 13,980,000 14,159,643 0.39
34,032,539 0.95
IndonesiaPerusahaan Perseroan Persero PT
Perusahaan Listrik Negara, Reg. S 2.875% 25/10/2025 EUR 10,250,000 11,087,505 0.31
11,087,505 0.31
IrelandAIB Group plc, Reg. S 1.5% 29/03/2023 EUR 3,062,000 3,163,857 0.09 Bank of Ireland Group plc, Reg. S, FRN
0.75% 08/07/2024 EUR 11,200,000 11,386,256 0.32 DAA Finance plc, Reg. S 1.601%
05/11/2032 EUR 5,700,000 6,243,387 0.17 Dell Bank International DAC, Reg. S
1.625% 24/06/2024 EUR 8,500,000 8,819,974 0.25 Ryanair DAC, Reg. S 2.875% 15/09/2025 EUR 5,550,000 5,947,977 0.17 Ryanair DAC, Reg. S 1.125% 10/03/2023 EUR 4,454,000 4,497,573 0.12 Ryanair DAC, Reg. S 1.125% 15/08/2023 EUR 5,172,000 5,217,255 0.15
45,276,279 1.27
IsraelTeva Pharmaceutical Finance Netherlands II
BV, Reg. S 1.125% 15/10/2024 EUR 8,565,000 7,977,013 0.22 Teva Pharmaceutical Finance Netherlands II
BV, Reg. S 1.625% 15/10/2028 EUR 11,217,000 9,943,736 0.28 Teva Pharmaceutical Finance Netherlands III
BV 3.15% 01/10/2026 USD 9,421,000 7,395,386 0.21
25,316,135 0.71
Italy2i Rete Gas SpA, Reg. S 2.195%
11/09/2025 EUR 4,000,000 4,364,532 0.12 2i Rete Gas SpA, Reg. S 1.608%
31/10/2027 EUR 16,500,000 17,897,171 0.50 Assicurazioni Generali SpA, Reg. S 2.429%
14/07/2031 EUR 5,450,000 5,983,451 0.17 Assicurazioni Generali SpA, Reg. S, FRN
5.5% 27/10/2047 EUR 15,891,000 19,617,439 0.55 CDP Reti SpA, Reg. S 1.875%
29/05/2022 EUR 10,657,000 10,890,601 0.31

Morgan Stanley Investment Funds 31 December 2020 134
The accompanying notes are an integral part of these financial statements.
Euro Corporate Bond Fund (continued)
schEDUlE of InVEsTmEnTsAs at 31 December 2020
Investments Currency
Quantity/ Nominal
Value
Market Value EUR
% of Net Assets
Transferable securities and money market instruments admitted to official exchange listing or dealt in on another regulated market
corporate Bonds (continued)
Italy (continued)Enel Finance International NV, Reg. S 0%
17/06/2024 EUR 7,500,000 7,541,768 0.21 Enel SpA, Reg. S, FRN 2.5% 24/11/2078 EUR 12,753,000 13,342,826 0.37 Enel SpA, Reg. S, FRN 3.375%
24/11/2081 EUR 14,499,000 16,090,178 0.45 FCA Bank SpA, Reg. S 0.5% 18/09/2023 EUR 12,000,000 12,120,828 0.34 FCA Bank SpA, Reg. S 0.25%
28/02/2023 EUR 6,650,000 6,677,292 0.19 Intesa Sanpaolo SpA, Reg. S 0.75%
04/12/2024 EUR 12,700,000 13,034,975 0.37 Intesa Sanpaolo SpA, Reg. S 1.75%
04/07/2029 EUR 25,050,000 27,400,542 0.77 Societa Esercizi Aereoportuali SpA Sea
3.125% 17/04/2021 EUR 1,810,000 1,826,096 0.05 Telecom Italia Finance SA 7.75%
24/01/2033 EUR 4,808,000 7,113,864 0.20 Telecom Italia SpA, Reg. S 2.375%
12/10/2027 EUR 12,311,000 12,850,591 0.36 UniCredit SpA, Reg. S 0.5% 09/04/2025 EUR 6,550,000 6,644,261 0.19 UniCredit SpA, Reg. S, FRN 1.25%
25/06/2025 EUR 7,500,000 7,753,462 0.22 UniCredit SpA, Reg. S 2.125%
24/10/2026 EUR 12,358,000 13,703,836 0.38 UniCredit SpA, Reg. S, FRN 4.375%
03/01/2027 EUR 12,753,000 13,232,475 0.37
218,086,188 6.12
JapanAsahi Group Holdings Ltd., Reg. S 0.155%
23/10/2024 EUR 9,700,000 9,764,398 0.28 Asahi Group Holdings Ltd., Reg. S 0.541%
23/10/2028 EUR 9,050,000 9,204,375 0.26 Nissan Motor Co. Ltd., Reg. S 2.652%
17/03/2026 EUR 14,250,000 15,084,016 0.42
34,052,789 0.96
luxembourgBlackstone Property Partners Europe
Holdings Sarl, Reg. S 1.25% 26/04/2027 EUR 13,000,000 13,332,865 0.37
Blackstone Property Partners Europe Holdings Sarl, Reg. S 1.4% 06/07/2022 EUR 8,554,000 8,691,454 0.24
Blackstone Property Partners Europe Holdings Sarl, Reg. S 2% 15/02/2024 EUR 4,000,000 4,199,608 0.12
Blackstone Property Partners Europe Holdings Sarl, Reg. S 2.2% 24/07/2025 EUR 11,400,000 12,233,750 0.34
INEOS Finance plc, Reg. S 2.125% 15/11/2025 EUR 5,415,000 5,365,480 0.15
Logicor Financing Sarl, Reg. S 1.5% 13/07/2026 EUR 12,850,000 13,575,254 0.38
Logicor Financing Sarl, Reg. S 1.5% 14/11/2022 EUR 11,000,000 11,274,109 0.32
Logicor Financing Sarl, Reg. S 3.25% 13/11/2028 EUR 10,750,000 12,676,207 0.36
SELP Finance Sarl, REIT, Reg. S 1.5% 20/11/2025 EUR 12,057,000 12,802,629 0.36
SELP Finance Sarl, REIT, Reg. S 1.5% 20/12/2026 EUR 7,900,000 8,489,680 0.24
102,641,036 2.88
schEDUlE of InVEsTmEnTsAs at 31 December 2020
Investments Currency
Quantity/ Nominal
Value
Market Value EUR
% of Net Assets
Transferable securities and money market instruments admitted to official exchange listing or dealt in on another regulated market
corporate Bonds (continued)
mexicoFomento Economico Mexicano SAB de CV,
Reg. S 1.75% 20/03/2023 EUR 7,073,000 7,361,090 0.21 Petroleos Mexicanos, Reg. S 2.5%
21/08/2021 EUR 7,946,000 7,977,705 0.22 Petroleos Mexicanos, Reg. S 3.75%
16/04/2026 EUR 2,642,000 2,657,847 0.07 Petroleos Mexicanos, Reg. S 4.875%
21/02/2028 EUR 11,118,000 11,378,439 0.32
29,375,081 0.82
netherlandsASR Nederland NV, Reg. S, FRN 5.125%
29/09/2045 EUR 10,090,000 12,032,325 0.34 ASR Nederland NV, Reg. S, FRN 5%
Perpetual EUR 21,917,000 24,785,387 0.69 Cooperatieve Rabobank UA, Reg. S, FRN
4.625% Perpetual EUR 6,200,000 6,781,250 0.19 Cooperatieve Rabobank UA, Reg. S, FRN
2.5% 26/05/2026 EUR 14,765,000 14,917,478 0.42 ING Groep NV, Reg. S, FRN 2%
22/03/2030 EUR 30,600,000 32,459,943 0.91 LeasePlan Corp. NV, Reg. S 0.75%
03/10/2022 EUR 6,000,000 6,082,842 0.17 LeasePlan Corp. NV, Reg. S 1.375%
07/03/2024 EUR 3,750,000 3,909,068 0.11 NN Group NV, Reg. S, FRN 4.625%
08/04/2044 EUR 19,174,000 21,599,511 0.61 Shell International Finance BV, Reg. S 0.5%
08/11/2031 EUR 15,000,000 15,395,400 0.43 Shell International Finance BV, Reg. S
1.875% 07/04/2032 EUR 8,600,000 10,119,577 0.28 Shell International Finance BV, Reg. S
1.25% 11/11/2032 EUR 7,900,000 8,749,290 0.25 Signify NV, Reg. S 2% 11/05/2024 EUR 4,450,000 4,708,456 0.13 Signify NV, Reg. S 2.375% 11/05/2027 EUR 2,500,000 2,774,150 0.08
164,314,677 4.61
PortugalBrisa-Concessao Rodoviaria SA, Reg. S
1.875% 30/04/2025 EUR 7,900,000 8,528,800 0.24
8,528,800 0.24
singaporeDBS Group Holdings Ltd., Reg. S, FRN
1.5% 11/04/2028 EUR 24,300,000 24,817,493 0.70
24,817,493 0.70
spainAbertis Infraestructuras SA, Reg. S
2.375% 27/09/2027 EUR 5,900,000 6,541,696 0.18 Amadeus IT Group SA, Reg. S 1.875%
24/09/2028 EUR 8,700,000 9,294,593 0.26 Banco Bilbao Vizcaya Argentaria SA,
Reg. S, FRN 1% 16/01/2030 EUR 12,500,000 12,503,438 0.35 Banco Santander SA, Reg. S 0.25%
19/06/2024 EUR 10,000,000 10,140,560 0.28 Banco Santander SA, Reg. S 3.125%
19/01/2027 EUR 22,500,000 25,733,407 0.72

135 Morgan Stanley Investment Funds 31 December 2020
The accompanying notes are an integral part of these financial statements.
Euro Corporate Bond Fund (continued)
schEDUlE of InVEsTmEnTsAs at 31 December 2020
Investments Currency
Quantity/ Nominal
Value
Market Value EUR
% of Net Assets
Transferable securities and money market instruments admitted to official exchange listing or dealt in on another regulated market
corporate Bonds (continued)
spain (continued)CaixaBank SA, Reg. S, FRN 2.25%
17/04/2030 EUR 36,700,000 38,442,981 1.08 Cellnex Telecom SA 1.875% 26/06/2029 EUR 12,300,000 12,660,230 0.36 Iberdrola International BV, Reg. S, FRN
1.875% Perpetual EUR 21,900,000 22,515,937 0.63 IE2 Holdco SAU, Reg. S 2.875%
01/06/2026 EUR 10,000,000 11,380,140 0.32 Inmobiliaria Colonial Socimi SA, Reg. S
1.35% 14/10/2028 EUR 11,700,000 12,107,944 0.34 Inmobiliaria Colonial Socimi SA, REIT,
Reg. S 2% 17/04/2026 EUR 9,100,000 9,806,604 0.28 Inmobiliaria Colonial Socimi SA, REIT,
Reg. S 1.45% 28/10/2024 EUR 8,200,000 8,565,974 0.24 Madrilena Red de Gas Finance BV, Reg. S
1.375% 11/04/2025 EUR 4,940,000 5,111,986 0.14 Madrilena Red de Gas Finance BV, Reg. S
2.25% 11/04/2029 EUR 9,957,000 10,863,286 0.31 NorteGas Energia Distribucion SA, Reg. S
2.065% 28/09/2027 EUR 3,205,000 3,505,071 0.10 Prosegur Cia de Seguridad SA, Reg. S 1%
08/02/2023 EUR 5,000,000 5,091,110 0.14 Redexis Gas Finance BV, Reg. S 1.875%
28/05/2025 EUR 9,500,000 10,129,375 0.28 Redexis Gas Finance BV, Reg. S 1.875%
27/04/2027 EUR 10,476,000 11,407,568 0.32 Telefonica Europe BV, Reg. S, FRN 5.875%
Perpetual EUR 2,800,000 3,154,972 0.09
228,956,872 6.42
swedenAkelius Residential Property AB, Reg. S
1.5% 23/01/2022 EUR 10,499,000 10,686,649 0.30 Akelius Residential Property Financing BV,
Reg. S 1% 17/01/2028 EUR 4,850,000 5,005,544 0.14 Akelius Residential Property Financing BV,
Reg. S 1.125% 11/01/2029 EUR 6,700,000 6,936,075 0.19 Securitas AB, Reg. S 1.125% 20/02/2024 EUR 4,500,000 4,638,973 0.13
27,267,241 0.76
switzerlandLonza Finance International NV, Reg. S
1.625% 21/04/2027 EUR 5,150,000 5,646,280 0.16 Novartis Finance SA, Reg. S 0%
23/09/2028 EUR 26,100,000 26,266,440 0.74 Syngenta Finance NV, 144A 5.182%
24/04/2028 USD 13,092,000 11,446,189 0.32 Syngenta Finance NV, Reg. S 3.375%
16/04/2026 EUR 14,000,000 15,145,676 0.42 UBS AG, Reg. S 5.125% 15/05/2024 USD 7,000,000 6,304,302 0.18 UBS Group AG, Reg. S, FRN 1.25%
17/04/2025 EUR 14,100,000 14,694,963 0.41 Zurich Insurance Co. Ltd., Reg. S, FRN
4.25% 02/10/2043 EUR 2,354,000 2,613,597 0.07
82,117,447 2.30
United arab EmiratesDP World plc, Reg. S 2.375% 25/09/2026 EUR 22,000,000 23,054,020 0.65 Emirates NBD Bank PJSC, Reg. S 1.75%
23/03/2022 EUR 4,500,000 4,588,011 0.13
27,642,031 0.78
schEDUlE of InVEsTmEnTsAs at 31 December 2020
Investments Currency
Quantity/ Nominal
Value
Market Value EUR
% of Net Assets
Transferable securities and money market instruments admitted to official exchange listing or dealt in on another regulated market
corporate Bonds (continued)
United KingdomAnnington Funding plc, Reg. S 1.65%
12/07/2024 EUR 6,554,000 6,884,151 0.19 Aviva plc, Reg. S, FRN 6.125%
05/07/2043 EUR 1,746,000 2,002,470 0.06 Aviva plc, Reg. S, FRN 3.875%
03/07/2044 EUR 6,808,000 7,578,577 0.21 Aviva plc, Reg. S, FRN 3.375%
04/12/2045 EUR 7,029,000 7,835,423 0.22 Barclays plc, Reg. S, FRN 3.375%
02/04/2025 EUR 7,000,000 7,729,015 0.22 BAT International Finance plc, Reg. S
2.25% 16/01/2030 EUR 7,946,000 8,740,902 0.25 BAT Netherlands Finance BV, Reg. S
3.125% 07/04/2028 EUR 9,800,000 11,450,496 0.32 BP Capital Markets plc, Reg. S 0.831%
08/11/2027 EUR 10,900,000 11,409,346 0.32 BP Capital Markets plc, Reg. S 2.822%
07/04/2032 EUR 8,000,000 10,118,776 0.28 BP Capital Markets plc, Reg. S, FRN
3.25% Perpetual EUR 15,750,000 16,832,812 0.47 BP Capital Markets plc, Reg. S, FRN
3.625% Perpetual EUR 13,700,000 15,018,625 0.42 Centrica plc, Reg. S, FRN 3%
10/04/2076 EUR 17,903,000 18,028,590 0.51 Chanel Ceres plc, Reg. S 0.5%
31/07/2026 EUR 10,200,000 10,355,479 0.29 CK Hutchison Finance 16 II Ltd., Reg. S
0.875% 03/10/2024 EUR 8,005,000 8,238,530 0.23 CK Hutchison Finance 16 Ltd., Reg. S
1.25% 06/04/2023 EUR 4,023,000 4,134,538 0.12 CK Hutchison Group Telecom Finance SA,
Reg. S 0.375% 17/10/2023 EUR 4,900,000 4,948,574 0.14 CK Hutchison Group Telecom Finance SA,
Reg. S 1.5% 17/10/2031 EUR 8,100,000 8,723,465 0.25 DS Smith plc, Reg. S 2.25%
16/09/2022 EUR 11,700,000 12,095,612 0.34 Heathrow Funding Ltd., Reg. S 1.5%
12/10/2027 EUR 8,200,000 8,587,335 0.24 Heathrow Funding Ltd., Reg. S 1.5%
11/02/2030 EUR 5,813,000 6,147,242 0.17 HSBC Holdings plc, Reg. S 0.309%
13/11/2026 EUR 8,100,000 8,205,786 0.23 HSBC Holdings plc, Reg. S 3%
30/06/2025 EUR 16,897,000 18,937,515 0.53 HSBC Holdings plc, Reg. S, FRN 5.25%
Perpetual EUR 3,758,000 3,931,807 0.11 Imperial Brands Finance plc, Reg. S
1.125% 14/08/2023 EUR 9,500,000 9,750,895 0.27 Imperial Brands Finance plc, Reg. S
2.125% 12/02/2027 EUR 20,400,000 22,113,070 0.62 Informa plc, Reg. S 1.5% 05/07/2023 EUR 11,504,000 11,800,766 0.33 Lloyds Banking Group plc, Reg. S, FRN
0.625% 15/01/2024 EUR 36,300,000 36,719,991 1.03 Lloyds Banking Group plc, Reg. S, FRN
1.75% 07/09/2028 EUR 29,722,000 30,619,337 0.86 Lloyds Banking Group plc, Reg. S, FRN
4.5% 18/03/2030 EUR 2,504,000 2,870,270 0.08 Natwest Group plc, Reg. S 2.5%
22/03/2023 EUR 15,107,000 15,962,207 0.45 NGG Finance plc, Reg. S, FRN 1.625%
05/12/2079 EUR 15,700,000 15,994,375 0.45 Reckitt Benckiser Treasury Services
Nederland BV, Reg. S 0.375% 19/05/2026 EUR 5,000,000 5,141,935 0.14
Santander UK Group Holdings plc, Reg. S, FRN 0.391% 28/02/2025 EUR 16,600,000 16,747,059 0.47
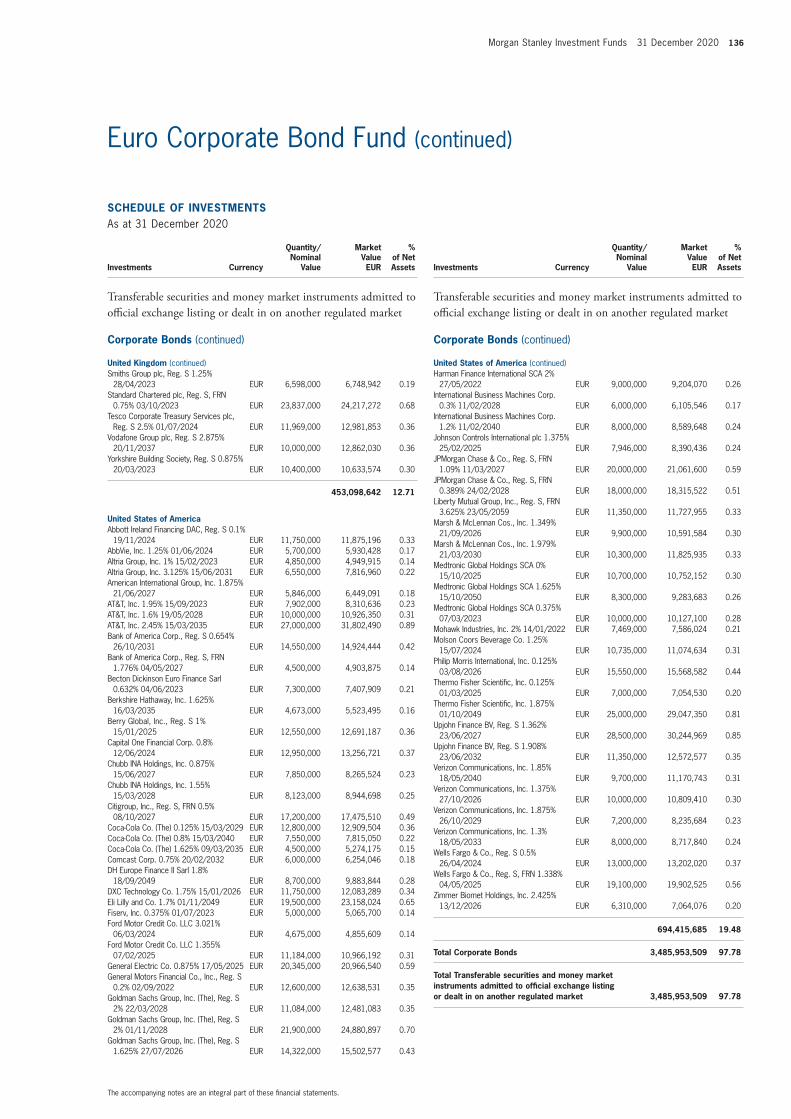
Morgan Stanley Investment Funds 31 December 2020 136
The accompanying notes are an integral part of these financial statements.
Euro Corporate Bond Fund (continued)
schEDUlE of InVEsTmEnTsAs at 31 December 2020
Investments Currency
Quantity/ Nominal
Value
Market Value EUR
% of Net Assets
Transferable securities and money market instruments admitted to official exchange listing or dealt in on another regulated market
corporate Bonds (continued)
United Kingdom (continued)Smiths Group plc, Reg. S 1.25%
28/04/2023 EUR 6,598,000 6,748,942 0.19 Standard Chartered plc, Reg. S, FRN
0.75% 03/10/2023 EUR 23,837,000 24,217,272 0.68 Tesco Corporate Treasury Services plc,
Reg. S 2.5% 01/07/2024 EUR 11,969,000 12,981,853 0.36 Vodafone Group plc, Reg. S 2.875%
20/11/2037 EUR 10,000,000 12,862,030 0.36 Yorkshire Building Society, Reg. S 0.875%
20/03/2023 EUR 10,400,000 10,633,574 0.30
453,098,642 12.71
United states of americaAbbott Ireland Financing DAC, Reg. S 0.1%
19/11/2024 EUR 11,750,000 11,875,196 0.33 AbbVie, Inc. 1.25% 01/06/2024 EUR 5,700,000 5,930,428 0.17 Altria Group, Inc. 1% 15/02/2023 EUR 4,850,000 4,949,915 0.14 Altria Group, Inc. 3.125% 15/06/2031 EUR 6,550,000 7,816,960 0.22 American International Group, Inc. 1.875%
21/06/2027 EUR 5,846,000 6,449,091 0.18 AT&T, Inc. 1.95% 15/09/2023 EUR 7,902,000 8,310,636 0.23 AT&T, Inc. 1.6% 19/05/2028 EUR 10,000,000 10,926,350 0.31 AT&T, Inc. 2.45% 15/03/2035 EUR 27,000,000 31,802,490 0.89 Bank of America Corp., Reg. S 0.654%
26/10/2031 EUR 14,550,000 14,924,444 0.42 Bank of America Corp., Reg. S, FRN
1.776% 04/05/2027 EUR 4,500,000 4,903,875 0.14 Becton Dickinson Euro Finance Sarl
0.632% 04/06/2023 EUR 7,300,000 7,407,909 0.21 Berkshire Hathaway, Inc. 1.625%
16/03/2035 EUR 4,673,000 5,523,495 0.16 Berry Global, Inc., Reg. S 1%
15/01/2025 EUR 12,550,000 12,691,187 0.36 Capital One Financial Corp. 0.8%
12/06/2024 EUR 12,950,000 13,256,721 0.37 Chubb INA Holdings, Inc. 0.875%
15/06/2027 EUR 7,850,000 8,265,524 0.23 Chubb INA Holdings, Inc. 1.55%
15/03/2028 EUR 8,123,000 8,944,698 0.25 Citigroup, Inc., Reg. S, FRN 0.5%
08/10/2027 EUR 17,200,000 17,475,510 0.49 Coca-Cola Co. (The) 0.125% 15/03/2029 EUR 12,800,000 12,909,504 0.36 Coca-Cola Co. (The) 0.8% 15/03/2040 EUR 7,550,000 7,815,050 0.22 Coca-Cola Co. (The) 1.625% 09/03/2035 EUR 4,500,000 5,274,175 0.15 Comcast Corp. 0.75% 20/02/2032 EUR 6,000,000 6,254,046 0.18 DH Europe Finance II Sarl 1.8%
18/09/2049 EUR 8,700,000 9,883,844 0.28 DXC Technology Co. 1.75% 15/01/2026 EUR 11,750,000 12,083,289 0.34 Eli Lilly and Co. 1.7% 01/11/2049 EUR 19,500,000 23,158,024 0.65 Fiserv, Inc. 0.375% 01/07/2023 EUR 5,000,000 5,065,700 0.14 Ford Motor Credit Co. LLC 3.021%
06/03/2024 EUR 4,675,000 4,855,609 0.14 Ford Motor Credit Co. LLC 1.355%
07/02/2025 EUR 11,184,000 10,966,192 0.31 General Electric Co. 0.875% 17/05/2025 EUR 20,345,000 20,966,540 0.59 General Motors Financial Co., Inc., Reg. S
0.2% 02/09/2022 EUR 12,600,000 12,638,531 0.35 Goldman Sachs Group, Inc. (The), Reg. S
2% 22/03/2028 EUR 11,084,000 12,481,083 0.35 Goldman Sachs Group, Inc. (The), Reg. S
2% 01/11/2028 EUR 21,900,000 24,880,897 0.70 Goldman Sachs Group, Inc. (The), Reg. S
1.625% 27/07/2026 EUR 14,322,000 15,502,577 0.43
schEDUlE of InVEsTmEnTsAs at 31 December 2020
Investments Currency
Quantity/ Nominal
Value
Market Value EUR
% of Net Assets
Transferable securities and money market instruments admitted to official exchange listing or dealt in on another regulated market
corporate Bonds (continued)
United states of america (continued)Harman Finance International SCA 2%
27/05/2022 EUR 9,000,000 9,204,070 0.26 International Business Machines Corp.
0.3% 11/02/2028 EUR 6,000,000 6,105,546 0.17 International Business Machines Corp.
1.2% 11/02/2040 EUR 8,000,000 8,589,648 0.24 Johnson Controls International plc 1.375%
25/02/2025 EUR 7,946,000 8,390,436 0.24 JPMorgan Chase & Co., Reg. S, FRN
1.09% 11/03/2027 EUR 20,000,000 21,061,600 0.59 JPMorgan Chase & Co., Reg. S, FRN
0.389% 24/02/2028 EUR 18,000,000 18,315,522 0.51 Liberty Mutual Group, Inc., Reg. S, FRN
3.625% 23/05/2059 EUR 11,350,000 11,727,955 0.33 Marsh & McLennan Cos., Inc. 1.349%
21/09/2026 EUR 9,900,000 10,591,584 0.30 Marsh & McLennan Cos., Inc. 1.979%
21/03/2030 EUR 10,300,000 11,825,935 0.33 Medtronic Global Holdings SCA 0%
15/10/2025 EUR 10,700,000 10,752,152 0.30 Medtronic Global Holdings SCA 1.625%
15/10/2050 EUR 8,300,000 9,283,683 0.26 Medtronic Global Holdings SCA 0.375%
07/03/2023 EUR 10,000,000 10,127,100 0.28 Mohawk Industries, Inc. 2% 14/01/2022 EUR 7,469,000 7,586,024 0.21 Molson Coors Beverage Co. 1.25%
15/07/2024 EUR 10,735,000 11,074,634 0.31 Philip Morris International, Inc. 0.125%
03/08/2026 EUR 15,550,000 15,568,582 0.44 Thermo Fisher Scientific, Inc. 0.125%
01/03/2025 EUR 7,000,000 7,054,530 0.20 Thermo Fisher Scientific, Inc. 1.875%
01/10/2049 EUR 25,000,000 29,047,350 0.81 Upjohn Finance BV, Reg. S 1.362%
23/06/2027 EUR 28,500,000 30,244,969 0.85 Upjohn Finance BV, Reg. S 1.908%
23/06/2032 EUR 11,350,000 12,572,577 0.35 Verizon Communications, Inc. 1.85%
18/05/2040 EUR 9,700,000 11,170,743 0.31 Verizon Communications, Inc. 1.375%
27/10/2026 EUR 10,000,000 10,809,410 0.30 Verizon Communications, Inc. 1.875%
26/10/2029 EUR 7,200,000 8,235,684 0.23 Verizon Communications, Inc. 1.3%
18/05/2033 EUR 8,000,000 8,717,840 0.24 Wells Fargo & Co., Reg. S 0.5%
26/04/2024 EUR 13,000,000 13,202,020 0.37 Wells Fargo & Co., Reg. S, FRN 1.338%
04/05/2025 EUR 19,100,000 19,902,525 0.56 Zimmer Biomet Holdings, Inc. 2.425%
13/12/2026 EUR 6,310,000 7,064,076 0.20
694,415,685 19.48
Total corporate Bonds 3,485,953,509 97.78
Total Transferable securities and money market instruments admitted to official exchange listing or dealt in on another regulated market 3,485,953,509 97.78

137 Morgan Stanley Investment Funds 31 December 2020
The accompanying notes are an integral part of these financial statements.
Euro Corporate Bond Fund (continued)
schEDUlE of InVEsTmEnTsAs at 31 December 2020
Investments Currency
Quantity/ Nominal
Value
Market Value EUR
% of Net Assets
Units of authorised UCITS or other collective investment undertakings
collective Investment schemes – UcITs
luxembourgMorgan Stanley Liquidity Funds Euro
Liquidity Fund – MS Reserve† EUR 14,482,137 14,482,137 0.40 Morgan Stanley Liquidity Funds US Dollar
Liquidity Fund – MS Reserve† USD 22,446,865 22,446,865 0.63
36,929,002 1.03
Total collective Investment schemes – UcITs 36,929,002 1.03
Total Units of authorised UcITs or other collective investment undertakings 36,929,002 1.03
Total Investments 3,522,882,511 98.81
cash 4,893,413 0.14
other assets/(liabilities) 37,358,770 1.05
Total net assets 3,565,134,694 100.00
† Managed by an affiliate of the Investment Adviser.The country disclosed within the Schedule of Investments refers to the country of risk. The country of incorporation may differ.
financial futures contracts
security Descriptionnumber
of contracts currency
Global Exposure
EUR
Unrealised Gain/(loss)
EUR
% of net assets
Euro-Bobl, 08/03/2021 (382) EUR (51,638,760) 42,020 0.00Euro-Bund, 08/03/2021 (465) EUR (82,602,600) 74,400 0.00US 10 Year Note, 22/03/2021 242 USD 27,218,936 6,164 0.00US 10 Year Ultra Bond, 22/03/2021 (414) USD (52,722,628) 350,605 0.01
Total Unrealised Gain on financial futures contracts 473,189 0.01
Euro-OAT, 08/03/2021 (1,138) EUR (191,024,680) (11,496) 0.00Euro-Schatz, 08/03/2021 1,830 EUR 205,463,250 (187,575) 0.00
Total Unrealised loss on financial futures contracts (199,071) 0.00
net Unrealised Gain on financial futures contracts 274,118 0.01
forward currency Exchange contracts
currency Purchased
amount Purchased
currency sold
amount sold
maturity Date counterparty
Unrealised Gain/(loss)
EUR
% of net assets
EUR 62,830,592 USD 74,751,000 15/01/2021 Westpac Banking 1,921,633 0.05
Unrealised Gain on forward currency Exchange contracts – assets 1,921,633 0.05
GBP hedged share classGBP 55,951,219 EUR 61,764,899 08/01/2021 J.P. Morgan 521,539 0.02
Unrealised Gain on naV hedged share classes forward currency Exchange contracts – assets 521,539 0.02
UsD hedged share classEUR 92,133 USD 112,818 08/01/2021 J.P. Morgan 189 0.00
Unrealised Gain on naV hedged share classes forward currency Exchange contracts – assets 189 0.00
Total Unrealised Gain on forward currency Exchange contracts – assets 2,443,361 0.07
USD 2,500,000 EUR 2,068,119 15/01/2021 J.P. Morgan (31,057) 0.00
Unrealised loss on forward currency Exchange contracts – liabilities (31,057) 0.00
chf hedged share classCHF 68,276 EUR 63,402 08/01/2021 J.P. Morgan (202) 0.00
GBP hedged share classEUR 226,940 GBP 205,131 05/01/2021 J.P. Morgan (1,429) 0.00
UsD hedged share classUSD 31,255,448 EUR 25,694,271 08/01/2021 J.P. Morgan (221,999) (0.01)
Unrealised loss on naV hedged share classes forward currency Exchange contracts – liabilities (223,630) (0.01)
Total Unrealised loss on forward currency Exchange contracts – liabilities (254,687) (0.01)
net Unrealised Gain on forward currency Exchange contracts – assets 2,188,674 0.06
DERIVaTIVEs
Over-the-counter (OTC) and exchange traded derivatives as at 31 December 2020, expressed in Euro.

Morgan Stanley Investment Funds 31 December 2020 138
The accompanying notes are an integral part of these financial statements.
Euro Corporate Bond Fund (continued)
Collateral received and paid by the Fund in respect of financial derivative instruments:
Type of collateral counterparty currency amount received amount paid
Euro corporate Bond fund
Cash Goldman Sachs EUR 4,002,904 –Westpac Banking EUR 1,853,583 –
5,856,487 –
DERIVaTIVEs (continued)

139 Morgan Stanley Investment Funds 31 December 2020
The accompanying notes are an integral part of these financial statements.
Please refer to the full prospectus for the Fund’s investment objective and policy.
schEDUlE of InVEsTmEnTsAs at 31 December 2020
Investments Currency
Quantity/ Nominal
Value
Market Value EUR
% of Net Assets
Transferable securities and money market instruments admitted to official exchange listing or dealt in on another regulated market
corporate Bonds
australiaAurizon Network Pty. Ltd., Reg. S 3.125%
01/06/2026 EUR 1,000,000 1,147,646 0.42 Ausgrid Finance Pty. Ltd., Reg. S 1.25%
30/07/2025 EUR 1,000,000 1,052,271 0.38 BHP Billiton Finance Ltd., Reg. S, FRN
5.625% 22/10/2079 EUR 1,700,000 1,987,584 0.73 Commonwealth Bank of Australia, Reg. S,
FRN 1.936% 03/10/2029 EUR 2,205,000 2,309,594 0.84 Glencore Finance Europe Ltd., Reg. S
1.75% 17/03/2025 EUR 1,939,000 2,047,642 0.75 Goodman Australia Finance Pty. Ltd., REIT,
Reg. S 1.375% 27/09/2025 EUR 450,000 475,466 0.17 Optus Finance Pty. Ltd., Reg. S 1%
20/06/2029 EUR 1,200,000 1,265,526 0.46 Origin Energy Finance Ltd., Reg. S 1%
17/09/2029 EUR 1,600,000 1,601,952 0.59 Santos Finance Ltd., Reg. S 4.125%
14/09/2027 USD 1,431,000 1,236,651 0.45 Sydney Airport Finance Co. Pty. Ltd.,
Reg. S 1.75% 26/04/2028 EUR 593,000 644,905 0.24 Transurban Finance Co. Pty. Ltd., Reg. S
1.75% 29/03/2028 EUR 300,000 332,574 0.12
14,101,811 5.15
austriaCA Immobilien Anlagen AG, Reg. S 1%
27/10/2025 EUR 400,000 407,554 0.15 CA Immobilien Anlagen AG, Reg. S
0.875% 05/02/2027 EUR 600,000 604,068 0.22 Erste Group Bank AG, Reg. S 0.05%
16/09/2025 EUR 700,000 704,313 0.26 UNIQA Insurance Group AG, Reg. S
1.375% 09/07/2030 EUR 600,000 654,987 0.24 UNIQA Insurance Group AG, Reg. S, FRN
6% 27/07/2046 EUR 400,000 491,756 0.18 Vienna Insurance Group AG Wiener
Versicherung Gruppe, Reg. S, FRN 5.5% 09/10/2043 EUR 1,700,000 1,942,250 0.71
4,804,928 1.76
BelgiumAnheuser-Busch InBev SA/NV, Reg. S
3.7% 02/04/2040 EUR 1,000,000 1,417,956 0.52 Anheuser-Busch InBev SA/NV, Reg. S
2.75% 17/03/2036 EUR 1,100,000 1,388,719 0.51 FLUVIUS System Operator CVBA, Reg. S
0.25% 02/12/2030 EUR 900,000 913,180 0.33 KBC Group NV, Reg. S 0.125%
10/09/2026 EUR 900,000 902,813 0.33 Solvay Finance SACA, Reg. S, FRN
5.425% Perpetual EUR 404,000 449,157 0.16
5,071,825 1.85
BrazilVale SA 3.75% 10/01/2023 EUR 1,616,000 1,725,418 0.63
1,725,418 0.63
InVEsTmEnT aIm
To provide an attractive rate of return, measured in Euro, while seeking to reduce the Fund’s exposure to market interest rate movements, primarily through investment in high quality issues of Euro denominated Fixed Income Securities issued by corporations and other non-government related issuers.
Euro Corporate Bond – Duration Hedged Fund

Morgan Stanley Investment Funds 31 December 2020 140
The accompanying notes are an integral part of these financial statements.
Euro Corporate Bond – Duration Hedged Fund (continued)
schEDUlE of InVEsTmEnTsAs at 31 December 2020
Investments Currency
Quantity/ Nominal
Value
Market Value EUR
% of Net Assets
Transferable securities and money market instruments admitted to official exchange listing or dealt in on another regulated market
corporate Bonds (continued)
chinaCGNPC International Ltd., Reg. S 1.625%
11/12/2024 EUR 2,135,000 2,230,285 0.81 China Merchants Bank Co. Ltd., Reg. S
0.25% 19/06/2022 EUR 1,500,000 1,494,900 0.55 CNAC HK Finbridge Co. Ltd., Reg. S
1.75% 14/06/2022 EUR 2,655,000 2,660,177 0.97 CNRC Capital Ltd., Reg. S 1.871%
07/12/2021 EUR 1,700,000 1,709,580 0.62 State Grid Europe Development 2014 plc,
Reg. S 2.45% 26/01/2027 EUR 1,985,000 2,180,522 0.80 State Grid Overseas Investment 2016 Ltd.,
Reg. S 0.797% 05/08/2026 EUR 500,000 507,969 0.19 Three Gorges Finance II Cayman Islands
Ltd., Reg. S 1.7% 10/06/2022 EUR 1,000,000 1,021,461 0.37
11,804,894 4.31
DenmarkDanske Bank A/S, Reg. S, FRN 1.375%
12/02/2030 EUR 750,000 762,611 0.28 Nykredit Realkredit A/S, Reg. S, FRN 4%
03/06/2036 EUR 1,350,000 1,372,132 0.50 STG Global Finance BV, Reg. S 1.375%
24/09/2025 EUR 700,000 713,713 0.26
2,848,456 1.04
finlandSampo OYJ, Reg. S 2.5% 03/09/2052 EUR 550,000 596,517 0.22 SATO OYJ, Reg. S 1.375% 31/05/2024 EUR 700,000 723,809 0.26
1,320,326 0.48
franceAeroports de Paris, Reg. S 1.5%
02/07/2032 EUR 900,000 1,004,317 0.37 Airbus SE, Reg. S 2.375% 07/04/2032 EUR 550,000 652,898 0.24 Airbus SE, Reg. S 2.375% 09/06/2040 EUR 400,000 478,146 0.17 AXA SA, Reg. S, FRN 3.25% 28/05/2049 EUR 1,150,000 1,347,608 0.49 AXA SA, Reg. S, FRN 3.941% Perpetual EUR 346,000 387,953 0.14 BNP Paribas Cardif SA, Reg. S, FRN
4.032% Perpetual EUR 2,300,000 2,614,813 0.96 BNP Paribas SA, Reg. S, FRN 1.125%
17/04/2029 EUR 800,000 845,466 0.31 BPCE SA, Reg. S 1.125% 18/01/2023 EUR 1,800,000 1,848,100 0.68 BPCE SA, Reg. S 0.5% 15/09/2027 EUR 700,000 711,432 0.26 BPCE SA, 144A 5.15% 21/07/2024 USD 1,500,000 1,392,197 0.51 Credit Agricole Assurances SA, Reg. S,
FRN 2.625% 29/01/2048 EUR 800,000 867,840 0.32 Credit Agricole Assurances SA, Reg. S,
FRN 4.5% Perpetual EUR 1,700,000 1,949,688 0.71 Credit Agricole SA, Reg. S 4%
31/12/2164 EUR 600,000 650,962 0.24 Engie SA, Reg. S, FRN 3.25% Perpetual EUR 400,000 439,595 0.16 Indigo Group SAS, Reg. S 1.625%
19/04/2028 EUR 1,200,000 1,242,689 0.45 Klepierre SA, REIT, Reg. S 2%
12/05/2029 EUR 700,000 784,647 0.29 Orange SA, Reg. S, FRN 5% Perpetual EUR 1,449,000 1,758,724 0.64 SEB SA, Reg. S 1.375% 16/06/2025 EUR 500,000 515,997 0.19 Societe Generale SA 1% 24/11/2030 EUR 500,000 501,776 0.18 Sogecap SA, Reg. S, FRN 4.125%
Perpetual EUR 1,400,000 1,568,000 0.57 TOTAL SE, Reg. S 2% Perpetual EUR 950,000 986,100 0.36
schEDUlE of InVEsTmEnTsAs at 31 December 2020
Investments Currency
Quantity/ Nominal
Value
Market Value EUR
% of Net Assets
Transferable securities and money market instruments admitted to official exchange listing or dealt in on another regulated market
corporate Bonds (continued)
france (continued)TOTAL SE, Reg. S, FRN 2.708% Perpetual EUR 1,850,000 1,939,494 0.71 TOTAL SE, Reg. S, FRN 3.369% Perpetual EUR 1,550,000 1,746,656 0.64 Unibail-Rodamco-Westfield SE, Reg. S
0.625% 04/05/2027 EUR 500,000 498,348 0.18 Unibail-Rodamco-Westfield SE, REIT, Reg. S
2.625% 09/04/2030 EUR 700,000 797,087 0.29
27,530,533 10.06
Germanyadidas AG, Reg. S 0% 09/09/2024 EUR 400,000 403,469 0.15 ADLER Group SA, Reg. S 1.5%
26/07/2024 EUR 1,600,000 1,575,920 0.58 Allianz Finance II BV, FRN 5.75%
08/07/2041 EUR 300,000 308,534 0.11 Allianz SE, Reg. S 5.625% 17/10/2042 EUR 1,200,000 1,319,225 0.48 Allianz SE, Reg. S, FRN 2.121%
08/07/2050 EUR 800,000 877,949 0.32 Allianz SE, Reg. S, FRN 3.375% Perpetual EUR 600,000 661,500 0.24 Bayer AG, Reg. S 0.375% 06/07/2024 EUR 600,000 608,612 0.22 Bayer AG, Reg. S 1.375% 06/07/2032 EUR 1,400,000 1,497,121 0.55 Bayer AG, Reg. S, FRN 3.125%
12/11/2079 EUR 300,000 315,757 0.12 Bayer Capital Corp. BV, Reg. S 1.5%
26/06/2026 EUR 600,000 642,646 0.23 BMW Finance NV, Reg. S 0.125%
13/07/2022 EUR 1,350,000 1,357,800 0.50 Clearstream Banking AG, Reg. S 0%
01/12/2025 EUR 300,000 302,181 0.11 Commerzbank AG, Reg. S, FRN 4%
05/12/2030 EUR 400,000 438,352 0.16 Daimler AG, Reg. S 1.125% 06/11/2031 EUR 1,625,000 1,725,927 0.63 Daimler International Finance BV, Reg. S
0.875% 09/04/2024 EUR 1,000,000 1,027,592 0.38 Grand City Properties SA, Reg. S, FRN
2.5% Perpetual EUR 600,000 619,500 0.23 Muenchener Rueckversicherungs-
Gesellschaft AG, Reg. S 1.25% 26/05/2041 EUR 400,000 416,128 0.15
Volkswagen International Finance NV, Reg. S 4.125% 16/11/2038 EUR 1,700,000 2,441,399 0.89
Volkswagen International Finance NV, Reg. S, FRN 3.875% Perpetual EUR 1,000,000 1,077,320 0.39
Volkswagen International Finance NV, Reg. S, FRN 4.625% Perpetual EUR 606,000 674,478 0.25
Wintershall Dea Finance BV, Reg. S 0.452% 25/09/2023 EUR 800,000 807,254 0.29
Wintershall Dea Finance BV, Reg. S 1.823% 25/09/2031 EUR 1,400,000 1,476,688 0.54
20,575,352 7.52
hong KongCheung Kong Infrastructure Finance BVI
Ltd., Reg. S 1% 12/12/2024 EUR 2,280,000 2,313,288 0.85
2,313,288 0.85
IcelandArion Banki HF, Reg. S 1% 20/03/2023 EUR 1,331,000 1,351,298 0.49 Landsbankinn HF, Reg. S 1% 30/05/2023 EUR 350,000 356,212 0.13
1,707,510 0.62
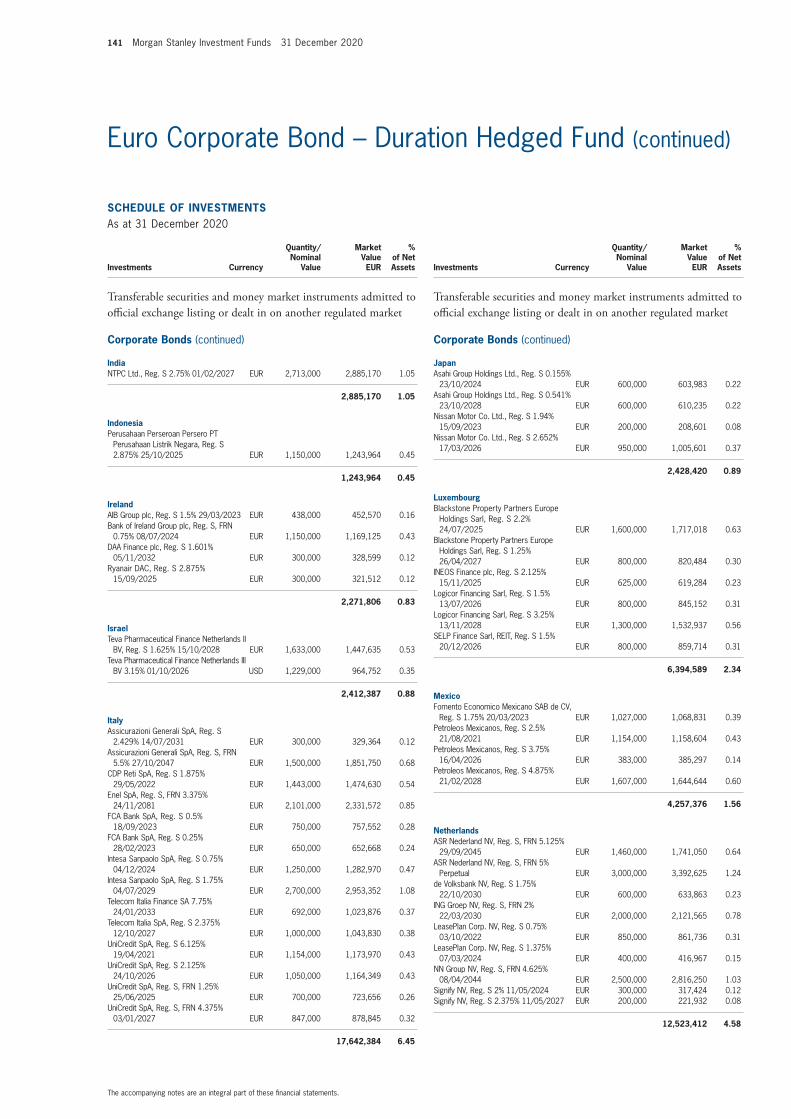
141 Morgan Stanley Investment Funds 31 December 2020
The accompanying notes are an integral part of these financial statements.
Euro Corporate Bond – Duration Hedged Fund (continued)
schEDUlE of InVEsTmEnTsAs at 31 December 2020
Investments Currency
Quantity/ Nominal
Value
Market Value EUR
% of Net Assets
Transferable securities and money market instruments admitted to official exchange listing or dealt in on another regulated market
corporate Bonds (continued)
JapanAsahi Group Holdings Ltd., Reg. S 0.155%
23/10/2024 EUR 600,000 603,983 0.22 Asahi Group Holdings Ltd., Reg. S 0.541%
23/10/2028 EUR 600,000 610,235 0.22 Nissan Motor Co. Ltd., Reg. S 1.94%
15/09/2023 EUR 200,000 208,601 0.08 Nissan Motor Co. Ltd., Reg. S 2.652%
17/03/2026 EUR 950,000 1,005,601 0.37
2,428,420 0.89
luxembourgBlackstone Property Partners Europe
Holdings Sarl, Reg. S 2.2% 24/07/2025 EUR 1,600,000 1,717,018 0.63
Blackstone Property Partners Europe Holdings Sarl, Reg. S 1.25% 26/04/2027 EUR 800,000 820,484 0.30
INEOS Finance plc, Reg. S 2.125% 15/11/2025 EUR 625,000 619,284 0.23
Logicor Financing Sarl, Reg. S 1.5% 13/07/2026 EUR 800,000 845,152 0.31
Logicor Financing Sarl, Reg. S 3.25% 13/11/2028 EUR 1,300,000 1,532,937 0.56
SELP Finance Sarl, REIT, Reg. S 1.5% 20/12/2026 EUR 800,000 859,714 0.31
6,394,589 2.34
mexicoFomento Economico Mexicano SAB de CV,
Reg. S 1.75% 20/03/2023 EUR 1,027,000 1,068,831 0.39 Petroleos Mexicanos, Reg. S 2.5%
21/08/2021 EUR 1,154,000 1,158,604 0.43 Petroleos Mexicanos, Reg. S 3.75%
16/04/2026 EUR 383,000 385,297 0.14 Petroleos Mexicanos, Reg. S 4.875%
21/02/2028 EUR 1,607,000 1,644,644 0.60
4,257,376 1.56
netherlandsASR Nederland NV, Reg. S, FRN 5.125%
29/09/2045 EUR 1,460,000 1,741,050 0.64 ASR Nederland NV, Reg. S, FRN 5%
Perpetual EUR 3,000,000 3,392,625 1.24 de Volksbank NV, Reg. S 1.75%
22/10/2030 EUR 600,000 633,863 0.23 ING Groep NV, Reg. S, FRN 2%
22/03/2030 EUR 2,000,000 2,121,565 0.78 LeasePlan Corp. NV, Reg. S 0.75%
03/10/2022 EUR 850,000 861,736 0.31 LeasePlan Corp. NV, Reg. S 1.375%
07/03/2024 EUR 400,000 416,967 0.15 NN Group NV, Reg. S, FRN 4.625%
08/04/2044 EUR 2,500,000 2,816,250 1.03 Signify NV, Reg. S 2% 11/05/2024 EUR 300,000 317,424 0.12 Signify NV, Reg. S 2.375% 11/05/2027 EUR 200,000 221,932 0.08
12,523,412 4.58
schEDUlE of InVEsTmEnTsAs at 31 December 2020
Investments Currency
Quantity/ Nominal
Value
Market Value EUR
% of Net Assets
Transferable securities and money market instruments admitted to official exchange listing or dealt in on another regulated market
corporate Bonds (continued)
IndiaNTPC Ltd., Reg. S 2.75% 01/02/2027 EUR 2,713,000 2,885,170 1.05
2,885,170 1.05
IndonesiaPerusahaan Perseroan Persero PT
Perusahaan Listrik Negara, Reg. S 2.875% 25/10/2025 EUR 1,150,000 1,243,964 0.45
1,243,964 0.45
IrelandAIB Group plc, Reg. S 1.5% 29/03/2023 EUR 438,000 452,570 0.16 Bank of Ireland Group plc, Reg. S, FRN
0.75% 08/07/2024 EUR 1,150,000 1,169,125 0.43 DAA Finance plc, Reg. S 1.601%
05/11/2032 EUR 300,000 328,599 0.12 Ryanair DAC, Reg. S 2.875%
15/09/2025 EUR 300,000 321,512 0.12
2,271,806 0.83
IsraelTeva Pharmaceutical Finance Netherlands II
BV, Reg. S 1.625% 15/10/2028 EUR 1,633,000 1,447,635 0.53 Teva Pharmaceutical Finance Netherlands III
BV 3.15% 01/10/2026 USD 1,229,000 964,752 0.35
2,412,387 0.88
ItalyAssicurazioni Generali SpA, Reg. S
2.429% 14/07/2031 EUR 300,000 329,364 0.12 Assicurazioni Generali SpA, Reg. S, FRN
5.5% 27/10/2047 EUR 1,500,000 1,851,750 0.68 CDP Reti SpA, Reg. S 1.875%
29/05/2022 EUR 1,443,000 1,474,630 0.54 Enel SpA, Reg. S, FRN 3.375%
24/11/2081 EUR 2,101,000 2,331,572 0.85 FCA Bank SpA, Reg. S 0.5%
18/09/2023 EUR 750,000 757,552 0.28 FCA Bank SpA, Reg. S 0.25%
28/02/2023 EUR 650,000 652,668 0.24 Intesa Sanpaolo SpA, Reg. S 0.75%
04/12/2024 EUR 1,250,000 1,282,970 0.47 Intesa Sanpaolo SpA, Reg. S 1.75%
04/07/2029 EUR 2,700,000 2,953,352 1.08 Telecom Italia Finance SA 7.75%
24/01/2033 EUR 692,000 1,023,876 0.37 Telecom Italia SpA, Reg. S 2.375%
12/10/2027 EUR 1,000,000 1,043,830 0.38 UniCredit SpA, Reg. S 6.125%
19/04/2021 EUR 1,154,000 1,173,970 0.43 UniCredit SpA, Reg. S 2.125%
24/10/2026 EUR 1,050,000 1,164,349 0.43 UniCredit SpA, Reg. S, FRN 1.25%
25/06/2025 EUR 700,000 723,656 0.26 UniCredit SpA, Reg. S, FRN 4.375%
03/01/2027 EUR 847,000 878,845 0.32
17,642,384 6.45

Morgan Stanley Investment Funds 31 December 2020 142
The accompanying notes are an integral part of these financial statements.
Euro Corporate Bond – Duration Hedged Fund (continued)
schEDUlE of InVEsTmEnTsAs at 31 December 2020
Investments Currency
Quantity/ Nominal
Value
Market Value EUR
% of Net Assets
Transferable securities and money market instruments admitted to official exchange listing or dealt in on another regulated market
corporate Bonds (continued)
singaporeDBS Group Holdings Ltd., Reg. S, FRN
1.5% 11/04/2028 EUR 2,740,000 2,798,351 1.02
2,798,351 1.02
spainAbertis Infraestructuras SA, Reg. S
2.375% 27/09/2027 EUR 500,000 554,381 0.20 Amadeus IT Group SA, Reg. S 1.875%
24/09/2028 EUR 600,000 641,006 0.23 Banco Bilbao Vizcaya Argentaria SA,
Reg. S 0.75% 04/06/2025 EUR 500,000 519,533 0.19 Banco Bilbao Vizcaya Argentaria SA,
Reg. S, FRN 1% 16/01/2030 EUR 1,300,000 1,300,358 0.48 Banco Santander SA, Reg. S 3.125%
19/01/2027 EUR 2,000,000 2,287,414 0.84 Bankia SA, Reg. S 0.75% 09/07/2026 EUR 1,000,000 1,031,617 0.38 CaixaBank SA, Reg. S, FRN 2.25%
17/04/2030 EUR 3,500,000 3,666,224 1.34 Cellnex Telecom SA 1.875% 26/06/2029 EUR 800,000 823,430 0.30 Iberdrola International BV, Reg. S, FRN
1.875% Perpetual EUR 1,700,000 1,747,813 0.64 IE2 Holdco SAU, Reg. S 2.875%
01/06/2026 EUR 1,200,000 1,365,617 0.50 Inmobiliaria Colonial Socimi SA, Reg. S
1.35% 14/10/2028 EUR 700,000 724,407 0.26 Inmobiliaria Colonial Socimi SA, REIT,
Reg. S 1.45% 28/10/2024 EUR 1,100,000 1,149,094 0.42 Inmobiliaria Colonial Socimi SA, REIT,
Reg. S 2% 17/04/2026 EUR 1,300,000 1,400,943 0.51 Madrilena Red de Gas Finance BV, Reg. S
2.25% 11/04/2029 EUR 1,000,000 1,091,020 0.40 NorteGa¬s Energia Distribucion SA, Reg. S
2.065% 28/09/2027 EUR 338,000 369,646 0.13
Prosegur Cia de Seguridad SA, Reg. S 1% 08/02/2023 EUR 1,100,000 1,120,044 0.41
Redexis Gas Finance BV, Reg. S 1.875% 28/05/2025 EUR 300,000 319,875 0.12
Redexis Gas Finance BV, Reg. S 1.875% 27/04/2027 EUR 2,000,000 2,177,848 0.80
Telefonica Europe BV, Reg. S, FRN 5.875% Perpetual EUR 400,000 450,710 0.16
22,740,980 8.31
swedenAkelius Residential Property Financing BV,
Reg. S 1% 17/01/2028 EUR 300,000 309,621 0.11 Akelius Residential Property Financing BV,
Reg. S 1.125% 11/01/2029 EUR 450,000 465,856 0.17 Scania CV AB, Reg. S 0% 23/11/2022 EUR 1,350,000 1,351,048 0.50
2,126,525 0.78
switzerlandLonza Finance International NV, Reg. S
1.625% 21/04/2027 EUR 650,000 712,637 0.26 Novartis Finance SA, Reg. S 0%
23/09/2028 EUR 1,750,000 1,761,160 0.64 SIX Finance Luxembourg SA, Reg. S 0%
02/12/2025 EUR 900,000 900,446 0.33 Syngenta Finance NV, Reg. S 3.375%
16/04/2026 EUR 1,100,000 1,190,017 0.44
schEDUlE of InVEsTmEnTsAs at 31 December 2020
Investments Currency
Quantity/ Nominal
Value
Market Value EUR
% of Net Assets
Transferable securities and money market instruments admitted to official exchange listing or dealt in on another regulated market
corporate Bonds (continued)
switzerland (continued)Syngenta Finance NV, 144A 5.182%
24/04/2028 USD 1,708,000 1,493,285 0.55 UBS AG, Reg. S 5.125% 15/05/2024 USD 750,000 675,461 0.25 Zurich Insurance Co. Ltd., Reg. S, FRN
4.25% 02/10/2043 EUR 346,000 384,157 0.14
7,117,163 2.61
United arab EmiratesDP World plc, Reg. S 2.375%
25/09/2026 EUR 2,700,000 2,829,357 1.03
2,829,357 1.03
United KingdomAnnington Funding plc, Reg. S 1.65%
12/07/2024 EUR 700,000 735,262 0.27 Aviva plc, Reg. S, FRN 3.875%
03/07/2044 EUR 992,000 1,104,281 0.40 BAT International Finance plc, Reg. S
2.25% 16/01/2030 EUR 1,154,000 1,269,444 0.46 BAT Netherlands Finance BV, Reg. S
3.125% 07/04/2028 EUR 750,000 876,313 0.32 BP Capital Markets plc, Reg. S 0.831%
08/11/2027 EUR 1,000,000 1,046,729 0.38 BP Capital Markets plc, Reg. S 2.822%
07/04/2032 EUR 1,050,000 1,328,089 0.49 BP Capital Markets plc, Reg. S, FRN
3.25% Perpetual EUR 1,050,000 1,122,187 0.41 BP Capital Markets plc, Reg. S, FRN
3.625% Perpetual EUR 900,000 986,625 0.36 Centrica plc, Reg. S, FRN 3% 10/04/2076 EUR 1,000,000 1,007,015 0.37 Chanel Ceres plc, Reg. S 0.5%
31/07/2026 EUR 650,000 659,908 0.24 CK Hutchison Group Telecom Finance SA,
Reg. S 0.375% 17/10/2023 EUR 1,100,000 1,110,904 0.41 CK Hutchison Group Telecom Finance SA,
Reg. S 1.5% 17/10/2031 EUR 800,000 861,577 0.32 CNH Industrial Finance Europe SA, Reg. S
0% 01/04/2024 EUR 500,000 499,637 0.18 Heathrow Funding Ltd., Reg. S 1.5%
11/02/2030 EUR 1,400,000 1,480,499 0.54 HSBC Holdings plc, Reg. S 3%
30/06/2025 EUR 1,300,000 1,456,991 0.53 HSBC Holdings plc, Reg. S 0.309%
13/11/2026 EUR 500,000 506,530 0.19 HSBC Holdings plc, Reg. S 0.77%
13/11/2031 EUR 350,000 362,864 0.13 HSBC Holdings plc, Reg. S, FRN 5.25%
Perpetual EUR 542,000 567,068 0.21 Imperial Brands Finance plc, Reg. S
2.125% 12/02/2027 EUR 2,250,000 2,438,941 0.89 Lloyds Banking Group plc, Reg. S, FRN
0.625% 15/01/2024 EUR 1,700,000 1,719,669 0.63 Lloyds Banking Group plc, Reg. S, FRN
1.75% 07/09/2028 EUR 2,000,000 2,060,382 0.75 Lloyds Banking Group plc, Reg. S, FRN
4.5% 18/03/2030 EUR 326,000 373,685 0.14 Natwest Group plc, Reg. S 2.5%
22/03/2023 EUR 1,193,000 1,260,536 0.46 NGG Finance plc, Reg. S, FRN 1.625%
05/12/2079 EUR 1,500,000 1,528,125 0.56 Santander UK Group Holdings plc, Reg. S,
FRN 0.391% 28/02/2025 EUR 1,450,000 1,462,846 0.53

143 Morgan Stanley Investment Funds 31 December 2020
The accompanying notes are an integral part of these financial statements.
Euro Corporate Bond – Duration Hedged Fund (continued)
schEDUlE of InVEsTmEnTsAs at 31 December 2020
Investments Currency
Quantity/ Nominal
Value
Market Value EUR
% of Net Assets
Transferable securities and money market instruments admitted to official exchange listing or dealt in on another regulated market
corporate Bonds (continued)
United Kingdom (continued)Smiths Group plc, Reg. S 1.25%
28/04/2023 EUR 952,000 973,779 0.36 Vodafone Group plc, Reg. S 2.875%
20/11/2037 EUR 1,050,000 1,350,513 0.49 Yorkshire Building Society, Reg. S 0.875%
20/03/2023 EUR 1,708,000 1,746,360 0.64
31,896,759 11.66
United states of americaAltria Group, Inc. 3.125% 15/06/2031 EUR 700,000 835,400 0.31 American International Group, Inc.
1.875% 21/06/2027 EUR 700,000 772,214 0.28 AT&T, Inc. 1.6% 19/05/2028 EUR 900,000 983,372 0.36 AT&T, Inc. 2.45% 15/03/2035 EUR 2,000,000 2,355,740 0.86 Bank of America Corp., Reg. S 0.654%
26/10/2031 EUR 1,250,000 1,282,169 0.47 Bank of America Corp., Reg. S, FRN
3.648% 31/03/2029 EUR 900,000 1,120,163 0.41 Baxter International, Inc. 0.4%
15/05/2024 EUR 600,000 611,162 0.22 Berry Global, Inc., Reg. S 1%
15/01/2025 EUR 850,000 859,563 0.31 Chubb INA Holdings, Inc. 1.55%
15/03/2028 EUR 1,000,000 1,101,157 0.40 Citigroup, Inc., Reg. S, FRN 1.25%
06/07/2026 EUR 1,650,000 1,738,943 0.64 Coca-Cola Co. (The) 0.125% 15/03/2029 EUR 850,000 857,272 0.31 Coca-Cola Co. (The) 0.8% 15/03/2040 EUR 850,000 879,840 0.32 Comcast Corp. 0.75% 20/02/2032 EUR 950,000 990,224 0.36 DH Europe Finance II Sarl 1.8%
18/09/2049 EUR 800,000 908,859 0.33 DXC Technology Co. 1.75% 15/01/2026 EUR 1,000,000 1,028,365 0.38 Eli Lilly and Co. 1.7% 01/11/2049 EUR 1,000,000 1,187,591 0.43 Ford Motor Credit Co. LLC 1.355%
07/02/2025 EUR 1,616,000 1,584,528 0.58 General Electric Co. 0.875% 17/05/2025 EUR 1,600,000 1,648,880 0.60 General Motors Financial Co., Inc., Reg. S
0.2% 02/09/2022 EUR 1,200,000 1,203,670 0.44 Goldman Sachs Group, Inc. (The), Reg. S
2% 01/11/2028 EUR 1,800,000 2,045,005 0.75 International Business Machines Corp.
1.2% 11/02/2040 EUR 500,000 536,853 0.20 Johnson Controls International plc 1.375%
25/02/2025 EUR 1,100,000 1,161,525 0.43 JPMorgan Chase & Co., Reg. S, FRN
1.09% 11/03/2027 EUR 1,500,000 1,579,620 0.58 Marsh & McLennan Cos., Inc. 1.349%
21/09/2026 EUR 1,000,000 1,069,857 0.39 Medtronic Global Holdings SCA 0%
15/10/2025 EUR 700,000 703,412 0.26 Medtronic Global Holdings SCA 1.625%
15/10/2050 EUR 500,000 559,258 0.20 Molson Coors Beverage Co. 1.25%
15/07/2024 EUR 1,400,000 1,444,293 0.53 Philip Morris International, Inc. 0.125%
03/08/2026 EUR 1,150,000 1,151,374 0.42 Schlumberger Finance BV, Reg. S 1.375%
28/10/2026 EUR 1,050,000 1,132,356 0.41 Thermo Fisher Scientific, Inc. 1.875%
01/10/2049 EUR 1,800,000 2,091,409 0.76 Upjohn Finance BV, Reg. S 1.362%
23/06/2027 EUR 1,900,000 2,016,331 0.74
schEDUlE of InVEsTmEnTsAs at 31 December 2020
Investments Currency
Quantity/ Nominal
Value
Market Value EUR
% of Net Assets
Transferable securities and money market instruments admitted to official exchange listing or dealt in on another regulated market
corporate Bonds (continued)
United states of america (continued)Upjohn Finance BV, Reg. S 1.908%
23/06/2032 EUR 750,000 830,787 0.30 Verizon Communications, Inc. 1.85%
18/05/2040 EUR 800,000 921,298 0.34 Verizon Communications, Inc. 1.875%
26/10/2029 EUR 1,100,000 1,258,230 0.46 Verizon Communications, Inc. 1.3%
18/05/2033 EUR 500,000 544,865 0.20 Wells Fargo & Co., Reg. S, FRN 1.338%
04/05/2025 EUR 1,100,000 1,146,219 0.42
42,141,804 15.40
Total corporate Bonds 257,514,788 94.11
Total Transferable securities and money market instruments admitted to official exchange listing or dealt in on another regulated market 257,514,788 94.11
Units of authorised UCITS or other collective investment undertakings
collective Investment schemes – UcITs
luxembourgMorgan Stanley Liquidity Funds Euro
Liquidity Fund – MS Reserve† EUR 6,942,503 6,942,503 2.54
6,942,503 2.54
Total collective Investment schemes – UcITs 6,942,503 2.54
Total Units of authorised UcITs or other collective investment undertakings 6,942,503 2.54
Total Investments 264,457,291 96.65
cash 5,501,235 2.01
other assets/(liabilities) 3,677,291 1.34
Total net assets 273,635,817 100.00
† Managed by an affiliate of the Investment Adviser.The country disclosed within the Schedule of Investments refers to the country of risk. The country of incorporation may differ.

Morgan Stanley Investment Funds 31 December 2020 144
The accompanying notes are an integral part of these financial statements.
Euro Corporate Bond – Duration Hedged Fund (continued)
financial futures contracts
security Descriptionnumber
of contracts currency
Global Exposure
EUR
Unrealised Gain/(loss)
EUR
% of net assets
Euro-Bobl, 08/03/2021 (871) EUR (117,741,780) 95,810 0.03Euro-Bund, 08/03/2021 (473) EUR (84,023,720) 75,680 0.03 Euro-Schatz, 08/03/2021 (235) EUR (26,384,625) 24,675 0.01
Total Unrealised Gain on financial futures contracts 196,165 0.07
US 2 Year Note, 31/03/2021 (14) USD (2,521,364) (2,288) 0.00US 5 Year Note, 31/03/2021 (51) USD (5,243,265) (10,721) (0.01) US 10 Year Note, 22/03/2021 (18) USD (2,024,549) (539) 0.00US 10 Year Ultra Bond, 22/03/2021 12 USD 1,528,192 (5,744) 0.00
Total Unrealised loss on financial futures contracts (19,292) (0.01)
net Unrealised Gain on financial futures contracts 176,873 0.06
forward currency Exchange contracts
currency Purchased
amount Purchased
currency sold
amount sold
maturity Date counterparty
Unrealised Gain/(loss)
EUR
% of net assets
EUR 7,459,720 USD 8,875,000 15/01/2021 Westpac Banking 228,151 0.08
Unrealised Gain on forward currency Exchange contracts – assets 228,151 0.08
Total Unrealised Gain on forward currency Exchange contracts – assets 228,151 0.08
net Unrealised Gain on forward currency Exchange contracts – assets 228,151 0.08
Collateral received and paid by the Fund in respect of financial derivative instruments:
Type of collateral counterparty currency amount received amount paid
Euro corporate Bond – Duration hedged fund
Cash Goldman Sachs EUR 2,211,732 –
2,211,732 –
DERIVaTIVEs
Over-the-counter (OTC) and exchange traded derivatives as at 31 December 2020, expressed in Euro.

145 Morgan Stanley Investment Funds 31 December 2020
The accompanying notes are an integral part of these financial statements.
Please refer to the full prospectus for the Fund’s investment objective and policy.
InVEsTmEnT aIm
To provide an attractive rate of return, measured in Euro, primarily through investment in issues of Euro denominated Fixed Income Securities whether issued by corporations, government or government guaranteed issuers, and subject to applicable law, in asset-backed securities, loan participations and loan assignments, to the extent that these instruments are securitised.
schEDUlE of InVEsTmEnTsAs at 31 December 2020
Investments Currency
Quantity/ Nominal
Value
Market Value EUR
% of Net Assets
Transferable securities and money market instruments admitted to official exchange listing or dealt in on another regulated market
convertible Bonds
chinaGeely Sweden Financials Holding AB,
Reg. S 0% 19/06/2024 EUR 2,200,000 2,636,645 0.14
2,636,645 0.14
ItalyEni SpA, Reg. S 0% 13/04/2022 EUR 2,300,000 2,299,586 0.12 Nexi SpA, Reg. S 1.75% 24/04/2027 EUR 3,800,000 4,698,757 0.25
6,998,343 0.37
spainCellnex Telecom SA, Reg. S 0.75%
20/11/2031 EUR 3,600,000 3,483,938 0.19
3,483,938 0.19
Total convertible Bonds 13,118,926 0.70
corporate Bonds
australiaAPT Pipelines Ltd., Reg. S 1.375%
22/03/2022 EUR 2,100,000 2,139,207 0.12 Aurizon Network Pty. Ltd., Reg. S 2%
18/09/2024 EUR 1,100,000 1,179,585 0.06 Aurizon Network Pty. Ltd., Reg. S 3.125%
01/06/2026 EUR 2,050,000 2,352,674 0.13 AusNet Services Holdings Pty. Ltd., Reg. S
0.625% 25/08/2030 EUR 1,850,000 1,923,264 0.10 BHP Billiton Finance Ltd., Reg. S, FRN
5.625% 22/10/2079 EUR 3,500,000 4,092,085 0.22 Commonwealth Bank of Australia, Reg. S
0.375% 11/04/2024 EUR 4,855,000 4,981,021 0.27 Commonwealth Bank of Australia, Reg. S,
FRN 2% 22/04/2027 EUR 1,700,000 1,737,629 0.09 Commonwealth Bank of Australia, Reg. S,
FRN 1.936% 03/10/2029 EUR 2,500,000 2,618,588 0.14 Glencore Finance Europe Ltd., Reg. S
1.75% 17/03/2025 EUR 1,400,000 1,478,442 0.08 Goodman Australia Finance Pty. Ltd., REIT,
Reg. S 1.375% 27/09/2025 EUR 625,000 660,369 0.04 Optus Finance Pty. Ltd., Reg. S 1%
20/06/2029 EUR 3,150,000 3,322,006 0.18 Origin Energy Finance Ltd., Reg. S 1%
17/09/2029 EUR 3,500,000 3,504,270 0.19 Scentre Group Trust 1, REIT, Reg. S
1.45% 28/03/2029 EUR 900,000 957,195 0.05 SGSP Australia Assets Pty. Ltd., Reg. S
2% 30/06/2022 EUR 2,750,000 2,823,810 0.15 Sydney Airport Finance Co. Pty. Ltd.,
Reg. S 1.75% 26/04/2028 EUR 1,000,000 1,087,529 0.06 Toyota Finance Australia Ltd., Reg. S
2.28% 21/10/2027 EUR 450,000 520,002 0.03 Transurban Finance Co. Pty. Ltd., Reg. S
1.75% 29/03/2028 EUR 200,000 221,716 0.01 Westpac Banking Corp., Reg. S 0.375%
02/04/2026 EUR 5,600,000 5,810,521 0.31
41,409,913 2.23
Euro Strategic Bond Fund

Morgan Stanley Investment Funds 31 December 2020 146
The accompanying notes are an integral part of these financial statements.
Euro Strategic Bond Fund (continued)
schEDUlE of InVEsTmEnTsAs at 31 December 2020
Investments Currency
Quantity/ Nominal
Value
Market Value EUR
% of Net Assets
Transferable securities and money market instruments admitted to official exchange listing or dealt in on another regulated market
corporate Bonds (continued)
austriaCA Immobilien Anlagen AG, Reg. S 1%
27/10/2025 EUR 700,000 713,220 0.04 Erste Group Bank AG, Reg. S 0.05%
16/09/2025 EUR 1,300,000 1,308,009 0.07 Erste Group Bank AG, Reg. S 4.25%
Perpetual EUR 3,000,000 3,112,311 0.17 Erste Group Bank AG, Reg. S, FRN 6.5%
Perpetual EUR 2,400,000 2,686,502 0.14 UNIQA Insurance Group AG, Reg. S
1.375% 09/07/2030 EUR 1,100,000 1,200,810 0.06 UNIQA Insurance Group AG, Reg. S, FRN
6% 27/07/2046 EUR 400,000 491,756 0.03
9,512,608 0.51
BelgiumAnheuser-Busch InBev SA/NV, Reg. S
3.7% 02/04/2040 EUR 4,100,000 5,813,620 0.31 Belfius Bank SA, Reg. S 0.625%
30/08/2023 EUR 2,000,000 2,044,062 0.11 Euroclear Investments SA, Reg. S, FRN
2.625% 11/04/2048 EUR 1,500,000 1,677,750 0.09 FLUVIUS System Operator CVBA, Reg. S
0.25% 02/12/2030 EUR 1,700,000 1,724,896 0.09 Fluxys Belgium SA, Reg. S 1.75%
05/10/2027 EUR 1,000,000 1,042,520 0.06 Solvay Finance SACA, Reg. S, FRN
5.425% Perpetual EUR 300,000 333,533 0.02
12,636,381 0.68
BrazilPetrobras Global Finance BV 6.75%
03/06/2050 USD 1,270,000 1,287,400 0.07 Vale SA 3.75% 10/01/2023 EUR 2,000,000 2,135,418 0.11
3,422,818 0.18
canadaCanadian Imperial Bank of Commerce,
Reg. S 0.75% 22/03/2023 EUR 3,500,000 3,580,304 0.19 Canadian Imperial Bank of Commerce,
Reg. S 0.04% 09/07/2027 EUR 3,850,000 3,938,885 0.21 CPPIB Capital, Inc., Reg. S 0.25%
06/04/2027 EUR 5,900,000 6,096,263 0.33 CPPIB Capital, Inc., Reg. S 0.75%
15/07/2049 EUR 5,000,000 5,567,249 0.30
19,182,701 1.03
chinaBank of China Ltd., Reg. S 0%
16/10/2021 EUR 2,900,000 2,899,739 0.16 Bank of China Ltd., Reg. S 0.75%
12/07/2021 EUR 1,700,000 1,707,752 0.09 CGNPC International Ltd., Reg. S 1.625%
11/12/2024 EUR 1,700,000 1,775,871 0.09 China Development Bank, Reg. S 0.375%
16/11/2021 EUR 1,600,000 1,606,800 0.09 China Merchants Bank Co. Ltd., Reg. S
0.25% 19/06/2022 EUR 2,700,000 2,690,820 0.14 CNAC HK Finbridge Co. Ltd., Reg. S
1.75% 14/06/2022 EUR 2,950,000 2,955,753 0.16
schEDUlE of InVEsTmEnTsAs at 31 December 2020
Investments Currency
Quantity/ Nominal
Value
Market Value EUR
% of Net Assets
Transferable securities and money market instruments admitted to official exchange listing or dealt in on another regulated market
corporate Bonds (continued)
china (continued)CNRC Capital Ltd., Reg. S 1.871%
07/12/2021 EUR 1,400,000 1,407,889 0.07 Export-Import Bank of China (The), Reg. S
0.625% 02/12/2021 EUR 2,550,000 2,565,241 0.14 Sinopec Group Overseas Development
2015 Ltd., Reg. S 1% 28/04/2022 EUR 1,400,000 1,417,307 0.08 State Grid Europe Development 2014 plc,
Reg. S 1.5% 26/01/2022 EUR 850,000 863,145 0.05 State Grid Europe Development 2014 plc,
Reg. S 2.45% 26/01/2027 EUR 1,200,000 1,318,200 0.07 State Grid Overseas Investment 2016 Ltd.,
Reg. S 0.797% 05/08/2026 EUR 2,000,000 2,031,875 0.11 Three Gorges Finance II Cayman Islands
Ltd., Reg. S 1.7% 10/06/2022 EUR 2,250,000 2,298,287 0.12
25,538,679 1.37
colombiaEcopetrol SA 5.875% 18/09/2023 USD 1,175,000 1,070,442 0.06
1,070,442 0.06
DenmarkCarlsberg Breweries A/S, Reg. S 0.375%
30/06/2027 EUR 1,100,000 1,118,348 0.06 Danske Bank A/S, Reg. S, FRN 1.375%
12/02/2030 EUR 3,100,000 3,152,126 0.17 Nykredit Realkredit A/S, Reg. S 4.125%
31/12/2164 EUR 3,000,000 3,169,875 0.17 Nykredit Realkredit A/S, Reg. S, FRN 4%
03/06/2036 EUR 800,000 813,115 0.05 STG Global Finance BV, Reg. S 1.375%
24/09/2025 EUR 1,150,000 1,172,529 0.06
9,425,993 0.51
finlandKojamo OYJ, Reg. S 1.625% 07/03/2025 EUR 900,000 948,219 0.05 Kojamo OYJ, Reg. S 1.875% 27/05/2027 EUR 900,000 973,536 0.05 Sampo OYJ, Reg. S 2.5% 03/09/2052 EUR 1,000,000 1,084,576 0.06 SATO OYJ, Reg. S 1.375% 31/05/2024 EUR 1,100,000 1,137,415 0.06 Transmission Finance DAC, Reg. S 1.5%
24/05/2023 EUR 1,000,000 1,035,167 0.06
5,178,913 0.28
franceAeroports de Paris, Reg. S 1.5%
02/07/2032 EUR 800,000 892,726 0.05 Aeroports de Paris, Reg. S 2.75%
02/04/2030 EUR 3,300,000 4,015,948 0.22 Agence Francaise de Developpement EPIC,
Reg. S 0% 25/03/2025 EUR 2,600,000 2,646,972 0.14 Agence Francaise de Developpement EPIC,
Reg. S 0.5% 31/05/2035 EUR 9,400,000 9,919,801 0.53 Airbus SE, Reg. S 2.375% 09/06/2040 EUR 850,000 1,016,060 0.05 Airbus SE, Reg. S 2.375% 07/04/2032 EUR 800,000 949,888 0.05 AXA Home Loan SFH SA, Reg. S 0.05%
05/07/2027 EUR 5,200,000 5,343,629 0.29 AXA SA, Reg. S, FRN 3.25%
28/05/2049 EUR 4,600,000 5,390,432 0.29 AXA SA, Reg. S, FRN 5.125%
04/07/2043 EUR 1,000,000 1,122,414 0.06

147 Morgan Stanley Investment Funds 31 December 2020
The accompanying notes are an integral part of these financial statements.
Euro Strategic Bond Fund (continued)
schEDUlE of InVEsTmEnTsAs at 31 December 2020
Investments Currency
Quantity/ Nominal
Value
Market Value EUR
% of Net Assets
Transferable securities and money market instruments admitted to official exchange listing or dealt in on another regulated market
corporate Bonds (continued)
france (continued)Banque Federative du Credit Mutuel SA,
Reg. S 0.75% 15/06/2023 EUR 2,500,000 2,564,748 0.14 BEL SA, Reg. S 1.5% 18/04/2024 EUR 800,000 828,806 0.04 BNP Paribas Cardif SA, Reg. S 1%
29/11/2024 EUR 2,100,000 2,157,101 0.12 BNP Paribas Cardif SA, Reg. S, FRN
4.032% Perpetual EUR 3,000,000 3,410,625 0.18 BNP Paribas SA, Reg. S, FRN 0.5%
04/06/2026 EUR 2,000,000 2,038,448 0.11 BNP Paribas SA, Reg. S, FRN 2.125%
23/01/2027 EUR 800,000 877,828 0.05 BNP Paribas SA, Reg. S, FRN 1.125%
17/04/2029 EUR 1,300,000 1,373,883 0.07 BNP Paribas SA, Reg. S 2.375%
17/02/2025 EUR 3,900,000 4,202,597 0.23 BPCE SA, Reg. S 0.25% 15/01/2026 EUR 2,500,000 2,539,175 0.14 BPCE SA, Reg. S, FRN 2.75%
08/07/2026 EUR 2,500,000 2,535,400 0.14 Bureau Veritas SA, Reg. S 1.875%
06/01/2025 EUR 1,000,000 1,064,117 0.06 Bureau Veritas SA, Reg. S 1.25%
07/09/2023 EUR 700,000 720,804 0.04 Credit Agricole Assurances SA, Reg. S,
FRN 4.25% Perpetual EUR 1,200,000 1,347,300 0.07 Credit Agricole Assurances SA, Reg. S,
FRN 4.5% Perpetual EUR 3,500,000 4,014,063 0.22 Credit Agricole Home Loan SFH SA, Reg. S
0.01% 03/11/2031 EUR 6,800,000 6,954,387 0.37 Credit Agricole SA, Reg. S 2.625%
17/03/2027 EUR 2,000,000 2,250,210 0.12 Engie SA, Reg. S, FRN 1.375% Perpetual EUR 700,000 711,813 0.04 Engie SA, Reg. S, FRN 3.25% Perpetual EUR 2,800,000 3,077,166 0.17 EssilorLuxottica SA, Reg. S 0.125%
27/05/2025 EUR 2,100,000 2,120,859 0.11 Indigo Group SAS, Reg. S 1.625%
19/04/2028 EUR 1,100,000 1,139,131 0.06 Klepierre SA, REIT, Reg. S 2%
12/05/2029 EUR 1,100,000 1,233,016 0.07 Orange SA, Reg. S 0.125% 16/09/2029 EUR 600,000 604,981 0.03 Orange SA, Reg. S 1.375% 20/03/2028 EUR 1,100,000 1,208,150 0.06 Orange SA, Reg. S, FRN 5% Perpetual EUR 470,000 570,463 0.03 Rexel SA, Reg. S 2.75% 15/06/2026 EUR 2,100,000 2,148,983 0.12 RTE Reseau de Transport d’Electricite
SADIR, Reg. S 0.625% 08/07/2032 EUR 1,100,000 1,149,533 0.06 SCOR SE, Reg. S, FRN 3% 08/06/2046 EUR 2,000,000 2,262,500 0.12 SEB SA, Reg. S 1.375% 16/06/2025 EUR 700,000 722,396 0.04 Societe Generale SA 1% 24/11/2030 EUR 1,100,000 1,103,908 0.06 Sogecap SA, Reg. S, FRN 4.125%
Perpetual EUR 3,000,000 3,360,000 0.18 Total Capital International SA, Reg. S
1.491% 08/04/2027 EUR 600,000 658,338 0.03 Total Capital International SA, Reg. S
1.994% 08/04/2032 EUR 600,000 719,129 0.04 TOTAL SE, Reg. S 2% Perpetual EUR 1,100,000 1,141,800 0.06 TOTAL SE, Reg. S, FRN 2.708% Perpetual EUR 2,000,000 2,096,750 0.11 TOTAL SE, Reg. S, FRN 3.369% Perpetual EUR 1,250,000 1,408,594 0.08 UNEDIC ASSEO, Reg. S 0.1%
25/11/2026 EUR 7,400,000 7,547,653 0.41 Unibail-Rodamco-Westfield SE, REIT, Reg. S
2.625% 09/04/2030 EUR 1,600,000 1,821,912 0.10 Vivendi SA, Reg. S 0% 13/06/2022 EUR 1,300,000 1,305,193 0.07
108,289,630 5.83
schEDUlE of InVEsTmEnTsAs at 31 December 2020
Investments Currency
Quantity/ Nominal
Value
Market Value EUR
% of Net Assets
Transferable securities and money market instruments admitted to official exchange listing or dealt in on another regulated market
corporate Bonds (continued)
Germanyadidas AG, Reg. S 0% 09/09/2024 EUR 800,000 806,938 0.04 ADLER Group SA, Reg. S 2.75%
13/11/2026 EUR 2,300,000 2,361,806 0.13 Allianz Finance II BV, FRN 5.75%
08/07/2041 EUR 500,000 514,223 0.03 Allianz SE, Reg. S, FRN 2.121% 08/07/2050 EUR 1,500,000 1,646,155 0.09 Bayer AG, Reg. S 0.375% 06/07/2024 EUR 1,100,000 1,115,788 0.06 Bayer AG, Reg. S 1.375% 06/07/2032 EUR 1,400,000 1,497,121 0.08 Bayer AG, Reg. S, FRN 3.125%
12/11/2079 EUR 500,000 526,262 0.03 BMW Finance NV, Reg. S 0.125%
13/07/2022 EUR 1,600,000 1,609,245 0.09 Commerzbank AG 0.01% 11/03/2030 EUR 7,750,000 7,955,452 0.43 Commerzbank AG, Reg. S, FRN 4%
05/12/2030 EUR 600,000 657,528 0.03 Commerzbank AG 7.75% 16/03/2021 EUR 2,500,000 2,536,185 0.14 Continental AG 2.5% 27/08/2026 EUR 925,000 1,033,729 0.06 Daimler AG, Reg. S 0.375% 08/11/2026 EUR 2,650,000 2,683,583 0.14 Daimler AG, Reg. S 1.125% 06/11/2031 EUR 2,475,000 2,628,720 0.14 EnBW Energie Baden-Wuerttemberg AG,
Reg. S, FRN 3.625% 02/04/2076 EUR 1,943,000 1,959,515 0.10 Grand City Properties SA, Reg. S, FRN
2.5% Perpetual EUR 2,000,000 2,065,000 0.11 Grand City Properties SA, Reg. S 1.5%
17/04/2025 EUR 1,500,000 1,594,613 0.09 Kreditanstalt fuer Wiederaufbau, Reg. S
0% 15/09/2028 EUR 6,500,000 6,739,609 0.36 Kreditanstalt fuer Wiederaufbau 0.125%
07/06/2023 EUR 5,709,000 5,819,989 0.31 Kreditanstalt fuer Wiederaufbau 0.25%
15/09/2025 EUR 9,000,000 9,368,352 0.50 Kreditanstalt fuer Wiederaufbau, Reg. S
0% 04/07/2024 EUR 8,500,000 8,690,825 0.47 Kreditanstalt fuer Wiederaufbau, Reg. S
1.125% 15/09/2032 EUR 5,000,000 5,826,100 0.31 Muenchener Rueckversicherungs-
Gesellschaft AG, Reg. S 1.25% 26/05/2041 EUR 700,000 728,225 0.04
Muenchener Rueckversicherungs-Gesellschaft AG, Reg. S, FRN 3.25% 26/05/2049 EUR 2,400,000 2,852,412 0.15
Muenchener Rueckversicherungs-Gesellschaft AG, Reg. S, FRN 6% 26/05/2041 EUR 1,400,000 1,432,441 0.08
Siemens Financieringsmaatschappij NV, Reg. S 0.25% 05/06/2024 EUR 1,600,000 1,628,624 0.09
Siemens Financieringsmaatschappij NV, Reg. S 0.25% 20/02/2029 EUR 2,100,000 2,159,947 0.12
Techem Verwaltungsgesellschaft 675 mbH, Reg. S 2% 15/07/2025 EUR 3,150,000 3,140,077 0.17
Volkswagen International Finance NV, Reg. S, FRN 2.7% Perpetual EUR 1,800,000 1,841,625 0.10
Volkswagen International Finance NV, Reg. S 1.875% 30/03/2027 EUR 1,000,000 1,095,592 0.06
Volkswagen International Finance NV, Reg. S, FRN 4.625% Perpetual EUR 486,000 540,918 0.03
Volkswagen Leasing GmbH, Reg. S 1.375% 20/01/2025 EUR 2,476,000 2,593,375 0.14
Vonovia Finance BV, Reg. S, FRN 4% Perpetual EUR 2,000,000 2,070,786 0.11
Wintershall Dea Finance BV, Reg. S 1.332% 25/09/2028 EUR 2,100,000 2,176,396 0.12
91,897,156 4.95

Morgan Stanley Investment Funds 31 December 2020 148
The accompanying notes are an integral part of these financial statements.
Euro Strategic Bond Fund (continued)
schEDUlE of InVEsTmEnTsAs at 31 December 2020
Investments Currency
Quantity/ Nominal
Value
Market Value EUR
% of Net Assets
Transferable securities and money market instruments admitted to official exchange listing or dealt in on another regulated market
corporate Bonds (continued)
GreeceOTE plc, Reg. S 0.875% 24/09/2026 EUR 3,500,000 3,628,730 0.19
3,628,730 0.19
hong KongCheung Kong Infrastructure Finance BVI
Ltd., Reg. S 1% 12/12/2024 EUR 3,000,000 3,043,800 0.16
3,043,800 0.16
IcelandArion Banki HF, Reg. S 1% 20/03/2023 EUR 1,050,000 1,066,013 0.06 Arion Banki HF, Reg. S 1.625%
01/12/2021 EUR 479,000 487,132 0.03 Landsbankinn HF, Reg. S 0.5%
20/05/2024 EUR 2,450,000 2,449,547 0.13 Landsbankinn HF, Reg. S 1.625%
15/03/2021 EUR 465,000 466,708 0.02
4,469,400 0.24
IndiaNTPC Ltd., Reg. S 2.75% 01/02/2027 EUR 3,000,000 3,190,383 0.17 ONGC Videsh Ltd., Reg. S 2.75%
15/07/2021 EUR 2,300,000 2,329,555 0.13
5,519,938 0.30
IndonesiaPerusahaan Perseroan Persero PT
Perusahaan Listrik Negara, Reg. S 2.875% 25/10/2025 EUR 1,975,000 2,136,373 0.11
2,136,373 0.11
IrelandBank of Ireland Group plc, Reg. S, FRN
0.75% 08/07/2024 EUR 3,100,000 3,151,553 0.17 Bank of Ireland Group plc, Reg. S, FRN
2.375% 14/10/2029 EUR 1,500,000 1,538,137 0.08 Dell Bank International DAC, Reg. S
0.625% 17/10/2022 EUR 1,100,000 1,110,462 0.06 eircom Finance DAC, Reg. S 1.75%
01/11/2024 EUR 4,150,000 4,091,589 0.22 GAS Networks Ireland, Reg. S 0.125%
04/12/2024 EUR 1,250,000 1,260,006 0.07 Ryanair DAC, Reg. S 2.875% 15/09/2025 EUR 600,000 643,025 0.04 Ryanair DAC, Reg. S 1.125% 15/08/2023 EUR 1,350,000 1,361,812 0.07 Smurfit Kappa Acquisitions ULC, Reg. S
2.875% 15/01/2026 EUR 2,000,000 2,216,406 0.12
15,372,990 0.83
IsraelTeva Pharmaceutical Finance Netherlands II
BV, Reg. S 1.125% 15/10/2024 EUR 1,250,000 1,164,188 0.06
1,164,188 0.06
schEDUlE of InVEsTmEnTsAs at 31 December 2020
Investments Currency
Quantity/ Nominal
Value
Market Value EUR
% of Net Assets
Transferable securities and money market instruments admitted to official exchange listing or dealt in on another regulated market
corporate Bonds (continued)
Italy2i Rete Gas SpA, Reg. S 1.608%
31/10/2027 EUR 3,855,000 4,181,430 0.22 Assicurazioni Generali SpA, Reg. S 2.429%
14/07/2031 EUR 650,000 713,623 0.04 Assicurazioni Generali SpA, Reg. S, FRN
5.5% 27/10/2047 EUR 1,550,000 1,913,475 0.10 Banco BPM SpA, Reg. S 0.75%
31/03/2022 EUR 1,200,000 1,217,432 0.07 CDP Reti SpA, Reg. S 1.875%
29/05/2022 EUR 1,700,000 1,737,264 0.09 Enel Finance International NV, Reg. S 0%
17/06/2024 EUR 1,350,000 1,357,518 0.07 Enel SpA, Reg. S, FRN 2.5% 24/11/2078 EUR 2,000,000 2,092,500 0.11 Enel SpA, Reg. S, FRN 3.375% 24/11/2081 EUR 3,000,000 3,329,232 0.18 FCA Bank SpA, Reg. S 0.5% 18/09/2023 EUR 1,400,000 1,414,097 0.08 Intesa Sanpaolo SpA, Reg. S 1%
04/07/2024 EUR 850,000 877,265 0.05 Intesa Sanpaolo SpA, Reg. S 0.75%
04/12/2024 EUR 3,000,000 3,079,128 0.17 Intesa Sanpaolo SpA, Reg. S, FRN 6.25%
Perpetual EUR 2,500,000 2,730,630 0.15 Intesa Sanpaolo SpA, 144A 6.5%
24/02/2021 USD 2,060,000 1,692,397 0.09 Intesa Sanpaolo SpA, Reg. S 1.375%
18/12/2025 EUR 3,000,000 3,271,674 0.18 Societa Esercizi Aereoportuali SpA Sea
3.125% 17/04/2021 EUR 300,000 302,668 0.02 Telecom Italia Finance SA 7.75%
24/01/2033 EUR 2,680,000 3,965,298 0.21 Telecom Italia SpA, Reg. S 3.625%
19/01/2024 EUR 950,000 1,020,066 0.05 Telecom Italia SpA, Reg. S 2.375%
12/10/2027 EUR 1,085,000 1,132,556 0.06 UniCredit SpA, Reg. S 0.5% 09/04/2025 EUR 1,350,000 1,369,428 0.07 UniCredit SpA, Reg. S, FRN 5.375%
Perpetual EUR 3,650,000 3,733,950 0.20 UniCredit SpA, Reg. S 2.125%
24/10/2026 EUR 1,650,000 1,829,692 0.10 UniCredit SpA, Reg. S, FRN 4.375%
03/01/2027 EUR 2,000,000 2,075,194 0.11
45,036,517 2.42
JapanAsahi Group Holdings Ltd., Reg. S 0.541%
23/10/2028 EUR 1,200,000 1,220,470 0.06 Nissan Motor Co. Ltd., Reg. S 1.94%
15/09/2023 EUR 350,000 365,051 0.02 Nissan Motor Co. Ltd., Reg. S 2.652%
17/03/2026 EUR 1,700,000 1,799,713 0.10 Sumitomo Mitsui Banking Corp., Reg. S
0.55% 06/11/2023 EUR 7,000,000 7,171,780 0.39 Sumitomo Mitsui Financial Group, Inc.,
Reg. S 0.819% 23/07/2023 EUR 1,800,000 1,846,568 0.10
12,403,582 0.67
luxembourgBlackstone Property Partners Europe
Holdings Sarl, Reg. S 1.25% 26/04/2027 EUR 1,650,000 1,692,248 0.09 Blackstone Property Partners Europe
Holdings Sarl, Reg. S 1.4% 06/07/2022 EUR 700,000 711,248 0.04 Blackstone Property Partners Europe
Holdings Sarl, Reg. S 2% 15/02/2024 EUR 450,000 472,456 0.03

149 Morgan Stanley Investment Funds 31 December 2020
The accompanying notes are an integral part of these financial statements.
Euro Strategic Bond Fund (continued)
schEDUlE of InVEsTmEnTsAs at 31 December 2020
Investments Currency
Quantity/ Nominal
Value
Market Value EUR
% of Net Assets
Transferable securities and money market instruments admitted to official exchange listing or dealt in on another regulated market
corporate Bonds (continued)
luxembourg (continued)Blackstone Property Partners Europe
Holdings Sarl, Reg. S 2.2% 24/07/2025 EUR 2,100,000 2,253,586 0.12 Eurofins Scientific SE, Reg. S, FRN
4.875% Perpetual EUR 1,200,000 1,298,706 0.07 INEOS Finance plc, Reg. S 2.125%
15/11/2025 EUR 1,000,000 990,855 0.05 Logicor Financing Sarl, Reg. S 1.5%
13/07/2026 EUR 1,450,000 1,531,838 0.08 Logicor Financing Sarl, Reg. S 1.5%
14/11/2022 EUR 2,200,000 2,254,822 0.12 SELP Finance Sarl, REIT, Reg. S 1.5%
20/12/2026 EUR 1,550,000 1,665,697 0.09
12,871,456 0.69
mexicoCemex SAB de CV, Reg. S 3.125%
19/03/2026 EUR 2,450,000 2,522,667 0.14 Fomento Economico Mexicano SAB de CV,
Reg. S 1.75% 20/03/2023 EUR 800,000 832,585 0.04 Petroleos Mexicanos, Reg. S 5.125%
15/03/2023 EUR 5,000,000 5,220,925 0.28 Petroleos Mexicanos, Reg. S 4.875%
21/02/2028 EUR 1,425,000 1,458,380 0.08
10,034,557 0.54
netherlandsABN AMRO Bank NV, Reg. S 4.375%
Perpetual EUR 2,400,000 2,556,478 0.14 ABN AMRO Bank NV, Reg. S 0.5%
17/07/2023 EUR 4,100,000 4,180,442 0.22 Achmea Bank NV, Reg. S 0.5%
20/02/2026 EUR 6,600,000 6,887,536 0.37 ASR Nederland NV, Reg. S, FRN 4.625%
Perpetual EUR 1,000,000 1,085,375 0.06 ASR Nederland NV, Reg. S, FRN 5.125%
29/09/2045 EUR 2,150,000 2,563,875 0.14 ASR Nederland NV, Reg. S, FRN 5%
Perpetual EUR 1,830,000 2,069,501 0.11 BNG Bank NV, Reg. S 0.5% 26/11/2025 EUR 6,000,000 6,296,640 0.34 BNG Bank NV, Reg. S 0.05% 20/11/2029 EUR 5,700,000 5,890,158 0.32 BNG Bank NV, Reg. S 1.5% 15/07/2039 EUR 5,000,000 6,296,725 0.34 Cooperatieve Rabobank UA, Reg. S, FRN
4.625% Perpetual EUR 2,000,000 2,187,500 0.12 Cooperatieve Rabobank UA, Reg. S, FRN
2.5% 26/05/2026 EUR 3,900,000 3,940,275 0.21 de Volksbank NV, Reg. S 1.75%
22/10/2030 EUR 1,400,000 1,479,015 0.08 Nationale-Nederlanden Bank NV (The)
Netherlands, Reg. S 0.375% 31/05/2023 EUR 1,000,000 1,014,436 0.05
Nederlandse Waterschapsbank NV, Reg. S 0% 02/10/2034 EUR 6,900,000 6,962,079 0.37
NN Group NV, Reg. S, FRN 4.625% 08/04/2044 EUR 4,000,000 4,506,000 0.24
Q-Park Holding I BV, Reg. S 1.5% 01/03/2025 EUR 3,750,000 3,631,345 0.20
Royal Schiphol Group NV, Reg. S 2% 06/04/2029 EUR 800,000 924,934 0.05
Shell International Finance BV, Reg. S 0.5% 08/11/2031 EUR 2,500,000 2,565,900 0.14
schEDUlE of InVEsTmEnTsAs at 31 December 2020
Investments Currency
Quantity/ Nominal
Value
Market Value EUR
% of Net Assets
Transferable securities and money market instruments admitted to official exchange listing or dealt in on another regulated market
corporate Bonds (continued)
netherlands (continued)Shell International Finance BV, Reg. S
1.875% 07/04/2032 EUR 3,050,000 3,588,920 0.19 Signify NV, Reg. S 2% 11/05/2024 EUR 700,000 740,656 0.04 Signify NV, Reg. S 2.375% 11/05/2027 EUR 450,000 499,347 0.03 Stedin Holding NV, Reg. S 1.375%
19/09/2028 EUR 2,000,000 2,196,844 0.12 Stedin Holding NV, Reg. S 0.5%
14/11/2029 EUR 700,000 721,793 0.04 UPC Holding BV, Reg. S 3.875%
15/06/2029 EUR 3,580,000 3,687,400 0.20
76,473,174 4.12
new ZealandANZ New Zealand Int’l Ltd., Reg. S
0.125% 22/09/2023 EUR 4,855,000 4,927,812 0.27 ASB Finance Ltd., Reg. S 0.75%
09/10/2025 EUR 4,450,000 4,678,886 0.25 BNZ International Funding Ltd., Reg. S
0.625% 03/07/2025 EUR 2,000,000 2,087,560 0.11 BNZ International Funding Ltd., Reg. S
0.125% 17/06/2021 EUR 1,855,000 1,860,370 0.10
13,554,628 0.73
norwayDNB Bank ASA, Reg. S, FRN 1.25%
01/03/2027 EUR 1,537,000 1,560,461 0.08 Sparebanken Vest Boligkreditt A/S,
Reg. S 0.01% 28/06/2027 EUR 5,800,000 5,931,457 0.32 SR-Boligkreditt A/S 0.01% 08/10/2026 EUR 1,800,000 1,839,735 0.10
9,331,653 0.50
PolandPKO Bank Hipoteczny SA, Reg. S 0.625%
24/01/2023 EUR 3,000,000 3,058,149 0.17 PKO Bank Hipoteczny SA, Reg. S 0.75%
27/08/2024 EUR 3,100,000 3,212,784 0.17
6,270,933 0.34
PortugalBrisa-Concessao Rodoviaria SA, Reg. S
1.875% 30/04/2025 EUR 2,900,000 3,130,825 0.17 Caixa Geral de Depositos SA, Reg. S
1.25% 25/11/2024 EUR 3,000,000 3,083,850 0.17 EDP - Energias de Portugal SA, Reg. S,
FRN 1.7% 20/07/2080 EUR 4,500,000 4,494,645 0.24
10,709,320 0.58
singaporeDBS Bank Ltd., Reg. S 0.375%
23/01/2024 EUR 7,705,000 7,882,824 0.42 DBS Group Holdings Ltd., Reg. S, FRN
1.5% 11/04/2028 EUR 2,000,000 2,042,592 0.11 Oversea-Chinese Banking Corp. Ltd.,
Reg. S 0.25% 05/10/2022 EUR 6,408,000 6,480,147 0.35
16,405,563 0.88

Morgan Stanley Investment Funds 31 December 2020 150
The accompanying notes are an integral part of these financial statements.
Euro Strategic Bond Fund (continued)
schEDUlE of InVEsTmEnTsAs at 31 December 2020
Investments Currency
Quantity/ Nominal
Value
Market Value EUR
% of Net Assets
Transferable securities and money market instruments admitted to official exchange listing or dealt in on another regulated market
corporate Bonds (continued)
south KoreaExport-Import Bank of Korea, Reg. S
0.625% 11/07/2023 EUR 2,300,000 2,357,226 0.13 Export-Import Bank of Korea, Reg. S
0.829% 27/04/2025 EUR 2,450,000 2,556,183 0.14 Korea Development Bank (The), Reg. S
0% 10/07/2024 EUR 4,500,000 4,520,925 0.24 Korea Housing Finance Corp., Reg. S
0.01% 07/07/2025 EUR 8,000,000 8,083,920 0.43 Korea Housing Finance Corp., Reg. S
0.75% 30/10/2023 EUR 1,850,000 1,901,635 0.10 Korea Housing Finance Corp., Reg. S
0.1% 18/06/2024 EUR 4,200,000 4,249,346 0.23
23,669,235 1.27
spainAbertis Infraestructuras Finance BV,
Reg. S 3.248% Perpetual EUR 2,600,000 2,702,050 0.15 Adif Alta Velocidad, Reg. S 1.875%
22/09/2022 EUR 1,300,000 1,351,120 0.07 Adif Alta Velocidad, Reg. S 3.5%
27/05/2024 EUR 1,000,000 1,131,255 0.06 Amadeus IT Group SA, Reg. S 1.875%
24/09/2028 EUR 1,000,000 1,068,344 0.06 Banco Bilbao Vizcaya Argentaria SA,
Reg. S 0.75% 04/06/2025 EUR 1,200,000 1,246,879 0.07 Banco Bilbao Vizcaya Argentaria SA,
Reg. S, FRN 1% 16/01/2030 EUR 1,400,000 1,400,385 0.08 Banco Bilbao Vizcaya Argentaria SA,
Reg. S 6% Perpetual EUR 4,000,000 4,302,000 0.23 Banco Santander SA, Reg. S 3.125%
19/01/2027 EUR 3,000,000 3,431,121 0.18 Bankia SA, Reg. S 0.75% 09/07/2026 EUR 3,500,000 3,610,659 0.19 CaixaBank SA, Reg. S 0.75%
18/04/2023 EUR 3,500,000 3,572,534 0.19 CaixaBank SA, Reg. S, FRN 2.25%
17/04/2030 EUR 4,500,000 4,713,717 0.25 CaixaBank SA, Reg. S 1.25% 11/01/2027 EUR 5,500,000 6,021,560 0.32 CaixaBank SA, Reg. S, FRN 6.75%
Perpetual EUR 2,000,000 2,216,498 0.12 Corp. de Reservas Estrategicas de
Productos Petroliferos Cores, Reg. S 1.75% 24/11/2027 EUR 3,700,000 4,149,961 0.22
Deutsche Bank SA Espanola, Reg. S 0.875% 16/01/2025 EUR 4,700,000 4,919,561 0.27
Grifols SA, Reg. S 2.25% 15/11/2027 EUR 2,175,000 2,210,774 0.12 Iberdrola International BV, Reg. S, FRN
1.875% Perpetual EUR 5,100,000 5,243,438 0.28 Iberdrola International BV, Reg. S, FRN
3.25% Perpetual EUR 1,800,000 1,975,741 0.11 IE2 Holdco SAU, Reg. S 2.875%
01/06/2026 EUR 2,300,000 2,617,432 0.14 Inmobiliaria Colonial Socimi SA, REIT,
Reg. S 2% 17/04/2026 EUR 1,400,000 1,508,708 0.08 Inmobiliaria Colonial Socimi SA, REIT,
Reg. S 1.45% 28/10/2024 EUR 1,800,000 1,880,336 0.10 Liberbank SA, Reg. S 0.25% 25/09/2029 EUR 4,000,000 4,158,100 0.22 Madrilena Red de Gas Finance BV, Reg. S
1.375% 11/04/2025 EUR 550,000 569,148 0.03 Madrilena Red de Gas Finance BV, Reg. S
2.25% 11/04/2029 EUR 1,300,000 1,418,326 0.08 NorteGas Energia Distribucion SA, Reg. S
0.918% 28/09/2022 EUR 2,750,000 2,781,914 0.15 Prosegur Cia de Seguridad SA, Reg. S 1%
08/02/2023 EUR 1,100,000 1,120,044 0.06
schEDUlE of InVEsTmEnTsAs at 31 December 2020
Investments Currency
Quantity/ Nominal
Value
Market Value EUR
% of Net Assets
Transferable securities and money market instruments admitted to official exchange listing or dealt in on another regulated market
corporate Bonds (continued)
spain (continued)Redexis Gas Finance BV, Reg. S 1.875%
28/05/2025 EUR 600,000 639,750 0.03 Redexis Gas Finance BV, Reg. S 1.875%
27/04/2027 EUR 1,650,000 1,796,725 0.10 Repsol International Finance BV, Reg. S,
FRN 4.247% Perpetual EUR 575,000 640,334 0.03 Repsol International Finance BV, Reg. S,
FRN 4.5% 25/03/2075 EUR 2,500,000 2,748,825 0.15 Telefonica Europe BV, Reg. S, FRN 2.502%
Perpetual EUR 1,000,000 1,022,313 0.06 Telefonica Europe BV, Reg. S, FRN 2.875%
Perpetual EUR 700,000 718,376 0.04 Telefonica Europe BV, Reg. S, FRN 4.375%
Perpetual EUR 1,900,000 2,067,565 0.11 Telefonica Europe BV, Reg. S, FRN 3.75%
Perpetual EUR 1,000,000 1,027,745 0.06 Telefonica Europe BV, Reg. S, FRN 5.875%
Perpetual EUR 300,000 338,033 0.02
82,321,271 4.43
supra-nationalCorp. Andina de Fomento, Reg. S 1.125%
13/02/2025 EUR 5,500,000 5,700,690 0.31 Corp. Andina de Fomento, Reg. S 0.5%
25/01/2022 EUR 3,966,000 3,996,038 0.22 Council of Europe Development Bank
0.625% 30/01/2029 EUR 3,450,000 3,743,037 0.20 Council of Europe Development Bank,
Reg. S 0% 09/04/2027 EUR 4,400,000 4,537,892 0.24 European Bank for Reconstruction
& Development 0% 17/10/2024 EUR 6,000,000 6,121,962 0.33 European Union, Reg. S 0% 04/10/2030 EUR 5,080,000 5,293,822 0.29 European Union, Reg. S 0% 04/07/2035 EUR 2,010,000 2,066,308 0.11 International Bank for Reconstruction
& Development 0% 15/01/2027 EUR 12,750,000 13,084,645 0.70
44,544,394 2.40
swedenAkelius Residential Property AB, Reg. S
1.5% 23/01/2022 EUR 1,000,000 1,017,873 0.05 Akelius Residential Property Financing BV,
Reg. S 1% 17/01/2028 EUR 500,000 516,035 0.03 Intrum AB, Reg. S 3.5% 15/07/2026 EUR 1,250,000 1,244,219 0.07 Intrum AB, Reg. S 3.125% 15/07/2024 EUR 1,250,000 1,256,644 0.07
4,034,771 0.22
switzerlandCredit Suisse Group AG, Reg. S, FRN
3.25% 02/04/2026 EUR 1,100,000 1,244,579 0.07 Lonza Finance International NV, Reg. S
1.625% 21/04/2027 EUR 1,000,000 1,096,365 0.06 Novartis Finance SA, Reg. S 0%
23/09/2028 EUR 3,100,000 3,119,769 0.17 Syngenta Finance NV, Reg. S 3.375%
16/04/2026 EUR 3,300,000 3,570,052 0.19 UBS AG, Reg. S 5.125% 15/05/2024 USD 800,000 720,492 0.04 UBS Group AG, Reg. S, FRN 1.25%
17/04/2025 EUR 1,500,000 1,563,294 0.08
11,314,551 0.61

151 Morgan Stanley Investment Funds 31 December 2020
The accompanying notes are an integral part of these financial statements.
Euro Strategic Bond Fund (continued)
schEDUlE of InVEsTmEnTsAs at 31 December 2020
Investments Currency
Quantity/ Nominal
Value
Market Value EUR
% of Net Assets
Transferable securities and money market instruments admitted to official exchange listing or dealt in on another regulated market
corporate Bonds (continued)
United arab EmiratesEmirates NBD Bank PJSC, Reg. S 1.75%
23/03/2022 EUR 1,930,000 1,967,747 0.11 Emirates Telecommunications Group Co.
PJSC, Reg. S 1.75% 18/06/2021 EUR 1,000,000 1,010,236 0.05 MDGH - GMTN BV, Reg. S 5.875%
14/03/2021 EUR 1,650,000 1,671,367 0.09
4,649,350 0.25
United KingdomAviva plc, Reg. S, FRN 6.125%
05/07/2043 EUR 2,000,000 2,293,780 0.12 Barclays Bank plc, Reg. S 6%
14/01/2021 EUR 1,050,000 1,051,570 0.06 Barclays plc, Reg. S, FRN 3.375%
02/04/2025 EUR 1,400,000 1,545,803 0.08 BP Capital Markets plc, Reg. S 3.25%
Perpetual EUR 3,700,000 3,954,375 0.21 BP Capital Markets plc, Reg. S 3.625%
Perpetual EUR 1,500,000 1,644,375 0.09 BP Capital Markets plc, Reg. S 2.822%
07/04/2032 EUR 1,600,000 2,023,755 0.11 Centrica plc, Reg. S, FRN 3%
10/04/2076 EUR 1,800,000 1,812,627 0.10 CK Hutchison Finance 16 Ltd., Reg. S
1.25% 06/04/2023 EUR 2,950,000 3,031,789 0.16 CK Hutchison Group Telecom Finance SA,
Reg. S 0.375% 17/10/2023 EUR 2,450,000 2,474,287 0.13 CK Hutchison Group Telecom Finance SA,
Reg. S 1.5% 17/10/2031 EUR 950,000 1,023,122 0.05 DS Smith plc, Reg. S 2.25%
16/09/2022 EUR 2,300,000 2,377,770 0.13 Heathrow Funding Ltd., Reg. S 1.5%
12/10/2027 EUR 1,000,000 1,047,236 0.06 Heathrow Funding Ltd., Reg. S 1.5%
11/02/2030 EUR 1,050,000 1,110,374 0.06 High Speed Rail Finance 1 plc, Reg. S
4.375% 01/11/2038 GBP 400,000 599,299 0.03 HSBC Holdings plc, Reg. S 0.309%
13/11/2026 EUR 1,050,000 1,063,737 0.06 HSBC Holdings plc, Reg. S 0.77%
13/11/2031 EUR 700,000 725,728 0.04 HSBC Holdings plc, Reg. S 3%
30/06/2025 EUR 1,450,000 1,625,105 0.09 HSBC Holdings plc, Reg. S, FRN 5.25%
Perpetual EUR 2,400,000 2,511,000 0.14 Lloyds Banking Group plc, Reg. S, FRN
0.625% 15/01/2024 EUR 1,900,000 1,921,983 0.10 Lloyds Banking Group plc, Reg. S, FRN
3.5% 01/04/2026 EUR 1,050,000 1,195,084 0.06 Lloyds Banking Group plc, Reg. S, FRN
1.75% 07/09/2028 EUR 3,300,000 3,399,630 0.18 Lloyds Banking Group plc, Reg. S, FRN
4.5% 18/03/2030 EUR 292,000 334,712 0.02 Lloyds Banking Group plc, Reg. S, FRN
4.947% Perpetual EUR 1,300,000 1,401,056 0.08 Natwest Group plc, Reg. S 2.5%
22/03/2023 EUR 1,200,000 1,267,932 0.07 NGG Finance plc, Reg. S, FRN 1.625%
05/12/2079 EUR 3,250,000 3,310,937 0.18 Playtech plc, Reg. S 4.25% 07/03/2026 EUR 525,000 544,307 0.03 Reckitt Benckiser Treasury Services
Nederland BV, Reg. S 0.375% 19/05/2026 EUR 1,750,000 1,799,677 0.10
schEDUlE of InVEsTmEnTsAs at 31 December 2020
Investments Currency
Quantity/ Nominal
Value
Market Value EUR
% of Net Assets
Transferable securities and money market instruments admitted to official exchange listing or dealt in on another regulated market
corporate Bonds (continued)
United Kingdom (continued)Santander UK Group Holdings plc, Reg. S,
FRN 0.391% 28/02/2025 EUR 3,150,000 3,177,906 0.17 Santander UK Group Holdings plc, Reg. S,
FRN 7.375% Perpetual GBP 800,000 933,011 0.05 Smiths Group plc, Reg. S 1.25%
28/04/2023 EUR 3,350,000 3,426,638 0.18 Vodafone Group plc, Reg. S 2.875%
20/11/2037 EUR 2,000,000 2,572,406 0.14
57,201,011 3.08
United states of americaAmerican Honda Finance Corp. 1.95%
18/10/2024 EUR 850,000 914,948 0.05 Ardagh Packaging Finance plc, Reg. S
2.125% 15/08/2026 EUR 4,100,000 4,116,733 0.22 Ashland Services BV, Reg. S 2%
30/01/2028 EUR 4,000,000 4,005,374 0.21 AT&T, Inc. 1.6% 19/05/2028 EUR 1,800,000 1,966,743 0.11 AT&T, Inc. 1.3% 05/09/2023 EUR 850,000 879,882 0.05 AT&T, Inc. 2.4% 15/03/2024 EUR 450,000 482,709 0.03 AT&T, Inc. 2.45% 15/03/2035 EUR 1,200,000 1,413,444 0.08 Avis Budget Finance plc, Reg. S 4.75%
30/01/2026 EUR 3,000,000 2,943,000 0.16 Bank of America Corp., Reg. S 0.654%
26/10/2031 EUR 2,450,000 2,513,051 0.13 Bank of America Corp., Reg. S, FRN
3.648% 31/03/2029 EUR 2,350,000 2,924,869 0.16 Berkshire Hathaway, Inc. 1.625%
16/03/2035 EUR 1,150,000 1,359,302 0.07 Capital One Financial Corp. 0.8%
12/06/2024 EUR 1,250,000 1,279,606 0.07 Chubb INA Holdings, Inc. 0.875%
15/06/2027 EUR 1,200,000 1,263,520 0.07 Chubb INA Holdings, Inc. 1.55%
15/03/2028 EUR 1,850,000 2,037,140 0.11 Citigroup, Inc., Reg. S, FRN 1.25%
06/07/2026 EUR 2,500,000 2,634,762 0.14 Citigroup, Inc., Reg. S, FRN 0.5%
08/10/2027 EUR 1,850,000 1,879,633 0.10 Coca-Cola Co. (The) 0.125% 15/03/2029 EUR 1,500,000 1,512,832 0.08 Coca-Cola Co. (The) 0.8% 15/03/2040 EUR 1,500,000 1,552,659 0.08 DH Europe Finance II Sarl 0.45%
18/03/2028 EUR 4,000,000 4,080,860 0.22 Eli Lilly and Co. 1.7% 01/11/2049 EUR 1,900,000 2,256,423 0.12 Fidelity National Information Services, Inc.
1.5% 21/05/2027 EUR 2,500,000 2,698,525 0.14 General Electric Co. 0.875% 17/05/2025 EUR 2,500,000 2,576,375 0.14 Goldman Sachs Group, Inc. (The), Reg. S
3.375% 27/03/2025 EUR 1,675,000 1,908,852 0.10 Goldman Sachs Group, Inc. (The), Reg. S
1.625% 27/07/2026 EUR 2,428,000 2,628,142 0.14 International Game Technology plc, Reg. S
3.5% 15/06/2026 EUR 2,600,000 2,696,382 0.14 JPMorgan Chase & Co., Reg. S, FRN
1.09% 11/03/2027 EUR 2,950,000 3,106,586 0.17 JPMorgan Chase & Co., Reg. S, FRN
0.389% 24/02/2028 EUR 2,000,000 2,035,058 0.11 Liberty Mutual Group, Inc., Reg. S, FRN
3.625% 23/05/2059 EUR 2,000,000 2,066,600 0.11 Marsh & McLennan Cos., Inc. 1.349%
21/09/2026 EUR 1,750,000 1,872,250 0.10 Medtronic Global Holdings SCA 0.375%
15/10/2028 EUR 2,250,000 2,312,240 0.12

Morgan Stanley Investment Funds 31 December 2020 152
The accompanying notes are an integral part of these financial statements.
Euro Strategic Bond Fund (continued)
schEDUlE of InVEsTmEnTsAs at 31 December 2020
Investments Currency
Quantity/ Nominal
Value
Market Value EUR
% of Net Assets
Transferable securities and money market instruments admitted to official exchange listing or dealt in on another regulated market
corporate Bonds (continued)
United states of america (continued)Medtronic Global Holdings SCA 1.625%
15/10/2050 EUR 1,000,000 1,118,516 0.06 Microsoft Corp. 3.125% 06/12/2028 EUR 1,000,000 1,262,610 0.07 Molson Coors Beverage Co. 1.25%
15/07/2024 EUR 3,000,000 3,094,914 0.17 NRG Energy, Inc., 144A 3.625%
15/02/2031 USD 2,225,000 1,872,501 0.10 PACCAR Financial Europe BV, Reg. S 0%
03/03/2023 EUR 3,650,000 3,655,964 0.20 PepsiCo, Inc. 0.25% 06/05/2024 EUR 1,200,000 1,218,673 0.07 Prologis Euro Finance LLC, REIT 1.875%
05/01/2029 EUR 3,800,000 4,304,952 0.23 Schlumberger Finance BV, Reg. S 1.375%
28/10/2026 EUR 1,500,000 1,617,651 0.09 Silgan Holdings, Inc. 2.25% 01/06/2028 EUR 1,950,000 1,984,067 0.11 Standard Industries, Inc., Reg. S 2.25%
21/11/2026 EUR 3,975,000 4,032,430 0.22 Upjohn Finance BV, Reg. S 1.362%
23/06/2027 EUR 3,500,000 3,714,295 0.20 Upjohn Finance BV, Reg. S 1.908%
23/06/2032 EUR 1,200,000 1,329,259 0.07
95,124,332 5.12
Total corporate Bonds 898,850,951 48.37
Government Bonds
australiaAustralia Government Bond, Reg. S 0.5%
21/09/2026 AUD 27,400,000 17,300,809 0.93 Australia Government Bond, Reg. S 1%
21/12/2030 AUD 12,250,000 7,726,837 0.42 Australia Government Bond, Reg. S 2.75%
21/11/2027 AUD 16,825,000 12,121,735 0.65
37,149,381 2.00
austriaAustria Government Bond, Reg. S, 144A
2.1% 20/09/2117 EUR 5,000,000 11,203,950 0.60 Austria Government Bond, Reg. S, 144A
0.85% 30/06/2120 EUR 1,880,000 2,485,900 0.14
13,689,850 0.74
BelgiumBelgium Government Bond, Reg. S, 144A
1.45% 22/06/2037 EUR 11,000,000 13,669,348 0.73 Belgium Government Bond, Reg. S, 144A
1.7% 22/06/2050 EUR 11,500,000 15,935,446 0.86 Belgium Government Bond, Reg. S 1.25%
22/04/2033 EUR 2,500,000 2,967,475 0.16
32,572,269 1.75
BrazilBrazil Notas do Tesouro Nacional 10%
01/01/2025 BRL 5,000,000 9,085,118 0.49
9,085,118 0.49
schEDUlE of InVEsTmEnTsAs at 31 December 2020
Investments Currency
Quantity/ Nominal
Value
Market Value EUR
% of Net Assets
Transferable securities and money market instruments admitted to official exchange listing or dealt in on another regulated market
Government Bonds (continued)
chileChile Government Bond 1.25% 29/01/2040 EUR 2,500,000 2,637,350 0.14
2,637,350 0.14
chinaChina Government Bond, Reg. S 0.25%
25/11/2030 EUR 7,225,000 7,229,566 0.39 China Government Bond, Reg. S 0.125%
12/11/2026 EUR 3,150,000 3,176,753 0.17
10,406,319 0.56
croatiaCroatia Government Bond, Reg. S 1.5%
17/06/2031 EUR 15,000,000 16,451,250 0.88 Croatia Government Bond, Reg. S 1.125%
19/06/2029 EUR 11,825,000 12,465,903 0.67
28,917,153 1.55
Dominican RepublicDominican Republic Government Bond,
Reg. S 4.875% 23/09/2032 USD 570,000 516,839 0.03 Dominican Republic Government Bond,
Reg. S 5.875% 30/01/2060 USD 4,350,000 3,908,845 0.21
4,425,684 0.24
EgyptEgypt Government Bond, Reg. S 6.375%
11/04/2031 EUR 6,000,000 6,478,890 0.35 Egypt Treasury Bill 0% 02/03/2021 EGP 83,500,000 4,238,421 0.23
10,717,311 0.58
EstoniaEstonia Government Bond, Reg. S 0.125%
10/06/2030 EUR 3,755,000 3,875,731 0.21
3,875,731 0.21
finlandFinland Government Bond, Reg. S, 144A
1.125% 15/04/2034 EUR 6,000,000 7,119,756 0.38 Finland Government Bond, Reg. S, 144A
0.125% 15/04/2036 EUR 3,300,000 3,452,067 0.19
10,571,823 0.57
franceFrance Government Bond OAT, Reg. S,
144A 0.5% 25/05/2040 EUR 5,050,000 5,451,232 0.29 France Government Bond OAT, Reg. S
0% 25/11/2030 EUR 24,000,000 24,830,978 1.34 France Government Bond OAT, Reg. S,
144A 2% 25/05/2048 EUR 4,086,530 5,958,071 0.32 France Government Bond OAT, Reg. S
4% 25/10/2038 EUR 11,416,564 19,660,522 1.06 Societe Du Grand Paris EPIC, Reg. S
1% 18/02/2070 EUR 6,500,000 7,333,716 0.39
63,234,519 3.40

153 Morgan Stanley Investment Funds 31 December 2020
The accompanying notes are an integral part of these financial statements.
Euro Strategic Bond Fund (continued)
schEDUlE of InVEsTmEnTsAs at 31 December 2020
Investments Currency
Quantity/ Nominal
Value
Market Value EUR
% of Net Assets
Transferable securities and money market instruments admitted to official exchange listing or dealt in on another regulated market
Government Bonds (continued)
GermanyBundesrepublik Deutschland, Reg. S 0%
15/08/2030 EUR 10,440,000 11,070,702 0.59 State of North Rhine-Westphalia Germany,
Reg. S 0% 12/10/2035 EUR 8,600,000 8,671,638 0.47 State of North Rhine-Westphalia Germany,
Reg. S 2.15% 21/03/2119 EUR 1,000,000 1,780,614 0.10 State of North Rhine-Westphalia Germany,
Reg. S 1.375% 15/01/2120 EUR 2,025,000 2,628,308 0.14
24,151,262 1.30
GreeceGreece Government Bond, Reg. S, 144A
2% 22/04/2027 EUR 7,000,000 7,734,314 0.41
7,734,314 0.41
hondurasHonduras Government Bond, Reg. S
5.625% 24/06/2030 USD 595,000 550,414 0.03
550,414 0.03
hungaryHungary Government Bond, Reg. S
1.75% 05/06/2035 EUR 7,000,000 7,768,320 0.42 Hungary Government Bond, Reg. S
1.25% 22/10/2025 EUR 4,300,000 4,546,167 0.24 Hungary Government Bond, Reg. S
1.625% 28/04/2032 EUR 8,075,000 8,827,727 0.48
21,142,214 1.14
IndonesiaIndonesia Government Bond 1.45%
18/09/2026 EUR 1,770,000 1,860,341 0.10 Indonesia Government Bond 1.4%
30/10/2031 EUR 900,000 933,036 0.05 Indonesia Government Bond, Reg. S
2.15% 18/07/2024 EUR 6,000,000 6,393,300 0.34 Indonesia Government Bond, Reg. S
3.375% 30/07/2025 EUR 5,000,000 5,672,068 0.31 Indonesia Treasury 8.25% 15/05/2029 IDR 80,000,000,000 5,334,961 0.29
20,193,706 1.09
IrelandIreland Government Bond, Reg. S 0.2%
15/05/2027 EUR 2,325,000 2,433,136 0.13 Ireland Government Bond, Reg. S 1.5%
15/05/2050 EUR 3,800,000 5,099,638 0.27
7,532,774 0.40
ItalyItaly Buoni Poliennali Del Tesoro, Reg. S,
144A 0.55% 21/05/2026 EUR 15,000,000 15,345,698 0.83 Italy Buoni Poliennali Del Tesoro, Reg. S
0.5% 01/02/2026 EUR 44,000,000 45,139,600 2.43 Italy Buoni Poliennali Del Tesoro 0.95%
15/03/2023 EUR 18,875,000 19,442,930 1.05
schEDUlE of InVEsTmEnTsAs at 31 December 2020
Investments Currency
Quantity/ Nominal
Value
Market Value EUR
% of Net Assets
Transferable securities and money market instruments admitted to official exchange listing or dealt in on another regulated market
Government Bonds (continued)
Italy (continued)Italy Buoni Poliennali Del Tesoro, Reg. S,
144A 1.65% 01/12/2030 EUR 22,075,000 24,499,166 1.32 Italy Buoni Poliennali Del Tesoro, Reg. S,
144A 3.1% 01/03/2040 EUR 21,000,000 28,063,379 1.51 Italy Buoni Poliennali Del Tesoro, Reg. S,
144A 3.85% 01/09/2049 EUR 1,904,000 3,010,251 0.16 Italy Buoni Poliennali Del Tesoro, Reg. S,
144A 2.45% 01/09/2050 EUR 17,980,000 22,467,535 1.21 Italy Buoni Poliennali Del Tesoro, Reg. S,
144A 1.4% 26/05/2025 EUR 50,573,000 53,574,569 2.88 Italy Buoni Poliennali Del Tesoro, Reg. S,
144A 0.65% 28/10/2027 EUR 28,905,000 29,718,529 1.60 Italy Buoni Poliennali Del Tesoro, Reg. S,
144A 0.1% 15/05/2022 EUR 100,000 106,833 0.00
241,368,490 12.99
JapanJapan Finance Organization for
Municipalities, Reg. S 0.05% 12/02/2027 EUR 1,825,000 1,850,143 0.10
1,850,143 0.10
lithuaniaLithuania Government Bond, Reg. S 0.5%
28/07/2050 EUR 3,295,000 3,347,766 0.18
3,347,766 0.18
mexicoMexican Bonos 8.5% 31/05/2029 MXN 270,000,000 13,515,818 0.73 Mexican Bonos 7.75% 29/05/2031 MXN 185,000,000 8,926,916 0.48 Mexico Government Bond 1.35%
18/09/2027 EUR 4,225,000 4,376,340 0.24 Mexico Government Bond 1.75%
17/04/2028 EUR 10,300,000 10,852,492 0.58
37,671,566 2.03
montenegroMontenegro Government Bond, Reg. S
2.875% 16/12/2027 EUR 9,150,000 8,997,991 0.48 Montenegro Government Bond, Reg. S
2.55% 03/10/2029 EUR 8,000,000 7,596,600 0.41
16,594,591 0.89
new ZealandNew Zealand Government Bond 0.25%
15/05/2028 NZD 10,440,000 5,939,115 0.32 New Zealand Government Bond 1.75%
15/05/2041 NZD 4,500,000 2,615,265 0.14
8,554,380 0.46
PortugalPortugal Obrigacoes do Tesouro OT,
Reg. S, 144A 0.7% 15/10/2027 EUR 10,000,000 10,648,680 0.57 Portugal Obrigacoes do Tesouro OT,
Reg. S, 144A 3.875% 15/02/2030 EUR 8,000,000 10,852,664 0.59
21,501,344 1.16

Morgan Stanley Investment Funds 31 December 2020 154
The accompanying notes are an integral part of these financial statements.
Euro Strategic Bond Fund (continued)
schEDUlE of InVEsTmEnTsAs at 31 December 2020
Investments Currency
Quantity/ Nominal
Value
Market Value EUR
% of Net Assets
Transferable securities and money market instruments admitted to official exchange listing or dealt in on another regulated market
Government Bonds (continued)
RussiaRussian Federal Bond - OFZ 6.9%
23/05/2029 RUB 200,000,000 2,366,009 0.13
2,366,009 0.13
senegalSenegal Government Bond, Reg. S 4.75%
13/03/2028 EUR 6,400,000 6,852,160 0.37
6,852,160 0.37
serbiaSerbia Government Bond, Reg. S 3.125%
15/05/2027 EUR 3,670,000 4,130,952 0.22 Serbia Government Bond, Reg. S 1.5%
26/06/2029 EUR 9,000,000 9,328,500 0.50
13,459,452 0.72
sloveniaSlovenia Government Bond, Reg. S
0.488% 20/10/2050 EUR 2,800,000 2,955,663 0.16 Slovenia Government Bond, Reg. S
1.188% 14/03/2029 EUR 12,000,000 13,426,152 0.72 Slovenia Government Bond, Reg. S
0.275% 14/01/2030 EUR 7,722,000 8,060,965 0.43
24,442,780 1.31
south africaSouth Africa Government Bond 8%
31/01/2030 ZAR 150,000,000 7,967,759 0.43
7,967,759 0.43
south KoreaKorea Government Bond 0% 16/09/2025 EUR 4,215,000 4,269,921 0.23
4,269,921 0.23
spainSpain Government Bond, Reg. S, 144A
1.25% 31/10/2030 EUR 74,350,000 83,135,924 4.48 Spain Government Bond, Reg. S, 144A
2.7% 31/10/2048 EUR 2,000,000 2,942,140 0.16 Spain Government Bond, Reg. S, 144A
3.45% 30/07/2066 EUR 8,000,000 14,498,480 0.78 Spain Government Inflation Linked Bond,
Reg. S, 144A 0.65% 30/11/2027 EUR 22,500,000 26,455,915 1.42
127,032,459 6.84
UkraineUkraine Government Bond, Reg. S 6.75%
20/06/2026 EUR 6,000,000 6,626,790 0.36
6,626,790 0.36
Total Government Bonds 832,492,802 44.80
schEDUlE of InVEsTmEnTsAs at 31 December 2020
Investments Currency
Quantity/ Nominal
Value
Market Value EUR
% of Net Assets
Transferable securities and money market instruments admitted to official exchange listing or dealt in on another regulated market
mortgage and asset Backed securities
franceCFHL-1, Reg. S ‘D’ 1.491% 28/04/2054 EUR 1,400,000 1,405,716 0.08
1,405,716 0.08
netherlandsE-MAC NL BV, Reg. S, FRN, Series NL05-I
‘A’ 2.397% 25/04/2038 EUR 1,308,814 1,297,055 0.07 E-MAC NL BV, Reg. S, FRN, Series NL06-2
‘A’ 0.767% 25/01/2039 EUR 1,494,890 1,382,911 0.07
2,679,966 0.14
United KingdomEurosail-UK plc, Reg. S, FRN, Series
2007-4X ‘B1A’ 1.06% 13/06/2045 GBP 2,189,080 2,270,078 0.12 Ripon Mortgages plc, Reg. S, FRN ‘C1’
1.568% 20/08/2056 GBP 3,100,000 3,465,265 0.19
5,735,343 0.31
United states of americaSLM Student Loan Trust, Reg. S, FRN
0.039% 25/07/2039 EUR 5,000,000 4,768,034 0.26
4,768,034 0.26
Total mortgage and asset Backed securities 14,589,059 0.79
Equities
United states of americaMr Cooper Group, Inc. USD 1 25 0.00
25 0.00
Total Equities 25 0.00
Total Transferable securities and money market instruments admitted to official exchange listing or dealt in on another regulated market 1,759,051,763 94.66
Other transferable securities and money market instruments not admitted to official exchange listing or dealt in on another regulated market
Equities
United states of americaWA Funding TR III* USD 200 0 0.00
0 0.00
Total Equities 0 0.00
Total other transferable securities and money market instruments not admitted to official exchange listing or dealt in on another regulated market 0 0.00

155 Morgan Stanley Investment Funds 31 December 2020
The accompanying notes are an integral part of these financial statements.
Euro Strategic Bond Fund (continued)
financial futures contracts
security Descriptionnumber
of contracts currency
Global Exposure
EUR
Unrealised Gain/(loss)
EUR
% of net assets
Australia 10 Year Bond, 15/03/2021 126 AUD 11,688,602 25,496 0.00Euro-Bobl, 08/03/2021 (140) EUR (18,925,200) 3,114 0.00Euro-BTP, 08/03/2021 133 EUR 20,217,330 97,888 0.01
Total Unrealised Gain on financial futures contracts 126,498 0.01
Euro-Bund, 08/03/2021 34 EUR 6,039,760 (5,620) 0.00Euro-Buxl 30 Year Bond, 08/03/2021 57 EUR 12,838,680 (30,857) 0.00Euro-OAT, 08/03/2021 (175) EUR (29,375,500) (1,768) 0.00Euro-Schatz, 08/03/2021 315 EUR 35,366,625 (32,288) 0.00US 10 Year Note, 22/03/2021 (11) USD (1,237,224) (329) 0.00US Long Bond, 22/03/2021 (50) USD (7,050,060) (33,185) (0.01) US Ultra Bond, 22/03/2021 (50) USD (8,686,499) (2,813) 0.00
Total Unrealised loss on financial futures contracts (106,860) (0.01)
net Unrealised Gain on financial futures contracts 19,638 0.00
forward currency Exchange contracts (continued)
currency Purchased
amount Purchased
currency sold
amount sold
maturity Date counterparty
Unrealised Gain/(loss)
EUR
% of net assets
EUR 5,301,278 USD 6,430,000 15/01/2021 State Street 61,956 0.00EUR 46,590,677 USD 55,430,000 15/01/2021 Westpac Banking 1,424,945 0.08 EUR 4,523,919 MXN 110,000,000 20/01/2021 Barclays 20,284 0.00EUR 4,748,696 MXN 115,500,000 20/01/2021 RBC 19,879 0.00MXN 224,000,000 EUR 9,078,870 20/01/2021 RBC 92,169 0.01 EUR 13,003,023 USD 15,400,000 21/01/2021 UBS 456,541 0.02 NOK 35,300,000 USD 3,996,650 21/01/2021 RBC 114,364 0.01 NOK 62,150,000 USD 6,579,094 21/01/2021 State Street 574,080 0.03 SEK 150,020,122 EUR 14,590,033 21/01/2021 BNP Paribas 379,281 0.02 AUD 10,838,595 EUR 6,684,780 22/01/2021 Commonwealth
Bank of Australia 142,669 0.01 NZD 9,674,069 EUR 5,595,149 22/01/2021 ANZ 103,130 0.01 ZAR 78,000,000 EUR 4,134,856 22/01/2021 RBC 191,356 0.01 EUR 9,113,121 PLN 41,200,000 25/01/2021 Barclays 82,428 0.00EUR 4,296,634 PLN 19,300,000 25/01/2021 RBC 66,237 0.00EUR 10,761,140 USD 13,200,000 01/02/2021 Commonwealth
Bank of Australia 9,871 0.00EUR 420,110 USD 500,000 01/02/2021 RBC 12,865 0.00EUR 2,151,702 USD 2,579,740 01/02/2021 Westpac Banking 50,529 0.00
Unrealised Gain on forward currency Exchange contracts – assets 3,802,584 0.20
Total Unrealised Gain on forward currency Exchange contracts – assets 3,802,584 0.20
USD 453 EUR 370 04/01/2021 J.P. Morgan (1) 0.00EUR 13,117,838 MXN 328,000,000 20/01/2021 State Street (311,184) (0.02) MXN 104,000,000 EUR 4,272,425 20/01/2021 RBC (14,443) 0.00EUR 14,942,290 SEK 155,035,000 21/01/2021 Canadian Imperial
Bank of Commerce (527,419) (0.03) EUR 42,173,906 AUD 69,640,000 22/01/2021 Goldman Sachs (1,693,729) (0.09) EUR 14,404,109 NZD 25,410,000 22/01/2021 Westpac Banking (563,046) (0.03) EUR 2,787,169 ZAR 53,750,000 22/01/2021 Canadian Imperial
Bank of Commerce (194,034) (0.01)
schEDUlE of InVEsTmEnTsAs at 31 December 2020
Investments Currency
Quantity/ Nominal
Value
Market Value EUR
% of Net Assets
Units of authorised UCITS or other collective investment undertakings
collective Investment schemes – UcITs
luxembourgMorgan Stanley Liquidity Funds Euro
Liquidity Fund – MS Reserve† EUR 53,862,271 53,862,271 2.90 Morgan Stanley Liquidity Funds US Dollar
Liquidity Fund – MS Reserve† USD 15,478,372 15,478,372 0.83
69,340,643 3.73
Total collective Investment schemes – UcITs 69,340,643 3.73
Exchange Traded funds
IrelandiShares EUR High Yield Corp. Bond UCITS ETF EUR 89,796 9,223,845 0.50
9,223,845 0.50
Total Exchange Traded funds 9,223,845 0.50
Total Units of authorised UcITs or other collective investment undertakings 78,564,488 4.23
Total Investments 1,837,616,251 98.89
cash 14,551,250 0.78
other assets/(liabilities) 5,997,915 0.33
Total net assets 1,858,165,416 100.00
*Security is valued at its fair value under the direction of the Board of Directors.† Managed by an affiliate of the Investment Adviser.The country disclosed within the Schedule of Investments refers to the country of risk. The country of incorporation may differ.
DERIVaTIVEs
Over-the-counter (OTC) and exchange traded derivatives as at 31 December 2020, expressed in Euro.

Morgan Stanley Investment Funds 31 December 2020 156
The accompanying notes are an integral part of these financial statements.
Euro Strategic Bond Fund (continued)
forward currency Exchange contracts (continued)
currency Purchased
amount Purchased
currency sold
amount sold
maturity Date counterparty
Unrealised Gain/(loss)
EUR
% of net assets
PLN 19,350,000 EUR 4,271,551 25/01/2021 Westpac Banking (30,195) 0.00PLN 41,200,000 USD 11,126,438 25/01/2021 HSBC (33,214) 0.00EUR 20,150,038 GBP 18,211,000 27/01/2021 Westpac Banking (116,472) (0.01) GBP 11,650,000 EUR 13,058,694 27/01/2021 Westpac Banking (93,736) (0.01) USD 1,056,531 COP 3,850,000,000 01/02/2021 State Street (57,881) 0.00USD 5,100,000 EUR 4,190,702 01/02/2021 RBC (36,802) 0.00USD 1,483,798 IDR 21,087,000,000 01/02/2021 BNP Paribas (23,297) 0.00USD 1,021,759 RUB 79,000,000 01/02/2021 State Street (33,844) 0.00
Unrealised loss on forward currency Exchange contracts – liabilities (3,729,297) (0.20)
Total Unrealised loss on forward currency Exchange contracts – liabilities (3,729,297) (0.20)
net Unrealised Gain on forward currency Exchange contracts – assets 73,287 0.00
credit Default swap contracts
nominal amount ccy counterparty
Reference Entity
Buy/ sell
Interest (Paid)/
Received Rate
maturity Date
market Value EUR
% of net assets
35,450,000 EUR Goldman Sachs ITRAXX.EUROPE.CROSSOVER. 32-V4 Buy (5.00)% 20/12/2024 (3,812,538) (0.20)
15,000,000 EUR Goldman Sachs ITRAXX.EUROPE.CROSSOVER. 33-V4 Buy (5.00)% 20/06/2025 (1,677,000) (0.09)
45,000,000 EUR Goldman Sachs ITRAXX.EUROPE.MAIN. 33-V1 Buy (1.00)% 20/06/2025 (1,076,410) (0.06)
Total market Value on credit Default swap contracts – liabilities (6,565,948) (0.35)
net market Value on credit Default swap contracts – liabilities (6,565,948) (0.35)
Collateral received and paid by the Fund in respect of financial derivative instruments:
Type of collateral counterparty currency amount received amount paid
Euro strategic Bond fund
Cash BNP Paribas EUR 250,000 –Goldman Sachs EUR – 3,071,023 State Street EUR 310,000 –UBS EUR 270,000 –Westpac Banking EUR 975,570 –
1,805,570 3,071,023
DERIVaTIVEs (continued)
Over-the-counter (OTC) and exchange traded derivatives as at 31 December 2020, expressed in Euro.

157 Morgan Stanley Investment Funds 31 December 2020
The accompanying notes are an integral part of these financial statements.
Please refer to the full prospectus for the Fund’s investment objective and policy.
European Fixed Income Opportunities Fund
InVEsTmEnT aIm
To provide an attractive level of returns, measured in Euro, by primarily investing in Euro denominated Fixed Income Securities of corporate, government and government related issuers across a spectrum of fixed income asset classes including investment grade bonds, high-yield bonds, mortgage-backed securities, convertibles and currencies and subject to applicable law, in other asset-backed securities as well as loan participations and loan assignments to the extent that these instruments are securitised.
schEDUlE of InVEsTmEnTsAs at 31 December 2020
Investments Currency
Quantity/Nominal
Value
Market Value EUR
% of Net Assets
Transferable securities and money market instruments admitted to official exchange listing or dealt in on another regulated market
convertible Bonds
ItalyEni SpA, Reg. S 0% 13/04/2022 EUR 200,000 199,964 0.09 Nexi SpA, Reg. S 1.75% 24/04/2027 EUR 200,000 247,303 0.12
447,267 0.21
spainCellnex Telecom SA, Reg. S 0.75%
20/11/2031 EUR 500,000 481,830 0.23
481,830 0.23
Total convertible Bonds 929,097 0.44
corporate Bonds
australiaAurizon Network Pty. Ltd., Reg. S 3.125%
01/06/2026 EUR 600,000 688,588 0.33 Ausgrid Finance Pty. Ltd., Reg. S 1.25%
30/07/2025 EUR 550,000 578,749 0.28 AusNet Services Holdings Pty. Ltd., Reg. S
0.625% 25/08/2030 EUR 500,000 519,801 0.25 BHP Billiton Finance Ltd., Reg. S, FRN
4.75% 22/04/2076 EUR 1,050,000 1,064,280 0.51 Commonwealth Bank of Australia, Reg. S,
FRN 2% 22/04/2027 EUR 850,000 868,815 0.41 Glencore Finance Europe Ltd., Reg. S
1.75% 17/03/2025 EUR 650,000 686,419 0.33 Origin Energy Finance Ltd., Reg. S 1%
17/09/2029 EUR 500,000 500,610 0.24 Sydney Airport Finance Co. Pty. Ltd.,
Reg. S 1.75% 26/04/2028 EUR 100,000 108,753 0.05
5,016,015 2.40
austriaCA Immobilien Anlagen AG, Reg. S 1%
27/10/2025 EUR 100,000 101,888 0.05 Erste Group Bank AG, Reg. S, FRN 6.5%
Perpetual EUR 600,000 671,626 0.32 UNIQA Insurance Group AG, Reg. S
1.375% 09/07/2030 EUR 100,000 109,164 0.05 UNIQA Insurance Group AG, Reg. S, FRN
6.875% 31/07/2043 EUR 100,000 115,813 0.06 UNIQA Insurance Group AG, Reg. S, FRN
6% 27/07/2046 EUR 400,000 491,756 0.23
1,490,247 0.71
BelgiumAnheuser-Busch InBev SA/NV, Reg. S
2.75% 17/03/2036 EUR 150,000 189,371 0.09 Euroclear Investments SA, Reg. S, FRN
2.625% 11/04/2048 EUR 100,000 111,850 0.05 FLUVIUS System Operator CVBA, Reg. S
0.25% 02/12/2030 EUR 200,000 202,929 0.10 KBC Group NV, Reg. S, FRN 1.875%
11/03/2027 EUR 700,000 714,290 0.34 UCB SA, Reg. S 1.875% 02/04/2022 EUR 100,000 102,092 0.05
1,320,532 0.63

Morgan Stanley Investment Funds 31 December 2020 158
The accompanying notes are an integral part of these financial statements.
European Fixed Income Opportunities Fund (continued)
schEDUlE of InVEsTmEnTsAs at 31 December 2020
Investments Currency
Quantity/Nominal
Value
Market Value EUR
% of Net Assets
Transferable securities and money market instruments admitted to official exchange listing or dealt in on another regulated market
corporate Bonds (continued)
BrazilPetrobras Global Finance BV 6.75%
03/06/2050 USD 50,000 50,685 0.03
50,685 0.03
chinaBank of China Ltd., Reg. S 0.75%
12/07/2021 EUR 100,000 100,456 0.05 CGNPC International Ltd., Reg. S 1.625%
11/12/2024 EUR 600,000 626,778 0.30 China Development Bank, Reg. S 0%
27/10/2023 EUR 100,000 100,003 0.05 China Development Bank, Reg. S 0.375%
16/11/2021 EUR 500,000 502,125 0.24 China Merchants Bank Co. Ltd., Reg. S
0.25% 19/06/2022 EUR 200,000 199,320 0.09 CNAC HK Finbridge Co. Ltd., Reg. S
1.75% 14/06/2022 EUR 900,000 901,755 0.43 CNRC Capital Ltd., Reg. S 1.871%
07/12/2021 EUR 200,000 201,127 0.10 Prosus NV, Reg. S 3.68% 21/01/2030 USD 600,000 532,868 0.25 State Grid Europe Development 2014 plc,
Reg. S 1.5% 26/01/2022 EUR 100,000 101,547 0.05 State Grid Overseas Investment 2016 Ltd.,
Reg. S 0.797% 05/08/2026 EUR 500,000 510,543 0.24 Three Gorges Finance II Cayman Islands
Ltd., Reg. S 1.7% 10/06/2022 EUR 300,000 306,438 0.15 Triceratops Capital Co. Ltd., Reg. S
0.817% 25/01/2021 EUR 200,000 200,116 0.10 Zhenro Properties Group Ltd., Reg. S
7.35% 05/02/2025 USD 200,000 169,125 0.08
4,452,201 2.13
DenmarkCarlsberg Breweries A/S, Reg. S 0.375%
30/06/2027 EUR 750,000 762,510 0.37 Danske Bank A/S, Reg. S 0.875%
22/05/2023 EUR 100,000 102,054 0.05 Danske Bank A/S, Reg. S, FRN 1.375%
12/02/2030 EUR 800,000 813,452 0.39 Nykredit Realkredit A/S, Reg. S 4.125%
31/12/2164 EUR 600,000 633,975 0.30
2,311,991 1.11
finlandKojamo OYJ, Reg. S 1.625% 07/03/2025 EUR 125,000 131,697 0.06 Kojamo OYJ, Reg. S 1.875% 27/05/2027 EUR 500,000 540,853 0.26 Nordea Bank Abp, Reg. S, FRN 1%
07/09/2026 EUR 750,000 754,378 0.36 Sampo OYJ, Reg. S 2.5% 03/09/2052 EUR 500,000 542,288 0.26 Transmission Finance DAC, Reg. S 1.5%
24/05/2023 EUR 100,000 103,517 0.05
2,072,733 0.99
franceAeroports de Paris, Reg. S 2.75%
02/04/2030 EUR 400,000 486,782 0.23 Aeroports de Paris, Reg. S 1.5%
02/07/2032 EUR 100,000 111,591 0.05 Airbus SE, Reg. S 2.375% 07/04/2032 EUR 460,000 546,158 0.26
schEDUlE of InVEsTmEnTsAs at 31 December 2020
Investments Currency
Quantity/Nominal
Value
Market Value EUR
% of Net Assets
Transferable securities and money market instruments admitted to official exchange listing or dealt in on another regulated market
corporate Bonds (continued)
france (continued)Airbus SE, Reg. S 2.375% 09/06/2040 EUR 100,000 119,537 0.06 APRR SA, Reg. S 1.25% 14/01/2027 EUR 100,000 108,224 0.05 AXA SA, Reg. S, FRN 3.25% 28/05/2049 EUR 1,000,000 1,171,833 0.56 BEL SA, Reg. S 1.5% 18/04/2024 EUR 100,000 103,601 0.05 BNP Paribas Cardif SA, Reg. S 1%
29/11/2024 EUR 100,000 102,719 0.05 BNP Paribas Cardif SA, Reg. S, FRN
4.032% Perpetual EUR 600,000 682,125 0.33 BNP Paribas SA, Reg. S, FRN 1.125%
17/04/2029 EUR 100,000 105,683 0.05 BNP Paribas SA, Reg. S 2.375%
17/02/2025 EUR 200,000 215,518 0.10 BNP Paribas SA, Reg. S, FRN 2.875%
20/03/2026 EUR 600,000 603,586 0.29 BNP Paribas SA, Reg. S, FRN 2.625%
14/10/2027 EUR 100,000 104,010 0.05 Bureau Veritas SA, Reg. S 1.875%
06/01/2025 EUR 100,000 106,412 0.05 CNP Assurances, Reg. S, FRN 6.875%
30/09/2041 EUR 1,000,000 1,050,936 0.50 Credit Agricole Assurances SA, Reg. S,
FRN 4.5% Perpetual EUR 800,000 917,500 0.44 Engie SA, Reg. S, FRN 3.25% Perpetual EUR 900,000 989,089 0.47 EssilorLuxottica SA, Reg. S 0.125%
27/05/2025 EUR 100,000 100,993 0.05 Indigo Group SAS, Reg. S 1.625%
19/04/2028 EUR 100,000 103,557 0.05 Klepierre SA, REIT, Reg. S 2%
12/05/2029 EUR 100,000 112,092 0.05 Orange SA, Reg. S 0.125% 16/09/2029 EUR 800,000 806,641 0.39 Rexel SA, Reg. S 2.75% 15/06/2026 EUR 500,000 511,663 0.24 RTE Reseau de Transport d’Electricite
SADIR, Reg. S 0.625% 08/07/2032 EUR 500,000 522,515 0.25 SCOR SE, Reg. S, FRN 3% 08/06/2046 EUR 600,000 678,750 0.32 SEB SA, Reg. S 1.375% 16/06/2025 EUR 500,000 515,997 0.25 Societe Generale SA 1% 24/11/2030 EUR 100,000 100,355 0.05 Sogecap SA, Reg. S, FRN 4.125%
Perpetual EUR 700,000 784,000 0.38 Total Capital International SA, Reg. S
1.491% 08/04/2027 EUR 600,000 658,338 0.32 Total Capital International SA, Reg. S
1.994% 08/04/2032 EUR 100,000 119,855 0.06 TOTAL SE, Reg. S, FRN 3.369% Perpetual EUR 200,000 225,375 0.11 TOTAL SE, Reg. S, FRN 3.875% Perpetual EUR 200,000 209,875 0.10 Unibail-Rodamco-Westfield SE, REIT, Reg. S
2.625% 09/04/2030 EUR 100,000 113,869 0.05 Unibail-Rodamco-Westfield SE, REIT,
Reg. S, FRN 2.125% Perpetual EUR 500,000 471,250 0.23
13,560,429 6.49
Germanyadidas AG, Reg. S 0% 09/09/2024 EUR 500,000 504,336 0.24 ADLER Group SA, Reg. S 2.75%
13/11/2026 EUR 100,000 102,687 0.05 Allianz SE, Reg. S, FRN 2.121%
08/07/2050 EUR 500,000 548,719 0.26 Bayer AG, Reg. S 0.375% 06/07/2024 EUR 100,000 101,435 0.05 Bayer AG, Reg. S 1.375% 06/07/2032 EUR 100,000 106,937 0.05 Bayer AG, Reg. S, FRN 3.125%
12/11/2079 EUR 600,000 631,515 0.30 Commerzbank AG, Reg. S, FRN 4%
05/12/2030 EUR 100,000 109,588 0.05 Commerzbank AG 7.75% 16/03/2021 EUR 1,300,000 1,318,816 0.63 Continental AG 2.5% 27/08/2026 EUR 25,000 27,939 0.01

159 Morgan Stanley Investment Funds 31 December 2020
The accompanying notes are an integral part of these financial statements.
European Fixed Income Opportunities Fund (continued)
schEDUlE of InVEsTmEnTsAs at 31 December 2020
Investments Currency
Quantity/Nominal
Value
Market Value EUR
% of Net Assets
Transferable securities and money market instruments admitted to official exchange listing or dealt in on another regulated market
corporate Bonds (continued)
Germany (continued)Daimler International Finance BV, Reg. S
0.25% 06/11/2023 EUR 725,000 730,608 0.35 Deutsche Bank AG, Reg. S 0.375%
18/01/2021 EUR 200,000 200,044 0.10 EnBW Energie Baden-Wuerttemberg AG,
Reg. S, FRN 3.625% 02/04/2076 EUR 500,000 504,250 0.24 Grand City Properties SA, Reg. S 1.375%
03/08/2026 EUR 100,000 106,578 0.05 Grand City Properties SA, Reg. S, FRN
2.5% Perpetual EUR 100,000 103,250 0.05 Muenchener Rueckversicherungs-
Gesellschaft AG, Reg. S 1.25% 26/05/2041 EUR 100,000 104,032 0.05
Muenchener Rueckversicherungs-Gesellschaft AG, Reg. S, FRN 6% 26/05/2041 EUR 1,000,000 1,023,172 0.49
Siemens Financieringsmaatschappij NV, Reg. S 0.25% 05/06/2024 EUR 100,000 101,789 0.05
Techem Verwaltungsgesellschaft 675 mbH, Reg. S 2% 15/07/2025 EUR 500,000 498,425 0.24
Volkswagen International Finance NV, Reg. S, FRN 3.75% Perpetual EUR 600,000 604,354 0.29
Volkswagen International Finance NV, Reg. S, FRN 4.625% Perpetual EUR 225,000 250,425 0.12
Vonovia Finance BV, Reg. S, FRN 4% Perpetual EUR 600,000 621,236 0.30
Wintershall Dea Finance BV, Reg. S 1.332% 25/09/2028 EUR 500,000 518,189 0.25
8,818,324 4.22
GreeceOTE plc, Reg. S 0.875% 24/09/2026 EUR 850,000 881,263 0.42
881,263 0.42
hong KongCheung Kong Infrastructure Finance BVI
Ltd., Reg. S 1% 12/12/2024 EUR 500,000 507,300 0.24
507,300 0.24
IcelandArion Banki HF, Reg. S 1% 20/03/2023 EUR 100,000 101,525 0.05 Arion Banki HF, Reg. S 1.625%
01/12/2021 EUR 924,000 939,688 0.45 Landsbankinn HF, Reg. S 1% 30/05/2023 EUR 100,000 101,775 0.05 Landsbankinn HF, Reg. S 0.5%
20/05/2024 EUR 750,000 749,861 0.36 Landsbankinn HF, Reg. S 1.625%
15/03/2021 EUR 150,000 150,551 0.07
2,043,400 0.98
IndiaNeerg Energy Ltd., Reg. S 6%
13/02/2022 USD 2,500,000 2,075,787 0.99 NTPC Ltd., Reg. S 2.75% 01/02/2027 EUR 100,000 106,346 0.05 ONGC Videsh Ltd., Reg. S 2.75%
15/07/2021 EUR 200,000 202,570 0.10
2,384,703 1.14
schEDUlE of InVEsTmEnTsAs at 31 December 2020
Investments Currency
Quantity/Nominal
Value
Market Value EUR
% of Net Assets
Transferable securities and money market instruments admitted to official exchange listing or dealt in on another regulated market
corporate Bonds (continued)
IndonesiaPerusahaan Perseroan Persero PT
Perusahaan Listrik Negara, Reg. S 2.875% 25/10/2025 EUR 100,000 108,171 0.05
108,171 0.05
IrelandBank of Ireland Group plc, Reg. S, FRN
0.75% 08/07/2024 EUR 600,000 609,978 0.29 Dell Bank International DAC, Reg. S
0.625% 17/10/2022 EUR 750,000 757,133 0.36 eircom Finance DAC, Reg. S 1.75%
01/11/2024 EUR 100,000 98,593 0.05 GAS Networks Ireland, Reg. S 0.125%
04/12/2024 EUR 100,000 100,800 0.05 Ryanair DAC, Reg. S 2.875% 15/09/2025 EUR 400,000 428,683 0.20 Ryanair DAC, Reg. S 1.125% 15/08/2023 EUR 100,000 100,875 0.05
2,096,062 1.00
IsraelTeva Pharmaceutical Finance Netherlands II
BV, Reg. S 1.125% 15/10/2024 EUR 400,000 372,540 0.18
372,540 0.18
Italy2i Rete Gas SpA, Reg. S 1.608%
31/10/2027 EUR 150,000 162,702 0.08 Assicurazioni Generali SpA, Reg. S 2.429%
14/07/2031 EUR 300,000 329,238 0.16 Assicurazioni Generali SpA, Reg. S, FRN
5.5% 27/10/2047 EUR 550,000 678,975 0.32 CDP Reti SpA, Reg. S 1.875%
29/05/2022 EUR 100,000 102,192 0.05 Enel Finance International NV, Reg. S 0%
17/06/2024 EUR 100,000 100,557 0.05 Enel SpA, Reg. S, FRN 2.5%
24/11/2078 EUR 1,050,000 1,098,562 0.53 FCA Bank SpA, Reg. S 0.5%
18/09/2023 EUR 100,000 101,007 0.05 Intesa Sanpaolo SpA, Reg. S 0.75%
04/12/2024 EUR 600,000 615,826 0.29 Intesa Sanpaolo SpA, Reg. S, FRN 6.25%
Perpetual EUR 600,000 655,351 0.31 Telecom Italia SpA, Reg. S 3.625%
19/01/2024 EUR 100,000 107,375 0.05 Telecom Italia SpA, Reg. S 2.375%
12/10/2027 EUR 500,000 521,915 0.25 UniCredit SpA, Reg. S, FRN 5.375%
Perpetual EUR 200,000 204,600 0.10 UniCredit SpA, Reg. S, FRN 4.375%
03/01/2027 EUR 1,000,000 1,037,597 0.50
5,715,897 2.74
JapanAsahi Group Holdings Ltd., Reg. S 0.541%
23/10/2028 EUR 500,000 508,529 0.24 Nissan Motor Co. Ltd., Reg. S 1.94%
15/09/2023 EUR 100,000 104,300 0.05
612,829 0.29

Morgan Stanley Investment Funds 31 December 2020 160
The accompanying notes are an integral part of these financial statements.
European Fixed Income Opportunities Fund (continued)
schEDUlE of InVEsTmEnTsAs at 31 December 2020
Investments Currency
Quantity/Nominal
Value
Market Value EUR
% of Net Assets
Transferable securities and money market instruments admitted to official exchange listing or dealt in on another regulated market
corporate Bonds (continued)
luxembourgBlackstone Property Partners Europe
Holdings Sarl, Reg. S 1.25% 26/04/2027 EUR 350,000 358,962 0.17
Blackstone Property Partners Europe Holdings Sarl, Reg. S 2% 15/02/2024 EUR 100,000 104,990 0.05
Eurofins Scientific SE, Reg. S, FRN 4.875% Perpetual EUR 600,000 649,353 0.31
INEOS Finance plc, Reg. S 2.125% 15/11/2025 EUR 600,000 594,513 0.29
Logicor Financing Sarl, Reg. S 1.5% 13/07/2026 EUR 100,000 105,644 0.05
Logicor Financing Sarl, Reg. S 1.5% 14/11/2022 EUR 150,000 153,738 0.07
SELP Finance Sarl, REIT, Reg. S 1.5% 20/12/2026 EUR 500,000 537,321 0.26
2,504,521 1.20
mexicoFomento Economico Mexicano SAB de CV,
Reg. S 1.75% 20/03/2023 EUR 100,000 104,073 0.05 Petroleos Mexicanos, Reg. S 3.75%
21/02/2024 EUR 200,000 203,208 0.10 Petroleos Mexicanos, Reg. S 2.5%
21/08/2021 EUR 275,000 276,097 0.13 PLA Administradora Industrial S de RL
de CV, REIT, Reg. S 5.25% 10/11/2022 USD 900,000 747,114 0.36
1,330,492 0.64
netherlandsABN AMRO Bank NV, Reg. S 4.375%
Perpetual EUR 600,000 639,119 0.31 Aegon Bank NV, Reg. S 0.01%
16/11/2057 EUR 100,000 101,878 0.05 ASR Nederland NV, Reg. S, FRN 4.625%
Perpetual EUR 600,000 651,225 0.31 ASR Nederland NV, Reg. S, FRN 5.125%
29/09/2045 EUR 315,000 375,637 0.18 Cooperatieve Rabobank UA, Reg. S, FRN
4.625% Perpetual EUR 600,000 656,250 0.31 Cooperatieve Rabobank UA, Reg. S, FRN
6.625% Perpetual EUR 200,000 205,860 0.10 de Volksbank NV, Reg. S 1.75%
22/10/2030 EUR 900,000 950,795 0.45 ING Bank NV, Reg. S, FRN 3.625%
25/02/2026 EUR 1,000,000 1,005,230 0.48 ING Groep NV, Reg. S, FRN 1.625%
26/09/2029 EUR 300,000 311,663 0.15 Nationale-Nederlanden Bank NV (The)
Netherlands, Reg. S 0.375% 31/05/2023 EUR 100,000 101,444 0.05
NN Group NV, Reg. S, FRN 4.625% 08/04/2044 EUR 1,000,000 1,126,500 0.54
Q-Park Holding I BV, Reg. S 1.5% 01/03/2025 EUR 100,000 96,836 0.05
Shell International Finance BV, Reg. S 1.875% 07/04/2032 EUR 100,000 117,670 0.06
Shell International Finance BV, Reg. S 1.25% 11/11/2032 EUR 100,000 110,751 0.05
Signify NV, Reg. S 2% 11/05/2024 EUR 750,000 793,560 0.38 Signify NV, Reg. S 2.375% 11/05/2027 EUR 100,000 110,966 0.05 Stedin Holding NV, Reg. S, FRN 3.25%
Perpetual EUR 750,000 769,875 0.37
schEDUlE of InVEsTmEnTsAs at 31 December 2020
Investments Currency
Quantity/Nominal
Value
Market Value EUR
% of Net Assets
Transferable securities and money market instruments admitted to official exchange listing or dealt in on another regulated market
corporate Bonds (continued)
netherlands (continued)United Group BV, Reg. S 3.125%
15/02/2026 EUR 550,000 540,375 0.26 UPC Holding BV, Reg. S 3.875%
15/06/2029 EUR 500,000 515,000 0.25 Vesteda Finance BV, Reg. S 2.5%
27/10/2022 EUR 100,000 104,045 0.05
9,284,679 4.45
PolandPowszechna Kasa Oszczednosci Bank
Polski SA, Reg. S 0.75% 25/07/2021 EUR 100,000 100,451 0.05
100,451 0.05
PortugalBrisa-Concessao Rodoviaria SA, Reg. S
2.375% 10/05/2027 EUR 100,000 113,165 0.06 Brisa-Concessao Rodoviaria SA, Reg. S
1.875% 30/04/2025 EUR 100,000 107,959 0.05 Caixa Geral de Depositos SA, Reg. S
1.25% 25/11/2024 EUR 1,000,000 1,027,950 0.49 EDP - Energias de Portugal SA, Reg. S,
FRN 1.7% 20/07/2080 EUR 1,000,000 998,810 0.48
2,247,884 1.08
saudi arabiaSaudi Arabian Oil Co., Reg. S 3.25%
24/11/2050 USD 200,000 165,265 0.08
165,265 0.08
singaporeDBS Group Holdings Ltd., Reg. S, FRN
1.5% 11/04/2028 EUR 800,000 817,037 0.39
817,037 0.39
south KoreaExport-Import Bank of Korea 0%
21/09/2023 EUR 100,000 100,675 0.05 Export-Import Bank of Korea, Reg. S
0.829% 27/04/2025 EUR 100,000 104,334 0.05 Korea Housing Finance Corp., Reg. S
0.75% 30/10/2023 EUR 750,000 770,933 0.37
975,942 0.47
spainAbertis Infraestructuras Finance BV, Reg. S
3.248% 31/12/2164 EUR 300,000 311,775 0.15 Amadeus IT Group SA, Reg. S 1.875%
24/09/2028 EUR 100,000 106,834 0.05 Banco Bilbao Vizcaya Argentaria SA,
Reg. S 0.75% 04/06/2025 EUR 500,000 519,533 0.25 Banco Bilbao Vizcaya Argentaria SA,
Reg. S, FRN 1% 16/01/2030 EUR 200,000 200,055 0.09 Banco Bilbao Vizcaya Argentaria SA,
Reg. S 6% Perpetual EUR 600,000 645,300 0.31 Banco Santander SA, Reg. S 3.125%
19/01/2027 EUR 900,000 1,029,336 0.49

161 Morgan Stanley Investment Funds 31 December 2020
The accompanying notes are an integral part of these financial statements.
European Fixed Income Opportunities Fund (continued)
schEDUlE of InVEsTmEnTsAs at 31 December 2020
Investments Currency
Quantity/Nominal
Value
Market Value EUR
% of Net Assets
Transferable securities and money market instruments admitted to official exchange listing or dealt in on another regulated market
corporate Bonds (continued)
spain (continued)Bankia SA, Reg. S 0.75% 09/07/2026 EUR 100,000 103,190 0.05 CaixaBank SA, Reg. S, FRN 3.5%
15/02/2027 EUR 2,000,000 2,063,032 0.99 CaixaBank SA, Reg. S, FRN 6.75%
Perpetual EUR 800,000 886,599 0.42 Cellnex Telecom SA 1.875% 26/06/2029 EUR 500,000 514,644 0.25 Corp. de Reservas Estrategicas
de Productos Petroliferos Cores, Reg. S 1.75% 24/11/2027 EUR 100,000 112,161 0.05
Grifols SA, Reg. S 2.25% 15/11/2027 EUR 100,000 101,635 0.05 Iberdrola International BV, Reg. S, FRN
1.875% Perpetual EUR 200,000 205,625 0.10 Iberdrola International BV, Reg. S, FRN
3.25% Perpetual EUR 800,000 878,107 0.42 IE2 Holdco SAU, Reg. S 2.875%
01/06/2026 EUR 200,000 227,603 0.11 Inmobiliaria Colonial Socimi SA, REIT,
Reg. S 2% 17/04/2026 EUR 500,000 538,614 0.26 Inmobiliaria Colonial Socimi SA, REIT,
Reg. S 1.45% 28/10/2024 EUR 100,000 104,463 0.05 Lorca Telecom Bondco SA, Reg. S 4%
18/09/2027 EUR 600,000 633,240 0.30 Madrilena Red de Gas Finance BV, Reg. S
1.375% 11/04/2025 EUR 100,000 103,482 0.05 NorteGas Energia Distribucion SA, Reg. S
0.918% 28/09/2022 EUR 100,000 101,161 0.05 Prosegur Cia de Seguridad SA, Reg. S 1%
08/02/2023 EUR 100,000 101,822 0.05 Redexis Gas Finance BV, Reg. S 1.875%
28/05/2025 EUR 800,000 853,000 0.41 Redexis Gas Finance BV, Reg. S 1.875%
27/04/2027 EUR 100,000 108,892 0.05 Repsol International Finance BV, Reg. S,
FRN 4.5% 25/03/2075 EUR 600,000 659,718 0.32 Telefonica Europe BV, Reg. S, FRN 2.502%
Perpetual EUR 900,000 920,082 0.44 Telefonica Europe BV, Reg. S, FRN 4.375%
Perpetual EUR 100,000 108,819 0.05 Telefonica Europe BV, Reg. S, FRN 5.875%
Perpetual EUR 200,000 225,355 0.11
12,364,077 5.92
supra-nationalEuropean Stability Mechanism, Reg. S 0%
16/12/2024 EUR 1,050,000 1,076,154 0.52 European Union, Reg. S 0% 04/10/2030 EUR 860,000 896,198 0.43 European Union, Reg. S 0% 04/07/2035 EUR 230,000 236,443 0.11
2,208,795 1.06
swedenAkelius Residential Property AB, Reg. S
1.5% 23/01/2022 EUR 100,000 101,787 0.05 Akelius Residential Property Financing BV,
Reg. S 1% 17/01/2028 EUR 500,000 516,035 0.24 Intrum AB, Reg. S 2.75% 15/07/2022 EUR 250,000 251,245 0.12 Intrum AB, Reg. S 3.125% 15/07/2024 EUR 100,000 100,532 0.05
969,599 0.46
schEDUlE of InVEsTmEnTsAs at 31 December 2020
Investments Currency
Quantity/Nominal
Value
Market Value EUR
% of Net Assets
Transferable securities and money market instruments admitted to official exchange listing or dealt in on another regulated market
corporate Bonds (continued)
switzerlandCredit Suisse Group AG, Reg. S, FRN
3.25% 02/04/2026 EUR 450,000 509,146 0.25 Lonza Finance International NV, Reg. S
1.625% 21/04/2027 EUR 100,000 109,637 0.05 Syngenta Finance NV, Reg. S 3.375%
16/04/2026 EUR 500,000 540,917 0.26 UBS Group AG, Reg. S, FRN 1.25%
17/04/2025 EUR 800,000 833,757 0.40
1,993,457 0.96
TurkeyTurkiye Vakiflar Bankasi TAO, Reg. S
5.625% 30/05/2022 USD 200,000 164,994 0.08
164,994 0.08
UkraineVF Ukraine PAT, 144A 6.2% 11/02/2025 USD 200,000 171,973 0.08
171,973 0.08
United arab EmiratesEmirates NBD Bank PJSC, Reg. S 1.75%
23/03/2022 EUR 100,000 101,956 0.05
101,956 0.05
United KingdomAnnington Funding plc, Reg. S 1.65%
12/07/2024 EUR 500,000 525,187 0.25 Aviva plc, Reg. S, FRN 3.875%
03/07/2044 EUR 300,000 333,956 0.16 Barclays plc, Reg. S, FRN 3.375%
02/04/2025 EUR 600,000 662,487 0.32 BP Capital Markets plc, Reg. S 3.625%
Perpetual EUR 500,000 548,125 0.26 BP Capital Markets plc, Reg. S 2.822%
07/04/2032 EUR 300,000 379,454 0.18 BP Capital Markets plc, Reg. S, FRN
3.25% Perpetual EUR 100,000 106,875 0.05 Centrica plc, Reg. S, FRN 3% 10/04/2076 EUR 100,000 100,702 0.05 CK Hutchison Finance 16 Ltd., Reg. S
1.25% 06/04/2023 EUR 100,000 102,773 0.05 CK Hutchison Group Telecom Finance SA,
Reg. S 0.375% 17/10/2023 EUR 100,000 100,991 0.05 DS Smith plc, Reg. S 0.875%
12/09/2026 EUR 500,000 510,847 0.24 DS Smith plc, Reg. S 2.25% 16/09/2022 EUR 100,000 103,381 0.05 FCE Bank plc, Reg. S 0.869% 13/09/2021 EUR 100,000 99,950 0.05 Heathrow Funding Ltd., Reg. S 1.5%
12/10/2027 EUR 100,000 104,724 0.05 HSBC Holdings plc, Reg. S 0.309%
13/11/2026 EUR 100,000 101,306 0.05 HSBC Holdings plc, Reg. S 0.77%
13/11/2031 EUR 100,000 103,675 0.05 HSBC Holdings plc, Reg. S 3%
30/06/2025 EUR 200,000 224,152 0.11 HSBC Holdings plc, Reg. S, FRN 5.25%
Perpetual EUR 600,000 627,750 0.30 Lloyds Banking Group plc, Reg. S, FRN
3.5% 01/04/2026 EUR 100,000 113,818 0.05
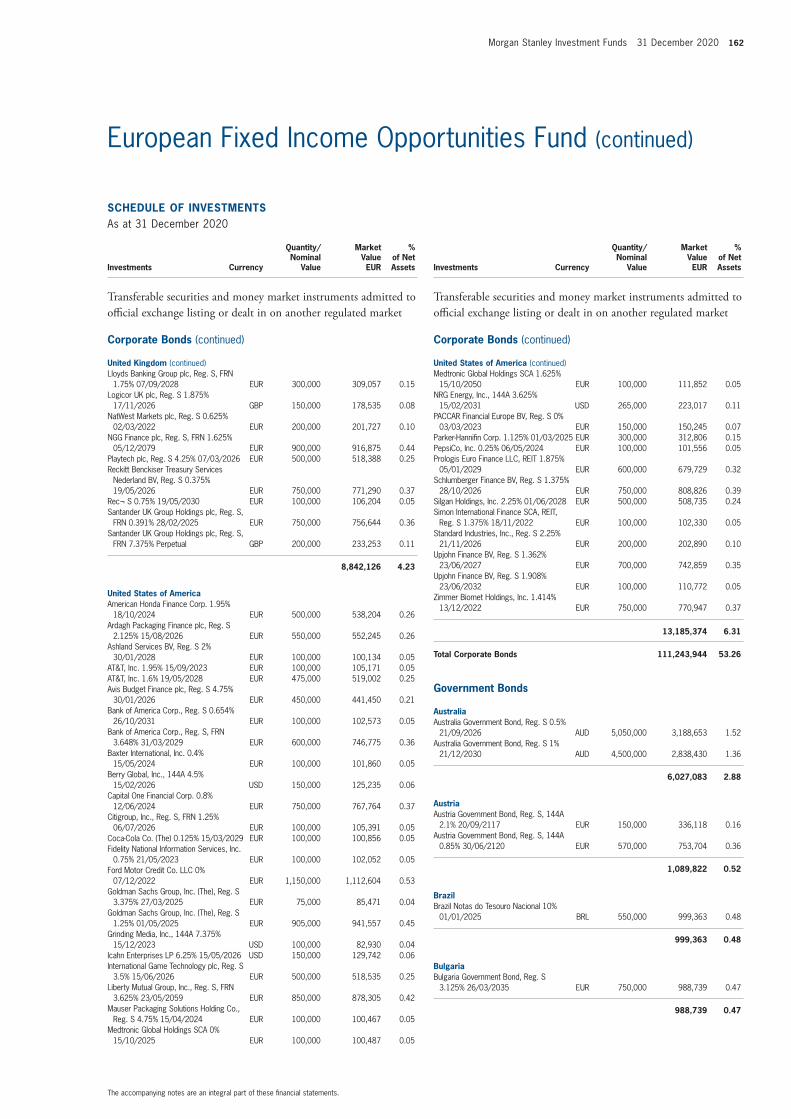
Morgan Stanley Investment Funds 31 December 2020 162
The accompanying notes are an integral part of these financial statements.
European Fixed Income Opportunities Fund (continued)
schEDUlE of InVEsTmEnTsAs at 31 December 2020
Investments Currency
Quantity/Nominal
Value
Market Value EUR
% of Net Assets
Transferable securities and money market instruments admitted to official exchange listing or dealt in on another regulated market
corporate Bonds (continued)
United Kingdom (continued)Lloyds Banking Group plc, Reg. S, FRN
1.75% 07/09/2028 EUR 300,000 309,057 0.15 Logicor UK plc, Reg. S 1.875%
17/11/2026 GBP 150,000 178,535 0.08 NatWest Markets plc, Reg. S 0.625%
02/03/2022 EUR 200,000 201,727 0.10 NGG Finance plc, Reg. S, FRN 1.625%
05/12/2079 EUR 900,000 916,875 0.44 Playtech plc, Reg. S 4.25% 07/03/2026 EUR 500,000 518,388 0.25 Reckitt Benckiser Treasury Services
Nederland BV, Reg. S 0.375% 19/05/2026 EUR 750,000 771,290 0.37
Rec¬ S 0.75% 19/05/2030 EUR 100,000 106,204 0.05 Santander UK Group Holdings plc, Reg. S,
FRN 0.391% 28/02/2025 EUR 750,000 756,644 0.36 Santander UK Group Holdings plc, Reg. S,
FRN 7.375% Perpetual GBP 200,000 233,253 0.11
8,842,126 4.23
United states of americaAmerican Honda Finance Corp. 1.95%
18/10/2024 EUR 500,000 538,204 0.26 Ardagh Packaging Finance plc, Reg. S
2.125% 15/08/2026 EUR 550,000 552,245 0.26 Ashland Services BV, Reg. S 2%
30/01/2028 EUR 100,000 100,134 0.05 AT&T, Inc. 1.95% 15/09/2023 EUR 100,000 105,171 0.05 AT&T, Inc. 1.6% 19/05/2028 EUR 475,000 519,002 0.25 Avis Budget Finance plc, Reg. S 4.75%
30/01/2026 EUR 450,000 441,450 0.21 Bank of America Corp., Reg. S 0.654%
26/10/2031 EUR 100,000 102,573 0.05 Bank of America Corp., Reg. S, FRN
3.648% 31/03/2029 EUR 600,000 746,775 0.36 Baxter International, Inc. 0.4%
15/05/2024 EUR 100,000 101,860 0.05 Berry Global, Inc., 144A 4.5%
15/02/2026 USD 150,000 125,235 0.06 Capital One Financial Corp. 0.8%
12/06/2024 EUR 750,000 767,764 0.37 Citigroup, Inc., Reg. S, FRN 1.25%
06/07/2026 EUR 100,000 105,391 0.05 Coca-Cola Co. (The) 0.125% 15/03/2029 EUR 100,000 100,856 0.05 Fidelity National Information Services, Inc.
0.75% 21/05/2023 EUR 100,000 102,052 0.05 Ford Motor Credit Co. LLC 0%
07/12/2022 EUR 1,150,000 1,112,604 0.53 Goldman Sachs Group, Inc. (The), Reg. S
3.375% 27/03/2025 EUR 75,000 85,471 0.04 Goldman Sachs Group, Inc. (The), Reg. S
1.25% 01/05/2025 EUR 905,000 941,557 0.45 Grinding Media, Inc., 144A 7.375%
15/12/2023 USD 100,000 82,930 0.04 Icahn Enterprises LP 6.25% 15/05/2026 USD 150,000 129,742 0.06 International Game Technology plc, Reg. S
3.5% 15/06/2026 EUR 500,000 518,535 0.25 Liberty Mutual Group, Inc., Reg. S, FRN
3.625% 23/05/2059 EUR 850,000 878,305 0.42 Mauser Packaging Solutions Holding Co.,
Reg. S 4.75% 15/04/2024 EUR 100,000 100,467 0.05 Medtronic Global Holdings SCA 0%
15/10/2025 EUR 100,000 100,487 0.05
schEDUlE of InVEsTmEnTsAs at 31 December 2020
Investments Currency
Quantity/Nominal
Value
Market Value EUR
% of Net Assets
Transferable securities and money market instruments admitted to official exchange listing or dealt in on another regulated market
corporate Bonds (continued)
United states of america (continued)Medtronic Global Holdings SCA 1.625%
15/10/2050 EUR 100,000 111,852 0.05 NRG Energy, Inc., 144A 3.625%
15/02/2031 USD 265,000 223,017 0.11 PACCAR Financial Europe BV, Reg. S 0%
03/03/2023 EUR 150,000 150,245 0.07 Parker-Hannifin Corp. 1.125% 01/03/2025 EUR 300,000 312,806 0.15 PepsiCo, Inc. 0.25% 06/05/2024 EUR 100,000 101,556 0.05 Prologis Euro Finance LLC, REIT 1.875%
05/01/2029 EUR 600,000 679,729 0.32 Schlumberger Finance BV, Reg. S 1.375%
28/10/2026 EUR 750,000 808,826 0.39 Silgan Holdings, Inc. 2.25% 01/06/2028 EUR 500,000 508,735 0.24 Simon International Finance SCA, REIT,
Reg. S 1.375% 18/11/2022 EUR 100,000 102,330 0.05 Standard Industries, Inc., Reg. S 2.25%
21/11/2026 EUR 200,000 202,890 0.10 Upjohn Finance BV, Reg. S 1.362%
23/06/2027 EUR 700,000 742,859 0.35 Upjohn Finance BV, Reg. S 1.908%
23/06/2032 EUR 100,000 110,772 0.05 Zimmer Biomet Holdings, Inc. 1.414%
13/12/2022 EUR 750,000 770,947 0.37
13,185,374 6.31
Total corporate Bonds 111,243,944 53.26
Government Bonds
australiaAustralia Government Bond, Reg. S 0.5%
21/09/2026 AUD 5,050,000 3,188,653 1.52 Australia Government Bond, Reg. S 1%
21/12/2030 AUD 4,500,000 2,838,430 1.36
6,027,083 2.88
austriaAustria Government Bond, Reg. S, 144A
2.1% 20/09/2117 EUR 150,000 336,118 0.16 Austria Government Bond, Reg. S, 144A
0.85% 30/06/2120 EUR 570,000 753,704 0.36
1,089,822 0.52
BrazilBrazil Notas do Tesouro Nacional 10%
01/01/2025 BRL 550,000 999,363 0.48
999,363 0.48
BulgariaBulgaria Government Bond, Reg. S
3.125% 26/03/2035 EUR 750,000 988,739 0.47
988,739 0.47
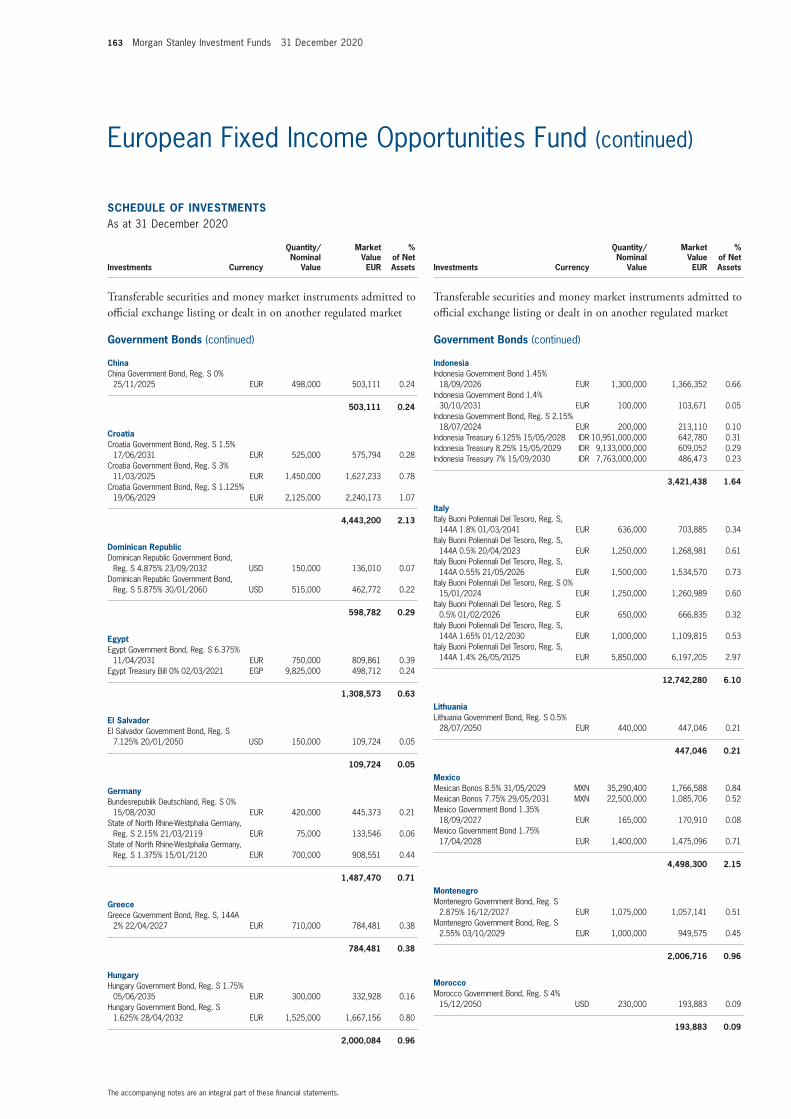
163 Morgan Stanley Investment Funds 31 December 2020
The accompanying notes are an integral part of these financial statements.
European Fixed Income Opportunities Fund (continued)
schEDUlE of InVEsTmEnTsAs at 31 December 2020
Investments Currency
Quantity/Nominal
Value
Market Value EUR
% of Net Assets
Transferable securities and money market instruments admitted to official exchange listing or dealt in on another regulated market
Government Bonds (continued)
chinaChina Government Bond, Reg. S 0%
25/11/2025 EUR 498,000 503,111 0.24
503,111 0.24
croatiaCroatia Government Bond, Reg. S 1.5%
17/06/2031 EUR 525,000 575,794 0.28 Croatia Government Bond, Reg. S 3%
11/03/2025 EUR 1,450,000 1,627,233 0.78 Croatia Government Bond, Reg. S 1.125%
19/06/2029 EUR 2,125,000 2,240,173 1.07
4,443,200 2.13
Dominican RepublicDominican Republic Government Bond,
Reg. S 4.875% 23/09/2032 USD 150,000 136,010 0.07 Dominican Republic Government Bond,
Reg. S 5.875% 30/01/2060 USD 515,000 462,772 0.22
598,782 0.29
EgyptEgypt Government Bond, Reg. S 6.375%
11/04/2031 EUR 750,000 809,861 0.39 Egypt Treasury Bill 0% 02/03/2021 EGP 9,825,000 498,712 0.24
1,308,573 0.63
El salvadorEl Salvador Government Bond, Reg. S
7.125% 20/01/2050 USD 150,000 109,724 0.05
109,724 0.05
GermanyBundesrepublik Deutschland, Reg. S 0%
15/08/2030 EUR 420,000 445,373 0.21 State of North Rhine-Westphalia Germany,
Reg. S 2.15% 21/03/2119 EUR 75,000 133,546 0.06 State of North Rhine-Westphalia Germany,
Reg. S 1.375% 15/01/2120 EUR 700,000 908,551 0.44
1,487,470 0.71
GreeceGreece Government Bond, Reg. S, 144A
2% 22/04/2027 EUR 710,000 784,481 0.38
784,481 0.38
hungaryHungary Government Bond, Reg. S 1.75%
05/06/2035 EUR 300,000 332,928 0.16 Hungary Government Bond, Reg. S
1.625% 28/04/2032 EUR 1,525,000 1,667,156 0.80
2,000,084 0.96
schEDUlE of InVEsTmEnTsAs at 31 December 2020
Investments Currency
Quantity/Nominal
Value
Market Value EUR
% of Net Assets
Transferable securities and money market instruments admitted to official exchange listing or dealt in on another regulated market
Government Bonds (continued)
IndonesiaIndonesia Government Bond 1.45%
18/09/2026 EUR 1,300,000 1,366,352 0.66 Indonesia Government Bond 1.4%
30/10/2031 EUR 100,000 103,671 0.05 Indonesia Government Bond, Reg. S 2.15%
18/07/2024 EUR 200,000 213,110 0.10 Indonesia Treasury 6.125% 15/05/2028 IDR 10,951,000,000 642,780 0.31 Indonesia Treasury 8.25% 15/05/2029 IDR 9,133,000,000 609,052 0.29 Indonesia Treasury 7% 15/09/2030 IDR 7,763,000,000 486,473 0.23
3,421,438 1.64
ItalyItaly Buoni Poliennali Del Tesoro, Reg. S,
144A 1.8% 01/03/2041 EUR 636,000 703,885 0.34 Italy Buoni Poliennali Del Tesoro, Reg. S,
144A 0.5% 20/04/2023 EUR 1,250,000 1,268,981 0.61 Italy Buoni Poliennali Del Tesoro, Reg. S,
144A 0.55% 21/05/2026 EUR 1,500,000 1,534,570 0.73 Italy Buoni Poliennali Del Tesoro, Reg. S 0%
15/01/2024 EUR 1,250,000 1,260,989 0.60 Italy Buoni Poliennali Del Tesoro, Reg. S
0.5% 01/02/2026 EUR 650,000 666,835 0.32 Italy Buoni Poliennali Del Tesoro, Reg. S,
144A 1.65% 01/12/2030 EUR 1,000,000 1,109,815 0.53 Italy Buoni Poliennali Del Tesoro, Reg. S,
144A 1.4% 26/05/2025 EUR 5,850,000 6,197,205 2.97
12,742,280 6.10
lithuaniaLithuania Government Bond, Reg. S 0.5%
28/07/2050 EUR 440,000 447,046 0.21
447,046 0.21
mexicoMexican Bonos 8.5% 31/05/2029 MXN 35,290,400 1,766,588 0.84 Mexican Bonos 7.75% 29/05/2031 MXN 22,500,000 1,085,706 0.52 Mexico Government Bond 1.35%
18/09/2027 EUR 165,000 170,910 0.08 Mexico Government Bond 1.75%
17/04/2028 EUR 1,400,000 1,475,096 0.71
4,498,300 2.15
montenegroMontenegro Government Bond, Reg. S
2.875% 16/12/2027 EUR 1,075,000 1,057,141 0.51 Montenegro Government Bond, Reg. S
2.55% 03/10/2029 EUR 1,000,000 949,575 0.45
2,006,716 0.96
moroccoMorocco Government Bond, Reg. S 4%
15/12/2050 USD 230,000 193,883 0.09
193,883 0.09

Morgan Stanley Investment Funds 31 December 2020 164
The accompanying notes are an integral part of these financial statements.
European Fixed Income Opportunities Fund (continued)
schEDUlE of InVEsTmEnTsAs at 31 December 2020
Investments Currency
Quantity/Nominal
Value
Market Value EUR
% of Net Assets
Transferable securities and money market instruments admitted to official exchange listing or dealt in on another regulated market
Government Bonds (continued)
new ZealandNew Zealand Government Bond 0.25%
15/05/2028 NZD 1,240,000 705,412 0.34 New Zealand Government Bond 1.75%
15/05/2041 NZD 500,000 290,585 0.14
995,997 0.48
nigeriaNigeria Government Bond, Reg. S 9.248%
21/01/2049 USD 200,000 192,016 0.09
192,016 0.09
RomaniaRomania Government Bond, Reg. S
1.375% 02/12/2029 EUR 300,000 306,095 0.15
306,095 0.15
RussiaRussian Federal Bond - OFZ 6.9%
23/05/2029 RUB 26,500,000 313,496 0.15
313,496 0.15
senegalSenegal Government Bond, Reg. S 4.75%
13/03/2028 EUR 250,000 267,662 0.13 Senegal Government Bond, Reg. S 6.25%
23/05/2033 USD 200,000 183,474 0.09
451,136 0.22
serbiaSerbia Government Bond, Reg. S 3.125%
15/05/2027 EUR 1,750,000 1,969,800 0.94 Serbia Government Bond, Reg. S 1.5%
26/06/2029 EUR 160,000 165,840 0.08
2,135,640 1.02
sloveniaSlovenia Government Bond, Reg. S
0.488% 20/10/2050 EUR 300,000 316,678 0.15
316,678 0.15
south africaSouth Africa Government Bond 8%
31/01/2030 ZAR 20,500,000 1,088,927 0.52
1,088,927 0.52
south KoreaKorea Government Bond 0% 16/09/2025 EUR 805,000 815,489 0.39
815,489 0.39
schEDUlE of InVEsTmEnTsAs at 31 December 2020
Investments Currency
Quantity/Nominal
Value
Market Value EUR
% of Net Assets
Transferable securities and money market instruments admitted to official exchange listing or dealt in on another regulated market
Government Bonds (continued)
spainSpain Government Bond, Reg. S, 144A
1.25% 31/10/2030 EUR 500,000 559,085 0.27 Spain Government Bond, Reg. S, 144A
2.7% 31/10/2048 EUR 100,000 147,107 0.07 Spain Government Bond, Reg. S, 144A
3.45% 30/07/2066 EUR 560,000 1,014,894 0.49 Spain Government Inflation Linked Bond,
Reg. S, 144A 0.65% 30/11/2027 EUR 2,600,000 3,057,128 1.46
4,778,214 2.29
UkraineUkraine Government Bond, Reg. S 6.75%
20/06/2026 EUR 650,000 717,902 0.34
717,902 0.34
Total Government Bonds 55,761,685 26.69
mortgage and asset Backed securities
australiaRuby Bond Trust ‘A1AU’ 1.828%
12/09/2051 AUD 1,500,000 945,475 0.45
945,475 0.45
European communityArrow CMBS DAC, Reg. S, FRN, Series
2018-1 ‘A1’ 1.1% 22/05/2030 EUR 181,411 181,394 0.09
181,394 0.09
finlandTaurus FIN DAC, Reg. S, FRN, Series
2019-FIN4 ‘A’ 1.4% 18/11/2031 EUR 100,000 99,420 0.05
99,420 0.05
franceFCT Youni, Reg. S, FRN, Series 2019-1 ‘D’
0.927% 25/04/2032 EUR 200,000 200,134 0.10
200,134 0.10
GreeceGrifonas Finance No. 1 plc, Reg. S, FRN,
Series 1 ‘A’ 0% 28/08/2039 EUR 149,701 145,765 0.07
145,765 0.07
IrelandDilosk RMBS No. 2 DAC, Reg. S, FRN,
Series 2 ‘A’ 0.242% 20/12/2057 EUR 252,864 253,475 0.12 Dilosk RMBS No. 2 DAC, Reg. S, FRN,
Series 2 ‘D’ 1.792% 20/12/2057 EUR 200,000 201,168 0.10 Dilosk RMBS No. 3 DAC, Reg. S, FRN,
Series 3 ‘C’ 1.151% 20/10/2057 EUR 199,616 200,751 0.10 Dublin Bay Securities DAC, FRN, Series
2018-1A ‘C’, 144A 0.759% 28/06/2055 EUR 200,000 195,103 0.09

165 Morgan Stanley Investment Funds 31 December 2020
The accompanying notes are an integral part of these financial statements.
European Fixed Income Opportunities Fund (continued)
schEDUlE of InVEsTmEnTsAs at 31 December 2020
Investments Currency
Quantity/Nominal
Value
Market Value EUR
% of Net Assets
Transferable securities and money market instruments admitted to official exchange listing or dealt in on another regulated market
mortgage and asset Backed securities (continued)
Ireland (continued)Dublin Bay Securities DAC, FRN, Series
2018-1A ‘D’, 144A 1.459% 28/06/2055 EUR 275,000 259,844 0.12 European Residential Loan Securitisation
DAC, Reg. S, FRN, Series 2018-1 ‘A’ 0.457% 24/03/2061 EUR 176,191 175,957 0.08
European Residential Loan Securitisation DAC, Reg. S, FRN, Series 2019-NPL1 ‘A’ 1.426% 24/07/2054 EUR 136,622 135,132 0.06
European Residential Loan Securitisation DAC, Reg. S, FRN, Series 2019-PL1 ‘B’ 0.426% 24/03/2063 EUR 225,000 225,175 0.11
Grand Canal Securities, Reg. S, FRN, Series 2 ‘A’ 0.457% 24/12/2058 EUR 120,446 118,515 0.06
Mulcair Securities DAC, Reg. S, FRN, Series 1 ‘B’ 0.989% 24/04/2071 EUR 250,000 249,559 0.12
Mulcair Securities DAC, Reg. S ‘C’ 0.989% 24/04/2071 EUR 250,000 247,464 0.12
Small Business Origination Loan Trust DAC, Reg. S, FRN, Series 2019-2 ‘C’ 2.792% 15/03/2028 GBP 60,235 65,034 0.03
2,327,177 1.11
ItalyDECO 2019-Vivaldi Srl, Reg. S, FRN,
Series 2019-VIVA ‘A’ 1.9% 22/08/2031 EUR 202,000 190,804 0.09 Emerald Italy Srl, Reg. S, FRN,
Series 2019-IT ‘A’ 2.1% 24/09/2030 EUR 98,750 86,232 0.04
277,036 0.13
luxembourgMiravet Sarl-Compartment, Reg. S ‘A’
0.322% 26/05/2065 EUR 500,000 490,880 0.23
490,880 0.23
netherlandsDomi BV, Reg. S ‘D’ 1.616% 15/06/2051 EUR 200,000 200,881 0.10 Dutch Property Finance BV, Reg. S, FRN,
Series 2017-1 ‘B’ 0.791% 28/01/2048 EUR 200,000 200,812 0.10 Dutch Property Finance BV, Reg. S ‘D’
1.591% 28/10/2052 EUR 600,000 602,124 0.29 EDML BV, Reg. S, FRN, Series 2019-1 ‘D’
1.141% 28/01/2058 EUR 100,000 99,075 0.05 E-MAC NL BV, Reg. S, FRN, Series NL04-II
‘A’ 2.827% 25/01/2037 EUR 269,458 261,882 0.12 E-MAC NL BV, Reg. S, FRN, Series NL06-2
‘A’ 0.767% 25/01/2039 EUR 229,983 212,756 0.10 E-MAC Program BV, Reg. S, FRN, Series
2007-NL4 ‘A’ 0.047% 25/01/2048 EUR 252,970 241,301 0.12 E-MAC Program BV, Reg. S, FRN, Series
2006-3 ‘A2’ 0.907% 25/04/2039 EUR 270,745 257,783 0.12 E-MAC Program BV, Reg. S, FRN, Series
2007-1 ‘A2’ 1.297% 25/07/2046 EUR 500,380 475,576 0.23 E-MAC Program BV, Reg. S, FRN, Series
2008-1 ‘A2’ 1.568% 25/01/2048 EUR 386,561 385,342 0.18 Jubilee Place BV, Reg. S ‘B’ 0.785%
17/10/2057 EUR 800,000 791,076 0.38
schEDUlE of InVEsTmEnTsAs at 31 December 2020
Investments Currency
Quantity/Nominal
Value
Market Value EUR
% of Net Assets
Transferable securities and money market instruments admitted to official exchange listing or dealt in on another regulated market
mortgage and asset Backed securities (continued)
netherlands (continued)Taurus NL DAC, Reg. S, FRN, Series
2020-NL1X ‘A’ 0.9% 20/02/2030 EUR 298,029 295,052 0.14 Taurus NL DAC, Reg. S, FRN, Series
2020-NL1X ‘C’ 1.55% 20/02/2030 EUR 298,029 283,043 0.13
4,306,703 2.06
PortugalHefesto STC-Guincho Finance, Reg. S,
FRN, Series 1 ‘A’ 1.851% 30/11/2038 EUR 115,627 113,958 0.06 Magellan Mortgages No3 plc, Reg. S, FRN,
Series 3 ‘A’ 0% 15/05/2058 EUR 241,170 236,560 0.11 Magellan Mortgages No4 plc, Reg. S,
FRN ‘A’ 0% 20/07/2059 EUR 195,901 191,069 0.09
541,587 0.26
spainUCI 16 FTA, Reg. S, FRN, Series 16 ‘A2’
0% 16/06/2049 EUR 328,470 316,106 0.15
316,106 0.15
United KingdomChester B1 Issuer plc, Reg. S ‘C’ 1.656%
17/01/2058 GBP 1,000,000 1,097,568 0.53 Dukinfield II plc, Reg. S ‘C’ 1.837%
20/12/2052 GBP 1,000,000 1,113,868 0.53 Eurohome UK Mortgages plc, Reg. S, FRN,
Series 2007-2 ‘M2’ 0.659% 15/09/2044 GBP 300,000 277,774 0.13 Harben Finance plc, Reg. S ‘C’ 1.548%
20/08/2056 GBP 800,000 890,743 0.43 Marketplace Originated Consumer Assets
plc, Reg. S ‘E’ 4.526% 20/12/2027 GBP 1,000,000 1,119,461 0.54 Mortgage Funding plc, Reg. S, FRN,
Series 2008-1 ‘B1’ 3.26% 13/03/2046 GBP 1,000,000 1,123,260 0.54 Newgate Funding plc, Reg. S, FRN,
Series 2007-3X ‘A3’ 1.06% 15/12/2050 GBP 135,202 147,642 0.07 Ripon Mortgages plc, Reg. S, FRN ‘C1’
1.568% 20/08/2056 GBP 150,000 167,674 0.08 Small Business Origination Loan Trust DAC,
Reg. S, FRN, Series 2019-3 ‘C’ 3.053% 15/10/2028 GBP 86,761 92,388 0.04
Taurus UK DAC, Reg. S, FRN, Series 2019-UK3 ‘C’ 1.987% 22/06/2029 GBP 200,000 211,110 0.10
Uropa Securities plc, Reg. S, FRN, Series 2007-1 ‘M2A’ 0.643% 10/10/2040 GBP 85,653 84,488 0.04
6,325,976 3.03
United states of americaCHL Mortgage Pass-Through Trust,
Series 2004-5 ‘2A2’ 5.5% 25/05/2034 USD 17,737 14,615 0.01 GNMA, IO, FRN, Series 2010-H26 0.756%
20/08/2058 USD 543,251 11,104 0.01 Invitation Homes Trust ‘D’, 144A 1.936%
17/12/2036 USD 591,632 485,121 0.23 J.P. Morgan Mortgage Trust, FRN, Series
2003-A1 ‘1A1’ 2.38% 25/10/2033 USD 45,327 37,675 0.02
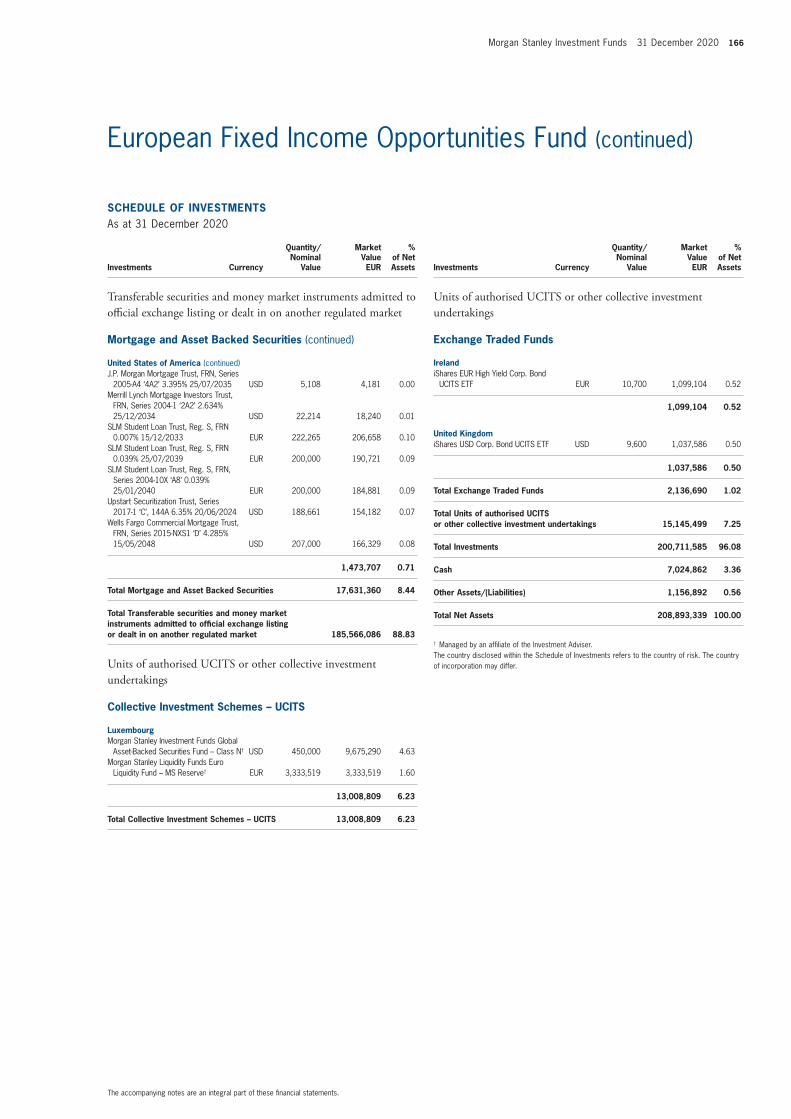
Morgan Stanley Investment Funds 31 December 2020 166
The accompanying notes are an integral part of these financial statements.
European Fixed Income Opportunities Fund (continued)
schEDUlE of InVEsTmEnTsAs at 31 December 2020
Investments Currency
Quantity/Nominal
Value
Market Value EUR
% of Net Assets
Transferable securities and money market instruments admitted to official exchange listing or dealt in on another regulated market
mortgage and asset Backed securities (continued)
United states of america (continued)J.P. Morgan Mortgage Trust, FRN, Series
2005-A4 ‘4A2’ 3.395% 25/07/2035 USD 5,108 4,181 0.00 Merrill Lynch Mortgage Investors Trust,
FRN, Series 2004-1 ‘2A2’ 2.634% 25/12/2034 USD 22,214 18,240 0.01
SLM Student Loan Trust, Reg. S, FRN 0.007% 15/12/2033 EUR 222,265 206,658 0.10
SLM Student Loan Trust, Reg. S, FRN 0.039% 25/07/2039 EUR 200,000 190,721 0.09
SLM Student Loan Trust, Reg. S, FRN, Series 2004-10X ‘A8’ 0.039% 25/01/2040 EUR 200,000 184,881 0.09
Upstart Securitization Trust, Series 2017-1 ‘C’, 144A 6.35% 20/06/2024 USD 188,661 154,182 0.07
Wells Fargo Commercial Mortgage Trust, FRN, Series 2015-NXS1 ‘D’ 4.285% 15/05/2048 USD 207,000 166,329 0.08
1,473,707 0.71
Total mortgage and asset Backed securities 17,631,360 8.44
Total Transferable securities and money market instruments admitted to official exchange listing or dealt in on another regulated market 185,566,086 88.83
Units of authorised UCITS or other collective investment undertakings
collective Investment schemes – UcITs
luxembourgMorgan Stanley Investment Funds Global
Asset-Backed Securities Fund – Class N† USD 450,000 9,675,290 4.63 Morgan Stanley Liquidity Funds Euro
Liquidity Fund – MS Reserve† EUR 3,333,519 3,333,519 1.60
13,008,809 6.23
Total collective Investment schemes – UcITs 13,008,809 6.23
schEDUlE of InVEsTmEnTsAs at 31 December 2020
Investments Currency
Quantity/Nominal
Value
Market Value EUR
% of Net Assets
Units of authorised UCITS or other collective investment undertakings
Exchange Traded funds
IrelandiShares EUR High Yield Corp. Bond
UCITS ETF EUR 10,700 1,099,104 0.52
1,099,104 0.52
United KingdomiShares USD Corp. Bond UCITS ETF USD 9,600 1,037,586 0.50
1,037,586 0.50
Total Exchange Traded funds 2,136,690 1.02
Total Units of authorised UcITs or other collective investment undertakings 15,145,499 7.25
Total Investments 200,711,585 96.08
cash 7,024,862 3.36
other assets/(liabilities) 1,156,892 0.56
Total net assets 208,893,339 100.00
† Managed by an affiliate of the Investment Adviser.The country disclosed within the Schedule of Investments refers to the country of risk. The country of incorporation may differ.

167 Morgan Stanley Investment Funds 31 December 2020
The accompanying notes are an integral part of these financial statements.
European Fixed Income Opportunities Fund (continued)
financial futures contracts
security Descriptionnumber
of contracts currency
Global Exposure
EUR
Unrealised Gain/(loss)
EUR
% of net assets
Euro-Bobl, 08/03/2021 (124) EUR (16,762,320) 13,640 0.01 Euro-Bund, 08/03/2021 (25) EUR (4,441,000) 4,000 0.00Euro-Buxl 30 Year Bond, 08/03/2021 (14) EUR (3,153,360) 7,280 0.00US Ultra Bond, 22/03/2021 (6) USD (1,042,380) 2,470 0.00
Total Unrealised Gain on financial futures contracts 27,390 0.01
Euro-OAT, 08/03/2021 (15) EUR (2,517,900) (152) 0.00US 10 Year Note, 22/03/2021 60 USD 6,748,496 (1,528) 0.00US Long Bond, 22/03/2021 (6) USD (846,007) (3,982) 0.00
Total Unrealised loss on financial futures contracts (5,662) 0.00
net Unrealised Gain on financial futures contracts 21,728 0.01
forward currency Exchange contracts (continued)
currency Purchased
amount Purchased
currency sold
amount sold
maturity Date counterparty
Unrealised Gain/(loss)
EUR
% of net assets
EUR 16,589,576 USD 19,737,000 15/01/2021 Westpac Banking 507,381 0.24 EUR 555,208 MXN 13,500,000 20/01/2021 Barclays 2,489 0.00EUR 1,912,427 MXN 46,307,161 20/01/2021 RBC 16,513 0.01 MXN 9,600,000 EUR 389,094 20/01/2021 RBC 3,950 0.00NOK 2,450,000 EUR 221,769 21/01/2021 Commonwealth
Bank of Australia 12,158 0.01 NOK 3,800,000 EUR 355,746 21/01/2021 RBC 7,080 0.00NOK 4,950,000 USD 560,437 21/01/2021 RBC 16,037 0.01 SEK 19,939,319 EUR 1,939,175 21/01/2021 BNP Paribas 50,411 0.02 AUD 349,690 EUR 215,674 22/01/2021 Commonwealth
Bank of Australia 4,603 0.00NZD 1,222,097 EUR 706,819 22/01/2021 ANZ 13,028 0.01 NZD 1,015,443 EUR 594,812 22/01/2021 Citigroup 3,310 0.00ZAR 10,800,000 EUR 583,834 22/01/2021 Citigroup 15,180 0.01 ZAR 3,760,000 EUR 199,321 22/01/2021 RBC 9,224 0.01 EUR 1,039,604 PLN 4,700,000 25/01/2021 Barclays 9,403 0.01 EUR 484,206 PLN 2,175,000 25/01/2021 RBC 7,465 0.00EUR 1,589,943 GBP 1,425,000 27/01/2021 Barclays 4,101 0.00EUR 2,262,316 GBP 2,010,957 27/01/2021 Canadian Imperial
Bank of Commerce 24,378 0.01 EUR 2,402,311 USD 2,900,000 01/02/2021 Commonwealth
Bank of Australia 40,290 0.02 EUR 395,402 USD 485,000 01/02/2021 HSBC 374 0.00EUR 10,972,856 USD 13,009,172 01/02/2021 Westpac Banking 377,014 0.18 IDR 4,600,000,000 USD 324,928 01/02/2021 Goldman Sachs 4,067 0.00
Unrealised Gain on forward currency Exchange contracts – assets 1,128,456 0.54
Total Unrealised Gain on forward currency Exchange contracts – assets 1,128,456 0.54
USD 290,000 EUR 239,093 15/01/2021 State Street (2,794) 0.00EUR 617,778 MXN 15,447,000 20/01/2021 State Street (14,655) (0.01) MXN 13,800,000 EUR 569,437 20/01/2021 J.P. Morgan (4,436) 0.00MXN 19,454,161 EUR 799,197 20/01/2021 RBC (2,702) 0.00EUR 1,391,369 SEK 14,209,594 21/01/2021 BNP Paribas (26,494) (0.01) EUR 575,968 SEK 5,976,000 21/01/2021 Canadian Imperial
Bank of Commerce (20,330) (0.01)
DERIVaTIVEs
Over-the-counter (OTC) and exchange traded derivatives as at 31 December 2020, expressed in Euro.
forward currency Exchange contracts (continued)
currency Purchased
amount Purchased
currency sold
amount sold
maturity Date counterparty
Unrealised Gain/(loss)
EUR
% of net assets
EUR 1,618,160 AUD 2,672,000 22/01/2021 Goldman Sachs (64,986) (0.03) EUR 5,439,237 AUD 8,857,887 22/01/2021 Westpac Banking (140,524) (0.07) EUR 1,482,866 NZD 2,570,845 22/01/2021 ANZ (31,429) (0.02) EUR 852,569 NZD 1,504,000 22/01/2021 Westpac Banking (33,326) (0.02) EUR 691,657 ZAR 12,836,962 22/01/2021 Barclays (20,335) (0.01) USD 211,200 ZAR 3,490,000 22/01/2021 Barclays (21,508) (0.01) PLN 1,420,000 EUR 316,474 25/01/2021 Barclays (5,222) 0.00PLN 770,000 EUR 169,979 25/01/2021 Westpac Banking (1,202) 0.00PLN 4,725,000 USD 1,276,030 25/01/2021 HSBC (3,809) 0.00EUR 2,213,003 GBP 1,989,449 27/01/2021 Canadian Imperial
Bank of Commerce (999) 0.00EUR 1,945,185 GBP 1,758,000 27/01/2021 Westpac Banking (11,244) (0.01) GBP 1,070,000 EUR 1,199,382 27/01/2021 Westpac Banking (8,609) 0.00USD 403,197 CNY 2,664,000 01/02/2021 Barclays (4,042) 0.00USD 970,000 EUR 797,055 01/02/2021 RBC (7,000) 0.00USD 563,910 IDR 8,014,000,000 01/02/2021 BNP Paribas (8,854) (0.01) USD 133,087 RUB 10,290,000 01/02/2021 State Street (4,408) 0.00
Unrealised loss on forward currency Exchange contracts – liabilities (438,908) (0.21)
Total Unrealised loss on forward currency Exchange contracts – liabilities (438,908) (0.21)
net Unrealised Gain on forward currency Exchange contracts – assets 689,548 0.33
credit Default swap contracts
nominal amount ccy counterparty
Reference Entity
Buy/ sell
Interest (Paid)/
Received Rate
maturity Date
market Value EUR
% of net assets
2,500,000 EUR Goldman Sachs ITRAXX.EUROPE.CROSSOVER. 32-V4 Buy (5.00)% 20/12/2024 (268,867) (0.13)
1,250,000 EUR Goldman Sachs ITRAXX.EUROPE.CROSSOVER. 33-V4 Buy (5.00)% 20/06/2025 (139,750) (0.07)
5,500,000 EUR Goldman Sachs ITRAXX.EUROPE.CROSSOVER. 34-V1 Buy (5.00)% 20/12/2025 (673,329) (0.32)
1,500,000 EUR Goldman Sachs ITRAXX.EUROPE.MAIN. 31-V2 Buy (1.00)% 20/06/2024 (33,776) (0.02)
1,275,000 EUR Goldman Sachs ITRAXX.EUROPE.MAIN. 33-V1 Buy (1.00)% 20/06/2025 (30,498) (0.01)
3,800,000 EUR Goldman Sachs ITRAXX.EUROPE.MAIN. 34-V1 Buy (1.00)% 20/12/2025 (100,967) (0.05)
Total market Value on credit Default swap contracts – liabilities (1,247,187) (0.60)
net market Value on credit Default swap contracts – liabilities (1,247,187) (0.60)
Collateral received and paid by the Fund in respect of financial derivative instruments:
Type of collateral counterparty currency amount received amount paid
European fixed Income opportunities fund
Cash Goldman Sachs EUR – 346,118
– 346,118
DERIVaTIVEs (continued)
Over-the-counter (OTC) and exchange traded derivatives as at 31 December 2020, expressed in Euro.

Morgan Stanley Investment Funds 31 December 2020 168
The accompanying notes are an integral part of these financial statements.
Please refer to the full prospectus for the Fund’s investment objective and policy.
schEDUlE of InVEsTmEnTsAs at 31 December 2020
Investments Currency
Quantity/Nominal
Value
Market Value EUR
% of Net Assets
Transferable securities and money market instruments admitted to official exchange listing or dealt in on another regulated market
convertible Bonds
spainCellnex Telecom SA, Reg. S 0.75%
20/11/2031 EUR 3,700,000 3,565,542 0.43
3,565,542 0.43
Total convertible Bonds 3,565,542 0.43
corporate Bonds
austriaErste Group Bank AG, Reg. S, FRN 6.5%
Perpetual EUR 4,000,000 4,477,504 0.54
4,477,504 0.54
BelgiumHouse of Finance NV (The), Reg. S 4.375%
15/07/2026 EUR 4,500,000 4,506,547 0.54 House of HR, Reg. S 7.5% 15/01/2027 EUR 3,400,000 3,441,650 0.42
7,948,197 0.96
czech RepublicEnergo-Pro A/S, Reg. S 4.5% 04/05/2024 EUR 8,050,000 7,865,011 0.95
7,865,011 0.95
DenmarkDKT Finance ApS, Reg. S 7% 17/06/2023 EUR 4,600,000 4,753,332 0.57 Nykredit Realkredit A/S, Reg. S 4.125%
31/12/2164 EUR 1,400,000 1,479,275 0.18
6,232,607 0.75
franceAltice France SA, Reg. S 5.875%
01/02/2027 EUR 2,550,000 2,722,253 0.33 Banijay Group SAS, Reg. S 6.5%
01/03/2026 EUR 8,150,000 8,214,181 0.99 Casino Guichard Perrachon SA, Reg. S
4.048% 05/08/2026 EUR 6,000,000 5,335,500 0.64 CMA CGM SA, Reg. S 7.5% 15/01/2026 EUR 2,450,000 2,632,525 0.32 Credit Agricole SA, Reg. S 4%
31/12/2164 EUR 2,000,000 2,169,874 0.26 Faurecia SE, Reg. S 3.75% 15/06/2028 EUR 4,150,000 4,370,780 0.53 La Poste SA, Reg. S, FRN 3.125%
Perpetual EUR 2,800,000 3,015,250 0.36 Louvre Bidco SAS, Reg. S, FRN 5.375%
30/09/2024 EUR 857,143 870,000 0.10 Louvre Bidco SAS, Reg. S 4.25%
30/09/2024 EUR 7,000,000 6,956,586 0.84 Loxam SAS, Reg. S 2.875% 15/04/2026 EUR 3,050,000 3,024,075 0.36 Loxam SAS, Reg. S 3.75% 15/07/2026 EUR 4,125,000 4,207,500 0.51 Loxam SAS, Reg. S 5.75% 15/07/2027 EUR 4,400,000 4,454,890 0.54 Novafives SAS, Reg. S 5% 15/06/2025 EUR 5,300,000 4,664,000 0.56 Parts Europe SA, Reg. S 6.5%
16/07/2025 EUR 6,000,000 6,275,100 0.76 Quatrim SASU, Reg. S 5.875%
15/01/2024 EUR 4,975,000 5,181,089 0.62 Renault SA, Reg. S 2.375% 25/05/2026 EUR 4,100,000 4,156,375 0.50
European High Yield Bond Fund
InVEsTmEnT aIm
To provide an attractive rate of return, measured in Euro, through investments worldwide primarily in lower rated and unrated Fixed Income Securities issued by governments, agencies and corporations that offer a yield above that generally available on debt securities in the four highest rating categories of S&P or Moody’s denominated in European currencies.

169 Morgan Stanley Investment Funds 31 December 2020
The accompanying notes are an integral part of these financial statements.
European High Yield Bond Fund (continued)
schEDUlE of InVEsTmEnTsAs at 31 December 2020
Investments Currency
Quantity/Nominal
Value
Market Value EUR
% of Net Assets
Transferable securities and money market instruments admitted to official exchange listing or dealt in on another regulated market
corporate Bonds (continued)
france (continued)Rubis Terminal Infra SAS, Reg. S 5.625%
15/05/2025 EUR 3,450,000 3,692,363 0.44 Tereos Finance Groupe I SA, Reg. S 7.5%
30/10/2025 EUR 2,400,000 2,553,360 0.31 Unibail-Rodamco-Westfield SE, Reg. S
2.875% Perpetual EUR 4,400,000 4,199,250 0.51
78,694,951 9.48
GermanyADLER Group SA, Reg. S 2.75%
13/11/2026 EUR 2,400,000 2,464,493 0.30 Bayer AG, Reg. S 2.375% 12/11/2079 EUR 4,000,000 4,074,004 0.49 CBR Fashion Finance BV, Reg. S 5.125%
01/10/2022 EUR 4,950,000 4,941,783 0.60 Cheplapharm Arzneimittel GmbH, Reg. S
3.5% 11/02/2027 EUR 3,000,000 3,018,750 0.36 Deutsche Lufthansa AG, Reg. S 3%
29/05/2026 EUR 3,000,000 3,004,650 0.36 HT Troplast GmbH, Reg. S 9.25%
15/07/2025 EUR 6,050,000 6,744,268 0.81 Kaefer Isoliertechnik GmbH & Co. KG,
Reg. S 5.5% 10/01/2024 EUR 2,300,000 2,326,036 0.28 Nidda BondCo GmbH, Reg. S 5%
30/09/2025 EUR 4,100,000 4,157,773 0.50 ProGroup AG, Reg. S 3% 31/03/2026 EUR 4,170,000 4,239,111 0.51 Schaeffler AG, Reg. S 3.375%
12/10/2028 EUR 3,800,000 4,194,250 0.51 Techem Verwaltungsgesellschaft 674 mbH,
Reg. S 6% 30/07/2026 EUR 4,100,000 4,310,637 0.52 Techem Verwaltungsgesellschaft 675 mbH,
Reg. S 2% 15/07/2025 EUR 3,775,000 3,763,109 0.45 thyssenkrupp AG, Reg. S 1.875%
06/03/2023 EUR 9,350,000 9,376,236 1.13 Vertical Midco GmbH, Reg. S 4.375%
15/07/2027 EUR 4,100,000 4,334,110 0.52 Volkswagen International Finance NV,
Reg. S, FRN 3.375% Perpetual EUR 4,600,000 4,827,792 0.58 WEPA Hygieneprodukte GmbH, Reg. S
2.875% 15/12/2027 EUR 4,000,000 4,062,500 0.49
69,839,502 8.41
GreeceCrystal Almond SARL, Reg. S 4.25%
15/10/2024 EUR 3,700,000 3,737,555 0.45 Frigoglass Finance BV, Reg. S 6.875%
12/02/2025 EUR 2,825,000 2,186,522 0.26
5,924,077 0.71
IrelandBank of Ireland Group plc, Reg. S, FRN
3.125% 19/09/2027 GBP 2,200,000 2,490,335 0.30 Virgin Media Vendor Financing Notes III
DAC, Reg. S 4.875% 15/07/2028 GBP 6,500,000 7,409,099 0.89
9,899,434 1.19
schEDUlE of InVEsTmEnTsAs at 31 December 2020
Investments Currency
Quantity/Nominal
Value
Market Value EUR
% of Net Assets
Transferable securities and money market instruments admitted to official exchange listing or dealt in on another regulated market
corporate Bonds (continued)
IsraelTeva Pharmaceutical Finance Netherlands II
BV 6% 31/01/2025 EUR 3,950,000 4,305,500 0.52 Teva Pharmaceutical Finance Netherlands II
BV, Reg. S 1.125% 15/10/2024 EUR 9,700,000 9,034,095 1.09
13,339,595 1.61
ItalyAutostrade per l’Italia SpA, Reg. S 2%
04/12/2028 EUR 2,550,000 2,565,634 0.31 Autostrade per l’Italia SpA, Reg. S 4.375%
16/09/2025 EUR 4,350,000 4,897,621 0.59 Centurion Bidco SpA, Reg. S 5.875%
30/09/2026 EUR 4,050,000 4,190,847 0.50 doValue SpA, Reg. S 5% 04/08/2025 EUR 4,200,000 4,397,022 0.53 Enel SpA, FRN, 144A 8.75% 24/09/2073 USD 4,000,000 3,815,346 0.46 EVOCA SpA, Reg. S, FRN 4.25%
01/11/2026 EUR 6,725,000 6,338,312 0.76 Fire BC SpA, Reg. S, FRN 4.75%
30/09/2024 EUR 5,700,000 5,478,555 0.66 Intesa Sanpaolo SpA, Reg. S, FRN 6.25%
Perpetual EUR 5,150,000 5,625,098 0.68 Rossini Sarl, Reg. S 6.75% 30/10/2025 EUR 3,650,000 3,904,131 0.47 Sofima Holding SpA, Reg. S 3.75%
15/01/2028 EUR 4,300,000 4,368,499 0.52 Telecom Italia Finance SA 7.75%
24/01/2033 EUR 5,450,000 8,063,760 0.97 Telecom Italia SpA, Reg. S 2.375%
12/10/2027 EUR 9,065,000 9,462,319 1.14 UniCredit SpA, Reg. S, FRN 5.375%
Perpetual EUR 5,750,000 5,882,250 0.71 Unipol Gruppo SpA, Reg. S 3.25%
23/09/2030 EUR 2,100,000 2,232,428 0.27 UnipolSai Assicurazioni SpA, Reg. S, FRN
5.75% Perpetual EUR 3,950,000 4,288,713 0.52
75,510,535 9.09
JapanNissan Motor Co. Ltd., Reg. S 3.201%
17/09/2028 EUR 3,450,000 3,748,042 0.45 SoftBank Group Corp., Reg. S 5%
15/04/2028 EUR 12,710,000 14,225,668 1.71
17,973,710 2.16
luxembourgAltice France Holding SA, 144A 8%
15/05/2027 EUR 8,350,000 9,091,898 1.10 ARD Finance SA, Reg. S, FRN 5%
30/06/2027 EUR 4,000,000 4,091,655 0.49 Eurofins Scientific SE, Reg. S, FRN 4.875%
Perpetual EUR 3,900,000 4,220,794 0.51 LHMC Finco 2 Sarl, Reg. S 7.25%
02/10/2025 EUR 5,990,000 5,474,261 0.66 Picard Bondco SA, Reg. S 5.5%
30/11/2024 EUR 2,950,000 3,033,264 0.37 Safari Verwaltungs GmbH, Reg. S 5.375%
30/11/2022 EUR 2,500,000 2,401,300 0.29 SIG Combibloc PurchaseCo Sarl, Reg. S
2.125% 18/06/2025 EUR 3,950,000 4,163,300 0.50
32,476,472 3.92
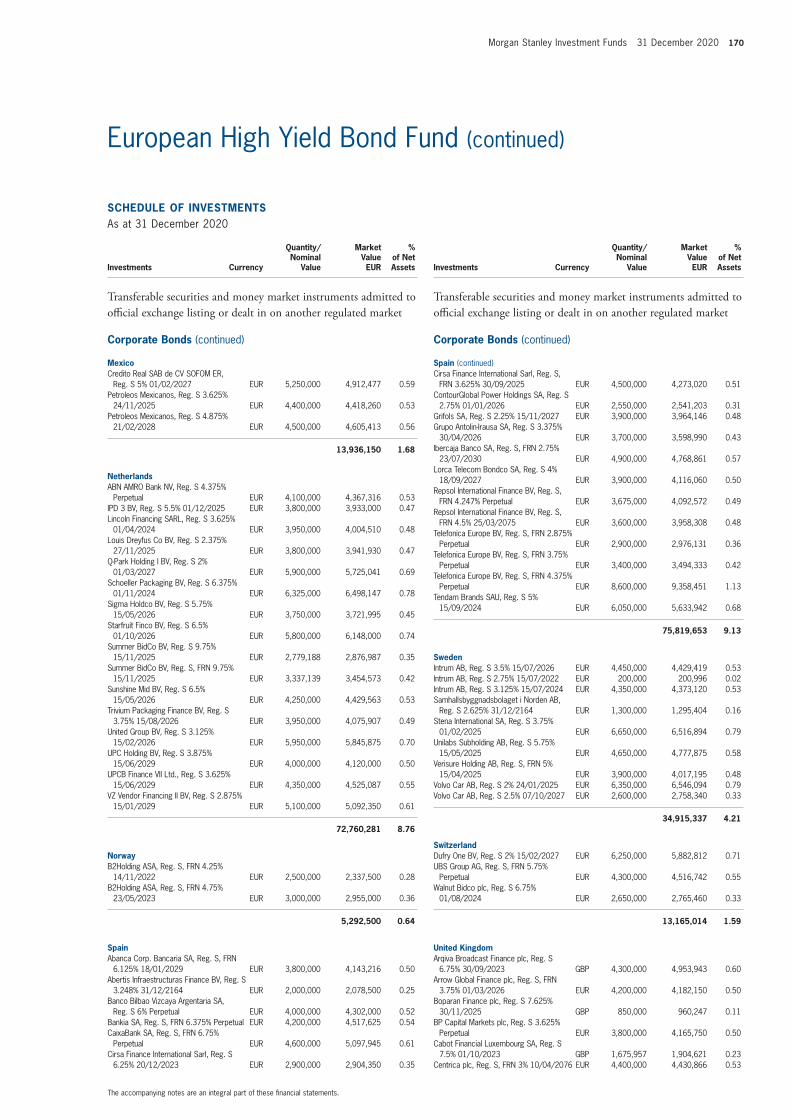
Morgan Stanley Investment Funds 31 December 2020 170
The accompanying notes are an integral part of these financial statements.
European High Yield Bond Fund (continued)
schEDUlE of InVEsTmEnTsAs at 31 December 2020
Investments Currency
Quantity/Nominal
Value
Market Value EUR
% of Net Assets
Transferable securities and money market instruments admitted to official exchange listing or dealt in on another regulated market
corporate Bonds (continued)
mexicoCredito Real SAB de CV SOFOM ER,
Reg. S 5% 01/02/2027 EUR 5,250,000 4,912,477 0.59 Petroleos Mexicanos, Reg. S 3.625%
24/11/2025 EUR 4,400,000 4,418,260 0.53 Petroleos Mexicanos, Reg. S 4.875%
21/02/2028 EUR 4,500,000 4,605,413 0.56
13,936,150 1.68
netherlandsABN AMRO Bank NV, Reg. S 4.375%
Perpetual EUR 4,100,000 4,367,316 0.53 IPD 3 BV, Reg. S 5.5% 01/12/2025 EUR 3,800,000 3,933,000 0.47 Lincoln Financing SARL, Reg. S 3.625%
01/04/2024 EUR 3,950,000 4,004,510 0.48 Louis Dreyfus Co BV, Reg. S 2.375%
27/11/2025 EUR 3,800,000 3,941,930 0.47 Q-Park Holding I BV, Reg. S 2%
01/03/2027 EUR 5,900,000 5,725,041 0.69 Schoeller Packaging BV, Reg. S 6.375%
01/11/2024 EUR 6,325,000 6,498,147 0.78 Sigma Holdco BV, Reg. S 5.75%
15/05/2026 EUR 3,750,000 3,721,995 0.45 Starfruit Finco BV, Reg. S 6.5%
01/10/2026 EUR 5,800,000 6,148,000 0.74 Summer BidCo BV, Reg. S 9.75%
15/11/2025 EUR 2,779,188 2,876,987 0.35 Summer BidCo BV, Reg. S, FRN 9.75%
15/11/2025 EUR 3,337,139 3,454,573 0.42 Sunshine Mid BV, Reg. S 6.5%
15/05/2026 EUR 4,250,000 4,429,563 0.53 Trivium Packaging Finance BV, Reg. S
3.75% 15/08/2026 EUR 3,950,000 4,075,907 0.49 United Group BV, Reg. S 3.125%
15/02/2026 EUR 5,950,000 5,845,875 0.70 UPC Holding BV, Reg. S 3.875%
15/06/2029 EUR 4,000,000 4,120,000 0.50 UPCB Finance VII Ltd., Reg. S 3.625%
15/06/2029 EUR 4,350,000 4,525,087 0.55 VZ Vendor Financing II BV, Reg. S 2.875%
15/01/2029 EUR 5,100,000 5,092,350 0.61
72,760,281 8.76
norwayB2Holding ASA, Reg. S, FRN 4.25%
14/11/2022 EUR 2,500,000 2,337,500 0.28 B2Holding ASA, Reg. S, FRN 4.75%
23/05/2023 EUR 3,000,000 2,955,000 0.36
5,292,500 0.64
spainAbanca Corp. Bancaria SA, Reg. S, FRN
6.125% 18/01/2029 EUR 3,800,000 4,143,216 0.50 Abertis Infraestructuras Finance BV, Reg. S
3.248% 31/12/2164 EUR 2,000,000 2,078,500 0.25 Banco Bilbao Vizcaya Argentaria SA,
Reg. S 6% Perpetual EUR 4,000,000 4,302,000 0.52 Bankia SA, Reg. S, FRN 6.375% Perpetual EUR 4,200,000 4,517,625 0.54 CaixaBank SA, Reg. S, FRN 6.75%
Perpetual EUR 4,600,000 5,097,945 0.61 Cirsa Finance International Sarl, Reg. S
6.25% 20/12/2023 EUR 2,900,000 2,904,350 0.35
schEDUlE of InVEsTmEnTsAs at 31 December 2020
Investments Currency
Quantity/Nominal
Value
Market Value EUR
% of Net Assets
Transferable securities and money market instruments admitted to official exchange listing or dealt in on another regulated market
corporate Bonds (continued)
spain (continued)Cirsa Finance International Sarl, Reg. S,
FRN 3.625% 30/09/2025 EUR 4,500,000 4,273,020 0.51 ContourGlobal Power Holdings SA, Reg. S
2.75% 01/01/2026 EUR 2,550,000 2,541,203 0.31 Grifols SA, Reg. S 2.25% 15/11/2027 EUR 3,900,000 3,964,146 0.48 Grupo Antolin-Irausa SA, Reg. S 3.375%
30/04/2026 EUR 3,700,000 3,598,990 0.43 Ibercaja Banco SA, Reg. S, FRN 2.75%
23/07/2030 EUR 4,900,000 4,768,861 0.57 Lorca Telecom Bondco SA, Reg. S 4%
18/09/2027 EUR 3,900,000 4,116,060 0.50 Repsol International Finance BV, Reg. S,
FRN 4.247% Perpetual EUR 3,675,000 4,092,572 0.49 Repsol International Finance BV, Reg. S,
FRN 4.5% 25/03/2075 EUR 3,600,000 3,958,308 0.48 Telefonica Europe BV, Reg. S, FRN 2.875%
Perpetual EUR 2,900,000 2,976,131 0.36 Telefonica Europe BV, Reg. S, FRN 3.75%
Perpetual EUR 3,400,000 3,494,333 0.42 Telefonica Europe BV, Reg. S, FRN 4.375%
Perpetual EUR 8,600,000 9,358,451 1.13 Tendam Brands SAU, Reg. S 5%
15/09/2024 EUR 6,050,000 5,633,942 0.68
75,819,653 9.13
swedenIntrum AB, Reg. S 3.5% 15/07/2026 EUR 4,450,000 4,429,419 0.53 Intrum AB, Reg. S 2.75% 15/07/2022 EUR 200,000 200,996 0.02 Intrum AB, Reg. S 3.125% 15/07/2024 EUR 4,350,000 4,373,120 0.53 Samhallsbyggnadsbolaget i Norden AB,
Reg. S 2.625% 31/12/2164 EUR 1,300,000 1,295,404 0.16 Stena International SA, Reg. S 3.75%
01/02/2025 EUR 6,650,000 6,516,894 0.79 Unilabs Subholding AB, Reg. S 5.75%
15/05/2025 EUR 4,650,000 4,777,875 0.58 Verisure Holding AB, Reg. S, FRN 5%
15/04/2025 EUR 3,900,000 4,017,195 0.48 Volvo Car AB, Reg. S 2% 24/01/2025 EUR 6,350,000 6,546,094 0.79 Volvo Car AB, Reg. S 2.5% 07/10/2027 EUR 2,600,000 2,758,340 0.33
34,915,337 4.21
switzerlandDufry One BV, Reg. S 2% 15/02/2027 EUR 6,250,000 5,882,812 0.71 UBS Group AG, Reg. S, FRN 5.75%
Perpetual EUR 4,300,000 4,516,742 0.55 Walnut Bidco plc, Reg. S 6.75%
01/08/2024 EUR 2,650,000 2,765,460 0.33
13,165,014 1.59
United KingdomArqiva Broadcast Finance plc, Reg. S
6.75% 30/09/2023 GBP 4,300,000 4,953,943 0.60 Arrow Global Finance plc, Reg. S, FRN
3.75% 01/03/2026 EUR 4,200,000 4,182,150 0.50 Boparan Finance plc, Reg. S 7.625%
30/11/2025 GBP 850,000 960,247 0.11 BP Capital Markets plc, Reg. S 3.625%
Perpetual EUR 3,800,000 4,165,750 0.50 Cabot Financial Luxembourg SA, Reg. S
7.5% 01/10/2023 GBP 1,675,957 1,904,621 0.23 Centrica plc, Reg. S, FRN 3% 10/04/2076 EUR 4,400,000 4,430,866 0.53

171 Morgan Stanley Investment Funds 31 December 2020
The accompanying notes are an integral part of these financial statements.
European High Yield Bond Fund (continued)
schEDUlE of InVEsTmEnTsAs at 31 December 2020
Investments Currency
Quantity/Nominal
Value
Market Value EUR
% of Net Assets
Transferable securities and money market instruments admitted to official exchange listing or dealt in on another regulated market
corporate Bonds (continued)
United Kingdom (continued)CPUK Finance Ltd., Reg. S 4.875%
28/02/2047 GBP 7,000,000 7,808,169 0.94 Drax Finco PLC, Reg. S 2.625%
01/11/2025 EUR 4,000,000 4,129,600 0.50 eG Global Finance plc, Reg. S 6.25%
30/10/2025 EUR 4,450,000 4,596,850 0.55 Fiat Chrysler Automobiles NV, Reg. S
3.375% 07/07/2023 EUR 3,750,000 4,002,315 0.48 Fiat Chrysler Automobiles NV, Reg. S
3.75% 29/03/2024 EUR 3,600,000 3,957,527 0.48 Heathrow Finance plc, Reg. S 4.125%
01/03/2027 GBP 5,500,000 6,163,156 0.74 Iceland Bondco plc, Reg. S 6.75%
15/07/2024 GBP 7,000,000 7,954,015 0.96 Jerrold Finco plc, Reg. S 4.875%
15/01/2026 GBP 3,950,000 4,370,639 0.53 Mclaren Finance plc, Reg. S 5% 01/08/2022 GBP 3,950,000 4,282,030 0.52 Motion Finco Sarl, Reg. S 7% 15/05/2025 EUR 5,750,000 6,084,363 0.73 National Express Group plc, Reg. S 4.25%
31/12/2164 GBP 3,650,000 4,170,145 0.50 Nationwide Building Society, Reg. S, FRN
5.75% Perpetual GBP 2,500,000 3,040,651 0.37 Pinewood Finance Co. Ltd., Reg. S 3.25%
30/09/2025 GBP 2,900,000 3,301,314 0.40 Pinnacle Bidco plc, Reg. S 6.375%
15/02/2025 GBP 6,250,000 6,916,611 0.83 Playtech plc, Reg. S 4.25% 07/03/2026 EUR 3,950,000 4,095,261 0.49 Santander UK Group Holdings plc, Reg. S,
FRN 7.375% Perpetual GBP 3,750,000 4,373,490 0.53 Synlab Bondco plc, Reg. S, FRN 4.829%
01/07/2025 EUR 6,100,000 6,237,250 0.75 Victoria plc, Reg. S 5.25% 15/07/2024 EUR 6,775,000 7,037,531 0.85 Virgin Media Secured Finance plc, Reg. S
5% 15/04/2027 GBP 3,500,000 4,093,824 0.49 Vodafone Group plc, Reg. S 3%
27/08/2080 EUR 6,000,000 6,281,250 0.76
123,493,568 14.87
United states of americaArdagh Packaging Finance plc, Reg. S
4.75% 15/07/2027 GBP 5,000,000 5,796,024 0.70 Ashland Services BV, Reg. S 2%
30/01/2028 EUR 5,150,000 5,156,920 0.62 Avis Budget Finance plc, Reg. S 4.5%
15/05/2025 EUR 7,300,000 7,181,375 0.87 Belden, Inc., Reg. S 3.375% 15/07/2027 EUR 6,000,000 6,163,050 0.74 Berry Global, Inc., Reg. S 1% 15/01/2025 EUR 4,100,000 4,146,125 0.50 Boxer Parent Co., Inc., Reg. S 6.5%
02/10/2025 EUR 3,300,000 3,503,841 0.42 Chemours Co. (The) 4% 15/05/2026 EUR 5,000,000 4,993,375 0.60 Clarios Global LP, Reg. S 4.375%
15/05/2026 EUR 3,850,000 4,005,732 0.48 Diebold Nixdorf Dutch Holding BV, Reg. S
9% 15/07/2025 EUR 4,050,000 4,420,980 0.53 Encore Capital Group, Inc., Reg. S 4.875%
15/10/2025 EUR 3,950,000 4,105,334 0.49 Ford Motor Credit Co. LLC 3.25%
15/09/2025 EUR 3,400,000 3,570,733 0.43 Ford Motor Credit Co. LLC 2.386%
17/02/2026 EUR 8,650,000 8,818,761 1.06 International Game Technology plc, Reg. S
3.5% 15/06/2026 EUR 7,900,000 8,192,853 0.99 International Game Technology plc, Reg. S
2.375% 15/04/2028 EUR 2,700,000 2,689,538 0.32
schEDUlE of InVEsTmEnTsAs at 31 December 2020
Investments Currency
Quantity/Nominal
Value
Market Value EUR
% of Net Assets
Transferable securities and money market instruments admitted to official exchange listing or dealt in on another regulated market
corporate Bonds (continued)
United states of america (continued)IQVIA, Inc., Reg. S 3.25% 15/03/2025 EUR 4,300,000 4,363,812 0.53 Kraton Polymers LLC, Reg. S 5.25%
15/05/2026 EUR 5,800,000 6,009,380 0.72 Mauser Packaging Solutions Holding Co.,
Reg. S 4.75% 15/04/2024 EUR 9,000,000 9,042,068 1.09 OI European Group BV, Reg. S 2.875%
15/02/2025 EUR 4,250,000 4,326,606 0.52 Scientific Games International, Inc., Reg. S
5.5% 15/02/2026 EUR 7,450,000 7,426,719 0.90 Silgan Holdings, Inc. 3.25% 15/03/2025 EUR 3,900,000 3,953,991 0.48 Standard Industries, Inc., Reg. S 2.25%
21/11/2026 EUR 6,300,000 6,389,047 0.77
114,256,264 13.76
Total corporate Bonds 783,820,362 94.41
Total Transferable securities and money market instruments admitted to official exchange listing or dealt in on another regulated market 787,385,904 94.84
Units of authorised UCITS or other collective investment undertakings
collective Investment schemes – UcITs
luxembourgMorgan Stanley Liquidity Funds Euro
Liquidity Fund – MS Reserve† EUR 13,210,326 13,210,326 1.59 Morgan Stanley Liquidity Funds US Dollar
Liquidity Fund – MS Reserve† USD 2,362,202 2,362,202 0.29
15,572,528 1.88
Total collective Investment schemes – UcITs 15,572,528 1.88
Exchange Traded funds
IrelandiShares EUR High Yield Corp. Bond
UCITS ETF EUR 80,000 8,217,600 0.99
8,217,600 0.99
Total Exchange Traded funds 8,217,600 0.99
Total Units of authorised UcITs or other collective investment undertakings 23,790,128 2.87
Total Investments 811,176,032 97.71
cash 9,429,775 1.14
other assets/(liabilities) 9,614,711 1.15
Total net assets 830,220,518 100.00
† Managed by an affiliate of the Investment Adviser.The country disclosed within the Schedule of Investments refers to the country of risk. The country of incorporation may differ.

Morgan Stanley Investment Funds 31 December 2020 172
The accompanying notes are an integral part of these financial statements.
European High Yield Bond Fund (continued)
forward currency Exchange contracts
currency Purchased
amount Purchased
currency sold
amount sold
maturity Date counterparty
Unrealised Gain/(loss)
EUR
% of net assets
EUR 6,348,537 USD 7,553,000 15/01/2021 Westpac Banking 194,166 0.03 EUR 109,517 GBP 97,828 27/01/2021 Canadian Imperial
Bank of Commerce 648 0.00GBP 2,186,880 EUR 2,419,147 27/01/2021 Canadian Imperial
Bank of Commerce 14,569 0.00
Unrealised Gain on forward currency Exchange contracts – assets 209,383 0.03
GBP hedged share classGBP 10,227 EUR 11,293 08/01/2021 J.P. Morgan 92 0.00
Unrealised Gain on naV hedged share classes forward currency Exchange contracts – assets 92 0.00
Total Unrealised Gain on forward currency Exchange contracts – assets 209,475 0.03
USD 120 EUR 98 04/01/2021 J.P. Morgan 0 0.00EUR 82,236,631 GBP 74,323,000 27/01/2021 Westpac Banking (475,349) (0.06)
Unrealised loss on forward currency Exchange contracts – liabilities (475,349) (0.06)
UsD hedged share classUSD 1,848,547 EUR 1,519,649 08/01/2021 J.P. Morgan (13,138) 0.00
Unrealised loss on naV hedged share classes forward currency Exchange contracts – liabilities (13,138) 0.00
Total Unrealised loss on forward currency Exchange contracts – liabilities (488,487) (0.06)
net Unrealised loss on forward currency Exchange contracts – liabilities (279,012) (0.03)
Collateral received and paid by the Fund in respect of financial derivative instruments:
Type of collateral counterparty currency amount received amount paid
European high Yield Bond fund
Cash Goldman Sachs EUR 36 –Westpac Banking EUR 130,076 –
130,112 –
DERIVaTIVEs
Over-the-counter (OTC) and exchange traded derivatives as at 31 December 2020, expressed in Euro.

173 Morgan Stanley Investment Funds 31 December 2020
The accompanying notes are an integral part of these financial statements.
Please refer to the full prospectus for the Fund’s investment objective and policy.
Global Asset Backed Securities Fund
schEDUlE of InVEsTmEnTsAs at 31 December 2020
Investments Currency
Quantity/Nominal
Value
Market Value USD
% of Net Assets
Transferable securities and money market instruments admitted to official exchange listing or dealt in on another regulated market
corporate Bonds
mexicoBanco Actinver SA, 144A 4.8%
18/12/2034 USD 3,500,000 2,650,156 0.22
2,650,156 0.22
Total corporate Bonds 2,650,156 0.22
mortgage and asset Backed securities
australiaInterstar Millennium Trust, FRN, Series
2006-1 ‘A’ 0.435% 27/03/2038 AUD 552,744 393,904 0.03 Ruby Bond Trust ‘A1AU’ 1.828%
12/09/2051 AUD 5,000,000 3,866,802 0.33 Sapphire XXI Trust, FRN, Series 2019-1
‘A1L’ 1.45% 21/03/2050 AUD 2,351,231 1,819,893 0.15 Vermilion Bond Trust ‘A1AU’ 1.772%
14/12/2058 AUD 4,000,000 3,098,981 0.26
9,179,580 0.77
cayman IslandsECAF I Ltd., Series 2015-1A ‘A2’, 144A
4.947% 15/06/2040 USD 4,708,133 4,291,677 0.36 Falcon Aerospace Ltd., Series 2019-1 ‘A’,
144A 3.597% 15/09/2039 USD 1,365,452 1,314,360 0.11 GAIA Aviation Ltd., STEP, Series
2019-1 ‘A’, 144A 3.967% 15/12/2044 USD 2,296,495 2,120,613 0.18 JOL Air Ltd. ‘A’, 144A 3.967%
15/04/2044 USD 1,439,097 1,393,143 0.12 Loanpal Solar Loan Ltd. ‘A’, 144A 2.29%
20/01/2048 USD 2,800,000 2,817,629 0.24 Project Silver, Series 2019-1 ‘A’, 144A
3.967% 15/07/2044 USD 1,847,895 1,790,586 0.15
13,728,008 1.16
European communityArrow CMBS DAC, Reg. S, FRN, Series
2018-1 ‘A1’ 1.1% 22/05/2030 EUR 997,761 1,224,075 0.10 Arrow CMBS DAC, Reg. S, FRN, Series
2018-1 ‘C’ 2.05% 22/05/2030 EUR 2,539,755 3,068,275 0.26 Eurohome Mortgages plc, Reg. S, FRN,
Series 2007-1 ‘A’ 0% 02/08/2050 EUR 2,713,393 3,007,490 0.26
7,299,840 0.62
finlandTaurus FIN DAC, Reg. S, FRN, Series
2019-FIN4 ‘C’ 2.3% 18/11/2031 EUR 2,500,000 2,874,233 0.24 Taurus FIN DAC, Reg. S, FRN, Series
2019-FIN4 ‘D’ 3% 18/11/2031 EUR 3,000,000 3,501,054 0.30
6,375,287 0.54
franceCFHL-2, Reg. S ‘D’ 2.357% 28/06/2055 EUR 1,500,000 1,858,547 0.16 FCT Youni, Reg. S, FRN, Series 2019-1 ‘D’
0.927% 25/04/2032 EUR 800,000 982,210 0.08 FCT Youni, Reg. S ‘E’ 1.877% 25/04/2032 EUR 1,500,000 1,842,061 0.16
InVEsTmEnT aIm
To provide an attractive rate of total return, measured in US Dollars, through investment primarily in Fixed Income Securities that are mortgage-backed securities, commercial mortgage-backed securities, collateralized mortgage obligations and covered bonds that are covered by mortgages including uniform mortgage-backed securities (“Mortgage Backed Securities”). At least half of the Fund’s asset will be invested in securities rated investment-grade by an internationally recognised rating agency, securities determined to be of similar creditworthiness by the Investment Adviser, or securities backed by the United States of America.

Morgan Stanley Investment Funds 31 December 2020 174
The accompanying notes are an integral part of these financial statements.
Global Asset Backed Securities Fund (continued)
schEDUlE of InVEsTmEnTsAs at 31 December 2020
Investments Currency
Quantity/Nominal
Value
Market Value USD
% of Net Assets
Transferable securities and money market instruments admitted to official exchange listing or dealt in on another regulated market
mortgage and asset Backed securities (continued)
france (continued)River Green Finance 2020 DAC, Reg. S,
FRN, Series 2020-1 ‘C’ 1.4% 22/01/2032 EUR 1,488,750 1,793,175 0.15
River Green Finance 2020 DAC, Reg. S, FRN, Series 2020-1 ‘D’ 1.8% 22/01/2032 EUR 1,985,000 2,365,984 0.20
8,841,977 0.75
GermanyE-Mac DE BV, Reg. S, FRN, Series DE05-I
‘C’ 7.643% 25/05/2052 EUR 3,300,000 3,642,428 0.31 E-Mac DE BV, Reg. S, FRN, Series DE06-I
‘B’ 3.263% 25/05/2057 EUR 3,524,718 4,221,095 0.36 E-Mac DE BV, Reg. S, FRN, Series DE06-II
‘B’ 6.513% 25/02/2058 EUR 2,611,705 3,124,161 0.26 E-Mac DE BV, Reg. S, FRN, Series DE06-II
‘C’ 4.513% 25/02/2058 EUR 3,500,000 3,343,543 0.28 E-Mac DE BV, Reg. S, FRN, Series DE07-1
‘B’ 0.413% 25/11/2054 EUR 3,000,000 3,552,275 0.30 Provide Blue plc, Reg. S, FRN, Series
2005-2 ‘E’ 1.733% 07/08/2052 EUR 1,540,947 1,599,606 0.13
19,483,108 1.64
GreeceGrifonas Finance No. 1 plc, Reg. S, FRN,
Series 1 ‘B’ 0.149% 28/08/2039 EUR 2,300,000 2,574,369 0.22
2,574,369 0.22
IrelandDilosk RMBS No. 2 DAC, Reg. S, FRN,
Series 2 ‘D’ 1.792% 20/12/2057 EUR 3,200,000 3,949,141 0.33 Dilosk RMBS No. 3 DAC, Reg. S, FRN,
Series 3 ‘C’ 1.151% 20/10/2057 EUR 3,293,671 4,064,107 0.34 Dublin Bay Securities DAC, FRN,
Series 2018-1A ‘C’, 144A 0.759% 28/06/2055 EUR 1,050,000 1,256,741 0.11
Dublin Bay Securities DAC, FRN, Series 2018-1A ‘D’, 144A 1.459% 28/06/2055 EUR 500,000 579,661 0.05
European Residential Loan Securitisation DAC, Reg. S, FRN, Series 2019-NPL1 ‘A’ 1.426% 24/07/2054 EUR 2,781,625 3,375,656 0.29
European Residential Loan Securitisation DAC, Reg. S, FRN, Series 2019-NPL2 ‘A’ 0.926% 24/02/2058 EUR 3,493,782 4,216,758 0.36
European Residential Loan Securitisation DAC, Reg. S, FRN, Series 2019-PL1 ‘B’ 0.426% 24/03/2063 EUR 1,900,000 2,333,000 0.20
European Residential Loan Securitisation DAC, Reg. S ‘D’ 0.926% 24/03/2063 EUR 1,000,000 1,209,834 0.10
Grand Canal Securities, Reg. S, FRN, Series 2 ‘A’ 0.457% 24/12/2058 EUR 3,184,603 3,844,659 0.32
Lansdowne Mortgage Securities No. 1 plc, Reg. S, FRN, Series 1 ‘A2’ 0% 15/06/2045 EUR 6,289,000 7,111,188 0.60
Lansdowne Mortgage Securities No. 2 plc, Reg. S, FRN, Series 2 ‘A2’ 0% 16/09/2048 EUR 4,411,746 4,661,089 0.39
schEDUlE of InVEsTmEnTsAs at 31 December 2020
Investments Currency
Quantity/Nominal
Value
Market Value USD
% of Net Assets
Transferable securities and money market instruments admitted to official exchange listing or dealt in on another regulated market
mortgage and asset Backed securities (continued)
Ireland (continued)Pembroke Property Finance DAC, Reg. S,
FRN, Series 1 ‘A’ 0.723% 01/06/2037 EUR 1,160,039 1,409,122 0.12 Pembroke Property Finance DAC,
Reg. S ‘B’ 1.023% 01/06/2037 EUR 1,000,000 1,212,075 0.10
39,223,031 3.31
ItalyDECO 2019-Vivaldi Srl, Reg. S, FRN,
Series 2019-VIVA ‘A’ 1.9% 22/08/2031 EUR 2,250,000 2,607,611 0.22 Emerald Italy Srl, Reg. S, FRN,
Series 2019-IT ‘A’ 2.1% 24/09/2030 EUR 4,937,500 5,290,078 0.45 Emerald Italy Srl, Reg. S, FRN,
Series 2019-IT ‘B’ 3.1% 24/09/2030 EUR 987,500 1,053,915 0.09 Taurus IT SRL, FRN ‘A’ 1% 18/05/2030 EUR 2,596,890 3,081,389 0.26
12,032,993 1.02
luxembourgMiravet Sarl-Compartment, Reg. S ‘A’
0.322% 26/05/2065 EUR 3,000,000 3,613,686 0.30 Miravet Sarl-Compartment, Reg. S ‘B’
1.072% 26/05/2065 EUR 1,979,000 2,330,086 0.20
5,943,772 0.50
netherlandsDutch Property Finance BV, Reg. S, FRN,
Series 2017-1 ‘D’ 1.591% 28/01/2048 EUR 3,800,000 4,689,857 0.40 EDML BV, Reg. S, FRN, Series 2019-1 ‘D’
1.141% 28/01/2058 EUR 1,500,000 1,823,384 0.15 E-MAC NL BV, Reg. S, FRN, Series NL04-I
‘A’ 1.807% 25/07/2036 EUR 1,866,339 2,215,579 0.19 E-MAC NL BV, Reg. S, FRN, Series NL04-I
‘C’ 5.047% 25/07/2036 EUR 196,038 199,267 0.02 E-MAC NL BV, Reg. S, FRN, Series NL04-II
‘C’ 8.637% 25/01/2037 EUR 283,264 256,332 0.02 E-MAC NL BV, Reg. S, FRN, Series NL04-II
‘A’ 2.827% 25/01/2037 EUR 1,077,831 1,285,255 0.11 E-MAC NL BV, Reg. S, FRN, Series NL04-II
‘B’ 5.457% 25/01/2037 EUR 284,431 274,984 0.02 E-MAC NL BV, Reg. S, FRN, Series NL05-3
‘A’ 1.707% 25/07/2038 EUR 3,854,997 4,551,274 0.38 E-MAC NL BV, Reg. S, FRN, Series NL05-I
‘A’ 2.397% 25/04/2038 EUR 2,485,546 3,022,218 0.26 E-MAC NL BV, Reg. S, FRN, Series NL05-I
‘B’ 4.047% 25/04/2038 EUR 336,792 341,250 0.03 E-MAC NL BV, Reg. S, FRN, Series NL06-2
‘A’ 0.767% 25/01/2039 EUR 8,049,407 9,136,338 0.77 E-MAC NL BV, Reg. S, FRN, Series NL06-2
‘B’ 1.217% 25/01/2039 EUR 1,679,876 1,711,127 0.14 E-MAC Program BV, Reg. S, FRN, Series
2007-NL4 ‘A’ 0.047% 25/01/2048 EUR 202,376 236,850 0.02 E-MAC Program BV, Reg. S, FRN, Series
2006-3 ‘A2’ 0.907% 25/04/2039 EUR 10,829,806 12,651,368 1.07 E-MAC Program BV, Reg. S, FRN, Series
2006-3 ‘B’ 1.507% 25/04/2039 EUR 1,625,472 1,708,758 0.14 E-MAC Program BV, Reg. S, FRN, Series
2007-1 ‘A2’ 1.297% 25/07/2046 EUR 6,805,173 7,935,644 0.67 E-MAC Program BV, Reg. S, FRN,
Series 2007-NL3X ‘C’ 0% 25/07/2047 EUR 4,487,432 3,776,991 0.32 E-MAC Program BV, Reg. S, FRN,
Series 2007-NL3X ‘D’ 0% 25/07/2047 EUR 1,136,288 825,111 0.07

175 Morgan Stanley Investment Funds 31 December 2020
The accompanying notes are an integral part of these financial statements.
Global Asset Backed Securities Fund (continued)
schEDUlE of InVEsTmEnTsAs at 31 December 2020
Investments Currency
Quantity/Nominal
Value
Market Value USD
% of Net Assets
Transferable securities and money market instruments admitted to official exchange listing or dealt in on another regulated market
mortgage and asset Backed securities (continued)
netherlands (continued)E-MAC Program BV, Reg. S, FRN,
Series 2007-NL4 ‘C’ 0.739% 25/01/2048 EUR 1,086,813 1,141,464 0.10 E-MAC Program BV, Reg. S, FRN,
Series 2008-1 ‘B’ 2.788% 25/01/2048 EUR 2,637,009 2,856,881 0.24 E-MAC Program II BV, Reg. S, FRN,
Series 2008-NL4 ‘A’ 2.239% 25/04/2048 EUR 3,693,000 4,454,034 0.38 E-MAC Program II BV, Reg. S, FRN,
Series 2008-NL4 ‘B’ 3.739% 25/04/2048 EUR 941,800 1,036,665 0.09 E-MAC Program II BV, Reg. S ‘D’ 7.239%
25/04/2048 EUR 1,882,716 2,186,386 0.18 EMF-NL Prime, Reg. S, FRN, Series 2008-
APRX ‘A2’ 0.357% 17/04/2041 EUR 4,690,566 5,523,806 0.47 EMF-NL Prime, Reg. S, FRN, Series 2008-
APRX ‘A3’ 0.407% 17/04/2041 EUR 500,000 454,424 0.04 Eurosail-NL BV, Reg. S, FRN, Series 2007-
NL2X ‘B’ 1.757% 17/10/2040 EUR 3,700,000 4,141,348 0.35 Eurosail-NL BV, Reg. S ‘C’ 2.393%
17/10/2040 EUR 3,000,000 3,271,314 0.28 Eurosail-NL BV, Reg. S, FRN, Series 2007-
NL1X ‘C’ 0.657% 17/04/2040 EUR 5,000,000 4,660,538 0.39 Eurosail-NL BV, Reg. S, FRN, Series 2007-
NL2X ‘M’ 1.357% 17/10/2040 EUR 6,400,000 7,479,316 0.63 Kantoor Finance DAC, Reg. S, FRN, Series
2018-1 ‘D’ 2.05% 22/05/2028 EUR 2,419,972 2,886,790 0.24 Taurus CMBS, FRN, Series 2020-NL1A ‘D’,
144A 2% 20/02/2030 EUR 2,980,293 3,453,920 0.29
100,188,473 8.46
PortugalHefesto STC-Evora Finance, Reg. S, FRN,
Series 1 ‘A’ 1.851% 30/11/2037 EUR 198,646 241,594 0.02 Hefesto STC-Guincho Finance, Reg. S, FRN,
Series 1 ‘A’ 1.851% 30/11/2038 EUR 2,023,477 2,421,829 0.20
2,663,423 0.22
spainAlhambra SME Funding DAC, Reg. S, FRN,
Series 2019-1 ‘A’ 2% 30/11/2028 EUR 5,113,952 6,081,166 0.51 Bancaja 7 FTA, Reg. S, FRN, Series 7 ‘D’
1.977% 25/11/2036 EUR 838,310 1,008,185 0.08 Bancaja 8 Fondo de Titulizacion
de Activos, Reg. S, FRN, Series 8 ‘D’ 1.297% 25/10/2037 EUR 1,200,000 1,380,958 0.12
Bancaja 9 Fondo de Titulizacion de Activos, Reg. S, FRN, Series 9 ‘D’ 2.002% 25/09/2043 EUR 497,328 570,759 0.05
Dssv Sarl, FRN, Series PRL ‘A’ 3% 15/10/2024 EUR 5,838,682 6,948,801 0.59
GC Pastor Hipotecario 5 FTA, Reg. S, FRN, Series 5 ‘A2’ 0% 21/06/2046 EUR 7,494,684 8,273,961 0.70
Hipocat 7 FTA, Reg. S, FRN, Series HIPO-7 ‘D’ 0.365% 15/07/2036 EUR 1,186,971 1,128,357 0.09
IM Pastor 3 FTH, Reg. S, FRN, Series 3 ‘A’ 0% 22/03/2043 EUR 2,571,344 2,844,687 0.24
IM Pastor 4 FTA, Reg. S, FRN, Series 4 ‘A’ 0% 22/03/2044 EUR 6,055,995 6,782,848 0.57
Magnolia Finance XI DAC, Reg. S, FRN, Series 2018-3MGN ‘A’ 2.75% 18/02/2021 EUR 2,488,905 2,534,601 0.21
Miravet Sarl, Reg. S, FRN, Series 2019-1 ‘B’ 1.012% 26/05/2065 EUR 1,915,000 2,238,873 0.19
schEDUlE of InVEsTmEnTsAs at 31 December 2020
Investments Currency
Quantity/Nominal
Value
Market Value USD
% of Net Assets
Transferable securities and money market instruments admitted to official exchange listing or dealt in on another regulated market
mortgage and asset Backed securities (continued)
spain (continued)Miravet Sarl-Compartment, Reg. S ‘A’
0.262% 26/05/2065 EUR 2,709,537 3,288,765 0.28 Prosil Acquisition SA, Reg. S, FRN, Series
1 ‘A’ 1.542% 31/10/2039 EUR 8,166,383 8,546,951 0.72 TDA 24 FTA, Reg. S, FRN, Series 24 ‘A2’
0% 22/06/2040 EUR 608,922 659,784 0.06 TDA 27 FTA, Reg. S, FRN, Series 27 ‘A3’
0% 28/12/2050 EUR 9,500,000 9,464,801 0.80
61,753,497 5.21
supra-nationalShenton Aircraft Investment I Ltd., Series
2015-1A ‘A’, 144A 4.75% 15/10/2042 USD 2,029,136 1,923,569 0.16 Shenton Aircraft Investment I Ltd. ‘B’,
144A 5.75% 15/10/2042 USD 1,546,286 1,150,261 0.10
3,073,830 0.26
United KingdomAlba plc, Reg. S, FRN, Series 2005-1 ‘C’
0.668% 25/11/2042 GBP 278,703 349,145 0.03 Alba plc, Reg. S, FRN, Series 2005-1 ‘D’
1.068% 25/11/2042 GBP 650,307 814,872 0.07 Alba plc, Reg. S, FRN, Series 2007-1 ‘C’
0.343% 17/03/2039 GBP 779,784 971,890 0.08 Alba plc, Reg. S, FRN, Series 2007-1 ‘F’
3.303% 17/03/2039 GBP 1,299,640 1,643,050 0.14 Banna RMBS DAC, Reg. S, FRN, Series
2019-1 ‘B’ 1.803% 30/12/2063 GBP 3,400,000 4,550,085 0.38 Banna RMBS DAC, Reg. S ‘C’ 2.153%
30/12/2063 GBP 1,000,000 1,298,427 0.11 Castell plc, Reg. S ‘E’ 3.546%
25/01/2046 GBP 1,489,076 2,036,101 0.17 Clavis Securities plc, Reg. S, FRN, Series
2006-1 ‘B1A’ 0.939% 15/12/2039 GBP 220,730 266,546 0.02 Clavis Securities plc, Reg. S, FRN, Series
2007-1 ‘M2A’ 0.509% 15/12/2040 GBP 578,890 718,265 0.06 Deco DAC, Reg. S, FRN, Series 2019-RAM
‘A’ 1.973% 07/08/2030 GBP 2,250,000 2,793,736 0.24 Eurohome UK Mortgages plc, Reg. S ‘M1’
0.409% 15/09/2044 GBP 1,675,000 2,061,819 0.17 Eurohome UK Mortgages plc, Reg. S, FRN,
Series 2007-2 ‘M2’ 0.659% 15/09/2044 GBP 2,900,000 3,294,520 0.28 EuroMASTR plc, Reg. S, FRN, Series 2007-
1V ‘C’ 0.609% 15/06/2040 GBP 1,507,762 1,821,361 0.15 EuroMASTR plc, Reg. S, FRN, Series 2007-
1V ‘D’ 1.759% 15/06/2040 GBP 703,622 845,312 0.07 Eurosail plc, FRN, Series 2006-2A ‘B1B’,
144A 0.49% 15/12/2044 USD 2,327,000 2,241,015 0.19 Eurosail plc, Reg. S, FRN, Series 2006-2X
‘C1C’ 0.475% 15/12/2044 GBP 2,000,000 2,411,820 0.20 Eurosail-UK plc, Reg. S, FRN, Series 2007-
5X ‘A1C’ 0.83% 13/09/2045 GBP 8,952,097 11,534,638 0.97 Farringdon Mortgages No. 2 plc,
Reg. S ‘B1A’ 1.546% 15/07/2047 GBP 698,075 948,525 0.08 Farringdon Mortgages No. 2 plc, Reg. S,
FRN, Series 2 ‘B2A’ 3.582% 15/07/2047 GBP 1,116,919 1,627,799 0.14
Great Hall Mortgages No. 1 plc, Reg. S, FRN, Series 2006-1 ‘BB’ 0% 18/06/2038 EUR 1,000,000 1,160,987 0.10

Morgan Stanley Investment Funds 31 December 2020 176
The accompanying notes are an integral part of these financial statements.
Global Asset Backed Securities Fund (continued)
schEDUlE of InVEsTmEnTsAs at 31 December 2020
Investments Currency
Quantity/Nominal
Value
Market Value USD
% of Net Assets
Transferable securities and money market instruments admitted to official exchange listing or dealt in on another regulated market
mortgage and asset Backed securities (continued)
United Kingdom (continued)Great Hall Mortgages No. 1 plc, Reg. S,
FRN, Series 2007-1 ‘BA’ 0.292% 18/03/2039 GBP 4,040,000 5,164,746 0.44
Great Hall Mortgages No. 1 plc, Reg. S, FRN, Series 2007-1 ‘BB’ 0% 18/03/2039 EUR 2,000,000 2,328,045 0.20
Great Hall Mortgages No. 1 plc, Reg. S, FRN, Series 2007-1 ‘CB’ 0% 18/03/2039 EUR 3,300,000 3,600,377 0.30
Great Hall Mortgages No. 1 plc, Reg. S, FRN, Series 2007-2X ‘BA’ 0.352% 18/06/2039 GBP 3,500,000 4,424,598 0.37
Great Hall Mortgages No. 1 plc, Reg. S, FRN, Series 2007-2X ‘EA’ 3.902% 18/06/2039 GBP 1,390,000 1,830,062 0.16
Landmark Mortgage Securities No. 1 plc, Reg. S, FRN, Series 1 ‘B’ 0.115% 17/06/2038 EUR 1,835,575 2,120,098 0.18
Landmark Mortgage Securities No. 3 plc, Reg. S, FRN, Series 3 ‘C’ 2.178% 17/04/2044 GBP 1,623,517 2,172,441 0.18
Ludgate Funding plc, Reg. S, FRN, Series 2006-1X ‘C’ 0% 01/12/2060 EUR 1,548,010 1,664,917 0.14
Ludgate Funding plc, Reg. S, FRN, Series 2007-1 ‘BB’ 0% 01/01/2061 EUR 1,209,892 1,346,755 0.11
Ludgate Funding plc, Reg. S, FRN, Series 2008-W1X ‘CB’ 0.687% 01/01/2061 EUR 2,782,884 3,071,497 0.26
Magenta 2020 plc, Reg. S, FRN, Series 2020-1X ‘C’ 1.853% 20/12/2024 GBP 2,799,997 3,471,775 0.29
Mansard Mortgages plc, Reg. S, FRN, Series 2006-1X ‘M2’ 0.682% 15/10/2048 GBP 1,074,589 1,341,880 0.11
Mansard Mortgages plc, Reg. S, FRN, Series 2007-2X ‘B1’ 3.059% 15/12/2049 GBP 2,316,348 3,089,290 0.26
Mansard Mortgages plc, Reg. S, FRN, Series 2007-2X ‘B2’ 3.059% 15/12/2049 GBP 1,544,232 1,986,158 0.17
Mansard Mortgages plc, Reg. S, FRN, Series 2007-1X ‘M2’ 0.58% 15/04/2049 GBP 2,721,869 3,434,803 0.29
Mansard Mortgages plc, Reg. S, FRN, Series 2007-2X ‘M2’ 2.059% 15/12/2049 GBP 1,158,174 1,555,545 0.13
Mortgage Funding plc, Reg. S, FRN, Series 2008-1 ‘B1’ 3.26% 13/03/2046 GBP 3,960,000 5,457,564 0.46
NewDay Funding, FRN, Series 2019-1A ‘B’, 144A 1.954% 15/06/2027 GBP 1,000,000 1,345,433 0.11
NewDay Funding, FRN, Series 2019-1A ‘C’, 144A 2.554% 15/06/2027 GBP 2,000,000 2,693,516 0.23
Newday Funding plc, FRN, Series 2018-1A ‘D’, 144A 2.142% 15/08/2026 GBP 1,500,000 2,032,305 0.17
Newday Funding plc, FRN, Series 2018-2A ‘D’, 144A 2.942% 15/12/2026 GBP 3,500,000 4,755,995 0.40
Newday Funding plc, FRN, Series 2019-2A ‘C’, 144A 2.454% 15/09/2027 GBP 4,500,000 6,036,112 0.51
Newday Partnership Funding plc, Reg. S, FRN, Series 2015-1 ‘D’ 3.442% 15/04/2025 GBP 2,500,000 3,419,394 0.29
Newday Partnership Funding plc, Reg. S, FRN, Series 2017-1 ‘D’ 2.142% 15/12/2027 GBP 2,000,000 2,681,433 0.23
Newgate Funding plc, Reg. S, FRN, Series 2007-3X ‘A3’ 1.06% 15/12/2050 GBP 1,487,223 1,992,623 0.17
Newgate Funding plc, Reg. S, FRN, Series 2007-3X ‘BB’ 0.707% 15/12/2050 EUR 757,131 881,748 0.08
schEDUlE of InVEsTmEnTsAs at 31 December 2020
Investments Currency
Quantity/Nominal
Value
Market Value USD
% of Net Assets
Transferable securities and money market instruments admitted to official exchange listing or dealt in on another regulated market
mortgage and asset Backed securities (continued)
United Kingdom (continued)Newgate Funding plc, Reg. S, FRN, Series
2007-3X ‘D’ 3.06% 15/12/2050 GBP 1,352,021 1,747,714 0.15 Oncilla Mortgage Funding plc, Reg. S, FRN,
Series 2016-1 ‘C’ 1.937% 12/12/2043 GBP 4,000,000 5,460,775 0.46 Oncilla Mortgage Funding plc, Reg. S, FRN,
Series 2016-1 ‘D’ 2.037% 12/12/2043 GBP 1,000,000 1,359,898 0.12 Paragon Mortgages No. 12 plc, Reg. S,
FRN, Series 12X ‘A2C’ 0.5% 15/11/2038 USD 175,446 169,416 0.01
Paragon Mortgages No. 13 plc, Reg. S, FRN, Series 13X ‘B1A’ 0.482% 15/01/2039 GBP 879,569 1,176,276 0.10
Paragon Mortgages No. 13 plc, Reg. S, FRN, Series 13X ‘B1B’ 0% 15/01/2039 EUR 2,638,708 3,169,458 0.27
Paragon Mortgages No. 13 plc, Reg. S, FRN, Series 13X ‘C1A’ 0.882% 15/01/2039 GBP 3,958,062 5,273,302 0.45
Residential Mortgage Securities 29 plc, Reg. S, FRN, Series 29 ‘E’ 3.046% 20/12/2046 GBP 1,500,000 2,043,699 0.17
Residential Mortgage Securities 30 plc, Reg. S, FRN, Series 30 ‘D’ 2.087% 20/03/2050 GBP 1,500,000 2,047,592 0.17
Residential Mortgage Securities 31 plc, Reg. S, FRN, Series 31 ‘D’ 2.557% 20/09/2065 GBP 2,000,000 2,740,730 0.23
Resloc UK plc, Reg. S, FRN, Series 2007-1X ‘B1A’ 0% 15/12/2043 EUR 2,333,447 2,651,315 0.22
Resloc UK plc, Reg. S, FRN, Series 2007-1X ‘B1B’ 0.309% 15/12/2043 GBP 1,148,250 1,428,502 0.12
Resloc UK plc, Reg. S, FRN, Series 2007-1X ‘C1A’ 0% 15/12/2043 EUR 921,712 1,023,883 0.09
Resloc UK plc, Reg. S, FRN, Series 2007-1X ‘D1A’ 0.657% 15/12/2043 EUR 972,270 1,046,635 0.09
Resloc UK plc, Reg. S, FRN, Series 2007-1X ‘M1A’ 0% 15/12/2043 EUR 2,070,934 2,401,129 0.20
Ribbon Finance 2018 plc, Reg. S, FRN, Series 2018-1 ‘D’ 1.826% 20/04/2028 GBP 845,010 1,038,047 0.09
RMAC NO 2 plc, Reg. S, FRN, Series 2018-2 ‘B’ 1.485% 12/06/2046 GBP 167,000 228,473 0.02
RMAC Securities No. 1 plc, Reg. S, FRN, Series 2006-NS4X ‘B1C’ 0.362% 12/06/2044 EUR 1,593,441 1,813,397 0.15
RMAC Securities No. 1 plc, Reg. S, FRN, Series 2007-NS1X ‘M2C’ 0% 12/06/2044 EUR 302,697 326,775 0.03
Rochester Financing No. 2 plc, Reg. S, FRN, Series 2 ‘D’ 2.802% 18/06/2045 GBP 2,000,000 2,730,642 0.23
Rochester Financing No. 2 plc, Reg. S, FRN, Series 2 ‘E’ 3.302% 18/06/2045 GBP 1,150,000 1,568,210 0.13
Sage AR Funding No. 1 plc ‘D’, 144A 0% 17/11/2030 GBP 1,500,000 2,059,078 0.17
Small Business Origination Loan Trust DAC, Reg. S, FRN ‘C’ 2.792% 15/12/2027 GBP 600,406 795,215 0.07
Small Business Origination Loan Trust DAC, Reg. S, FRN ‘D’ 3.842% 15/12/2027 GBP 2,101,422 1,768,585 0.15
Small Business Origination Loan Trust DAC, Reg. S, FRN ‘D’ 3.842% 15/03/2028 GBP 2,108,217 2,681,899 0.23
Small Business Origination Loan Trust DAC, Reg. S, FRN, Series 2018-1 ‘D’ 3.042% 15/12/2026 GBP 1,536,829 1,939,179 0.16
Small Business Origination Loan Trust DAC, Reg. S, FRN, Series 2019-3 ‘C’ 3.053% 15/10/2028 GBP 1,868,697 2,441,475 0.21

177 Morgan Stanley Investment Funds 31 December 2020
The accompanying notes are an integral part of these financial statements.
Global Asset Backed Securities Fund (continued)
schEDUlE of InVEsTmEnTsAs at 31 December 2020
Investments Currency
Quantity/Nominal
Value
Market Value USD
% of Net Assets
Transferable securities and money market instruments admitted to official exchange listing or dealt in on another regulated market
mortgage and asset Backed securities (continued)
United Kingdom (continued)Southern Pacific Securities 06-1 plc,
Reg. S, FRN, Series 2006-1X ‘E1C’ 3.81% 10/03/2044 GBP 800,000 1,084,970 0.09
Taurus UK DAC, Reg. S, FRN, Series 2019-UK2 ‘C’ 2.173% 17/11/2029 GBP 1,500,000 1,979,216 0.17
Taurus UK DAC, Reg. S, FRN, Series 2019-UK3 ‘C’ 1.987% 22/06/2029 GBP 2,100,000 2,719,708 0.23
Towd Point Mortgage Funding, FRN, Series 2019-V2A ‘B’, 144A 1.855% 20/02/2054 GBP 3,100,000 4,230,492 0.36
Trinity Square plc, Reg. S, FRN, Series 2016-1 ‘E’ 3.482% 15/07/2051 GBP 2,000,000 2,726,792 0.23
Uropa Securities plc, Reg. S, FRN, Series 2007-1 ‘M1B’ 0% 10/10/2040 EUR 1,070,662 1,203,235 0.10
Uropa Securities plc, Reg. S, FRN, Series 2007-1 ‘M2A’ 0.643% 10/10/2040 GBP 2,141,323 2,591,555 0.22
Uropa Securities plc, Reg. S, FRN, Series 2008-1 ‘M2’ 0.61% 10/06/2059 GBP 642,397 804,933 0.07
187,761,223 15.85
United states of america1345 Avenue of the Americas & Park
Avenue Plaza Trust, Series 2005-1 ‘A3’, 144A 5.278% 10/08/2035 USD 3,437,169 3,665,777 0.31
280 Park Avenue Mortgage Trust, FRN, Series 2017-280P ‘E’, 144A 2.26% 15/09/2034 USD 2,600,000 2,518,948 0.21
Aaset Trust, Series 2019-1 ‘A’, 144A 3.844% 15/05/2039 USD 877,226 832,794 0.07
ABFC Trust ‘M7’ 2.023% 25/06/2034 USD 253,780 255,236 0.02 Accredited Mortgage Loan Trust, FRN,
Series 2004-1 ‘A1’ 0.748% 25/04/2034 USD 1,035,802 1,024,356 0.09 Adjustable Rate Mortgage Trust, FRN,
Series 2004-5 ‘5A1’ 3.007% 25/04/2035 USD 547,626 541,668 0.05
Adjustable Rate Mortgage Trust, FRN, Series 2004-3 ‘CM’ 0.975% 25/02/2035 USD 222,179 223,222 0.02
Alternative Loan Trust, Series 2004-2CB ‘1A9’ 5.75% 25/03/2034 USD 630,745 639,552 0.05
Alternative Loan Trust, Series 2005-J5 ‘1A7’ 5.5% 25/05/2035 USD 583,039 565,131 0.05
Alternative Loan Trust, Series 2005-J1 ‘2A1’ 5.5% 25/02/2025 USD 22,464 22,821 0.00
Alternative Loan Trust, Series 2005-73CB ‘1A1’ 5.5% 25/01/2036 USD 11,879 12,065 0.00
Alternative Loan Trust, Series 2005-79CB ‘A3’ 5.5% 25/01/2036 USD 190,080 156,946 0.01
Alternative Loan Trust, Series 2005-86CB ‘A4’ 5.5% 25/02/2036 USD 2,869 2,377 0.00
Alternative Loan Trust, FRN, Series 2006-14CB ‘A2’ 0.548% 25/06/2036 USD 1,682 728 0.00
Alternative Loan Trust, FRN, Series 2007-22 ‘2A19’ 27.808% 25/09/2037 USD 374,122 606,160 0.05
Alternative Loan Trust, FRN, Series 2007-11T1 ‘A37’ 39.132% 25/05/2037 USD 255,521 549,227 0.05
Alternative Loan Trust, FRN, Series 2007-8CB ‘A4’ 38.112% 25/05/2037 USD 363,736 815,349 0.07
Alternative Loan Trust Resecuritization, FRN, Series 2008-2R ‘2A1’ 6% 25/08/2037 USD 69,713 45,024 0.00
Alternative Loan Trust Resecuritization, FRN, Series 2008-2R ‘4A1’ 6.25% 25/08/2037 USD 182,215 141,478 0.01
schEDUlE of InVEsTmEnTsAs at 31 December 2020
Investments Currency
Quantity/Nominal
Value
Market Value USD
% of Net Assets
Transferable securities and money market instruments admitted to official exchange listing or dealt in on another regulated market
mortgage and asset Backed securities (continued)
United states of america (continued)American Credit Acceptance Receivables
Trust, Series 2018-3 ‘E’, 144A 5.17% 15/10/2024 USD 800,000 835,253 0.07
American Home Mortgage Investment Trust, STEP, Series 2005-1 ‘8A2’ 6% 25/06/2035 USD 1,763,827 1,755,733 0.15
American Homes 4 Rent Trust, Series 2014-SFR2 ‘D’, 144A 5.149% 17/10/2036 USD 725,000 793,821 0.07
American Homes 4 Rent Trust, Series 2014-SFR2 ‘E’, 144A 6.231% 17/10/2036 USD 5,075,000 5,650,285 0.48
American Homes 4 Rent Trust, Series 2014-SFR3 ‘E’, 144A 6.418% 17/12/2036 USD 3,224,000 3,625,367 0.31
American Homes 4 Rent Trust, Series 2015-SFR1 ‘F’, 144A 5.885% 17/04/2052 USD 4,700,000 5,242,935 0.44
Ameriquest Mortgage Securities, Inc., STEP, Series 2004-FR1W ‘A6’ 4.122% 25/05/2034 USD 505,150 518,161 0.04
Ameriquest Mortgage Securities, Inc., FRN, Series 2004-R3 ‘M3’ 2.248% 25/05/2034 USD 1,859,988 1,903,890 0.16
Argent Securities, Inc. Asset-Backed Pass-Through Certificates Trust, FRN, Series 2004-W2 ‘M2’ 2.023% 25/04/2034 USD 611,249 614,286 0.05
Asset-Backed Securities Corp. Home Equity Loan Trust ‘M2’ 2.025% 25/09/2034 USD 3,581,286 3,635,588 0.31
Banc of America Alternative Loan Trust, Series 2005-8 ‘2CB1’ 6% 25/09/2035 USD 363,088 364,626 0.03
Banc of America Alternative Loan Trust, FRN, Series 2006-7 ‘A2’ 5.707% 25/10/2036 USD 503,851 219,324 0.02
Banc of America Commercial Mortgage Trust, Series 2015-UBS7 ‘D’ 3.167% 15/09/2048 USD 484,000 278,167 0.02
Banc of America Funding Trust, Series 2006-6 ‘1A15’ 6.25% 25/08/2036 USD 9,704 9,560 0.00
Banc of America Funding Trust, FRN, Series 2006-I ‘1A2’ 2.909% 20/12/2036 USD 1,680,540 1,653,738 0.14
Banc of America Funding Trust, Series 2005-7 ‘3A1’ 5.75% 25/11/2035 USD 258,156 281,652 0.02
Banc of America Funding Trust, Series 2005-7 ‘3A8’ 5.5% 25/11/2035 USD 22,579 23,211 0.00
Banc of America Funding Trust, Series 2006-2 ‘2A9’ 6% 25/03/2036 USD 29,438 29,379 0.00
Banc of America Funding Trust, Series 2006-3 ‘3A1’ 5.75% 25/03/2036 USD 397,874 413,060 0.03
Banc of America Funding Trust, Series 2007-2 ‘1A7’ 5.75% 25/03/2037 USD 88,305 79,729 0.01
Banc of America Funding Trust, Series 2007-5 ‘5A1’ 5.25% 25/07/2037 USD 70,781 69,948 0.01
Banc of America Mortgage Trust, FRN, Series 2003-B ‘2A7’ 4.372% 25/03/2033 USD 112,420 108,747 0.01
Bayview Commercial Asset Trust, FRN, Series 2005-4A ‘A2’, 144A 0.538% 25/01/2036 USD 689,368 654,061 0.06
Bayview Commercial Asset Trust, FRN, Series 2007-3 ‘A1’, 144A 0.388% 25/07/2037 USD 1,521,583 1,436,061 0.12
Bayview Commercial Mortgage Pass-Through Trust, FRN, Series 2006-SP1 ‘M4’, 144A 1.123% 25/04/2036 USD 1,000,000 999,195 0.08

Morgan Stanley Investment Funds 31 December 2020 178
The accompanying notes are an integral part of these financial statements.
Global Asset Backed Securities Fund (continued)
schEDUlE of InVEsTmEnTsAs at 31 December 2020
Investments Currency
Quantity/Nominal
Value
Market Value USD
% of Net Assets
Transferable securities and money market instruments admitted to official exchange listing or dealt in on another regulated market
mortgage and asset Backed securities (continued)
United states of america (continued)Bayview Financial Revolving Asset Trust,
FRN, Series 2005-A ‘A1’, 144A 1.147% 28/02/2040 USD 2,772,455 2,625,806 0.22
BCMSC Trust, FRN, Series 1998-C ‘M1’ 7.51% 15/01/2029 USD 1,159,896 1,119,310 0.09
Bear Stearns ALT-A Trust, FRN, Series 2004-5 ‘3A1’ 3.698% 25/06/2034 USD 640,768 676,242 0.06
Bear Stearns ALT-A Trust, FRN, Series 2004-1 ‘4A1’ 3.022% 25/02/2034 USD 287,212 297,050 0.02
Bear Stearns ALT-A Trust, FRN, Series 2004-9 ‘5A1’ 3.394% 25/09/2034 USD 556,647 563,533 0.05
Bear Stearns ARM Trust, FRN, Series 2005-12 ‘24A1’ 3.253% 25/02/2036 USD 328,514 333,337 0.03
Bear Stearns ARM Trust ‘2A3’ 3.519% 25/02/2034 USD 86,937 86,824 0.01
Bear Stearns ARM Trust ‘5A’ 2.753% 25/10/2033 USD 1,236,991 1,240,863 0.10
Bear Stearns ARM Trust ‘7A’ 2.703% 25/10/2033 USD 111,265 109,421 0.01
Bear Stearns Asset-Backed Securities I Trust, FRN, Series 2005-TC2 ‘M7’ 4.588% 25/08/2035 USD 1,152,883 1,210,567 0.10
Bear Stearns Asset-Backed Securities I Trust, FRN, Series 2006-AC2 ‘1A2’ 23.493% 25/03/2036 USD 2,343,658 1,687,522 0.14
Bear Stearns Asset-Backed Securities I Trust, STEP, Series 2004-AC3 ‘A2’ 6% 25/06/2034 USD 406,681 420,561 0.04
Bear Stearns Asset-Backed Securities Trust, FRN, Series 2003-1 ‘A1’ 1.148% 25/11/2042 USD 704,929 686,483 0.06
Bella Vista Mortgage Trust, FRN, Series 2004-1 ‘2A1’ 2.762% 20/11/2034 USD 935,726 989,723 0.08
Business Loan Express Business Loan Trust, FRN ‘A’, 144A 0.547% 20/10/2040 USD 2,192,893 1,979,113 0.17
Cascade Funding Mortgage Trust, STEP, Series 2018-RM1 ‘A1’, 144A 4.58% 25/06/2048 USD 2,683,431 2,696,171 0.23
Cascade Funding Mortgage Trust, STEP, Series 2018-RM1 ‘A2’, 144A 5.804% 25/06/2048 USD 800,000 797,129 0.07
Cascade Funding Mortgage Trust, FRN, Series 2018-RM2 ‘B’, 144A 4% 25/10/2068 USD 8,679,756 8,890,231 0.75
Cascade Funding Mortgage Trust, FRN, Series 2018-RM2 ‘C’, 144A 4% 25/10/2068 USD 2,649,586 2,662,743 0.22
Cascade Funding Mortgage Trust ‘D’, 144A 4% 25/10/2068 USD 2,649,586 2,584,512 0.22
Castlelake Aircraft Structured Trust ‘A’, 144A 3.967% 15/04/2039 USD 2,090,691 1,998,409 0.17
CG-CCRE Commercial Mortgage Trust, FRN, Series 2014-FL2 ‘A’, 144A 1.995% 15/11/2031 USD 760,602 729,613 0.06
Chase Funding Loan Acquisition Trust, Series 2003-C2 ‘2A’ 5.5% 25/08/2034 USD 1,075,435 1,128,299 0.10
Chase Mortgage Finance Trust, Series 2004-S2 ‘1A5’ 5.25% 25/02/2034 USD 252,749 266,112 0.02
Chase Mortgage Finance Trust, FRN, Series 2007-S1 ‘A4’ 0.748% 25/02/2037 USD 277,644 76,950 0.01
ChaseFlex Trust, Series 2005-1 ‘2A4’ 5.5% 25/02/2035 USD 290,814 256,199 0.02
CHL GMSR Issuer Trust ‘A’, 144A 2.898% 25/05/2023 USD 4,000,000 3,950,782 0.33
schEDUlE of InVEsTmEnTsAs at 31 December 2020
Investments Currency
Quantity/Nominal
Value
Market Value USD
% of Net Assets
Transferable securities and money market instruments admitted to official exchange listing or dealt in on another regulated market
mortgage and asset Backed securities (continued)
United states of america (continued)CHL Mortgage Pass-Through Trust, FRN,
Series 2004-HYB1 ‘2A’ 3.002% 20/05/2034 USD 346,901 346,363 0.03
CHL Mortgage Pass-Through Trust, Series 2006-J1 ‘2A1’ 5.5% 25/02/2036 USD 214,254 213,985 0.02
CHL Mortgage Pass-Through Trust ‘2A4A’ 3.441% 20/06/2035 USD 1,017,535 1,034,405 0.09
CHL Mortgage Pass-Through Trust ‘3A1’ 2.918% 20/04/2035 USD 229,301 239,349 0.02
CHL Mortgage Pass-Through Trust, Series 2006-J1 ‘3A1’ 6% 25/02/2036 USD 509,409 344,695 0.03
CHL Mortgage Pass-Through Trust, FRN, Series 2005-HYB1 ‘5A1’ 3.544% 25/03/2035 USD 1,676,990 1,726,797 0.15
CHL Mortgage Pass-Through Trust, FRN, Series 2004-22 ‘A1’ 2.771% 25/11/2034 USD 308,438 307,775 0.03
CHL Mortgage Pass-Through Trust, Series 2007-13 ‘A6’ 6% 25/08/2037 USD 80,076 61,653 0.01
CHL Mortgage Pass-Through Trust Resecuritization, Series 2008-2R ‘A1’ 6% 25/12/2036 USD 355,655 296,189 0.02
CIM Small Business Loan Trust, FRN, Series 2018-1A ‘A’, 144A 1.546% 20/03/2043 USD 558,779 552,012 0.05
Citicorp Mortgage Securities Trust, Series 2006-6 ‘A4’ 6% 25/11/2036 USD 52,378 53,615 0.00
Citicorp Residential Mortgage Trust, STEP, Series 2007-1 ‘A5’ 5.165% 25/03/2037 USD 2,628,285 2,716,260 0.23
Citigroup Commercial Mortgage Trust, FRN, Series 2015-GC33 ‘C’ 4.724% 10/09/2058 USD 825,000 806,569 0.07
Citigroup Commercial Mortgage Trust, IO, FRN, Series 2015-GC33 ‘XA’ 1.04% 10/09/2058 USD 7,956,070 279,991 0.02
Citigroup Mortgage Loan Trust, Series 2006-4 ‘2A1A’ 6% 25/12/2035 USD 403,068 407,099 0.03
Citigroup Mortgage Loan Trust, Inc., FRN, Series 2005-2 ‘1A1’ 3.64% 25/05/2035 USD 178,689 181,394 0.02
Citigroup Mortgage Loan Trust, Inc., FRN, Series 2005-2 ‘1A4’ 3.379% 25/05/2035 USD 1,109,034 1,131,734 0.10
Citigroup Mortgage Loan Trust, Inc., FRN, Series 2005-SHL1 ‘M3’, 144A 3.15% 25/07/2044 USD 1,000,000 1,044,958 0.09
COMM Mortgage Trust, FRN, Series 2014-CR18 ‘D’, 144A 4.901% 15/07/2047 USD 306,000 260,342 0.02
COMM Mortgage Trust, IO, FRN, Series 2014-CR14 ‘XA’ 0.727% 10/02/2047 USD 9,030,926 140,644 0.01
COMM Mortgage Trust, IO, FRN, Series 2014-LC17 ‘XA’ 0.875% 10/10/2047 USD 4,278,159 93,016 0.01
Commercial Mortgage Lease-Backed Certificates Trust, FRN, Series 2001-CMLB ‘E’, 144A 8.25% 20/06/2031 USD 1,776,000 1,817,712 0.15
Community Program Loan Trust, Series 1987-A ‘B’ 4.5% 01/10/2029 USD 159,507 160,294 0.01
Consumer Loan Underlying Bond Credit Trust, Series 2017-P1 ‘C’, 144A 5.02% 15/09/2023 USD 310,264 312,741 0.03
COOF Securitization Trust ‘A’, 144A 2.406% 25/10/2040 USD 2,990,587 189,786 0.02
COOF Securitization Trust II ‘A1’, 144A 2.218% 25/08/2041 USD 12,634,921 877,697 0.07
Countrywide, FRN, Series 2004-SD2 ‘M1’, 144A 1.078% 25/06/2033 USD 203,006 201,878 0.02

179 Morgan Stanley Investment Funds 31 December 2020
The accompanying notes are an integral part of these financial statements.
Global Asset Backed Securities Fund (continued)
schEDUlE of InVEsTmEnTsAs at 31 December 2020
Investments Currency
Quantity/Nominal
Value
Market Value USD
% of Net Assets
Transferable securities and money market instruments admitted to official exchange listing or dealt in on another regulated market
mortgage and asset Backed securities (continued)
United states of america (continued)Countrywide, FRN, Series 2005-BC4 ‘M7’
1.873% 25/05/2035 USD 2,000,000 2,001,848 0.17 Credit Suisse First Boston Mortgage
Securities Corp., FRN, Series 2002-AR2 ‘2B’ 3.448% 25/02/2032 USD 785,999 769,944 0.06
Credit Suisse First Boston Mortgage Securities Corp., FRN, Series 2003-AR28 ‘5A1’ 2.877% 25/12/2033 USD 3,222,026 3,368,702 0.28
Credit Suisse First Boston Mortgage Securities Corp., FRN, Series 2004-AR7 ‘2A1’ 3.294% 25/11/2034 USD 214,599 224,995 0.02
Credit Suisse First Boston Mortgage Securities Corp. ‘3A2’ 2.496% 25/11/2033 USD 222,090 222,334 0.02
Credit-Based Asset Servicing and Securitization LLC, FRN, Series 2002-CB1 ‘B1’ 3.223% 25/08/2030 USD 168,707 171,271 0.01
Credit-Based Asset Servicing and Securitization LLC, STEP, Series 2006-MH1 ‘B1’, 144A 6.25% 25/10/2036 USD 1,651,000 1,725,518 0.15
CSAIL Commercial Mortgage Trust, FRN, Series 2017-CX10 ‘UESC’, 144A 4.378% 15/10/2032 USD 1,000,000 969,751 0.08
CSFB Mortgage-Backed Pass-Through Certificates Trust, Series 2002-29 ‘1B1’ 7.5% 25/10/2032 USD 374,584 392,766 0.03
CSFB Mortgage-Backed Pass-Through Certificates Trust, FRN, Series 2003-AR18 ‘2A2’ 3.035% 25/07/2033 USD 295,648 297,869 0.02
CSFB Mortgage-Backed Pass-Through Certificates Trust, FRN, Series 2003-AR24 ‘2A4’ 3.139% 25/10/2033 USD 1,114,078 1,177,842 0.10
CSFB Mortgage-Backed Pass-Through Certificates Trust, FRN, Series 2004-AR4 ‘2A1’ 3.329% 25/05/2034 USD 878,291 900,003 0.08
CSFB Mortgage-Backed Pass-Through Certificates Trust, FRN, Series 2004-AR4 ‘3A1’ 3.316% 25/05/2034 USD 2,024,718 2,086,421 0.18
CSFB Mortgage-Backed Pass-Through Certificates Trust, Series 2003-27 ‘7A1’ 5.5% 25/11/2033 USD 204,851 210,984 0.02
CSMC Mortgage-Backed Trust, Series 2007-5 ‘2A5’ 5% 25/08/2037 USD 449,509 463,358 0.04
CSMC Mortgage-Backed Trust, Series 2006-4 ‘3A1’ 6.5% 25/05/2036 USD 1,917,536 1,077,564 0.09
CWABS Trust, FRN, Series 2004-15 ‘MV6’ 1.723% 25/03/2035 USD 4,380,000 4,324,129 0.36
Deephaven Residential Mortgage Trust ‘A2’, 144A 2.928% 26/12/2046 USD 457,661 460,844 0.04
DT Auto Owner Trust, Series 2018-1A ‘E’, 144A 5.42% 17/03/2025 USD 3,000,000 3,081,696 0.26
EMC Mortgage Loan Trust, FRN, Series 2004-C ‘M1’, 144A 1.648% 25/11/2030 USD 281,317 280,709 0.02
EquiFirst Mortgage Loan Trust, FRN, Series 2004-2 ‘M6’ 2.323% 25/10/2034 USD 353,259 359,124 0.03
Equity One Mortgage Pass-Through Trust, FRN, Series 2002-4 ‘M1’ 5.221% 25/02/2033 USD 113,999 115,788 0.01
Exeter Automobile Receivables Trust, Series 2017-3A ‘D’, 144A 5.28% 15/10/2024 USD 1,000,000 1,047,627 0.09
Exeter Automobile Receivables Trust, Series 2018-2A ‘E’, 144A 5.33% 15/05/2025 USD 1,500,000 1,565,844 0.13
FHLMC G07848 3.5% 01/04/2044 USD 1,023,979 1,131,327 0.10
schEDUlE of InVEsTmEnTsAs at 31 December 2020
Investments Currency
Quantity/Nominal
Value
Market Value USD
% of Net Assets
Transferable securities and money market instruments admitted to official exchange listing or dealt in on another regulated market
mortgage and asset Backed securities (continued)
United states of america (continued)FHLMC G60038 3.5% 01/01/2044 USD 609,523 662,555 0.06 FHLMC Q26692 4% 01/06/2044 USD 1,117,288 1,229,454 0.10 FHLMC Q26694 4% 01/06/2044 USD 798,249 882,338 0.07 FHLMC Q29048 4% 01/10/2044 USD 358,409 391,358 0.03 FHLMC Q32407 3.5% 01/06/2045 USD 881,966 964,540 0.08 FHLMC QU7287 4% 01/09/2049 USD 1,253,162 1,303,776 0.11 FHLMC RE6004 3.5% 01/08/2049 USD 1,542,278 1,601,210 0.13 FHLMC RE6006 4% 01/07/2049 USD 805,158 836,911 0.07 FHLMC RE6015 3.5% 01/09/2049 USD 762,912 792,791 0.07 FHLMC RE6028 3% 01/04/2050 USD 5,553,171 5,727,974 0.48 FHLMC RE6034 3.5% 01/04/2050 USD 1,625,372 1,680,949 0.14 FHLMC RE6043 2.5% 01/04/2050 USD 4,017,173 4,164,661 0.35 FHLMC T65104 2.5% 01/11/2042 USD 2,127,489 2,217,810 0.19 FHLMC T65531 4.5% 01/01/2049 USD 315,397 342,631 0.03 FHLMC REMICS, IO, FRN, Series 4365 ‘AI’
2.991% 15/08/2042 USD 1,987,239 94,556 0.01 FHLMC REMICS, IO, Series 4259 ‘IA’ 5%
15/08/2041 USD 260,874 33,350 0.00FHLMC REMICS ‘IJ’ 2% 25/02/2050 USD 13,131,536 952,566 0.08 FHLMC REMICS, IO, FRN, Series 4314 ‘IT’
2.852% 15/04/2039 USD 1,414,120 76,935 0.01 FHLMC REMICS ‘JI’ 2% 25/12/2050 USD 20,559,307 1,624,459 0.14 FHLMC REMICS, IO, FRN, Series 4363
2.878% 15/09/2041 USD 4,241,901 247,832 0.02 FHLMC REMICS, IO, FRN, Series 4348 ‘SA’
2.65% 15/10/2040 USD 2,746,032 159,580 0.01 FHLMC REMICS, FRN, Series 4286 ‘SC’
11.602% 15/12/2043 USD 708,342 902,103 0.08 FHLMC REMICS, IO, FRN, Series 4265 ‘ST’
5.841% 15/11/2043 USD 2,390,334 411,509 0.03 FHLMC REMICS, IO, FRN, Series 4363 ‘TI’
2.916% 15/10/2039 USD 1,416,744 73,531 0.01 FHLMC REMICS, IO, FRN, Series 2962 ‘BS’
350315 6.491% 15/03/2035 USD 967,101 110,337 0.01 FHLMC STRIPS, IO, FRN, Series 343 ‘S4’
1.838% 15/10/2037 USD 7,518,892 315,405 0.03 FHLMC Structured Agency Credit Risk Debt
Notes, FRN, Series 2015-DNA2 ‘M3’ 4.05% 25/12/2027 USD 969,298 986,378 0.08
FHLMC Whole Loan Securities Trust, Series 2016-SC01 ‘1A’ 3% 25/07/2046 USD 1,895,343 1,933,327 0.16
FHLMC Whole Loan Securities Trust, Series 2017-SC01 ‘1A’ 3% 25/12/2046 USD 1,463,040 1,489,687 0.13
FHLMC Whole Loan Securities Trust, Series 2017-SC02 ‘1A’ 3% 25/05/2047 USD 3,849,517 3,888,303 0.33
FHLMC Whole Loan Securities Trust, Series 2016-SC01 ‘2A’ 3.5% 25/07/2046 USD 339,465 348,619 0.03
FHLMC Whole Loan Securities Trust, Series 2017-SC01 ‘2A’ 3.5% 25/12/2046 USD 575,646 590,640 0.05
FHLMC Whole Loan Securities Trust, FRN, Series 2017-SC02 ‘M2’, 144A 3.823% 25/05/2047 USD 950,000 953,054 0.08
Financial Asset Securities Corp. AAA Trust, FRN, Series 2005-1A ‘1A3A’, 144A 0.525% 27/02/2035 USD 769,835 720,367 0.06
First Horizon Alternative Mortgage Securities Trust, Series 2006-FA3 ‘A6’ 6% 25/07/2036 USD 3,624 2,508 0.00
First Horizon Mortgage Pass-Through Trust, FRN, Series 2007-AR3 ‘2A2’ 3.139% 25/11/2037 USD 248,123 237,714 0.02
First Horizon Mortgage Pass-Through Trust, FRN, Series 2006-AR2 ‘3A1’ 3.095% 25/07/2036 USD 949,486 936,698 0.08

Morgan Stanley Investment Funds 31 December 2020 180
The accompanying notes are an integral part of these financial statements.
Global Asset Backed Securities Fund (continued)
schEDUlE of InVEsTmEnTsAs at 31 December 2020
Investments Currency
Quantity/Nominal
Value
Market Value USD
% of Net Assets
Transferable securities and money market instruments admitted to official exchange listing or dealt in on another regulated market
mortgage and asset Backed securities (continued)
United states of america (continued)Flagship Credit Auto Trust, Series
2018-1 ‘E’, 144A 5.1% 15/05/2025 USD 1,000,000 1,043,060 0.09 FMC GMSR Issuer Trust ‘A’, 144A 4.45%
25/01/2026 USD 4,000,000 3,998,456 0.34 FMC GMSR Issuer Trust, FRN, Series
2019-GT1 ‘A’, 144A 5.07% 25/05/2024 USD 6,000,000 6,081,728 0.51 FNMA ‘X1’ 0.564% 25/08/2027 USD 48,190,568 1,281,975 0.11 FNMA AS5718 3.5% 01/08/2045 USD 563,087 593,107 0.05 FNMA AS6580 3.5% 01/02/2046 USD 584,104 627,319 0.05 FNMA BM4835 3.5% 01/11/2048 USD 1,678,609 1,763,383 0.15 FNMA BN4512 4% 01/01/2049 USD 489,588 521,811 0.04 FNMA BN5999 3.5% 01/02/2049 USD 364,632 384,727 0.03 FNMA BP1344 2.5% 01/03/2050 USD 1,828,039 1,923,409 0.16 FNMA BP1382 2.5% 01/03/2050 USD 6,363,283 6,695,719 0.57 FNMA BP1584 3% 01/02/2050 USD 2,820,331 2,937,963 0.25 FNMA BP4337 2.5% 01/03/2050 USD 4,477,546 4,711,781 0.40 FNMA BQ1271 2% 01/08/2050 USD 4,170,101 4,276,792 0.36 FNMA BQ2948 2% 01/09/2050 USD 4,291,125 4,450,337 0.38 FNMA BQ8750 2% 01/11/2050 USD 6,150,000 6,307,346 0.53 FNMA CA4613 3.5% 01/11/2049 USD 2,424,675 2,520,418 0.21 FNMA MA3046 3% 01/05/2047 USD 244,778 252,699 0.02 FNMA MA3257 3.5% 01/01/2048 USD 862,820 899,010 0.08 FNMA MA3474 4.5% 01/09/2048 USD 417,738 442,078 0.04 FNMA MA3647 3.5% 01/04/2049 USD 203,637 211,608 0.02 FNMA MA3652 4.5% 01/03/2049 USD 1,776,199 1,879,374 0.16 FNMA MA3672 3% 01/05/2049 USD 1,103,401 1,138,496 0.10 FNMA MA3677 4.5% 01/04/2049 USD 306,836 324,766 0.03 FNMA MA3703 3% 01/05/2049 USD 188,567 194,570 0.02 FNMA MA3713 4.5% 01/06/2049 USD 1,537,281 1,626,136 0.14 FNMA MA3725 3.5% 01/07/2049 USD 2,601,295 2,702,883 0.23 FNMA MA3727 4.5% 01/06/2049 USD 811,717 858,736 0.07 FNMA MA3752 3% 01/08/2049 USD 1,175,225 1,212,857 0.10 FNMA MA3754 4% 01/08/2049 USD 1,909,552 1,986,266 0.17 FNMA MA3763 4.5% 01/08/2049 USD 1,348,215 1,425,559 0.12 FNMA MA3779 5% 01/08/2049 USD 347,610 371,381 0.03 FNMA MA3785 4% 01/09/2049 USD 1,519,289 1,580,630 0.13 FNMA MA3820 2.5% 01/10/2049 USD 611,731 634,486 0.05 FNMA MA3846 3% 01/11/2049 USD 1,832,454 1,887,177 0.16 FNMA MA3876 3% 01/12/2049 USD 2,268,947 2,331,638 0.20 FNMA MA3881 4% 01/12/2049 USD 738,766 768,635 0.06 FNMA MA3913 3% 01/01/2050 USD 1,545,382 1,595,006 0.13 FNMA MA3914 2.5% 01/01/2050 USD 1,704,127 1,767,399 0.15 FNMA MA3917 5% 01/01/2050 USD 412,767 440,494 0.04 FNMA MA3919 4% 01/01/2050 USD 1,376,419 1,431,594 0.12 FNMA MA3997 3% 01/04/2050 USD 1,473,580 1,513,922 0.13 FNMA MA4025 2.5% 01/05/2050 USD 3,767,336 3,907,891 0.33 FNMA MA4191 2% 01/11/2050 USD 4,987,545 5,119,972 0.43 FNMA MA4215 2% 01/12/2050 USD 6,985,250 7,171,424 0.61 FNMA ACES, IO, FRN, Series 2014-M2 ‘X3’
0.189% 25/12/2023 USD 30,592,685 226,854 0.02 FNMA REMICS, IO, FRN, Series 2016-15
‘AS’ 2.31% 25/03/2046 USD 7,304,716 438,214 0.04 FNMA REMICS, IO, FRN, Series 2014-10
‘CS’ 2.797% 25/03/2044 USD 1,155,916 62,150 0.01 FNMA REMICS, IO, FRN, Series 2014-23
‘SA’ 2.499% 25/10/2039 USD 2,073,579 98,663 0.01 FNMA REMICS, IO, FRN, Series 2013-12
‘SP’ 5.502% 25/11/2041 USD 75,223 6,045 0.00FNMA REMICS, IO, FRN, Series 2012-56
‘SQ’ 5.902% 25/06/2042 USD 3,311,414 641,834 0.05 Fremont Home Loan Trust, FRN, Series
2005-D ‘M1’ 0.765% 25/11/2035 USD 2,500,000 2,328,872 0.20 Galton Funding Mortgage Trust ‘A22’,
144A 4% 25/11/2057 USD 1,119,650 1,164,758 0.10 GLS Auto Receivables Trust, Series 2018-
1A ‘C’, 144A 5.02% 15/01/2025 USD 2,400,000 2,481,854 0.21
schEDUlE of InVEsTmEnTsAs at 31 December 2020
Investments Currency
Quantity/Nominal
Value
Market Value USD
% of Net Assets
Transferable securities and money market instruments admitted to official exchange listing or dealt in on another regulated market
mortgage and asset Backed securities (continued)
United states of america (continued)GLS Auto Receivables Trust, Series
2018-3A ‘D’, 144A 5.34% 15/08/2025 USD 1,000,000 1,053,883 0.09 GNMA ‘AI’ 2.124% 20/04/2069 USD 30,741,115 1,885,605 0.16 GNMA ‘DI’ 1.463% 20/08/2069 USD 22,926,383 1,305,967 0.11 GNMA, IO, Series 2011-136 ‘IG’ 4.5%
20/05/2040 USD 573,717 38,534 0.00GNMA, IO, Series 2012-128 ‘IG’ 3.5%
16/10/2042 USD 247,917 42,407 0.00GNMA, IO, Series 2013-71 ‘IG’ 3.5%
20/05/2043 USD 6,208,252 651,154 0.05 GNMA, IO, Series 2013-41 ‘LI’ 4%
20/01/2041 USD 2,604,376 67,644 0.01 GNMA, IO, Series 2013-71 ‘MI’ 3.5%
20/06/2041 USD 849,110 52,901 0.00GNMA, IO, Series 2012-57 ‘NI’ 5%
20/10/2040 USD 210,019 15,830 0.00GNMA, IO, Series 2013-60 3.5%
20/04/2043 USD 1,074,615 155,624 0.01 GNMA, IO, FRN, Series 2013-182 ‘NS’
5.988% 20/12/2043 USD 6,738,308 1,639,661 0.14 GNMA, IO, Series 2012-122 ‘PI’ 4%
20/04/2042 USD 1,992,012 223,988 0.02 GNMA, IO, FRN, Series 2006-49 ‘SA’
6.308% 20/02/2036 USD 33,660 115 0.00GNMA, IO, FRN, Series 2013-124 ‘SB’
5.998% 20/10/2041 USD 1,020,560 39,986 0.00GNMA, IO, FRN, Series 2013-135 ‘SM’
6.148% 20/09/2043 USD 3,453,435 488,820 0.04 GNMA, IO, FRN, Series 2011-94 ‘SU’
5.948% 20/04/2041 USD 647,771 107,821 0.01 GNMA ‘YI’ 2% 20/11/2050 USD 39,903,326 3,149,462 0.27 GNMA AE8503 4% 15/07/2044 USD 499,622 540,546 0.05 GNMA AJ9334 3.5% 20/10/2044 USD 582,169 644,435 0.05 GNMA AM7358 3.5% 20/05/2045 USD 187,531 207,669 0.02 GNMA BG8526 5% 20/07/2048 USD 139,325 152,868 0.01 GNMA BK5991 5% 20/12/2048 USD 230,831 249,602 0.02 GNMA BK6472 5% 20/02/2049 USD 104,029 111,504 0.01 GNMA BL6438 4.5% 20/04/2049 USD 764,831 822,140 0.07 GNMA BM4130 4% 20/11/2049 USD 955,052 1,017,948 0.09 GNMA BM4136 4.5% 20/07/2049 USD 1,472,024 1,580,157 0.13 GNMA MA5642 4.5% 20/12/2048 USD 150,168 159,974 0.01 GNMA MA5809 5% 20/03/2049 USD 157,020 170,225 0.01 GNMA MA5868 5% 20/04/2049 USD 1,599,131 1,721,432 0.15 GNMA MA5923 4.5% 20/05/2049 USD 664,814 708,061 0.06 GNMA MA5924 5% 20/05/2049 USD 443,168 470,654 0.04 GNMA MA5978 4.5% 20/06/2049 USD 1,513,177 1,611,608 0.14 GNMA MA5980 5.5% 20/05/2049 USD 598,094 661,925 0.06 GNMA MA6032 4.5% 20/07/2049 USD 859,106 914,930 0.08 GNMA MA6034 5.5% 20/05/2049 USD 312,092 312,092 0.03 GNMA MA6331 4% 20/12/2049 USD 1,157,841 1,215,013 0.10 GNMA MA6332 4.5% 20/12/2049 USD 1,428,937 1,508,170 0.13 GNMA MA6400 3.5% 20/01/2050 USD 1,057,514 1,107,248 0.09 GNMA MA6465 3.5% 20/02/2050 USD 1,040,124 1,078,725 0.09 GS Mortgage Securities Corp. Trust ‘A’,
144A 1.079% 15/07/2025 USD 3,601,863 3,540,713 0.30 GS Mortgage Securities Corp. Trust, IO,
FRN, Series 2017-SLP ‘XB’, 144A 0.61% 10/10/2032 USD 49,460,000 357,566 0.03
GS Mortgage Securities Trust, Series 2015-GC32 ‘D’ 3.345% 10/07/2048 USD 1,700,000 1,515,156 0.13
GS Mortgage Securities Trust, IO, FRN, Series 2014-GC24 ‘XA’ 0.865% 10/09/2047 USD 6,896,603 153,634 0.01
GS Mortgage Securities Trust, IO, FRN, Series 2015-590M ‘XA’, 144A 0.311% 10/10/2035 USD 30,000,000 280,446 0.02

181 Morgan Stanley Investment Funds 31 December 2020
The accompanying notes are an integral part of these financial statements.
Global Asset Backed Securities Fund (continued)
schEDUlE of InVEsTmEnTsAs at 31 December 2020
Investments Currency
Quantity/Nominal
Value
Market Value USD
% of Net Assets
Transferable securities and money market instruments admitted to official exchange listing or dealt in on another regulated market
mortgage and asset Backed securities (continued)
United states of america (continued)GSAA Home Equity Trust, FRN, Series
2006-20 ‘2A1A’ 0.25% 25/12/2046 USD 681,359 433,834 0.04 GSAA Home Equity Trust, FRN, Series
2006-5 ‘2A2’ 0.508% 25/03/2036 USD 478,314 226,392 0.02 GSMPS Mortgage Loan Trust, Series
2005-RP3 ‘1A4’, 144A 8.5% 25/09/2035 USD 363,935 391,191 0.03
GSMPS Mortgage Loan Trust, FRN, Series 1998-4 ‘A’, 144A 4.466% 19/12/2026 USD 58,575 57,704 0.00
GSMPS Mortgage Loan Trust, Series 2003-3 ‘A1’, 144A 7% 25/06/2043 USD 200,636 228,999 0.02
GSR Mortgage Loan Trust ‘1A3’ 3.072% 25/06/2034 USD 528,375 521,988 0.04
GSR Mortgage Loan Trust, Series 2005-3F ‘1A3’ 5.5% 25/03/2035 USD 1,382,958 1,484,120 0.13
GSR Mortgage Loan Trust, FRN, Series 2004-14 ‘3A1’ 2.833% 25/12/2034 USD 819,066 843,489 0.07
GSR Mortgage Loan Trust, Series 2005-7F ‘3A10’ 6% 25/09/2035 USD 911,169 955,947 0.08
GSR Mortgage Loan Trust, FRN, Series 2005-AR3 ‘6A1’ 3.467% 25/05/2035 USD 10,117 9,734 0.00
HarborView Mortgage Loan Trust, FRN, Series 2006-2 ‘1A’ 3.148% 25/02/2036 USD 254,808 117,421 0.01
HarborView Mortgage Loan Trust, FRN, Series 2007-2 ‘2A1A’ 0.31% 25/05/2038 USD 521,834 468,378 0.04
HarborView Mortgage Loan Trust, FRN, Series 2003-1 ‘A’ 3.038% 19/05/2033 USD 777,609 792,358 0.07
Headlands Residential LLC, STEP, Series 2019-RPL1 ‘NOTE’, 144A 3.967% 25/06/2024 USD 1,000,000 1,006,601 0.08
Home Equity Asset Trust, FRN, Series 2003-1 ‘M1’ 1.65% 25/06/2033 USD 553,137 557,390 0.05
Home Equity Asset Trust ‘M2’ 2.45% 25/08/2033 USD 579,017 574,004 0.05
Home Equity Mortgage Loan Asset-Backed Trust SPMD, FRN, Series 2000-C ‘AV’ 0.65% 25/12/2031 USD 1,270,020 1,240,198 0.10
Home Equity Mortgage Loan Asset-Backed Trust SPMD, FRN, Series 2004-A ‘M2’ 2.173% 25/07/2034 USD 439,721 441,245 0.04
Home Equity Mortgage Loan Asset-Backed Trust SPMD, FRN, Series 2004-B ‘M4’ 1.873% 25/11/2034 USD 365,205 360,215 0.03
Home Partners of America Trust, FRN, Series 2018-1 ‘E’, 144A 1.987% 17/07/2037 USD 4,500,000 4,521,077 0.38
Home Partners of America Trust, FRN, Series 2017-1 ‘F’, 144A 3.675% 17/07/2034 USD 4,000,000 4,011,184 0.34
Impac CMB Trust, FRN, Series 2004-8 ‘1A’ 0.868% 25/10/2034 USD 355,282 342,277 0.03
Impac CMB Trust, FRN, Series 2004-5 ‘1M1’ 0.943% 25/10/2034 USD 65,073 64,109 0.01
Impac CMB Trust, FRN, Series 2004-5 ‘1M4’ 1.798% 25/10/2034 USD 173,991 174,639 0.01
Impac CMB Trust, FRN, Series 2004-11 ‘2A1’ 0.81% 25/03/2035 USD 527,071 524,264 0.04
Impac CMB Trust, STEP, Series 2003-4 ‘3M2’ 5.729% 25/07/2033 USD 147,889 150,261 0.01
IndyMac INDX Mortgage Loan Trust, FRN, Series 2004-AR11 ‘2A’ 3.027% 25/12/2034 USD 357,954 363,846 0.03
IndyMac INDX Mortgage Loan Trust, FRN, Series 2004-AR10 ‘2A1’ 0.948% 25/05/2034 USD 222,996 209,029 0.02
schEDUlE of InVEsTmEnTsAs at 31 December 2020
Investments Currency
Quantity/Nominal
Value
Market Value USD
% of Net Assets
Transferable securities and money market instruments admitted to official exchange listing or dealt in on another regulated market
mortgage and asset Backed securities (continued)
United states of america (continued)IndyMac INDX Mortgage Loan Trust, FRN,
Series 2004-AR15 ‘2A1’ 4.198% 25/02/2035 USD 693,463 701,831 0.06
IndyMac INDX Mortgage Loan Trust ‘5A1’ 3.014% 25/10/2034 USD 784,805 796,657 0.07
InTown Hotel Portfolio Trust, FRN, Series 2018-STAY ‘D’, 144A 2.191% 15/01/2033 USD 1,200,000 1,169,215 0.10
Invitation Homes Trust, FRN, Series 2018-SFR1 ‘E’, 144A 2.136% 17/03/2037 USD 5,999,180 6,011,458 0.51
Invitation Homes Trust, FRN, Series 2018-SFR3 ‘F’, 144A 2.386% 17/07/2037 USD 15 15 0.00
J.P. Morgan Chase Commercial Mortgage Securities Trust, IO, FRN, Series 2016-JP4 ‘XA’ 0.817% 15/12/2049 USD 7,293,113 192,283 0.02
J.P. Morgan Mortgage Acquisition Trust, STEP, Series 2006-CH2 ‘AF4’ 5.763% 25/10/2036 USD 126,565 101,509 0.01
J.P. Morgan Mortgage Trust, FRN, Series 2007-A1 ‘1A1’ 3.252% 25/07/2035 USD 854,694 875,553 0.07
J.P. Morgan Mortgage Trust, FRN, Series 2008-R2 ‘1A1’, 144A 3.22% 27/07/2037 USD 258,669 267,309 0.02
J.P. Morgan Mortgage Trust, FRN, Series 2005-A6 ‘1A2’ 2.942% 25/09/2035 USD 75,738 76,648 0.01
J.P. Morgan Mortgage Trust, FRN, Series 2007-A2 ‘2A3’ 3.587% 25/04/2037 USD 112,713 102,777 0.01
J.P. Morgan Mortgage Trust, FRN, Series 2003-A1 ‘4A4’ 2.475% 25/10/2033 USD 654,259 653,344 0.05
J.P. Morgan Mortgage Trust, FRN, Series 2004-A5 ‘4A4’ 2.513% 25/12/2034 USD 182,962 180,030 0.02
JPMBB Commercial Mortgage Securities Trust, FRN, Series 2014-C19 ‘D’, 144A 4.832% 15/04/2047 USD 1,025,000 937,596 0.08
KGS-Alpha SBA COOF Trust, IO, FRN, Series 2013-2 ‘A’, 144A 1.711% 25/03/2039 USD 5,077,390 207,868 0.02
KGS-Alpha SBA COOF Trust, IO, FRN, Series 2014-2 ‘A’, 144A 2.777% 25/04/2040 USD 4,184,400 355,473 0.03
KGS-Alpha SBA COOF Trust, IO, FRN, Series 2015-2 ‘A’, 144A 2.675% 25/07/2041 USD 2,889,762 356,798 0.03
KGS-ALPHA SBA COOF Trust ‘A’, 144A 0.649% 25/10/2040 USD 8,146,884 148,049 0.01
Ladder Capital Commercial Mortgage Mortgage Trust, IO, FRN, Series 2013-GCP ‘XA’, 144A 1.344% 15/02/2036 USD 7,868,465 546,932 0.05
Lehman ABS Manufactured Housing Contract Trust, FRN, Series 2001-B ‘M1’ 6.63% 15/04/2040 USD 1,430,050 1,529,233 0.13
LHOME Mortgage Trust, Series 2019-RTL3 ‘A1’, 144A 3.868% 25/07/2024 USD 1,800,000 1,823,511 0.15
LHOME Mortgage Trust, Series 2020-RTL1 ‘A1’, 144A 3.228% 25/10/2024 USD 2,500,000 2,521,665 0.21
Loanpal Solar Loan Ltd. ‘A’, 144A 2.47% 20/12/2047 USD 2,689,858 2,709,942 0.23
Long Beach Mortgage Loan Trust ‘A1’ 0.586% 21/04/2031 USD 1,020,846 1,002,420 0.08
Luminent Mortgage Trust, Series 2007-2 ‘2A1’ 0.61% 25/05/2037 USD 4,247,401 3,873,246 0.33
LUNAR AIRCRAFT Ltd. ‘A’, 144A 3.376% 15/02/2045 USD 615,331 584,122 0.05
MASTR Adjustable Rate Mortgages Trust, FRN, Series 2004-15 ‘1A1’ 3.211% 25/12/2034 USD 128,017 126,912 0.01

Morgan Stanley Investment Funds 31 December 2020 182
The accompanying notes are an integral part of these financial statements.
Global Asset Backed Securities Fund (continued)
schEDUlE of InVEsTmEnTsAs at 31 December 2020
Investments Currency
Quantity/Nominal
Value
Market Value USD
% of Net Assets
Transferable securities and money market instruments admitted to official exchange listing or dealt in on another regulated market
mortgage and asset Backed securities (continued)
United states of america (continued)MASTR Adjustable Rate Mortgages Trust,
FRN, Series 2004-15 ‘2A1’ 2.869% 25/12/2034 USD 2,612,364 2,640,316 0.22
MASTR Adjustable Rate Mortgages Trust, FRN, Series 2004-11 ‘M2’ 1.75% 25/11/2034 USD 648,504 658,980 0.06
MASTR Alternative Loan Trust, Series 2003-3 ‘2A5’ 6% 25/05/2033 USD 858,565 901,078 0.08
MASTR Alternative Loan Trust, Series 2005-1 ‘6A5’ 5.5% 25/02/2035 USD 1,141,243 1,216,175 0.10
MASTR Asset Securitization Trust, Series 2004-5 ‘1A5’ 5.25% 25/05/2034 USD 182,325 187,980 0.02
MASTR Asset Securitization Trust, FRN, Series 2002-NC1 ‘M3’ 3.3% 25/10/2032 USD 1,618,439 1,635,234 0.14
Mastr Asset-Backed Securities Trust, FRN, Series 2004-OPT2 ‘A2’ 0.85% 25/09/2034 USD 803,710 777,441 0.07
Mastr Asset-Backed Securities Trust, FRN, Series 2003-WMC1 ‘M1’ 1.65% 25/05/2033 USD 474,029 469,094 0.04
Mastr Asset-Backed Securities Trust, FRN, Series 2004-HE1 ‘M5’ 2.175% 25/09/2034 USD 1,000,000 1,001,369 0.08
Mastr Asset-Backed Securities Trust, FRN, Series 2004-HE1 ‘M6’ 2.625% 25/09/2034 USD 1,764,000 1,791,968 0.15
MASTR Reperforming Loan Trust, Series 2005-2 ‘1A2’, 144A 7% 25/05/2035 USD 69,486 64,168 0.01
MERIT Securities Corp., FRN, Series 11PA ‘B3’, 144A 2.398% 28/09/2032 USD 511,430 400,080 0.03
MERIT Securities Corp., STEP, Series 13 ‘M1’ 7.776% 28/12/2033 USD 778,070 809,818 0.07
Merrill Lynch Mortgage Investors Trust, FRN, Series 2005-1 ‘2A2’ 2.564% 25/04/2035 USD 175,155 172,042 0.01
Merrill Lynch Mortgage Investors Trust, FRN, Series 2007-1 ‘3A’ 3.248% 25/01/2037 USD 250,930 264,517 0.02
Merrill Lynch Mortgage Investors Trust, FRN, Series 2004-FM1 ‘B1’ 2.85% 25/01/2035 USD 1,433,412 1,422,399 0.12
METAL LLC, Series 2017-1 ‘A’, 144A 4.581% 15/10/2042 USD 2,490,019 1,996,611 0.17
MFA LLC, Series 2018-NPL1 ‘A1’, 144A 3.875% 25/05/2048 USD 3,301,369 3,313,999 0.28
MFA LLC, STEP, Series 2018-NPL2 ‘A1’, 144A 4.164% 25/07/2048 USD 2,991,327 3,007,449 0.25
Morgan Stanley ABS Capital I, Inc. Trust ‘A4’ 0.948% 25/03/2034 USD 1,239,797 1,167,802 0.10
Morgan Stanley ABS Capital I, Inc. Trust ‘A4’ 0.908% 25/09/2034 USD 304,448 272,973 0.02
Morgan Stanley Mortgage Loan Trust ‘3A’ 3.05% 25/09/2034 USD 596,897 597,687 0.05
Morgan Stanley Resecuritization Trust, FRN, Series 2015-R4 ‘CB2’, 144A 0.976% 26/08/2047 USD 1,946,000 1,769,518 0.15
Mortgage Equity Conversion Asset Trust ‘A’, 144A 0.59% 25/05/2042 USD 2,050,061 1,920,796 0.16
Mortgage Equity Conversion Asset Trust, FRN, Series 2007-FF2 ‘A’, 144A 0.56% 25/02/2042 USD 1,379,765 1,364,371 0.12
MortgageIT Trust, FRN, Series 2005-4 ‘M1’ 1.05% 25/10/2035 USD 384,343 387,464 0.03
Mosaic Solar Loan Trust ‘A’, 144A 2.1% 20/04/2046 USD 624,920 639,500 0.05
schEDUlE of InVEsTmEnTsAs at 31 December 2020
Investments Currency
Quantity/Nominal
Value
Market Value USD
% of Net Assets
Transferable securities and money market instruments admitted to official exchange listing or dealt in on another regulated market
mortgage and asset Backed securities (continued)
United states of america (continued)National City Mortgage Capital Trust,
Series 2008-1 ‘2A1’ 6% 25/03/2038 USD 1,144,028 1,174,169 0.10 Natixis Commercial Mortgage Securities
Trust ‘A’, 144A 1.641% 15/07/2036 USD 4,582,000 4,576,376 0.39 Natixis Commercial Mortgage Securities
Trust, FRN, Series 2020-2PAC ‘AMZ2’, 144A 3.617% 15/01/2037 USD 1,200,000 1,161,679 0.10
Natixis Commercial Mortgage Securities Trust ‘D’, 144A 2.891% 15/07/2036 USD 2,000,000 1,944,110 0.16
Natixis Commercial Mortgage Securities Trust, FRN, Series 2020-2PAC ‘MSK2’, 144A 3.358% 15/12/2036 USD 1,500,000 1,427,711 0.12
New Century Home Equity Loan Trust, FRN, Series 2003-2 ‘M1’ 1.498% 25/03/2033 USD 967,500 960,488 0.08
New Century Home Equity Loan Trust, FRN, Series 2002-1 ‘M2’ 2.248% 25/03/2032 USD 67,648 66,882 0.01
New Residential Mortgage LLC, Series 2018-FNT2 ‘A’, 144A 3.79% 25/07/2054 USD 3,217,765 3,227,068 0.27
New Residential Mortgage Loan Trust ‘A1’, 144A 4.335% 25/07/2060 USD 3,824,025 3,877,178 0.33
New Residential Mortgage Loan Trust ‘A1’, 144A 3.228% 25/08/2060 USD 406,421 410,021 0.03
Nomura Asset Acceptance Corp. Alternative Loan Trust, FRN, Series 2006-AF1 ‘4A1’ 3.262% 25/06/2036 USD 208,010 186,163 0.02
NovaStar Mortgage Funding Trust, FRN, Series 2003-4 ‘A1’ 0.888% 25/02/2034 USD 459,198 450,409 0.04
NovaStar Mortgage Funding Trust, FRN, Series 2004-3 ‘M4’ 1.723% 25/12/2034 USD 1,500,000 1,489,294 0.13
NRPL Trust, STEP, Series 2018-2A ‘A1’, 144A 4.25% 25/07/2067 USD 5,336,824 5,393,863 0.46
NRZ Excess Spread-Collateralized Notes, Series 2018-FNT1 ‘F’, 144A 5.57% 25/05/2023 USD 2,616,044 2,623,606 0.22
Oakwood Mortgage Investors, Inc., FRN, Series 1999-D ‘A1’ 7.84% 15/11/2029 USD 1,011,877 1,069,350 0.09
Oakwood Mortgage Investors, Inc., Series 2000-C ‘A1’ 7.72% 15/04/2030 USD 234,460 248,039 0.02
Oakwood Mortgage Investors, Inc., FRN, Series 2001-C ‘A4’ 7.405% 15/06/2031 USD 3,676,867 891,199 0.08
Opteum Mortgage Acceptance Corp. Asset-Backed Pass-Through Certificates Trust, FRN, Series 2005-1 ‘M8’ 2.325% 25/02/2035 USD 2,000,000 2,066,823 0.17
Option One Mortgage Accept Corp. Trust, FRN, Series 2003-5 ‘A2’ 0.79% 25/08/2033 USD 1,797,084 1,732,323 0.15
Oxford Finance Funding LLC ‘A2’, 144A 4.459% 15/02/2027 USD 2,600,000 2,692,493 0.23
Park Place Securities, Inc. Asset-Backed Pass-Through Certificates Trust ‘M3’ 2.023% 25/09/2034 USD 2,046,478 2,053,994 0.17
Park Place Securities, Inc. Asset-Backed Pass-Through Certificates Trust, FRN, Series 2004-WHQ1 ‘M4’ 1.875% 25/09/2034 USD 441,467 445,328 0.04
PHH Mortgage Trust, FRN, Series 2008-CIM1 ‘13A1’ 2.399% 25/06/2038 USD 4,157,716 4,341,327 0.37
PNMAC FMSR ISSUER Trust, FRN, Series 2018-FT1 ‘A’, 144A 2.498% 25/04/2023 USD 6,000,000 5,813,012 0.49
PNMAC GMSR ISSUER Trust, FRN, Series 2018-GT1 ‘A’, 144A 3% 25/02/2023 USD 4,000,000 3,962,297 0.33

183 Morgan Stanley Investment Funds 31 December 2020
The accompanying notes are an integral part of these financial statements.
Global Asset Backed Securities Fund (continued)
schEDUlE of InVEsTmEnTsAs at 31 December 2020
Investments Currency
Quantity/Nominal
Value
Market Value USD
% of Net Assets
Transferable securities and money market instruments admitted to official exchange listing or dealt in on another regulated market
mortgage and asset Backed securities (continued)
United states of america (continued)PNMAC GMSR ISSUER Trust, FRN, Series
2018-GT2 ‘A’, 144A 2.8% 25/08/2025 USD 5,500,000 5,320,770 0.45 Pretium Mortgage Credit Partners I LLC
‘A1’, 144A 2.858% 27/05/2059 USD 5,983,229 6,015,729 0.51 Pretium Mortgage Credit Partners I LLC
‘A1’, 144A 3.721% 27/02/2060 USD 1,643,608 1,657,388 0.14 Pretium Mortgage Credit Partners I LLC
‘A1’, 144A 3.819% 27/05/2060 USD 3,864,778 3,898,565 0.33 Progress Residential Trust ‘C’, 144A
3.684% 17/03/2035 USD 4,250,000 4,267,073 0.36 Progress Residential Trust, Series 2017-
SFR1 ‘E’, 144A 4.261% 17/08/2034 USD 947,000 963,890 0.08 Progress Residential Trust, Series 2018-
SFR1 ‘E’, 144A 4.38% 17/03/2035 USD 2,000,000 2,010,519 0.17 Progress Residential Trust, Series 2018-
SFR2 ‘F’, 144A 4.953% 17/08/2035 USD 415,000 422,062 0.04 Progress Residential Trust, Series 2019-
SFR1 ‘F’, 144A 5.061% 17/08/2035 USD 2,000,000 2,065,026 0.17 PRPM LLC ‘A1’, 144A 3.671%
25/08/2025 USD 946,401 952,249 0.08 PRPM LLC ‘A1’, 144A 3.104%
25/11/2025 USD 4,404,532 4,434,474 0.37 PRPM LLC, STEP, Series 2019-4A ‘A1’,
144A 3.351% 25/11/2024 USD 1,674,516 1,683,231 0.14 RALI Trust, Series 2005-QA5 ‘A2’ 4.723%
25/04/2035 USD 577,327 567,316 0.05 RALI Trust, Series 2006-QS4 ‘A2’ 6%
25/04/2036 USD 5,541 5,388 0.00RALI Trust, Series 2006-QS5 ‘A6’ 6%
25/05/2036 USD 664,517 639,249 0.05 Raptor Aircraft Finance I LLC ‘A’, 144A
4.213% 23/08/2044 USD 7,649,529 6,526,025 0.55 RBSSP Resecuritization Trust, FRN, Series
2009-8 ‘7A1’, 144A 26.502% 26/09/2037 USD 465,455 876,405 0.07
Renaissance Home Equity Loan Trust, STEP, Series 2005-1 ‘AF5’ 5.451% 25/05/2035 USD 1,000,000 1,074,571 0.09
Residential Asset Securitization Trust, Series 2005-A1 ‘A1’ 5.5% 25/04/2035 USD 1,767,165 1,830,543 0.15
RFMSI Trust ‘2A1’ 5.5% 25/09/2022 USD 563,243 570,838 0.05 RiverView HECM Trust ‘A’, 144A 0.6%
25/05/2047 USD 1,086,630 989,233 0.08 RiverView HECM Trust ‘A’, 144A 0.42%
25/05/2047 USD 1,952,465 1,812,945 0.15 Seasoned Credit Risk Transfer Trust,
Series 2018-2 ‘HT’ 3% 25/11/2057 USD 1,527,346 1,634,926 0.14 Seasoned Credit Risk Transfer Trust,
Series 2018-4 ‘HT’ 3% 25/03/2058 USD 3,544,897 3,802,611 0.32 Seasoned Credit Risk Transfer Trust,
Series 2019-2 ‘HT’ 3% 25/08/2058 USD 1,250,250 1,352,423 0.11 Seasoned Credit Risk Transfer Trust,
Series 2019-3 ‘HT’ 3% 25/10/2058 USD 1,009,665 1,092,779 0.09 Seasoned Credit Risk Transfer Trust,
Series 2019-4 ‘HT’ 3% 25/02/2059 USD 1,136,270 1,231,949 0.10 Seasoned Credit Risk Transfer Trust, STEP,
Series 2017-1 ‘HT’ 3% 25/01/2056 USD 733,852 794,063 0.07 Seasoned Credit Risk Transfer Trust, STEP,
Series 2017-3 ‘HT’ 3.25% 25/07/2056 USD 1,577,382 1,731,032 0.15 Seasoned Credit Risk Transfer Trust ‘M’,
144A 4.75% 25/08/2057 USD 3,000,000 3,089,878 0.26 Seasoned Credit Risk Transfer Trust, FRN,
Series 2016-1 ‘M2’, 144A 3.75% 25/09/2055 USD 6,000,000 6,029,033 0.51
schEDUlE of InVEsTmEnTsAs at 31 December 2020
Investments Currency
Quantity/Nominal
Value
Market Value USD
% of Net Assets
Transferable securities and money market instruments admitted to official exchange listing or dealt in on another regulated market
mortgage and asset Backed securities (continued)
United states of america (continued)Seasoned Credit Risk Transfer Trust, FRN,
Series 2017-2 ‘M2’, 144A 4% 25/08/2056 USD 2,400,000 2,426,306 0.20
Seasoned Credit Risk Transfer Trust ‘M45T’ 4.5% 25/06/2057 USD 1,230,759 1,355,003 0.11
Seasoned Credit Risk Transfer Trust, Series 2018-4 ‘M55D’ 4% 25/03/2058 USD 4,983,935 5,425,473 0.46
Seasoned Credit Risk Transfer Trust, Series 2019-2 ‘M55D’ 4% 25/08/2058 USD 1,102,190 1,219,906 0.10
Seasoned Credit Risk Transfer Trust, Series 2019-3 ‘M55D’ 4% 25/10/2058 USD 1,146,964 1,268,276 0.11
Seasoned Credit Risk Transfer Trust, Series 2019-4 ‘M55D’ 4% 25/02/2059 USD 999,838 1,107,671 0.09
Seasoned Credit Risk Transfer Trust, Series 2018-1 ‘MA’ 3% 25/05/2057 USD 68,972 74,100 0.01
Seasoned Credit Risk Transfer Trust, Series 2018-1 ‘MT’ 3% 25/05/2057 USD 5,442,949 5,847,619 0.49
Seasoned Credit Risk Transfer Trust, Series 2019-4 ‘MT’ 3% 25/02/2059 USD 1,761,868 1,890,993 0.16
Seasoned Loans Structured Transaction, FRN, Series 2018-1 ‘M1’ 3% 25/04/2058 USD 2,800,000 2,806,827 0.24
Security National Mortgage Loan Trust, FRN, Series 2006-1A ‘1A3’, 144A 6.45% 25/09/2036 USD 507,185 534,100 0.04
Sequoia Mortgage Trust, FRN, Series 2003-4 ‘1A1’ 0.767% 20/07/2033 USD 388,746 375,796 0.03
Skopos Auto Receivables Trust, Series 2018-1A ‘D’, 144A 7.25% 16/12/2024 USD 3,000,000 3,099,874 0.26
SLM Student Loan Trust, Reg. S, FRN 0.007% 15/12/2033 EUR 2,747,196 3,133,960 0.27
SLM Student Loan Trust, Reg. S, FRN 0.591% 15/03/2038 GBP 1,845,920 2,401,134 0.20
Sprite Ltd., Series 2017-1 ‘A’, 144A 4.25% 15/12/2037 USD 964,782 915,403 0.08
Sprite Ltd., Series 2017-1 ‘C’, 144A 6.9% 15/12/2037 USD 526,741 263,726 0.02
STARM Mortgage Loan Trust, FRN, Series 2007-4 ‘3A1’ 3.007% 25/10/2037 USD 113,823 104,849 0.01
STARM Mortgage Loan Trust, FRN, Series 2007-S1 ‘5A1’ 2.971% 25/01/2037 USD 167,019 167,989 0.01
Start Ltd., Series 2018-1 ‘A’, 144A 4.089% 15/05/2043 USD 1,732,085 1,693,675 0.14
Structured Adjustable Rate Mortgage Loan Trust, FRN, Series 2005-1 ‘2A’ 2.973% 25/02/2035 USD 1,229,818 1,201,195 0.10
Structured Adjustable Rate Mortgage Loan Trust ‘3A1’ 2.586% 25/12/2034 USD 2,477,197 2,489,903 0.21
Structured Adjustable Rate Mortgage Loan Trust, FRN, Series 2004-7 ‘A3’ 0.885% 25/06/2034 USD 570,620 539,256 0.05
Structured Asset Mortgage Investments II Trust, FRN, Series 2005-AR1 ‘A2’ 1.231% 19/04/2035 USD 252,318 243,342 0.02
Structured Asset Securities Corp. Mortgage Pass-Through Certificates Trust, FRN, Series 2003-26A ‘3A5’ 2.614% 25/09/2033 USD 455,524 456,287 0.04
Structured Asset Securities Corp. Mortgage-Backed Pass-Through Certificates Trust, Series 2004-18H ‘A5’ 4.75% 25/10/2034 USD 401,101 423,379 0.04
Structured Asset Securities Corp. Reverse Mortgage Loan Trust, FRN, Series 2007-RM1 ‘M3’, 144A 2% 25/05/2047 USD 8,193,663 7,148,971 0.60

Morgan Stanley Investment Funds 31 December 2020 184
The accompanying notes are an integral part of these financial statements.
Global Asset Backed Securities Fund (continued)
schEDUlE of InVEsTmEnTsAs at 31 December 2020
Investments Currency
Quantity/Nominal
Value
Market Value USD
% of Net Assets
Transferable securities and money market instruments admitted to official exchange listing or dealt in on another regulated market
mortgage and asset Backed securities (continued)
United states of america (continued)Structured Asset Securities Corp. Reverse
Mortgage Loan Trust ‘M4’, 144A 3.15% 25/05/2047 USD 4,127,808 4,023,584 0.34
Sunbird Engine Finance LLC, Series 2020-1A ‘A’, 144A 3.671% 15/02/2045 USD 2,776,514 2,498,136 0.21
Sutherland Commercial Mortgage Loans ‘A’, 144A 4.72% 25/05/2039 USD 2,041,486 2,067,406 0.17
TBW Mortgage-Backed Trust, Series 2006-2 ‘1A1’ 6% 25/07/2036 USD 256,175 147,721 0.01
Thornburg Mortgage Securities Trust ‘A4’ 3.599% 25/04/2045 USD 3,902,972 3,971,894 0.34
TLF National Tax Lien Trust, Series 2017-1A ‘A’, 144A 3.09% 15/12/2029 USD 89,797 90,455 0.01
Tricon American Homes Trust, Series 2017-SFR1 ‘E’, 144A 4.011% 17/09/2034 USD 1,500,000 1,529,395 0.13
Tricon American Homes Trust, Series 2017-SFR2 ‘E’, 144A 4.216% 17/01/2036 USD 1,000,000 1,039,897 0.09
Tricon American Homes Trust, Series 2017-SFR1 ‘F’, 144A 5.151% 17/09/2034 USD 4,000,000 4,090,979 0.35
Tricon American Homes Trust, Series 2017-SFR2 ‘F’, 144A 5.104% 17/01/2036 USD 3,131,000 3,275,702 0.28
Truman Capital Mortgage Loan Trust, FRN, Series 2002-1 ‘M2’, 144A 2.923% 25/11/2031 USD 593,911 593,967 0.05
TVC Mortgage Trust, Series 2020-RTL1 ‘A1’, 144A 3.474% 25/09/2024 USD 1,000,000 1,011,479 0.09
UMBS AS4821 4% 01/04/2045 USD 1,384,974 1,539,741 0.13 UMBS AZ4750 3.5% 01/10/2045 USD 653,219 706,721 0.06 UMBS BA3100 3.5% 01/01/2046 USD 595,812 642,422 0.05 UMBS BN0759 5% 01/12/2048 USD 821,676 915,822 0.08 UMBS BN4430 5% 01/01/2049 USD 2,335,134 2,584,697 0.22 Vericrest Opportunity Loan Trust ‘A1A’,
144A 2.981% 25/03/2050 USD 2,177,426 2,182,836 0.18 Veros Automobile Receivables Trust ‘C’,
144A 4.65% 15/02/2024 USD 1,985,540 2,002,156 0.17 VOLT LXXX LLC ‘A1A’, 144A 3.228%
25/10/2049 USD 2,311,372 2,318,292 0.20 VOLT LXXXVII LLC ‘A1A’, 144A 2.981%
25/02/2050 USD 2,069,731 2,075,732 0.18 VOLT LXXXVIII LLC, STEP, Series 2020-
NPL4 ‘A1’, 144A 2.981% 25/03/2050 USD 2,049,819 2,055,233 0.17 WaMu Mortgage-Backed Pass-Through
Certificates Trust, FRN, Series 2001-AR3 ‘1A’ 2.083% 25/11/2041 USD 1,879,669 1,838,167 0.16
WaMu Mortgage-Backed Pass-Through Certificates Trust, FRN, Series 2002-AR18 ‘A’ 3.575% 25/01/2033 USD 329,151 327,794 0.03
Washington Mutual Mortgage-Backed Pass-Through Certificates WMALT Trust, Series 2005-1 ‘5A1’ 6% 25/03/2035 USD 838,785 846,373 0.07
Washington Mutual MSC Mortgage-Backed Pass-Through Certificates Trust, FRN, Series 2005-RA1 ‘3A’ 3.527% 25/01/2035 USD 597,128 601,659 0.05
Waterfall Commercial Mortgage Trust ‘A’, 144A 4.104% 14/09/2022 USD 4,447,797 4,509,523 0.38
Wells Fargo Alternative Loan Trust, FRN, Series 2007-PA4 ‘1A1’ 3.134% 25/07/2037 USD 303,780 283,217 0.02
Wells Fargo Commercial Mortgage Trust ‘C’, 144A 1.951% 15/01/2035 USD 1,000,000 967,814 0.08
schEDUlE of InVEsTmEnTsAs at 31 December 2020
Investments Currency
Quantity/Nominal
Value
Market Value USD
% of Net Assets
Transferable securities and money market instruments admitted to official exchange listing or dealt in on another regulated market
mortgage and asset Backed securities (continued)
United states of america (continued)Wells Fargo Commercial Mortgage Trust,
Series 2015-NXS3 ‘D’, 144A 3.153% 15/09/2057 USD 1,116,000 1,038,669 0.09
Wells Fargo Mortgage Backed Securities Trust, FRN, Series 2006-AR11 ‘A6’ 3.169% 25/08/2036 USD 37,000 35,557 0.00
WFRBS Commercial Mortgage Trust, FRN, Series 2013-C16 ‘D’, 144A 5.185% 15/09/2046 USD 1,285,000 1,012,257 0.09
609,815,687 51.48
Total mortgage and asset Backed securities 1,089,938,098 92.01
To Be announced contracts
United states of americaUMBS 2.5% 25/01/2050 USD 2,000,000 2,105,781 0.18 UMBS 2% 25/02/2050 USD 57,000,000 59,034,852 4.98 UMBS 3% 25/01/2050 USD 10,000,000 10,473,828 0.89
71,614,461 6.05
Total To Be announced contracts 71,614,461 6.05
Total Transferable securities and money market instruments admitted to official exchange listing or dealt in on another regulated market 1,164,202,715 98.28
Other transferable securities and money market instruments not admitted to official exchange listing or dealt in on another regulated market
corporate Bonds
GreeceLuminis Finance plc 0% 12/06/2022* EUR 488,400 582,758 0.05 Luminis Finance plc, Reg. S, FRN 0%
12/03/2025* EUR 6,982,247 8,331,211 0.70
8,913,969 0.75
United states of americaDP Facilities Data Center Subordinated
Pass Through Trust, FRN, 144A 0% 10/11/2028* USD 2,200,000 1,107,040 0.09
1,107,040 0.09
Total corporate Bonds 10,021,009 0.84

185 Morgan Stanley Investment Funds 31 December 2020
The accompanying notes are an integral part of these financial statements.
Global Asset Backed Securities Fund (continued)
schEDUlE of InVEsTmEnTsAs at 31 December 2020
Investments Currency
Quantity/Nominal
Value
Market Value USD
% of Net Assets
Other transferable securities and money market instruments not admitted to official exchange listing or dealt in on another regulated market
mortgage and asset Backed securities
United states of americaCHL Mortgage Pass-Through Trust, FRN,
Series 2003-48 ‘2A2’ 2.724% 25/10/2033* USD 96,895 90,423 0.01
J.P. Morgan Alternative Loan Trust ‘1A16’ 6% 25/03/2036* USD 201,651 148,383 0.01
238,806 0.02
Total mortgage and asset Backed securities 238,806 0.02
Total other transferable securities and money market instruments not admitted to official exchange listing or dealt in on another regulated market 10,259,815 0.86
Units of authorised UCITS or other collective investment undertakings
collective Investment schemes – UcITs
luxembourgMorgan Stanley Liquidity Funds US Dollar
Liquidity Fund – MS Reserve† USD 84,579,746 84,579,746 7.14
84,579,746 7.14
Total collective Investment schemes – UcITs 84,579,746 7.14
Total Units of authorised UcITs or other collective investment undertakings 84,579,746 7.14
Total Investments 1,259,042,276 106.28
cash 4,523,504 0.38
other assets/(liabilities) (78,971,840) (6.66)
Total net assets 1,184,593,940 100.00
* Security is valued at its fair value under the direction of the Board of Directors.† Managed by an affiliate of the Investment Adviser.The country disclosed within the Schedule of Investments refers to the country of risk. The country of incorporation may differ.
financial futures contracts
security Descriptionnumber
of contracts currency
Global Exposure
UsD
Unrealised Gain/(loss)
UsD
% of net assets
US 2 Year Note, 31/03/2021 (70) USD (15,467,813) (14,032) 0.00US 5 Year Note, 31/03/2021 (1,164) USD (146,827,688) (294,727) (0.03) US 10 Year Note, 22/03/2021 1,164 USD 160,632,000 (36,375) 0.00US 10 Year Ultra Bond, 22/03/2021 32 USD 5,000,000 (18,794) 0.00US Long Bond, 22/03/2021 208 USD 35,984,000 (306,763) (0.03) US Ultra Bond, 22/03/2021 46 USD 9,805,188 (163,270) (0.01)
Total Unrealised loss on financial futures contracts (833,961) (0.07)
net Unrealised loss on financial futures contracts (833,961) (0.07)
forward currency Exchange contracts (continued)
currency Purchased
amount Purchased
currency sold
amount sold
maturity Date counterparty
Unrealised Gain/(loss)
UsD
% of net assets
EUR 14,957 USD 18,323 04/01/2021 J.P. Morgan 28 0.00AUD 67,184 USD 49,775 26/02/2021 RBC 2,186 0.00AUD 21,292 USD 16,222 26/02/2021 UBS 245 0.00EUR 7,500,000 USD 9,165,958 26/02/2021 Barclays 46,984 0.01 EUR 1,113,585 USD 1,360,251 26/02/2021 RBC 7,668 0.00GBP 3,799,838 USD 5,089,811 26/02/2021 UBS 102,251 0.01
Unrealised Gain on forward currency Exchange contracts – assets 159,362 0.02
EUR hedged share classEUR 99,613 USD 122,205 04/01/2021 J.P. Morgan 14 0.00USD 449,208 EUR 365,313 05/01/2021 J.P. Morgan 990 0.00EUR 360,398,424 USD 438,406,932 08/01/2021 J.P. Morgan 3,815,669 0.32
Unrealised Gain on naV hedged share classes forward currency Exchange contracts – assets 3,816,673 0.32
GBP hedged share classGBP 7,080,754 USD 9,511,399 08/01/2021 J.P. Morgan 160,716 0.01
Unrealised Gain on naV hedged share classes forward currency Exchange contracts – assets 160,716 0.01
sEK hedged share classSEK 1,509,382,639 USD 180,240,767 08/01/2021 J.P. Morgan 4,588,326 0.39
Unrealised Gain on naV hedged share classes forward currency Exchange contracts – assets 4,588,326 0.39
Total Unrealised Gain on forward currency Exchange contracts – assets 8,725,077 0.74
DERIVaTIVEs
Over-the-counter (OTC) and exchange traded derivatives as at 31 December 2020, expressed in US Dollars.

Morgan Stanley Investment Funds 31 December 2020 186
The accompanying notes are an integral part of these financial statements.
Global Asset Backed Securities Fund (continued)
forward currency Exchange contracts (continued)
currency Purchased
amount Purchased
currency sold
amount sold
maturity Date counterparty
Unrealised Gain/(loss)
UsD
% of net assets
EUR 32,944 USD 40,479 05/01/2021 J.P. Morgan (58) 0.00USD 8,855,391 AUD 12,091,301 26/02/2021 Barclays (496,077) (0.04) USD 301,874,501 EUR 254,141,700 26/02/2021 Bank of America (10,311,172) (0.87) USD 3,006,455 EUR 2,474,129 26/02/2021 BNP Paribas (32,745) 0.00USD 865,806 EUR 716,793 26/02/2021 J.P. Morgan (14,697) 0.00USD 1,522,721 EUR 1,240,440 26/02/2021 RBC (1,026) 0.00USD 2,643,924 EUR 2,210,393 26/02/2021 UBS (71,306) (0.01) USD 484,838 EUR 398,409 26/02/2021 Westpac Banking (4,564) 0.00USD 3,519,397 GBP 2,623,887 26/02/2021 BNP Paribas (65,857) (0.01) USD 532,848 GBP 396,093 26/02/2021 Citibank (8,370) 0.00USD 155,653,007 GBP 116,686,488 26/02/2021 J.P. Morgan (3,786,290) (0.32)
Unrealised loss on forward currency Exchange contracts – liabilities (14,792,162) (1.25)
EUR hedged share classUSD 89,070 EUR 72,604 04/01/2021 J.P. Morgan (10) 0.00EUR 365,313 USD 449,247 08/01/2021 J.P. Morgan (994) 0.00
USD 4,094,237 EUR 3,350,159 08/01/2021 J.P. Morgan (16,536) 0.00
Unrealised loss on naV hedged share classes forward currency Exchange contracts – liabilities (17,540) 0.00
Total Unrealised loss on forward currency Exchange contracts – liabilities (14,809,702) (1.25)
net Unrealised loss on forward currency Exchange contracts – liabilities (6,084,625) (0.51)
Collateral received and paid by the Fund in respect of financial derivative instruments:
Type of collateral counterparty currency amount received amount paid
Global asset Backed securities fund
Cash Barclays USD – 260,000BNP Paribas USD – 10,000Goldman Sachs USD 3,491,626 –UBS USD – 10,000Wells Fargo Securities USD 320,000 –
3,811,626 280,000
DERIVaTIVEs (continued)
Over-the-counter (OTC) and exchange traded derivatives as at 31 December 2020, expressed in US Dollars.

187 Morgan Stanley Investment Funds 31 December 2020
The accompanying notes are an integral part of these financial statements.
Please refer to the full prospectus for the Fund’s investment objective and policy.
InVEsTmEnT aIm
To provide an attractive rate of return, measured in US Dollars, through market, instrument and currency selection. The Fund consists of domestic, international and Euromarket Fixed Income Securities of varying maturities denominated in US Dollars and other currencies, including emerging markets, asset-backed securities (including mortgage backed securities), loan participations and loan assignments, to the extent that these instruments are securitised.
schEDUlE of InVEsTmEnTsAs at 31 December 2020
Investments Currency
Quantity/ Nominal
Value
Market Value USD
% of Net Assets
Transferable securities and money market instruments admitted to official exchange listing or dealt in on another regulated market
convertible Bonds
australiaGlencore Funding LLC, Reg. S 0%
27/03/2025 USD 1,800,000 1,670,399 0.09
1,670,399 0.09
chileLiberty Latin America Ltd. 2% 15/07/2024 USD 2,225,000 2,109,188 0.12
2,109,188 0.12
franceAirbus SE, Reg. S 0% 14/06/2021 EUR 1,200,000 1,473,345 0.08
1,473,345 0.08
switzerlandSika AG, Reg. S 0.15% 05/06/2025 CHF 940,000 1,448,859 0.08
1,448,859 0.08
United KingdomGSK Finance No. 3 plc, 144A 0%
22/06/2023 USD 1,775,000 1,828,126 0.10
1,828,126 0.10
United states of americaAkamai Technologies, Inc. 0.375%
01/09/2027 USD 1,085,000 1,210,395 0.07 Booking Holdings, Inc. 0.9% 15/09/2021 USD 1,225,000 1,414,107 0.08 Jazz Investments I Ltd. 1.875%
15/08/2021 USD 1,650,000 1,689,503 0.09 Marriott Vacations Worldwide Corp. 1.5%
15/09/2022 USD 1,300,000 1,474,267 0.08 Pure Storage, Inc. 0.125% 15/04/2023 USD 1,350,000 1,493,093 0.08 Twitter, Inc. 1% 15/09/2021 USD 1,490,000 1,518,913 0.08 Verint Systems, Inc. 1.5% 01/06/2021 USD 1,450,000 1,579,298 0.09
10,379,576 0.57
Total convertible Bonds 18,909,493 1.04
corporate Bonds
australiaAPT Pipelines Ltd., 144A 4.2%
23/03/2025 USD 325,000 358,819 0.02 APT Pipelines Ltd., Reg. S 3.5%
22/03/2030 GBP 1,100,000 1,773,548 0.10 Aurizon Network Pty. Ltd., Reg. S 2%
18/09/2024 EUR 600,000 789,425 0.04 Aurizon Network Pty. Ltd., Reg. S 3.125%
01/06/2026 EUR 350,000 492,833 0.03 Australia & New Zealand Banking Group
Ltd., 144A 2.57% 25/11/2035 USD 1,600,000 1,632,749 0.09 Commonwealth Bank of Australia, Reg. S,
FRN 2% 22/04/2027 EUR 500,000 627,049 0.03 Glencore Funding LLC, 144A 3.875%
27/10/2027 USD 2,100,000 2,371,406 0.13 Macquarie Group Ltd., 144A 4.15%
27/03/2024 USD 2,375,000 2,553,604 0.14
Global Bond Fund

Morgan Stanley Investment Funds 31 December 2020 188
The accompanying notes are an integral part of these financial statements.
Global Bond Fund (continued)
schEDUlE of InVEsTmEnTsAs at 31 December 2020
Investments Currency
Quantity/ Nominal
Value
Market Value USD
% of Net Assets
Transferable securities and money market instruments admitted to official exchange listing or dealt in on another regulated market
corporate Bonds (continued)
australia (continued)National Australia Bank Ltd., Reg. S
0.625% 30/08/2023 EUR 650,000 817,181 0.04 Scentre Group Trust 1, REIT, Reg. S 2.25%
16/07/2024 EUR 375,000 491,559 0.03 Transurban Finance Co. Pty. Ltd., Reg. S
1.875% 16/09/2024 EUR 300,000 392,870 0.02 Transurban Finance Co. Pty. Ltd., Reg. S
2% 28/08/2025 EUR 350,000 466,888 0.03 Westpac Banking Corp. 2.668%
15/11/2035 USD 1,475,000 1,521,330 0.09
14,289,261 0.79
BelgiumAnheuser-Busch Cos. LLC 3.65%
01/02/2026 USD 2,100,000 2,376,028 0.13 Anheuser-Busch InBev SA/NV, Reg. S
2.75% 17/03/2036 EUR 2,950,000 4,569,483 0.25 Solvay Finance SACA, Reg. S, FRN 5.425%
Perpetual EUR 225,000 306,918 0.02
7,252,429 0.40
BrazilBanco Bradesco SA, Reg. S 3.2%
27/01/2025 USD 2,380,000 2,501,975 0.14 Itau Unibanco Holding SA, 144A 2.9%
24/01/2023 USD 2,200,000 2,258,872 0.12 Petrobras Global Finance BV 6.75%
03/06/2050 USD 1,500,000 1,865,625 0.10
6,626,472 0.36
canadaEnbridge, Inc. 2.5% 15/01/2025 USD 1,210,000 1,295,795 0.07 NOVA Chemicals Corp., 144A 4.875%
01/06/2024 USD 1,650,000 1,721,156 0.10
3,016,951 0.17
chinaAgricultural Development Bank of China
2.96% 17/04/2030 CNY 60,000,000 8,706,124 0.48 China Development Bank 3.07%
10/03/2030 CNY 69,000,000 10,116,455 0.56 CNAC HK Finbridge Co. Ltd., Reg. S
1.75% 14/06/2022 EUR 1,800,000 2,212,799 0.12 CNAC HK Finbridge Co. Ltd., Reg. S
3.875% 19/06/2029 USD 1,700,000 1,725,041 0.10 Export-Import Bank of China (The) 3.23%
23/03/2030 CNY 8,000,000 1,187,407 0.07 Meituan, 144A 3.05% 28/10/2030 USD 1,860,000 1,942,379 0.11 Tencent Holdings Ltd., 144A 3.595%
19/01/2028 USD 2,875,000 3,172,365 0.18
29,062,570 1.62
schEDUlE of InVEsTmEnTsAs at 31 December 2020
Investments Currency
Quantity/ Nominal
Value
Market Value USD
% of Net Assets
Transferable securities and money market instruments admitted to official exchange listing or dealt in on another regulated market
corporate Bonds (continued)
colombiaEcopetrol SA 5.875% 18/09/2023 USD 3,200,000 3,576,832 0.20 Grupo Aval Ltd., 144A 4.375%
04/02/2030 USD 770,000 821,205 0.04
4,398,037 0.24
DenmarkDanske Bank A/S, FRN, 144A 5%
12/01/2023 USD 575,000 598,641 0.03
598,641 0.03
franceAltice France SA, 144A 7.375%
01/05/2026 USD 1,650,000 1,738,687 0.10 AXA SA, Reg. S, FRN 3.25% 28/05/2049 EUR 1,700,000 2,444,207 0.14 AXA SA, Reg. S, FRN 5.125%
04/07/2043 EUR 875,000 1,204,993 0.07 AXA SA, Reg. S, FRN 3.941% Perpetual EUR 300,000 412,712 0.02 Banque Federative du Credit Mutuel SA,
Reg. S 2.375% 21/11/2024 USD 2,425,000 2,571,733 0.14 Banque Federative du Credit Mutuel SA,
Reg. S 1.75% 19/12/2024 GBP 3,500,000 5,044,442 0.28 Banque Federative du Credit Mutuel SA,
Reg. S 0.75% 17/07/2025 EUR 1,700,000 2,169,666 0.12 BNP Paribas SA, FRN, 144A 2.819%
19/11/2025 USD 3,525,000 3,758,096 0.21 BNP Paribas SA, Reg. S, FRN 0.5%
04/06/2026 EUR 2,500,000 3,126,317 0.17 BNP Paribas SA, Reg. S 2.375%
17/02/2025 EUR 1,325,000 1,751,832 0.10 BPCE SA, 144A 5.15% 21/07/2024 USD 2,150,000 2,448,337 0.14 Credit Agricole Assurances SA, Reg. S,
FRN 2.625% 29/01/2048 EUR 1,100,000 1,464,083 0.08 Credit Agricole Assurances SA, Reg. S,
FRN 4.5% Perpetual EUR 1,500,000 2,110,720 0.12 Credit Agricole SA, Reg. S 2.625%
17/03/2027 EUR 400,000 552,174 0.03 TOTAL SE, Reg. S, FRN 3.875% Perpetual EUR 200,000 257,504 0.01 Unibail-Rodamco-Westfield SE, REIT,
Reg. S, FRN 2.125% Perpetual EUR 200,000 231,278 0.01
31,286,781 1.74
GermanyAllianz Finance II BV, FRN 5.75%
08/07/2041 EUR 300,000 378,552 0.02 Bayer US Finance II LLC, 144A 3.875%
15/12/2023 USD 1,300,000 1,417,472 0.08 BMW Finance NV, Reg. S 1.5%
06/02/2029 EUR 3,000,000 4,109,650 0.23 Daimler Finance North America LLC, 144A
2.7% 14/06/2024 USD 1,225,000 1,311,991 0.07 Deutsche Telekom International Finance BV,
144A 3.6% 19/01/2027 USD 1,050,000 1,181,359 0.07 Fresenius SE & Co. KGaA, Reg. S 2.875%
15/02/2029 EUR 375,000 550,892 0.03

189 Morgan Stanley Investment Funds 31 December 2020
The accompanying notes are an integral part of these financial statements.
Global Bond Fund (continued)
schEDUlE of InVEsTmEnTsAs at 31 December 2020
Investments Currency
Quantity/ Nominal
Value
Market Value USD
% of Net Assets
Transferable securities and money market instruments admitted to official exchange listing or dealt in on another regulated market
corporate Bonds (continued)
Germany (continued)Muenchener
Rueckversicherungs-Gesellschaft AG, Reg. S, FRN 6% 26/05/2041 EUR 1,200,000 1,506,445 0.09
SAP SE, Reg. S 1.625% 10/03/2031 EUR 900,000 1,281,108 0.07 Techem Verwaltungsgesellschaft 675 mbH,
Reg. S 2% 15/07/2025 EUR 2,675,000 3,271,726 0.18 Volkswagen International Finance NV,
Reg. S 1.875% 30/03/2027 EUR 2,700,000 3,629,409 0.20 Volkswagen International Finance NV,
Reg. S, FRN 4.625% Perpetual EUR 1,550,000 2,116,656 0.12 Wintershall Dea Finance BV, Reg. S
1.332% 25/09/2028 EUR 3,000,000 3,814,724 0.21
24,569,984 1.37
hong KongCK Hutchison International 16 Ltd., 144A
1.875% 03/10/2021 USD 1,000,000 1,009,352 0.06
1,009,352 0.06
IndiaBharti Airtel International Netherlands BV,
144A 5.35% 20/05/2024 USD 1,175,000 1,300,161 0.07 Export-Import Bank of India, Reg. S
3.875% 01/02/2028 USD 2,200,000 2,430,912 0.13 Export-Import Bank of India, Reg. S 3.25%
15/01/2030 USD 2,300,000 2,467,383 0.14 ONGC Videsh Vankorneft Pte. Ltd., Reg. S
3.75% 27/07/2026 USD 2,600,000 2,827,274 0.16
9,025,730 0.50
IndonesiaPertamina Persero PT, Reg. S 6.5%
07/11/2048 USD 1,300,000 1,833,870 0.10 Perusahaan Perseroan Persero PT
Perusahaan Listrik Negara, Reg. S 6.25% 25/01/2049 USD 1,300,000 1,742,000 0.10
3,575,870 0.20
IrelandAvolon Holdings Funding Ltd., 144A
2.875% 15/02/2025 USD 1,050,000 1,072,420 0.06 GAS Networks Ireland, Reg. S 1.375%
05/12/2026 EUR 1,200,000 1,594,743 0.09 Ryanair DAC, Reg. S 1.875% 17/06/2021 EUR 220,000 271,813 0.02 Ryanair DAC, Reg. S 1.125% 10/03/2023 EUR 350,000 433,630 0.02
3,372,606 0.19
IsraelTeva Pharmaceutical Finance Netherlands
III BV 2.2% 21/07/2021 USD 294,000 293,816 0.02
293,816 0.02
schEDUlE of InVEsTmEnTsAs at 31 December 2020
Investments Currency
Quantity/ Nominal
Value
Market Value USD
% of Net Assets
Transferable securities and money market instruments admitted to official exchange listing or dealt in on another regulated market
corporate Bonds (continued)
ItalyEnel Finance International NV, 144A 3.5%
06/04/2028 USD 2,650,000 3,019,713 0.17 Intesa Sanpaolo SpA, Reg. S, FRN 6.25%
Perpetual EUR 1,050,000 1,407,134 0.08 Intesa Sanpaolo SpA, 144A 6.5%
24/02/2021 USD 1,955,000 1,970,630 0.11 Intesa Sanpaolo SpA 5.25% 12/01/2024 USD 200,000 223,991 0.01 UniCredit SpA, 144A 6.572% 14/01/2022 USD 825,000 869,582 0.05
7,491,050 0.42
JapanAsahi Group Holdings Ltd., Reg. S 0.541%
23/10/2028 EUR 1,050,000 1,310,263 0.07
1,310,263 0.07
luxembourgBlackstone Property Partners Europe
Holdings Sarl, Reg. S 1.25% 26/04/2027 EUR 1,500,000 1,887,534 0.10
Logicor Financing Sarl, Reg. S 1.5% 14/11/2022 EUR 650,000 817,384 0.05
2,704,918 0.15
malaysiaPetronas Capital Ltd., Reg. S 3.5%
18/03/2025 USD 2,200,000 2,440,013 0.13
2,440,013 0.13
mexicoPetroleos Mexicanos 6.84% 23/01/2030 USD 1,900,000 1,979,781 0.11 Petroleos Mexicanos 6.95% 28/01/2060 USD 2,100,000 1,970,325 0.11 Petroleos Mexicanos, Reg. S 6.875%
16/10/2025 USD 1,800,000 1,975,320 0.11 Petroleos Mexicanos, Reg. S 2.5%
21/08/2021 EUR 2,000,000 2,463,671 0.14
8,389,097 0.47
netherlandsABN AMRO Bank NV, Reg. S 6.375%
27/04/2021 EUR 1,625,000 2,033,765 0.11 Aegon NV, Reg. S, FRN 4% 25/04/2044 EUR 150,000 203,020 0.01 ASR Nederland NV, Reg. S, FRN 5%
Perpetual EUR 1,950,000 2,705,656 0.15 Cooperatieve Rabobank UA, Reg. S, FRN
2.5% 26/05/2026 EUR 1,000,000 1,239,610 0.07 NN Group NV, Reg. S, FRN 4.625%
08/04/2044 EUR 2,800,000 3,870,014 0.22 Q-Park Holding I BV, Reg. S 1.5%
01/03/2025 EUR 2,475,000 2,940,705 0.16 UPC Holding BV, Reg. S 3.875%
15/06/2029 EUR 1,525,000 1,927,216 0.11
14,919,986 0.83

Morgan Stanley Investment Funds 31 December 2020 190
The accompanying notes are an integral part of these financial statements.
Global Bond Fund (continued)
schEDUlE of InVEsTmEnTsAs at 31 December 2020
Investments Currency
Quantity/ Nominal
Value
Market Value USD
% of Net Assets
Transferable securities and money market instruments admitted to official exchange listing or dealt in on another regulated market
corporate Bonds (continued)
PortugalEDP - Energias de Portugal SA, Reg. S,
FRN 1.7% 20/07/2080 EUR 700,000 857,836 0.05
857,836 0.05
QatarQNB Finance Ltd., Reg. S 2.75%
12/02/2027 USD 1,600,000 1,696,837 0.09
1,696,837 0.09
saudi arabiaSaudi Arabian Oil Co., Reg. S 3.25%
24/11/2050 USD 1,660,000 1,682,991 0.09
1,682,991 0.09
singaporeDBS Group Holdings Ltd., Reg. S, FRN
1.5% 11/04/2028 EUR 300,000 375,921 0.02
375,921 0.02
south africaEskom Holdings SOC Ltd., Reg. S 7.125%
11/02/2025 USD 1,800,000 1,847,250 0.10
1,847,250 0.10
south KoreaExport-Import Bank of Korea 2.375%
25/06/2024 USD 2,220,000 2,349,524 0.13 Korea Electric Power Corp., Reg. S 2.5%
24/06/2024 USD 2,300,000 2,439,752 0.14 Korea Housing Finance Corp., Reg. S
0.75% 30/10/2023 EUR 500,000 630,593 0.03
5,419,869 0.30
spainBanco Santander SA 5.179% 19/11/2025 USD 2,200,000 2,581,293 0.14 CaixaBank SA, Reg. S 0.75% 18/04/2023 EUR 2,800,000 3,506,628 0.20 CaixaBank SA, Reg. S, FRN 2.25%
17/04/2030 EUR 2,500,000 3,213,026 0.18 Grifols SA, Reg. S 2.25% 15/11/2027 EUR 1,025,000 1,278,175 0.07 IE2 Holdco SAU, Reg. S 2.875%
01/06/2026 EUR 2,800,000 3,909,570 0.22 Inmobiliaria Colonial Socimi SA, REIT,
Reg. S 1.45% 28/10/2024 EUR 300,000 384,510 0.02 Telefonica Europe BV, Reg. S, FRN 2.875%
Perpetual EUR 800,000 1,007,320 0.06 Telefonica Europe BV, Reg. S, FRN 3.75%
Perpetual EUR 200,000 252,196 0.01 Telefonica Europe BV, Reg. S, FRN 5.875%
Perpetual EUR 300,000 414,746 0.02
16,547,464 0.92
schEDUlE of InVEsTmEnTsAs at 31 December 2020
Investments Currency
Quantity/ Nominal
Value
Market Value USD
% of Net Assets
Transferable securities and money market instruments admitted to official exchange listing or dealt in on another regulated market
corporate Bonds (continued)
supra-nationalBanque Ouest Africaine de Developpement,
Reg. S 4.7% 22/10/2031 USD 2,100,000 2,279,487 0.12 Corp. Andina de Fomento 1.625%
23/09/2025 USD 8,490,000 8,624,821 0.48
10,904,308 0.60
swedenIntrum AB, Reg. S 3.125% 15/07/2024 EUR 1,500,000 1,850,192 0.10
1,850,192 0.10
switzerlandCredit Suisse Group AG, 144A 2.193%
05/06/2026 USD 2,155,000 2,253,851 0.12 Credit Suisse Group AG, FRN, 144A
2.593% 11/09/2025 USD 3,175,000 3,350,640 0.18 Credit Suisse Group AG, Reg. S, FRN
3.25% 02/04/2026 EUR 350,000 485,871 0.03 Syngenta Finance NV, 144A 4.441%
24/04/2023 USD 500,000 525,050 0.03 Syngenta Finance NV 3.125%
28/03/2022 USD 640,000 651,445 0.04 UBS AG, Reg. S 5.125% 15/05/2024 USD 650,000 718,250 0.04 UBS Group AG, 144A 3.491%
23/05/2023 USD 2,975,000 3,097,031 0.17 Zurich Insurance Co. Ltd., Reg. S, FRN
4.25% 02/10/2043 EUR 300,000 408,674 0.02
11,490,812 0.63
United arab EmiratesADCB Finance Cayman Ltd., 144A 4%
29/03/2023 USD 2,500,000 2,670,312 0.15 DP World Crescent Ltd., Reg. S 3.875%
18/07/2029 USD 1,700,000 1,867,008 0.10 Galaxy Pipeline Assets Bidco Ltd., 144A
2.625% 31/03/2036 USD 5,200,000 5,411,072 0.30 MDGH - GMTN BV, Reg. S 5.875%
14/03/2021 EUR 400,000 497,132 0.03
10,445,524 0.58
United KingdomBarclays Bank plc, Reg. S 6%
14/01/2021 EUR 300,000 368,632 0.02 Barclays plc, Reg. S, FRN 3.375%
02/04/2025 EUR 800,000 1,083,776 0.06 BAT Capital Corp. 3.557% 15/08/2027 USD 3,000,000 3,340,121 0.19 BP Capital Markets plc, FRN 4.375%
Perpetual USD 950,000 1,012,937 0.06 BP Capital Markets plc, FRN 4.875%
Perpetual USD 950,000 1,062,290 0.06 BP Capital Markets plc, Reg. S 2.274%
03/07/2026 GBP 3,150,000 4,708,390 0.26 HSBC Holdings plc, Reg. S, FRN 2.256%
13/11/2026 GBP 2,900,000 4,223,581 0.23 HSBC Holdings plc 4.375% 23/11/2026 USD 2,075,000 2,394,989 0.13 Imperial Brands Finance plc, Reg. S
1.125% 14/08/2023 EUR 500,000 629,672 0.03

191 Morgan Stanley Investment Funds 31 December 2020
The accompanying notes are an integral part of these financial statements.
Global Bond Fund (continued)
schEDUlE of InVEsTmEnTsAs at 31 December 2020
Investments Currency
Quantity/ Nominal
Value
Market Value USD
% of Net Assets
Transferable securities and money market instruments admitted to official exchange listing or dealt in on another regulated market
corporate Bonds (continued)
United Kingdom (continued)Lloyds Banking Group plc, Reg. S 2.25%
16/10/2024 GBP 2,850,000 4,087,362 0.23 Lloyds Banking Group plc, Reg. S, FRN
1.75% 07/09/2028 EUR 3,850,000 4,866,333 0.27 Nationwide Building Society, FRN, 144A
3.766% 08/03/2024 USD 3,100,000 3,299,885 0.18 NGG Finance plc, Reg. S, FRN 5.625%
18/06/2073 GBP 1,200,000 1,880,373 0.10 Sky Ltd., 144A 3.75% 16/09/2024 USD 575,000 640,669 0.04 Standard Chartered plc, FRN, 144A
4.644% 01/04/2031 USD 4,200,000 5,085,972 0.28 Vodafone Group plc, Reg. S 2.2%
25/08/2026 EUR 1,250,000 1,720,081 0.10 Western Power Distribution West Midlands
plc, Reg. S 5.75% 16/04/2032 GBP 1,400,000 2,833,506 0.16
43,238,569 2.40
United states of americaAbbVie, Inc. 2.95% 21/11/2026 USD 2,475,000 2,742,171 0.15 AbbVie, Inc. 3.2% 21/11/2029 USD 4,625,000 5,214,593 0.29 Air Lease Corp. 2.3% 01/02/2025 USD 1,275,000 1,320,261 0.07 Altria Group, Inc. 3.8% 14/02/2024 USD 3,000,000 3,276,769 0.18 American International Group, Inc. 4.875%
01/06/2022 USD 1,775,000 1,883,543 0.10 American Tower Corp., REIT 2.4%
15/03/2025 USD 2,225,000 2,365,801 0.13 Amgen, Inc. 2.45% 21/02/2030 USD 3,350,000 3,589,647 0.20 Aramark Services, Inc., 144A 6.375%
01/05/2025 USD 1,705,000 1,832,994 0.10 AT&T, Inc. 2.25% 01/02/2032 USD 3,150,000 3,198,485 0.18 AT&T, Inc. 2.9% 04/12/2026 GBP 2,600,000 3,944,198 0.22 Aviation Capital Group LLC, 144A 0.884%
30/07/2021 USD 1,320,000 1,307,792 0.07 Avis Budget Car Rental LLC, 144A 5.75%
15/07/2027 USD 650,000 660,969 0.04 Avis Budget Finance plc, Reg. S 4.75%
30/01/2026 EUR 850,000 1,023,084 0.06 Bank of America Corp. 3.248%
21/10/2027 USD 900,000 1,007,375 0.06 Bank of America Corp. 4% 22/01/2025 USD 325,000 365,442 0.02 Bank of America Corp. 4.25%
22/10/2026 USD 5,614,000 6,583,698 0.37 Berry Global, Inc., 144A 4.5%
15/02/2026 USD 1,950,000 1,997,531 0.11 Boeing Co. (The) 5.15% 01/05/2030 USD 2,300,000 2,785,311 0.15 Boston Properties LP, REIT 3.85%
01/02/2023 USD 1,200,000 1,277,322 0.07 Boyd Gaming Corp. 4.75% 01/12/2027 USD 1,790,000 1,863,050 0.10 BP Capital Markets America, Inc. 3.119%
04/05/2026 USD 675,000 747,679 0.04 Bristol-Myers Squibb Co. 3.25%
20/02/2023 USD 950,000 999,961 0.06 Calpine Corp., 144A 4.5% 15/02/2028 USD 2,275,000 2,369,412 0.13 Campbell Soup Co. 2.375% 24/04/2030 USD 4,600,000 4,862,344 0.27 Charter Communications Operating LLC
4.908% 23/07/2025 USD 4,300,000 4,995,913 0.28 Chubb INA Holdings, Inc. 0.875%
15/06/2027 EUR 500,000 645,943 0.04 Cigna Corp. 3.05% 15/10/2027 USD 475,000 532,816 0.03 Cigna Corp. 2.4% 15/03/2030 USD 3,475,000 3,704,626 0.21 Citigroup, Inc. 2.976% 05/11/2030 USD 551,000 605,850 0.03 Citigroup, Inc. 2.666% 29/01/2031 USD 4,889,000 5,246,331 0.29 Citigroup, Inc. 4.412% 31/03/2031 USD 1,060,000 1,287,807 0.07
schEDUlE of InVEsTmEnTsAs at 31 December 2020
Investments Currency
Quantity/ Nominal
Value
Market Value USD
% of Net Assets
Transferable securities and money market instruments admitted to official exchange listing or dealt in on another regulated market
corporate Bonds (continued)
United states of america (continued)Citigroup, Inc. 5.5% 13/09/2025 USD 3,125,000 3,756,749 0.21 Comcast Corp. 0.25% 20/05/2027 EUR 1,700,000 2,119,992 0.12 Comcast Corp. 1.95% 15/01/2031 USD 3,550,000 3,644,822 0.20 Crown Castle International Corp., REIT
3.3% 01/07/2030 USD 4,775,000 5,348,148 0.30 CVS Health Corp. 3.75% 01/04/2030 USD 2,005,000 2,333,971 0.13 Deere & Co. 3.1% 15/04/2030 USD 550,000 629,598 0.03 Dell International LLC, 144A 4%
15/07/2024 USD 2,200,000 2,427,636 0.13 Diamond Sports Group LLC, 144A 6.625%
15/08/2027 USD 2,235,000 1,349,381 0.07 Diamondback Energy, Inc. 2.875%
01/12/2024 USD 1,825,000 1,919,641 0.11 Diamondback Energy, Inc. 3.25%
01/12/2026 USD 2,325,000 2,484,797 0.14 Discover Financial Services 3.95%
06/11/2024 USD 2,975,000 3,306,297 0.18 Ecolab, Inc. 1% 15/01/2024 EUR 350,000 443,261 0.02 Emerson Electric Co. 1.25% 15/10/2025 EUR 2,700,000 3,535,559 0.20 Energy Transfer Operating LP 2.9%
15/05/2025 USD 2,550,000 2,699,826 0.15 Fidelity National Information Services, Inc.
1.5% 21/05/2027 EUR 2,300,000 3,046,054 0.17 Ford Motor Credit Co. LLC 3.087%
09/01/2023 USD 2,525,000 2,573,783 0.14 Fox Corp. 4.709% 25/01/2029 USD 3,150,000 3,828,299 0.21 Georgia-Pacific LLC, 144A 2.3%
30/04/2030 USD 3,550,000 3,796,591 0.21 Global Partners LP, 144A 6.875%
15/01/2029 USD 2,335,000 2,526,178 0.14 Goldman Sachs Group, Inc. (The), FRN
2.876% 31/10/2022 USD 1,800,000 1,836,724 0.10 Goldman Sachs Group, Inc. (The), Reg. S
2% 01/11/2028 EUR 2,500,000 3,484,859 0.19 Goldman Sachs Group, Inc. (The) 6.75%
01/10/2037 USD 1,320,000 2,027,696 0.11 HCA, Inc. 4.5% 15/02/2027 USD 1,590,000 1,849,803 0.10 HCA, Inc. 5.5% 15/06/2047 USD 100,000 133,490 0.01 Icahn Enterprises LP 4.75% 15/09/2024 USD 2,100,000 2,184,662 0.12 International Business Machines Corp. 3%
15/05/2024 USD 2,875,000 3,115,454 0.17 J2 Global, Inc., 144A 4.625%
15/10/2030 USD 2,505,000 2,647,472 0.15 Johnson Controls International plc 1.375%
25/02/2025 EUR 2,000,000 2,591,130 0.14 JPMorgan Chase & Co. 1.764%
19/11/2031 USD 3,300,000 3,337,431 0.18 JPMorgan Chase & Co., FRN 3.702%
06/05/2030 USD 725,000 840,924 0.05 JPMorgan Chase & Co., FRN 4.493%
24/03/2031 USD 3,175,000 3,908,695 0.22 JPMorgan Chase & Co. 4.125%
15/12/2026 USD 3,745,000 4,380,856 0.24 Las Vegas Sands Corp. 3.2% 08/08/2024 USD 900,000 953,687 0.05 Las Vegas Sands Corp. 3.5% 18/08/2026 USD 1,475,000 1,579,062 0.09 Level 3 Financing, Inc., 144A 3.4%
01/03/2027 USD 2,700,000 2,945,524 0.16 Medtronic Global Holdings SCA 1.125%
07/03/2027 EUR 2,425,000 3,183,168 0.18 Metropolitan Life Global Funding I, 144A
2.95% 09/04/2030 USD 2,375,000 2,674,956 0.15 Mileage Plus Holdings LLC, 144A 6.5%
20/06/2027 USD 1,760,000 1,895,300 0.11 NIKE, Inc. 2.85% 27/03/2030 USD 1,350,000 1,529,171 0.08

Morgan Stanley Investment Funds 31 December 2020 192
The accompanying notes are an integral part of these financial statements.
Global Bond Fund (continued)
schEDUlE of InVEsTmEnTsAs at 31 December 2020
Investments Currency
Quantity/ Nominal
Value
Market Value USD
% of Net Assets
Transferable securities and money market instruments admitted to official exchange listing or dealt in on another regulated market
corporate Bonds (continued)
United states of america (continued)NiSource, Inc. 3.6% 01/05/2030 USD 2,725,000 3,155,369 0.18 NRG Energy, Inc., 144A 3.625%
15/02/2031 USD 1,925,000 1,987,678 0.11 NVIDIA Corp. 2.85% 01/04/2030 USD 1,425,000 1,602,823 0.09 Occidental Petroleum Corp. 5.55%
15/03/2026 USD 1,250,000 1,306,700 0.07 Occidental Petroleum Corp. 3.2%
15/08/2026 USD 205,000 192,059 0.01 Oracle Corp. 2.95% 01/04/2030 USD 2,750,000 3,071,934 0.17 Pacific Gas and Electric Co. 2.5%
01/02/2031 USD 2,084,000 2,082,993 0.12 Prologis Euro Finance LLC, REIT 1.875%
05/01/2029 EUR 1,950,000 2,710,458 0.15 Quicken Loans LLC, 144A 3.875%
01/03/2031 USD 2,530,000 2,631,200 0.15 Resorts World Las Vegas LLC, 144A
4.625% 16/04/2029 USD 1,400,000 1,440,053 0.08 Rockies Express Pipeline LLC, 144A 3.6%
15/05/2025 USD 1,750,000 1,807,260 0.10 Silgan Holdings, Inc. 2.25% 01/06/2028 EUR 2,250,000 2,808,843 0.16 Sprint Spectrum Co. LLC, 144A 4.738%
20/09/2029 USD 550,000 597,418 0.03 Sprint Spectrum Co. LLC, 144A 3.36%
20/03/2023 USD 464,063 469,151 0.03 Standard Industries, Inc., Reg. S 2.25%
21/11/2026 EUR 1,575,000 1,960,350 0.11 Synchrony Bank 3% 15/06/2022 USD 1,350,000 1,394,474 0.08 TEGNA, Inc., 144A 4.625% 15/03/2028 USD 1,680,000 1,731,450 0.10 Tenet Healthcare Corp. 4.625%
15/07/2024 USD 2,675,000 2,744,604 0.15 Thermo Fisher Scientific, Inc. 0.875%
01/10/2031 EUR 4,413,000 5,722,516 0.32 T-Mobile USA, Inc., 144A 2.25%
15/11/2031 USD 3,700,000 3,804,396 0.21 UnitedHealth Group, Inc. 3.75%
15/07/2025 USD 2,175,000 2,479,120 0.14 Upjohn Finance BV, Reg. S 1.362%
23/06/2027 EUR 3,100,000 4,036,392 0.22 Verizon Communications, Inc. 1.375%
27/10/2026 EUR 3,600,000 4,774,499 0.26 Verizon Communications, Inc. 1.125%
03/11/2028 GBP 2,750,000 3,822,283 0.21 Verizon Communications, Inc. 1.5%
18/09/2030 USD 875,000 862,346 0.05 Verizon Communications, Inc. 1.75%
20/01/2031 USD 1,250,000 1,245,841 0.07 Verizon Communications, Inc. 4.672%
15/03/2055 USD 635,000 852,992 0.05 Walt Disney Co. (The) 2.65% 13/01/2031 USD 6,100,000 6,686,529 0.37 Wells Fargo & Co., FRN 2.879%
30/10/2030 USD 1,350,000 1,472,647 0.08 Wells Fargo & Co., FRN 5.013%
04/04/2051 USD 1,550,000 2,201,366 0.12
244,765,109 13.57
ZambiaFirst Quantum Minerals Ltd., 144A 6.875%
15/10/2027 USD 3,530,000 3,826,697 0.21
3,826,697 0.21
Total corporate Bonds 530,583,206 29.42
schEDUlE of InVEsTmEnTsAs at 31 December 2020
Investments Currency
Quantity/ Nominal
Value
Market Value USD
% of Net Assets
Transferable securities and money market instruments admitted to official exchange listing or dealt in on another regulated market
Government Bonds
australiaAustralia Government Bond, Reg. S 2.5%
21/05/2030 AUD 9,200,000 8,117,077 0.45 Australia Government Bond, Reg. S 1%
21/12/2030 AUD 35,400,000 27,396,322 1.52 Australia Government Bond, Reg. S 1.75%
21/06/2051 AUD 1,780,000 1,305,946 0.07
36,819,345 2.04
austriaAustria Government Bond, Reg. S, 144A
4.15% 15/03/2037 EUR 1,500,000 3,153,047 0.18 Austria Government Bond, Reg. S, 144A
2.1% 20/09/2117 EUR 1,050,000 2,886,781 0.16 Austria Government Bond, Reg. S, 144A
0.85% 30/06/2120 EUR 1,480,000 2,401,103 0.13
8,440,931 0.47
BelgiumBelgium Government Bond, Reg. S, 144A
1.9% 22/06/2038 EUR 8,400,000 13,702,426 0.76 Belgium Government Bond, Reg. S, 144A
1.7% 22/06/2050 EUR 2,100,000 3,570,336 0.20
17,272,762 0.96
BermudaBermuda Government Bond, Reg. S
4.854% 06/02/2024 USD 494,000 551,381 0.03
551,381 0.03
BrazilBrazil Government Bond 3.875%
12/06/2030 USD 2,400,000 2,533,800 0.14 Brazil Notas do Tesouro Nacional 10%
01/01/2025 BRL 3,880,000 8,649,990 0.48
11,183,790 0.62
canadaCanada Government Bond 2%
01/06/2028 CAD 4,300,000 3,736,567 0.21 Canada Government Bond 2.25%
01/06/2029 CAD 29,900,000 26,652,869 1.48 Canada Government Bond 1.25%
01/06/2030 CAD 10,400,000 8,579,620 0.47 Canada Government Bond 2.75%
01/12/2048 CAD 3,700,000 3,963,133 0.22
42,932,189 2.38
chinaChina Government Bond 2.36%
02/07/2023 CNY 30,000,000 4,539,085 0.25 China Government Bond 3.13%
21/11/2029 CNY 180,000,000 27,350,512 1.52 China Government Bond 3.86%
22/07/2049 CNY 51,000,000 7,929,970 0.44
39,819,567 2.21

193 Morgan Stanley Investment Funds 31 December 2020
The accompanying notes are an integral part of these financial statements.
Global Bond Fund (continued)
schEDUlE of InVEsTmEnTsAs at 31 December 2020
Investments Currency
Quantity/ Nominal
Value
Market Value USD
% of Net Assets
Transferable securities and money market instruments admitted to official exchange listing or dealt in on another regulated market
Government Bonds (continued)
croatiaCroatia Government Bond, Reg. S 1.5%
17/06/2031 EUR 700,000 941,952 0.05 Croatia Government Bond, Reg. S 1.125%
19/06/2029 EUR 1,400,000 1,810,814 0.10 Croatia Government Bond, Reg. S 2.75%
27/01/2030 EUR 3,800,000 5,585,522 0.31
8,338,288 0.46
DenmarkDenmark Government Bond, Reg. S,
144A 0.5% 15/11/2029 DKK 19,900,000 3,567,104 0.20
3,567,104 0.20
Dominican RepublicDominican Republic Government Bond,
Reg. S 4.875% 23/09/2032 USD 380,000 422,754 0.02 Dominican Republic Government Bond,
Reg. S 5.875% 30/01/2060 USD 3,200,000 3,528,032 0.20
3,950,786 0.22
EcuadorEcuador Government Bond, Reg. S 0.5%
31/07/2035 USD 564,000 308,091 0.02 Ecuador Government Bond, Reg. S 0.5%
31/07/2040 USD 1,140,000 584,261 0.03
892,352 0.05
EgyptEgypt Government Bond, Reg. S 5.25%
06/10/2025 USD 1,880,000 2,004,351 0.11 Egypt Government Bond, Reg. S 6.375%
11/04/2031 EUR 6,500,000 8,611,643 0.48 Egypt Government Bond, Reg. S 8.875%
29/05/2050 USD 1,000,000 1,176,380 0.06 Egypt Government Bond, Reg. S 8.15%
20/11/2059 USD 1,000,000 1,104,022 0.06 Egypt Treasury Bill 0% 02/03/2021 EGP 72,000,000 4,484,080 0.25
17,380,476 0.96
franceFrance Government Bond OAT, Reg. S 0%
25/11/2030 EUR 5,400,000 6,854,877 0.38 France Government Bond OAT, Reg. S,
144A 2% 25/05/2048 EUR 5,100,000 9,123,143 0.51
15,978,020 0.89
GermanyBundesrepublik Deutschland, Reg. S 4.75%
04/07/2034 EUR 2,360,000 5,027,158 0.28 Bundesrepublik Deutschland, Reg. S 4.25%
04/07/2039 EUR 2,100,000 4,866,313 0.27
schEDUlE of InVEsTmEnTsAs at 31 December 2020
Investments Currency
Quantity/ Nominal
Value
Market Value USD
% of Net Assets
Transferable securities and money market instruments admitted to official exchange listing or dealt in on another regulated market
Government Bonds (continued)
Germany (continued)Bundesrepublik Deutschland, Reg. S 2.5%
04/07/2044 EUR 1,390,000 2,865,919 0.16 Bundesrepublik Deutschland, Reg. S 0%
15/08/2050 EUR 2,420,000 3,117,240 0.17
15,876,630 0.88
GreeceGreece Government Bond, Reg. S,
144A 1.5% 18/06/2030 EUR 5,100,000 6,762,387 0.37
6,762,387 0.37
hungaryHungary Government Bond 5.375%
25/03/2024 USD 790,000 902,613 0.05 Hungary Government Bond 3%
21/08/2030 HUF 225,000,000 824,230 0.05
1,726,843 0.10
IndonesiaIndonesia Government Bond 1.75%
24/04/2025 EUR 5,100,000 6,621,866 0.37 Indonesia Government Bond 4.2%
15/10/2050 USD 1,700,000 2,039,854 0.11 Indonesia Treasury 8.25% 15/05/2029 IDR 85,500,000,000 6,995,750 0.39 Indonesia Treasury 7% 15/09/2030 IDR 64,000,000,000 4,920,808 0.27 Indonesia Treasury 9% 15/03/2029 IDR 56,000,000,000 4,746,402 0.26 Indonesia Treasury 8.375% 15/03/2034 IDR 32,806,000,000 2,717,193 0.15
28,041,873 1.55
ItalyItaly Buoni Poliennali Del Tesoro, Reg. S,
144A 1.4% 26/05/2025 EUR 7,400,000 9,618,227 0.53 Italy Buoni Poliennali Del Tesoro, Reg. S,
144A 1.85% 01/07/2025 EUR 7,700,000 10,283,489 0.57 Italy Buoni Poliennali Del Tesoro, Reg. S,
144A 1.65% 01/12/2030 EUR 1,500,000 2,042,514 0.11 Italy Buoni Poliennali Del Tesoro, Reg. S,
144A 1.8% 01/03/2041 EUR 8,770,000 11,908,792 0.66 Italy Buoni Poliennali Del Tesoro, Reg. S,
144A 2.45% 01/09/2050 EUR 7,000,000 10,732,159 0.60 Italy Buoni Poliennali Del Tesoro, Reg. S
1.75% 01/07/2024 EUR 6,200,000 8,134,355 0.45
52,719,536 2.92
JapanJapan Government Five Year Bond 0.1%
20/06/2024 JPY 1,868,000,000 18,272,659 1.01 Japan Government Ten Year Bond 0.1%
20/06/2029 JPY 605,000,000 5,942,626 0.33 Japan Government Ten Year Bond 0.1%
20/03/2030 JPY 722,000,000 7,076,562 0.39 Japan Government Ten Year Bond 0.1%
20/06/2026 JPY 3,301,000,000 32,395,286 1.80 Japan Government Thirty Year Bond 0.4%
20/09/2049 JPY 2,198,000,000 20,095,215 1.12

Morgan Stanley Investment Funds 31 December 2020 194
The accompanying notes are an integral part of these financial statements.
Global Bond Fund (continued)
schEDUlE of InVEsTmEnTsAs at 31 December 2020
Investments Currency
Quantity/ Nominal
Value
Market Value USD
% of Net Assets
Transferable securities and money market instruments admitted to official exchange listing or dealt in on another regulated market
Government Bonds (continued)
Japan (continued)Japan Government Thirty Year Bond 1.7%
20/06/2033 JPY 4,480,000,000 51,877,004 2.88 Japan Government Thirty Year Bond 2%
20/09/2040 JPY 2,385,600,000 30,184,414 1.67 Japan Government Thirty Year Bond 0.3%
20/06/2046 JPY 965,000,000 8,852,319 0.49
174,696,085 9.69
malaysiaMalaysia Government Bond 3.885%
15/08/2029 MYR 19,700,000 5,390,158 0.30
5,390,158 0.30
mexicoMexican Bonos 8.5% 31/05/2029 MXN 128,000,000 7,861,616 0.44 Mexican Bonos 7.75% 29/05/2031 MXN 266,000,000 15,748,337 0.87 Mexico Government Bond 4.5%
22/04/2029 USD 1,500,000 1,762,312 0.10
25,372,265 1.41
moroccoMorocco Government Bond, Reg. S 4%
15/12/2050 USD 1,385,000 1,432,471 0.08
1,432,471 0.08
new ZealandNew Zealand Government Bond 0.25%
15/05/2028 NZD 10,200,000 7,119,422 0.40 New Zealand Government Bond 3%
20/04/2029 NZD 1,300,000 1,104,835 0.06 New Zealand Government Bond 1.75%
15/05/2041 NZD 3,870,000 2,759,545 0.15
10,983,802 0.61
nigeriaNigeria Government Bond, Reg. S 9.248%
21/01/2049 USD 1,500,000 1,766,937 0.10
1,766,937 0.10
norwayNorway Government Bond, Reg. S, 144A
1.375% 19/08/2030 NOK 7,200,000 877,120 0.05
877,120 0.05
PeruPeru Government Bond, Reg. S 5.35%
12/08/2040 PEN 3,100,000 888,541 0.05
888,541 0.05
schEDUlE of InVEsTmEnTsAs at 31 December 2020
Investments Currency
Quantity/ Nominal
Value
Market Value USD
% of Net Assets
Transferable securities and money market instruments admitted to official exchange listing or dealt in on another regulated market
Government Bonds (continued)
PolandPoland Government Bond 2.25%
25/04/2022 PLN 7,300,000 2,023,469 0.11 Poland Government Bond 2.5%
25/07/2027 PLN 7,800,000 2,336,970 0.13
4,360,439 0.24
PortugalPortugal Obrigacoes do Tesouro OT,
Reg. S, 144A 0.7% 15/10/2027 EUR 4,400,000 5,748,728 0.32
5,748,728 0.32
QatarQatar Government Bond, Reg. S 3.75%
16/04/2030 USD 4,600,000 5,421,514 0.30 Qatar Government Bond, Reg. S 5.103%
23/04/2048 USD 2,300,000 3,240,097 0.18
8,661,611 0.48
RussiaRussian Federal Bond - OFZ 7.95%
07/10/2026 RUB 207,000,000 3,138,603 0.17 Russian Foreign Bond - Eurobond, Reg. S
5.625% 04/04/2042 USD 2,600,000 3,622,323 0.20
6,760,926 0.37
senegalSenegal Government Bond, Reg. S 6.25%
23/05/2033 USD 680,000 765,378 0.04
765,378 0.04
sloveniaSlovenia Government Bond, Reg. S
0.275% 14/01/2030 EUR 2,500,000 3,201,994 0.18
3,201,994 0.18
south africaSouth Africa Government Bond 8%
31/01/2030 ZAR 241,000,000 15,706,712 0.87 South Africa Government Bond 8.25%
31/03/2032 ZAR 132,752,418 8,168,258 0.45
23,874,970 1.32
spainSpain Government Bond, Reg. S, 144A
1.6% 30/04/2025 EUR 12,400,000 16,602,277 0.92 Spain Government Bond, Reg. S, 144A
1.25% 31/10/2030 EUR 10,600,000 14,542,429 0.80 Spain Government Bond, Reg. S, 144A
2.7% 31/10/2048 EUR 1,400,000 2,526,880 0.14 Spain Government Bond, Reg. S, 144A
3.45% 30/07/2066 EUR 2,000,000 4,447,191 0.25
38,118,777 2.11
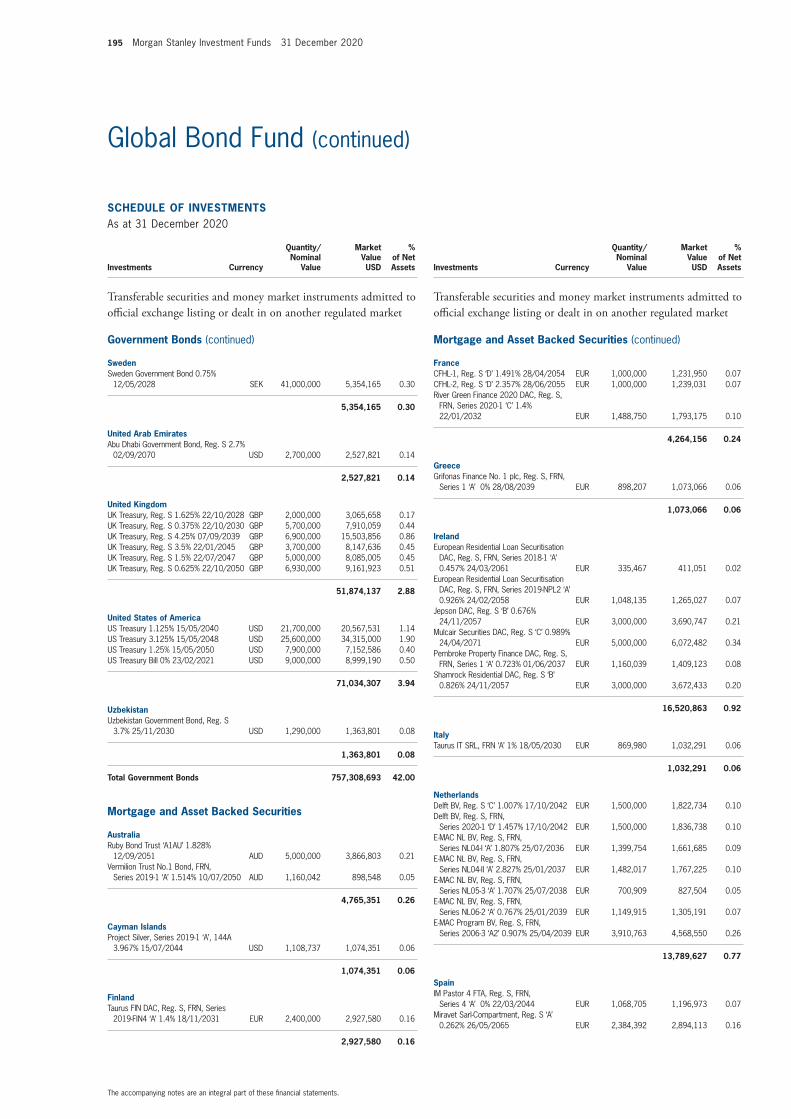
195 Morgan Stanley Investment Funds 31 December 2020
The accompanying notes are an integral part of these financial statements.
Global Bond Fund (continued)
schEDUlE of InVEsTmEnTsAs at 31 December 2020
Investments Currency
Quantity/ Nominal
Value
Market Value USD
% of Net Assets
Transferable securities and money market instruments admitted to official exchange listing or dealt in on another regulated market
Government Bonds (continued)
swedenSweden Government Bond 0.75%
12/05/2028 SEK 41,000,000 5,354,165 0.30
5,354,165 0.30
United arab EmiratesAbu Dhabi Government Bond, Reg. S 2.7%
02/09/2070 USD 2,700,000 2,527,821 0.14
2,527,821 0.14
United KingdomUK Treasury, Reg. S 1.625% 22/10/2028 GBP 2,000,000 3,065,658 0.17 UK Treasury, Reg. S 0.375% 22/10/2030 GBP 5,700,000 7,910,059 0.44 UK Treasury, Reg. S 4.25% 07/09/2039 GBP 6,900,000 15,503,856 0.86 UK Treasury, Reg. S 3.5% 22/01/2045 GBP 3,700,000 8,147,636 0.45 UK Treasury, Reg. S 1.5% 22/07/2047 GBP 5,000,000 8,085,005 0.45 UK Treasury, Reg. S 0.625% 22/10/2050 GBP 6,930,000 9,161,923 0.51
51,874,137 2.88
United states of americaUS Treasury 1.125% 15/05/2040 USD 21,700,000 20,567,531 1.14 US Treasury 3.125% 15/05/2048 USD 25,600,000 34,315,000 1.90 US Treasury 1.25% 15/05/2050 USD 7,900,000 7,152,586 0.40 US Treasury Bill 0% 23/02/2021 USD 9,000,000 8,999,190 0.50
71,034,307 3.94
UzbekistanUzbekistan Government Bond, Reg. S
3.7% 25/11/2030 USD 1,290,000 1,363,801 0.08
1,363,801 0.08
Total Government Bonds 757,308,693 42.00
mortgage and asset Backed securities
australiaRuby Bond Trust ‘A1AU’ 1.828%
12/09/2051 AUD 5,000,000 3,866,803 0.21 Vermilion Trust No.1 Bond, FRN,
Series 2019-1 ‘A’ 1.514% 10/07/2050 AUD 1,160,042 898,548 0.05
4,765,351 0.26
cayman IslandsProject Silver, Series 2019-1 ‘A’, 144A
3.967% 15/07/2044 USD 1,108,737 1,074,351 0.06
1,074,351 0.06
finlandTaurus FIN DAC, Reg. S, FRN, Series
2019-FIN4 ‘A’ 1.4% 18/11/2031 EUR 2,400,000 2,927,580 0.16
2,927,580 0.16
schEDUlE of InVEsTmEnTsAs at 31 December 2020
Investments Currency
Quantity/ Nominal
Value
Market Value USD
% of Net Assets
Transferable securities and money market instruments admitted to official exchange listing or dealt in on another regulated market
mortgage and asset Backed securities (continued)
franceCFHL-1, Reg. S ‘D’ 1.491% 28/04/2054 EUR 1,000,000 1,231,950 0.07 CFHL-2, Reg. S ‘D’ 2.357% 28/06/2055 EUR 1,000,000 1,239,031 0.07 River Green Finance 2020 DAC, Reg. S,
FRN, Series 2020-1 ‘C’ 1.4% 22/01/2032 EUR 1,488,750 1,793,175 0.10
4,264,156 0.24
GreeceGrifonas Finance No. 1 plc, Reg. S, FRN,
Series 1 ‘A’ 0% 28/08/2039 EUR 898,207 1,073,066 0.06
1,073,066 0.06
IrelandEuropean Residential Loan Securitisation
DAC, Reg. S, FRN, Series 2018-1 ‘A’ 0.457% 24/03/2061 EUR 335,467 411,051 0.02
European Residential Loan Securitisation DAC, Reg. S, FRN, Series 2019-NPL2 ‘A’ 0.926% 24/02/2058 EUR 1,048,135 1,265,027 0.07
Jepson DAC, Reg. S ‘B’ 0.676% 24/11/2057 EUR 3,000,000 3,690,747 0.21
Mulcair Securities DAC, Reg. S ‘C’ 0.989% 24/04/2071 EUR 5,000,000 6,072,482 0.34
Pembroke Property Finance DAC, Reg. S, FRN, Series 1 ‘A’ 0.723% 01/06/2037 EUR 1,160,039 1,409,123 0.08
Shamrock Residential DAC, Reg. S ‘B’ 0.826% 24/11/2057 EUR 3,000,000 3,672,433 0.20
16,520,863 0.92
ItalyTaurus IT SRL, FRN ‘A’ 1% 18/05/2030 EUR 869,980 1,032,291 0.06
1,032,291 0.06
netherlandsDelft BV, Reg. S ‘C’ 1.007% 17/10/2042 EUR 1,500,000 1,822,734 0.10 Delft BV, Reg. S, FRN,
Series 2020-1 ‘D’ 1.457% 17/10/2042 EUR 1,500,000 1,836,738 0.10 E-MAC NL BV, Reg. S, FRN,
Series NL04-I ‘A’ 1.807% 25/07/2036 EUR 1,399,754 1,661,685 0.09 E-MAC NL BV, Reg. S, FRN,
Series NL04-II ‘A’ 2.827% 25/01/2037 EUR 1,482,017 1,767,225 0.10 E-MAC NL BV, Reg. S, FRN,
Series NL05-3 ‘A’ 1.707% 25/07/2038 EUR 700,909 827,504 0.05 E-MAC NL BV, Reg. S, FRN,
Series NL06-2 ‘A’ 0.767% 25/01/2039 EUR 1,149,915 1,305,191 0.07 E-MAC Program BV, Reg. S, FRN,
Series 2006-3 ‘A2’ 0.907% 25/04/2039 EUR 3,910,763 4,568,550 0.26
13,789,627 0.77
spainIM Pastor 4 FTA, Reg. S, FRN,
Series 4 ‘A’ 0% 22/03/2044 EUR 1,068,705 1,196,973 0.07 Miravet Sarl-Compartment, Reg. S ‘A’
0.262% 26/05/2065 EUR 2,384,392 2,894,113 0.16

Morgan Stanley Investment Funds 31 December 2020 196
The accompanying notes are an integral part of these financial statements.
Global Bond Fund (continued)
schEDUlE of InVEsTmEnTsAs at 31 December 2020
Investments Currency
Quantity/ Nominal
Value
Market Value USD
% of Net Assets
Transferable securities and money market instruments admitted to official exchange listing or dealt in on another regulated market
mortgage and asset Backed securities (continued)
spain (continued)Prosil Acquisition SA, Reg. S, FRN,
Series 1 ‘A’ 1.542% 31/10/2039 EUR 1,996,227 2,089,255 0.12 UCI 16 FTA, Reg. S, FRN,
Series 16 ‘A2’ 0% 16/06/2049 EUR 985,411 1,163,530 0.06
7,343,871 0.41
United KingdomBanna RMBS DAC, Reg. S, FRN,
Series 2019-1 ‘A’ 1.253% 30/12/2063 GBP 1,337,846 1,828,020 0.10 Banna RMBS DAC, Reg. S, FRN,
Series 2019-1 ‘D’ 2.803% 30/12/2063 GBP 500,000 627,794 0.03 Eurohome UK Mortgages plc, Reg. S, FRN,
Series 2007-2 ‘M2’ 0.659% 15/09/2044 GBP 2,800,000 3,180,915 0.18 Eurosail-UK plc, Reg. S, FRN,
Series 2007-5X ‘A1C’ 0.83% 13/09/2045 GBP 1,616,729 2,083,130 0.12
Harben Finance plc, Reg. S ‘B’ 1.248% 20/08/2056 GBP 3,500,000 4,775,788 0.27
Ludgate Funding plc, Reg. S, FRN, Series 2008-W1X ‘CB’ 0.687% 01/01/2061 EUR 695,721 767,874 0.04
Newday Partnership Funding plc ‘A3’, 144A 1.454% 15/11/2028 GBP 2,000,000 2,741,730 0.15
Newgate Funding plc, Reg. S, FRN, Series 2007-2X ‘A3’ 0.219% 15/12/2050 GBP 1,200,000 1,557,047 0.09
Newgate Funding plc, Reg. S, FRN, Series 2007-3X ‘A3’ 1.06% 15/12/2050 GBP 2,163,233 2,898,361 0.16
Paragon Mortgages No. 14 plc, Reg. S, FRN, Series 14X ‘BB’ 0% 15/09/2039 EUR 1,400,000 1,690,808 0.09
Paragon Mortgages No. 25 plc, Reg. S, FRN, Series 25 ‘B’ 1.023% 15/05/2050 GBP 1,000,000 1,355,967 0.08
Ripon Mortgages plc, Reg. S ‘C2’ 1.568% 20/08/2056 GBP 4,000,000 5,473,533 0.30
RMAC NO 2 plc, Reg. S, FRN, Series 2018-2 ‘A’ 1.005% 12/06/2046 GBP 582,528 797,942 0.04
Rochester Financing No. 2 plc, Reg. S, FRN, Series 2 ‘D’ 2.802% 18/06/2045 GBP 1,250,000 1,706,651 0.09
Small Business Origination Loan Trust DAC, Reg. S, FRN, Series 2019-3 ‘C’ 3.053% 15/10/2028 GBP 1,201,305 1,569,520 0.09
Stratton Mortgage Funding plc, Reg. S ‘D’ 2.554% 25/05/2051 GBP 2,000,000 2,732,772 0.15
Taurus UK DAC, Reg. S ‘A’ 1.755% 17/08/2030 GBP 2,479,773 3,402,991 0.19
Taurus UK DAC, Reg. S, FRN, Series 2019-UK2 ‘A’ 1.273% 17/11/2029 GBP 1,200,000 1,617,868 0.09
Towd Point Mortgage Funding, FRN, Series 2019-V2A ‘A’, 144A 1.255% 20/02/2054 GBP 1,071,414 1,470,043 0.08
42,278,754 2.34
United states of americaAlternative Loan Trust, Series 2006-4CB
‘1A1’ 6% 25/04/2036 USD 316,151 235,952 0.01 Alternative Loan Trust, Series 2007-5CB
‘1A12’ 6% 25/04/2037 USD 905,819 715,172 0.04 Alternative Loan Trust, Series 2005-86CB
‘A11’ 5.5% 25/02/2036 USD 78,176 64,746 0.00
schEDUlE of InVEsTmEnTsAs at 31 December 2020
Investments Currency
Quantity/ Nominal
Value
Market Value USD
% of Net Assets
Transferable securities and money market instruments admitted to official exchange listing or dealt in on another regulated market
mortgage and asset Backed securities (continued)
United states of america (continued)Alternative Loan Trust, Series 2005-86CB
‘A4’ 5.5% 25/02/2036 USD 138,240 114,492 0.01 American Homes 4 Rent Trust,
Series 2015-SFR1 ‘E’, 144A 5.639% 17/04/2052 USD 770,000 859,620 0.05
American Homes 4 Rent Trust, Series 2014-SFR2 ‘E’, 144A 6.231% 17/10/2036 USD 700,000 779,350 0.04
Ashford Hospitality Trust, FRN, Series 2018-KEYS ‘C’, 144A 1.991% 15/06/2035 USD 1,800,000 1,685,091 0.09
Avant Loans Funding Trust, Series 2018-B ‘B’, 144A 4.11% 15/07/2022 USD 155,309 155,577 0.01
Banc of America Alternative Loan Trust, Series 2005-8 ‘2CB1’ 6% 25/09/2035 USD 207,397 208,275 0.01
Banc of America Alternative Loan Trust, FRN, Series 2006-6 ‘CB1’ 0.8% 25/07/2046 USD 369,655 271,884 0.02
Banc of America Funding Trust, Series 2007-5 ‘3A1’ 6% 25/07/2037 USD 401,743 389,377 0.02
Cascade Funding Mortgage Trust, FRN, Series 2018-RM2 ‘A’, 144A 4% 25/10/2068 USD 755,839 782,538 0.04
Cascade Funding Mortgage Trust, FRN, Series 2018-RM2 ‘B’, 144A 4% 25/10/2068 USD 5,442,123 5,574,089 0.31
Cascade Funding Mortgage Trust, FRN, Series 2018-RM2 ‘C’, 144A 4% 25/10/2068 USD 2,176,849 2,187,659 0.12
Castlelake Aircraft Structured Trust, Series 2019-1A ‘A’, 144A 3.967% 15/04/2039 USD 1,311,806 1,253,904 0.07
Chase Mortgage Finance Trust, FRN, Series 2007-A1 ‘11A4’ 3.635% 25/03/2037 USD 610,553 602,563 0.03
CHL GMSR Issuer Trust ‘A’, 144A 2.898% 25/05/2023 USD 3,500,000 3,456,934 0.19
CHL Mortgage Pass-Through Trust, Series 2004-8 ‘1A11’ 5.25% 25/07/2034 USD 1,783,817 1,906,247 0.11
COMM Mortgage Trust, FRN, Series 2014-CR18 ‘D’, 144A 4.901% 15/07/2047 USD 594,000 505,370 0.03
CWABS Trust, STEP, Series 2005-3 ‘AF5B’ 6.095% 25/08/2035 USD 1,447,829 1,496,359 0.08
FHLMC, IO, FRN, Series K038 ‘X1’ 1.272% 25/03/2024 USD 17,298,722 523,980 0.03
FHLMC, FRN 849761 3.12% 01/07/2045 USD 188,920 196,105 0.01 FHLMC A64548 6% 01/08/2037 USD 7,956 8,999 0.00 FHLMC G00876 6.5% 01/01/2028 USD 1,969 2,208 0.00 FHLMC G05631 7.5% 01/05/2035 USD 5,672 6,718 0.00 FHLMC G05639 8% 01/08/2032 USD 3,370 4,034 0.00 FHLMC G05640 8.5% 01/08/2031 USD 3,462 4,181 0.00 FHLMC G60038 3.5% 01/01/2044 USD 973,704 1,058,422 0.06 FHLMC RE6004 3.5% 01/08/2049 USD 616,911 640,484 0.04 FHLMC Whole Loan Securities Trust,
Series 2015-SC02 ‘1A’ 3% 25/09/2045 USD 572,764 582,661 0.03 FHLMC Whole Loan Securities Trust,
Series 2016-SC01 ‘1A’ 3% 25/07/2046 USD 173,356 176,830 0.01 FHLMC Whole Loan Securities Trust,
Series MR-1 ‘1A’ 3.5% 25/05/2045 USD 231,295 233,339 0.01 FHLMC Whole Loan Securities Trust,
Series 2015-SC01 ‘2A’ 4% 25/05/2045 USD 92,883 96,832 0.01 FHLMC Whole Loan Securities Trust,
Series 2015-SC02 ‘2A’ 3.5% 25/09/2045 USD 456,942 469,341 0.03

197 Morgan Stanley Investment Funds 31 December 2020
The accompanying notes are an integral part of these financial statements.
Global Bond Fund (continued)
schEDUlE of InVEsTmEnTsAs at 31 December 2020
Investments Currency
Quantity/ Nominal
Value
Market Value USD
% of Net Assets
Transferable securities and money market instruments admitted to official exchange listing or dealt in on another regulated market
mortgage and asset Backed securities (continued)
United states of america (continued)FHLMC Whole Loan Securities Trust,
Series 2016-SC01 ‘2A’ 3.5% 25/07/2046 USD 266,722 273,915 0.02 FNMA MA3647 3.5% 01/04/2049 USD 162,910 169,286 0.01 FNMA MA3652 4.5% 01/03/2049 USD 710,480 751,750 0.04 FNMA MA3725 3.5% 01/07/2049 USD 505,106 524,832 0.03 FREED ABS Trust, Series 2018-2 ‘B’, 144A
4.61% 20/10/2025 USD 1,764,000 1,789,066 0.10 GNMA, IO, Series 2013-71 ‘IG’ 3.5%
20/05/2043 USD 2,052,208 215,246 0.01 GNMA BK5991 5% 20/12/2048 USD 115,416 124,801 0.01 GNMA BL6438 4.5% 20/04/2049 USD 484,393 520,689 0.03 GS Mortgage Securities Corp. Trust, FRN,
Series 2018-TWR ‘A’, 144A 1.041% 15/07/2031 USD 2,500,000 2,483,177 0.14
HarborView Mortgage Loan Trust, FRN, Series 2006-12 ‘2A2A’ 0.34% 19/01/2038 USD 474,243 444,813 0.02
Headlands Residential LLC, STEP, Series 2019-RPL1 ‘NOTE’, 144A 3.967% 25/06/2024 USD 1,000,000 1,006,601 0.06
Invitation Homes Trust, FRN, Series 2018-SFR4 ‘D’, 144A 1.786% 17/01/2038 USD 2,250,000 2,252,829 0.13
Invitation Homes Trust, FRN, Series 2018-SFR1 ‘E’, 144A 2.136% 17/03/2037 USD 2,999,590 3,005,729 0.17
J.P. Morgan Chase Commercial Mortgage Securities Trust, FRN, Series 2018-PTC ‘A’, 144A 1.341% 15/04/2031 USD 2,500,000 2,449,783 0.14
J.P. Morgan Mortgage Trust, FRN, Series 2007-A4 ‘2A3’ 3.785% 25/06/2037 USD 608,120 537,784 0.03
J.P. Morgan Mortgage Trust, FRN, Series 2005-A4 ‘4A2’ 3.395% 25/07/2035 USD 293,725 294,932 0.02
JPMBB Commercial Mortgage Securities Trust, FRN, Series 2014-C19 ‘D’, 144A 4.832% 15/04/2047 USD 1,515,000 1,385,813 0.08
JPMBB Commercial Mortgage Securities Trust, FRN, Series 2014-C23 ‘D’, 144A 4.121% 15/09/2047 USD 290,000 254,562 0.01
Long Beach Mortgage Loan Trust, FRN, Series 2001-3 ‘M1’ 0.973% 25/09/2031 USD 8,255 8,255 0.00
Mastr Asset-Backed Securities Trust, FRN, Series 2003-WMC1 ‘M1’ 1.65% 25/05/2033 USD 474,029 469,094 0.03
Merrill Lynch Mortgage Investors Trust, FRN, Series 2004-1 ‘2A2’ 2.634% 25/12/2034 USD 273,403 275,433 0.02
METAL LLC, Series 2017-1 ‘A’, 144A 4.581% 15/10/2042 USD 1,697,740 1,361,325 0.08
MortgageIT Trust, Series 2005-1 ‘1A1’ 0.79% 25/02/2035 USD 1,050,484 1,069,515 0.06
MortgageIT Trust, FRN, Series 2005-4 ‘M1’ 1.05% 25/10/2035 USD 526,025 530,297 0.03
Natixis Commercial Mortgage Securities Trust, FRN, Series 2019-MILE ‘A’, 144A 1.641% 15/07/2036 USD 2,451,000 2,447,991 0.14
New Residential Mortgage Loan Trust ‘A1’, 144A 4.335% 25/07/2060 USD 3,824,025 3,877,178 0.22
New Residential Mortgage Loan Trust ‘A1’, 144A 3.228% 25/08/2060 USD 709,103 715,384 0.04
NovaStar Mortgage Funding Trust, FRN, Series 2004-3 ‘M4’ 1.723% 25/12/2034 USD 800,000 794,290 0.04
schEDUlE of InVEsTmEnTsAs at 31 December 2020
Investments Currency
Quantity/ Nominal
Value
Market Value USD
% of Net Assets
Transferable securities and money market instruments admitted to official exchange listing or dealt in on another regulated market
mortgage and asset Backed securities (continued)
United states of america (continued)PNMAC FMSR ISSUER Trust, FRN,
Series 2018-FT1 ‘A’, 144A 2.498% 25/04/2023 USD 4,500,000 4,359,759 0.24
PNMAC GMSR ISSUER Trust, FRN, Series 2018-GT1 ‘A’, 144A 3% 25/02/2023 USD 3,500,000 3,467,010 0.19
PNMAC GMSR ISSUER Trust, FRN, Series 2018-GT2 ‘A’, 144A 2.8% 25/08/2025 USD 2,500,000 2,418,532 0.13
Pretium Mortgage Credit Partners I LLC ‘A1’, 144A 3.819% 27/05/2060 USD 2,898,583 2,923,924 0.16
Progress Residential Trust ‘E’, 144A 4.873% 17/10/2035 USD 2,397,000 2,461,451 0.14
Progress Residential Trust, Series 2018-SFR2 ‘E’, 144A 4.656% 17/08/2035 USD 1,032,000 1,052,728 0.06
RALI Trust ‘A1’ 6% 25/01/2037 USD 229,748 218,997 0.01 RALI Trust, Series 2006-QS8 ‘A1’ 6%
25/08/2036 USD 1,119,054 1,099,769 0.06 RALI Trust, Series 2006-QS4 ‘A2’ 6%
25/04/2036 USD 271,220 263,745 0.01 Raptor Aircraft Finance I LLC,
Series 2019-1 ‘A’, 144A 4.213% 23/08/2044 USD 3,059,812 2,610,410 0.14
Renaissance Home Equity Loan Trust, FRN, Series 2002-3 ‘A’ 0.91% 25/12/2032 USD 867,629 830,690 0.05
Renaissance Home Equity Loan Trust, FRN, Series 2002-4 ‘A’ 1.39% 25/03/2033 USD 467,396 464,125 0.03
Residential Asset Securitization Trust, Series 2006-A6 ‘2A6’ 6% 25/07/2036 USD 227,028 185,671 0.01
Seasoned Credit Risk Transfer Trust, Series 2019-2 ‘HT’ 3% 25/08/2058 USD 516,314 558,509 0.03
Seasoned Credit Risk Transfer Trust, Series 2019-3 ‘HT’ 3% 25/10/2058 USD 349,625 378,406 0.02
Seasoned Credit Risk Transfer Trust, Series 2019-2 ‘M55D’ 4% 25/08/2058 USD 384,038 425,055 0.02
Seasoned Credit Risk Transfer Trust, Series 2019-3 ‘M55D’ 4% 25/10/2058 USD 389,791 431,019 0.02
Seasoned Credit Risk Transfer Trust, Series 2018-1 ‘MT’ 3% 25/05/2057 USD 1,227,665 1,318,939 0.07
SLM Student Loan Trust, Reg. S, FRN 0.007% 15/12/2033 EUR 4,041,183 4,610,120 0.26
SLM Student Loan Trust, Reg. S, FRN 0.039% 25/07/2039 EUR 4,000,000 4,680,074 0.26
SLM Student Loan Trust, Reg. S, FRN, Series 2004-5X ‘A6’ 0% 25/10/2039 EUR 1,161,112 1,359,093 0.08
SLM Student Loan Trust, Reg. S, FRN, Series 2004-10X ‘A8’ 0.039% 25/01/2040 EUR 4,000,000 4,536,755 0.25
Structured Adjustable Rate Mortgage Loan Trust, FRN, Series 2004-1 ‘6A’ 3.002% 25/02/2034 USD 568,811 563,759 0.03
Tricon American Homes Trust ‘D’, 144A 3.672% 17/01/2036 USD 3,000,000 3,094,151 0.17
Tricon American Homes Trust ‘D’, 144A 4.168% 17/05/2037 USD 4,400,000 4,679,232 0.26
UMBS 251898 6.5% 01/08/2028 USD 1,091 1,224 0.00 UMBS 252589 6.5% 01/05/2029 USD 1,072 1,201 0.00 UMBS 253794 6.5% 01/05/2031 USD 2,024 2,309 0.00 UMBS 253894 6.5% 01/08/2031 USD 6,378 7,445 0.00 UMBS 485674 6.5% 01/03/2029 USD 2,063 2,314 0.00 UMBS 490758 6.5% 01/03/2029 USD 22,704 25,466 0.00 UMBS 496029 6.5% 01/01/2029 USD 46 51 0.00 UMBS 527244 6.5% 01/11/2029 USD 190 213 0.00 UMBS 591189 6.5% 01/08/2031 USD 310 348 0.00 UMBS 653071 6.5% 01/07/2032 USD 1,453 1,629 0.00

Morgan Stanley Investment Funds 31 December 2020 198
The accompanying notes are an integral part of these financial statements.
Global Bond Fund (continued)
schEDUlE of InVEsTmEnTsAs at 31 December 2020
Investments Currency
Quantity/ Nominal
Value
Market Value USD
% of Net Assets
Transferable securities and money market instruments admitted to official exchange listing or dealt in on another regulated market
mortgage and asset Backed securities (continued)
United states of america (continued)UMBS 675952 6.5% 01/04/2032 USD 630 710 0.00 UMBS 702022 6.5% 01/05/2033 USD 403 469 0.00 UMBS 962304 5.5% 01/03/2038 USD 22,883 26,590 0.00 UMBS AB1222 4.5% 01/07/2040 USD 292,596 331,444 0.02 UMBS AD0273 8.5% 01/10/2032 USD 6,340 7,818 0.00 UMBS AH2962 5% 01/01/2041 USD 39,398 43,716 0.00 UMBS AH5714 5% 01/02/2041 USD 210,921 245,345 0.01 UMBS AI1647 4.5% 01/07/2041 USD 539,102 597,469 0.03 UMBS AJ2800 4% 01/11/2041 USD 225,505 246,682 0.01 UMBS AJ9630 4% 01/12/2041 USD 966,540 1,065,589 0.06 UMBS AU1323 4% 01/07/2043 USD 502,124 555,050 0.03 UMBS AZ1221 3.5% 01/06/2046 USD 167,373 178,894 0.01 UMBS BM5827 5% 01/04/2049 USD 239,452 266,270 0.02 UMBS MA2512 4% 01/01/2046 USD 239,565 260,716 0.01 UMBS MA3527 5% 01/11/2048 USD 224,140 248,284 0.01 UMBS RA1316 4.5% 01/04/2049 USD 644,919 703,464 0.04 UMBS ZA7151 4.5% 01/01/2049 USD 528,178 573,327 0.03 UMBS ZN1319 4.5% 01/11/2048 USD 1,018,012 1,102,907 0.06 VCAT LLC ‘A1’, 144A 3.671%
25/08/2050 USD 922,135 934,284 0.05 Vericrest Opportunity Loan Trust, STEP,
Series 2020-NPL2 ‘A1A’, 144A 2.981% 25/02/2050 USD 1,979,971 1,986,168 0.11
Veros Automobile Receivables Trust, Series 2018-1 ‘C’, 144A 4.65% 15/02/2024 USD 1,390,121 1,401,754 0.08
Wells Fargo Commercial Mortgage Trust, FRN, Series 2020-SOP ‘A’, 144A 1.281% 15/01/2035 USD 1,500,000 1,474,992 0.08
WFRBS Commercial Mortgage Trust, FRN, Series 2014-C23 ‘D’, 144A 4.141% 15/10/2057 USD 1,000,000 964,277 0.05
119,534,045 6.63
Total mortgage and asset Backed securities 214,603,955 11.91
To Be announced contracts
United states of americaUMBS 2.5% 25/01/2050 USD 49,000,000 51,591,639 2.86 UMBS 2% 25/02/2050 USD 69,000,000 71,463,241 3.96 UMBS 3% 25/01/2050 USD 22,000,000 23,042,422 1.28
146,097,302 8.10
Total To Be announced contracts 146,097,302 8.10
Total Transferable securities and money market instruments admitted to official exchange listing or dealt in on another regulated market 1,667,502,649 92.47
schEDUlE of InVEsTmEnTsAs at 31 December 2020
Investments Currency
Quantity/ Nominal
Value
Market Value USD
% of Net Assets
Other transferable securities and money market instruments not admitted to official exchange listing or dealt in on another regulated market
corporate Bonds
GreeceLuminis Finance plc 0% 12/06/2022* EUR 1,953,599 2,331,032 0.13 Luminis Finance plc, Reg. S, FRN 0%
12/03/2025* EUR 2,327,416 2,777,071 0.16
5,108,103 0.29
Total corporate Bonds 5,108,103 0.29
Total other transferable securities and money market instruments not admitted to official exchange listing or dealt in on another regulated market 5,108,103 0.29
Units of authorised UCITS or other collective investment undertakings
collective Investment schemes – UcITs
luxembourgMorgan Stanley Liquidity Funds Euro
Liquidity Fund – MS Reserve† EUR 27,390,752 27,390,752 1.52 Morgan Stanley Liquidity Funds US Dollar
Liquidity Fund – MS Reserve† USD 59,291,843 59,291,843 3.29
86,682,595 4.81
Total collective Investment schemes – UcITs 86,682,595 4.81
Exchange Traded funds
IrelandiShares Core EUR Corp Bond UCITS ETF EUR 3,000 502,285 0.03 iShares Core EUR Corp Bond UCITS ETF GBP 130,000 21,873,183 1.21 iShares USD Short Duration Corp Bond
UCITS ETF MXN 1,539,000 8,702,761 0.48
31,078,229 1.72
United KingdomiShares USD Corp. Bond UCITS ETF USD 323,000 42,833,030 2.37
42,833,030 2.37

199 Morgan Stanley Investment Funds 31 December 2020
The accompanying notes are an integral part of these financial statements.
Global Bond Fund (continued)
financial futures contracts
security Descriptionnumber
of contracts currency
Global Exposure
UsD
Unrealised Gain/(loss)
UsD
% of net assets
Euro-Bund, 08/03/2021 (18) EUR (3,923,165) 3,534 0.00US 2 Year Note, 31/03/2021 260 USD 57,451,875 50,788 0.00US 10 Year Ultra Bond, 22/03/2021 (323) USD (50,468,750) 181,203 0.01 US Long Bond, 22/03/2021 (27) USD (4,671,000) 45,352 0.00
Total Unrealised Gain on financial futures contracts 280,877 0.01
Japan 10 Year Bond, 15/03/2021 11 JPY 16,216,830 (2,998) 0.00US 5 Year Note, 31/03/2021 (102) USD (12,866,344) (26,308) 0.00
Total Unrealised loss on financial futures contracts (29,306) 0.00
net Unrealised Gain on financial futures contracts 251,571 0.01
forward currency Exchange contracts (continued)
currency Purchased
amount Purchased
currency sold
amount sold
maturity Date counterparty
Unrealised Gain/(loss)
UsD
% of net assets
EUR 23,550,000 USD 28,009,298 19/01/2021 Canadian Imperial Bank of Commerce 895,419 0.05
EUR 3,088,603 USD 3,654,159 19/01/2021 Citigroup 136,719 0.01 EUR 1,500,000 USD 1,765,749 19/01/2021 UBS 75,316 0.00CAD 6,234,000 USD 4,689,397 20/01/2021 RBC 210,306 0.01 MXN 47,372,699 USD 2,275,893 20/01/2021 Barclays 104,710 0.01 MXN 13,447,301 USD 639,312 20/01/2021 BNP Paribas 36,451 0.00MXN 37,189,685 USD 1,841,119 20/01/2021 State Street 27,761 0.00SGD 3,907,000 USD 2,861,013 20/01/2021 Barclays 97,181 0.01 SGD 1,232,193 USD 913,832 20/01/2021 State Street 19,126 0.00USD 2,403,556 MXN 47,725,000 20/01/2021 Goldman Sachs 5,248 0.00NOK 40,520,000 USD 4,600,854 21/01/2021 J.P. Morgan 147,934 0.01 NOK 48,290,000 USD 5,111,898 21/01/2021 State Street 547,505 0.03 SEK 21,010,000 USD 2,370,987 21/01/2021 Goldman Sachs 202,235 0.01 SEK 7,873,489 USD 914,652 21/01/2021 RBC 49,661 0.00AUD 14,041,109 USD 10,676,747 22/01/2021 State Street 179,911 0.01 AUD 1,754,940 USD 1,277,058 22/01/2021 Westpac Banking 79,871 0.00EUR 2,656,322 ZAR 47,660,210 22/01/2021 Goldman Sachs 15,815 0.00NZD 11,040,062 USD 7,611,681 22/01/2021 ANZ 370,386 0.02 NZD 1,768,001 USD 1,244,581 22/01/2021 RBC 33,700 0.00USD 2,801,413 ZAR 41,095,885 22/01/2021 HSBC 3,586 0.00ZAR 33,002,500 USD 2,082,567 22/01/2021 BNP Paribas 164,259 0.01 ZAR 33,002,500 USD 2,073,423 22/01/2021 UBS 173,402 0.01 CHF 7,000,000 USD 7,785,503 25/01/2021 Westpac Banking 169,582 0.01 CZK 38,570,000 USD 1,715,753 25/01/2021 Barclays 88,086 0.01 HUF 223,782,000 USD 740,134 25/01/2021 Goldman Sachs 14,863 0.00PLN 14,522,000 USD 3,813,450 25/01/2021 Commonwealth
Bank of Australia 93,978 0.01 USD 9,423,015 PLN 34,835,000 25/01/2021 BNP Paribas 49,975 0.00GBP 6,975,000 USD 9,208,278 27/01/2021 BNP Paribas 320,806 0.02 GBP 1,112,386 USD 1,472,736 27/01/2021 J.P. Morgan 46,980 0.00CNH 327,198,000 USD 49,380,551 28/01/2021 Barclays 867,593 0.05 CNH 18,302,916 USD 2,757,373 28/01/2021 State Street 53,425 0.00RON 6,920,000 USD 1,676,154 28/01/2021 Goldman Sachs 65,623 0.00THB 27,968,571 USD 921,510 28/01/2021 Merrill Lynch 13,007 0.00THB 169,960,000 USD 5,596,312 28/01/2021 State Street 82,580 0.00JPY 307,178,000 USD 2,949,027 29/01/2021 ANZ 32,804 0.00JPY 417,835,777 USD 4,002,835 29/01/2021 Canadian Imperial
Bank of Commerce 53,170 0.00
schEDUlE of InVEsTmEnTsAs at 31 December 2020
Investments Currency
Quantity/ Nominal
Value
Market Value USD
% of Net Assets
Units of authorised UCITS or other collective investment undertakings
Exchange Traded funds (continued)
United states of americaiShares USD High Yield Corp Bond
UCITS ETF USD 99,000 10,201,950 0.57
10,201,950 0.57
Total Exchange Traded funds 84,113,209 4.66
Total Units of authorised UcITs or other collective investment undertakings 170,795,804 9.47
Total Investments 1,843,406,556 102.23
cash 96,562,170 5.36
other assets/(liabilities) (136,772,152) (7.59)
Total net assets 1,803,196,574 100.00
* Security is valued at its fair value under the direction of the Board of Directors.† Managed by an affiliate of the Investment Adviser. The country disclosed within the Schedule of Investments refers to the country of risk. The country of incorporation may differ.
DERIVaTIVEs
Over-the-counter (OTC) and exchange traded derivatives as at 31 December 2020, expressed in US Dollars.

Morgan Stanley Investment Funds 31 December 2020 200
The accompanying notes are an integral part of these financial statements.
Global Bond Fund (continued)
forward currency Exchange contracts (continued)
currency Purchased
amount Purchased
currency sold
amount sold
maturity Date counterparty
Unrealised Gain/(loss)
UsD
% of net assets
JPY 915,055,000 USD 8,836,893 29/01/2021 Citigroup 45,707 0.00JPY 8,768,189,000 USD 83,673,750 29/01/2021 Westpac Banking 1,440,604 0.08 COP 6,412,650,000 USD 1,759,783 01/02/2021 State Street 118,366 0.01 KRW 33,644,199,000 USD 30,383,996 01/02/2021 State Street 452,426 0.03 PEN 3,185,000 USD 869,743 01/02/2021 State Street 8,878 0.00USD 4,421,301 BRL 22,500,000 01/02/2021 HSBC 90,364 0.01 USD 17,574 BRL 90,000 01/02/2021 J.P. Morgan 251 0.00
Unrealised Gain on forward currency Exchange contracts – assets 7,685,570 0.42
EUR hedged share classUSD 108,306 EUR 88,099 05/01/2021 J.P. Morgan 213 0.00EUR 395,762,826 USD 481,444,661 08/01/2021 J.P. Morgan 4,171,409 0.23 USD 6,475 EUR 5,265 08/01/2021 J.P. Morgan 14 0.00AUD 18,280 EUR 11,339 29/01/2021 J.P. Morgan 215 0.00BRL 320,272 EUR 50,005 29/01/2021 J.P. Morgan 261 0.00CAD 271,439 EUR 172,999 29/01/2021 J.P. Morgan 962 0.00CHF 1,690,445 EUR 1,558,369 29/01/2021 J.P. Morgan 8,168 0.00CNH 18,253 EUR 2,274 29/01/2021 J.P. Morgan 11 0.00CNY 33,659 EUR 4,192 29/01/2021 J.P. Morgan 12 0.00EUR 2,287,444 BRL 14,259,303 29/01/2021 J.P. Morgan 63,387 0.00EUR 8,185,128 CAD 12,699,160 29/01/2021 J.P. Morgan 67,277 0.00EUR 1,573,258 CHF 1,694,242 29/01/2021 J.P. Morgan 5,797 0.00EUR 6,935,468 CNH 55,183,204 29/01/2021 J.P. Morgan 40,524 0.00EUR 12,768,294 CNY 101,762,308 29/01/2021 J.P. Morgan 81,014 0.01 EUR 9,296 JPY 1,173,153 29/01/2021 J.P. Morgan 24 0.00EUR 5,219,209 KRW 6,945,130,783 29/01/2021 J.P. Morgan 41,957 0.00EUR 2,194,551 PLN 9,737,138 29/01/2021 J.P. Morgan 74,174 0.01 EUR 105,386,393 USD 128,177,039 29/01/2021 J.P. Morgan 1,202,995 0.07 EUR 856 ZAR 15,409 29/01/2021 J.P. Morgan 3 0.00GBP 46,588 EUR 51,157 29/01/2021 J.P. Morgan 844 0.00IDR 82,216,083 EUR 4,750 29/01/2021 J.P. Morgan 66 0.00JPY 1,859,045 EUR 14,688 29/01/2021 J.P. Morgan 14 0.00MXN 262,926 EUR 10,664 29/01/2021 J.P. Morgan 107 0.00NOK 48,150 EUR 4,540 29/01/2021 J.P. Morgan 69 0.00ZAR 69,875 EUR 3,808 29/01/2021 J.P. Morgan 77 0.00
Unrealised Gain on naV hedged share classes forward currency Exchange contracts – assets 5,759,594 0.32
JPY hedged share classBRL 25,720 JPY 509,440 29/01/2021 J.P. Morgan 6 0.00CAD 21,523 JPY 1,740,809 29/01/2021 J.P. Morgan 18 0.00CHF 138,094 JPY 16,118,516 29/01/2021 J.P. Morgan 490 0.00JPY 23,581,560 BRL 1,162,775 29/01/2021 J.P. Morgan 5,082 0.00JPY 84,381,549 CAD 1,035,077 29/01/2021 J.P. Morgan 5,549 0.00JPY 16,218,926 CHF 138,094 29/01/2021 J.P. Morgan 484 0.00JPY 71,483,809 CNH 4,496,801 29/01/2021 J.P. Morgan 3,374 0.00JPY 131,606,640 CNY 8,294,683 29/01/2021 J.P. Morgan 6,434 0.00JPY 726,961,397 EUR 5,747,478 29/01/2021 J.P. Morgan 718 0.00JPY 53,790,614 KRW 565,709,540 29/01/2021 J.P. Morgan 3,657 0.00JPY 22,622,009 PLN 793,568 29/01/2021 J.P. Morgan 6,067 0.00JPY 1,086,007,556 USD 10,443,789 29/01/2021 J.P. Morgan 98,278 0.01
Unrealised Gain on naV hedged share classes forward currency Exchange contracts – assets 130,157 0.01
Total Unrealised Gain on forward currency Exchange contracts – assets 13,575,321 0.75
forward currency Exchange contracts (continued)
currency Purchased
amount Purchased
currency sold
amount sold
maturity Date counterparty
Unrealised Gain/(loss)
UsD
% of net assets
USD 6,011,102 EUR 5,103,050 19/01/2021 BNP Paribas (252,262) (0.01) USD 7,509,166 EUR 6,434,000 19/01/2021 UBS (387,774) (0.02) USD 5,705,480 EUR 4,822,584 19/01/2021 Westpac Banking (213,646) (0.01) CAD 192,341 EUR 123,876 20/01/2021 Canadian Imperial
Bank of Commerce (873) 0.00USD 774,723 CAD 990,442 20/01/2021 Citigroup (3,729) 0.00USD 712,975 CAD 913,404 20/01/2021 J.P. Morgan (4,928) 0.00USD 18,673,108 EUR 15,406,855 20/01/2021 Citigroup (237,361) (0.01) USD 3,499,142 EUR 2,930,749 20/01/2021 Commonwealth
Bank of Australia (98,078) (0.01) USD 8,237,170 EUR 6,790,848 20/01/2021 RBC (97,959) (0.01) USD 6,498,244 MXN 135,737,000 20/01/2021 State Street (322,898) (0.02) USD 218,456 DKK 1,388,000 21/01/2021 Canadian Imperial
Bank of Commerce (10,504) 0.00USD 616,318 NOK 5,389,125 21/01/2021 RBC (15,266) 0.00EUR 6,500,000 USD 7,989,566 22/01/2021 J.P. Morgan (11,040) 0.00USD 25,104,965 AUD 35,345,124 22/01/2021 Commonwealth
Bank of Australia (2,224,068) (0.12) USD 16,970,895 NZD 25,612,000 22/01/2021 Westpac Banking (1,546,819) (0.09) USD 10,030,318 ZAR 165,747,000 22/01/2021 Barclays (1,253,813) (0.07) PLN 16,305,000 USD 4,412,239 25/01/2021 Citibank (25,059) 0.00USD 8,830,777 CHF 7,820,000 25/01/2021 UBS (56,189) 0.00USD 33,493,040 GBP 25,450,000 27/01/2021 Canadian Imperial
Bank of Commerce (1,276,161) (0.07) USD 1,644,622 GBP 1,223,516 27/01/2021 State Street (26,917) 0.00USD 3,932,074 GBP 2,943,438 27/01/2021 Westpac Banking (89,183) (0.01) USD 7,079,707 CNH 46,279,245 28/01/2021 BNP Paribas (27,446) 0.00USD 715,736 THB 21,502,137 28/01/2021 HSBC (2,717) 0.00USD 4,341,717 JPY 451,869,876 29/01/2021 BNP Paribas (44,663) 0.00USD 11,932,645 JPY 1,241,490,330 29/01/2021 Goldman Sachs (118,720) (0.01) BRL 3,840,000 USD 741,027 01/02/2021 Barclays (1,880) 0.00BRL 5,196,000 USD 1,006,294 01/02/2021 BNP Paribas (6,136) 0.00BRL 13,554,000 USD 2,624,455 01/02/2021 Citigroup (15,499) 0.00USD 6,030,131 IDR 85,697,213,000 01/02/2021 BNP Paribas (116,244) (0.01)
Unrealised loss on forward currency Exchange contracts – liabilities (8,487,832) (0.47)
EUR hedged share classUSD 505,368 EUR 411,985 04/01/2021 J.P. Morgan (113) 0.00EUR 5,265 USD 6,474 05/01/2021 J.P. Morgan (14) 0.00EUR 52,465 USD 64,519 08/01/2021 J.P. Morgan (143) 0.00USD 29,502 EUR 24,194 08/01/2021 J.P. Morgan (185) 0.00BRL 4,711,741 EUR 756,323 29/01/2021 J.P. Morgan (21,530) 0.00CAD 28,446 EUR 18,346 29/01/2021 J.P. Morgan (165) 0.00CHF 3,797 EUR 3,526 29/01/2021 J.P. Morgan (14) 0.00CNH 123,759 EUR 15,549 29/01/2021 J.P. Morgan (84) 0.00CNY 228,120 EUR 28,629 29/01/2021 J.P. Morgan (189) 0.00EUR 4,417,747 AUD 7,118,037 29/01/2021 J.P. Morgan (80,504) (0.01) EUR 6,826 CAD 10,718 29/01/2021 J.P. Morgan (44) 0.00EUR 4,391 CNH 35,189 29/01/2021 J.P. Morgan (13) 0.00EUR 8,121 CNY 65,200 29/01/2021 J.P. Morgan (22) 0.00EUR 19,913,835 GBP 18,157,591 29/01/2021 J.P. Morgan (359,158) (0.02) EUR 2,504,147 IDR 43,334,418,199 29/01/2021 J.P. Morgan (34,278) 0.00EUR 44,794,856 JPY 5,666,030,625 29/01/2021 J.P. Morgan (7,719) 0.00EUR 4,787,501 MXN 117,908,599 29/01/2021 J.P. Morgan (41,339) (0.01) EUR 1,766,091 NOK 18,748,891 29/01/2021 J.P. Morgan (29,101) 0.00EUR 21,215 USD 26,075 29/01/2021 J.P. Morgan (30) 0.00EUR 1,740,594 ZAR 31,916,240 29/01/2021 J.P. Morgan (34,028) 0.00JPY 12,240,055 EUR 96,857 29/01/2021 J.P. Morgan (92) 0.00KRW 14,757,365 EUR 11,106 29/01/2021 J.P. Morgan (108) 0.00
DERIVaTIVEs (continued)
Over-the-counter (OTC) and exchange traded derivatives as at 31 December 2020, expressed in US Dollars.
DERIVaTIVEs (continued)
Over-the-counter (OTC) and exchange traded derivatives as at 31 December 2020, expressed in US Dollars.

201 Morgan Stanley Investment Funds 31 December 2020
The accompanying notes are an integral part of these financial statements.
Global Bond Fund (continued)
forward currency Exchange contracts (continued)
currency Purchased
amount Purchased
currency sold
amount sold
maturity Date counterparty
Unrealised Gain/(loss)
UsD
% of net assets
EUR hedged share class (continued)MXN 40,199 EUR 1,652 29/01/2021 J.P. Morgan (10) 0.00PLN 9,737,138 EUR 2,160,879 29/01/2021 J.P. Morgan (32,836) 0.00USD 319,527 EUR 262,353 29/01/2021 J.P. Morgan (2,556) 0.00ZAR 10,293 EUR 574 29/01/2021 J.P. Morgan (4) 0.00
JPY hedged share classBRL 383,357 JPY 7,764,138 29/01/2021 J.P. Morgan (1,573) 0.00JPY 45,504,813 AUD 579,674 29/01/2021 J.P. Morgan (6,513) 0.00JPY 205,120,576 GBP 1,478,755 29/01/2021 J.P. Morgan (29,129) 0.00JPY 25,815,574 IDR 3,532,062,387 29/01/2021 J.P. Morgan (2,773) 0.00JPY 49,312,892 MXN 9,602,080 29/01/2021 J.P. Morgan (3,320) 0.00JPY 18,191,439 NOK 1,526,857 29/01/2021 J.P. Morgan (2,353) 0.00JPY 17,934,825 ZAR 2,600,016 29/01/2021 J.P. Morgan (2,754) 0.00PLN 793,568 JPY 22,221,335 29/01/2021 J.P. Morgan (2,177) 0.00
Unrealised loss on naV hedged share classes forward currency Exchange contracts – liabilities (694,871) (0.04)
Total Unrealised loss on forward currency Exchange contracts – liabilities (9,182,703) (0.51)
net Unrealised Gain on forward currency Exchange contracts – assets 4,392,618 0.24
Interest Rate swap contracts
nominal amount ccy counterparty
security Description
maturity Date
market Value
UsD
% of net assets
2,416,000,000 KRW J.P. Morgan Pay floating CD_KSDA 3 month Receive fixed
1.474% 18/10/2026 44,898 0.00
Total market Value on Interest Rate swap contracts – assets 44,898 0.00
net market Value on Interest Rate swap contracts – assets 44,898 0.00
Collateral received and paid by the Fund in respect of financial derivative instruments:
Type of collateral counterparty currency amount received amount paid
Global Bond fund
Cash Barclays USD – 350,000Goldman Sachs USD 1,094,128 –J.P. Morgan USD 420,000 –Merrill Lynch USD 270,000 –State Street USD 650,000 –Wells Fargo Securities USD 180,000 –Westpac Banking USD – 260,000
2,614,128 610,000
DERIVaTIVEs (continued)
Over-the-counter (OTC) and exchange traded derivatives as at 31 December 2020, expressed in US Dollars.

Morgan Stanley Investment Funds 31 December 2020 202
The accompanying notes are an integral part of these financial statements.
Please refer to the full prospectus for the Fund’s investment objective and policy.
Global Convertible Bond Fund
InVEsTmEnT aIm
To seek long-term capital appreciation, measured in US Dollars, through investment primarily in convertible bonds issued by companies organised or operating in either the developed or emerging markets which will be denominated in global currencies.
schEDUlE of InVEsTmEnTsAs at 31 December 2020
Investments Currency
Quantity/ Nominal
Value
Market Value USD
% of Net Assets
Transferable securities and money market instruments admitted to official exchange listing or dealt in on another regulated market
convertible Bonds
aerospace & DefenseAirbus SE, Reg. S 0% 14/06/2021 EUR 2,700,000 3,315,027 0.73
3,315,027 0.73
agricultureADM Ag Holding Ltd., Reg. S 0%
26/08/2023 USD 3,000,000 3,306,809 0.72
3,306,809 0.72
airlinesAir Canada, 144A 4% 01/07/2025 USD 2,000,000 3,000,000 0.66 Singapore Airlines Ltd., Reg. S 1.625%
03/12/2025 SGD 4,000,000 3,310,775 0.72 Southwest Airlines Co. 1.25% 01/05/2025 USD 2,500,000 3,634,375 0.79
9,945,150 2.17
appareladidas AG, Reg. S 0.05% 12/09/2023 EUR 2,000,000 3,101,680 0.68 Kering SA, Reg. S 0% 30/09/2022 EUR 3,200,000 4,488,362 0.98 Under Armour, Inc., 144A 1.5%
01/06/2024 USD 1,300,000 2,152,198 0.47
9,742,240 2.13
auto manufacturersGeely Sweden Financials Holding AB,
Reg. S 0% 19/06/2024 EUR 2,400,000 3,529,097 0.77
3,529,097 0.77
auto Parts & EquipmentCie Generale des Etablissements Michelin
SCA, Reg. S 0% 10/01/2022 USD 3,200,000 3,177,071 0.69
3,177,071 0.69
BanksBarclays Bank plc 0% 04/02/2025 USD 2,275,000 2,919,137 0.64 BofA Finance LLC 0.125% 01/09/2022 USD 2,275,000 2,657,200 0.58 JPMorgan Chase Bank NA 0%
07/08/2022 USD 2,000,000 2,657,000 0.58 JPMorgan Chase Bank NA 0.125%
01/01/2023 USD 1,762,000 2,065,945 0.45 JPMorgan Chase Bank NA 0%
28/12/2023 USD 4,400,000 4,767,416 1.04
15,066,698 3.29
BiotechnologyBridgebio Pharma, Inc., 144A 2.5%
15/03/2027 USD 1,408,000 2,542,973 0.56 Exact Sciences Corp. 0.375%
01/03/2028 USD 3,525,000 4,611,353 1.00 Guardant Health, Inc., 144A 0%
15/11/2027 USD 1,725,000 1,995,815 0.44 Halozyme Therapeutics, Inc., 144A 1.25%
01/12/2024 USD 1,155,000 2,120,722 0.46

203 Morgan Stanley Investment Funds 31 December 2020
The accompanying notes are an integral part of these financial statements.
Global Convertible Bond Fund (continued)
schEDUlE of InVEsTmEnTsAs at 31 December 2020
Investments Currency
Quantity/ Nominal
Value
Market Value USD
% of Net Assets
Transferable securities and money market instruments admitted to official exchange listing or dealt in on another regulated market
convertible Bonds (continued)
Biotechnology (continued)Illumina, Inc. 0% 15/08/2023 USD 2,598,000 2,930,300 0.64 Intercept Pharmaceuticals, Inc. 2%
15/05/2026 USD 1,650,000 993,978 0.22 Ionis Pharmaceuticals, Inc. 1%
15/11/2021 USD 2,125,000 2,289,505 0.50 Ligand Pharmaceuticals, Inc. 0.75%
15/05/2023 USD 2,409,000 2,287,002 0.50
19,771,648 4.32
Building materialsPatrick Industries, Inc. 1% 01/02/2023 USD 2,000,000 2,126,423 0.47 Sika AG, Reg. S 0.15% 05/06/2025 CHF 3,280,000 5,055,594 1.10 Taiwan Cement Corp., Reg. S 0%
10/12/2023 USD 1,100,000 1,630,750 0.36
8,812,767 1.93
chemicalsMitsubishi Chemical Holdings Corp., Reg. S
0% 29/03/2024 JPY 260,000,000 2,520,561 0.55 Umicore SA, Reg. S 0% 23/06/2025 EUR 2,900,000 3,605,402 0.79
6,125,963 1.34
coalRAG-Stiftung, Reg. S 0% 02/10/2024 EUR 2,900,000 3,581,610 0.78
3,581,610 0.78
commercial servicesAmadeus IT Group SA, Reg. S 1.5%
09/04/2025 EUR 1,500,000 2,592,646 0.57 Chegg, Inc., 144A 0% 01/09/2026 USD 4,150,000 4,666,821 1.02 Euronet Worldwide, Inc. 0.75%
15/03/2049 USD 3,490,000 3,915,202 0.86 Shanghai Port Group BVI Holding Co. Ltd.,
Reg. S 0% 09/08/2022 USD 3,200,000 3,260,480 0.71 Worldline SA, Reg. S 0% 30/07/2026 EUR 777,229 1,117,301 0.24
15,552,450 3.40
computersInsight Enterprises, Inc. 0.75%
15/02/2025 USD 3,550,000 4,486,092 0.98 Lumentum Holdings, Inc. 0.5%
15/12/2026 USD 3,223,000 3,944,463 0.86 Nutanix, Inc. 0% 15/01/2023 USD 4,425,000 4,483,995 0.98 Pure Storage, Inc. 0.125% 15/04/2023 USD 4,300,000 4,755,776 1.05 Western Digital Corp. 1.5% 01/02/2024 USD 3,838,000 3,813,970 0.83
21,484,296 4.70
Diversified financial servicesEliott Capital Sarl, Reg. S 0% 30/12/2022 EUR 1,700,000 2,102,776 0.46 SBI Holdings, Inc., Reg. S 0% 13/09/2023 JPY 230,000,000 2,276,598 0.50
4,379,374 0.96
schEDUlE of InVEsTmEnTsAs at 31 December 2020
Investments Currency
Quantity/ Nominal
Value
Market Value USD
% of Net Assets
Transferable securities and money market instruments admitted to official exchange listing or dealt in on another regulated market
convertible Bonds (continued)
ElectricChina Yangtze Power International BVI 1
Ltd., Reg. S 0% 09/11/2021 USD 3,000,000 3,063,750 0.67
3,063,750 0.67
Electric UtilitiesElectricite de France SA, Reg. S 0%
14/09/2024 EUR 15,029,800 2,912,753 0.64
2,912,753 0.64
ElectronicsFortive Corp. 0.875% 15/02/2022 USD 3,175,000 3,266,324 0.71 II-VI, Inc. 0.25% 01/09/2022 USD 2,575,000 4,303,984 0.95 LG Display Co. Ltd., Reg. S 1.5%
22/08/2024 USD 3,000,000 3,457,500 0.76 MINEBEA MITSUMI, Inc., Reg. S 0%
03/08/2022 JPY 140,000,000 1,567,466 0.34 Vishay Intertechnology, Inc. 2.25%
15/06/2025 USD 2,358,000 2,442,502 0.53
15,037,776 3.29
Energy-alternate sourcesAudax Renovables SA, Reg. S 2.75%
30/11/2025 EUR 1,300,000 1,685,268 0.37
1,685,268 0.37
Engineering & constructionCellnex Telecom SA, Reg. S 0.75%
20/11/2031 EUR 2,900,000 3,431,842 0.75 China Railway Construction Corp. Ltd.,
Reg. S 0% 29/01/2021 USD 3,250,000 3,239,844 0.71 Dycom Industries, Inc. 0.75% 15/09/2021 USD 2,222,000 2,280,826 0.50 KBR, Inc. 2.5% 01/11/2023 USD 2,550,000 3,473,510 0.76 Vinci SA, Reg. S 0.375% 16/02/2022 USD 2,800,000 3,155,945 0.69
15,581,967 3.41
EntertainmentLive Nation Entertainment, Inc. 2.5%
15/03/2023 USD 1,590,000 2,066,503 0.45 Marriott Vacations Worldwide Corp. 1.5%
15/09/2022 USD 2,682,000 3,041,526 0.67 Vail Resorts, Inc., 144A 0% 01/01/2026 USD 2,000,000 2,024,495 0.44
7,132,524 1.56
foodCarrefour SA, Reg. S 0% 27/03/2024 USD 2,800,000 2,733,778 0.60
2,733,778 0.60
GasSnam SpA, Reg. S 0% 20/03/2022 EUR 1,900,000 2,449,459 0.54
2,449,459 0.54
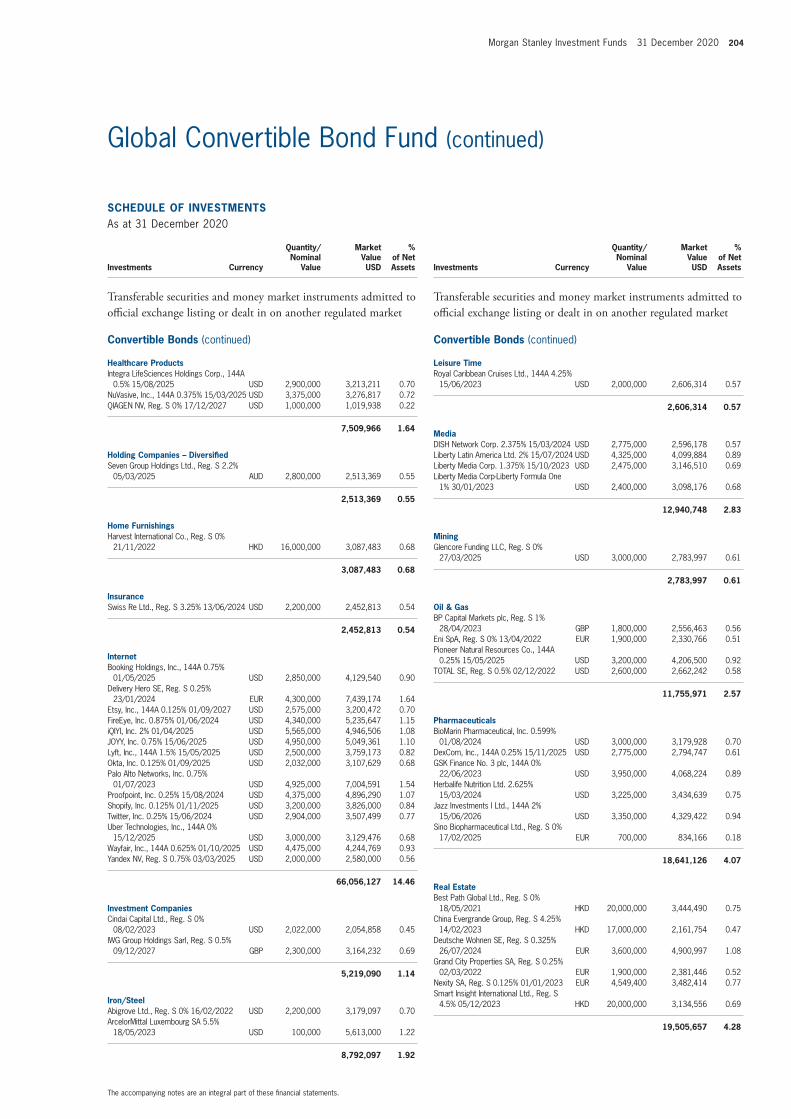
Morgan Stanley Investment Funds 31 December 2020 204
The accompanying notes are an integral part of these financial statements.
Global Convertible Bond Fund (continued)
schEDUlE of InVEsTmEnTsAs at 31 December 2020
Investments Currency
Quantity/ Nominal
Value
Market Value USD
% of Net Assets
Transferable securities and money market instruments admitted to official exchange listing or dealt in on another regulated market
convertible Bonds (continued)
healthcare ProductsIntegra LifeSciences Holdings Corp., 144A
0.5% 15/08/2025 USD 2,900,000 3,213,211 0.70 NuVasive, Inc., 144A 0.375% 15/03/2025 USD 3,375,000 3,276,817 0.72 QIAGEN NV, Reg. S 0% 17/12/2027 USD 1,000,000 1,019,938 0.22
7,509,966 1.64
holding companies – DiversifiedSeven Group Holdings Ltd., Reg. S 2.2%
05/03/2025 AUD 2,800,000 2,513,369 0.55
2,513,369 0.55
home furnishingsHarvest International Co., Reg. S 0%
21/11/2022 HKD 16,000,000 3,087,483 0.68
3,087,483 0.68
InsuranceSwiss Re Ltd., Reg. S 3.25% 13/06/2024 USD 2,200,000 2,452,813 0.54
2,452,813 0.54
InternetBooking Holdings, Inc., 144A 0.75%
01/05/2025 USD 2,850,000 4,129,540 0.90 Delivery Hero SE, Reg. S 0.25%
23/01/2024 EUR 4,300,000 7,439,174 1.64 Etsy, Inc., 144A 0.125% 01/09/2027 USD 2,575,000 3,200,472 0.70 FireEye, Inc. 0.875% 01/06/2024 USD 4,340,000 5,235,647 1.15 iQIYI, Inc. 2% 01/04/2025 USD 5,565,000 4,946,506 1.08 JOYY, Inc. 0.75% 15/06/2025 USD 4,950,000 5,049,361 1.10 Lyft, Inc., 144A 1.5% 15/05/2025 USD 2,500,000 3,759,173 0.82 Okta, Inc. 0.125% 01/09/2025 USD 2,032,000 3,107,629 0.68 Palo Alto Networks, Inc. 0.75%
01/07/2023 USD 4,925,000 7,004,591 1.54 Proofpoint, Inc. 0.25% 15/08/2024 USD 4,375,000 4,896,290 1.07 Shopify, Inc. 0.125% 01/11/2025 USD 3,200,000 3,826,000 0.84 Twitter, Inc. 0.25% 15/06/2024 USD 2,904,000 3,507,499 0.77 Uber Technologies, Inc., 144A 0%
15/12/2025 USD 3,000,000 3,129,476 0.68 Wayfair, Inc., 144A 0.625% 01/10/2025 USD 4,475,000 4,244,769 0.93 Yandex NV, Reg. S 0.75% 03/03/2025 USD 2,000,000 2,580,000 0.56
66,056,127 14.46
Investment companiesCindai Capital Ltd., Reg. S 0%
08/02/2023 USD 2,022,000 2,054,858 0.45 IWG Group Holdings Sarl, Reg. S 0.5%
09/12/2027 GBP 2,300,000 3,164,232 0.69
5,219,090 1.14
Iron/steelAbigrove Ltd., Reg. S 0% 16/02/2022 USD 2,200,000 3,179,097 0.70 ArcelorMittal Luxembourg SA 5.5%
18/05/2023 USD 100,000 5,613,000 1.22
8,792,097 1.92
schEDUlE of InVEsTmEnTsAs at 31 December 2020
Investments Currency
Quantity/ Nominal
Value
Market Value USD
% of Net Assets
Transferable securities and money market instruments admitted to official exchange listing or dealt in on another regulated market
convertible Bonds (continued)
leisure TimeRoyal Caribbean Cruises Ltd., 144A 4.25%
15/06/2023 USD 2,000,000 2,606,314 0.57
2,606,314 0.57
mediaDISH Network Corp. 2.375% 15/03/2024 USD 2,775,000 2,596,178 0.57 Liberty Latin America Ltd. 2% 15/07/2024 USD 4,325,000 4,099,884 0.89 Liberty Media Corp. 1.375% 15/10/2023 USD 2,475,000 3,146,510 0.69 Liberty Media Corp-Liberty Formula One
1% 30/01/2023 USD 2,400,000 3,098,176 0.68
12,940,748 2.83
miningGlencore Funding LLC, Reg. S 0%
27/03/2025 USD 3,000,000 2,783,997 0.61
2,783,997 0.61
oil & GasBP Capital Markets plc, Reg. S 1%
28/04/2023 GBP 1,800,000 2,556,463 0.56 Eni SpA, Reg. S 0% 13/04/2022 EUR 1,900,000 2,330,766 0.51 Pioneer Natural Resources Co., 144A
0.25% 15/05/2025 USD 3,200,000 4,206,500 0.92 TOTAL SE, Reg. S 0.5% 02/12/2022 USD 2,600,000 2,662,242 0.58
11,755,971 2.57
PharmaceuticalsBioMarin Pharmaceutical, Inc. 0.599%
01/08/2024 USD 3,000,000 3,179,928 0.70 DexCom, Inc., 144A 0.25% 15/11/2025 USD 2,775,000 2,794,747 0.61 GSK Finance No. 3 plc, 144A 0%
22/06/2023 USD 3,950,000 4,068,224 0.89 Herbalife Nutrition Ltd. 2.625%
15/03/2024 USD 3,225,000 3,434,639 0.75 Jazz Investments I Ltd., 144A 2%
15/06/2026 USD 3,350,000 4,329,422 0.94 Sino Biopharmaceutical Ltd., Reg. S 0%
17/02/2025 EUR 700,000 834,166 0.18
18,641,126 4.07
Real EstateBest Path Global Ltd., Reg. S 0%
18/05/2021 HKD 20,000,000 3,444,490 0.75 China Evergrande Group, Reg. S 4.25%
14/02/2023 HKD 17,000,000 2,161,754 0.47 Deutsche Wohnen SE, Reg. S 0.325%
26/07/2024 EUR 3,600,000 4,900,997 1.08 Grand City Properties SA, Reg. S 0.25%
02/03/2022 EUR 1,900,000 2,381,446 0.52 Nexity SA, Reg. S 0.125% 01/01/2023 EUR 4,549,400 3,482,414 0.77 Smart Insight International Ltd., Reg. S
4.5% 05/12/2023 HKD 20,000,000 3,134,556 0.69
19,505,657 4.28

205 Morgan Stanley Investment Funds 31 December 2020
The accompanying notes are an integral part of these financial statements.
Global Convertible Bond Fund (continued)
schEDUlE of InVEsTmEnTsAs at 31 December 2020
Investments Currency
Quantity/ Nominal
Value
Market Value USD
% of Net Assets
Transferable securities and money market instruments admitted to official exchange listing or dealt in on another regulated market
convertible Bonds (continued)
Real Estate Investment Trusts (REITs)Derwent London Capital No. 3 Jersey Ltd.,
REIT, Reg. S 1.5% 12/06/2025 GBP 1,900,000 2,664,248 0.58
2,664,248 0.58
RetailANLLIAN Capital Ltd., Reg. S 0%
05/02/2025 EUR 2,600,000 3,910,993 0.86 Bosideng International Holdings Ltd.,
Reg. S 1% 17/12/2024 USD 2,600,000 2,665,000 0.58 Burlington Stores, Inc., 144A 2.25%
15/04/2025 USD 2,475,000 3,446,455 0.75 Zhongsheng Group Holdings Ltd., Reg. S
0% 21/05/2025 HKD 14,000,000 2,468,217 0.54
12,490,665 2.73
semiconductorsSTMicroelectronics NV, Reg. S 0%
04/08/2025 USD 3,200,000 3,903,948 0.85 Synaptics, Inc. 0.5% 15/06/2022 USD 1,799,000 2,444,619 0.53
6,348,567 1.38
softwareAkamai Technologies, Inc. 0.125%
01/05/2025 USD 3,550,000 4,385,882 0.96 Avaya Holdings Corp. 2.25% 15/06/2023 USD 3,117,000 3,249,596 0.71 J2 Global, Inc., 144A 1.75% 01/11/2026 USD 4,585,000 4,767,975 1.04 Medallia, Inc., 144A 0.125% 15/09/2025 USD 2,150,000 2,376,017 0.52 Momo, Inc. 1.25% 01/07/2025 USD 3,393,000 2,830,717 0.62 New Relic, Inc. 0.5% 01/05/2023 USD 4,425,000 4,325,863 0.95 RealPage, Inc. 1.5% 15/05/2025 USD 3,630,000 4,685,515 1.02 RingCentral, Inc., 144A 0% 01/03/2025 USD 3,600,000 4,647,236 1.02 Splunk, Inc., 144A 1.125% 15/06/2027 USD 4,275,000 4,478,013 0.98 Ubisoft Entertainment SA, Reg. S 0%
24/09/2024 EUR 1,853,400 2,893,703 0.63 Verint Systems, Inc. 1.5% 01/06/2021 USD 3,325,000 3,621,494 0.79 Zynga, Inc., 144A 0% 15/12/2026 USD 3,475,000 3,611,542 0.79 Zynga, Inc. 0.25% 01/06/2024 USD 1,370,000 1,810,985 0.40
47,684,538 10.43
TelecommunicationsInterDigital, Inc. 2% 01/06/2024 USD 3,206,000 3,381,935 0.74 Viavi Solutions, Inc. 1.75% 01/06/2023 USD 2,450,000 3,024,475 0.66 Vonage Holdings Corp. 1.75%
01/06/2024 USD 3,151,000 3,447,779 0.76
9,854,189 2.16
schEDUlE of InVEsTmEnTsAs at 31 December 2020
Investments Currency
Quantity/ Nominal
Value
Market Value USD
% of Net Assets
Transferable securities and money market instruments admitted to official exchange listing or dealt in on another regulated market
convertible Bonds (continued)
TransportationAtlas Air Worldwide Holdings, Inc. 2.25%
01/06/2022 USD 2,975,000 3,107,042 0.68
3,107,042 0.68
Total convertible Bonds 424,401,482 92.83
Total Transferable securities and money market instruments admitted to official exchange listing or dealt in on another regulated market 424,401,482 92.83
Units of authorised UCITS or other collective investment undertakings
collective Investment schemes – UcITs
mutual fundsMorgan Stanley Liquidity Funds US Dollar
Liquidity Fund – MS Reserve† USD 21,620,663 21,620,663 4.73
21,620,663 4.73
Total collective Investment schemes – UcITs 21,620,663 4.73
Total Units of authorised UcITs or other collective investment undertakings 21,620,663 4.73
Total Investments 446,022,145 97.56
cash 3,258,804 0.71
other assets/(liabilities) 7,913,327 1.73
Total net assets 457,194,276 100.00
† Managed by an affiliate of the Investment Adviser.
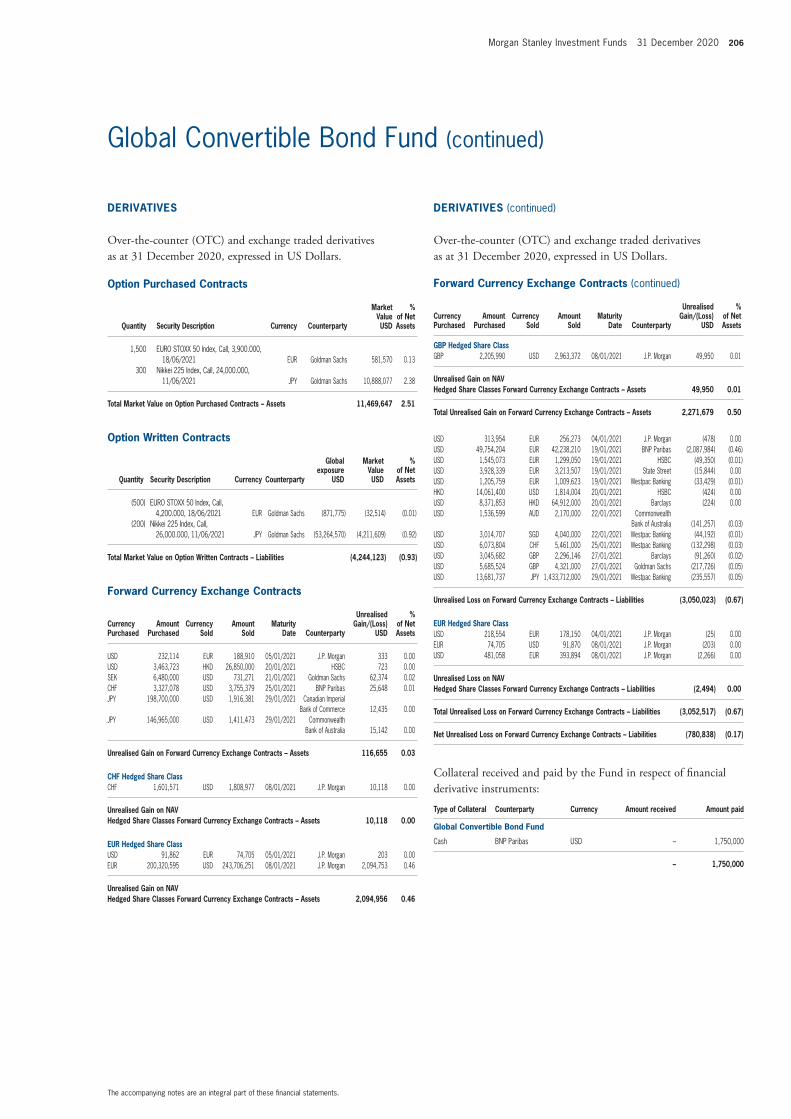
Morgan Stanley Investment Funds 31 December 2020 206
The accompanying notes are an integral part of these financial statements.
Global Convertible Bond Fund (continued)
option Purchased contracts
Quantity security Description currency counterparty
market Value UsD
% of net assets
1,500 EURO STOXX 50 Index, Call, 3,900.000, 18/06/2021 EUR Goldman Sachs 581,570 0.13
300 Nikkei 225 Index, Call, 24,000.000, 11/06/2021 JPY Goldman Sachs 10,888,077 2.38
Total market Value on option Purchased contracts – assets 11,469,647 2.51
option Written contracts
Quantity security Description currency counterparty
Global exposure
UsD
market Value UsD
% of net assets
(500) EURO STOXX 50 Index, Call, 4,200.000, 18/06/2021 EUR Goldman Sachs (871,775) (32,514) (0.01)
(200) Nikkei 225 Index, Call, 26,000.000, 11/06/2021 JPY Goldman Sachs (53,264,570) (4,211,609) (0.92)
Total market Value on option Written contracts – liabilities (4,244,123) (0.93)
forward currency Exchange contracts (continued)
currency Purchased
amount Purchased
currency sold
amount sold
maturity Date counterparty
Unrealised Gain/(loss)
UsD
% of net assets
USD 232,114 EUR 188,910 05/01/2021 J.P. Morgan 333 0.00USD 3,463,723 HKD 26,850,000 20/01/2021 HSBC 723 0.00SEK 6,480,000 USD 731,271 21/01/2021 Goldman Sachs 62,374 0.02 CHF 3,327,078 USD 3,755,379 25/01/2021 BNP Paribas 25,648 0.01 JPY 198,700,000 USD 1,916,381 29/01/2021 Canadian Imperial
Bank of Commerce 12,435 0.00JPY 146,965,000 USD 1,411,473 29/01/2021 Commonwealth
Bank of Australia 15,142 0.00
Unrealised Gain on forward currency Exchange contracts – assets 116,655 0.03
chf hedged share classCHF 1,601,571 USD 1,808,977 08/01/2021 J.P. Morgan 10,118 0.00
Unrealised Gain on naV hedged share classes forward currency Exchange contracts – assets 10,118 0.00
EUR hedged share classUSD 91,862 EUR 74,705 05/01/2021 J.P. Morgan 203 0.00EUR 200,320,595 USD 243,706,251 08/01/2021 J.P. Morgan 2,094,753 0.46
Unrealised Gain on naV hedged share classes forward currency Exchange contracts – assets 2,094,956 0.46
forward currency Exchange contracts (continued)
currency Purchased
amount Purchased
currency sold
amount sold
maturity Date counterparty
Unrealised Gain/(loss)
UsD
% of net assets
GBP hedged share classGBP 2,205,990 USD 2,963,372 08/01/2021 J.P. Morgan 49,950 0.01
Unrealised Gain on naV hedged share classes forward currency Exchange contracts – assets 49,950 0.01
Total Unrealised Gain on forward currency Exchange contracts – assets 2,271,679 0.50
USD 313,954 EUR 256,273 04/01/2021 J.P. Morgan (478) 0.00USD 49,754,204 EUR 42,238,210 19/01/2021 BNP Paribas (2,087,984) (0.46) USD 1,545,073 EUR 1,299,050 19/01/2021 HSBC (49,350) (0.01) USD 3,928,339 EUR 3,213,507 19/01/2021 State Street (15,844) 0.00USD 1,205,759 EUR 1,009,623 19/01/2021 Westpac Banking (33,429) (0.01) HKD 14,061,400 USD 1,814,004 20/01/2021 HSBC (424) 0.00USD 8,371,853 HKD 64,912,000 20/01/2021 Barclays (224) 0.00USD 1,536,599 AUD 2,170,000 22/01/2021 Commonwealth
Bank of Australia (141,257) (0.03) USD 3,014,707 SGD 4,040,000 22/01/2021 Westpac Banking (44,192) (0.01) USD 6,073,804 CHF 5,461,000 25/01/2021 Westpac Banking (132,298) (0.03) USD 3,045,682 GBP 2,296,146 27/01/2021 Barclays (91,260) (0.02) USD 5,685,524 GBP 4,321,000 27/01/2021 Goldman Sachs (217,726) (0.05) USD 13,681,737 JPY 1,433,712,000 29/01/2021 Westpac Banking (235,557) (0.05)
Unrealised loss on forward currency Exchange contracts – liabilities (3,050,023) (0.67)
EUR hedged share classUSD 218,554 EUR 178,150 04/01/2021 J.P. Morgan (25) 0.00EUR 74,705 USD 91,870 08/01/2021 J.P. Morgan (203) 0.00USD 481,058 EUR 393,894 08/01/2021 J.P. Morgan (2,266) 0.00
Unrealised loss on naV hedged share classes forward currency Exchange contracts – liabilities (2,494) 0.00
Total Unrealised loss on forward currency Exchange contracts – liabilities (3,052,517) (0.67)
net Unrealised loss on forward currency Exchange contracts – liabilities (780,838) (0.17)
Collateral received and paid by the Fund in respect of financial derivative instruments:
Type of collateral counterparty currency amount received amount paid
Global convertible Bond fund
Cash BNP Paribas USD – 1,750,000
– 1,750,000
DERIVaTIVEs
Over-the-counter (OTC) and exchange traded derivatives as at 31 December 2020, expressed in US Dollars.
DERIVaTIVEs (continued)
Over-the-counter (OTC) and exchange traded derivatives as at 31 December 2020, expressed in US Dollars.
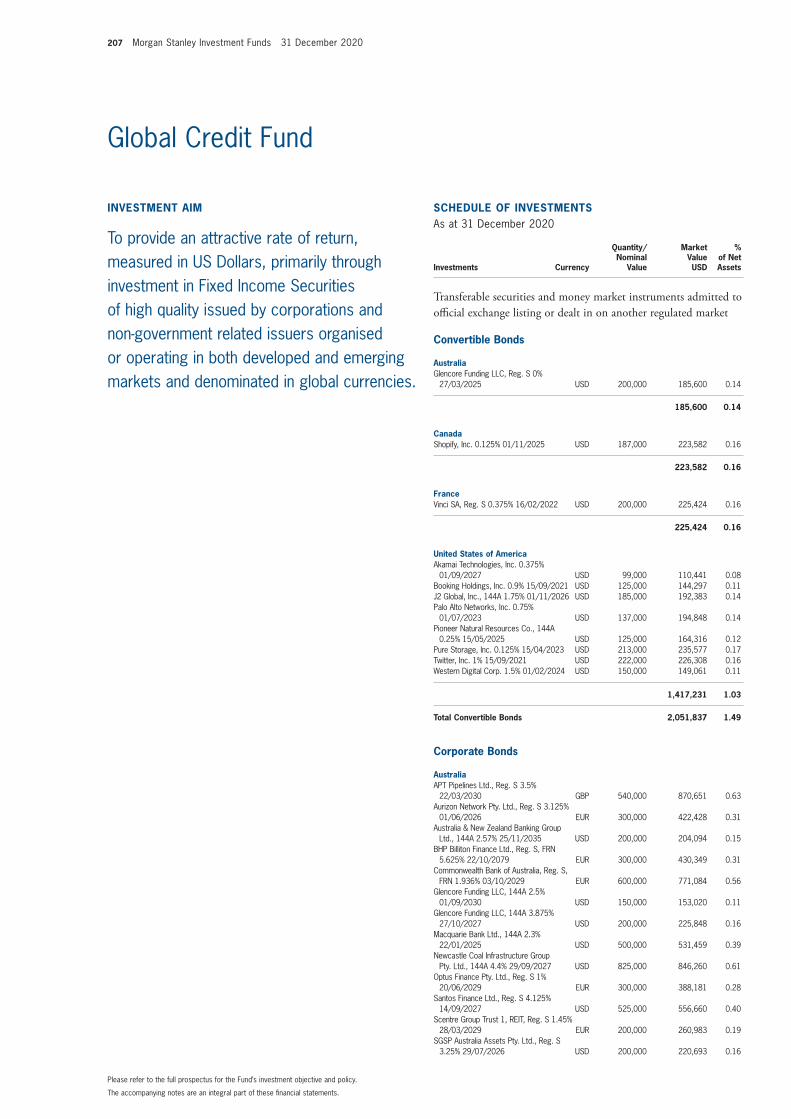
207 Morgan Stanley Investment Funds 31 December 2020
The accompanying notes are an integral part of these financial statements.
Please refer to the full prospectus for the Fund’s investment objective and policy.
InVEsTmEnT aIm
To provide an attractive rate of return, measured in US Dollars, primarily through investment in Fixed Income Securities of high quality issued by corporations and non‑government related issuers organised or operating in both developed and emerging markets and denominated in global currencies.
schEDUlE of InVEsTmEnTsAs at 31 December 2020
Investments Currency
Quantity/Nominal
Value
Market Value USD
% of Net Assets
Transferable securities and money market instruments admitted to official exchange listing or dealt in on another regulated market
convertible Bonds
australiaGlencore Funding LLC, Reg. S 0%
27/03/2025 USD 200,000 185,600 0.14
185,600 0.14
canadaShopify, Inc. 0.125% 01/11/2025 USD 187,000 223,582 0.16
223,582 0.16
franceVinci SA, Reg. S 0.375% 16/02/2022 USD 200,000 225,424 0.16
225,424 0.16
United states of americaAkamai Technologies, Inc. 0.375%
01/09/2027 USD 99,000 110,441 0.08 Booking Holdings, Inc. 0.9% 15/09/2021 USD 125,000 144,297 0.11 J2 Global, Inc., 144A 1.75% 01/11/2026 USD 185,000 192,383 0.14 Palo Alto Networks, Inc. 0.75%
01/07/2023 USD 137,000 194,848 0.14 Pioneer Natural Resources Co., 144A
0.25% 15/05/2025 USD 125,000 164,316 0.12 Pure Storage, Inc. 0.125% 15/04/2023 USD 213,000 235,577 0.17 Twitter, Inc. 1% 15/09/2021 USD 222,000 226,308 0.16 Western Digital Corp. 1.5% 01/02/2024 USD 150,000 149,061 0.11
1,417,231 1.03
Total convertible Bonds 2,051,837 1.49
corporate Bonds
australiaAPT Pipelines Ltd., Reg. S 3.5%
22/03/2030 GBP 540,000 870,651 0.63 Aurizon Network Pty. Ltd., Reg. S 3.125%
01/06/2026 EUR 300,000 422,428 0.31 Australia & New Zealand Banking Group
Ltd., 144A 2.57% 25/11/2035 USD 200,000 204,094 0.15 BHP Billiton Finance Ltd., Reg. S, FRN
5.625% 22/10/2079 EUR 300,000 430,349 0.31 Commonwealth Bank of Australia, Reg. S,
FRN 1.936% 03/10/2029 EUR 600,000 771,084 0.56 Glencore Funding LLC, 144A 2.5%
01/09/2030 USD 150,000 153,020 0.11 Glencore Funding LLC, 144A 3.875%
27/10/2027 USD 200,000 225,848 0.16 Macquarie Bank Ltd., 144A 2.3%
22/01/2025 USD 500,000 531,459 0.39 Newcastle Coal Infrastructure Group
Pty. Ltd., 144A 4.4% 29/09/2027 USD 825,000 846,260 0.61 Optus Finance Pty. Ltd., Reg. S 1%
20/06/2029 EUR 300,000 388,181 0.28 Santos Finance Ltd., Reg. S 4.125%
14/09/2027 USD 525,000 556,660 0.40 Scentre Group Trust 1, REIT, Reg. S 1.45%
28/03/2029 EUR 200,000 260,983 0.19 SGSP Australia Assets Pty. Ltd., Reg. S
3.25% 29/07/2026 USD 200,000 220,693 0.16
Global Credit Fund

Morgan Stanley Investment Funds 31 December 2020 208
The accompanying notes are an integral part of these financial statements.
Global Credit Fund (continued)
schEDUlE of InVEsTmEnTsAs at 31 December 2020
Investments Currency
Quantity/Nominal
Value
Market Value USD
% of Net Assets
Transferable securities and money market instruments admitted to official exchange listing or dealt in on another regulated market
corporate Bonds (continued)
australia (continued)Transurban Finance Co. Pty. Ltd., 144A
2.45% 16/03/2031 USD 525,000 551,393 0.40 Transurban Finance Co. Pty. Ltd., Reg. S
2% 28/08/2025 EUR 350,000 466,888 0.34 Westpac Banking Corp. 2.668%
15/11/2035 USD 150,000 154,712 0.11
7,054,703 5.11
austriaUNIQA Insurance Group AG, Reg. S
1.375% 09/07/2030 EUR 100,000 133,938 0.10 Vienna Insurance Group AG Wiener
Versicherung Gruppe, Reg. S, FRN 5.5% 09/10/2043 EUR 500,000 700,890 0.51
834,828 0.61
BelgiumAnheuser‑Busch InBev Worldwide, Inc.
4.35% 01/06/2040 USD 325,000 399,088 0.29 Anheuser‑Busch InBev Worldwide, Inc.
4.6% 15/04/2048 USD 250,000 316,144 0.23 Anheuser‑Busch InBev Worldwide, Inc.
4.5% 01/06/2050 USD 375,000 473,021 0.34 Euroclear Investments SA, Reg. S, FRN
2.625% 11/04/2048 EUR 100,000 137,233 0.10 Solvay Finance SACA, Reg. S, FRN 5.425%
Perpetual EUR 175,000 238,714 0.17
1,564,200 1.13
BrazilBraskem Netherlands Finance BV, 144A
4.5% 31/01/2030 USD 220,000 225,777 0.16 Embraer Netherlands Finance BV 5.4%
01/02/2027 USD 240,000 255,303 0.19 Itau Unibanco Holding SA, 144A 2.9%
24/01/2023 USD 475,000 487,711 0.35
968,791 0.70
canadaBank of Nova Scotia (The) 2.2%
03/02/2025 USD 500,000 531,454 0.39 Brookfield Finance LLC 3.45%
15/04/2050 USD 200,000 212,438 0.15 Brookfield Finance, Inc. 4.25%
02/06/2026 USD 575,000 669,436 0.49 Canadian National Railway Co. 2.45%
01/05/2050 USD 125,000 129,399 0.09 Canadian Natural Resources Ltd. 2.95%
15/01/2023 USD 475,000 496,935 0.36 Enbridge, Inc. 4.5% 10/06/2044 USD 123,000 143,717 0.11 Enbridge, Inc. 3.125% 15/11/2029 USD 150,000 165,098 0.12 NOVA Chemicals Corp., 144A 4.875%
01/06/2024 USD 225,000 234,703 0.17
2,583,180 1.88
schEDUlE of InVEsTmEnTsAs at 31 December 2020
Investments Currency
Quantity/Nominal
Value
Market Value USD
% of Net Assets
Transferable securities and money market instruments admitted to official exchange listing or dealt in on another regulated market
corporate Bonds (continued)
chileBanco Santander Chile, 144A 2.7%
10/01/2025 USD 350,000 371,003 0.27 Inversiones CMPC SA, Reg. S 3.85%
13/01/2030 USD 200,000 224,350 0.16
595,353 0.43
chinaBaidu, Inc. 1.72% 09/04/2026 USD 275,000 279,353 0.20 CNAC HK Finbridge Co. Ltd., Reg. S
1.75% 14/06/2022 EUR 450,000 553,200 0.40 Country Garden Holdings Co. Ltd., Reg. S
3.875% 22/10/2030 USD 230,000 237,820 0.17 Meituan, 144A 2.125% 28/10/2025 USD 250,000 254,621 0.19 Prosus NV, 144A 3.68% 21/01/2030 USD 200,000 217,932 0.16 State Grid Overseas Investment 2016 Ltd.,
Reg. S 0.797% 05/08/2026 EUR 300,000 373,948 0.27 Tencent Holdings Ltd., 144A 3.595%
19/01/2028 USD 875,000 965,503 0.70
2,882,377 2.09
colombiaGrupo Aval Ltd., 144A 4.375%
04/02/2030 USD 200,000 213,300 0.15 Transportadora de Gas Internacional SA
ESP, 144A 5.55% 01/11/2028 USD 225,000 266,065 0.19
479,365 0.34
finlandNordea Bank Abp, 144A 0.75%
28/08/2025 USD 850,000 849,709 0.62
849,709 0.62
franceAeroports de Paris, Reg. S 1.5%
02/07/2032 EUR 200,000 273,830 0.20 AXA SA, Reg. S, FRN 3.25% 28/05/2049 EUR 400,000 575,108 0.42 AXA SA, Reg. S, FRN 5.125%
04/07/2043 EUR 375,000 516,425 0.37 Banque Federative du Credit Mutuel SA,
Reg. S 1.75% 19/12/2024 GBP 300,000 432,381 0.31 BEL SA, Reg. S 1.5% 18/04/2024 EUR 200,000 254,224 0.19 BNP Paribas SA, 144A 4.4% 14/08/2028 USD 925,000 1,096,793 0.80 BNP Paribas SA, FRN, 144A 3.052%
13/01/2031 USD 350,000 381,652 0.28 BPCE SA, 144A 5.15% 21/07/2024 USD 975,000 1,110,292 0.80 Credit Agricole Assurances SA, Reg. S,
FRN 4.5% Perpetual EUR 800,000 1,125,717 0.82 Credit Agricole SA, Reg. S 4%
31/12/2164 EUR 200,000 266,231 0.19 Credit Agricole SA, 144A 3.75%
24/04/2023 USD 775,000 832,502 0.60 Societe Generale SA, 144A 2.625%
22/01/2025 USD 475,000 503,234 0.36 TOTAL SE, Reg. S, FRN 3.875% Perpetual EUR 300,000 386,256 0.28 Unibail‑Rodamco‑Westfield SE, REIT,
Reg. S, FRN 2.125% Perpetual EUR 100,000 115,639 0.08
7,870,284 5.70

209 Morgan Stanley Investment Funds 31 December 2020
The accompanying notes are an integral part of these financial statements.
Global Credit Fund (continued)
schEDUlE of InVEsTmEnTsAs at 31 December 2020
Investments Currency
Quantity/Nominal
Value
Market Value USD
% of Net Assets
Transferable securities and money market instruments admitted to official exchange listing or dealt in on another regulated market
corporate Bonds (continued)
GermanyAllianz SE, Reg. S, FRN 3.375% Perpetual EUR 600,000 811,621 0.59 Bayer AG, Reg. S 1.375% 06/07/2032 EUR 300,000 393,617 0.29 BMW Finance NV, Reg. S 1.5%
06/02/2029 EUR 425,000 582,200 0.42 Commerzbank AG, 144A 8.125%
19/09/2023 USD 350,000 409,527 0.30 Commerzbank AG 7.75% 16/03/2021 EUR 400,000 497,879 0.36 Daimler Finance North America LLC, 144A
2.7% 14/06/2024 USD 350,000 374,854 0.27 Deutsche Bank AG 3.7% 30/05/2024 USD 575,000 619,107 0.45 Nidda Healthcare Holding GmbH, Reg. S
3.5% 30/09/2024 EUR 200,000 245,911 0.18 Techem Verwaltungsgesellschaft 675 mbH,
Reg. S 2% 15/07/2025 EUR 100,000 122,307 0.09 Volkswagen International Finance NV,
Reg. S 1.875% 30/03/2027 EUR 600,000 806,535 0.58 Volkswagen International Finance NV,
Reg. S, FRN 4.625% Perpetual EUR 600,000 819,351 0.59 Wintershall Dea Finance BV, Reg. S
1.332% 25/09/2028 EUR 700,000 890,102 0.64
6,573,011 4.76
IndonesiaPerusahaan Perseroan Persero PT
Perusahaan Listrik Negara, Reg. S 2.875% 25/10/2025 EUR 300,000 398,157 0.29
398,157 0.29
IrelandAvolon Holdings Funding Ltd., 144A
2.875% 15/02/2025 USD 250,000 255,338 0.19 Ryanair DAC, Reg. S 2.875% 15/09/2025 EUR 150,000 197,238 0.14
452,576 0.33
Italy2i Rete Gas SpA, Reg. S 1.608%
31/10/2027 EUR 450,000 598,875 0.43 Assicurazioni Generali SpA, Reg. S, FRN
5.5% 27/10/2047 EUR 500,000 757,329 0.55 Enel Finance International NV, 144A
3.625% 25/05/2027 USD 200,000 227,119 0.16 Enel SpA, FRN, 144A 8.75% 24/09/2073 USD 650,000 760,695 0.55 Intesa Sanpaolo SpA, Reg. S, FRN 6.25%
Perpetual EUR 200,000 268,025 0.20 Intesa Sanpaolo SpA 5.25% 12/01/2024 USD 375,000 419,984 0.30 UniCredit SpA, 144A 6.572% 14/01/2022 USD 425,000 447,966 0.33 UniCredit SpA, Reg. S, FRN 4.375%
03/01/2027 EUR 400,000 509,228 0.37
3,989,221 2.89
JapanAsahi Group Holdings Ltd., Reg. S 0.541%
23/10/2028 EUR 250,000 311,967 0.23 Nissan Motor Co. Ltd., 144A 3.043%
15/09/2023 USD 425,000 444,666 0.32 Nissan Motor Co. Ltd., Reg. S 1.94%
15/09/2023 EUR 100,000 127,970 0.09
884,603 0.64
schEDUlE of InVEsTmEnTsAs at 31 December 2020
Investments Currency
Quantity/Nominal
Value
Market Value USD
% of Net Assets
Transferable securities and money market instruments admitted to official exchange listing or dealt in on another regulated market
corporate Bonds (continued)
luxembourgBlackstone Property Partners Europe
Holdings Sarl, Reg. S 1.25% 26/04/2027 EUR 350,000 440,425 0.32
Logicor Financing Sarl, Reg. S 1.5% 13/07/2026 EUR 150,000 194,428 0.14
Logicor Financing Sarl, Reg. S 1.5% 14/11/2022 EUR 600,000 754,508 0.55
1,389,361 1.01
mexicoCoca‑Cola Femsa SAB de CV 2.75%
22/01/2030 USD 475,000 511,426 0.37 Petroleos Mexicanos, Reg. S 3.625%
24/11/2025 EUR 500,000 616,016 0.45 Sigma Finance Netherlands BV, 144A
4.875% 27/03/2028 USD 200,000 233,852 0.17
1,361,294 0.99
netherlandsASR Nederland NV, Reg. S, FRN 5%
Perpetual EUR 800,000 1,110,013 0.80 ING Groep NV, 144A 4.625% 06/01/2026 USD 200,000 235,479 0.17 LeasePlan Corp. NV, 144A 2.875%
24/10/2024 USD 725,000 766,730 0.55 NXP BV, 144A 3.4% 01/05/2030 USD 250,000 283,803 0.21 Q‑Park Holding I BV, Reg. S 1.5%
01/03/2025 EUR 100,000 118,812 0.09 UPCB Finance VII Ltd., 144A 3.625%
15/06/2029 EUR 200,000 255,265 0.18 Vesteda Finance BV, Reg. S 1.5%
24/05/2027 EUR 100,000 132,864 0.10 Vesteda Finance BV, Reg. S 2.5%
27/10/2022 EUR 400,000 510,630 0.37
3,413,596 2.47
PeruBanco de Credito del Peru, 144A 2.7%
11/01/2025 USD 475,000 496,498 0.36 Consorcio Transmantaro SA, 144A 4.7%
16/04/2034 USD 200,000 236,652 0.17
733,150 0.53
PortugalEDP ‑ Energias de Portugal SA, Reg. S,
FRN 4.496% 30/04/2079 EUR 200,000 270,135 0.19 EDP ‑ Energias de Portugal SA, Reg. S,
FRN 1.7% 20/07/2080 EUR 200,000 245,096 0.18 EDP Finance BV, 144A 3.625%
15/07/2024 USD 1,100,000 1,201,253 0.87
1,716,484 1.24
QatarQNB Finance Ltd., Reg. S 2.75%
12/02/2027 USD 200,000 212,105 0.15
212,105 0.15

Morgan Stanley Investment Funds 31 December 2020 210
The accompanying notes are an integral part of these financial statements.
Global Credit Fund (continued)
schEDUlE of InVEsTmEnTsAs at 31 December 2020
Investments Currency
Quantity/Nominal
Value
Market Value USD
% of Net Assets
Transferable securities and money market instruments admitted to official exchange listing or dealt in on another regulated market
corporate Bonds (continued)
saudi arabiaSaudi Arabian Oil Co., 144A 2.25%
24/11/2030 USD 320,000 325,964 0.24 Saudi Arabian Oil Co., 144A 3.5%
16/04/2029 USD 400,000 444,625 0.32
770,589 0.56
singaporeOversea‑Chinese Banking Corp. Ltd., 144A
1.832% 10/09/2030 USD 260,000 264,266 0.19 PSA Treasury Pte. Ltd., Reg. S 2.25%
30/04/2030 USD 200,000 212,106 0.15 United Overseas Bank Ltd., FRN, 144A
3.75% 15/04/2029 USD 900,000 965,879 0.70
1,442,251 1.04
south KoreaPOSCO, 144A 4% 01/08/2023 USD 250,000 269,844 0.20
269,844 0.20
spainAbertis Infraestructuras SA, Reg. S
2.375% 27/09/2027 EUR 200,000 272,077 0.20 Banco Santander SA, Reg. S 3.125%
19/01/2027 EUR 700,000 982,282 0.71 CaixaBank SA, Reg. S 0.75% 18/04/2023 EUR 1,000,000 1,252,367 0.91 CaixaBank SA, Reg. S, FRN 2.25%
17/04/2030 EUR 400,000 514,084 0.37 Cellnex Telecom SA 1.875% 26/06/2029 EUR 300,000 378,862 0.27 Grifols SA, Reg. S 2.25% 15/11/2027 EUR 100,000 124,700 0.09 IE2 Holdco SAU, Reg. S 2.875%
01/06/2026 EUR 300,000 418,882 0.30 Inmobiliaria Colonial Socimi SA, REIT,
Reg. S 1.45% 28/10/2024 EUR 200,000 256,340 0.19 Prosegur Cia de Seguridad SA, Reg. S 1%
08/02/2023 EUR 200,000 249,859 0.18 Telefonica Europe BV, Reg. S, FRN 4.375%
Perpetual EUR 100,000 133,515 0.10 Telefonica Europe BV, Reg. S, FRN 5.875%
Perpetual EUR 100,000 138,249 0.10
4,721,217 3.42
swedenAkelius Residential Property Financing BV,
Reg. S 1% 17/01/2028 EUR 100,000 126,629 0.09 Akelius Residential Property Financing BV,
Reg. S 1.125% 11/01/2029 EUR 200,000 254,034 0.18 Intrum AB, Reg. S 3.5% 15/07/2026 EUR 200,000 244,253 0.18 Intrum AB, Reg. S 2.75% 15/07/2022 EUR 20,000 24,661 0.02
649,577 0.47
switzerlandCredit Suisse Group AG, FRN, 144A
3.869% 12/01/2029 USD 525,000 594,925 0.43 Credit Suisse Group AG, Reg. S, FRN
3.25% 02/04/2026 EUR 100,000 138,820 0.10 Novartis Finance SA, Reg. S 0%
23/09/2028 EUR 350,000 432,168 0.31
schEDUlE of InVEsTmEnTsAs at 31 December 2020
Investments Currency
Quantity/Nominal
Value
Market Value USD
% of Net Assets
Transferable securities and money market instruments admitted to official exchange listing or dealt in on another regulated market
corporate Bonds (continued)
switzerland (continued)Syngenta Finance NV, 144A 4.892%
24/04/2025 USD 475,000 511,724 0.37 UBS Group AG, Reg. S, FRN 5.75%
Perpetual EUR 200,000 257,757 0.19
1,935,394 1.40
TaiwanTSMC Global Ltd., 144A 0.75%
28/09/2025 USD 350,000 348,728 0.25
348,728 0.25
United arab EmiratesDP World plc, 144A 5.625% 25/09/2048 USD 325,000 415,408 0.30 Galaxy Pipeline Assets Bidco Ltd., 144A
1.75% 30/09/2027 USD 600,000 610,480 0.44 MDGH ‑ GMTN BV, 144A 4.5%
07/11/2028 USD 200,000 240,630 0.18
1,266,518 0.92
United KingdomAnnington Funding plc, Reg. S 3.935%
12/07/2047 GBP 200,000 370,128 0.27 AstraZeneca plc 1.375% 06/08/2030 USD 300,000 296,810 0.22 Barclays plc, FRN 2.852% 07/05/2026 USD 275,000 295,578 0.21 Barclays plc, Reg. S, FRN 3.375%
02/04/2025 EUR 300,000 406,416 0.30 BAT Capital Corp. 3.734% 25/09/2040 USD 150,000 156,710 0.11 BAT Capital Corp. 3.557% 15/08/2027 USD 875,000 974,202 0.71 BP Capital Markets plc, FRN 4.375%
Perpetual USD 250,000 266,563 0.19 BP Capital Markets plc, FRN 4.875%
Perpetual USD 250,000 279,550 0.20 Heathrow Funding Ltd., Reg. S 1.5%
12/10/2027 EUR 200,000 256,979 0.19 HSBC Holdings plc 4.583% 19/06/2029 USD 300,000 354,916 0.26 HSBC Holdings plc, Reg. S, FRN 2.256%
13/11/2026 GBP 400,000 582,563 0.42 HSBC Holdings plc, FRN 4.041%
13/03/2028 USD 675,000 770,757 0.56 Imperial Brands Finance plc, Reg. S
2.125% 12/02/2027 EUR 500,000 664,986 0.48 Lloyds Banking Group plc, Reg. S 2.25%
16/10/2024 GBP 850,000 1,219,038 0.88 Lloyds Banking Group plc, Reg. S, FRN
1.75% 07/09/2028 EUR 900,000 1,137,584 0.82 Lloyds Banking Group plc, Reg. S, FRN
4.947% Perpetual EUR 200,000 264,463 0.19 Nationwide Building Society, FRN, 144A
4.302% 08/03/2029 USD 325,000 379,012 0.28 Nationwide Building Society, FRN, 144A
3.96% 18/07/2030 USD 325,000 378,736 0.28 Natwest Group plc, Reg. S, FRN 2.875%
19/09/2026 GBP 550,000 816,874 0.59 NGG Finance plc, Reg. S, FRN 5.625%
18/06/2073 GBP 300,000 470,093 0.34 Santander UK plc 2.1% 13/01/2023 USD 925,000 956,072 0.69 Segro plc, REIT, Reg. S 2.375%
11/10/2029 GBP 450,000 694,675 0.50 Western Power Distribution West Midlands
plc, Reg. S 5.75% 16/04/2032 GBP 225,000 455,385 0.33
12,448,090 9.02
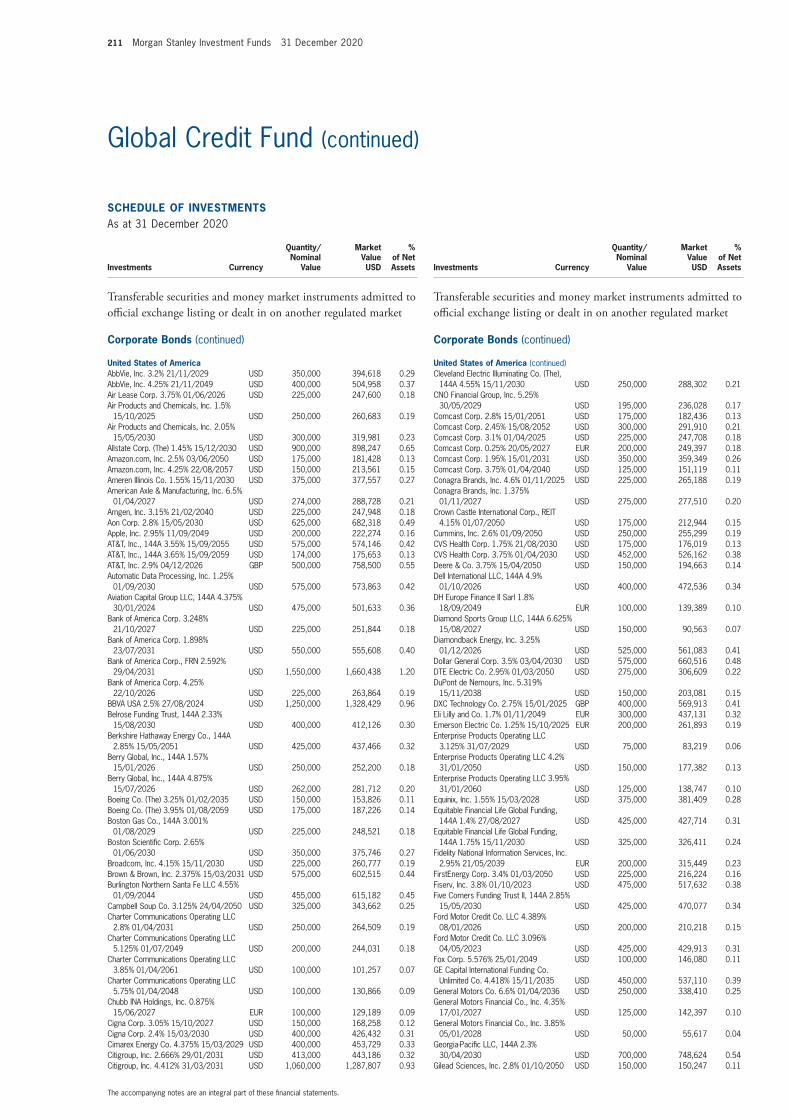
211 Morgan Stanley Investment Funds 31 December 2020
The accompanying notes are an integral part of these financial statements.
Global Credit Fund (continued)
schEDUlE of InVEsTmEnTsAs at 31 December 2020
Investments Currency
Quantity/Nominal
Value
Market Value USD
% of Net Assets
Transferable securities and money market instruments admitted to official exchange listing or dealt in on another regulated market
corporate Bonds (continued)
United states of americaAbbVie, Inc. 3.2% 21/11/2029 USD 350,000 394,618 0.29 AbbVie, Inc. 4.25% 21/11/2049 USD 400,000 504,958 0.37 Air Lease Corp. 3.75% 01/06/2026 USD 225,000 247,600 0.18 Air Products and Chemicals, Inc. 1.5%
15/10/2025 USD 250,000 260,683 0.19 Air Products and Chemicals, Inc. 2.05%
15/05/2030 USD 300,000 319,981 0.23 Allstate Corp. (The) 1.45% 15/12/2030 USD 900,000 898,247 0.65 Amazon.com, Inc. 2.5% 03/06/2050 USD 175,000 181,428 0.13 Amazon.com, Inc. 4.25% 22/08/2057 USD 150,000 213,561 0.15 Ameren Illinois Co. 1.55% 15/11/2030 USD 375,000 377,557 0.27 American Axle & Manufacturing, Inc. 6.5%
01/04/2027 USD 274,000 288,728 0.21 Amgen, Inc. 3.15% 21/02/2040 USD 225,000 247,948 0.18 Aon Corp. 2.8% 15/05/2030 USD 625,000 682,318 0.49 Apple, Inc. 2.95% 11/09/2049 USD 200,000 222,274 0.16 AT&T, Inc., 144A 3.55% 15/09/2055 USD 575,000 574,146 0.42 AT&T, Inc., 144A 3.65% 15/09/2059 USD 174,000 175,653 0.13 AT&T, Inc. 2.9% 04/12/2026 GBP 500,000 758,500 0.55 Automatic Data Processing, Inc. 1.25%
01/09/2030 USD 575,000 573,863 0.42 Aviation Capital Group LLC, 144A 4.375%
30/01/2024 USD 475,000 501,633 0.36 Bank of America Corp. 3.248%
21/10/2027 USD 225,000 251,844 0.18 Bank of America Corp. 1.898%
23/07/2031 USD 550,000 555,608 0.40 Bank of America Corp., FRN 2.592%
29/04/2031 USD 1,550,000 1,660,438 1.20 Bank of America Corp. 4.25%
22/10/2026 USD 225,000 263,864 0.19 BBVA USA 2.5% 27/08/2024 USD 1,250,000 1,328,429 0.96 Belrose Funding Trust, 144A 2.33%
15/08/2030 USD 400,000 412,126 0.30 Berkshire Hathaway Energy Co., 144A
2.85% 15/05/2051 USD 425,000 437,466 0.32 Berry Global, Inc., 144A 1.57%
15/01/2026 USD 250,000 252,200 0.18 Berry Global, Inc., 144A 4.875%
15/07/2026 USD 262,000 281,712 0.20 Boeing Co. (The) 3.25% 01/02/2035 USD 150,000 153,826 0.11 Boeing Co. (The) 3.95% 01/08/2059 USD 175,000 187,226 0.14 Boston Gas Co., 144A 3.001%
01/08/2029 USD 225,000 248,521 0.18 Boston Scientific Corp. 2.65%
01/06/2030 USD 350,000 375,746 0.27 Broadcom, Inc. 4.15% 15/11/2030 USD 225,000 260,777 0.19 Brown & Brown, Inc. 2.375% 15/03/2031 USD 575,000 602,515 0.44 Burlington Northern Santa Fe LLC 4.55%
01/09/2044 USD 455,000 615,182 0.45 Campbell Soup Co. 3.125% 24/04/2050 USD 325,000 343,662 0.25 Charter Communications Operating LLC
2.8% 01/04/2031 USD 250,000 264,509 0.19 Charter Communications Operating LLC
5.125% 01/07/2049 USD 200,000 244,031 0.18 Charter Communications Operating LLC
3.85% 01/04/2061 USD 100,000 101,257 0.07 Charter Communications Operating LLC
5.75% 01/04/2048 USD 100,000 130,866 0.09 Chubb INA Holdings, Inc. 0.875%
15/06/2027 EUR 100,000 129,189 0.09 Cigna Corp. 3.05% 15/10/2027 USD 150,000 168,258 0.12 Cigna Corp. 2.4% 15/03/2030 USD 400,000 426,432 0.31 Cimarex Energy Co. 4.375% 15/03/2029 USD 400,000 453,729 0.33 Citigroup, Inc. 2.666% 29/01/2031 USD 413,000 443,186 0.32 Citigroup, Inc. 4.412% 31/03/2031 USD 1,060,000 1,287,807 0.93
schEDUlE of InVEsTmEnTsAs at 31 December 2020
Investments Currency
Quantity/Nominal
Value
Market Value USD
% of Net Assets
Transferable securities and money market instruments admitted to official exchange listing or dealt in on another regulated market
corporate Bonds (continued)
United states of america (continued)Cleveland Electric Illuminating Co. (The),
144A 4.55% 15/11/2030 USD 250,000 288,302 0.21 CNO Financial Group, Inc. 5.25%
30/05/2029 USD 195,000 236,028 0.17 Comcast Corp. 2.8% 15/01/2051 USD 175,000 182,436 0.13 Comcast Corp. 2.45% 15/08/2052 USD 300,000 291,910 0.21 Comcast Corp. 3.1% 01/04/2025 USD 225,000 247,708 0.18 Comcast Corp. 0.25% 20/05/2027 EUR 200,000 249,397 0.18 Comcast Corp. 1.95% 15/01/2031 USD 350,000 359,349 0.26 Comcast Corp. 3.75% 01/04/2040 USD 125,000 151,119 0.11 Conagra Brands, Inc. 4.6% 01/11/2025 USD 225,000 265,188 0.19 Conagra Brands, Inc. 1.375%
01/11/2027 USD 275,000 277,510 0.20 Crown Castle International Corp., REIT
4.15% 01/07/2050 USD 175,000 212,944 0.15 Cummins, Inc. 2.6% 01/09/2050 USD 250,000 255,299 0.19 CVS Health Corp. 1.75% 21/08/2030 USD 175,000 176,019 0.13 CVS Health Corp. 3.75% 01/04/2030 USD 452,000 526,162 0.38 Deere & Co. 3.75% 15/04/2050 USD 150,000 194,663 0.14 Dell International LLC, 144A 4.9%
01/10/2026 USD 400,000 472,536 0.34 DH Europe Finance II Sarl 1.8%
18/09/2049 EUR 100,000 139,389 0.10 Diamond Sports Group LLC, 144A 6.625%
15/08/2027 USD 150,000 90,563 0.07 Diamondback Energy, Inc. 3.25%
01/12/2026 USD 525,000 561,083 0.41 Dollar General Corp. 3.5% 03/04/2030 USD 575,000 660,516 0.48 DTE Electric Co. 2.95% 01/03/2050 USD 275,000 306,609 0.22 DuPont de Nemours, Inc. 5.319%
15/11/2038 USD 150,000 203,081 0.15 DXC Technology Co. 2.75% 15/01/2025 GBP 400,000 569,913 0.41 Eli Lilly and Co. 1.7% 01/11/2049 EUR 300,000 437,131 0.32 Emerson Electric Co. 1.25% 15/10/2025 EUR 200,000 261,893 0.19 Enterprise Products Operating LLC
3.125% 31/07/2029 USD 75,000 83,219 0.06 Enterprise Products Operating LLC 4.2%
31/01/2050 USD 150,000 177,382 0.13 Enterprise Products Operating LLC 3.95%
31/01/2060 USD 125,000 138,747 0.10 Equinix, Inc. 1.55% 15/03/2028 USD 375,000 381,409 0.28 Equitable Financial Life Global Funding,
144A 1.4% 27/08/2027 USD 425,000 427,714 0.31 Equitable Financial Life Global Funding,
144A 1.75% 15/11/2030 USD 325,000 326,411 0.24 Fidelity National Information Services, Inc.
2.95% 21/05/2039 EUR 200,000 315,449 0.23 FirstEnergy Corp. 3.4% 01/03/2050 USD 225,000 216,224 0.16 Fiserv, Inc. 3.8% 01/10/2023 USD 475,000 517,632 0.38 Five Corners Funding Trust II, 144A 2.85%
15/05/2030 USD 425,000 470,077 0.34 Ford Motor Credit Co. LLC 4.389%
08/01/2026 USD 200,000 210,218 0.15 Ford Motor Credit Co. LLC 3.096%
04/05/2023 USD 425,000 429,913 0.31 Fox Corp. 5.576% 25/01/2049 USD 100,000 146,080 0.11 GE Capital International Funding Co.
Unlimited Co. 4.418% 15/11/2035 USD 450,000 537,110 0.39 General Motors Co. 6.6% 01/04/2036 USD 250,000 338,410 0.25 General Motors Financial Co., Inc. 4.35%
17/01/2027 USD 125,000 142,397 0.10 General Motors Financial Co., Inc. 3.85%
05/01/2028 USD 50,000 55,617 0.04 Georgia‑Pacific LLC, 144A 2.3%
30/04/2030 USD 700,000 748,624 0.54 Gilead Sciences, Inc. 2.8% 01/10/2050 USD 150,000 150,247 0.11

Morgan Stanley Investment Funds 31 December 2020 212
The accompanying notes are an integral part of these financial statements.
Global Credit Fund (continued)
schEDUlE of InVEsTmEnTsAs at 31 December 2020
Investments Currency
Quantity/Nominal
Value
Market Value USD
% of Net Assets
Transferable securities and money market instruments admitted to official exchange listing or dealt in on another regulated market
corporate Bonds (continued)
United states of america (continued)Global Payments, Inc. 2.9% 15/05/2030 USD 550,000 598,801 0.43 GLP Capital LP, REIT 4% 15/01/2030 USD 450,000 488,765 0.35 Goldman Sachs Group, Inc. (The), Reg. S
2% 01/11/2028 EUR 250,000 348,486 0.25 Goldman Sachs Group, Inc. (The) 6.75%
01/10/2037 USD 325,000 499,243 0.36 Goldman Sachs Group, Inc. (The) 4.8%
08/07/2044 USD 100,000 138,783 0.10 Goldman Sachs Group, Inc. (The), FRN
3.691% 05/06/2028 USD 200,000 230,383 0.17 Harborwalk Funding Trust, FRN, 144A
5.077% 15/02/2069 USD 150,000 189,407 0.14 HCA, Inc. 5.5% 15/06/2047 USD 200,000 266,980 0.19 Home Depot, Inc. (The) 2.5% 15/04/2027 USD 75,000 82,367 0.06 Home Depot, Inc. (The) 2.7% 15/04/2030 USD 64,000 71,422 0.05 Home Depot, Inc. (The) 3.35%
15/04/2050 USD 150,000 178,376 0.13 Hormel Foods Corp. 1.8% 11/06/2030 USD 107,000 110,648 0.08 Indiana Michigan Power Co. 4.25%
15/08/2048 USD 200,000 258,687 0.19 Intercontinental Exchange, Inc. 1.85%
15/09/2032 USD 625,000 628,877 0.46 International Business Machines Corp.
2.95% 15/05/2050 USD 300,000 319,934 0.23 International Business Machines Corp.
0.375% 31/01/2023 EUR 250,000 310,642 0.23 International Game Technology plc, Reg. S
3.5% 15/06/2026 EUR 175,000 222,674 0.16 Interstate Power and Light Co. 3.5%
30/09/2049 USD 125,000 144,728 0.10 John Deere Capital Corp. 2.05%
09/01/2025 USD 350,000 371,263 0.27 Johnson Controls International plc 1.75%
15/09/2030 USD 275,000 280,603 0.20 JPMorgan Chase & Co. 2.739%
15/10/2030 USD 400,000 434,674 0.31 JPMorgan Chase & Co. 1.764%
19/11/2031 USD 500,000 505,671 0.37 JPMorgan Chase & Co., FRN 2.956%
13/05/2031 USD 325,000 356,539 0.26 JPMorgan Chase & Co., Reg. S, FRN
0.389% 24/02/2028 EUR 500,000 624,224 0.45 Kilroy Realty LP 2.5% 15/11/2032 USD 150,000 152,281 0.11 Kilroy Realty LP, REIT 3.05% 15/02/2030 USD 125,000 132,978 0.10 Las Vegas Sands Corp. 3.2% 08/08/2024 USD 625,000 662,283 0.48 Level 3 Financing, Inc., 144A 3.4%
01/03/2027 USD 400,000 436,374 0.32 Marsh & McLennan Cos., Inc. 1.349%
21/09/2026 EUR 750,000 984,488 0.71 McKesson Corp. 3.125% 17/02/2029 GBP 325,000 500,969 0.36 Microsoft Corp. 2.525% 01/06/2050 USD 25,000 26,354 0.02 Midwest Connector Capital Co. LLC, 144A
3.625% 01/04/2022 USD 200,000 203,138 0.15 Mondelez International, Inc. 2.75%
13/04/2030 USD 225,000 246,677 0.18 NIKE, Inc. 3.375% 27/03/2050 USD 250,000 308,273 0.22 NRG Energy, Inc., 144A 3.625%
15/02/2031 USD 140,000 144,558 0.10 Nutrition & Biosciences, Inc., 144A 2.3%
01/11/2030 USD 175,000 180,228 0.13 NVIDIA Corp. 3.5% 01/04/2050 USD 225,000 273,300 0.20 Occidental Petroleum Corp. 3.5%
15/08/2029 USD 225,000 205,110 0.15 ONEOK, Inc. 3.1% 15/03/2030 USD 225,000 237,803 0.17 Oracle Corp. 3.85% 01/04/2060 USD 200,000 245,065 0.18 Pacific Gas and Electric Co. 3.3%
01/08/2040 USD 150,000 150,318 0.11
schEDUlE of InVEsTmEnTsAs at 31 December 2020
Investments Currency
Quantity/Nominal
Value
Market Value USD
% of Net Assets
Transferable securities and money market instruments admitted to official exchange listing or dealt in on another regulated market
corporate Bonds (continued)
United states of america (continued)PayPal Holdings, Inc. 2.85% 01/10/2029 USD 131,000 145,794 0.11 PayPal Holdings, Inc. 2.3% 01/06/2030 USD 449,000 481,131 0.35 Philip Morris International, Inc. 0.125%
03/08/2026 EUR 150,000 184,261 0.13 Phillips 66 2.15% 15/12/2030 USD 200,000 202,939 0.15 PNC Financial Services Group, Inc. (The)
2.2% 01/11/2024 USD 500,000 531,571 0.39 Prologis Euro Finance LLC, REIT 1.875%
05/01/2029 EUR 300,000 416,993 0.30 Public Service Co. of Colorado 3.2%
01/03/2050 USD 200,000 231,814 0.17 Quicken Loans LLC, 144A 3.875%
01/03/2031 USD 190,000 197,600 0.14 Resorts World Las Vegas LLC, 144A
4.625% 16/04/2029 USD 600,000 617,165 0.45 Rockies Express Pipeline LLC, 144A 3.6%
15/05/2025 USD 250,000 258,180 0.19 Rockies Express Pipeline LLC, 144A
4.95% 15/07/2029 USD 50,000 52,100 0.04 Ross Stores, Inc. 0.875% 15/04/2026 USD 200,000 200,109 0.14 Royalty Pharma plc, 144A 2.2%
02/09/2030 USD 500,000 511,907 0.37 Sabine Pass Liquefaction LLC, 144A 4.5%
15/05/2030 USD 225,000 266,754 0.19 Sherwin‑Williams Co. (The) 2.95%
15/08/2029 USD 100,000 110,143 0.08 Sherwin‑Williams Co. (The) 2.3%
15/05/2030 USD 325,000 339,627 0.25 Sherwin‑Williams Co. (The) 3.3%
15/05/2050 USD 100,000 110,699 0.08 Silgan Holdings, Inc. 2.25% 01/06/2028 EUR 200,000 249,675 0.18 Smithfield Foods, Inc., 144A 3%
15/10/2030 USD 125,000 131,808 0.10 Sprint Spectrum Co. LLC, 144A 4.738%
20/09/2029 USD 600,000 651,729 0.47 Sprint Spectrum Co. LLC, 144A 5.152%
20/09/2029 USD 200,000 232,000 0.17 Standard Industries, Inc., Reg. S 2.25%
21/11/2026 EUR 100,000 124,467 0.09 Stryker Corp. 2.125% 30/11/2027 EUR 100,000 139,513 0.10 Sunoco Logistics Partners Operations LP
3.9% 15/07/2026 USD 175,000 192,691 0.14 Sunoco Logistics Partners Operations LP
4% 01/10/2027 USD 200,000 220,366 0.16 Target Corp. 2.25% 15/04/2025 USD 475,000 508,745 0.37 Thermo Fisher Scientific, Inc. 1.875%
01/10/2049 EUR 450,000 641,508 0.47 T‑Mobile USA, Inc., 144A 2.25%
15/11/2031 USD 100,000 102,822 0.07 T‑Mobile USA, Inc., 144A 3.6%
15/11/2060 USD 300,000 317,900 0.23 Transcontinental Gas Pipe Line Co. LLC
3.25% 15/05/2030 USD 125,000 140,029 0.10 Transcontinental Gas Pipe Line Co. LLC
3.95% 15/05/2050 USD 200,000 226,779 0.16 Union Pacific Corp. 2.4% 05/02/2030 USD 475,000 511,889 0.37 Verizon Communications, Inc., 144A
2.987% 30/10/2056 USD 228,000 229,365 0.17 Verizon Communications, Inc. 1.125%
03/11/2028 GBP 350,000 486,472 0.35 Verizon Communications, Inc. 0.875%
08/04/2027 EUR 400,000 516,321 0.37 Verizon Communications, Inc. 4.672%
15/03/2055 USD 309,000 415,078 0.30 Viatris, Inc., 144A 4% 22/06/2050 USD 200,000 229,005 0.17 Visa, Inc. 2.7% 15/04/2040 USD 100,000 109,215 0.08 Walmart, Inc. 2.95% 24/09/2049 USD 261,000 300,696 0.22

213 Morgan Stanley Investment Funds 31 December 2020
The accompanying notes are an integral part of these financial statements.
Global Credit Fund (continued)
schEDUlE of InVEsTmEnTsAs at 31 December 2020
Investments Currency
Quantity/Nominal
Value
Market Value USD
% of Net Assets
Transferable securities and money market instruments admitted to official exchange listing or dealt in on another regulated market
corporate Bonds (continued)
United states of america (continued)Walt Disney Co. (The) 2.75% 01/09/2049 USD 495,000 523,364 0.38 Walt Disney Co. (The) 3.6% 13/01/2051 USD 87,000 105,234 0.08 Wells Fargo & Co., FRN 3.068%
30/04/2041 USD 500,000 543,585 0.39 Wells Fargo Bank NA, Reg. S 5.25%
01/08/2023 GBP 200,000 304,542 0.22 Western Midstream Operating LP 4.1%
01/02/2025 USD 200,000 206,318 0.15 Williams Cos., Inc. (The) 5.1% 15/09/2045 USD 100,000 124,787 0.09 Williams Cos., Inc. (The) 4.85%
01/03/2048 USD 150,000 184,257 0.13 Xcel Energy, Inc. 2.6% 01/12/2029 USD 200,000 216,592 0.16
59,231,643 42.92
Total corporate Bonds 129,890,199 94.11
mortgage and asset Backed securities
United states of americaJetBlue Pass‑Through Trust ‘AA’ 2.75%
15/11/2033 USD 361,283 363,083 0.26
363,083 0.26
Total mortgage and asset Backed securities 363,083 0.26
Total Transferable securities and money market instruments admitted to official exchange listing or dealt in on another regulated market 132,305,119 95.86
Units of authorised UCITS or other collective investment undertakings
collective Investment schemes – UcITs
luxembourgMorgan Stanley Liquidity Funds US Dollar
Liquidity Fund – MS Reserve† USD 2,602,390 2,602,390 1.89
2,602,390 1.89
Total collective Investment schemes – UcITs 2,602,390 1.89
Total Units of authorised UcITs or other collective investment undertakings 2,602,390 1.89
Total Investments 134,907,509 97.75
cash 1,410,261 1.02
other assets/(liabilities) 1,690,501 1.23
Total net assets 138,008,271 100.00
† Managed by an affiliate of the Investment Adviser.The country disclosed within the Schedule of Investments refers to the country of risk. The country of incorporation may differ.
financial futures contracts
security Descriptionnumber
of contracts currency
Global Exposure
UsD
Unrealised Gain/(loss)
UsD
% of net assets
Euro‑Bobl, 08/03/2021 (15) EUR (2,487,866) 2,024 0.00Euro‑Bund, 08/03/2021 (5) EUR (1,089,768) 982 0.00Long Gilt, 29/03/2021 3 GBP 555,414 6,188 0.01 US 2 Year Note, 31/03/2021 16 USD 3,535,500 3,125 0.00US 5 Year Note, 31/03/2021 10 USD 1,261,406 2,508 0.00US 10 Year Note, 22/03/2021 (20) USD (2,760,000) 1,207 0.00US 10 Year Ultra Bond, 22/03/2021 (105) USD (16,406,250) 71,242 0.05
Total Unrealised Gain on financial futures contracts 87,276 0.06
Canada 10 Year Bond, 22/03/2021 32 CAD 3,743,950 (5,784) 0.00Euro‑OAT, 08/03/2021 (10) EUR (2,059,541) (124) 0.00Euro‑Schatz, 08/03/2021 10 EUR 1,377,547 (1,258) 0.00US Long Bond, 22/03/2021 46 USD 7,958,000 (65,343) (0.05) US Ultra Bond, 22/03/2021 13 USD 2,771,031 (32,807) (0.02)
Total Unrealised loss on financial futures contracts (105,316) (0.07)
net Unrealised loss on financial futures contracts (18,040) (0.01)
forward currency Exchange contracts
currency Purchased
amount Purchased
currency sold
amount sold
maturity Date counterparty
Unrealised Gain/(loss)
UsD
% of net assets
USD 52,515 EUR 42,740 05/01/2021 J.P. Morgan 75 0.00EUR 225,000 USD 266,046 19/01/2021 Barclays 10,114 0.01 EUR 51,387 USD 62,897 19/01/2021 BNP Paribas 174 0.00EUR 385,000 USD 448,640 19/01/2021 Commonwealth
Bank of Australia 23,900 0.02 EUR 500,000 USD 585,120 19/01/2021 State Street 28,569 0.02 CAD 5,405,000 USD 4,065,799 20/01/2021 RBC 182,339 0.13 AUD 618,000 USD 437,612 22/01/2021 Commonwealth
Bank of Australia 40,229 0.03 CHF 398,000 USD 442,661 25/01/2021 Westpac Banking 9,642 0.01 JPY 118,955,000 USD 1,135,173 29/01/2021 Westpac Banking 19,544 0.01
Unrealised Gain on forward currency Exchange contracts – assets 314,586 0.23
GBP hedged share classGBP 9,019,377 USD 12,116,525 08/01/2021 J.P. Morgan 203,697 0.15
Unrealised Gain on naV hedged share classes forward currency Exchange contracts – assets 203,697 0.15
Total Unrealised Gain on forward currency Exchange contracts – assets 518,283 0.38
USD 505,246 EUR 412,420 04/01/2021 J.P. Morgan (769) 0.00EUR 42,740 USD 52,515 05/01/2021 J.P. Morgan (75) 0.00USD 4,382,731 EUR 3,719,268 19/01/2021 BNP Paribas (182,212) (0.13) USD 2,019,736 GBP 1,535,000 27/01/2021 Goldman Sachs (77,345) (0.06)
Unrealised loss on forward currency Exchange contracts – liabilities (260,401) (0.19)
GBP hedged share classUSD 28,035 GBP 20,764 04/01/2021 J.P. Morgan (328) 0.00
Unrealised loss on naV hedged share classes forward currency Exchange contracts – liabilities (328) 0.00
Total Unrealised loss on forward currency Exchange contracts – liabilities (260,729) (0.19)
net Unrealised Gain on forward currency Exchange contracts – assets 257,554 0.19
DERIVaTIVEs
Over-the-counter (OTC) and exchange traded derivatives as at 31 December 2020, expressed in US Dollars.

Morgan Stanley Investment Funds 31 December 2020 214
The accompanying notes are an integral part of these financial statements.
Global Credit Fund (continued)
credit Default swap contracts
nominal amount ccy counterparty
Reference Entity
Buy/ sell
Interest (Paid)/
Received Rate
maturity Date
market Value UsD
% of net assets
1,500,000 EUR Goldman Sachs ITRAXX.EUROPE.CROSSOVER. 31‑V6 Buy (5.00)% 20/06/2024 (180,328) (0.13)
Total market Value on credit Default swap contracts – liabilities (180,328) (0.13)
net market Value on credit Default swap contracts – liabilities (180,328) (0.13)
Collateral received and paid by the Fund in respect of financial derivative instruments:
Type of collateral counterparty currency amount received amount paid
Global credit fund
Cash Goldman Sachs USD 248,785 –
248,785 –
DERIVaTIVEs (continued)
Over-the-counter (OTC) and exchange traded derivatives as at 31 December 2020, expressed in US Dollars.

215 Morgan Stanley Investment Funds 31 December 2020
The accompanying notes are an integral part of these financial statements.
Please refer to the full prospectus for the Fund’s investment objective and policy.
InVEsTmEnT aIm
To provide an attractive level of total return, measured in US Dollars, through investment primarily in the global securities of corporate, government and government related issuers across a spectrum of fixed income asset classes including high yield bonds, investment‑grade bonds, mortgage‑backed securities, convertibles and currencies, and subject to applicable law, in other asset‑backed securities, loan participations and loan assignments, to the extent that these instruments are securitised.
schEDUlE of InVEsTmEnTsAs at 31 December 2020
Investments Currency
Quantity/Nominal
Value
Market Value USD
% of Net Assets
Transferable securities and money market instruments admitted to official exchange listing or dealt in on another regulated market
convertible Bonds
canadaShopify, Inc. 0.125% 01/11/2025 USD 4,950,000 5,918,344 0.12
5,918,344 0.12
franceAirbus SE, Reg. S 0% 14/06/2021 EUR 6,200,000 7,612,284 0.15 TOTAL SE, Reg. S 0.5% 02/12/2022 USD 4,800,000 4,914,908 0.10 Vinci SA, Reg. S 0.375% 16/02/2022 USD 4,600,000 5,184,767 0.10
17,711,959 0.35
singaporeSingapore Airlines Ltd., Reg. S 1.625%
03/12/2025 SGD 7,000,000 5,793,856 0.12
5,793,856 0.12
United states of americaAkamai Technologies, Inc. 0.375%
01/09/2027 USD 5,293,000 5,904,718 0.11 BioMarin Pharmaceutical, Inc. 0.599%
01/08/2024 USD 6,054,000 6,417,095 0.13 Booking Holdings, Inc. 0.9% 15/09/2021 USD 4,200,000 4,848,366 0.09 Jazz Investments I Ltd. 1.875%
15/08/2021 USD 6,350,000 6,502,029 0.13 Twitter, Inc. 1% 15/09/2021 USD 8,887,000 9,059,451 0.18 Verint Systems, Inc. 1.5% 01/06/2021 USD 5,975,000 6,507,798 0.13 Western Digital Corp. 1.5% 01/02/2024 USD 5,550,000 5,515,251 0.11
44,754,708 0.88
Total convertible Bonds 74,178,867 1.47
corporate Bonds
australiaAPT Pipelines Ltd., 144A 4.2%
23/03/2025 USD 8,275,000 9,136,090 0.18 Aurizon Network Pty. Ltd., Reg. S 3.125%
01/06/2026 EUR 6,050,000 8,518,961 0.17 Australia & New Zealand Banking Group
Ltd., 144A 2.57% 25/11/2035 USD 4,350,000 4,439,038 0.09 Glencore Funding LLC, 144A 3.875%
27/10/2027 USD 12,000,000 13,550,892 0.27 Infrabuild Australia Pty. Ltd., 144A 12%
01/10/2024 USD 1,355,000 1,377,019 0.03 Newcastle Coal Infrastructure Group
Pty. Ltd., 144A 4.4% 29/09/2027 USD 6,675,000 6,847,015 0.13 Santos Finance Ltd., Reg. S 4.125%
14/09/2027 USD 10,725,000 11,371,771 0.22 Westpac Banking Corp. 2.668%
15/11/2035 USD 3,925,000 4,048,284 0.08
59,289,070 1.17
Global Fixed Income Opportunities Fund

Morgan Stanley Investment Funds 31 December 2020 216
The accompanying notes are an integral part of these financial statements.
Global Fixed Income Opportunities Fund (continued)
schEDUlE of InVEsTmEnTsAs at 31 December 2020
Investments Currency
Quantity/Nominal
Value
Market Value USD
% of Net Assets
Transferable securities and money market instruments admitted to official exchange listing or dealt in on another regulated market
corporate Bonds (continued)
BelgiumAnheuser‑Busch InBev SA/NV, Reg. S 3.7%
02/04/2040 EUR 5,000,000 8,698,734 0.17 LBC Tank Terminals Holding Netherlands
BV, 144A 6.875% 15/05/2023 USD 1,915,000 1,920,984 0.04 Solvay Finance SACA, Reg. S, FRN 5.425%
Perpetual EUR 2,600,000 3,546,611 0.07
14,166,329 0.28
BrazilBanco Bradesco SA, Reg. S 3.2%
27/01/2025 USD 14,680,000 15,432,350 0.30 Braskem Netherlands Finance BV, Reg. S
4.5% 31/01/2030 USD 6,280,000 6,444,913 0.13 Itau Unibanco Holding SA, 144A 2.9%
24/01/2023 USD 18,950,000 19,457,102 0.38 Minerva Luxembourg SA, Reg. S 5.875%
19/01/2028 USD 5,400,000 5,833,404 0.12 Petrobras Global Finance BV 5.093%
15/01/2030 USD 9,000,000 10,068,750 0.20 Petrobras Global Finance BV 6.75%
03/06/2050 USD 5,000,000 6,218,750 0.12
63,455,269 1.25
Burkina fasoIAMGOLD Corp., 144A 5.75%
15/10/2028 USD 6,980,000 7,093,425 0.14
7,093,425 0.14
canadaBaffinland Iron Mines Corp., 144A 8.75%
15/07/2026 USD 2,450,000 2,657,797 0.05 Enbridge, Inc. 4.25% 01/12/2026 USD 5,000,000 5,854,964 0.12 Garda World Security Corp., 144A 9.5%
01/11/2027 USD 11,202,000 12,425,146 0.25 NOVA Chemicals Corp., 144A 4.875%
01/06/2024 USD 9,525,000 9,935,766 0.20 Titan Acquisition Ltd., 144A 7.75%
15/04/2026 USD 1,850,000 1,928,625 0.04 Vermilion Energy, Inc., 144A 5.625%
15/03/2025 USD 3,200,000 2,759,664 0.05
35,561,962 0.71
chinaBaidu, Inc. 2.875% 06/07/2022 USD 6,900,000 7,112,118 0.14 CNAC HK Finbridge Co. Ltd., Reg. S
3.875% 19/06/2029 USD 6,000,000 6,088,380 0.12 CNRC Capital Ltd., Reg. S 1.871%
07/12/2021 EUR 5,000,000 6,169,269 0.12 Country Garden Holdings Co. Ltd., Reg. S
7.25% 08/04/2026 USD 9,050,000 10,200,101 0.20 Fufeng Group Ltd., Reg. S 5.875%
28/08/2021 USD 3,750,000 3,844,181 0.08 Meituan, 144A 3.05% 28/10/2030 USD 5,200,000 5,430,308 0.11 Tencent Holdings Ltd., 144A 3.595%
19/01/2028 USD 10,000,000 11,034,312 0.22 Tencent Holdings Ltd., Reg. S 2.985%
19/01/2023 USD 5,000,000 5,206,239 0.10
55,084,908 1.09
schEDUlE of InVEsTmEnTsAs at 31 December 2020
Investments Currency
Quantity/Nominal
Value
Market Value USD
% of Net Assets
Transferable securities and money market instruments admitted to official exchange listing or dealt in on another regulated market
corporate Bonds (continued)
colombiaGrupo Aval Ltd., 144A 4.375%
04/02/2030 USD 4,940,000 5,268,510 0.10 Millicom International Cellular SA, Reg. S
6.625% 15/10/2026 USD 1,000,000 1,071,500 0.02 Millicom International Cellular SA, Reg. S
6.25% 25/03/2029 USD 3,095,000 3,489,040 0.07
9,829,050 0.19
DenmarkDanske Bank A/S, FRN, 144A 5%
12/01/2023 USD 5,025,000 5,231,598 0.10
5,231,598 0.10
franceAltice France SA, 144A 7.375%
01/05/2026 USD 4,775,000 5,031,656 0.10 AXA SA, Reg. S, FRN 3.25% 28/05/2049 EUR 11,000,000 15,815,456 0.31 Banque Federative du Credit Mutuel SA,
Reg. S 2.375% 21/11/2024 USD 13,000,000 13,786,612 0.27 BNP Paribas SA, FRN, 144A 2.819%
19/11/2025 USD 12,525,000 13,353,233 0.27 BNP Paribas SA, Reg. S 2.875%
01/10/2026 EUR 8,600,000 11,921,926 0.23 BPCE SA, 144A 5.15% 21/07/2024 USD 9,500,000 10,818,232 0.21 Credit Agricole Assurances SA, Reg. S,
FRN 4.5% Perpetual EUR 9,000,000 12,664,321 0.25 Orange SA, Reg. S, FRN 5% Perpetual EUR 10,750,000 16,008,883 0.32 TOTAL SE, Reg. S, FRN 2.708% Perpetual EUR 9,100,000 11,705,268 0.23
111,105,587 2.19
GermanyDaimler Finance North America LLC, 144A
2.7% 14/06/2024 USD 6,750,000 7,229,336 0.14 Deutsche Bank AG 3.15% 22/01/2021 USD 13,550,000 13,565,191 0.27 Muenchener Rueckversicherungs‑
Gesellschaft AG, Reg. S, FRN 3.25% 26/05/2049 EUR 10,800,000 15,748,822 0.31
Techem Verwaltungsgesellschaft 675 mbH, Reg. S 2% 15/07/2025 EUR 7,700,000 9,417,678 0.19
Volkswagen International Finance NV, Reg. S, FRN 4.625% Perpetual EUR 8,000,000 10,924,674 0.21
Volkswagen International Finance NV, Reg. S 1.875% 30/03/2027 EUR 6,000,000 8,065,354 0.16
Wintershall Dea Finance BV, Reg. S 1.332% 25/09/2028 EUR 12,700,000 16,149,000 0.32
81,100,055 1.60
IndiaBharti Airtel International Netherlands BV,
144A 5.35% 20/05/2024 USD 7,000,000 7,745,642 0.15 Bharti Airtel Ltd., Reg. S 4.375%
10/06/2025 USD 3,500,000 3,816,700 0.08 NTPC Ltd., Reg. S 4.25% 26/02/2026 USD 8,000,000 8,810,160 0.18 ONGC Videsh Vankorneft Pte. Ltd., Reg. S
3.75% 27/07/2026 USD 9,000,000 9,786,717 0.19
30,159,219 0.60

217 Morgan Stanley Investment Funds 31 December 2020
The accompanying notes are an integral part of these financial statements.
Global Fixed Income Opportunities Fund (continued)
schEDUlE of InVEsTmEnTsAs at 31 December 2020
Investments Currency
Quantity/Nominal
Value
Market Value USD
% of Net Assets
Transferable securities and money market instruments admitted to official exchange listing or dealt in on another regulated market
corporate Bonds (continued)
IndonesiaPerusahaan Perseroan Persero PT
Perusahaan Listrik Negara, Reg. S 6.25% 25/01/2049 USD 11,000,000 14,740,000 0.29
14,740,000 0.29
IrelandAvolon Holdings Funding Ltd., 144A
2.875% 15/02/2025 USD 19,275,000 19,686,560 0.39 eircom Finance DAC, Reg. S 3.5%
15/05/2026 EUR 7,650,000 9,603,848 0.19 Park Aerospace Holdings Ltd., 144A
5.25% 15/08/2022 USD 7,250,000 7,611,522 0.15
36,901,930 0.73
IsraelTeva Pharmaceutical Finance Netherlands
III BV 2.2% 21/07/2021 USD 5,202,000 5,198,749 0.10
5,198,749 0.10
ItalyAssicurazioni Generali SpA, Reg. S, FRN
5.5% 27/10/2047 EUR 10,300,000 15,600,971 0.31 Enel Finance International NV, 144A 4.25%
14/09/2023 USD 18,450,000 20,190,936 0.40 Enel SpA, Reg. S, FRN 2.5% 24/11/2078 EUR 11,500,000 14,762,388 0.29 Intesa Sanpaolo SpA 5.25% 12/01/2024 USD 4,000,000 4,479,830 0.09 UniCredit SpA, 144A 6.572% 14/01/2022 USD 4,575,000 4,822,228 0.09
59,856,353 1.18
JapanAsahi Group Holdings Ltd., Reg. S 0.541%
23/10/2028 EUR 3,000,000 3,743,607 0.07
3,743,607 0.07
luxembourgBlackstone Property Partners Europe
Holdings Sarl, Reg. S 1.25% 26/04/2027 EUR 7,750,000 9,752,257 0.20
Eurofins Scientific SE, Reg. S, FRN 4.875% Perpetual EUR 2,000,000 2,655,724 0.05
INEOS Finance plc, Reg. S 2.125% 15/11/2025 EUR 2,975,000 3,616,766 0.07
16,024,747 0.32
mexicoBanco Actinver SA, 144A 4.8%
18/12/2034 USD 10,000,000 7,571,875 0.15 Cemex SAB de CV, Reg. S 3.125%
19/03/2026 EUR 5,600,000 7,074,654 0.14 Petroleos Mexicanos 6.49% 23/01/2027 USD 9,000,000 9,481,500 0.19 Petroleos Mexicanos 7.69% 23/01/2050 USD 4,000,000 4,040,000 0.08 Petroleos Mexicanos 6.95% 28/01/2060 USD 4,000,000 3,753,000 0.07
schEDUlE of InVEsTmEnTsAs at 31 December 2020
Investments Currency
Quantity/Nominal
Value
Market Value USD
% of Net Assets
Transferable securities and money market instruments admitted to official exchange listing or dealt in on another regulated market
corporate Bonds (continued)
mexico (continued)Petroleos Mexicanos, Reg. S 2.5%
21/08/2021 EUR 11,000,000 13,550,190 0.27 Petroleos Mexicanos, Reg. S 6.875%
16/10/2025 USD 5,000,000 5,487,000 0.11
50,958,219 1.01
netherlandsASR Nederland NV, Reg. S, FRN 5%
Perpetual EUR 9,500,000 13,181,399 0.26 InterGen NV, 144A 7% 30/06/2023 USD 2,000,000 1,947,500 0.04 NN Group NV, Reg. S, FRN 4.625%
08/04/2044 EUR 11,000,000 15,203,627 0.30 Q‑Park Holding I BV, Reg. S 1.5%
01/03/2025 EUR 7,150,000 8,495,044 0.17 UPC Holding BV, Reg. S 3.875%
15/06/2029 EUR 7,610,000 9,617,124 0.19
48,444,694 0.96
nigeriaAfrica Finance Corp., Reg. S 4.375%
17/04/2026 USD 10,000,000 10,978,900 0.22
10,978,900 0.22
norwayAker BP ASA, 144A 4.75% 15/06/2024 USD 9,450,000 9,778,738 0.19
9,778,738 0.19
PeruLima Metro Line 2 Finance Ltd., Reg. S
4.35% 05/04/2036 USD 5,000,000 5,554,625 0.11
5,554,625 0.11
PortugalEDP ‑ Energias de Portugal SA, Reg. S,
FRN 1.7% 20/07/2080 EUR 6,200,000 7,597,975 0.15
7,597,975 0.15
QatarQNB Finance Ltd., Reg. S 2.75%
12/02/2027 USD 7,000,000 7,423,661 0.15
7,423,661 0.15
saudi arabiaSaudi Arabian Oil Co., Reg. S 3.25%
24/11/2050 USD 8,000,000 8,110,802 0.16
8,110,802 0.16
south africaEskom Holdings SOC Ltd., Reg. S 7.125%
11/02/2025 USD 8,000,000 8,210,000 0.16 Standard Bank Group Ltd., Reg. S, FRN
5.95% 31/05/2029 USD 4,975,000 5,186,437 0.10
13,396,437 0.26
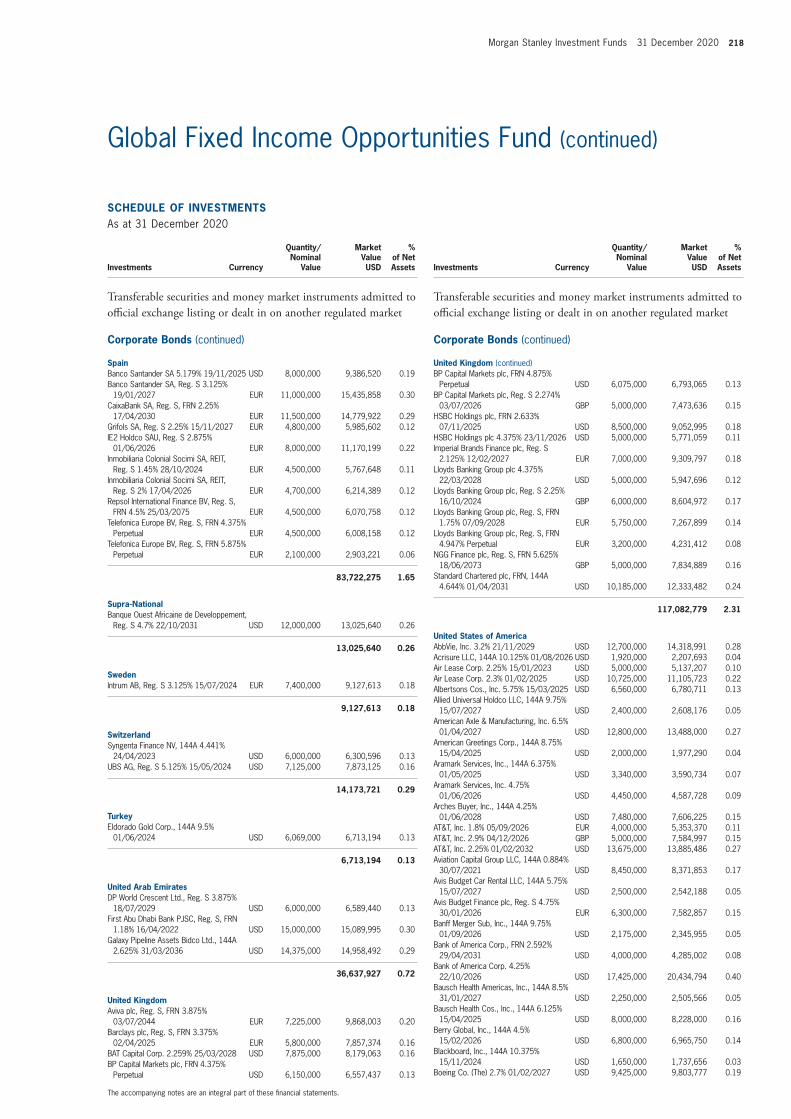
Morgan Stanley Investment Funds 31 December 2020 218
The accompanying notes are an integral part of these financial statements.
Global Fixed Income Opportunities Fund (continued)
schEDUlE of InVEsTmEnTsAs at 31 December 2020
Investments Currency
Quantity/Nominal
Value
Market Value USD
% of Net Assets
Transferable securities and money market instruments admitted to official exchange listing or dealt in on another regulated market
corporate Bonds (continued)
spainBanco Santander SA 5.179% 19/11/2025 USD 8,000,000 9,386,520 0.19 Banco Santander SA, Reg. S 3.125%
19/01/2027 EUR 11,000,000 15,435,858 0.30 CaixaBank SA, Reg. S, FRN 2.25%
17/04/2030 EUR 11,500,000 14,779,922 0.29 Grifols SA, Reg. S 2.25% 15/11/2027 EUR 4,800,000 5,985,602 0.12 IE2 Holdco SAU, Reg. S 2.875%
01/06/2026 EUR 8,000,000 11,170,199 0.22 Inmobiliaria Colonial Socimi SA, REIT,
Reg. S 1.45% 28/10/2024 EUR 4,500,000 5,767,648 0.11 Inmobiliaria Colonial Socimi SA, REIT,
Reg. S 2% 17/04/2026 EUR 4,700,000 6,214,389 0.12 Repsol International Finance BV, Reg. S,
FRN 4.5% 25/03/2075 EUR 4,500,000 6,070,758 0.12 Telefonica Europe BV, Reg. S, FRN 4.375%
Perpetual EUR 4,500,000 6,008,158 0.12 Telefonica Europe BV, Reg. S, FRN 5.875%
Perpetual EUR 2,100,000 2,903,221 0.06
83,722,275 1.65
supra-nationalBanque Ouest Africaine de Developpement,
Reg. S 4.7% 22/10/2031 USD 12,000,000 13,025,640 0.26
13,025,640 0.26
swedenIntrum AB, Reg. S 3.125% 15/07/2024 EUR 7,400,000 9,127,613 0.18
9,127,613 0.18
switzerlandSyngenta Finance NV, 144A 4.441%
24/04/2023 USD 6,000,000 6,300,596 0.13 UBS AG, Reg. S 5.125% 15/05/2024 USD 7,125,000 7,873,125 0.16
14,173,721 0.29
TurkeyEldorado Gold Corp., 144A 9.5%
01/06/2024 USD 6,069,000 6,713,194 0.13
6,713,194 0.13
United arab EmiratesDP World Crescent Ltd., Reg. S 3.875%
18/07/2029 USD 6,000,000 6,589,440 0.13 First Abu Dhabi Bank PJSC, Reg. S, FRN
1.18% 16/04/2022 USD 15,000,000 15,089,995 0.30 Galaxy Pipeline Assets Bidco Ltd., 144A
2.625% 31/03/2036 USD 14,375,000 14,958,492 0.29
36,637,927 0.72
United KingdomAviva plc, Reg. S, FRN 3.875%
03/07/2044 EUR 7,225,000 9,868,003 0.20 Barclays plc, Reg. S, FRN 3.375%
02/04/2025 EUR 5,800,000 7,857,374 0.16 BAT Capital Corp. 2.259% 25/03/2028 USD 7,875,000 8,179,063 0.16 BP Capital Markets plc, FRN 4.375%
Perpetual USD 6,150,000 6,557,437 0.13
schEDUlE of InVEsTmEnTsAs at 31 December 2020
Investments Currency
Quantity/Nominal
Value
Market Value USD
% of Net Assets
Transferable securities and money market instruments admitted to official exchange listing or dealt in on another regulated market
corporate Bonds (continued)
United Kingdom (continued)BP Capital Markets plc, FRN 4.875%
Perpetual USD 6,075,000 6,793,065 0.13 BP Capital Markets plc, Reg. S 2.274%
03/07/2026 GBP 5,000,000 7,473,636 0.15 HSBC Holdings plc, FRN 2.633%
07/11/2025 USD 8,500,000 9,052,995 0.18 HSBC Holdings plc 4.375% 23/11/2026 USD 5,000,000 5,771,059 0.11 Imperial Brands Finance plc, Reg. S
2.125% 12/02/2027 EUR 7,000,000 9,309,797 0.18 Lloyds Banking Group plc 4.375%
22/03/2028 USD 5,000,000 5,947,696 0.12 Lloyds Banking Group plc, Reg. S 2.25%
16/10/2024 GBP 6,000,000 8,604,972 0.17 Lloyds Banking Group plc, Reg. S, FRN
1.75% 07/09/2028 EUR 5,750,000 7,267,899 0.14 Lloyds Banking Group plc, Reg. S, FRN
4.947% Perpetual EUR 3,200,000 4,231,412 0.08 NGG Finance plc, Reg. S, FRN 5.625%
18/06/2073 GBP 5,000,000 7,834,889 0.16 Standard Chartered plc, FRN, 144A
4.644% 01/04/2031 USD 10,185,000 12,333,482 0.24
117,082,779 2.31
United states of americaAbbVie, Inc. 3.2% 21/11/2029 USD 12,700,000 14,318,991 0.28 Acrisure LLC, 144A 10.125% 01/08/2026 USD 1,920,000 2,207,693 0.04 Air Lease Corp. 2.25% 15/01/2023 USD 5,000,000 5,137,207 0.10 Air Lease Corp. 2.3% 01/02/2025 USD 10,725,000 11,105,723 0.22 Albertsons Cos., Inc. 5.75% 15/03/2025 USD 6,560,000 6,780,711 0.13 Allied Universal Holdco LLC, 144A 9.75%
15/07/2027 USD 2,400,000 2,608,176 0.05 American Axle & Manufacturing, Inc. 6.5%
01/04/2027 USD 12,800,000 13,488,000 0.27 American Greetings Corp., 144A 8.75%
15/04/2025 USD 2,000,000 1,977,290 0.04 Aramark Services, Inc., 144A 6.375%
01/05/2025 USD 3,340,000 3,590,734 0.07 Aramark Services, Inc. 4.75%
01/06/2026 USD 4,450,000 4,587,728 0.09 Arches Buyer, Inc., 144A 4.25%
01/06/2028 USD 7,480,000 7,606,225 0.15 AT&T, Inc. 1.8% 05/09/2026 EUR 4,000,000 5,353,370 0.11 AT&T, Inc. 2.9% 04/12/2026 GBP 5,000,000 7,584,997 0.15 AT&T, Inc. 2.25% 01/02/2032 USD 13,675,000 13,885,486 0.27 Aviation Capital Group LLC, 144A 0.884%
30/07/2021 USD 8,450,000 8,371,853 0.17 Avis Budget Car Rental LLC, 144A 5.75%
15/07/2027 USD 2,500,000 2,542,188 0.05 Avis Budget Finance plc, Reg. S 4.75%
30/01/2026 EUR 6,300,000 7,582,857 0.15 Banff Merger Sub, Inc., 144A 9.75%
01/09/2026 USD 2,175,000 2,345,955 0.05 Bank of America Corp., FRN 2.592%
29/04/2031 USD 4,000,000 4,285,002 0.08 Bank of America Corp. 4.25%
22/10/2026 USD 17,425,000 20,434,794 0.40 Bausch Health Americas, Inc., 144A 8.5%
31/01/2027 USD 2,250,000 2,505,566 0.05 Bausch Health Cos., Inc., 144A 6.125%
15/04/2025 USD 8,000,000 8,228,000 0.16 Berry Global, Inc., 144A 4.5%
15/02/2026 USD 6,800,000 6,965,750 0.14 Blackboard, Inc., 144A 10.375%
15/11/2024 USD 1,650,000 1,737,656 0.03 Boeing Co. (The) 2.7% 01/02/2027 USD 9,425,000 9,803,777 0.19
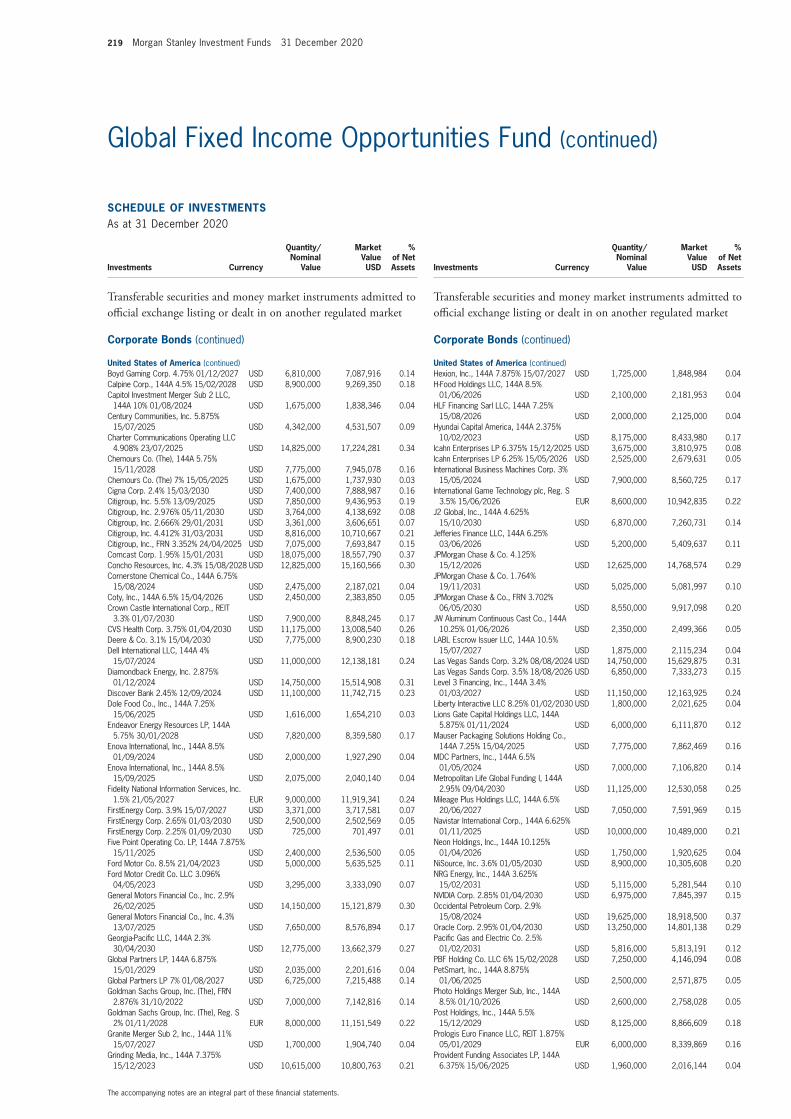
219 Morgan Stanley Investment Funds 31 December 2020
The accompanying notes are an integral part of these financial statements.
Global Fixed Income Opportunities Fund (continued)
schEDUlE of InVEsTmEnTsAs at 31 December 2020
Investments Currency
Quantity/Nominal
Value
Market Value USD
% of Net Assets
Transferable securities and money market instruments admitted to official exchange listing or dealt in on another regulated market
corporate Bonds (continued)
United states of america (continued)Boyd Gaming Corp. 4.75% 01/12/2027 USD 6,810,000 7,087,916 0.14 Calpine Corp., 144A 4.5% 15/02/2028 USD 8,900,000 9,269,350 0.18 Capitol Investment Merger Sub 2 LLC,
144A 10% 01/08/2024 USD 1,675,000 1,838,346 0.04 Century Communities, Inc. 5.875%
15/07/2025 USD 4,342,000 4,531,507 0.09 Charter Communications Operating LLC
4.908% 23/07/2025 USD 14,825,000 17,224,281 0.34 Chemours Co. (The), 144A 5.75%
15/11/2028 USD 7,775,000 7,945,078 0.16 Chemours Co. (The) 7% 15/05/2025 USD 1,675,000 1,737,930 0.03 Cigna Corp. 2.4% 15/03/2030 USD 7,400,000 7,888,987 0.16 Citigroup, Inc. 5.5% 13/09/2025 USD 7,850,000 9,436,953 0.19 Citigroup, Inc. 2.976% 05/11/2030 USD 3,764,000 4,138,692 0.08 Citigroup, Inc. 2.666% 29/01/2031 USD 3,361,000 3,606,651 0.07 Citigroup, Inc. 4.412% 31/03/2031 USD 8,816,000 10,710,667 0.21 Citigroup, Inc., FRN 3.352% 24/04/2025 USD 7,075,000 7,693,847 0.15 Comcast Corp. 1.95% 15/01/2031 USD 18,075,000 18,557,790 0.37 Concho Resources, Inc. 4.3% 15/08/2028 USD 12,825,000 15,160,566 0.30 Cornerstone Chemical Co., 144A 6.75%
15/08/2024 USD 2,475,000 2,187,021 0.04 Coty, Inc., 144A 6.5% 15/04/2026 USD 2,450,000 2,383,850 0.05 Crown Castle International Corp., REIT
3.3% 01/07/2030 USD 7,900,000 8,848,245 0.17 CVS Health Corp. 3.75% 01/04/2030 USD 11,175,000 13,008,540 0.26 Deere & Co. 3.1% 15/04/2030 USD 7,775,000 8,900,230 0.18 Dell International LLC, 144A 4%
15/07/2024 USD 11,000,000 12,138,181 0.24 Diamondback Energy, Inc. 2.875%
01/12/2024 USD 14,750,000 15,514,908 0.31 Discover Bank 2.45% 12/09/2024 USD 11,100,000 11,742,715 0.23 Dole Food Co., Inc., 144A 7.25%
15/06/2025 USD 1,616,000 1,654,210 0.03 Endeavor Energy Resources LP, 144A
5.75% 30/01/2028 USD 7,820,000 8,359,580 0.17 Enova International, Inc., 144A 8.5%
01/09/2024 USD 2,000,000 1,927,290 0.04 Enova International, Inc., 144A 8.5%
15/09/2025 USD 2,075,000 2,040,140 0.04 Fidelity National Information Services, Inc.
1.5% 21/05/2027 EUR 9,000,000 11,919,341 0.24 FirstEnergy Corp. 3.9% 15/07/2027 USD 3,371,000 3,717,581 0.07 FirstEnergy Corp. 2.65% 01/03/2030 USD 2,500,000 2,502,569 0.05 FirstEnergy Corp. 2.25% 01/09/2030 USD 725,000 701,497 0.01 Five Point Operating Co. LP, 144A 7.875%
15/11/2025 USD 2,400,000 2,536,500 0.05 Ford Motor Co. 8.5% 21/04/2023 USD 5,000,000 5,635,525 0.11 Ford Motor Credit Co. LLC 3.096%
04/05/2023 USD 3,295,000 3,333,090 0.07 General Motors Financial Co., Inc. 2.9%
26/02/2025 USD 14,150,000 15,121,879 0.30 General Motors Financial Co., Inc. 4.3%
13/07/2025 USD 7,650,000 8,576,894 0.17 Georgia‑Pacific LLC, 144A 2.3%
30/04/2030 USD 12,775,000 13,662,379 0.27 Global Partners LP, 144A 6.875%
15/01/2029 USD 2,035,000 2,201,616 0.04 Global Partners LP 7% 01/08/2027 USD 6,725,000 7,215,488 0.14 Goldman Sachs Group, Inc. (The), FRN
2.876% 31/10/2022 USD 7,000,000 7,142,816 0.14 Goldman Sachs Group, Inc. (The), Reg. S
2% 01/11/2028 EUR 8,000,000 11,151,549 0.22 Granite Merger Sub 2, Inc., 144A 11%
15/07/2027 USD 1,700,000 1,904,740 0.04 Grinding Media, Inc., 144A 7.375%
15/12/2023 USD 10,615,000 10,800,763 0.21
schEDUlE of InVEsTmEnTsAs at 31 December 2020
Investments Currency
Quantity/Nominal
Value
Market Value USD
% of Net Assets
Transferable securities and money market instruments admitted to official exchange listing or dealt in on another regulated market
corporate Bonds (continued)
United states of america (continued)Hexion, Inc., 144A 7.875% 15/07/2027 USD 1,725,000 1,848,984 0.04 H‑Food Holdings LLC, 144A 8.5%
01/06/2026 USD 2,100,000 2,181,953 0.04 HLF Financing Sarl LLC, 144A 7.25%
15/08/2026 USD 2,000,000 2,125,000 0.04 Hyundai Capital America, 144A 2.375%
10/02/2023 USD 8,175,000 8,433,980 0.17 Icahn Enterprises LP 6.375% 15/12/2025 USD 3,675,000 3,810,975 0.08 Icahn Enterprises LP 6.25% 15/05/2026 USD 2,525,000 2,679,631 0.05 International Business Machines Corp. 3%
15/05/2024 USD 7,900,000 8,560,725 0.17 International Game Technology plc, Reg. S
3.5% 15/06/2026 EUR 8,600,000 10,942,835 0.22 J2 Global, Inc., 144A 4.625%
15/10/2030 USD 6,870,000 7,260,731 0.14 Jefferies Finance LLC, 144A 6.25%
03/06/2026 USD 5,200,000 5,409,637 0.11 JPMorgan Chase & Co. 4.125%
15/12/2026 USD 12,625,000 14,768,574 0.29 JPMorgan Chase & Co. 1.764%
19/11/2031 USD 5,025,000 5,081,997 0.10 JPMorgan Chase & Co., FRN 3.702%
06/05/2030 USD 8,550,000 9,917,098 0.20 JW Aluminum Continuous Cast Co., 144A
10.25% 01/06/2026 USD 2,350,000 2,499,366 0.05 LABL Escrow Issuer LLC, 144A 10.5%
15/07/2027 USD 1,875,000 2,115,234 0.04 Las Vegas Sands Corp. 3.2% 08/08/2024 USD 14,750,000 15,629,875 0.31 Las Vegas Sands Corp. 3.5% 18/08/2026 USD 6,850,000 7,333,273 0.15 Level 3 Financing, Inc., 144A 3.4%
01/03/2027 USD 11,150,000 12,163,925 0.24 Liberty Interactive LLC 8.25% 01/02/2030 USD 1,800,000 2,021,625 0.04 Lions Gate Capital Holdings LLC, 144A
5.875% 01/11/2024 USD 6,000,000 6,111,870 0.12 Mauser Packaging Solutions Holding Co.,
144A 7.25% 15/04/2025 USD 7,775,000 7,862,469 0.16 MDC Partners, Inc., 144A 6.5%
01/05/2024 USD 7,000,000 7,106,820 0.14 Metropolitan Life Global Funding I, 144A
2.95% 09/04/2030 USD 11,125,000 12,530,058 0.25 Mileage Plus Holdings LLC, 144A 6.5%
20/06/2027 USD 7,050,000 7,591,969 0.15 Navistar International Corp., 144A 6.625%
01/11/2025 USD 10,000,000 10,489,000 0.21 Neon Holdings, Inc., 144A 10.125%
01/04/2026 USD 1,750,000 1,920,625 0.04 NiSource, Inc. 3.6% 01/05/2030 USD 8,900,000 10,305,608 0.20 NRG Energy, Inc., 144A 3.625%
15/02/2031 USD 5,115,000 5,281,544 0.10 NVIDIA Corp. 2.85% 01/04/2030 USD 6,975,000 7,845,397 0.15 Occidental Petroleum Corp. 2.9%
15/08/2024 USD 19,625,000 18,918,500 0.37 Oracle Corp. 2.95% 01/04/2030 USD 13,250,000 14,801,138 0.29 Pacific Gas and Electric Co. 2.5%
01/02/2031 USD 5,816,000 5,813,191 0.12 PBF Holding Co. LLC 6% 15/02/2028 USD 7,250,000 4,146,094 0.08 PetSmart, Inc., 144A 8.875%
01/06/2025 USD 2,500,000 2,571,875 0.05 Photo Holdings Merger Sub, Inc., 144A
8.5% 01/10/2026 USD 2,600,000 2,758,028 0.05 Post Holdings, Inc., 144A 5.5%
15/12/2029 USD 8,125,000 8,866,609 0.18 Prologis Euro Finance LLC, REIT 1.875%
05/01/2029 EUR 6,000,000 8,339,869 0.16 Provident Funding Associates LP, 144A
6.375% 15/06/2025 USD 1,960,000 2,016,144 0.04

Morgan Stanley Investment Funds 31 December 2020 220
The accompanying notes are an integral part of these financial statements.
Global Fixed Income Opportunities Fund (continued)
schEDUlE of InVEsTmEnTsAs at 31 December 2020
Investments Currency
Quantity/Nominal
Value
Market Value USD
% of Net Assets
Transferable securities and money market instruments admitted to official exchange listing or dealt in on another regulated market
corporate Bonds (continued)
United states of america (continued)Quicken Loans LLC, 144A 3.875%
01/03/2031 USD 7,430,000 7,727,200 0.15 Radiology Partners, Inc., 144A 9.25%
01/02/2028 USD 2,150,000 2,418,750 0.05 Rain CII Carbon LLC, 144A 7.25%
01/04/2025 USD 2,325,000 2,367,117 0.05 Resorts World Las Vegas LLC, 144A
4.625% 16/04/2029 USD 18,270,000 18,792,686 0.37 Rite Aid Corp. 7.7% 15/02/2027 USD 3,050,000 2,912,750 0.06 Rockies Express Pipeline LLC, 144A 3.6%
15/05/2025 USD 11,600,000 11,979,552 0.24 Select Medical Corp., 144A 6.25%
15/08/2026 USD 9,920,000 10,664,397 0.21 Sotheby’s, 144A 7.375% 15/10/2027 USD 8,200,000 8,798,108 0.17 Sprint Spectrum Co. LLC, 144A 4.738%
20/09/2029 USD 9,500,000 10,319,043 0.20 Sprint Spectrum Co. LLC, 144A 3.36%
20/03/2023 USD 1,687,500 1,706,003 0.03 TEGNA, Inc., 144A 4.625% 15/03/2028 USD 7,175,000 7,394,734 0.15 Thermo Fisher Scientific, Inc. 0.875%
01/10/2031 EUR 13,000,000 16,857,628 0.33 T‑Mobile USA, Inc., 144A 2.25%
15/11/2031 USD 7,700,000 7,917,256 0.16 TPro Acquisition Corp., 144A 11%
15/10/2024 USD 2,090,000 2,246,750 0.04 Trident TPI Holdings, Inc., 144A 6.625%
01/11/2025 USD 2,055,000 2,093,315 0.04 Triumph Group, Inc., 144A 6.25%
15/09/2024 USD 2,700,000 2,683,125 0.05 Uniti Group LP, REIT, 144A 7.125%
15/12/2024 USD 2,500,000 2,510,938 0.05 Upjohn Finance BV, Reg. S 1.362%
23/06/2027 EUR 8,100,000 10,546,701 0.21 US Renal Care, Inc., 144A 10.625%
15/07/2027 USD 2,000,000 2,215,000 0.04 Veritas US, Inc., 144A 7.5% 01/02/2023 USD 2,000,000 2,008,550 0.04 Verizon Communications, Inc. 1.125%
03/11/2028 GBP 7,500,000 10,424,407 0.21 Vista Outdoor, Inc. 5.875% 01/10/2023 USD 2,500,000 2,534,112 0.05 Wells Fargo & Co., FRN 2.879%
30/10/2030 USD 6,975,000 7,608,674 0.15 Wells Fargo & Co., FRN 5.013%
04/04/2051 USD 7,000,000 9,941,651 0.20 Werner FinCo. LP, 144A 8.75%
15/07/2025 USD 1,260,000 1,340,193 0.03 Wolverine World Wide, Inc., 144A 5%
01/09/2026 USD 2,866,000 2,932,276 0.06
937,696,569 18.52
ZambiaFirst Quantum Minerals Ltd., 144A 6.875%
15/10/2027 USD 10,270,000 11,133,194 0.22
11,133,194 0.22
Total corporate Bonds 2,000,098,821 39.50
schEDUlE of InVEsTmEnTsAs at 31 December 2020
Investments Currency
Quantity/Nominal
Value
Market Value USD
% of Net Assets
Transferable securities and money market instruments admitted to official exchange listing or dealt in on another regulated market
Government Bonds
australiaAustralia Government Bond, Reg. S 3.25%
21/04/2029 AUD 17,000,000 15,721,250 0.31 Australia Government Bond, Reg. S 2.75%
21/11/2029 AUD 29,000,000 26,010,847 0.51 Australia Government Bond, Reg. S 2.5%
21/05/2030 AUD 29,000,000 25,586,439 0.51 Australia Government Bond, Reg. S 1%
21/12/2030 AUD 52,000,000 40,243,184 0.80
107,561,720 2.13
austriaAustria Government Bond, Reg. S, 144A
2.1% 20/09/2117 EUR 2,000,000 5,498,629 0.11 Austria Government Bond, Reg. S, 144A
0.85% 30/06/2120 EUR 7,200,000 11,681,041 0.23
17,179,670 0.34
BelarusBelarus Government Bond, Reg. S 6.378%
24/02/2031 USD 8,000,000 8,153,840 0.16
8,153,840 0.16
BrazilBrazil Government Bond 3.875%
12/06/2030 USD 10,000,000 10,557,500 0.21 Brazil Notas do Tesouro Nacional 10%
01/01/2025 BRL 21,450,000 47,820,176 0.94
58,377,676 1.15
chinaChina Government Bond 2.36%
02/07/2023 CNY 245,000,000 37,069,195 0.73
37,069,195 0.73
croatiaCroatia Government Bond, Reg. S 1.125%
19/06/2029 EUR 8,000,000 10,347,511 0.21 Croatia Government Bond, Reg. S 2.75%
27/01/2030 EUR 7,000,000 10,289,119 0.20
20,636,630 0.41
Dominican RepublicDominican Republic Government Bond,
Reg. S 4.875% 23/09/2032 USD 2,000,000 2,225,020 0.04 Dominican Republic Government Bond,
Reg. S 5.875% 30/01/2060 USD 15,000,000 16,537,650 0.33
18,762,670 0.37

221 Morgan Stanley Investment Funds 31 December 2020
The accompanying notes are an integral part of these financial statements.
Global Fixed Income Opportunities Fund (continued)
schEDUlE of InVEsTmEnTsAs at 31 December 2020
Investments Currency
Quantity/Nominal
Value
Market Value USD
% of Net Assets
Transferable securities and money market instruments admitted to official exchange listing or dealt in on another regulated market
Government Bonds (continued)
EcuadorEcuador Government Bond, Reg. S 0.5%
31/07/2030 USD 1,341,900 862,184 0.01 Ecuador Government Bond, Reg. S 0.5%
31/07/2035 USD 4,641,880 2,535,673 0.05 Ecuador Government Bond, Reg. S 0.5%
31/07/2040 USD 4,650,000 2,383,172 0.05
5,781,029 0.11
EgyptEgypt Government Bond, Reg. S 5.25%
06/10/2025 USD 7,000,000 7,463,008 0.15 Egypt Government Bond, Reg. S 4.75%
16/04/2026 EUR 12,000,000 15,327,479 0.30 Egypt Government Bond, Reg. S 6.375%
11/04/2031 EUR 7,000,000 9,274,077 0.18 Egypt Government Bond, Reg. S 8.875%
29/05/2050 USD 3,000,000 3,529,140 0.07 Egypt Government Bond, Reg. S 8.15%
20/11/2059 USD 4,000,000 4,416,088 0.09 Egypt Treasury Bill 0% 02/03/2021 EGP 211,000,000 13,140,847 0.26 Egypt Treasury Bill 0% 06/04/2021 EGP 83,000,000 5,108,961 0.10 Egypt Treasury Bill 0% 18/05/2021 EGP 106,000,000 6,433,846 0.13
64,693,446 1.28
El salvadorEl Salvador Government Bond, Reg. S
7.125% 20/01/2050 USD 10,000,000 8,975,000 0.18
8,975,000 0.18
GreeceGreece Government Bond, Reg. S, 144A
1.5% 18/06/2030 EUR 8,000,000 10,607,666 0.21
10,607,666 0.21
IndonesiaIndonesia Government Bond 1.75%
24/04/2025 EUR 13,000,000 16,879,267 0.33 Indonesia Government Bond 1.45%
18/09/2026 EUR 9,000,000 11,606,067 0.23 Indonesia Government Bond 4.2%
15/10/2050 USD 7,000,000 8,399,399 0.16 Indonesia Treasury 8.25% 15/05/2029 IDR258,000,000,000 21,109,981 0.42 Indonesia Treasury 7% 15/09/2030 IDR505,500,000,000 38,866,696 0.77 Indonesia Treasury 8.375% 15/03/2034 IDR230,672,000,000 19,105,661 0.38
115,967,071 2.29
ItalyItaly Buoni Poliennali Del Tesoro, Reg. S,
144A 1.8% 01/03/2041 EUR 21,000,000 28,515,923 0.56
28,515,923 0.56
schEDUlE of InVEsTmEnTsAs at 31 December 2020
Investments Currency
Quantity/Nominal
Value
Market Value USD
% of Net Assets
Transferable securities and money market instruments admitted to official exchange listing or dealt in on another regulated market
Government Bonds (continued)
JamaicaJamaica Government Bond 8%
15/03/2039 USD 9,000,000 13,140,090 0.26
13,140,090 0.26
mexicoMexican Bonos 8.5% 31/05/2029 MXN 803,000,000 49,319,358 0.98 Mexican Bonos 7.75% 29/05/2031 MXN 694,000,000 41,087,766 0.81
90,407,124 1.79
moroccoMorocco Government Bond, Reg. S 4%
15/12/2050 USD 8,000,000 8,274,200 0.16
8,274,200 0.16
new ZealandNew Zealand Government Bond 0.25%
15/05/2028 NZD 21,000,000 14,657,633 0.29 New Zealand Government Bond 1.75%
15/05/2041 NZD 10,000,000 7,130,606 0.14
21,788,239 0.43
nigeriaNigeria Government Bond, Reg. S 9.248%
21/01/2049 USD 9,000,000 10,601,622 0.21
10,601,622 0.21
ParaguayParaguay Government Bond, Reg. S 4.95%
28/04/2031 USD 4,000,000 4,855,040 0.10
4,855,040 0.10
QatarQatar Government Bond, Reg. S 3.75%
16/04/2030 USD 6,000,000 7,071,540 0.14 Qatar Government Bond, Reg. S 5.103%
23/04/2048 USD 8,000,000 11,269,904 0.22
18,341,444 0.36
RussiaRussian Foreign Bond ‑ Eurobond, Reg. S
5.625% 04/04/2042 USD 11,000,000 15,325,211 0.30
15,325,211 0.30
senegalSenegal Government Bond, Reg. S 6.25%
23/05/2033 USD 9,000,000 10,130,004 0.20
10,130,004 0.20

Morgan Stanley Investment Funds 31 December 2020 222
The accompanying notes are an integral part of these financial statements.
Global Fixed Income Opportunities Fund (continued)
schEDUlE of InVEsTmEnTsAs at 31 December 2020
Investments Currency
Quantity/Nominal
Value
Market Value USD
% of Net Assets
Transferable securities and money market instruments admitted to official exchange listing or dealt in on another regulated market
Government Bonds (continued)
serbiaSerbia Government Bond, Reg. S 3.125%
15/05/2027 EUR 8,000,000 11,048,349 0.22
11,048,349 0.22
south africaSouth Africa Government Bond 8%
31/01/2030 ZAR 914,000,000 59,568,192 1.18 South Africa Government Bond 8.25%
31/03/2032 ZAR 225,528,486 13,876,771 0.27
73,444,963 1.45
United arab EmiratesAbu Dhabi Government Bond, Reg. S 2.7%
02/09/2070 USD 8,000,000 7,489,840 0.15
7,489,840 0.15
United states of americaUS Treasury 2.125% 15/05/2025 USD 138,000,000 148,953,750 2.94 US Treasury 3.125% 15/05/2048 USD 33,000,000 44,234,180 0.88 US Treasury Bill 0% 21/01/2021 USD 37,000,000 36,999,056 0.73 US Treasury Bill 0% 23/02/2021 USD 120,000,000 119,989,200 2.37 US Treasury Bill 0% 11/03/2021 USD 9,000,000 8,998,666 0.18
359,174,852 7.10
UzbekistanUzbekistan Government Bond, Reg. S
3.7% 25/11/2030 USD 5,000,000 5,286,050 0.10
5,286,050 0.10
Total Government Bonds 1,151,588,564 22.75
mortgage and asset Backed securities
cayman IslandsECAF I Ltd., Series 2015‑1A ‘A2’, 144A
4.947% 15/06/2040 USD 10,200,956 9,298,633 0.18 Falcon Aerospace Ltd., Series 2019‑1 ‘A’,
144A 3.597% 15/09/2039 USD 3,337,772 3,212,879 0.06 GAIA Aviation Ltd., STEP, Series 2019‑1
‘A’, 144A 3.967% 15/12/2044 USD 7,500,815 6,926,351 0.14 JOL Air Ltd., Series 2019‑1 ‘B’, 144A
4.948% 15/04/2044 USD 1,142,413 938,337 0.02 Project Silver, Series 2019‑1 ‘A’, 144A
3.967% 15/07/2044 USD 5,543,686 5,371,757 0.11
25,747,957 0.51
European communityArrow CMBS DAC, Reg. S, FRN, Series
2018‑1 ‘C’ 2.05% 22/05/2030 EUR 4,081,749 4,931,157 0.10 Eurohome Mortgages plc, Reg. S, FRN,
Series 2007‑1 ‘A’ 0% 02/08/2050 EUR 4,933,442 5,468,163 0.11
10,399,320 0.21
schEDUlE of InVEsTmEnTsAs at 31 December 2020
Investments Currency
Quantity/Nominal
Value
Market Value USD
% of Net Assets
Transferable securities and money market instruments admitted to official exchange listing or dealt in on another regulated market
mortgage and asset Backed securities (continued)
finlandTaurus FIN DAC, Reg. S, FRN,
Series 2019‑FIN4 ‘C’ 2.3% 18/11/2031 EUR 3,000,000 3,449,079 0.07 Taurus FIN DAC, Reg. S, FRN,
Series 2019‑FIN4 ‘D’ 3% 18/11/2031 EUR 5,840,000 6,815,386 0.13
10,264,465 0.20
franceRiver Green Finance 2020 DAC, Reg. S,
FRN, Series 2020‑1 ‘D’ 1.8% 22/01/2032 EUR 3,970,000 4,731,969 0.09
4,731,969 0.09
GermanyE‑Mac DE BV, Reg. S, FRN, Series DE05‑I
‘C’ 7.643% 25/05/2052 EUR 2,500,000 2,759,416 0.05 E‑Mac DE BV, Reg. S, FRN, Series DE06‑I
‘B’ 3.263% 25/05/2057 EUR 3,776,484 4,522,601 0.09 E‑Mac DE BV, Reg. S, FRN, Series DE06‑II
‘C’ 4.513% 25/02/2058 EUR 3,500,000 3,343,543 0.07
10,625,560 0.21
IrelandDilosk RMBS No. 2 DAC, Reg. S, FRN,
Series 2 ‘D’ 1.792% 20/12/2057 EUR 2,300,000 2,838,445 0.06 Dilosk RMBS No. DAC, Reg. S, FRN,
Series 2 ‘C’ 1.492% 20/12/2057 EUR 1,850,000 2,287,728 0.04 European Residential Loan Securitisation
DAC, Reg. S, FRN, Series 2019‑NPL1 ‘A’ 1.426% 24/07/2054 EUR 6,489,542 7,875,418 0.16
European Residential Loan Securitisation DAC, Reg. S, FRN, Series 2019‑NPL2 ‘A’ 0.926% 24/02/2058 EUR 6,987,563 8,433,516 0.17
Jepson DAC, Reg. S ‘B’ 0.676% 24/11/2057 EUR 2,500,000 3,075,623 0.06
Lansdowne Mortgage Securities No. 1 plc, Reg. S, FRN, Series 1 ‘A2’ 0% 15/06/2045 EUR 3,144,500 3,555,594 0.07
Lansdowne Mortgage Securities No. 2 plc, Reg. S, FRN, Series 2 ‘A2’ 0% 16/09/2048 EUR 7,322,400 7,736,247 0.15
Pembroke Property Finance DAC, Reg. S, FRN, Series 1 ‘A’ 0.723% 01/06/2037 EUR 1,740,059 2,113,684 0.04
37,916,255 0.75
ItalyDECO 2019‑Vivaldi Srl, Reg. S, FRN,
Series 2019‑VIVA ‘A’ 1.9% 22/08/2031 EUR 5,400,000 6,191,978 0.12 Emerald Italy Srl, Reg. S, FRN,
Series 2019‑IT ‘A’ 2.1% 24/09/2030 EUR 8,788,751 9,416,339 0.19 Emerald Italy Srl, Reg. S, FRN,
Series 2019‑IT ‘B’ 3.1% 24/09/2030 EUR 987,500 1,053,916 0.02 Taurus IT SRL, FRN, Series 2018‑IT1 ‘C’
2.1% 18/05/2030 EUR 492,695 552,617 0.01 Taurus IT SRL, FRN, Series 2018‑IT1 ‘D’
3.35% 18/05/2030 EUR 492,695 550,900 0.01
17,765,750 0.35
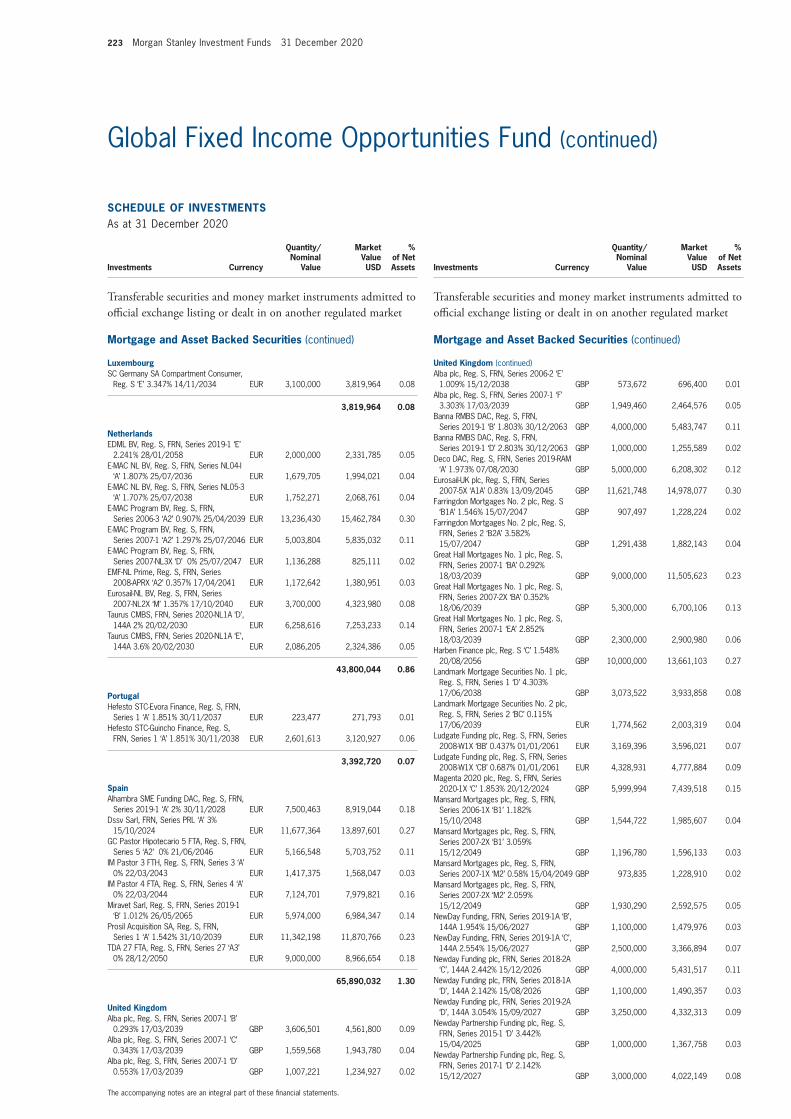
223 Morgan Stanley Investment Funds 31 December 2020
The accompanying notes are an integral part of these financial statements.
Global Fixed Income Opportunities Fund (continued)
schEDUlE of InVEsTmEnTsAs at 31 December 2020
Investments Currency
Quantity/Nominal
Value
Market Value USD
% of Net Assets
Transferable securities and money market instruments admitted to official exchange listing or dealt in on another regulated market
mortgage and asset Backed securities (continued)
luxembourgSC Germany SA Compartment Consumer,
Reg. S ‘E’ 3.347% 14/11/2034 EUR 3,100,000 3,819,964 0.08
3,819,964 0.08
netherlandsEDML BV, Reg. S, FRN, Series 2019‑1 ‘E’
2.241% 28/01/2058 EUR 2,000,000 2,331,785 0.05 E‑MAC NL BV, Reg. S, FRN, Series NL04‑I
‘A’ 1.807% 25/07/2036 EUR 1,679,705 1,994,021 0.04 E‑MAC NL BV, Reg. S, FRN, Series NL05‑3
‘A’ 1.707% 25/07/2038 EUR 1,752,271 2,068,761 0.04 E‑MAC Program BV, Reg. S, FRN,
Series 2006‑3 ‘A2’ 0.907% 25/04/2039 EUR 13,236,430 15,462,784 0.30 E‑MAC Program BV, Reg. S, FRN,
Series 2007‑1 ‘A2’ 1.297% 25/07/2046 EUR 5,003,804 5,835,032 0.11 E‑MAC Program BV, Reg. S, FRN,
Series 2007‑NL3X ‘D’ 0% 25/07/2047 EUR 1,136,288 825,111 0.02 EMF‑NL Prime, Reg. S, FRN, Series
2008‑APRX ‘A2’ 0.357% 17/04/2041 EUR 1,172,642 1,380,951 0.03 Eurosail‑NL BV, Reg. S, FRN, Series
2007‑NL2X ‘M’ 1.357% 17/10/2040 EUR 3,700,000 4,323,980 0.08 Taurus CMBS, FRN, Series 2020‑NL1A ‘D’,
144A 2% 20/02/2030 EUR 6,258,616 7,253,233 0.14 Taurus CMBS, FRN, Series 2020‑NL1A ‘E’,
144A 3.6% 20/02/2030 EUR 2,086,205 2,324,386 0.05
43,800,044 0.86
PortugalHefesto STC‑Evora Finance, Reg. S, FRN,
Series 1 ‘A’ 1.851% 30/11/2037 EUR 223,477 271,793 0.01 Hefesto STC‑Guincho Finance, Reg. S,
FRN, Series 1 ‘A’ 1.851% 30/11/2038 EUR 2,601,613 3,120,927 0.06
3,392,720 0.07
spainAlhambra SME Funding DAC, Reg. S, FRN,
Series 2019‑1 ‘A’ 2% 30/11/2028 EUR 7,500,463 8,919,044 0.18 Dssv Sarl, FRN, Series PRL ‘A’ 3%
15/10/2024 EUR 11,677,364 13,897,601 0.27 GC Pastor Hipotecario 5 FTA, Reg. S, FRN,
Series 5 ‘A2’ 0% 21/06/2046 EUR 5,166,548 5,703,752 0.11 IM Pastor 3 FTH, Reg. S, FRN, Series 3 ‘A’
0% 22/03/2043 EUR 1,417,375 1,568,047 0.03 IM Pastor 4 FTA, Reg. S, FRN, Series 4 ‘A’
0% 22/03/2044 EUR 7,124,701 7,979,821 0.16 Miravet Sarl, Reg. S, FRN, Series 2019‑1
‘B’ 1.012% 26/05/2065 EUR 5,974,000 6,984,347 0.14 Prosil Acquisition SA, Reg. S, FRN,
Series 1 ‘A’ 1.542% 31/10/2039 EUR 11,342,198 11,870,766 0.23 TDA 27 FTA, Reg. S, FRN, Series 27 ‘A3’
0% 28/12/2050 EUR 9,000,000 8,966,654 0.18
65,890,032 1.30
United KingdomAlba plc, Reg. S, FRN, Series 2007‑1 ‘B’
0.293% 17/03/2039 GBP 3,606,501 4,561,800 0.09 Alba plc, Reg. S, FRN, Series 2007‑1 ‘C’
0.343% 17/03/2039 GBP 1,559,568 1,943,780 0.04 Alba plc, Reg. S, FRN, Series 2007‑1 ‘D’
0.553% 17/03/2039 GBP 1,007,221 1,234,927 0.02
schEDUlE of InVEsTmEnTsAs at 31 December 2020
Investments Currency
Quantity/Nominal
Value
Market Value USD
% of Net Assets
Transferable securities and money market instruments admitted to official exchange listing or dealt in on another regulated market
mortgage and asset Backed securities (continued)
United Kingdom (continued)Alba plc, Reg. S, FRN, Series 2006‑2 ‘E’
1.009% 15/12/2038 GBP 573,672 696,400 0.01 Alba plc, Reg. S, FRN, Series 2007‑1 ‘F’
3.303% 17/03/2039 GBP 1,949,460 2,464,576 0.05 Banna RMBS DAC, Reg. S, FRN,
Series 2019‑1 ‘B’ 1.803% 30/12/2063 GBP 4,000,000 5,483,747 0.11 Banna RMBS DAC, Reg. S, FRN,
Series 2019‑1 ‘D’ 2.803% 30/12/2063 GBP 1,000,000 1,255,589 0.02 Deco DAC, Reg. S, FRN, Series 2019‑RAM
‘A’ 1.973% 07/08/2030 GBP 5,000,000 6,208,302 0.12 Eurosail‑UK plc, Reg. S, FRN, Series
2007‑5X ‘A1A’ 0.83% 13/09/2045 GBP 11,621,748 14,978,077 0.30 Farringdon Mortgages No. 2 plc, Reg. S
‘B1A’ 1.546% 15/07/2047 GBP 907,497 1,228,224 0.02 Farringdon Mortgages No. 2 plc, Reg. S,
FRN, Series 2 ‘B2A’ 3.582% 15/07/2047 GBP 1,291,438 1,882,143 0.04
Great Hall Mortgages No. 1 plc, Reg. S, FRN, Series 2007‑1 ‘BA’ 0.292% 18/03/2039 GBP 9,000,000 11,505,623 0.23
Great Hall Mortgages No. 1 plc, Reg. S, FRN, Series 2007‑2X ‘BA’ 0.352% 18/06/2039 GBP 5,300,000 6,700,106 0.13
Great Hall Mortgages No. 1 plc, Reg. S, FRN, Series 2007‑1 ‘EA’ 2.852% 18/03/2039 GBP 2,300,000 2,900,980 0.06
Harben Finance plc, Reg. S ‘C’ 1.548% 20/08/2056 GBP 10,000,000 13,661,103 0.27
Landmark Mortgage Securities No. 1 plc, Reg. S, FRN, Series 1 ‘D’ 4.303% 17/06/2038 GBP 3,073,522 3,933,858 0.08
Landmark Mortgage Securities No. 2 plc, Reg. S, FRN, Series 2 ‘BC’ 0.115% 17/06/2039 EUR 1,774,562 2,003,319 0.04
Ludgate Funding plc, Reg. S, FRN, Series 2008‑W1X ‘BB’ 0.437% 01/01/2061 EUR 3,169,396 3,596,021 0.07
Ludgate Funding plc, Reg. S, FRN, Series 2008‑W1X ‘CB’ 0.687% 01/01/2061 EUR 4,328,931 4,777,884 0.09
Magenta 2020 plc, Reg. S, FRN, Series 2020‑1X ‘C’ 1.853% 20/12/2024 GBP 5,999,994 7,439,518 0.15
Mansard Mortgages plc, Reg. S, FRN, Series 2006‑1X ‘B1’ 1.182% 15/10/2048 GBP 1,544,722 1,985,607 0.04
Mansard Mortgages plc, Reg. S, FRN, Series 2007‑2X ‘B1’ 3.059% 15/12/2049 GBP 1,196,780 1,596,133 0.03
Mansard Mortgages plc, Reg. S, FRN, Series 2007‑1X ‘M2’ 0.58% 15/04/2049 GBP 973,835 1,228,910 0.02
Mansard Mortgages plc, Reg. S, FRN, Series 2007‑2X ‘M2’ 2.059% 15/12/2049 GBP 1,930,290 2,592,575 0.05
NewDay Funding, FRN, Series 2019‑1A ‘B’, 144A 1.954% 15/06/2027 GBP 1,100,000 1,479,976 0.03
NewDay Funding, FRN, Series 2019‑1A ‘C’, 144A 2.554% 15/06/2027 GBP 2,500,000 3,366,894 0.07
Newday Funding plc, FRN, Series 2018‑2A ‘C’, 144A 2.442% 15/12/2026 GBP 4,000,000 5,431,517 0.11
Newday Funding plc, FRN, Series 2018‑1A ‘D’, 144A 2.142% 15/08/2026 GBP 1,100,000 1,490,357 0.03
Newday Funding plc, FRN, Series 2019‑2A ‘D’, 144A 3.054% 15/09/2027 GBP 3,250,000 4,332,313 0.09
Newday Partnership Funding plc, Reg. S, FRN, Series 2015‑1 ‘D’ 3.442% 15/04/2025 GBP 1,000,000 1,367,758 0.03
Newday Partnership Funding plc, Reg. S, FRN, Series 2017‑1 ‘D’ 2.142% 15/12/2027 GBP 3,000,000 4,022,149 0.08
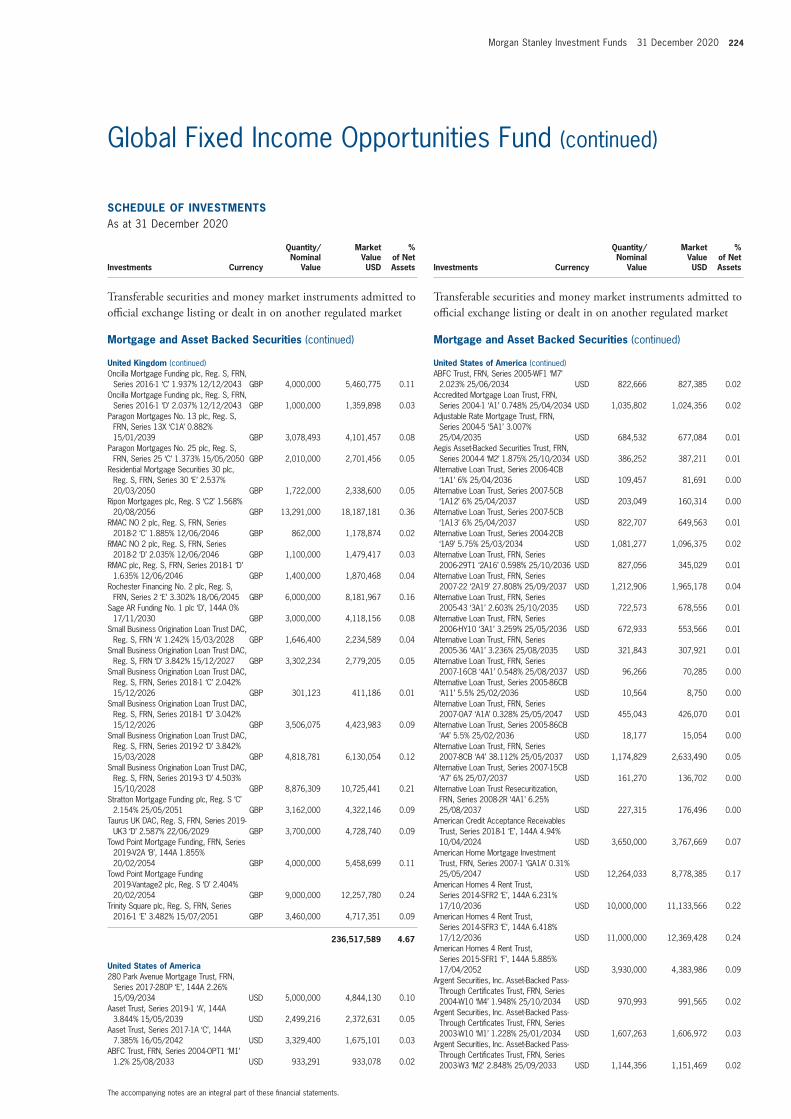
Morgan Stanley Investment Funds 31 December 2020 224
The accompanying notes are an integral part of these financial statements.
Global Fixed Income Opportunities Fund (continued)
schEDUlE of InVEsTmEnTsAs at 31 December 2020
Investments Currency
Quantity/Nominal
Value
Market Value USD
% of Net Assets
Transferable securities and money market instruments admitted to official exchange listing or dealt in on another regulated market
mortgage and asset Backed securities (continued)
United Kingdom (continued)Oncilla Mortgage Funding plc, Reg. S, FRN,
Series 2016‑1 ‘C’ 1.937% 12/12/2043 GBP 4,000,000 5,460,775 0.11 Oncilla Mortgage Funding plc, Reg. S, FRN,
Series 2016‑1 ‘D’ 2.037% 12/12/2043 GBP 1,000,000 1,359,898 0.03 Paragon Mortgages No. 13 plc, Reg. S,
FRN, Series 13X ‘C1A’ 0.882% 15/01/2039 GBP 3,078,493 4,101,457 0.08
Paragon Mortgages No. 25 plc, Reg. S, FRN, Series 25 ‘C’ 1.373% 15/05/2050 GBP 2,010,000 2,701,456 0.05
Residential Mortgage Securities 30 plc, Reg. S, FRN, Series 30 ‘E’ 2.537% 20/03/2050 GBP 1,722,000 2,338,600 0.05
Ripon Mortgages plc, Reg. S ‘C2’ 1.568% 20/08/2056 GBP 13,291,000 18,187,181 0.36
RMAC NO 2 plc, Reg. S, FRN, Series 2018‑2 ‘C’ 1.885% 12/06/2046 GBP 862,000 1,178,874 0.02
RMAC NO 2 plc, Reg. S, FRN, Series 2018‑2 ‘D’ 2.035% 12/06/2046 GBP 1,100,000 1,479,417 0.03
RMAC plc, Reg. S, FRN, Series 2018‑1 ‘D’ 1.635% 12/06/2046 GBP 1,400,000 1,870,468 0.04
Rochester Financing No. 2 plc, Reg. S, FRN, Series 2 ‘E’ 3.302% 18/06/2045 GBP 6,000,000 8,181,967 0.16
Sage AR Funding No. 1 plc ‘D’, 144A 0% 17/11/2030 GBP 3,000,000 4,118,156 0.08
Small Business Origination Loan Trust DAC, Reg. S, FRN ‘A’ 1.242% 15/03/2028 GBP 1,646,400 2,234,589 0.04
Small Business Origination Loan Trust DAC, Reg. S, FRN ‘D’ 3.842% 15/12/2027 GBP 3,302,234 2,779,205 0.05
Small Business Origination Loan Trust DAC, Reg. S, FRN, Series 2018‑1 ‘C’ 2.042% 15/12/2026 GBP 301,123 411,186 0.01
Small Business Origination Loan Trust DAC, Reg. S, FRN, Series 2018‑1 ‘D’ 3.042% 15/12/2026 GBP 3,506,075 4,423,983 0.09
Small Business Origination Loan Trust DAC, Reg. S, FRN, Series 2019‑2 ‘D’ 3.842% 15/03/2028 GBP 4,818,781 6,130,054 0.12
Small Business Origination Loan Trust DAC, Reg. S, FRN, Series 2019‑3 ‘D’ 4.503% 15/10/2028 GBP 8,876,309 10,725,441 0.21
Stratton Mortgage Funding plc, Reg. S ‘C’ 2.154% 25/05/2051 GBP 3,162,000 4,322,146 0.09
Taurus UK DAC, Reg. S, FRN, Series 2019‑UK3 ‘D’ 2.587% 22/06/2029 GBP 3,700,000 4,728,740 0.09
Towd Point Mortgage Funding, FRN, Series 2019‑V2A ‘B’, 144A 1.855% 20/02/2054 GBP 4,000,000 5,458,699 0.11
Towd Point Mortgage Funding 2019‑Vantage2 plc, Reg. S ‘D’ 2.404% 20/02/2054 GBP 9,000,000 12,257,780 0.24
Trinity Square plc, Reg. S, FRN, Series 2016‑1 ‘E’ 3.482% 15/07/2051 GBP 3,460,000 4,717,351 0.09
236,517,589 4.67
United states of america280 Park Avenue Mortgage Trust, FRN,
Series 2017‑280P ‘E’, 144A 2.26% 15/09/2034 USD 5,000,000 4,844,130 0.10
Aaset Trust, Series 2019‑1 ‘A’, 144A 3.844% 15/05/2039 USD 2,499,216 2,372,631 0.05
Aaset Trust, Series 2017‑1A ‘C’, 144A 7.385% 16/05/2042 USD 3,329,400 1,675,101 0.03
ABFC Trust, FRN, Series 2004‑OPT1 ‘M1’ 1.2% 25/08/2033 USD 933,291 933,078 0.02
schEDUlE of InVEsTmEnTsAs at 31 December 2020
Investments Currency
Quantity/Nominal
Value
Market Value USD
% of Net Assets
Transferable securities and money market instruments admitted to official exchange listing or dealt in on another regulated market
mortgage and asset Backed securities (continued)
United states of america (continued)ABFC Trust, FRN, Series 2005‑WF1 ‘M7’
2.023% 25/06/2034 USD 822,666 827,385 0.02 Accredited Mortgage Loan Trust, FRN,
Series 2004‑1 ‘A1’ 0.748% 25/04/2034 USD 1,035,802 1,024,356 0.02 Adjustable Rate Mortgage Trust, FRN,
Series 2004‑5 ‘5A1’ 3.007% 25/04/2035 USD 684,532 677,084 0.01
Aegis Asset‑Backed Securities Trust, FRN, Series 2004‑4 ‘M2’ 1.875% 25/10/2034 USD 386,252 387,211 0.01
Alternative Loan Trust, Series 2006‑4CB ‘1A1’ 6% 25/04/2036 USD 109,457 81,691 0.00
Alternative Loan Trust, Series 2007‑5CB ‘1A12’ 6% 25/04/2037 USD 203,049 160,314 0.00
Alternative Loan Trust, Series 2007‑5CB ‘1A13’ 6% 25/04/2037 USD 822,707 649,563 0.01
Alternative Loan Trust, Series 2004‑2CB ‘1A9’ 5.75% 25/03/2034 USD 1,081,277 1,096,375 0.02
Alternative Loan Trust, FRN, Series 2006‑29T1 ‘2A16’ 0.598% 25/10/2036 USD 827,056 345,029 0.01
Alternative Loan Trust, FRN, Series 2007‑22 ‘2A19’ 27.808% 25/09/2037 USD 1,212,906 1,965,178 0.04
Alternative Loan Trust, FRN, Series 2005‑43 ‘3A1’ 2.603% 25/10/2035 USD 722,573 678,556 0.01
Alternative Loan Trust, FRN, Series 2006‑HY10 ‘3A1’ 3.259% 25/05/2036 USD 672,933 553,566 0.01
Alternative Loan Trust, FRN, Series 2005‑36 ‘4A1’ 3.236% 25/08/2035 USD 321,843 307,921 0.01
Alternative Loan Trust, FRN, Series 2007‑16CB ‘4A1’ 0.548% 25/08/2037 USD 96,266 70,285 0.00
Alternative Loan Trust, Series 2005‑86CB ‘A11’ 5.5% 25/02/2036 USD 10,564 8,750 0.00
Alternative Loan Trust, FRN, Series 2007‑OA7 ‘A1A’ 0.328% 25/05/2047 USD 455,043 426,070 0.01
Alternative Loan Trust, Series 2005‑86CB ‘A4’ 5.5% 25/02/2036 USD 18,177 15,054 0.00
Alternative Loan Trust, FRN, Series 2007‑8CB ‘A4’ 38.112% 25/05/2037 USD 1,174,829 2,633,490 0.05
Alternative Loan Trust, Series 2007‑15CB ‘A7’ 6% 25/07/2037 USD 161,270 136,702 0.00
Alternative Loan Trust Resecuritization, FRN, Series 2008‑2R ‘4A1’ 6.25% 25/08/2037 USD 227,315 176,496 0.00
American Credit Acceptance Receivables Trust, Series 2018‑1 ‘E’, 144A 4.94% 10/04/2024 USD 3,650,000 3,767,669 0.07
American Home Mortgage Investment Trust, FRN, Series 2007‑1 ‘GA1A’ 0.31% 25/05/2047 USD 12,264,033 8,778,385 0.17
American Homes 4 Rent Trust, Series 2014‑SFR2 ‘E’, 144A 6.231% 17/10/2036 USD 10,000,000 11,133,566 0.22
American Homes 4 Rent Trust, Series 2014‑SFR3 ‘E’, 144A 6.418% 17/12/2036 USD 11,000,000 12,369,428 0.24
American Homes 4 Rent Trust, Series 2015‑SFR1 ‘F’, 144A 5.885% 17/04/2052 USD 3,930,000 4,383,986 0.09
Argent Securities, Inc. Asset‑Backed Pass‑Through Certificates Trust, FRN, Series 2004‑W10 ‘M4’ 1.948% 25/10/2034 USD 970,993 991,565 0.02
Argent Securities, Inc. Asset‑Backed Pass‑Through Certificates Trust, FRN, Series 2003‑W10 ‘M1’ 1.228% 25/01/2034 USD 1,607,263 1,606,972 0.03
Argent Securities, Inc. Asset‑Backed Pass‑Through Certificates Trust, FRN, Series 2003‑W3 ‘M2’ 2.848% 25/09/2033 USD 1,144,356 1,151,469 0.02

225 Morgan Stanley Investment Funds 31 December 2020
The accompanying notes are an integral part of these financial statements.
Global Fixed Income Opportunities Fund (continued)
schEDUlE of InVEsTmEnTsAs at 31 December 2020
Investments Currency
Quantity/Nominal
Value
Market Value USD
% of Net Assets
Transferable securities and money market instruments admitted to official exchange listing or dealt in on another regulated market
mortgage and asset Backed securities (continued)
United states of america (continued)Asset‑Backed Securities Corp. Home
Equity Loan Trust NC, FRN, Series 2006‑HE2 ‘A3’ 0.53% 25/03/2036 USD 481,747 476,477 0.01
Avant Loans Funding Trust, Series 2018‑B ‘C’, 144A 5% 17/11/2025 USD 5,350,000 5,387,523 0.11
BAMLL Commercial Mortgage Securities Trust ‘E’, 144A 3.606% 14/08/2034 USD 4,000,000 3,840,003 0.08
Banc of America Alternative Loan Trust, Series 2005‑8 ‘2CB1’ 6% 25/09/2035 USD 528,966 531,206 0.01
Banc of America Alternative Loan Trust, FRN, Series 2006‑6 ‘CB1’ 0.8% 25/07/2046 USD 322,039 236,862 0.01
Banc of America Funding Trust, Series 2007‑5 ‘3A1’ 6% 25/07/2037 USD 58,303 56,508 0.00
Banc of America Mortgage Trust, Series 2005‑3 ‘1A28’ 5.5% 25/04/2035 USD 1,055,587 1,099,999 0.02
Banc of America Mortgage Trust, FRN, Series 2004‑E ‘3A1’ 3.807% 25/06/2034 USD 1,140,790 1,196,232 0.02
Bayview Commercial Asset Trust, FRN, Series 2005‑4A ‘A2’, 144A 0.538% 25/01/2036 USD 2,920,798 2,771,207 0.06
Bayview Commercial Mortgage Pass‑Through Trust, FRN, Series 2006‑SP1 ‘M4’, 144A 1.123% 25/04/2036 USD 4,150,000 4,146,660 0.08
Bayview Financial Mortgage Pass‑Through Trust, FRN, Series 2005‑D ‘AF4’ 5.5% 28/12/2035 USD 215,518 214,687 0.00
Bayview Financial Revolving Asset Trust, FRN, Series 2005‑A ‘A1’, 144A 1.147% 28/02/2040 USD 14,710,987 13,932,849 0.28
Bayview Financial Revolving Asset Trust, FRN, Series 2005‑A ‘A2A’, 144A 1.077% 28/02/2040 USD 814,863 770,022 0.02
BCMSC Trust, FRN, Series 1998‑C ‘M1’ 7.51% 15/01/2029 USD 1,163,132 1,122,432 0.02
Bear Stearns ALT‑A Trust, FRN, Series 2006‑3 ‘23A1’ 3.301% 25/05/2036 USD 1,195,458 1,124,791 0.02
Bear Stearns ARM Trust, FRN, Series 2004‑12 ‘2A1’ 3.544% 25/02/2035 USD 1,067,449 1,106,771 0.02
Bear Stearns ARM Trust, FRN, Series 2007‑3 ‘2A1’ 3.595% 25/05/2047 USD 244,667 238,120 0.01
Bear Stearns Asset‑Backed Securities I Trust, Series 2005‑AC3 ‘2A1’ 5.25% 25/06/2020 USD 847,186 791,005 0.02
Bear Stearns Asset‑Backed Securities I Trust, STEP, Series 2004‑AC3 ‘A2’ 6% 25/06/2034 USD 1,195,418 1,236,216 0.02
Bear Stearns Asset‑Backed Securities Trust, FRN, Series 2005‑SD4 ‘2M2’ 2.1% 25/12/2042 USD 2,183,194 2,185,697 0.04
Bella Vista Mortgage Trust, FRN, Series 2004‑1 ‘2A2’ 2.798% 20/11/2034 USD 2,686,163 2,726,806 0.05
Business Loan Express Business Loan Trust, FRN, Series 2007‑AA ‘A’, 144A 0.547% 20/10/2040 USD 4,079,546 3,681,841 0.07
BX Trust, FRN, Series 2018‑EXCL ‘C’, 144A 2.116% 15/09/2037 USD 2,268,468 1,870,961 0.04
BX Trust, FRN, Series 2017‑SLCT ‘E’, 144A 3.291% 15/07/2034 USD 2,550,000 2,530,893 0.05
BXP Trust, FRN, Series 2017‑CQHP ‘E’, 144A 3.141% 15/11/2034 USD 4,000,000 2,794,965 0.06
Cascade Funding Mortgage Trust, STEP, Series 2018‑RM1 ‘A1’, 144A 4.58% 25/06/2048 USD 4,935,644 4,959,077 0.10
schEDUlE of InVEsTmEnTsAs at 31 December 2020
Investments Currency
Quantity/Nominal
Value
Market Value USD
% of Net Assets
Transferable securities and money market instruments admitted to official exchange listing or dealt in on another regulated market
mortgage and asset Backed securities (continued)
United states of america (continued)Cascade Funding Mortgage Trust, STEP,
Series 2018‑RM1 ‘A2’, 144A 5.804% 25/06/2048 USD 800,000 797,129 0.02
Cascade Funding Mortgage Trust, FRN, Series 2018‑RM2 ‘B’, 144A 4% 25/10/2068 USD 12,201,341 12,497,211 0.25
Cascade Funding Mortgage Trust, FRN, Series 2018‑RM2 ‘C’, 144A 4% 25/10/2068 USD 3,265,274 3,281,488 0.07
Cascade Funding Mortgage Trust, FRN, Series 2018‑RM2 ‘D’, 144A 4% 25/10/2068 USD 7,640,740 7,453,083 0.15
Cendant Mortgage Corp., FRN, Series 2003‑A ‘A2’, 144A 6% 25/07/2043 USD 771,905 809,141 0.02
CG‑CCRE Commercial Mortgage Trust, FRN, Series 2014‑FL2 ‘A’, 144A 1.995% 15/11/2031 USD 570,452 547,210 0.01
Chase Funding Loan Acquisition Trust, Series 2003‑C2 ‘2A’ 5.5% 25/08/2034 USD 1,075,435 1,128,299 0.02
Chase Mortgage Finance Trust, FRN, Series 2007‑A1 ‘11A4’ 3.635% 25/03/2037 USD 147,988 146,051 0.00
Chase Mortgage Finance Trust, Series 2004‑S2 ‘1A5’ 5.25% 25/02/2034 USD 899,806 947,377 0.02
CHL GMSR Issuer Trust ‘A’, 144A 2.898% 25/05/2023 USD 6,000,000 5,926,172 0.12
CHL Mortgage Pass‑Through Trust, FRN, Series 2003‑48 ‘1A1’ 2.807% 25/10/2033 USD 604,991 615,397 0.01
CHL Mortgage Pass‑Through Trust, FRN, Series 2005‑HYB1 ‘1A1’ 0.748% 25/03/2035 USD 1,735,933 1,669,241 0.03
CHL Mortgage Pass‑Through Trust, Series 2004‑5 ‘2A2’ 5.5% 25/05/2034 USD 662,902 670,213 0.01
CHL Mortgage Pass‑Through Trust, FRN, Series 2004‑20 ‘3A1’ 2.165% 25/09/2034 USD 1,347,848 1,245,961 0.03
CHL Mortgage Pass‑Through Trust, FRN, Series 2005‑7 ‘3A1’ 3.104% 25/03/2035 USD 1,412,905 1,226,038 0.02
CHL Mortgage Pass‑Through Trust, Series 2006‑9 ‘A3’ 6% 25/05/2036 USD 109,505 81,766 0.00
CIM Small Business Loan Trust, FRN, Series 2018‑1A ‘A’, 144A 1.546% 20/03/2043 USD 1,341,070 1,324,828 0.03
Citigroup Mortgage Loan Trust, FRN, Series 2006‑AR7 ‘2A2A’ 2.992% 25/11/2036 USD 301,757 282,637 0.01
Citigroup Mortgage Loan Trust, Inc., FRN, Series 2005‑SHL1 ‘M3’, 144A 3.15% 25/07/2044 USD 1,700,000 1,776,428 0.04
COMM Mortgage Trust, FRN, Series 2014‑CR14 ‘D’, 144A 4.766% 10/02/2047 USD 572,000 530,121 0.01
COMM Mortgage Trust, FRN, Series 2014‑CR18 ‘D’, 144A 4.901% 15/07/2047 USD 401,000 341,167 0.01
COMM Mortgage Trust, Reg. S, FRN, Series 2014‑C14X ‘D’ 4.766% 10/02/2047 USD 500,000 463,392 0.01
COMM Mortgage Trust, FRN, Series 2016‑GCT ‘F’, 144A 3.577% 10/08/2029 USD 6,003,000 5,966,450 0.12
COMM Mortgage Trust, IO, FRN, Series 2014‑CR14 ‘XA’ 0.727% 10/02/2047 USD 10,611,938 165,266 0.00
Consumer Loan Underlying Bond Credit Trust, Series 2017‑P1 ‘C’, 144A 5.02% 15/09/2023 USD 867,687 874,615 0.02

Morgan Stanley Investment Funds 31 December 2020 226
The accompanying notes are an integral part of these financial statements.
Global Fixed Income Opportunities Fund (continued)
schEDUlE of InVEsTmEnTsAs at 31 December 2020
Investments Currency
Quantity/Nominal
Value
Market Value USD
% of Net Assets
Transferable securities and money market instruments admitted to official exchange listing or dealt in on another regulated market
mortgage and asset Backed securities (continued)
United states of america (continued)Consumer Loan Underlying Bond Credit
Trust, Series 2018‑P2 ‘C’, 144A 5.21% 15/10/2025 USD 4,495,000 4,524,358 0.09
COOF Securitization Trust, IO, FRN ‘A’, 144A 2.406% 25/10/2040 USD 6,044,469 383,589 0.01
COOF Securitization Trust II, IO, FRN, Series 2015‑2 ‘A1’, 144A 2.218% 25/08/2041 USD 29,383,538 2,041,157 0.04
Credit Suisse First Boston Mortgage Securities Corp., STEP, Series 2005‑FIX1 ‘A4’ 5.51% 25/05/2035 USD 1,566,041 1,664,839 0.03
Credit‑Based Asset Servicing and Securitization LLC, STEP, Series 2006‑SC1 ‘B2’, 144A 6.75% 25/05/2036 USD 1,800,000 1,942,512 0.04
CSAIL Commercial Mortgage Trust, FRN, Series 2017‑CX10 ‘UESC’, 144A 4.378% 15/10/2032 USD 1,500,000 1,494,412 0.03
CSMC Mortgage‑Backed Trust, Series 2006‑4 ‘10A1’ 6.5% 25/05/2036 USD 7,183,079 3,193,323 0.06
CSMC Mortgage‑Backed Trust, FRN, Series 2007‑3 ‘1A2’ 5.587% 25/04/2037 USD 3,654,299 1,536,740 0.03
CSMC Mortgage‑Backed Trust, FRN, Series 2006‑7 ‘3A1’ 0.45% 25/08/2036 USD 228,398 86,055 0.00
CWABS Trust, STEP, Series 2005‑3 ‘AF5B’ 6.095% 25/08/2035 USD 3,619,572 3,740,897 0.07
CWABS Trust, FRN, Series 2004‑15 ‘MV6’ 1.723% 25/03/2035 USD 5,700,000 5,627,291 0.11
DT Auto Owner Trust, Series 2018‑1A ‘E’, 144A 5.42% 17/03/2025 USD 8,000,000 8,217,856 0.16
DT Auto Owner Trust, Series 2018‑2A ‘E’, 144A 5.54% 16/06/2025 USD 3,600,000 3,726,958 0.07
DT Auto Owner Trust, Series 2018‑3A ‘E’, 144A 5.33% 17/11/2025 USD 6,000,000 6,354,404 0.13
EMC Mortgage Loan Trust, FRN, Series 2004‑C ‘M1’, 144A 1.648% 25/11/2030 USD 1,415,585 1,412,527 0.03
Encore Credit Receivables Trust, FRN, Series 2005‑1 ‘M3’ 0.883% 25/07/2035 USD 675,237 644,332 0.01
Equity One Mortgage Pass‑Through Trust, STEP, Series 2004‑3 ‘M1’ 4.317% 25/07/2034 USD 3,396,717 3,506,854 0.07
Exeter Automobile Receivables Trust, Series 2017‑3A ‘D’, 144A 5.28% 15/10/2024 USD 2,000,000 2,095,254 0.04
Exeter Automobile Receivables Trust, Series 2018‑1A ‘E’, 144A 4.64% 15/10/2024 USD 3,100,000 3,195,813 0.06
Exeter Automobile Receivables Trust, Series 2018‑2A ‘E’, 144A 5.33% 15/05/2025 USD 3,000,000 3,131,688 0.06
Exeter Automobile Receivables Trust, Series 2018‑3A ‘E’, 144A 5.43% 15/08/2024 USD 1,800,000 1,930,667 0.04
Exeter Automobile Receivables Trust, Series 2018‑4A ‘E’, 144A 5.38% 15/07/2025 USD 2,600,000 2,754,368 0.05
FHLMC Structured Agency Credit Risk Debt Notes, FRN, Series 2017‑DNA2 ‘B1’ 5.3% 25/10/2029 USD 1,500,000 1,605,366 0.03
FHLMC Whole Loan Securities Trust, FRN, Series 2017‑SC02 ‘M2’, 144A 3.823% 25/05/2047 USD 2,565,000 2,573,245 0.05
Fieldstone Mortgage Investment Trust, FRN, Series 2006‑2 ‘2A2’ 0.32% 25/07/2036 USD 1,043,860 667,874 0.01
schEDUlE of InVEsTmEnTsAs at 31 December 2020
Investments Currency
Quantity/Nominal
Value
Market Value USD
% of Net Assets
Transferable securities and money market instruments admitted to official exchange listing or dealt in on another regulated market
mortgage and asset Backed securities (continued)
United states of america (continued)First Franklin Mortgage Loan Trust, FRN,
Series 2004‑FF7 ‘M3’ 1.725% 25/09/2034 USD 2,669,948 2,697,329 0.05
First Investors Auto Owner Trust, Series 2018‑2A ‘E’, 144A 5.36% 15/01/2025 USD 2,500,000 2,672,540 0.05
Flagship Credit Auto Trust, Series 2018‑1 ‘E’, 144A 5.1% 15/05/2025 USD 2,500,000 2,607,651 0.05
Flagship Credit Auto Trust, Series 2018‑3 ‘E’, 144A 5.28% 15/12/2025 USD 2,904,000 3,100,231 0.06
FMC GMSR Issuer Trust ‘A’, 144A 4.45% 25/01/2026 USD 3,500,000 3,498,649 0.07
FMC GMSR Issuer Trust, FRN, Series 2019‑GT1 ‘A’, 144A 5.07% 25/05/2024 USD 9,000,000 9,122,592 0.18
FNMA REMICS, IO, FRN, Series 2014‑10 ‘CS’ 2.797% 25/03/2044 USD 1,396,583 75,090 0.00
FNMA REMICS, IO, FRN, Series 2012‑63 ‘HS’ 6.402% 25/08/2041 USD 173,957 19,818 0.00
FNMA REMICS, IO, FRN, Series 2014‑23 ‘SA’ 2.499% 25/10/2039 USD 3,097,422 147,378 0.00
FREMF Mortgage Trust, FRN, Series 2017‑KF27 ‘B’, 144A 4.503% 25/12/2026 USD 460,448 460,738 0.01
Fremont Home Loan Trust, FRN, Series 1999‑3 ‘A2’ 0.94% 25/12/2029 USD 284,846 270,343 0.01
Fremont Home Loan Trust, FRN, Series 2005‑2 ‘M4’ 1.08% 25/06/2035 USD 644,136 611,959 0.01
GLS Auto Receivables Trust, Series 2018‑1A ‘C’, 144A 5.02% 15/01/2025 USD 3,250,000 3,360,844 0.07
GLS Auto Receivables Trust, Series 2018‑3A ‘D’, 144A 5.34% 15/08/2025 USD 1,450,000 1,528,130 0.03
GNMA, IO, FRN, Series 2012‑149 ‘MS’ 6.098% 20/12/2042 USD 3,883,163 775,282 0.02
GSAA Home Equity Trust, STEP, Series 2006‑18 ‘AF5A’ 6.002% 25/11/2036 USD 2,026,555 1,113,109 0.02
GSAA Home Equity Trust, FRN, Series 2005‑3 ‘B1’ 2.025% 25/12/2034 USD 804,990 820,365 0.02
GSAMP Trust, FRN, Series 2006‑HE2 ‘M1’ 0.63% 25/03/2046 USD 6,400,000 6,290,383 0.12
GSMPS Mortgage Loan Trust, Series 2005‑RP2 ‘1A4’, 144A 8.5% 25/03/2035 USD 1,319,035 1,440,870 0.03
GSMPS Mortgage Loan Trust, FRN, Series 1998‑4 ‘A’, 144A 4.466% 19/12/2026 USD 172,280 169,717 0.00
GSR Mortgage Loan Trust, FRN, Series 2007‑AR1 ‘1A1’ 2.923% 25/03/2037 USD 512,349 418,969 0.01
GSR Mortgage Loan Trust, Series 2005‑3F ‘1A3’ 5.5% 25/03/2035 USD 1,400,650 1,503,106 0.03
GSR Mortgage Loan Trust, FRN, Series 2005‑AR3 ‘6A1’ 3.467% 25/05/2035 USD 29,737 28,612 0.00
HarborView Mortgage Loan Trust, FRN, Series 2006‑12 ‘2A13’ 0.389% 19/12/2036 USD 673,305 644,656 0.01
HarborView Mortgage Loan Trust, FRN, Series 2007‑2 ‘2A1A’ 0.31% 25/05/2038 USD 1,391,559 1,249,009 0.03
HarborView Mortgage Loan Trust, FRN, Series 2005‑16 ‘4A1A’ 2.743% 19/01/2036 USD 1,227,254 707,063 0.01
Headlands Residential LLC, STEP, Series 2019‑RPL1 ‘NOTE’, 144A 3.967% 25/06/2024 USD 4,000,000 4,026,404 0.08
Home Partners of America Trust, FRN, Series 2018‑1 ‘E’, 144A 1.987% 17/07/2037 USD 7,300,000 7,334,192 0.15

227 Morgan Stanley Investment Funds 31 December 2020
The accompanying notes are an integral part of these financial statements.
Global Fixed Income Opportunities Fund (continued)
schEDUlE of InVEsTmEnTsAs at 31 December 2020
Investments Currency
Quantity/Nominal
Value
Market Value USD
% of Net Assets
Transferable securities and money market instruments admitted to official exchange listing or dealt in on another regulated market
mortgage and asset Backed securities (continued)
United states of america (continued)Home Partners of America Trust, FRN,
Series 2017‑1 ‘F’, 144A 3.675% 17/07/2034 USD 9,709,000 9,736,146 0.19
Home Partners of America Trust, FRN, Series 2018‑1 ‘F’, 144A 2.487% 17/07/2037 USD 18,000,000 18,071,870 0.36
Homeward Opportunities Fund Trust ‘A1’, 144A 3.228% 25/08/2025 USD 2,226,000 2,234,345 0.04
Impac CMB Trust, FRN, Series 2004‑8 ‘1A’ 0.868% 25/10/2034 USD 1,276,744 1,230,007 0.02
InSite Issuer LLC, Series 2016‑1A ‘C’, 144A 6.414% 15/11/2046 USD 1,197,000 1,290,863 0.03
InTown Hotel Portfolio Trust, FRN, Series 2018‑STAY ‘D’, 144A 2.191% 15/01/2033 USD 1,307,000 1,273,470 0.03
Invitation Homes Trust, FRN, Series 2018‑SFR1 ‘E’, 144A 2.136% 17/03/2037 USD 17,569,599 17,605,556 0.35
Invitation Homes Trust, FRN, Series 2018‑SFR3 ‘E’, 144A 2.136% 17/07/2037 USD 4,958,165 4,972,113 0.10
Invitation Homes Trust, FRN, Series 2018‑SFR2 ‘F’, 144A 2.391% 17/06/2037 USD 3,717,530 3,737,259 0.07
Invitation Homes Trust, FRN, Series 2018‑SFR3 ‘F’, 144A 2.386% 17/07/2037 USD 494,992 496,759 0.01
Invitation Homes Trust, FRN, Series 2018‑SFR4 ‘F’, 144A 2.336% 17/01/2038 USD 8,800,000 8,849,401 0.18
J.P. Morgan Alternative Loan Trust, Series 2005‑S1 ‘2A9’ 6% 25/12/2035 USD 156,573 141,722 0.00
J.P. Morgan Mortgage Trust, FRN, Series 2007‑A4 ‘1A1’ 3.58% 25/06/2037 USD 1 1 0.00
J.P. Morgan Mortgage Trust, FRN, Series 2007‑A4 ‘2A3’ 3.785% 25/06/2037 USD 81,493 72,067 0.00
JPMBB Commercial Mortgage Securities Trust, FRN, Series 2014‑C19 ‘D’, 144A 4.832% 15/04/2047 USD 1,000,000 914,728 0.02
JPMBB Commercial Mortgage Securities Trust, FRN, Series 2014‑C23 ‘D’, 144A 4.121% 15/09/2047 USD 1,240,779 1,089,156 0.02
JPMBB Commercial Mortgage Securities Trust, IO, FRN, Series 2014‑C21 ‘XA’ 1.155% 15/08/2047 USD 9,292,262 248,860 0.01
KGS‑Alpha SBA COOF Trust, IO, FRN, Series 2014‑2 ‘A’, 144A 2.777% 25/04/2040 USD 3,795,153 322,406 0.01
KGS‑Alpha SBA COOF Trust, IO, FRN, Series 2015‑2 ‘A’, 144A 2.675% 25/07/2041 USD 1,754,491 216,626 0.00
Lehman Mortgage Trust, Series 2006‑1 ‘1A3’ 5.5% 25/02/2036 USD 270,443 219,742 0.00
Lehman Mortgage Trust, Series 2007‑8 ‘2A1’ 6.5% 25/09/2037 USD 375,097 188,490 0.00
LHOME Mortgage Trust ‘A1’, 144A 3.868% 25/07/2024 USD 3,000,000 3,039,185 0.06
LHOME Mortgage Trust, Series 2020‑RTL1 ‘A1’, 144A 3.228% 25/10/2024 USD 5,000,000 5,043,330 0.10
Long Beach Mortgage Loan Trust, FRN, Series 2004‑2 ‘M2’ 1.768% 25/06/2034 USD 436,418 436,877 0.01
LUNAR AIRCRAFT Ltd., Series 2020‑1A ‘A’, 144A 3.376% 15/02/2045 USD 2,410,048 2,287,810 0.05
MACH 1 Cayman Ltd., Series 2019‑1 ‘A’, 144A 3.474% 15/10/2039 USD 4,836,721 4,695,610 0.09
MASTR Adjustable Rate Mortgages Trust, FRN, Series 2007‑R5 ‘A1’, 144A 3.025% 25/11/2035 USD 1 1 0.00
MASTR Alternative Loan Trust, Series 2005‑1 ‘6A5’ 5.5% 25/02/2035 USD 2,283,633 2,433,574 0.05
schEDUlE of InVEsTmEnTsAs at 31 December 2020
Investments Currency
Quantity/Nominal
Value
Market Value USD
% of Net Assets
Transferable securities and money market instruments admitted to official exchange listing or dealt in on another regulated market
mortgage and asset Backed securities (continued)
United states of america (continued)MASTR Asset Securitization Trust, FRN,
Series 2006‑2 ‘1A11’ 6% 25/06/2036 USD 196,167 171,722 0.00 Mastr Specialized Loan Trust, FRN, Series
2007‑2 ‘A’, 144A 0.498% 25/05/2037 USD 1,627,090 1,504,299 0.03 Merrill Lynch Mortgage Investors Trust,
FRN, Series 2006‑1 ‘1A’ 2.648% 25/02/2036 USD 1,152,799 1,138,378 0.02
Merrill Lynch Mortgage Investors Trust, FRN, Series 2005‑1 ‘2A2’ 2.564% 25/04/2035 USD 191,091 187,695 0.00
Merrill Lynch Mortgage Investors Trust, IO, FRN, Series 2006‑A2 ‘XA’, 144A 2.311% 25/02/2036 USD 5,693,403 316,032 0.01
METAL LLC, Series 2017‑1 ‘A’, 144A 4.581% 15/10/2042 USD 3,961,394 3,176,426 0.06
MFA LLC, STEP, Series 2018‑NPL1 ‘A1’, 144A 3.875% 25/05/2048 USD 3,961,643 3,976,799 0.08
MFA LLC, STEP, Series 2018‑NPL2 ‘A1’, 144A 4.164% 25/07/2048 USD 7,132,605 7,171,046 0.14
Morgan Stanley Resecuritization Trust, FRN, Series 2015‑R4 ‘CB2’, 144A 0.976% 26/08/2047 USD 2,000,000 1,818,621 0.04
Mortgage Equity Conversion Asset Trust, FRN, Series 2007‑FF2 ‘A’, 144A 0.56% 25/02/2042 USD 2,587,060 2,558,197 0.05
MortgageIT Trust, FRN, Series 2005‑4 ‘M1’ 1.05% 25/10/2035 USD 434,147 437,672 0.01
National City Mortgage Capital Trust, FRN, Series 2008‑1 ‘1A1’ 3.522% 25/03/2038 USD 261,234 257,803 0.01
Natixis Commercial Mortgage Securities Trust, FRN, Series 2019‑MILE ‘A’, 144A 1.641% 15/07/2036 USD 4,795,000 4,789,114 0.09
Natixis Commercial Mortgage Securities Trust, FRN, Series 2020‑2PAC ‘AMZ2’, 144A 3.617% 15/01/2037 USD 2,000,000 1,936,131 0.04
Natixis Commercial Mortgage Securities Trust, FRN, Series 2019‑MILE ‘D’, 144A 2.891% 15/07/2036 USD 4,000,000 3,888,221 0.08
Natixis Commercial Mortgage Securities Trust, FRN, Series 2018‑ALXA ‘E’, 144A 4.46% 15/01/2043 USD 4,815,000 4,844,914 0.10
Natixis Commercial Mortgage Securities Trust, FRN, Series 2018‑285M ‘F’, 144A 3.917% 15/11/2032 USD 2,500,000 2,424,756 0.05
Natixis Commercial Mortgage Securities Trust, FRN, Series 2020‑2PAC ‘MSK2’, 144A 3.358% 15/12/2036 USD 2,369,300 2,255,117 0.04
New Century Home Equity Loan Trust, FRN, Series 2003‑6 ‘M2’ 2.548% 25/01/2034 USD 148,360 154,262 0.00
New Century Home Equity Loan Trust, FRN, Series 2005‑2 ‘M4’ 1.093% 25/06/2035 USD 484,647 472,217 0.01
New Residential Mortgage Loan Trust ‘A1’, 144A 4.335% 25/07/2060 USD 11,472,075 11,631,534 0.23
New Residential Mortgage Loan Trust ‘A1’, 144A 3.228% 25/08/2060 USD 3,115,898 3,143,497 0.06
Nomura Asset Acceptance Corp. Alternative Loan Trust, FRN, Series 2006‑AF1 ‘4A1’ 3.262% 25/06/2036 USD 387,066 346,411 0.01
Nomura Asset Acceptance Corp. Alternative Loan Trust, FRN, Series 2007‑2 ‘A1A’ 0.27% 25/06/2037 USD 1,267,112 1,008,659 0.02

Morgan Stanley Investment Funds 31 December 2020 228
The accompanying notes are an integral part of these financial statements.
Global Fixed Income Opportunities Fund (continued)
schEDUlE of InVEsTmEnTsAs at 31 December 2020
Investments Currency
Quantity/Nominal
Value
Market Value USD
% of Net Assets
Transferable securities and money market instruments admitted to official exchange listing or dealt in on another regulated market
mortgage and asset Backed securities (continued)
United states of america (continued)Nomura Asset Acceptance Corp.
Alternative Loan Trust, FRN, Series 2006‑AR3 ‘A2’ 0.27% 25/10/2036 USD 455,491 404,589 0.01
NRPL Trust, STEP, Series 2018‑2A ‘A1’, 144A 4.25% 25/07/2067 USD 10,810,422 10,925,960 0.22
NRZ Excess Spread‑Collateralized Notes, Series 2018‑FNT1 ‘D’, 144A 4.69% 25/05/2023 USD 1,308,022 1,308,560 0.03
NRZ Excess Spread‑Collateralized Notes, Series 2018‑FNT1 ‘E’, 144A 4.89% 25/05/2023 USD 1,569,626 1,568,816 0.03
NRZ Excess Spread‑Collateralized Notes, Series 2018‑FNT1 ‘F’, 144A 5.57% 25/05/2023 USD 4,874,212 4,888,304 0.10
Oakwood Mortgage Investors, Inc., FRN, Series 1999‑D ‘A1’ 7.84% 15/11/2029 USD 1,011,877 1,069,350 0.02
Opteum Mortgage Acceptance Corp. Asset‑Backed Pass‑Through Certificates Trust, FRN, Series 2005‑1 ‘M8’ 2.325% 25/02/2035 USD 1,423,000 1,470,545 0.03
Ownit Mortgage Loan Trust, FRN, Series 2006‑3 ‘A2D’ 0.42% 25/03/2037 USD 4,298,793 4,192,160 0.08
PNMAC FMSR ISSUER Trust, FRN, Series 2018‑FT1 ‘A’, 144A 2.498% 25/04/2023 USD 13,004,000 12,598,734 0.25
PNMAC GMSR ISSUER Trust, FRN, Series 2018‑GT1 ‘A’, 144A 3% 25/02/2023 USD 14,500,000 14,363,327 0.28
PNMAC GMSR ISSUER Trust, FRN, Series 2018‑GT2 ‘A’, 144A 2.8% 25/08/2025 USD 12,130,000 11,734,717 0.23
Pretium Mortgage Credit Partners I LLC ‘A1’, 144A 3.819% 27/05/2060 USD 8,695,750 8,771,772 0.17
Pretium Mortgage Credit Partners I LLC, STEP, Series 2020‑NPL1 ‘A1’, 144A 2.858% 27/05/2059 USD 11,567,575 11,630,410 0.23
Progress Residential Trust, Series 2018‑SFR2 ‘C’, 144A 4.04% 17/08/2035 USD 6,000,000 6,102,146 0.12
Progress Residential Trust, Series 2018‑SFR1 ‘E’, 144A 4.38% 17/03/2035 USD 5,800,000 5,830,505 0.12
Progress Residential Trust, Series 2018‑SFR2 ‘E’, 144A 4.656% 17/08/2035 USD 3,000,000 3,060,254 0.06
Progress Residential Trust, Series 2017‑SFR1 ‘F’, 144A 5.35% 17/08/2034 USD 5,083,000 5,198,105 0.10
Progress Residential Trust, Series 2018‑SFR1 ‘F’, 144A 4.778% 17/03/2035 USD 1,000,000 1,007,017 0.02
Progress Residential Trust, Series 2018‑SFR3 ‘F’, 144A 5.368% 17/10/2035 USD 14,010,000 14,369,732 0.28
Prosper Marketplace Issuance Trust, Series 2018‑2A ‘C’, 144A 5.5% 15/10/2024 USD 7,989,229 7,964,692 0.16
PRPM LLC ‘A1’, 144A 3.671% 25/08/2025 USD 946,401 952,249 0.02
PRPM LLC ‘A1’, 144A 2.857% 25/09/2025 USD 4,733,940 4,779,396 0.09
PRPM LLC ‘A1’, 144A 3.104% 25/11/2025 USD 4,893,925 4,927,194 0.10
RALI Trust ‘A1’ 6% 25/01/2037 USD 140,333 133,766 0.00 RALI Trust, Series 2006‑QS8 ‘A1’ 6%
25/08/2036 USD 341,450 335,566 0.01 RALI Trust, Series 2006‑QS4 ‘A2’ 6%
25/04/2036 USD 35,099 34,132 0.00 RALI Trust, Series 2007‑QS6 ‘A45’ 5.75%
25/04/2037 USD 114,848 110,538 0.00 RAMP Trust, STEP, Series 2005‑RS1 ‘MI1’
5.645% 25/01/2035 USD 4,335,568 4,610,871 0.09 Raptor Aircraft Finance I LLC, Series
2019‑1 ‘A’, 144A 4.213% 23/08/2044 USD 13,786,771 11,761,876 0.23
schEDUlE of InVEsTmEnTsAs at 31 December 2020
Investments Currency
Quantity/Nominal
Value
Market Value USD
% of Net Assets
Transferable securities and money market instruments admitted to official exchange listing or dealt in on another regulated market
mortgage and asset Backed securities (continued)
United states of america (continued)RASC Trust, FRN, Series 2006‑KS9 ‘AI3’
0.308% 25/11/2036 USD 213,815 217,232 0.00 RASC Trust, FRN, Series 2005‑KS5 ‘M7’
1.873% 25/06/2035 USD 1,500,000 1,491,228 0.03 Renaissance Home Equity Loan Trust,
STEP, Series 2005‑3 ‘AF4’ 5.14% 25/11/2035 USD 2,541,007 2,678,478 0.05
Renaissance Home Equity Loan Trust, STEP, Series 2005‑1 ‘AF5’ 5.451% 25/05/2035 USD 3,000,000 3,223,714 0.06
Reperforming Loan REMIC Trust, Series 2005‑R1 ‘2A2’, 144A 6.5% 25/03/2035 USD 508,343 526,261 0.01
Reperforming Loan REMIC Trust, Series 2004‑R1 ‘3A’, 144A 7.5% 25/11/2034 USD 546,384 571,440 0.01
RiverView HECM Trust, FRN, Series 2007‑4A ‘A’, 144A 0.42% 25/05/2047 USD 6,317,342 5,865,914 0.12
Seasoned Credit Risk Transfer Trust, FRN, Series 2018‑1 ‘M’ 4.75% 25/05/2057 USD 7,480,000 7,663,142 0.15
Seasoned Credit Risk Transfer Trust, FRN, Series 2018‑3 ‘M’, 144A 4.75% 25/08/2057 USD 11,000,000 11,329,551 0.22
Seasoned Credit Risk Transfer Trust ‘M1’, 144A 4% 25/08/2056 USD 2,500,000 2,524,420 0.05
Seasoned Credit Risk Transfer Trust ‘M2’, 144A 3.75% 25/09/2055 USD 15,000,000 15,072,584 0.30
Seasoned Loans Structured Transaction, FRN, Series 2018‑1 ‘M1’ 3% 25/04/2058 USD 10,000,000 10,024,381 0.20
Security National Mortgage Loan Trust, FRN, Series 2005‑2A ‘A3’, 144A 6.213% 25/02/2036 USD 1,644,695 1,727,302 0.03
Skopos Auto Receivables Trust, Series 2018‑1A ‘C’, 144A 4.77% 17/04/2023 USD 5,223,424 5,307,923 0.11
SLM Student Loan Trust, Reg. S, FRN 0.007% 15/12/2033 EUR 6,674,822 7,614,536 0.15
SLM Student Loan Trust, Reg. S, FRN, Series 2004‑10X ‘A8’ 0.039% 25/01/2040 EUR 14,700,000 16,672,576 0.33
Sprite Ltd., Series 2017‑1 ‘A’, 144A 4.25% 15/12/2037 USD 3,215,940 3,051,344 0.06
Sprite Ltd., Series 2017‑1 ‘C’, 144A 6.9% 15/12/2037 USD 1,316,854 659,316 0.01
STARM Mortgage Loan Trust, FRN, Series 2007‑4 ‘3A1’ 3.007% 25/10/2037 USD 310,844 286,337 0.01
Start Ltd., Series 2018‑1 ‘A’, 144A 4.089% 15/05/2043 USD 3,608,510 3,528,490 0.07
Starwood Waypoint Homes Trust, FRN, Series 2017‑1 ‘F’, 144A 3.541% 17/01/2035 USD 2,297,000 2,298,583 0.05
Structured Adjustable Rate Mortgage Loan Trust ‘2A’ 2.973% 25/02/2035 USD 1,506,527 1,471,464 0.03
Structured Asset Mortgage Investments II Trust, FRN, Series 2006‑AR6 ‘2A2’ 0.38% 25/07/2036 USD 32,223 13,635 0.00
Structured Asset Mortgage Investments II Trust, FRN, Series 2005‑AR1 ‘A2’ 1.231% 19/04/2035 USD 2,115,179 2,039,933 0.04
Structured Asset Securities Corp., FRN, Series 2002‑14A ‘1A1’ 4.165% 25/07/2032 USD 131,040 128,782 0.00
Structured Asset Securities Corp., IO, FRN, Series 2005‑RF5 ‘1AIO’, 144A 4.387% 25/07/2035 USD 6,276,421 937,589 0.02
Structured Asset Securities Corp. Reverse Mortgage Loan Trust ‘M3’, 144A 2% 25/05/2047 USD 9,769,368 8,523,773 0.17

229 Morgan Stanley Investment Funds 31 December 2020
The accompanying notes are an integral part of these financial statements.
Global Fixed Income Opportunities Fund (continued)
schEDUlE of InVEsTmEnTsAs at 31 December 2020
Investments Currency
Quantity/Nominal
Value
Market Value USD
% of Net Assets
Transferable securities and money market instruments admitted to official exchange listing or dealt in on another regulated market
mortgage and asset Backed securities (continued)
United states of america (continued)Structured Asset Securities Corp. Reverse
Mortgage Loan Trust ‘M4’, 144A 3.15% 25/05/2047 USD 6,059,827 5,906,822 0.12
Sunbird Engine Finance LLC, Series 2020‑1A ‘A’, 144A 3.671% 15/02/2045 USD 7,404,037 6,661,696 0.13
Tricon American Homes Trust ‘E’, 144A 4.216% 17/01/2036 USD 5,345,000 5,558,251 0.11
Tricon American Homes Trust, Series 2017‑SFR1 ‘F’, 144A 5.151% 17/09/2034 USD 23,967,750 24,512,892 0.48
Tricon American Homes Trust, Series 2017‑SFR2 ‘F’, 144A 5.104% 17/01/2036 USD 18,000,000 18,831,884 0.37
Tricon American Homes Trust, Series 2018‑SFR1 ‘F’, 144A 4.96% 17/05/2037 USD 3,005,000 3,199,374 0.06
Truman Capital Mortgage Loan Trust, FRN, Series 2002‑1 ‘M2’, 144A 2.923% 25/11/2031 USD 520,194 520,243 0.01
TVC Mortgage Trust, Series 2020‑RTL1 ‘A1’, 144A 3.474% 25/09/2024 USD 3,000,000 3,034,436 0.06
Upgrade Receivables Trust, Series 2018‑1A ‘C’, 144A 5.17% 15/11/2024 USD 3,405,769 3,424,629 0.07
Upstart Securitization Trust, Series 2017‑2 ‘C’, 144A 5.59% 20/03/2025 USD 506,560 511,177 0.01
VCAT LLC ‘A1’, 144A 3.671% 25/08/2050 USD 2,881,670 2,919,638 0.06
Vericrest Opportunity Loan Trust ‘A1A’, 144A 3.351% 25/09/2049 USD 3,661,406 3,671,896 0.07
Vericrest Opportunity Loan Trust, STEP, Series 2020‑NPL2 ‘A1A’, 144A 2.981% 25/02/2050 USD 14,187,621 14,232,026 0.28
Vericrest Opportunity Loan Trust, STEP, Series 2020‑NPL5 ‘A1A’, 144A 2.981% 25/03/2050 USD 6,913,327 6,930,504 0.14
Veros Automobile Receivables Trust ‘D’, 144A 5.74% 15/08/2025 USD 4,050,000 4,100,992 0.08
VOLT LXXX LLC ‘A1A’, 144A 3.228% 25/10/2049 USD 5,778,429 5,795,730 0.11
VOLT LXXXIV LLC, STEP, Series 2019‑NP10 ‘A1A’, 144A 3.426% 27/12/2049 USD 4,012,129 4,028,437 0.08
VOLT LXXXV LLC ‘A1A’, 144A 3.228% 25/01/2050 USD 8,168,188 8,203,877 0.16
VOLT LXXXVII LLC ‘A1A’, 144A 2.981% 25/02/2050 USD 7,805,646 7,828,276 0.16
VOLT LXXXVIII LLC, STEP, Series 2020‑NPL4 ‘A1’, 144A 2.981% 25/03/2050 USD 7,664,540 7,684,784 0.15
Wachovia Mortgage Loan Trust LLC Trust, FRN, Series 2005‑B ‘3A1’ 2.829% 20/10/2035 USD 192,427 188,999 0.00
Washington Mutual MSC Mortgage‑Backed Pass‑Through Certificates Trust, FRN, Series 2005‑RA1 ‘3A’ 3.527% 25/01/2035 USD 525,314 529,300 0.01
WAVE LLC, Series 2019‑1 ‘A’, 144A 3.597% 15/09/2044 USD 4,678,795 4,576,367 0.09
WAVE Trust, Series 2017‑1A ‘A’, 144A 3.844% 15/11/2042 USD 2,658,635 2,585,248 0.05
Wells Fargo Commercial Mortgage Trust, FRN, Series 2020‑SOP ‘C’, 144A 1.951% 15/01/2035 USD 1,600,000 1,548,502 0.03
Wells Fargo Commercial Mortgage Trust, FRN ‘D’ 4.354% 15/06/2048 USD 3,100,000 2,686,312 0.05
Wells Fargo Commercial Mortgage Trust, FRN, Series 2020‑SOP ‘D’, 144A 2.351% 15/01/2035 USD 2,500,000 2,397,033 0.05
schEDUlE of InVEsTmEnTsAs at 31 December 2020
Investments Currency
Quantity/Nominal
Value
Market Value USD
% of Net Assets
Transferable securities and money market instruments admitted to official exchange listing or dealt in on another regulated market
mortgage and asset Backed securities (continued)
United states of america (continued)WFRBS Commercial Mortgage Trust, FRN,
Series 2013‑C15 ‘D’, 144A 4.643% 15/08/2046 USD 2,000,000 859,080 0.02
WFRBS Commercial Mortgage Trust, FRN, Series 2013‑C16 ‘D’, 144A 5.185% 15/09/2046 USD 2,034,000 1,282,591 0.03
WFRBS Commercial Mortgage Trust, FRN, Series 2014‑C23 ‘D’, 144A 4.141% 15/10/2057 USD 1,000,000 964,276 0.02
879,960,935 17.38
Total mortgage and asset Backed securities 1,350,832,560 26.68
To Be announced contracts
United states of americaUMBS 2% 25/02/2050 USD 160,000,000 165,711,864 3.27
165,711,864 3.27
Total To Be announced contracts 165,711,864 3.27
Total Transferable securities and money market instruments admitted to official exchange listing or dealt in on another regulated market 4,742,410,676 93.67
Other transferable securities and money market instruments not admitted to official exchange listing or dealt in on another regulated market
corporate Bonds
GreeceLuminis Finance plc 0% 12/06/2022* EUR 488,400 582,758 0.01 Luminis Finance plc, Reg. S, FRN 0%
12/03/2025* EUR 6,982,247 8,331,211 0.17
8,913,969 0.18
United states of americaDP Facilities Data Center Subordinated
Pass Through Trust, FRN, 144A 0% 10/11/2028* USD 3,300,000 1,660,560 0.03
1,660,560 0.03
Total corporate Bonds 10,574,529 0.21
Total other transferable securities and money market instruments not admitted to official exchange listing or dealt in on another regulated market 10,574,529 0.21

Morgan Stanley Investment Funds 31 December 2020 230
The accompanying notes are an integral part of these financial statements.
Global Fixed Income Opportunities Fund (continued)
schEDUlE of InVEsTmEnTsAs at 31 December 2020
Investments Currency
Quantity/ Nominal
Value
Market Value USD
% of Net Assets
Units of authorised UCITS or other collective investment undertakings
collective Investment schemes – UcITs
luxembourgMorgan Stanley Liquidity Funds US Dollar
Liquidity Fund – MS Reserve† USD 274,877,032 274,877,032 5.43
274,877,032 5.43
Total collective Investment schemes – UcITs 274,877,032 5.43
Exchange Traded funds
IrelandiShares Core EUR Corp Bond UCITS ETF EUR 6,000 1,004,569 0.02 iShares Core EUR Corp Bond UCITS ETF GBP 129,000 21,704,928 0.43 iShares EUR High Yield Corp. Bond
UCITS ETF EUR 112,200 14,140,709 0.28 iShares USD Short Duration Corp Bond
UCITS ETF MXN 764,000 4,320,279 0.08 iShares USD Short Duration Corp Bond
UCITS ETF USD 5,714,000 32,247,823 0.64
73,418,308 1.45
United KingdomiShares USD Corp. Bond UCITS ETF USD 311,200 41,268,232 0.81
41,268,232 0.81
United states of americaiShares USD High Yield Corp Bond
UCITS ETF USD 151,200 15,581,160 0.31
15,581,160 0.31
Total Exchange Traded funds 130,267,700 2.57
Total Units of authorised UcITs or other collective investment undertakings 405,144,732 8.00
Total Investments 5,158,129,937 101.88
cash 92,708,978 1.83
other assets/(liabilities) (187,991,461) (3.71)
Total net assets 5,062,847,454 100.00
* Security is valued at its fair value under the direction of the Board of Directors.† Managed by an affiliate of the Investment Adviser.The country disclosed within the Schedule of Investments refers to the country of risk. The country of incorporation may differ.
financial futures contracts
security Descriptionnumber
of contracts currency
Global Exposure
UsD
Unrealised Gain/(loss)
UsD
% of net assets
Australia 10 Year Bond, 15/03/2021 137 AUD 15,593,224 74,209 0.00Euro‑Bund, 08/03/2021 (268) EUR (58,411,569) 52,611 0.00US 5 Year Note, 31/03/2021 1,422 USD 179,371,969 325,998 0.01
Total Unrealised Gain on financial futures contracts 452,818 0.01
US 10 Year Note, 22/03/2021 115 USD 15,870,000 (3,594) 0.00US 10 Year Ultra Bond, 22/03/2021 181 USD 28,281,250 (17,328) 0.00US Long Bond, 22/03/2021 (28) USD (4,844,000) (19,165) 0.00US Ultra Bond, 22/03/2021 (12) USD (2,557,875) (21,000) 0.00
Total Unrealised loss on financial futures contracts (61,087) 0.00
net Unrealised Gain on financial futures contracts 391,731 0.01
forward currency Exchange contracts (continued)
currency Purchased
amount Purchased
currency sold
amount sold
maturity Date counterparty
Unrealised Gain/(loss)
UsD
% of net assets
EUR 297,961 USD 365,024 04/01/2021 J.P. Morgan 555 0.00USD 98,924 EUR 80,511 05/01/2021 J.P. Morgan 142 0.00EUR 62,146,000 USD 73,549,541 19/01/2021 J.P. Morgan 2,727,000 0.05 EUR 10,000,000 USD 12,254,000 19/01/2021 Westpac Banking 19,765 0.00MXN 401,487,900 USD 19,288,398 20/01/2021 Barclays 887,427 0.02 MXN 113,967,100 USD 5,418,224 20/01/2021 BNP Paribas 308,923 0.01 MXN 205,913,348 USD 10,093,693 20/01/2021 RBC 253,996 0.01 USD 21,555,701 MXN 428,010,000 20/01/2021 Goldman Sachs 47,070 0.00NOK 110,635,000 USD 12,562,081 21/01/2021 J.P. Morgan 403,915 0.01 NOK 111,745,000 USD 11,829,136 21/01/2021 State Street 1,266,948 0.03 AUD 14,308,370 USD 10,437,241 22/01/2021 Commonwealth
Bank of Australia 626,065 0.01 AUD 26,610,500 USD 20,234,411 22/01/2021 State Street 340,965 0.01 NZD 31,514,316 USD 21,727,860 22/01/2021 ANZ 1,057,283 0.02 USD 4,752,618 ZAR 69,719,475 22/01/2021 HSBC 6,084 0.00USD 7,068,561 ZAR 103,789,101 22/01/2021 RBC 2,552 0.00ZAR 186,792,500 USD 11,787,223 22/01/2021 BNP Paribas 929,696 0.02 ZAR 186,792,500 USD 11,735,471 22/01/2021 UBS 981,448 0.02 CHF 6,054,987 USD 6,663,483 25/01/2021 HSBC 217,650 0.00PLN 48,650,000 USD 12,765,343 25/01/2021 Goldman Sachs 324,892 0.01 USD 25,200,173 PLN 93,160,000 25/01/2021 BNP Paribas 133,651 0.00GBP 5,802,607 USD 7,713,754 27/01/2021 Barclays 213,634 0.00GBP 14,910,000 USD 19,683,932 27/01/2021 BNP Paribas 685,766 0.01 JPY 2,601,775,000 USD 25,125,930 29/01/2021 Citigroup 129,958 0.00JPY 2,622,170,000 USD 25,023,046 29/01/2021 Westpac Banking 430,820 0.01 IDR 116,200,000,000 USD 8,194,236 01/02/2021 BNP Paribas 139,860 0.00KRW 27,987,600,000 USD 25,275,535 01/02/2021 State Street 376,360 0.01 USD 24,871,725 BRL 127,000,000 01/02/2021 Goldman Sachs 425,990 0.01
Unrealised Gain on forward currency Exchange contracts – assets 12,938,415 0.26
aUD hedged share classAUD 10,223 USD 7,730 08/01/2021 J.P. Morgan 174 0.00
Unrealised Gain on naV hedged share classes forward currency Exchange contracts – assets 174 0.00
chf hedged share classCHF 16,207,922 USD 18,308,409 08/01/2021 J.P. Morgan 100,858 0.00
Unrealised Gain on naV hedged share classes forward currency Exchange contracts – assets 100,858 0.00
DERIVaTIVEs
Over-the-counter (OTC) and exchange traded derivatives as at 31 December 2020, expressed in US Dollars.

231 Morgan Stanley Investment Funds 31 December 2020
The accompanying notes are an integral part of these financial statements.
Global Fixed Income Opportunities Fund (continued)
forward currency Exchange contracts (continued)
currency Purchased
amount Purchased
currency sold
amount sold
maturity Date counterparty
Unrealised Gain/(loss)
UsD
% of net assets
EUR hedged share classEUR 341,130 USD 418,498 04/01/2021 J.P. Morgan 48 0.00USD 877,425 EUR 713,556 05/01/2021 J.P. Morgan 1,934 0.00EUR 1,692,940,982 USD 2,059,424,967 08/01/2021 J.P. Morgan 17,878,137 0.35 USD 1,214,823 EUR 987,855 08/01/2021 J.P. Morgan 2,687 0.00
Unrealised Gain on naV hedged share classes forward currency Exchange contracts – assets 17,882,806 0.35
GBP hedged share classGBP 18,894,997 USD 25,285,157 08/01/2021 J.P. Morgan 524,891 0.01
Unrealised Gain on naV hedged share classes forward currency Exchange contracts – assets 524,891 0.01
sGD hedged share classSGD 215,458,903 USD 161,700,091 08/01/2021 J.P. Morgan 1,435,311 0.03
Unrealised Gain on naV hedged share classes forward currency Exchange contracts – assets 1,435,311 0.03
UsD hedged share classUSD 370,000 BRL 1,921,425 29/01/2021 J.P. Morgan 135 0.00
Unrealised Gain on naV hedged share classes forward currency Exchange contracts – assets 135 0.00
Total Unrealised Gain on forward currency Exchange contracts – assets 32,882,590 0.65
USD 60,513 EUR 49,396 04/01/2021 J.P. Morgan (92) 0.00EUR 337,451 USD 414,627 05/01/2021 J.P. Morgan (596) 0.00USD 9,866,857 EUR 8,300,000 19/01/2021 ANZ (320,368) (0.01) USD 10,073,370 EUR 8,255,000 19/01/2021 Barclays (58,623) 0.00USD 893,839,377 EUR 758,810,263 19/01/2021 BNP Paribas (37,506,531) (0.74) USD 24,053,558 EUR 20,250,000 19/01/2021 Goldman Sachs (800,817) (0.02) USD 30,394,834 MXN 632,076,868 20/01/2021 State Street (1,368,695) (0.03) USD 129,229,565 AUD 181,990,000 22/01/2021 Commonwealth
Bank of Australia (11,486,043) (0.23) USD 44,662,239 NZD 67,403,000 22/01/2021 Westpac Banking (4,070,756) (0.08) USD 5,341,031 SGD 7,157,500 22/01/2021 Westpac Banking (78,294) 0.00USD 18,672,198 ZAR 307,712,470 22/01/2021 Barclays (2,277,007) (0.04) USD 10,719,617 ZAR 165,416,559 22/01/2021 State Street (542,017) (0.01) PLN 44,510,000 USD 12,044,694 25/01/2021 Citibank (68,407) 0.00USD 25,103,347 CHF 22,230,000 25/01/2021 UBS (159,728) 0.00USD 2,780,537 CHF 2,500,000 25/01/2021 Westpac Banking (60,565) 0.00USD 261,635,432 GBP 198,843,000 27/01/2021 Goldman Sachs (10,019,275) (0.20) BRL 46,910,440 USD 9,070,146 01/02/2021 Barclays (40,538) 0.00BRL 29,080,000 USD 5,631,839 01/02/2021 BNP Paribas (34,343) 0.00BRL 25,035,120 USD 4,847,540 01/02/2021 Citigroup (28,627) 0.00BRL 25,414,440 USD 4,922,036 01/02/2021 Goldman Sachs (30,110) 0.00BRL 560,000 USD 109,352 01/02/2021 J.P. Morgan (1,559) 0.00USD 56,237,548 IDR799,219,916,000 01/02/2021 BNP Paribas (1,084,103) (0.02)
Unrealised loss on forward currency Exchange contracts – liabilities (70,037,094) (1.38)
chf hedged share classUSD 7,563,911 CHF 6,709,303 08/01/2021 J.P. Morgan (56,644) 0.00
EUR hedged share classUSD 1,520,904 EUR 1,239,733 04/01/2021 J.P. Morgan (174) 0.00EUR 987,855 USD 1,214,716 05/01/2021 J.P. Morgan (2,677) 0.00EUR 713,556 USD 877,502 08/01/2021 J.P. Morgan (1,941) 0.00USD 9,539,146 EUR 7,801,311 08/01/2021 J.P. Morgan (33,360) 0.00
forward currency Exchange contracts (continued)
currency Purchased
amount Purchased
currency sold
amount sold
maturity Date counterparty
Unrealised Gain/(loss)
UsD
% of net assets
GBP hedged share classUSD 6,658 GBP 4,894 05/01/2021 J.P. Morgan (27) 0.00USD 304,645 GBP 225,327 08/01/2021 J.P. Morgan (3,145) 0.00
UsD hedged share classBRL 146,040,917 USD 28,555,201 29/01/2021 J.P. Morgan (443,031) (0.01)
Unrealised loss on naV hedged share classes forward currency Exchange contracts – liabilities (540,999) (0.01)
Total Unrealised loss on forward currency Exchange contracts – liabilities (70,578,093) (1.39)
net Unrealised loss on forward currency Exchange contracts – liabilities (37,695,503) (0.74)
credit Default swap contracts
nominal amount ccy counterparty
Reference Entity
Buy/ sell
Interest (Paid)/
Received Rate
maturity Date
market Value UsD
% of net assets
171,208,000 USD Goldman Sachs CDX.NA.HY. 34‑V9 Buy (5.00)% 20/06/2025 (14,659,467) (0.29)
Total market Value on credit Default swap contracts – liabilities (14,659,467) (0.29)
net market Value on credit Default swap contracts – liabilities (14,659,467) (0.29)
Collateral received and paid by the Fund in respect of financial derivative instruments:
Type of collateral counterparty currency amount received amount paid
Global fixed Income opportunities fund
Cash Barclays USD – 1,400,000BNP Paribas USD – 34,130,000Goldman Sachs USD – 15,933,256J.P. Morgan USD 1,160,000 –State Street USD – 430,000UBS USD 990,000 –Wells Fargo Securities USD 320,000 –Westpac Banking USD – 3,400,000
2,470,000 55,293,256
DERIVaTIVEs (continued)
Over-the-counter (OTC) and exchange traded derivatives as at 31 December 2020, expressed in US Dollars.
DERIVaTIVEs (continued)
Over-the-counter (OTC) and exchange traded derivatives as at 31 December 2020, expressed in US Dollars.

Morgan Stanley Investment Funds 31 December 2020 232
The accompanying notes are an integral part of these financial statements.
Please refer to the full prospectus for the Fund’s investment objective and policy.
InVEsTmEnT aIm
To provide an attractive rate of return, measured in US Dollars, through investments worldwide primarily in Fixed Income Securities issued by corporations that are rated lower than “BBB‑” by S&P or “Baa3” by Moody’s or similarly by another internationally recognised rating service or determined to be of similar creditworthiness by the Investment Adviser.
schEDUlE of InVEsTmEnTsAs at 31 December 2020
Investments Currency
Quantity/Nominal
Value
Market Value USD
% of Net Assets
Transferable securities and money market instruments admitted to official exchange listing or dealt in on another regulated market
corporate Bonds
argentinaTelecom Argentina SA, Reg. S 8%
18/07/2026 USD 1,875,000 1,747,852 0.25
1,747,852 0.25
BelgiumLBC Tank Terminals Holding Netherlands
BV, 144A 6.875% 15/05/2023 USD 3,310,000 3,320,344 0.48
3,320,344 0.48
BrazilBraskem Netherlands Finance BV, Reg. S
4.5% 31/01/2030 USD 1,250,000 1,282,825 0.19 JSM Global Sarl, Reg. S 4.75%
20/10/2030 USD 1,250,000 1,347,669 0.19 Minerva Luxembourg SA, 144A 5.875%
19/01/2028 USD 1,500,000 1,620,390 0.23
4,250,884 0.61
Burkina fasoIAMGOLD Corp., 144A 5.75%
15/10/2028 USD 2,425,000 2,464,406 0.35
2,464,406 0.35
canadaAAG FH LP, 144A 9.75% 15/07/2024 USD 1,550,000 1,476,375 0.21 Baytex Energy Corp., 144A 5.625%
01/06/2024 USD 2,450,000 1,694,334 0.24 Bombardier, Inc., 144A 6.125%
15/01/2023 USD 2,250,000 2,201,625 0.31 Empire Communities Corp., 144A 7%
15/12/2025 USD 2,000,000 2,112,500 0.30 Garda World Security Corp., 144A 9.5%
01/11/2027 USD 3,120,000 3,460,673 0.49 Intertape Polymer Group, Inc., 144A 7%
15/10/2026 USD 3,000,000 3,192,210 0.46 Mattamy Group Corp., 144A 5.25%
15/12/2027 USD 1,625,000 1,723,516 0.25 NOVA Chemicals Corp., 144A 5.25%
01/06/2027 USD 1,000,000 1,066,770 0.15 Parkland Corp., 144A 6% 01/04/2026 USD 1,000,000 1,051,875 0.15 Parkland Corp., 144A 5.875%
15/07/2027 USD 640,000 689,200 0.10 Seven Generations Energy Ltd., 144A
5.375% 30/09/2025 USD 2,175,000 2,219,838 0.32 Vermilion Energy, Inc., 144A 5.625%
15/03/2025 USD 2,500,000 2,155,987 0.31
23,044,903 3.29
chileVTR Finance NV, Reg. S 6.375%
15/07/2028 USD 2,225,000 2,433,594 0.35
2,433,594 0.35
Global High Yield Bond Fund

233 Morgan Stanley Investment Funds 31 December 2020
The accompanying notes are an integral part of these financial statements.
Global High Yield Bond Fund (continued)
schEDUlE of InVEsTmEnTsAs at 31 December 2020
Investments Currency
Quantity/Nominal
Value
Market Value USD
% of Net Assets
Transferable securities and money market instruments admitted to official exchange listing or dealt in on another regulated market
corporate Bonds (continued)
colombiaGeopark Ltd., Reg. S 5.5% 17/01/2027 USD 450,000 450,005 0.06
450,005 0.06
DenmarkNykredit Realkredit A/S, Reg. S 4.125%
31/12/2164 EUR 1,000,000 1,296,416 0.19
1,296,416 0.19
franceAltice France SA, 144A 5.125%
15/01/2029 USD 750,000 773,906 0.11 Altice France SA, Reg. S 5.875%
01/02/2027 EUR 2,100,000 2,750,622 0.39 Altice France SA, 144A 7.375%
01/05/2026 USD 1,250,000 1,317,187 0.19 Banijay Group SAS, Reg. S 6.5%
01/03/2026 EUR 2,750,000 3,401,229 0.49 Louvre Bidco SAS, Reg. S 4.25%
30/09/2024 EUR 2,250,000 2,743,494 0.39 Loxam SAS, Reg. S 3.75% 15/07/2026 EUR 2,700,000 3,378,993 0.48 Novafives SAS, Reg. S 5% 15/06/2025 EUR 2,300,000 2,483,326 0.35 Parts Europe SA, Reg. S 6.5%
16/07/2025 EUR 2,600,000 3,336,307 0.48
20,185,064 2.88
GermanyCheplapharm Arzneimittel GmbH, Reg. S
3.5% 11/02/2027 EUR 2,625,000 3,240,847 0.47 HT Troplast GmbH, Reg. S 9.25%
15/07/2025 EUR 2,600,000 3,556,117 0.51 Nidda BondCo GmbH, Reg. S 5%
30/09/2025 EUR 2,300,000 2,861,726 0.41 Techem Verwaltungsgesellschaft 674 mbH,
Reg. S 6% 30/07/2026 EUR 1,100,000 1,418,971 0.20 Vertical Midco GmbH, Reg. S 4.375%
15/07/2027 EUR 2,600,000 3,372,196 0.48
14,449,857 2.07
IndonesiaJababeka International BV, 144A 6.5%
05/10/2023 USD 1,500,000 1,462,519 0.21
1,462,519 0.21
IrelandC&W Senior Financing DAC, 144A 6.875%
15/09/2027 USD 1,500,000 1,622,055 0.23 Fly Leasing Ltd. 5.25% 15/10/2024 USD 2,200,000 2,099,625 0.30
3,721,680 0.53
IsraelTeva Pharmaceutical Finance Netherlands
III BV 3.15% 01/10/2026 USD 1,000,000 963,135 0.14
963,135 0.14
schEDUlE of InVEsTmEnTsAs at 31 December 2020
Investments Currency
Quantity/Nominal
Value
Market Value USD
% of Net Assets
Transferable securities and money market instruments admitted to official exchange listing or dealt in on another regulated market
corporate Bonds (continued)
ItalyIntesa Sanpaolo SpA, Reg. S, FRN 6.25%
Perpetual EUR 2,550,000 3,417,326 0.49 Rossini Sarl, Reg. S 6.75% 30/10/2025 EUR 2,100,000 2,755,968 0.39 Sofima Holding SpA, Reg. S 3.75%
15/01/2028 EUR 1,950,000 2,430,646 0.35
8,603,940 1.23
luxembourgAltice Financing SA, 144A 5% 15/01/2028 USD 1,700,000 1,744,115 0.25 FAGE International SA, 144A 5.625%
15/08/2026 USD 1,000,000 1,028,560 0.15 SIG Combibloc PurchaseCo Sarl, Reg. S
2.125% 18/06/2025 EUR 2,300,000 2,973,941 0.42
5,746,616 0.82
mexicoCemex SAB de CV, Reg. S 5.45%
19/11/2029 USD 1,340,000 1,476,358 0.21
1,476,358 0.21
netherlandsTrivium Packaging Finance BV, 144A 8.5%
15/08/2027 USD 350,000 383,871 0.06 United Group BV, Reg. S 3.125%
15/02/2026 EUR 2,800,000 3,375,312 0.48 UPCB Finance VII Ltd., Reg. S 3.625%
15/06/2029 EUR 2,300,000 2,935,546 0.42 Ziggo BV, 144A 4.875% 15/01/2030 USD 2,025,000 2,132,578 0.30
8,827,307 1.26
nigeriaIHS Netherlands Holdco BV, Reg. S
7.125% 18/03/2025 USD 1,530,000 1,610,325 0.23
1,610,325 0.23
PanamaC&W Senior Financing DAC, Reg. S 7.5%
15/10/2026 USD 900,000 960,097 0.14 Cable Onda SA, Reg. S 4.5% 30/01/2030 USD 930,000 1,029,394 0.14
1,989,491 0.28
PeruHudbay Minerals, Inc., 144A 6.125%
01/04/2029 USD 960,000 1,036,800 0.15 Hudbay Minerals, Inc., 144A 7.625%
15/01/2025 USD 1,000,000 1,040,625 0.15 Nexa Resources SA, Reg. S 6.5%
18/01/2028 USD 1,000,000 1,180,625 0.17
3,258,050 0.47
PortugalEDP ‑ Energias de Portugal SA, Reg. S,
FRN 4.496% 30/04/2079 EUR 2,000,000 2,701,354 0.39
2,701,354 0.39

Morgan Stanley Investment Funds 31 December 2020 234
The accompanying notes are an integral part of these financial statements.
Global High Yield Bond Fund (continued)
schEDUlE of InVEsTmEnTsAs at 31 December 2020
Investments Currency
Quantity/Nominal
Value
Market Value USD
% of Net Assets
Transferable securities and money market instruments admitted to official exchange listing or dealt in on another regulated market
corporate Bonds (continued)
spainCaixaBank SA, Reg. S, FRN 6.75%
Perpetual EUR 2,600,000 3,535,363 0.51 Grifols SA, Reg. S 2.25% 15/11/2027 EUR 2,275,000 2,836,926 0.41 Telefonica Europe BV, Reg. S, FRN 5.875%
Perpetual EUR 2,400,000 3,317,967 0.47 Tendam Brands SAU, Reg. S 5%
15/09/2024 EUR 2,150,000 2,456,511 0.35
12,146,767 1.74
swedenIntrum AB, Reg. S 3.125% 15/07/2024 EUR 2,750,000 3,392,018 0.49
3,392,018 0.49
TanzaniaHTA Group Ltd., Reg. S 7% 18/12/2025 USD 1,250,000 1,351,725 0.19
1,351,725 0.19
TurkeyEldorado Gold Corp., 144A 9.5%
01/06/2024 USD 1,754,000 1,940,178 0.28 Ulker Biskuvi Sanayi A/S, Reg. S 6.95%
30/10/2025 USD 1,250,000 1,356,025 0.19
3,296,203 0.47
United KingdomDrax Finco plc, 144A 6.625%
01/11/2025 USD 1,500,000 1,574,063 0.22 Iceland Bondco plc, Reg. S 6.75%
15/07/2024 GBP 2,150,000 2,997,437 0.43 Mclaren Finance plc, 144A 5.75%
01/08/2022 USD 2,073,000 2,021,175 0.29 Pinnacle Bidco plc, Reg. S 6.375%
15/02/2025 GBP 2,500,000 3,394,507 0.49 Virgin Media Finance plc, 144A 5%
15/07/2030 USD 1,250,000 1,298,437 0.18 Virgin Media Secured Finance plc, 144A
5.5% 15/05/2029 USD 1,425,000 1,546,609 0.22
12,832,228 1.83
United states of america99 Escrow Issuer, Inc., 144A 7.5%
15/01/2026 USD 1,300,000 1,295,125 0.18 Acadia Healthcare Co., Inc., 144A 5.5%
01/07/2028 USD 2,000,000 2,148,750 0.31 AdaptHealth LLC, 144A 6.125%
01/08/2028 USD 1,400,000 1,506,750 0.22 AdaptHealth LLC, 144A 4.625%
01/08/2029 USD 1,700,000 1,747,175 0.25 Ahern Rentals, Inc., 144A 7.375%
15/05/2023 USD 3,000,000 2,199,375 0.31 AHP Health Partners, Inc., 144A 9.75%
15/07/2026 USD 2,696,000 2,985,308 0.43 Akumin, Inc., 144A 7% 01/11/2025 USD 1,822,000 1,919,932 0.27 Albertsons Cos., Inc., 144A 5.875%
15/02/2028 USD 500,000 544,940 0.08 Alcoa Nederland Holding BV, 144A 5.5%
15/12/2027 USD 1,700,000 1,846,625 0.26
schEDUlE of InVEsTmEnTsAs at 31 December 2020
Investments Currency
Quantity/Nominal
Value
Market Value USD
% of Net Assets
Transferable securities and money market instruments admitted to official exchange listing or dealt in on another regulated market
corporate Bonds (continued)
United states of america (continued)Alliant Holdings Intermediate LLC, 144A
6.75% 15/10/2027 USD 2,300,000 2,447,637 0.35 American Axle & Manufacturing, Inc.
6.875% 01/07/2028 USD 2,500,000 2,679,575 0.38 American Builders & Contractors Supply
Co., Inc., 144A 5.875% 15/05/2026 USD 1,000,000 1,038,125 0.15 American Midstream Partners LP, 144A
9.5% 15/12/2021 USD 3,100,000 3,080,238 0.44 American Woodmark Corp., 144A 4.875%
15/03/2026 USD 1,600,000 1,645,696 0.23 AMN Healthcare, Inc., 144A 4%
15/04/2029 USD 600,000 615,000 0.09 Apex Tool Group LLC, 144A 9%
15/02/2023 USD 3,000,000 2,947,500 0.42 Aramark Services, Inc., 144A 6.375%
01/05/2025 USD 500,000 537,535 0.08 Arches Buyer, Inc., 144A 4.25%
01/06/2028 USD 575,000 584,703 0.08 Archrock Partners LP, 144A 6.25%
01/04/2028 USD 950,000 993,938 0.14 Archrock Partners LP, 144A 6.875%
01/04/2027 USD 750,000 809,010 0.12 Asbury Automotive Group, Inc. 4.75%
01/03/2030 USD 835,000 896,581 0.13 Ashland Services BV, Reg. S 2%
30/01/2028 EUR 2,800,000 3,439,211 0.49 Ashton Woods USA LLC, 144A 6.625%
15/01/2028 USD 2,550,000 2,690,250 0.38 AssuredPartners, Inc., 144A 5.625%
15/01/2029 USD 1,000,000 1,046,250 0.15 At Home Holding III, Inc., 144A 8.75%
01/09/2025 USD 3,000,000 3,253,125 0.46 Avaya, Inc., 144A 6.125% 15/09/2028 USD 1,525,000 1,625,337 0.23 Avient Corp., 144A 5.75% 15/05/2025 USD 2,000,000 2,127,500 0.30 Axalta Coating Systems LLC, 144A 4.75%
15/06/2027 USD 1,000,000 1,065,000 0.15 Bausch Health Cos., Inc., 144A 9%
15/12/2025 USD 1,000,000 1,105,825 0.16 Bausch Health Cos., Inc., 144A 6.125%
15/04/2025 USD 500,000 514,250 0.07 Beacon Roofing Supply, Inc., 144A 4.875%
01/11/2025 USD 1,000,000 1,026,815 0.15 Beazer Homes USA, Inc. 5.875%
15/10/2027 USD 2,000,000 2,108,750 0.30 Block Communications, Inc., 144A 4.875%
01/03/2028 USD 2,750,000 2,838,949 0.41 Blue Racer Midstream LLC, 144A 6.625%
15/07/2026 USD 2,450,000 2,474,500 0.35 Boxer Parent Co., Inc., 144A 7.125%
02/10/2025 USD 575,000 624,960 0.09 Boxer Parent Co., Inc., 144A 9.125%
01/03/2026 USD 1,625,000 1,752,969 0.25 Boyd Gaming Corp. 6% 15/08/2026 USD 1,900,000 1,980,750 0.28 Boyne USA, Inc., 144A 7.25%
01/05/2025 USD 1,925,000 2,022,453 0.29 Brand Industrial Services, Inc., 144A 8.5%
15/07/2025 USD 3,250,000 3,327,187 0.48 Builders FirstSource, Inc., 144A 5%
01/03/2030 USD 2,000,000 2,168,740 0.31 Burlington Coat Factory Warehouse Corp.,
144A 6.25% 15/04/2025 USD 1,005,000 1,069,069 0.15 BY Crown Parent LLC, 144A 7.375%
15/10/2024 USD 2,250,000 2,297,576 0.33 Cable One, Inc., 144A 4% 15/11/2030 USD 800,000 832,500 0.12 Caesars Entertainment, Inc., 144A 6.25%
01/07/2025 USD 1,575,000 1,679,352 0.24

235 Morgan Stanley Investment Funds 31 December 2020
The accompanying notes are an integral part of these financial statements.
Global High Yield Bond Fund (continued)
schEDUlE of InVEsTmEnTsAs at 31 December 2020
Investments Currency
Quantity/Nominal
Value
Market Value USD
% of Net Assets
Transferable securities and money market instruments admitted to official exchange listing or dealt in on another regulated market
corporate Bonds (continued)
United states of america (continued)Cargo Aircraft Management, Inc., 144A
4.75% 01/02/2028 USD 1,500,000 1,549,687 0.22 Carvana Co., 144A 5.875% 01/10/2028 USD 2,250,000 2,331,832 0.33 Catalent Pharma Solutions, Inc., 144A 5%
15/07/2027 USD 500,000 528,915 0.08 CCM Merger, Inc., 144A 6.375%
01/05/2026 USD 1,600,000 1,684,000 0.24 CCO Holdings LLC, 144A 5% 01/02/2028 USD 1,000,000 1,053,500 0.15 CD&R Smokey Buyer, Inc., 144A 6.75%
15/07/2025 USD 2,475,000 2,648,250 0.38 CDK Global, Inc., 144A 5.25%
15/05/2029 USD 500,000 554,430 0.08 Central Garden & Pet Co. 5.125%
01/02/2028 USD 500,000 530,530 0.08 Century Communities, Inc. 5.875%
15/07/2025 USD 1,000,000 1,043,645 0.15 Century Communities, Inc. 6.75%
01/06/2027 USD 1,000,000 1,070,605 0.15 CenturyLink, Inc., 144A 4% 15/02/2027 USD 1,500,000 1,541,430 0.22 Change Healthcare Holdings LLC, 144A
5.75% 01/03/2025 USD 1,600,000 1,634,000 0.23 Chemours Co. (The), 144A 5.75%
15/11/2028 USD 2,550,000 2,605,781 0.37 Chobani LLC, 144A 7.5% 15/04/2025 USD 2,475,000 2,602,995 0.37 Clarios Global LP, 144A 8.5% 15/05/2027 USD 2,250,000 2,448,134 0.35 Clear Channel International BV, 144A
6.625% 01/08/2025 USD 750,000 790,312 0.11 Clear Channel Worldwide Holdings, Inc.,
144A 5.125% 15/08/2027 USD 700,000 707,875 0.10 Clear Channel Worldwide Holdings, Inc.
9.25% 15/02/2024 USD 2,307,000 2,338,963 0.33 Cleaver‑Brooks, Inc., 144A 7.875%
01/03/2023 USD 3,250,000 3,221,221 0.46 Compass Group Diversified Holdings LLC,
144A 8% 01/05/2026 USD 2,970,000 3,129,073 0.45 Core & Main Holdings LP, 144A 8.625%
15/09/2024 USD 1,500,000 1,538,280 0.22 Core & Main LP, 144A 6.125%
15/08/2025 USD 1,474,000 1,526,511 0.22 Cornerstone Building Brands, Inc., 144A
6.125% 15/01/2029 USD 750,000 798,281 0.11 Cornerstone Building Brands, Inc., 144A
8% 15/04/2026 USD 2,500,000 2,634,375 0.38 CP Atlas Buyer, Inc., 144A 7%
01/12/2028 USD 3,000,000 3,125,625 0.45 CrownRock LP, 144A 5.625%
15/10/2025 USD 2,900,000 2,967,005 0.42 CSC Holdings LLC, 144A 4.625%
01/12/2030 USD 500,000 520,693 0.07 CSC Holdings LLC, 144A 6.5%
01/02/2029 USD 900,000 1,017,833 0.15 CSC Holdings LLC, 144A 5.75%
15/01/2030 USD 1,770,000 1,935,946 0.28 CTR Partnership LP, REIT 5.25%
01/06/2025 USD 1,452,000 1,508,113 0.22 Cushman & Wakefield US Borrower LLC,
144A 6.75% 15/05/2028 USD 1,300,000 1,434,063 0.20 Dana, Inc. 5.625% 15/06/2028 USD 1,000,000 1,078,365 0.15 Dana, Inc. 5.375% 15/11/2027 USD 750,000 796,406 0.11 DCP Midstream Operating LP 5.625%
15/07/2027 USD 750,000 832,838 0.12 Dealer Tire LLC, 144A 8% 01/02/2028 USD 2,159,000 2,288,950 0.33 Delta Air Lines, Inc., 144A 4.5%
20/10/2025 USD 2,750,000 2,950,932 0.42 Diamond Sports Group LLC, 144A 6.625%
15/08/2027 USD 1,500,000 905,625 0.13
schEDUlE of InVEsTmEnTsAs at 31 December 2020
Investments Currency
Quantity/Nominal
Value
Market Value USD
% of Net Assets
Transferable securities and money market instruments admitted to official exchange listing or dealt in on another regulated market
corporate Bonds (continued)
United states of america (continued)Diebold Nixdorf, Inc., 144A 9.375%
15/07/2025 USD 1,050,000 1,177,969 0.17 Diebold Nixdorf, Inc. 8.5% 15/04/2024 USD 2,000,000 2,027,500 0.29 DISH DBS Corp. 7.75% 01/07/2026 USD 1,496,000 1,677,427 0.24 Downstream Development Authority of the
Quapaw Tribe of Oklahoma, 144A 10.5% 15/02/2023 USD 3,517,000 3,582,574 0.51
Edgewell Personal Care Co., 144A 5.5% 01/06/2028 USD 1,750,000 1,883,674 0.27
Endeavor Energy Resources LP, 144A 5.5% 30/01/2026 USD 1,150,000 1,182,229 0.17
Endeavor Energy Resources LP, 144A 5.75% 30/01/2028 USD 1,100,000 1,175,900 0.17
Endo Dac, 144A 6% 15/07/2023 USD 2,332,000 1,989,464 0.28 Energy Ventures Gom LLC, 144A 11%
15/02/2023 USD 2,400,000 2,280,000 0.33 EnerSys, 144A 4.375% 15/12/2027 USD 1,025,000 1,086,500 0.16 EnPro Industries, Inc. 5.75% 15/10/2026 USD 1,875,000 1,998,863 0.29 Entercom Media Corp., 144A 7.25%
01/11/2024 USD 250,000 249,844 0.04 Entercom Media Corp., 144A 6.5%
01/05/2027 USD 1,775,000 1,810,163 0.26 EW Scripps Co. (The), 144A 5.125%
15/05/2025 USD 3,000,000 3,067,830 0.44 Exide Technologies 8.625% 01/02/2018 USD 1,750,000 2,187 – FelCor Lodging LP, REIT 6% 01/06/2025 USD 500,000 509,322 0.07 Ferrellgas LP, 144A 10% 15/04/2025 USD 1,400,000 1,552,250 0.22 Flex Acquisition Co., Inc., 144A 6.875%
15/01/2025 USD 2,760,000 2,808,300 0.40 Ford Motor Co. 8.5% 21/04/2023 USD 1,750,000 1,972,434 0.28 Ford Motor Co. 9% 22/04/2025 USD 3,000,000 3,685,515 0.53 Ford Motor Credit Co. LLC 4.125%
17/08/2027 USD 550,000 576,812 0.08 Forestar Group, Inc., 144A 5%
01/03/2028 USD 2,325,000 2,406,015 0.34 Freedom Mortgage Corp., 144A 7.625%
01/05/2026 USD 1,650,000 1,726,312 0.25 Freedom Mortgage Corp., 144A 8.25%
15/04/2025 USD 1,000,000 1,047,500 0.15 FXI Holdings, Inc., 144A 7.875%
01/11/2024 USD 2,957,000 2,986,570 0.43 GCI LLC, 144A 4.75% 15/10/2028 USD 1,025,000 1,095,136 0.16 Genworth Mortgage Holdings, Inc., 144A
6.5% 15/08/2025 USD 785,000 851,234 0.12 G‑III Apparel Group Ltd., 144A 7.875%
15/08/2025 USD 1,250,000 1,367,187 0.20 Global Partners LP 7% 01/08/2027 USD 2,500,000 2,682,337 0.38 Golden Nugget, Inc., 144A 8.75%
01/10/2025 USD 1,750,000 1,814,531 0.26 Graham Packaging Co., Inc., 144A
7.125% 15/08/2028 USD 2,000,000 2,203,750 0.31 Gray Television, Inc., 144A 4.75%
15/10/2030 USD 1,500,000 1,530,937 0.22 Gray Television, Inc., 144A 5.875%
15/07/2026 USD 1,000,000 1,050,625 0.15 Great Lakes Dredge & Dock Corp. 8%
15/05/2022 USD 1,915,000 1,970,717 0.28 Greif, Inc., 144A 6.5% 01/03/2027 USD 250,000 264,844 0.04 Griffon Corp. 5.75% 01/03/2028 USD 3,100,000 3,282,125 0.47 Grinding Media, Inc., 144A 7.375%
15/12/2023 USD 2,875,000 2,925,313 0.42 Group 1 Automotive, Inc., 144A 4%
15/08/2028 USD 650,000 667,485 0.10 GTCR AP Finance, Inc., 144A 8%
15/05/2027 USD 2,000,000 2,176,900 0.31

Morgan Stanley Investment Funds 31 December 2020 236
The accompanying notes are an integral part of these financial statements.
Global High Yield Bond Fund (continued)
schEDUlE of InVEsTmEnTsAs at 31 December 2020
Investments Currency
Quantity/Nominal
Value
Market Value USD
% of Net Assets
Transferable securities and money market instruments admitted to official exchange listing or dealt in on another regulated market
corporate Bonds (continued)
United states of america (continued)Guitar Center Escrow Issuer II, Inc., 144A
8.5% 15/01/2026 USD 650,000 677,219 0.10 Hadrian Merger Sub, Inc., 144A 8.5%
01/05/2026 USD 594,000 615,420 0.09 Hanesbrands, Inc., 144A 4.875%
15/05/2026 USD 1,075,000 1,169,062 0.17 Harsco Corp., 144A 5.75% 31/07/2027 USD 2,506,000 2,654,794 0.38 HB Fuller Co. 4.25% 15/10/2028 USD 1,000,000 1,026,875 0.15 H‑Food Holdings LLC, 144A 8.5%
01/06/2026 USD 2,750,000 2,857,319 0.41 Hillenbrand, Inc. 5.75% 15/06/2025 USD 1,004,000 1,086,203 0.16 HUB International Ltd., 144A 7%
01/05/2026 USD 2,050,000 2,140,979 0.31 Hunt Cos., Inc., 144A 6.25% 15/02/2026 USD 2,992,000 3,075,492 0.44 Icahn Enterprises LP 6.25% 15/05/2026 USD 500,000 530,620 0.08 iHeartCommunications, Inc., 144A 5.25%
15/08/2027 USD 2,750,000 2,871,523 0.41 Ingram Micro, Inc. 5.45% 15/12/2024 USD 2,750,000 3,165,697 0.45 Innophos Holdings, Inc., 144A 9.375%
15/02/2028 USD 3,000,000 3,294,375 0.47 Installed Building Products, Inc., 144A
5.75% 01/02/2028 USD 1,850,000 1,976,836 0.28 Interface, Inc., 144A 5.5% 01/12/2028 USD 575,000 606,266 0.09 International Game Technology plc, Reg. S
3.5% 15/06/2026 EUR 2,650,000 3,371,920 0.48 International Wire Group, Inc., 144A
10.75% 01/08/2021 USD 2,350,000 2,351,469 0.34 IRB Holding Corp., 144A 7% 15/06/2025 USD 1,350,000 1,477,271 0.21 Iron Mountain, Inc., REIT, 144A 5.25%
15/07/2030 USD 1,000,000 1,081,250 0.15 iStar, Inc., REIT 4.25% 01/08/2025 USD 500,000 495,000 0.07 J2 Global, Inc., 144A 4.625%
15/10/2030 USD 2,250,000 2,377,969 0.34 Jaguar Holding Co. II, 144A 5%
15/06/2028 USD 1,000,000 1,068,750 0.15 JB Poindexter & Co., Inc., 144A 7.125%
15/04/2026 USD 2,846,000 3,016,760 0.43 JPW Industries Holding Corp., 144A 9%
01/10/2024 USD 3,500,000 3,465,000 0.49 Kaiser Aluminum Corp., 144A 6.5%
01/05/2025 USD 1,000,000 1,072,500 0.15 Kaiser Aluminum Corp., 144A 4.625%
01/03/2028 USD 1,000,000 1,039,190 0.15 KBR, Inc., 144A 4.75% 30/09/2028 USD 1,125,000 1,174,219 0.17 Ken Garff Automotive LLC, 144A 4.875%
15/09/2028 USD 950,000 989,781 0.14 Kenan Advantage Group, Inc. (The), 144A
7.875% 31/07/2023 USD 2,755,000 2,751,846 0.39 Kennedy‑Wilson, Inc. 5.875% 01/04/2024 USD 2,135,000 2,164,356 0.31 Koppers, Inc., 144A 6% 15/02/2025 USD 2,370,000 2,445,544 0.35 Kraton Polymers LLC, 144A 4.25%
15/12/2025 USD 1,025,000 1,049,344 0.15 Kratos Defense & Security Solutions, Inc.,
144A 6.5% 30/11/2025 USD 2,400,000 2,525,748 0.36 L Brands, Inc. 6.95% 01/03/2033 USD 1,000,000 1,037,500 0.15 LBM Acquisition LLC, 144A 6.25%
15/01/2029 USD 1,925,000 2,000,797 0.29 LCPR Senior Secured Financing DAC,
144A 6.75% 15/10/2027 USD 2,750,000 2,963,125 0.42 LD Holdings Group LLC, 144A 6.5%
01/11/2025 USD 1,150,000 1,213,250 0.17 Level 3 Financing, Inc., 144A 4.25%
01/07/2028 USD 2,000,000 2,057,000 0.29 LGI Homes, Inc., 144A 6.875%
15/07/2026 USD 1,075,000 1,131,438 0.16 Lions Gate Capital Holdings LLC, 144A
6.375% 01/02/2024 USD 1,525,000 1,556,438 0.22
schEDUlE of InVEsTmEnTsAs at 31 December 2020
Investments Currency
Quantity/Nominal
Value
Market Value USD
% of Net Assets
Transferable securities and money market instruments admitted to official exchange listing or dealt in on another regulated market
corporate Bonds (continued)
United states of america (continued)Lions Gate Capital Holdings LLC, 144A
5.875% 01/11/2024 USD 1,000,000 1,018,645 0.15 Lithia Motors, Inc., 144A 4.625%
15/12/2027 USD 1,000,000 1,056,875 0.15 Macy’s, Inc., 144A 8.375% 15/06/2025 USD 2,250,000 2,483,865 0.35 Magnolia Oil & Gas Operating LLC, 144A
6% 01/08/2026 USD 1,960,000 2,004,100 0.29 Manitowoc Co., Inc. (The), 144A 9%
01/04/2026 USD 1,850,000 2,001,469 0.29 Marriott Ownership Resorts, Inc., 144A
6.125% 15/09/2025 USD 1,000,000 1,067,500 0.15 Martin Midstream Partners LP, 144A 10%
29/02/2024 USD 516,021 527,631 0.08 Martin Midstream Partners LP, 144A
11.5% 28/02/2025 USD 2,343,359 2,267,200 0.32 Matador Resources Co. 5.875%
15/09/2026 USD 2,761,000 2,641,642 0.38 Mauser Packaging Solutions Holding Co.,
144A 7.25% 15/04/2025 USD 3,250,000 3,286,562 0.47 MDC Partners, Inc., 144A 6.5%
01/05/2024 USD 2,661,000 2,701,607 0.39 Meritor, Inc., 144A 4.5% 15/12/2028 USD 425,000 436,422 0.06 Meritor, Inc., 144A 6.25% 01/06/2025 USD 700,000 756,084 0.11 Meritor, Inc. 6.25% 15/02/2024 USD 484,000 495,142 0.07 MGM Growth Properties Operating
Partnership LP, REIT 5.75% 01/02/2027 USD 1,250,000 1,404,294 0.20 MGM Resorts International 6.75%
01/05/2025 USD 1,250,000 1,355,706 0.19 Michael Baker International LLC, 144A
8.75% 01/03/2023 USD 3,000,000 3,030,000 0.43 Midcontinent Communications, 144A
5.375% 15/08/2027 USD 2,700,000 2,831,112 0.40 Mileage Plus Holdings LLC, 144A 6.5%
20/06/2027 USD 3,250,000 3,499,844 0.50 Minerals Technologies, Inc., 144A 5%
01/07/2028 USD 1,750,000 1,824,375 0.26 Moog, Inc., 144A 4.25% 15/12/2027 USD 1,000,000 1,038,750 0.15 MPT Operating Partnership LP, REIT
4.625% 01/08/2029 USD 1,000,000 1,070,470 0.15 MTS Systems Corp., 144A 5.75%
15/08/2027 USD 1,750,000 1,904,569 0.27 Murphy Oil Corp. 5.75% 15/08/2025 USD 1,000,000 987,605 0.14 Murphy Oil Corp. 5.875% 01/12/2027 USD 1,500,000 1,486,410 0.21 Murphy Oil USA, Inc. 4.75% 15/09/2029 USD 1,089,000 1,160,945 0.17 Murphy Oil USA, Inc. 5.625% 01/05/2027 USD 1,250,000 1,326,325 0.19 Nathan’s Famous, Inc., 144A 6.625%
01/11/2025 USD 3,133,000 3,230,906 0.46 National CineMedia LLC 5.75%
15/08/2026 USD 2,370,000 1,702,987 0.24 New Enterprise Stone & Lime Co., Inc.,
144A 9.75% 15/07/2028 USD 1,700,000 1,870,000 0.27 New Enterprise Stone & Lime Co., Inc.,
144A 6.25% 15/03/2026 USD 1,885,000 1,935,659 0.28 New Home Co., Inc. (The), 144A 7.25%
15/10/2025 USD 2,900,000 2,985,521 0.43 Nexstar Broadcasting, Inc., 144A 5.625%
15/07/2027 USD 2,100,000 2,255,537 0.32 Nielsen Finance LLC, 144A 5.625%
01/10/2028 USD 1,975,000 2,149,639 0.31 NMI Holdings, Inc., 144A 7.375%
01/06/2025 USD 1,967,000 2,205,882 0.32 Novelis Corp., 144A 4.75% 30/01/2030 USD 1,500,000 1,607,813 0.23 NuStar Logistics LP 6.375% 01/10/2030 USD 625,000 709,172 0.10 Occidental Petroleum Corp. 6.125%
01/01/2031 USD 4,733,000 5,087,028 0.73 Occidental Petroleum Corp. 6.95%
01/07/2024 USD 2,250,000 2,435,625 0.35

237 Morgan Stanley Investment Funds 31 December 2020
The accompanying notes are an integral part of these financial statements.
Global High Yield Bond Fund (continued)
schEDUlE of InVEsTmEnTsAs at 31 December 2020
Investments Currency
Quantity/Nominal
Value
Market Value USD
% of Net Assets
Transferable securities and money market instruments admitted to official exchange listing or dealt in on another regulated market
corporate Bonds (continued)
United states of america (continued)Occidental Petroleum Corp. 2.9%
15/08/2024 USD 2,250,000 2,169,000 0.31 Occidental Petroleum Corp. 3.2%
15/08/2026 USD 750,000 702,656 0.10 Oceaneering International, Inc. 6%
01/02/2028 USD 2,750,000 2,464,688 0.35 Olin Corp., 144A 9.5% 01/06/2025 USD 750,000 940,912 0.13 ON Semiconductor Corp., 144A 3.875%
01/09/2028 USD 1,075,000 1,111,281 0.16 Outfront Media Capital LLC, 144A 4.625%
15/03/2030 USD 1,500,000 1,524,375 0.22 Owens‑Brockway Glass Container, Inc.,
144A 6.625% 13/05/2027 USD 2,000,000 2,168,750 0.31 Oxford Finance LLC, 144A 6.375%
15/12/2022 USD 2,750,000 2,752,791 0.39 P&L Development LLC, 144A 7.75%
15/11/2025 USD 1,150,000 1,239,125 0.18 PBF Holding Co. LLC, 144A 9.25%
15/05/2025 USD 1,000,000 994,310 0.14 PBF Holding Co. LLC 6% 15/02/2028 USD 2,250,000 1,286,719 0.18 PennyMac Financial Services, Inc., 144A
5.375% 15/10/2025 USD 1,750,000 1,852,812 0.26 Performance Food Group, Inc., 144A
6.875% 01/05/2025 USD 1,484,000 1,599,641 0.23 PetSmart, Inc., 144A 7.125%
15/03/2023 USD 3,250,000 3,254,062 0.46 PG&E Corp. 5.25% 01/07/2030 USD 2,250,000 2,477,812 0.36 PGT Innovations, Inc., 144A 6.75%
01/08/2026 USD 2,490,000 2,657,602 0.38 Picasso Finance Sub, Inc., 144A 6.125%
15/06/2025 USD 2,050,000 2,203,114 0.31 Plastipak Holdings, Inc., 144A 6.25%
15/10/2025 USD 2,750,000 2,837,656 0.41 Post Holdings, Inc., 144A 5.5%
15/12/2029 USD 1,075,000 1,173,121 0.17 Powdr Corp., 144A 6% 01/08/2025 USD 2,100,000 2,207,625 0.32 Providence Service Corp. (The), 144A
5.875% 15/11/2025 USD 1,425,000 1,509,609 0.22 Rackspace Technology Global, Inc., 144A
5.375% 01/12/2028 USD 1,750,000 1,832,578 0.26 Radian Group, Inc. 6.625% 15/03/2025 USD 500,000 567,187 0.08 Radian Group, Inc. 4.875% 15/03/2027 USD 500,000 550,350 0.08 Radiate Holdco LLC, 144A 6.5%
15/09/2028 USD 2,550,000 2,691,844 0.38 RHP Hotel Properties LP 4.75%
15/10/2027 USD 1,000,000 1,031,690 0.15 Rite Aid Corp., 144A 8% 15/11/2026 USD 1,215,000 1,298,325 0.19 Rite Aid Corp., 144A 7.5% 01/07/2025 USD 1,131,000 1,182,489 0.17 Rockies Express Pipeline LLC, 144A 3.6%
15/05/2025 USD 1,900,000 1,962,168 0.28 RP Escrow Issuer LLC, 144A 5.25%
15/12/2025 USD 1,725,000 1,804,885 0.26 Sally Holdings LLC 5.625% 01/12/2025 USD 1,968,000 2,025,072 0.29 Schweitzer‑Mauduit International, Inc.,
144A 6.875% 01/10/2026 USD 3,000,000 3,190,680 0.46 Scientific Games International, Inc., 144A
8.25% 15/03/2026 USD 3,250,000 3,496,334 0.50 Select Medical Corp., 144A 6.25%
15/08/2026 USD 750,000 806,280 0.11 Service Corp. International 3.375%
15/08/2030 USD 500,000 521,043 0.08 Service Corp. International 5.125%
01/06/2029 USD 500,000 554,595 0.08 Simmons Foods, Inc., 144A 5.75%
01/11/2024 USD 2,815,000 2,878,337 0.41 Sirius XM Radio, Inc., 144A 5%
01/08/2027 USD 1,500,000 1,595,963 0.23
schEDUlE of InVEsTmEnTsAs at 31 December 2020
Investments Currency
Quantity/Nominal
Value
Market Value USD
% of Net Assets
Transferable securities and money market instruments admitted to official exchange listing or dealt in on another regulated market
corporate Bonds (continued)
United states of america (continued)Sotheby’s, 144A 7.375% 15/10/2027 USD 1,550,000 1,663,057 0.24 Spectrum Brands, Inc., 144A 5%
01/10/2029 USD 1,355,000 1,449,850 0.21 Speedway Motorsports LLC, 144A 4.875%
01/11/2027 USD 1,800,000 1,777,500 0.25 Spirit Loyalty Cayman Ltd., 144A 8%
20/09/2025 USD 1,000,000 1,132,479 0.16 SRM Escrow Issuer LLC, 144A 6%
01/11/2028 USD 2,250,000 2,355,817 0.34 Standard Industries, Inc., 144A 5%
15/02/2027 USD 700,000 732,813 0.10 Station Casinos LLC, 144A 4.5%
15/02/2028 USD 1,900,000 1,917,812 0.27 Stevens Holding Co., Inc., 144A 6.125%
01/10/2026 USD 1,800,000 1,950,408 0.28 StoneX Group, Inc., 144A 8.625%
15/06/2025 USD 2,572,000 2,801,872 0.40 Sugarhouse HSP Gaming Prop Mezz LP,
144A 5.875% 15/05/2025 USD 3,000,000 2,962,500 0.42 Summit Materials LLC, 144A 5.25%
15/01/2029 USD 1,500,000 1,576,875 0.23 Sunoco LP, 144A 4.5% 15/05/2029 USD 600,000 625,125 0.09 Surgery Center Holdings, Inc., 144A 10%
15/04/2027 USD 900,000 996,188 0.14 Surgery Center Holdings, Inc., 144A 6.75%
01/07/2025 USD 2,250,000 2,296,406 0.33 Switch Ltd., 144A 3.75% 15/09/2028 USD 1,075,000 1,093,141 0.16 Tallgrass Energy Partners LP, 144A 7.5%
01/10/2025 USD 1,102,000 1,179,829 0.17 Tallgrass Energy Partners LP, 144A 6%
31/12/2030 USD 600,000 619,506 0.09 Targa Resources Partners LP 5.5%
01/03/2030 USD 1,250,000 1,354,300 0.19 Taylor Morrison Communities, Inc., 144A
5.875% 15/06/2027 USD 1,000,000 1,135,600 0.16 Taylor Morrison Communities, Inc., 144A
6.625% 15/07/2027 USD 700,000 759,150 0.11 TEGNA, Inc. 5% 15/09/2029 USD 750,000 791,955 0.11 TEGNA, Inc., 144A 4.625% 15/03/2028 USD 1,500,000 1,545,937 0.22 Teleflex, Inc. 4.875% 01/06/2026 USD 1,050,000 1,097,093 0.16 Tempur Sealy International, Inc. 5.5%
15/06/2026 USD 1,400,000 1,452,500 0.21 Tenet Healthcare Corp. 7% 01/08/2025 USD 2,000,000 2,071,050 0.30 Tenneco, Inc., 144A 7.875% 15/01/2029 USD 1,500,000 1,686,952 0.24 Titan International, Inc. 6.5% 30/11/2023 USD 2,975,000 2,762,719 0.39 Tms International Holding Corp., 144A
7.25% 15/08/2025 USD 3,175,000 3,238,500 0.46 TopBuild Corp., 144A 5.625%
01/05/2026 USD 1,010,000 1,049,769 0.15 TransDigm, Inc. 5.5% 15/11/2027 USD 1,000,000 1,054,000 0.15 TreeHouse Foods, Inc. 4% 01/09/2028 USD 500,000 515,938 0.07 Trident TPI Holdings, Inc., 144A 6.625%
01/11/2025 USD 3,000,000 3,055,935 0.44 TriMas Corp., 144A 4.875% 15/10/2025 USD 1,000,000 1,027,345 0.15 TripAdvisor, Inc., 144A 7% 15/07/2025 USD 500,000 542,637 0.08 Triumph Group, Inc., 144A 8.875%
01/06/2024 USD 975,000 1,071,891 0.15 Triumph Group, Inc., 144A 6.25%
15/09/2024 USD 2,025,000 2,012,344 0.29 Truck Hero, Inc., 144A 8.5% 21/04/2024 USD 3,000,000 3,194,685 0.46 TTM Technologies, Inc., 144A 5.625%
01/10/2025 USD 2,968,000 3,049,308 0.44 Tutor Perini Corp., 144A 6.875%
01/05/2025 USD 2,560,000 2,512,000 0.36 Unisys Corp., 144A 6.875% 01/11/2027 USD 1,250,000 1,368,750 0.20 Univision Communications, Inc., 144A
5.125% 15/02/2025 USD 3,000,000 3,028,125 0.43

Morgan Stanley Investment Funds 31 December 2020 238
The accompanying notes are an integral part of these financial statements.
Global High Yield Bond Fund (continued)
schEDUlE of InVEsTmEnTsAs at 31 December 2020
Investments Currency
Quantity/Nominal
Value
Market Value USD
% of Net Assets
Transferable securities and money market instruments admitted to official exchange listing or dealt in on another regulated market
corporate Bonds (continued)
United states of america (continued)US Concrete, Inc., 144A 5.125%
01/03/2029 USD 1,250,000 1,283,594 0.18 US Foods, Inc., 144A 5.875% 15/06/2024 USD 1,250,000 1,269,531 0.18 US Foods, Inc., 144A 6.25% 15/04/2025 USD 1,000,000 1,070,085 0.15 Vail Resorts, Inc., 144A 6.25%
15/05/2025 USD 1,500,000 1,609,620 0.23 Viper Energy Partners LP, 144A 5.375%
01/11/2027 USD 2,400,000 2,512,056 0.36 Watco Cos. LLC, 144A 6.5% 15/06/2027 USD 2,850,000 3,090,469 0.44 WESCO Distribution, Inc., 144A 7.125%
15/06/2025 USD 800,000 880,060 0.13 Winnebago Industries, Inc., 144A 6.25%
15/07/2028 USD 1,350,000 1,453,781 0.21 Wolverine World Wide, Inc., 144A 5%
01/09/2026 USD 1,775,000 1,816,047 0.26 WPX Energy, Inc. 5.25% 15/10/2027 USD 1,250,000 1,326,013 0.19 WPX Energy, Inc. 4.5% 15/01/2030 USD 1,000,000 1,061,500 0.15 Wyndham Destinations, Inc., 144A 6.625%
31/07/2026 USD 1,250,000 1,432,812 0.20 Wyndham Destinations, Inc., 144A 4.625%
01/03/2030 USD 500,000 529,140 0.08 Wyndham Hotels & Resorts, Inc., 144A
4.375% 15/08/2028 USD 1,275,000 1,327,179 0.19 XPO Logistics, Inc., 144A 6.25%
01/05/2025 USD 1,000,000 1,078,015 0.15
512,596,237 73.26
ZambiaFirst Quantum Minerals Ltd., 144A 6.875%
15/10/2027 USD 1,000,000 1,084,050 0.16 First Quantum Minerals Ltd., 144A 7.5%
01/04/2025 USD 1,500,000 1,554,375 0.22
2,638,425 0.38
Total corporate Bonds 662,257,703 94.66
Total Transferable securities and money market instruments admitted to official exchange listing or dealt in on another regulated market 662,257,703 94.66
Other transferable securities and money market instruments not admitted to official exchange listing or dealt in on another regulated market
Warrants
netherlandssyncreon Group BV 30/11/2020* USD 15,358 237,742 0.03
237,742 0.03
Total Warrants 237,742 0.03
Equities
netherlandssyncreon Group BV* USD 9,762 447,490 0.07
447,490 0.07
schEDUlE of InVEsTmEnTsAs at 31 December 2020
Investments Currency
Quantity/Nominal
Value
Market Value USD
% of Net Assets
Other transferable securities and money market instruments not admitted to official exchange listing or dealt in on another regulated market
Equities (continued)
United states of americaAmerican Gilsonite Co.* USD 1,750 826,875 0.12 Iracore International Holdings, Inc* USD 2,058 252,043 0.03 Lonestar Resources US, Inc.* USD 134,400 326,592 0.05 UC Holdings, Inc.* USD 24,253 221,430 0.03
1,626,940 0.23
Total Equities 2,074,430 0.30
Total other transferable securities and money market instruments not admitted to official exchange listing or dealt in on another regulated market 2,312,172 0.33
Units of authorised UCITS or other collective investment undertakings
collective Investment schemes – UcITs
luxembourgMorgan Stanley Liquidity Funds US Dollar
Liquidity Fund – MS Reserve† USD 9,001,499 9,001,499 1.29
9,001,499 1.29
Total collective Investment schemes – UcITs 9,001,499 1.29
Exchange Traded funds
IrelandiShares EUR High Yield Corp. Bond UCITS ETF EUR 53,000 6,679,657 0.95
6,679,657 0.95
United states of americaiShares USD High Yield Corp Bond
UCITS ETF USD 63,000 6,492,150 0.93
6,492,150 0.93
Total Exchange Traded funds 13,171,807 1.88
Total Units of authorised UcITs or other collective investment undertakings 22,173,306 3.17
Total Investments 686,743,181 98.16
cash 1,196,709 0.17
other assets/(liabilities) 11,684,071 1.67
Total net assets 699,623,961 100.00
* Security is valued at its fair value under the direction of the Board of Directors.† Managed by an affiliate of the Investment Adviser.The country disclosed within the Schedule of Investments refers to the country of risk. The country of incorporation may differ.

239 Morgan Stanley Investment Funds 31 December 2020
The accompanying notes are an integral part of these financial statements.
Global High Yield Bond Fund (continued)
forward currency Exchange contracts
currency Purchased
amount Purchased
currency sold
amount sold
maturity Date counterparty
Unrealised Gain/(loss)
UsD
% of net assets
EUR 157,701 USD 193,196 04/01/2021 J.P. Morgan 294 0.00USD 43,169 EUR 35,134 05/01/2021 J.P. Morgan 62 0.00EUR 4,715,818 USD 5,666,489 26/02/2021 ANZ 126,385 0.02 EUR 47,163,832 USD 56,043,319 26/02/2021 J.P. Morgan 1,892,362 0.27 EUR 6,038,218 USD 7,370,901 26/02/2021 RBC 46,399 0.01 GBP 738,821 USD 996,041 26/02/2021 J.P. Morgan 13,477 0.00GBP 5,148,757 USD 6,868,344 26/02/2021 RBC 166,868 0.02
Unrealised Gain on forward currency Exchange contracts – assets 2,245,847 0.32
EUR hedged share classEUR 13,833 USD 16,970 04/01/2021 J.P. Morgan 2 0.00USD 30,993 EUR 25,205 05/01/2021 J.P. Morgan 68 0.00EUR 63,316,335 USD 77,022,538 08/01/2021 J.P. Morgan 669,019 0.10 USD 123,620 EUR 100,523 08/01/2021 J.P. Morgan 273 0.00
Unrealised Gain on naV hedged share classes forward currency Exchange contracts – assets 669,362 0.10
ZaR hedged share classZAR 180,656 USD 12,078 08/01/2021 J.P. Morgan 245 0.00
Unrealised Gain on naV hedged share classes forward currency Exchange contracts – assets 245 0.00
Total Unrealised Gain on forward currency Exchange contracts – assets 2,915,454 0.42
USD 661,830 EUR 540,236 04/01/2021 J.P. Morgan (1,007) 0.00EUR 7,468 USD 9,176 05/01/2021 J.P. Morgan (13) 0.00EUR 1,675,000 USD 2,059,364 26/02/2021 RBC (1,807) 0.00USD 4,152,565 EUR 3,430,015 26/02/2021 ANZ (60,839) (0.01) USD 6,308,636 EUR 5,250,000 26/02/2021 J.P. Morgan (140,423) (0.02) USD 5,117,601 EUR 4,200,000 26/02/2021 RBC (41,647) (0.01) USD 312,820 GBP 233,230 26/02/2021 ANZ (5,863) 0.00
Unrealised loss on forward currency Exchange contracts – liabilities (251,599) (0.04)
EUR hedged share classUSD 40,741 EUR 33,209 04/01/2021 J.P. Morgan (5) 0.00EUR 100,523 USD 123,609 05/01/2021 J.P. Morgan (272) 0.00EUR 25,205 USD 30,996 08/01/2021 J.P. Morgan (69) 0.00USD 1,076,276 EUR 879,713 08/01/2021 J.P. Morgan (3,166) 0.00
ZaR hedged share classUSD 340 ZAR 5,000 05/01/2021 J.P. Morgan (1) 0.00ZAR 370,862 USD 25,367 08/01/2021 J.P. Morgan (68) 0.00
Unrealised loss on naV hedged share classes forward currency Exchange contracts – liabilities (3,581) 0.00
Total Unrealised loss on forward currency Exchange contracts – liabilities (255,180) (0.04)
net Unrealised Gain on forward currency Exchange contracts – assets 2,660,274 0.38
DERIVaTIVEs
Over-the-counter (OTC) and exchange traded derivatives as at 31 December 2020, expressed in US Dollars.

Morgan Stanley Investment Funds 31 December 2020 240
The accompanying notes are an integral part of these financial statements.
Please refer to the full prospectus for the Fund’s investment objective and policy.
InVEsTmEnT aIm
To provide an attractive rate of relative return, measured in Euro, through investing primarily in Euro denominated Fixed Income Securities whether issued by corporations, government or government guaranteed issuers.
schEDUlE of InVEsTmEnTsAs at 31 December 2020
Investments Currency
Quantity/Nominal
Value
Market Value EUR
% of Net Assets
Transferable securities and money market instruments admitted to official exchange listing or dealt in on another regulated market
corporate Bonds
australiaAPT Pipelines Ltd., Reg. S 1.375%
22/03/2022 EUR 8,000,000 8,149,360 0.63 Australia & New Zealand Banking Group
Ltd., Reg. S 2.5% 16/01/2024 EUR 5,000,000 5,442,800 0.42 BHP Billiton Finance Ltd., Reg. S, FRN
4.75% 22/04/2076 EUR 6,500,000 6,588,400 0.51 Commonwealth Bank of Australia, Reg. S
0.375% 11/04/2024 EUR 6,000,000 6,155,742 0.48 National Australia Bank Ltd., Reg. S
1.875% 13/01/2023 EUR 3,000,000 3,141,972 0.25 National Australia Bank Ltd., Reg. S
0.625% 30/08/2023 EUR 3,100,000 3,176,458 0.25 Origin Energy Finance Ltd., Reg. S 3.5%
04/10/2021 EUR 3,500,000 3,597,482 0.28 SGSP Australia Assets Pty. Ltd., Reg. S
2% 30/06/2022 EUR 8,000,000 8,214,720 0.64 Westpac Banking Corp., Reg. S 0.75%
17/10/2023 EUR 5,000,000 5,147,575 0.40 Westpac Banking Corp., Reg. S 0.5%
04/12/2023 EUR 8,000,000 8,227,184 0.64
57,841,693 4.50
austriaOesterreichische Kontrollbank AG, Reg. S
0% 06/04/2023 EUR 8,500,000 8,612,336 0.67 Raiffeisen Bank International AG, Reg. S
6% 16/10/2023 EUR 2,600,000 3,034,850 0.23 Raiffeisen Bank International AG, Reg. S
0.25% 05/07/2021 EUR 6,000,000 6,018,936 0.47 UNIQA Insurance Group AG, Reg. S, FRN
6.875% 31/07/2043 EUR 3,300,000 3,821,812 0.30
21,487,934 1.67
BelgiumEuroclear Bank SA, Reg. S 0.25%
07/09/2022 EUR 3,950,000 3,987,561 0.31
3,987,561 0.31
canadaBank of Nova Scotia (The), Reg. S 0.375%
06/04/2022 EUR 4,100,000 4,137,158 0.32 Bank of Nova Scotia (The), Reg. S 0.25%
11/01/2024 EUR 5,600,000 5,718,580 0.44 Canadian Imperial Bank of Commerce,
Reg. S 0.75% 22/03/2023 EUR 4,750,000 4,858,984 0.38 CPPIB Capital, Inc., Reg. S 0.375%
20/06/2024 EUR 15,967,000 16,438,362 1.28 Federation des Caisses Desjardins
du Quebec, Reg. S 0.25% 27/09/2021 EUR 8,000,000 8,044,448 0.63
39,197,532 3.05
chinaBank of China Ltd., Reg. S 0%
16/10/2021 EUR 2,850,000 2,849,744 0.22 Bank of China Ltd., Reg. S 0.75%
12/07/2021 EUR 5,750,000 5,776,220 0.45 China Development Bank, Reg. S 0%
27/10/2023 EUR 1,600,000 1,600,051 0.13
Short Maturity Euro Bond Fund

241 Morgan Stanley Investment Funds 31 December 2020
The accompanying notes are an integral part of these financial statements.
Short Maturity Euro Bond Fund (continued)
schEDUlE of InVEsTmEnTsAs at 31 December 2020
Investments Currency
Quantity/Nominal
Value
Market Value EUR
% of Net Assets
Transferable securities and money market instruments admitted to official exchange listing or dealt in on another regulated market
corporate Bonds (continued)
china (continued)China Merchants Bank Co. Ltd., Reg. S
0.25% 19/06/2022 EUR 3,000,000 2,989,800 0.23 CNAC HK Finbridge Co. Ltd., Reg. S
1.75% 14/06/2022 EUR 4,000,000 4,007,800 0.31 Export‑Import Bank of China (The), Reg. S
0.625% 02/12/2021 EUR 7,000,000 7,041,839 0.55 Sinopec Group Overseas Development
2015 Ltd., Reg. S 1% 28/04/2022 EUR 2,000,000 2,024,724 0.16 Triceratops Capital Co. Ltd., Reg. S
0.817% 25/01/2021 EUR 8,000,000 8,004,640 0.62
34,294,818 2.67
DenmarkDanske Bank A/S, Reg. S 0.875%
22/05/2023 EUR 3,900,000 3,980,110 0.31 Nykredit Realkredit A/S, Reg. S 0.25%
20/01/2023 EUR 3,900,000 3,925,775 0.30
7,905,885 0.61
EstoniaLuminor Bank A/S, Reg. S 0.792%
03/12/2024 EUR 1,150,000 1,158,263 0.09
1,158,263 0.09
finlandSATO OYJ, Reg. S 2.375% 24/03/2021 EUR 2,793,000 2,800,195 0.22
2,800,195 0.22
franceAXA Bank Europe SCF, Reg. S 0.125%
01/10/2024 EUR 4,000,000 4,090,288 0.32 BNP Paribas SA, Reg. S, FRN 2.875%
20/03/2026 EUR 8,000,000 8,047,808 0.63 BPCE SA, Reg. S 0.625% 28/04/2025 EUR 3,900,000 4,021,797 0.31 Caisse Francaise de Financement Local,
Reg. S 0.01% 07/05/2025 EUR 3,500,000 3,572,681 0.28 CNP Assurances, Reg. S 1.875%
20/10/2022 EUR 2,100,000 2,172,167 0.17 Credit Agricole Home Loan SFH SA, Reg. S
0.125% 16/12/2024 EUR 6,000,000 6,147,450 0.48 Dassault Systemes SE, Reg. S 0%
16/09/2022 EUR 3,900,000 3,919,110 0.31 Engie SA, Reg. S, FRN 1.375% Perpetual EUR 6,000,000 6,101,250 0.47 EssilorLuxottica SA, Reg. S 0.25%
05/01/2024 EUR 1,800,000 1,822,734 0.14 Orange SA, Reg. S 5.25% Perpetual EUR 2,300,000 2,622,000 0.20 TOTAL SE, Reg. S, FRN 3.875% Perpetual EUR 6,750,000 7,083,281 0.55 UNEDIC ASSEO, Reg. S 0.3% 04/11/2021 EUR 6,000,000 6,040,698 0.47 Unibail‑Rodamco‑Westfield SE, REIT, Reg. S
2.125% 09/04/2025 EUR 4,900,000 5,267,892 0.41 Unibail‑Rodamco‑Westfield SE, REIT,
Reg. S, FRN 2.125% Perpetual EUR 4,400,000 4,147,000 0.32 Worldline SA, Reg. S 0.5% 30/06/2023 EUR 2,500,000 2,538,575 0.20
67,594,731 5.26
schEDUlE of InVEsTmEnTsAs at 31 December 2020
Investments Currency
Quantity/Nominal
Value
Market Value EUR
% of Net Assets
Transferable securities and money market instruments admitted to official exchange listing or dealt in on another regulated market
corporate Bonds (continued)
Germanyadidas AG, Reg. S 0% 09/09/2024 EUR 600,000 605,203 0.05 Allianz Finance II BV, FRN 5.75%
08/07/2041 EUR 2,300,000 2,365,426 0.18 Allianz SE, Reg. S 5.625% 17/10/2042 EUR 2,100,000 2,308,643 0.18 BMW Finance NV, Reg. S 0.103%
02/10/2023 EUR 3,900,000 3,933,375 0.31 Commerzbank AG 7.75% 16/03/2021 EUR 9,000,000 9,130,266 0.71 Deutsche Bank AG, Reg. S 1%
19/11/2025 EUR 1,300,000 1,321,483 0.10 Deutsche Bank AG, Reg. S 0.375%
18/01/2021 EUR 8,000,000 8,001,744 0.62 Kreditanstalt fuer Wiederaufbau 0.125%
07/06/2023 EUR 60,000,000 61,166,460 4.76 Kreditanstalt fuer Wiederaufbau, Reg. S 0%
04/07/2024 EUR 51,500,000 52,656,175 4.10 Muenchener Rueckversicherungs‑
Gesellschaft AG, Reg. S, FRN 6% 26/05/2041 EUR 10,000,000 10,231,720 0.80
Siemens Financieringsmaatschappij NV, Reg. S 0.25% 05/06/2024 EUR 1,700,000 1,730,413 0.13
Volkswagen International Finance NV, Reg. S, FRN 3.75% Perpetual EUR 5,000,000 5,036,285 0.39
Wintershall Dea Finance BV, Reg. S 0.452% 25/09/2023 EUR 4,600,000 4,641,708 0.36
163,128,901 12.69
IcelandArion Banki HF, Reg. S 1% 20/03/2023 EUR 2,450,000 2,487,362 0.19 Arion Banki HF, Reg. S 1.625%
01/12/2021 EUR 1,402,000 1,425,803 0.11 Landsbankinn HF, Reg. S 0.5%
20/05/2024 EUR 4,850,000 4,849,103 0.38 Landsbankinn HF, Reg. S 1.625%
15/03/2021 EUR 1,394,000 1,399,122 0.11
10,161,390 0.79
IndiaBharti Airtel International Netherlands BV,
Reg. S 3.375% 20/05/2021 EUR 3,000,000 3,038,130 0.23 ONGC Videsh Ltd., Reg. S 2.75%
15/07/2021 EUR 10,500,000 10,634,925 0.83
13,673,055 1.06
IrelandDell Bank International DAC, Reg. S
0.625% 17/10/2022 EUR 4,000,000 4,038,044 0.31 Ryanair DAC, Reg. S 1.125% 10/03/2023 EUR 2,500,000 2,524,457 0.20
6,562,501 0.51
ItalyEnel SpA, Reg. S, FRN 2.5% 24/11/2078 EUR 6,500,000 6,800,625 0.53 FCA Bank SpA, Reg. S 0.5% 18/09/2023 EUR 1,100,000 1,111,076 0.09 FCA Bank SpA, Reg. S 0.25%
28/02/2023 EUR 3,500,000 3,514,364 0.27
11,426,065 0.89

Morgan Stanley Investment Funds 31 December 2020 242
The accompanying notes are an integral part of these financial statements.
Short Maturity Euro Bond Fund (continued)
schEDUlE of InVEsTmEnTsAs at 31 December 2020
Investments Currency
Quantity/Nominal
Value
Market Value EUR
% of Net Assets
Transferable securities and money market instruments admitted to official exchange listing or dealt in on another regulated market
corporate Bonds (continued)
JapanAsahi Group Holdings Ltd., Reg. S 0.155%
23/10/2024 EUR 3,300,000 3,321,909 0.26 Nissan Motor Co. Ltd., Reg. S 1.94%
15/09/2023 EUR 550,000 573,652 0.04 Sumitomo Mitsui Banking Corp., Reg. S
0.55% 06/11/2023 EUR 10,000,000 10,245,400 0.80 Sumitomo Mitsui Financial Group, Inc.,
Reg. S 0.819% 23/07/2023 EUR 6,500,000 6,668,161 0.52
20,809,122 1.62
luxembourgBlackstone Property Partners Europe
Holdings Sarl, Reg. S 1.4% 06/07/2022 EUR 4,500,000 4,572,310 0.36 Logicor Financing Sarl, Reg. S 1.5%
14/11/2022 EUR 3,200,000 3,279,741 0.26 Prologis International Funding II SA, REIT,
Reg. S 2.875% 04/04/2022 EUR 6,000,000 6,228,822 0.48
14,080,873 1.10
mexicoPetroleos Mexicanos, Reg. S 3.75%
21/02/2024 EUR 8,000,000 8,128,320 0.63
8,128,320 0.63
netherlandsAegon Bank NV, Reg. S 0.01%
16/11/2057 EUR 4,100,000 4,176,990 0.33 BNG Bank NV, Reg. S 0.05% 11/07/2023 EUR 40,000,000 40,617,080 3.16 Cooperatieve Rabobank UA, Reg. S, FRN
2.5% 26/05/2026 EUR 5,000,000 5,051,635 0.39 de Volksbank NV 0.252% 07/10/2022 EUR 1,000,000 1,008,298 0.08 ING Groep NV 3% 11/04/2028 EUR 4,400,000 4,662,133 0.36 Nederlandse Waterschapsbank NV, Reg. S
0% 14/04/2023 EUR 7,000,000 7,094,739 0.55 Shell International Finance BV, Reg. S 0.5%
11/05/2024 EUR 3,650,000 3,742,692 0.29 Stedin Holding NV, Reg. S, FRN 3.25%
Perpetual EUR 2,500,000 2,566,250 0.20
68,919,817 5.36
new ZealandASB Finance Ltd., Reg. S 0.125%
18/10/2023 EUR 4,600,000 4,665,426 0.36
4,665,426 0.36
PolandPowszechna Kasa Oszczednosci Bank
Polski SA, Reg. S 0.75% 25/07/2021 EUR 1,043,000 1,047,704 0.08
1,047,704 0.08
schEDUlE of InVEsTmEnTsAs at 31 December 2020
Investments Currency
Quantity/Nominal
Value
Market Value EUR
% of Net Assets
Transferable securities and money market instruments admitted to official exchange listing or dealt in on another regulated market
corporate Bonds (continued)
singaporeDBS Bank Ltd., Reg. S 0.375%
23/01/2024 EUR 5,000,000 5,115,395 0.40 DBS Group Holdings Ltd., Reg. S, FRN
1.5% 11/04/2028 EUR 8,000,000 8,170,368 0.63
13,285,763 1.03
slovakiaSPP‑Distribucia A/S, Reg. S 2.625%
23/06/2021 EUR 3,000,000 3,040,857 0.24
3,040,857 0.24
south KoreaExport‑Import Bank of Korea 0%
21/09/2023 EUR 850,000 855,738 0.06 Export‑Import Bank of Korea, Reg. S
0.625% 11/07/2023 EUR 6,500,000 6,661,726 0.52 Export‑Import Bank of Korea, Reg. S
0.829% 27/04/2025 EUR 2,450,000 2,556,183 0.20 Korea Development Bank (The), Reg. S
0.625% 17/07/2023 EUR 5,500,000 5,616,242 0.44 Korea Housing Finance Corp., Reg. S
0.75% 30/10/2023 EUR 4,000,000 4,111,644 0.32
19,801,533 1.54
spainCaixaBank SA, Reg. S, FRN 2.75%
14/07/2028 EUR 5,500,000 5,756,988 0.45 Iberdrola International BV, Reg. S, FRN
1.875% Perpetual EUR 6,000,000 6,168,750 0.48 Inmobiliaria Colonial Socimi SA, REIT,
Reg. S 1.45% 28/10/2024 EUR 3,800,000 3,969,598 0.31 Instituto de Credito Oficial, Reg. S 0%
31/10/2022 EUR 7,000,000 7,066,136 0.55 NorteGas Energia Distribucion SA, Reg. S
0.918% 28/09/2022 EUR 4,650,000 4,703,963 0.36
27,665,435 2.15
supra-nationalEuropean Bank for Reconstruction
& Development 0% 17/10/2024 EUR 10,400,000 10,611,401 0.83 European Financial Stability Facility, Reg. S
0% 19/04/2024 EUR 10,000,000 10,205,300 0.79 European Stability Mechanism, Reg. S 0%
16/12/2024 EUR 3,250,000 3,330,951 0.26 European Stability Mechanism, Reg. S 0%
10/02/2023 EUR 5,000,000 5,068,000 0.39
29,215,652 2.27
swedenScania CV AB, Reg. S 0.5% 06/10/2023 EUR 750,000 758,981 0.06 Svenska Handelsbanken AB, Reg. S, FRN
1.25% 02/03/2028 EUR 5,400,000 5,524,098 0.43 Volvo Treasury AB, Reg. S 0.125%
17/09/2024 EUR 4,000,000 4,022,920 0.31 Volvo Treasury AB, Reg. S 0%
11/02/2023 EUR 1,775,000 1,780,044 0.14
12,086,043 0.94

243 Morgan Stanley Investment Funds 31 December 2020
The accompanying notes are an integral part of these financial statements.
Short Maturity Euro Bond Fund (continued)
schEDUlE of InVEsTmEnTsAs at 31 December 2020
Investments Currency
Quantity/Nominal
Value
Market Value EUR
% of Net Assets
Transferable securities and money market instruments admitted to official exchange listing or dealt in on another regulated market
corporate Bonds (continued)
switzerlandCredit Suisse AG, Reg. S, FRN 0.428%
18/05/2022 EUR 3,900,000 3,947,615 0.31 UBS AG, Reg. S 0.625% 23/01/2023 EUR 4,000,000 4,070,912 0.32 UBS AG, Reg. S 0.75% 21/04/2023 EUR 1,550,000 1,584,994 0.12 Zurich Insurance Co. Ltd., Reg. S 3.375%
27/06/2022 EUR 1,499,000 1,581,346 0.12
11,184,867 0.87
United arab EmiratesEmirates NBD Bank PJSC, Reg. S 1.75%
23/03/2022 EUR 4,800,000 4,893,878 0.38 MDGH ‑ GMTN BV, Reg. S 5.875%
14/03/2021 EUR 4,500,000 4,558,275 0.35
9,452,153 0.73
United KingdomAviva plc, Reg. S, FRN 6.125%
05/07/2043 EUR 3,300,000 3,784,737 0.30 Centrica plc, Reg. S, FRN 3% 10/04/2076 EUR 6,800,000 6,847,702 0.53 CK Hutchison Group Telecom Finance SA,
Reg. S 0.375% 17/10/2023 EUR 5,000,000 5,049,565 0.39 CNH Industrial Finance Europe SA, Reg. S
0% 01/04/2024 EUR 1,450,000 1,448,947 0.11 DS Smith plc, Reg. S 2.25% 16/09/2022 EUR 6,000,000 6,202,878 0.48 FCE Bank plc, Reg. S 0.869%
13/09/2021 EUR 3,900,000 3,898,050 0.31 GlaxoSmithKline Capital plc, Reg. S
0.125% 12/05/2023 EUR 2,950,000 2,975,004 0.23 Hutchison Whampoa Finance 14 Ltd.,
Reg. S 1.375% 31/10/2021 EUR 7,000,000 7,090,342 0.55 Lloyds Bank plc, Reg. S 0.25%
25/03/2024 EUR 5,800,000 5,922,473 0.46 Lloyds Banking Group plc, Reg. S, FRN
1.75% 07/09/2028 EUR 2,600,000 2,678,497 0.21 Lloyds Banking Group plc, Reg. S 0.75%
09/11/2021 EUR 5,000,000 5,040,665 0.39 NGG Finance plc, Reg. S, FRN 1.625%
05/12/2079 EUR 3,000,000 3,056,250 0.24 Santander UK Group Holdings plc, Reg. S,
FRN 0.391% 28/02/2025 EUR 4,200,000 4,237,208 0.33
58,232,318 4.53
United states of americaAT&T, Inc. 1.45% 01/06/2022 EUR 5,000,000 5,099,530 0.40 Bank of America Corp., Reg. S 1.625%
14/09/2022 EUR 5,000,000 5,161,650 0.40 Bank of America Corp., Reg. S 1.379%
07/02/2025 EUR 2,600,000 2,711,368 0.21 Capital One Financial Corp. 0.8%
12/06/2024 EUR 3,300,000 3,378,161 0.26 Digital Dutch Finco BV, Reg. S 0%
23/09/2022 EUR 2,400,000 2,406,480 0.19 Eaton Capital Unlimited Co., Reg. S
0.021% 14/05/2021 EUR 5,750,000 5,754,077 0.45 General Electric Co. 0.375% 17/05/2022 EUR 4,000,000 4,028,040 0.31 Goldman Sachs Group, Inc. (The), Reg. S
1.375% 15/05/2024 EUR 4,000,000 4,130,984 0.32 Medtronic Global Holdings SCA 0%
15/03/2023 EUR 2,350,000 2,361,247 0.18
schEDUlE of InVEsTmEnTsAs at 31 December 2020
Investments Currency
Quantity/Nominal
Value
Market Value EUR
% of Net Assets
Transferable securities and money market instruments admitted to official exchange listing or dealt in on another regulated market
corporate Bonds (continued)
United states of america (continued)Medtronic Global Holdings SCA 0.375%
07/03/2023 EUR 4,600,000 4,658,466 0.36 Metropolitan Life Global Funding I, Reg. S
0% 23/09/2022 EUR 3,900,000 3,921,051 0.31 Mohawk Industries, Inc. 2% 14/01/2022 EUR 4,300,000 4,367,372 0.34 PACCAR Financial Europe BV, Reg. S 0%
03/03/2023 EUR 3,300,000 3,305,392 0.26 Simon International Finance SCA, REIT,
Reg. S 1.375% 18/11/2022 EUR 3,000,000 3,069,893 0.24 Upjohn Finance BV, Reg. S 1.023%
23/06/2024 EUR 2,600,000 2,682,251 0.21
57,035,962 4.44
Total corporate Bonds 799,872,369 62.21
Government Bonds
austriaAustria Government Bond, Reg. S, 144A
0% 20/04/2023 EUR 7,000,000 7,112,763 0.55
7,112,763 0.55
canadaProvince of Quebec Canada, Reg. S 0.2%
07/04/2025 EUR 5,100,000 5,230,772 0.41
5,230,772 0.41
chileChile Government Bond 1.625%
30/01/2025 EUR 6,500,000 6,950,905 0.54
6,950,905 0.54
chinaChina Government Bond, Reg. S 0%
25/11/2025 EUR 3,199,000 3,231,831 0.25
3,231,831 0.25
croatiaCroatia Government Bond, Reg. S 3%
11/03/2025 EUR 10,500,000 11,783,415 0.92
11,783,415 0.92
cyprusCyprus Government Bond, Reg. S 3.875%
06/05/2022 EUR 5,800,000 6,131,980 0.48 Cyprus Government Bond, Reg. S 3.75%
26/07/2023 EUR 2,000,000 2,206,361 0.17 Cyprus Government Bond, Reg. S 0.625%
03/12/2024 EUR 5,000,000 5,135,125 0.40
13,473,466 1.05

Morgan Stanley Investment Funds 31 December 2020 244
The accompanying notes are an integral part of these financial statements.
Short Maturity Euro Bond Fund (continued)
schEDUlE of InVEsTmEnTsAs at 31 December 2020
Investments Currency
Quantity/Nominal
Value
Market Value EUR
% of Net Assets
Transferable securities and money market instruments admitted to official exchange listing or dealt in on another regulated market
Government Bonds (continued)
hungaryHungary Government Bond, Reg. S 1.25%
22/10/2025 EUR 2,560,000 2,706,555 0.21
2,706,555 0.21
IcelandIceland Government Bond, Reg. S 0.1%
20/06/2024 EUR 5,300,000 5,324,878 0.42
5,324,878 0.42
IndonesiaIndonesia Government Bond, Reg. S
2.625% 14/06/2023 EUR 8,000,000 8,500,000 0.66 Indonesia Government Bond, Reg. S 2.15%
18/07/2024 EUR 4,000,000 4,262,200 0.33
12,762,200 0.99
ItalyItaly Buoni Poliennali Del Tesoro, Reg. S,
144A 0.1% 15/05/2022 EUR 77,400,000 82,689,132 6.43 Italy Buoni Poliennali Del Tesoro, Reg. S,
144A 1.45% 26/11/2022 EUR 30,000,000 31,055,229 2.42 Italy Buoni Poliennali Del Tesoro, Reg. S,
144A 0.45% 22/05/2023 EUR 45,000,000 45,731,110 3.56 Italy Buoni Poliennali Del Tesoro, Reg. S,
144A 1.4% 26/05/2025 EUR 13,400,000 14,195,306 1.10
173,670,777 13.51
JapanJapan Finance Organization for
Municipalities, Reg. S 0.875% 22/09/2021 EUR 7,500,000 7,574,557 0.59
7,574,557 0.59
latviaLatvia Government Bond, Reg. S 0.125%
14/04/2023 EUR 4,000,000 4,060,180 0.32
4,060,180 0.32
luxembourgLuxembourg Government Bond, Reg. S 0%
28/04/2025 EUR 4,000,000 4,112,072 0.32
4,112,072 0.32
mexicoMexico Government Bond 1.375%
15/01/2025 EUR 7,200,000 7,473,024 0.58
7,473,024 0.58
schEDUlE of InVEsTmEnTsAs at 31 December 2020
Investments Currency
Quantity/Nominal
Value
Market Value EUR
% of Net Assets
Transferable securities and money market instruments admitted to official exchange listing or dealt in on another regulated market
Government Bonds (continued)
PolandPoland Government Bond, Reg. S 0%
07/07/2023 EUR 4,260,000 4,294,617 0.33
4,294,617 0.33
south KoreaKorea Government Bond 0% 16/09/2025 EUR 3,285,000 3,327,804 0.26
3,327,804 0.26
spainSpain Government Bond 0% 30/04/2023 EUR 5,000,000 5,067,334 0.39 Spain Government Bond 0% 31/01/2025 EUR 57,000,000 58,137,389 4.52 Spain Government Bond, Reg. S, 144A
5.4% 31/01/2023 EUR 77,000,000 86,632,777 6.74
149,837,500 11.65
Total Government Bonds 422,927,316 32.90
Total Transferable securities and money market instruments admitted to official exchange listing or dealt in on another regulated market 1,222,799,685 95.11
Units of authorised UCITS or other collective investment undertakings
collective Investment schemes – UcITs
luxembourgMorgan Stanley Liquidity Funds Euro
Liquidity Fund – MS Reserve† EUR 48,998,502 48,998,502 3.81
48,998,502 3.81
Total collective Investment schemes – UcITs 48,998,502 3.81
Total Units of authorised UcITs or other collective investment undertakings 48,998,502 3.81
Total Investments 1,271,798,187 98.92
cash 3,103,932 0.24
other assets/(liabilities) 10,838,136 0.84
Total net assets 1,285,740,255 100.00
† Managed by an affiliate of the Investment Adviser.The country disclosed within the Schedule of Investments refers to the country of risk. The country of incorporation may differ.

245 Morgan Stanley Investment Funds 31 December 2020
The accompanying notes are an integral part of these financial statements.
Short Maturity Euro Bond Fund (continued)
financial futures contracts
security Descriptionnumber
of contracts currency
Global Exposure
EUR
Unrealised Gain/(loss)
EUR
% of net assets
Euro‑Bobl, 08/03/2021 (2,231) EUR (301,586,580) 245,410 0.02
Total Unrealised Gain on financial futures contracts 245,410 0.02
Euro‑Schatz, 08/03/2021 4,757 EUR 534,092,175 (487,593) (0.04)
Total Unrealised loss on financial futures contracts (487,593) (0.04)
net Unrealised loss on financial futures contracts (242,183) (0.02)
forward currency Exchange contracts
currency Purchased
amount Purchased
currency sold
amount sold
maturity Date counterparty
Unrealised Gain/(loss)
EUR
% of net assets
USD 53 EUR 43 04/01/2021 J.P. Morgan 0 0.00
Unrealised loss on forward currency Exchange contracts – liabilities 0 0.00
UsD hedged share classUSD 10,323 EUR 8,486 08/01/2021 J.P. Morgan (73) 0.00
Unrealised loss on naV hedged share classes forward currency Exchange contracts – liabilities (73) 0.00
Total Unrealised loss on forward currency Exchange contracts – liabilities (73) 0.00
net Unrealised loss on forward currency Exchange contracts – liabilities (73) 0.00
Collateral received and paid by the Fund in respect of financial derivative instruments:
Type of collateral counterparty currency amount received amount paid
short maturity Euro Bond fund
Cash Goldman Sachs EUR 1,638,844 –
1,638,844 –
DERIVaTIVEs
Over-the-counter (OTC) and exchange traded derivatives as at 31 December 2020, expressed in Euro.

Morgan Stanley Investment Funds 31 December 2020 246
The accompanying notes are an integral part of these financial statements.
Please refer to the full prospectus for the Fund’s investment objective and policy.
Sustainable Euro Corporate Bond Fund
*Fund commenced activity on 31 July 2020.
InVEsTmEnT aIm
To provide an attractive rate of relative return, measured in Euro, by investing primarily in Euro denominated Fixed Income Securities, issued by corporations and other non-government related issuers (“Corporate Bonds”) while incorporating environmental, social and corporate governance (ESG) considerations. The Fund will only invest in the top 80% of ESG-scoring corporates in each sub-sector of the Bloomberg Barclays European Corporate Index.
schEDUlE of InVEsTmEnTsAs at 31 December 2020
Investments Currency
Quantity/ Nominal
Value
Market Value EUR
% of Net Assets
Transferable securities and money market instruments admitted to official exchange listing or dealt in on another regulated market
corporate Bonds
australiaAPT Pipelines Ltd., Reg. S 2%
22/03/2027 EUR 200,000 222,252 0.98 Aurizon Network Pty. Ltd., Reg. S 3.125%
01/06/2026 EUR 200,000 229,529 1.02 Commonwealth Bank of Australia, Reg. S,
FRN 1.936% 03/10/2029 EUR 200,000 209,487 0.93 Optus Finance Pty. Ltd., Reg. S 1%
20/06/2029 EUR 200,000 210,921 0.93 Scentre Group Trust 1, Reg. S 1.375%
22/03/2023 EUR 100,000 102,685 0.46 Sydney Airport Finance Co. Pty. Ltd.,
Reg. S 1.75% 26/04/2028 EUR 100,000 108,753 0.48 Telstra Corp. Ltd., Reg. S 1% 23/04/2030 EUR 200,000 215,361 0.95 Transurban Finance Co. Pty. Ltd., Reg. S
1.75% 29/03/2028 EUR 200,000 221,716 0.98
1,520,704 6.73
austriaCA Immobilien Anlagen AG, Reg. S 1%
27/10/2025 EUR 100,000 101,889 0.45 CA Immobilien Anlagen AG, Reg. S 0.875%
05/02/2027 EUR 100,000 100,678 0.45 UNIQA Insurance Group AG, Reg. S, FRN
6% 27/07/2046 EUR 100,000 122,939 0.54 Vienna Insurance Group AG Wiener
Versicherung Gruppe, Reg. S, FRN 5.5% 09/10/2043 EUR 100,000 114,250 0.51
439,756 1.95
BelgiumAnheuser-Busch InBev SA/NV, Reg. S 3.7%
02/04/2040 EUR 200,000 283,591 1.25 Belfius Bank SA, Reg. S 1% 26/10/2024 EUR 100,000 103,948 0.46 FLUVIUS System Operator CVBA, Reg. S
0.25% 02/12/2030 EUR 100,000 101,465 0.45
489,004 2.16
chinaCNRC Capital Ltd., Reg. S 1.871%
07/12/2021 EUR 100,000 100,563 0.44 State Grid Overseas Investment 2016 Ltd.,
Reg. S 0.797% 05/08/2026 EUR 100,000 101,594 0.45
202,157 0.89
DenmarkCarlsberg Breweries A/S, Reg. S 0.875%
01/07/2029 EUR 100,000 105,028 0.46
105,028 0.46
finlandSampo OYJ, Reg. S 2.5% 03/09/2052 EUR 100,000 108,458 0.48 SATO OYJ, Reg. S 2.25% 07/04/2023 EUR 100,000 104,671 0.46
213,129 0.94
*

247 Morgan Stanley Investment Funds 31 December 2020
The accompanying notes are an integral part of these financial statements.
Sustainable Euro Corporate Bond Fund (continued)
schEDUlE of InVEsTmEnTsAs at 31 December 2020
Investments Currency
Quantity/ Nominal
Value
Market Value EUR
% of Net Assets
Transferable securities and money market instruments admitted to official exchange listing or dealt in on another regulated market
corporate Bonds (continued)
franceAeroports de Paris, Reg. S 1.5%
02/07/2032 EUR 200,000 223,182 0.99 APRR SA, Reg. S 1.25% 14/01/2027 EUR 200,000 216,448 0.96 AXA SA, Reg. S, FRN 3.25% 28/05/2049 EUR 200,000 234,367 1.04 Banque Federative du Credit Mutuel SA,
Reg. S 0.1% 08/10/2027 EUR 200,000 201,477 0.89 Banque Federative du Credit Mutuel SA,
Reg. S 1.75% 15/03/2029 EUR 100,000 112,659 0.50 BNP Paribas SA, Reg. S, FRN 0.5%
04/06/2026 EUR 300,000 305,767 1.35 BPCE SA, Reg. S 0.125% 04/12/2024 EUR 300,000 303,441 1.34 Credit Mutuel Arkea SA, Reg. S 1.25%
31/05/2024 EUR 100,000 104,025 0.46 Engie SA, Reg. S, FRN 1.375% Perpetual EUR 100,000 101,687 0.45 Klepierre SA, REIT, Reg. S 2%
12/05/2029 EUR 100,000 112,092 0.50 LVMH Moet Hennessy Louis Vuitton SE,
Reg. S 0.75% 07/04/2025 EUR 100,000 103,856 0.46 Orange SA, Reg. S 0.125% 16/09/2029 EUR 100,000 100,830 0.45 Orange SA, Reg. S 1.375% 20/03/2028 EUR 200,000 219,664 0.97 Orange SA, Reg. S, FRN 5% Perpetual EUR 200,000 242,750 1.07 RTE Reseau de Transport d’Electricite
SADIR, Reg. S 0.625% 08/07/2032 EUR 100,000 104,503 0.46 SCOR SE, Reg. S, FRN 3% 08/06/2046 EUR 100,000 113,125 0.50 Societe Generale SA 1% 24/11/2030 EUR 100,000 100,355 0.44 Societe Generale SA, Reg. S 0.75%
26/05/2023 EUR 100,000 102,479 0.45 Total Capital International SA, Reg. S
0.75% 12/07/2028 EUR 200,000 212,216 0.94 TOTAL SE, Reg. S, FRN 3.369% Perpetual EUR 200,000 225,375 1.00 Unibail-Rodamco-Westfield SE, REIT, Reg. S
1% 14/03/2025 EUR 100,000 103,559 0.46 Unibail-Rodamco-Westfield SE, REIT, Reg. S
2.625% 09/04/2030 EUR 100,000 113,870 0.50 Vivendi SA, Reg. S 1.125% 24/11/2023 EUR 100,000 103,703 0.46
3,761,430 16.64
Germanyadidas AG, Reg. S 0% 09/09/2024 EUR 100,000 100,867 0.45 Allianz SE, Reg. S, FRN 2.121%
08/07/2050 EUR 100,000 109,744 0.48 BMW Finance NV, Reg. S 0.125%
13/07/2022 EUR 225,000 226,300 1.00 BMW Finance NV, Reg. S 1.5%
06/02/2029 EUR 200,000 223,301 0.99 Clearstream Banking AG, Reg. S 0%
01/12/2025 EUR 100,000 100,727 0.45 Commerzbank AG, Reg. S 1.25%
23/10/2023 EUR 100,000 103,543 0.46 Commerzbank AG, Reg. S, FRN 4%
05/12/2030 EUR 100,000 109,588 0.48 Continental AG 2.5% 27/08/2026 EUR 100,000 111,754 0.49 Daimler AG, Reg. S 1.125% 06/11/2031 EUR 125,000 132,764 0.59 Daimler International Finance BV, Reg. S
0.875% 09/04/2024 EUR 225,000 231,208 1.02 E.ON SE, Reg. S 0% 28/08/2024 EUR 100,000 100,675 0.44 Merck Financial Services GmbH, Reg. S
0.005% 15/12/2023 EUR 100,000 100,613 0.44 Muenchener Rueckversicherungs-
Gesellschaft AG, Reg. S 1.25% 26/05/2041 EUR 100,000 104,032 0.46
O2 Telefonica Deutschland Finanzierungs GmbH, Reg. S 1.75% 05/07/2025 EUR 200,000 213,044 0.94
Vonovia Finance BV, Reg. S 1.5% 22/03/2026 EUR 200,000 216,103 0.96
schEDUlE of InVEsTmEnTsAs at 31 December 2020
Investments Currency
Quantity/ Nominal
Value
Market Value EUR
% of Net Assets
Transferable securities and money market instruments admitted to official exchange listing or dealt in on another regulated market
corporate Bonds (continued)
Germany (continued)Wintershall Dea Finance BV, Reg. S
0.452% 25/09/2023 EUR 100,000 100,907 0.45 Wintershall Dea Finance BV, Reg. S
1.823% 25/09/2031 EUR 100,000 105,478 0.47
2,390,648 10.57
IcelandArion Banki HF, Reg. S 1% 20/03/2023 EUR 100,000 101,525 0.45
101,525 0.45
IrelandAIB Group plc, Reg. S 1.5% 29/03/2023 EUR 100,000 103,327 0.46 Bank of Ireland Group plc, Reg. S, FRN
0.75% 08/07/2024 EUR 100,000 101,663 0.45 DAA Finance plc, Reg. S 1.601%
05/11/2032 EUR 100,000 109,533 0.48 Ryanair DAC, Reg. S 1.125% 10/03/2023 EUR 100,000 100,978 0.45
415,501 1.84
Italy2i Rete Gas SpA, Reg. S 1.608%
31/10/2027 EUR 100,000 108,468 0.48 Assicurazioni Generali SpA, Reg. S, FRN
5.5% 27/10/2047 EUR 200,000 246,900 1.09 Enel Finance International NV, Reg. S 1%
16/09/2024 EUR 200,000 208,497 0.92 FCA Bank SpA, Reg. S 0.25%
28/02/2023 EUR 100,000 100,410 0.45 Intesa Sanpaolo SpA, Reg. S 0.75%
04/12/2024 EUR 100,000 102,638 0.46 Intesa Sanpaolo SpA, Reg. S 1.75%
04/07/2029 EUR 100,000 109,383 0.48 UniCredit SpA, Reg. S 1.8% 20/01/2030 EUR 250,000 262,342 1.16
1,138,638 5.04
JapanTakeda Pharmaceutical Co. Ltd., Reg. S
3% 21/11/2030 EUR 100,000 123,343 0.55
123,343 0.55
luxembourgBlackstone Property Partners Europe
Holdings Sarl, Reg. S 2.2% 24/07/2025 EUR 200,000 214,627 0.95 Blackstone Property Partners Europe
Holdings Sarl, Reg. S 1.25% 26/04/2027 EUR 100,000 102,561 0.45
Logicor Financing Sarl, Reg. S 1.5% 14/11/2022 EUR 225,000 230,607 1.02
547,795 2.42
netherlandsABN AMRO Bank NV, Reg. S 0.875%
22/04/2025 EUR 100,000 104,578 0.46 ASR Nederland NV, Reg. S, FRN 5%
Perpetual EUR 200,000 226,175 1.00 de Volksbank NV, Reg. S 1.75%
22/10/2030 EUR 200,000 211,288 0.94

Morgan Stanley Investment Funds 31 December 2020 248
The accompanying notes are an integral part of these financial statements.
Sustainable Euro Corporate Bond Fund (continued)
schEDUlE of InVEsTmEnTsAs at 31 December 2020
Investments Currency
Quantity/ Nominal
Value
Market Value EUR
% of Net Assets
Transferable securities and money market instruments admitted to official exchange listing or dealt in on another regulated market
corporate Bonds (continued)
netherlands (continued)ING Groep NV, Reg. S, FRN 2%
22/03/2030 EUR 200,000 212,156 0.94 LeasePlan Corp. NV, Reg. S 1.375%
07/03/2024 EUR 100,000 104,242 0.46 NN Group NV, Reg. S, FRN 4.625%
08/04/2044 EUR 100,000 112,650 0.50 Royal Schiphol Group NV, Reg. S 2%
06/04/2029 EUR 200,000 231,233 1.02 Signify NV, Reg. S 2% 11/05/2024 EUR 100,000 105,808 0.47 Vesteda Finance BV, Reg. S 1.5%
24/05/2027 EUR 100,000 108,289 0.48
1,416,419 6.27
PortugalEDP Finance BV, Reg. S 0.375%
16/09/2026 EUR 225,000 228,798 1.01
228,798 1.01
singaporeDBS Group Holdings Ltd., Reg. S, FRN
1.5% 11/04/2028 EUR 100,000 102,130 0.45
102,130 0.45
spainAbertis Infraestructuras SA, Reg. S
2.375% 27/09/2027 EUR 100,000 110,876 0.49 Amadeus IT Group SA, Reg. S 1.875%
24/09/2028 EUR 100,000 106,835 0.47 Banco Bilbao Vizcaya Argentaria SA,
Reg. S 1% 21/06/2026 EUR 200,000 210,539 0.93 Banco Santander SA, Reg. S 3.125%
19/01/2027 EUR 200,000 228,741 1.01 Bankia SA, Reg. S 0.75% 09/07/2026 EUR 100,000 103,162 0.46 CaixaBank SA, Reg. S, FRN 2.25%
17/04/2030 EUR 200,000 209,499 0.93 Cellnex Telecom SA, Reg. S 2.875%
18/04/2025 EUR 100,000 108,277 0.48 Iberdrola International BV, Reg. S, FRN
1.875% Perpetual EUR 200,000 205,625 0.91 Inmobiliaria Colonial Socimi SA, Reg. S
1.35% 14/10/2028 EUR 100,000 103,487 0.46 Inmobiliaria Colonial Socimi SA, REIT,
Reg. S 2% 17/04/2026 EUR 100,000 107,712 0.48 NorteGas Energia Distribucion SA, Reg. S
2.065% 28/09/2027 EUR 100,000 109,363 0.48 Redexis Gas Finance BV, Reg. S 1.875%
28/05/2025 EUR 200,000 213,250 0.94 Santander Consumer Finance SA, Reg. S
1.125% 09/10/2023 EUR 100,000 103,620 0.46
1,920,986 8.50
swedenAkelius Residential Property Financing BV,
Reg. S 1% 17/01/2028 EUR 100,000 103,207 0.45 Akelius Residential Property Financing BV,
Reg. S 1.125% 11/01/2029 EUR 100,000 103,524 0.46
206,731 0.91
schEDUlE of InVEsTmEnTsAs at 31 December 2020
Investments Currency
Quantity/ Nominal
Value
Market Value EUR
% of Net Assets
Transferable securities and money market instruments admitted to official exchange listing or dealt in on another regulated market
corporate Bonds (continued)
switzerlandLonza Finance International NV, Reg. S
1.625% 21/04/2027 EUR 200,000 219,273 0.97 Syngenta Finance NV, Reg. S 3.375%
16/04/2026 EUR 100,000 108,183 0.48
327,456 1.45
United arab EmiratesDP World plc, Reg. S 2.375% 25/09/2026 EUR 100,000 104,791 0.46
104,791 0.46
United KingdomAviva plc, Reg. S, FRN 3.375%
04/12/2045 EUR 100,000 111,473 0.49 Barclays plc, Reg. S 0.625% 14/11/2023 EUR 100,000 101,198 0.45 BP Capital Markets plc, Reg. S 3.25%
Perpetual EUR 225,000 240,469 1.06 BP Capital Markets plc, Reg. S 2.822%
07/04/2032 EUR 100,000 126,485 0.56 British Telecommunications plc, Reg. S 1%
21/11/2024 EUR 100,000 103,586 0.46 Chanel Ceres plc, Reg. S 0.5%
31/07/2026 EUR 100,000 101,524 0.45 CK Hutchison Finance 16 II Ltd., Reg. S
0.875% 03/10/2024 EUR 100,000 102,917 0.46 DS Smith plc, Reg. S 2.25% 16/09/2022 EUR 100,000 103,381 0.46 Heathrow Funding Ltd., Reg. S 1.5%
12/10/2027 EUR 100,000 104,724 0.46 Heathrow Funding Ltd., Reg. S 1.5%
11/02/2030 EUR 100,000 105,750 0.47 HSBC Holdings plc, Reg. S 0.309%
13/11/2026 EUR 100,000 101,306 0.45 HSBC Holdings plc, Reg. S, FRN 1.5%
04/12/2024 EUR 100,000 104,889 0.46 HSBC Holdings plc, Reg. S 3%
30/06/2025 EUR 200,000 224,152 0.99 Informa plc, Reg. S 1.5% 05/07/2023 EUR 100,000 102,580 0.45 Lloyds Banking Group plc, Reg. S, FRN
0.625% 15/01/2024 EUR 100,000 101,157 0.45 Lloyds Banking Group plc, Reg. S, FRN
4.5% 18/03/2030 EUR 200,000 229,255 1.01 NGG Finance plc, Reg. S, FRN 1.625%
05/12/2079 EUR 100,000 101,875 0.45 Reckitt Benckiser Treasury Services
Nederland BV, Reg. S 0.375% 19/05/2026 EUR 225,000 231,387 1.02
Santander UK Group Holdings plc, Reg. S, FRN 0.391% 28/02/2025 EUR 100,000 100,886 0.45
Standard Chartered plc, Reg. S, FRN 0.75% 03/10/2023 EUR 100,000 101,595 0.45
Tesco Corporate Treasury Services plc, Reg. S 2.5% 01/07/2024 EUR 100,000 108,462 0.48
Vodafone Group plc, Reg. S 0.9% 24/11/2026 EUR 200,000 210,826 0.93
Vodafone Group plc, Reg. S 2.5% 24/05/2039 EUR 100,000 121,987 0.54
3,041,864 13.45

249 Morgan Stanley Investment Funds 31 December 2020
The accompanying notes are an integral part of these financial statements.
Sustainable Euro Corporate Bond Fund (continued)
schEDUlE of InVEsTmEnTsAs at 31 December 2020
Investments Currency
Quantity/ Nominal
Value
Market Value EUR
% of Net Assets
Transferable securities and money market instruments admitted to official exchange listing or dealt in on another regulated market
corporate Bonds (continued)
United states of americaAbbott Ireland Financing DAC, Reg. S 0.1%
19/11/2024 EUR 100,000 101,066 0.45 American Honda Finance Corp. 0.75%
17/01/2024 EUR 200,000 205,332 0.91 Capital One Financial Corp. 0.8%
12/06/2024 EUR 100,000 102,369 0.45 Coca-Cola Co. (The) 0.125% 15/03/2029 EUR 100,000 100,855 0.45 Coca-Cola Co. (The) 0.8% 15/03/2040 EUR 100,000 103,511 0.46 Danaher Corp. 1.7% 30/03/2024 EUR 100,000 105,898 0.47 Digital Dutch Finco BV, Reg. S 1%
15/01/2032 EUR 100,000 103,654 0.46 DXC Technology Co. 1.75% 15/01/2026 EUR 100,000 102,836 0.45 Eaton Capital Unlimited Co., Reg. S
0.697% 14/05/2025 EUR 100,000 103,510 0.46 Ecolab, Inc. 2.625% 08/07/2025 EUR 200,000 224,013 0.99 Eli Lilly and Co. 1.7% 01/11/2049 EUR 100,000 118,759 0.52 Emerson Electric Co. 1.25% 15/10/2025 EUR 200,000 213,452 0.94 Fiserv, Inc. 0.375% 01/07/2023 EUR 225,000 227,956 1.01 Johnson Controls International plc 1.375%
25/02/2025 EUR 100,000 105,593 0.47 Marsh & McLennan Cos., Inc. 1.979%
21/03/2030 EUR 200,000 229,630 1.02 Medtronic Global Holdings SCA 1%
02/07/2031 EUR 100,000 108,036 0.48 Medtronic Global Holdings SCA 1.625%
15/10/2050 EUR 100,000 111,852 0.49 Medtronic Global Holdings SCA 0.25%
02/07/2025 EUR 100,000 101,610 0.45 Microsoft Corp. 3.125% 06/12/2028 EUR 100,000 126,261 0.56 PepsiCo, Inc. 0.25% 06/05/2024 EUR 100,000 101,556 0.45 Prologis Euro Finance LLC 0.375%
06/02/2028 EUR 100,000 102,420 0.45 Schlumberger Finance BV, Reg. S 1.375%
28/10/2026 EUR 100,000 107,843 0.48 Thermo Fisher Scientific, Inc. 1.875%
01/10/2049 EUR 100,000 116,189 0.51 Verizon Communications, Inc. 1.3%
18/05/2033 EUR 100,000 108,973 0.48 Verizon Communications, Inc. 0.875%
02/04/2025 EUR 200,000 208,594 0.92
3,341,768 14.78
Total corporate Bonds 22,139,601 97.92
Total Transferable securities and money market instruments admitted to official exchange listing or dealt in on another regulated market 22,139,601 97.92
Total Investments 22,139,601 97.92
cash 309,358 1.37
other assets/(liabilities) 160,491 0.71
Total net assets 22,609,450 100.00
financial futures contracts
security Descriptionnumber
of contracts currency
Global Exposure
EUR
Unrealised Gain/(loss)
EUR
% of net assets
Euro-Bobl, 08/03/2021 (13) EUR (1,757,340) 1,430 0.01 Euro-Bund, 08/03/2021 (4) EUR (710,560) 640 0.00
Total Unrealised Gain on financial futures contracts 2,070 0.01
net Unrealised Gain on financial futures contracts 2,070 0.01
Collateral received and paid by the Fund in respect of financial derivative instruments:
Type of collateral counterparty currency amount received amount paid
sustainable Euro corporate Bond fund
Cash Goldman Sachs EUR 27,716 –
27,716 –
DERIVaTIVEs
Over-the-counter (OTC) and exchange traded derivatives as at 31 December 2020, expressed in Euro.

Morgan Stanley Investment Funds 31 December 2020 250
The accompanying notes are an integral part of these financial statements.
Please refer to the full prospectus for the Fund’s investment objective and policy.
Sustainable Euro Strategic Bond Fund
*Fund commenced operation on 31 July 2020.
InVEsTmEnT aIm
To provide an attractive rate of relative return, measured in Euro, by investing primarily in issues of Euro denominated Fixed Income Securities whether issued by corporations, government or government guaranteed issuers, and subject to applicable law, no more than 20% of its assets in asset-backed securities to the extent that these instruments are securitised, while incorporating environmental, social and corporate governance (ESG) considerations.
schEDUlE of InVEsTmEnTsAs at 31 December 2020
Investments Currency
Quantity/ Nominal
Value
Market Value EUR
% of Net Assets
Transferable securities and money market instruments admitted to official exchange listing or dealt in on another regulated market
convertible Bonds
ItalyNexi SpA, Reg. S 1.75% 24/04/2027 EUR 100,000 123,651 0.51
123,651 0.51
spainCellnex Telecom SA, Reg. S 0.75%
20/11/2031 EUR 100,000 96,366 0.39
96,366 0.39
Total convertible Bonds 220,017 0.90
corporate Bonds
australiaCommonwealth Bank of Australia, Reg. S,
FRN 1.936% 03/10/2029 EUR 100,000 104,743 0.43 Optus Finance Pty. Ltd., Reg. S 1%
20/06/2029 EUR 100,000 105,461 0.43 Telstra Corp. Ltd., Reg. S 1% 23/04/2030 EUR 100,000 107,680 0.44 Transurban Finance Co. Pty. Ltd., Reg. S
1.75% 29/03/2028 EUR 100,000 110,858 0.46
428,742 1.76
austriaCA Immobilien Anlagen AG, Reg. S 1%
27/10/2025 EUR 100,000 101,889 0.42 UNIQA Insurance Group AG, Reg. S, FRN
6% 27/07/2046 EUR 100,000 122,939 0.50 Vienna Insurance Group AG Wiener
Versicherung Gruppe, Reg. S, FRN 5.5% 09/10/2043 EUR 100,000 114,250 0.47
339,078 1.39
BelgiumAnheuser-Busch InBev SA/NV, Reg. S 3.7%
02/04/2040 EUR 100,000 141,796 0.58 FLUVIUS System Operator CVBA, Reg. S
0.25% 02/12/2030 EUR 100,000 101,464 0.42 KBC Group NV, Reg. S 0.375%
16/06/2027 EUR 100,000 102,045 0.42
345,305 1.42
canadaCPPIB Capital, Inc., Reg. S 0.25%
06/04/2027 EUR 250,000 258,316 1.06
258,316 1.06
DenmarkCarlsberg Breweries A/S, Reg. S 0.875%
01/07/2029 EUR 100,000 105,028 0.43
105,028 0.43
*
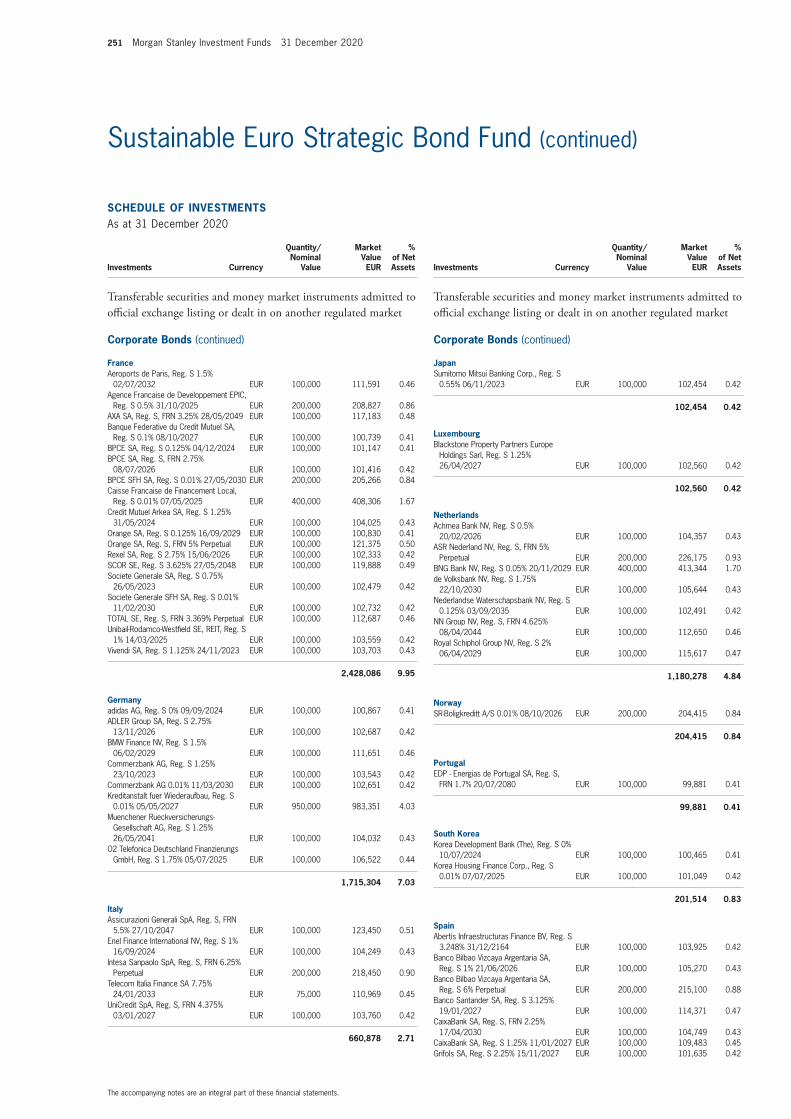
251 Morgan Stanley Investment Funds 31 December 2020
The accompanying notes are an integral part of these financial statements.
Sustainable Euro Strategic Bond Fund (continued)
schEDUlE of InVEsTmEnTsAs at 31 December 2020
Investments Currency
Quantity/ Nominal
Value
Market Value EUR
% of Net Assets
Transferable securities and money market instruments admitted to official exchange listing or dealt in on another regulated market
corporate Bonds (continued)
franceAeroports de Paris, Reg. S 1.5%
02/07/2032 EUR 100,000 111,591 0.46 Agence Francaise de Developpement EPIC,
Reg. S 0.5% 31/10/2025 EUR 200,000 208,827 0.86 AXA SA, Reg. S, FRN 3.25% 28/05/2049 EUR 100,000 117,183 0.48 Banque Federative du Credit Mutuel SA,
Reg. S 0.1% 08/10/2027 EUR 100,000 100,739 0.41 BPCE SA, Reg. S 0.125% 04/12/2024 EUR 100,000 101,147 0.41 BPCE SA, Reg. S, FRN 2.75%
08/07/2026 EUR 100,000 101,416 0.42 BPCE SFH SA, Reg. S 0.01% 27/05/2030 EUR 200,000 205,266 0.84 Caisse Francaise de Financement Local,
Reg. S 0.01% 07/05/2025 EUR 400,000 408,306 1.67 Credit Mutuel Arkea SA, Reg. S 1.25%
31/05/2024 EUR 100,000 104,025 0.43 Orange SA, Reg. S 0.125% 16/09/2029 EUR 100,000 100,830 0.41 Orange SA, Reg. S, FRN 5% Perpetual EUR 100,000 121,375 0.50 Rexel SA, Reg. S 2.75% 15/06/2026 EUR 100,000 102,333 0.42 SCOR SE, Reg. S 3.625% 27/05/2048 EUR 100,000 119,888 0.49 Societe Generale SA, Reg. S 0.75%
26/05/2023 EUR 100,000 102,479 0.42 Societe Generale SFH SA, Reg. S 0.01%
11/02/2030 EUR 100,000 102,732 0.42 TOTAL SE, Reg. S, FRN 3.369% Perpetual EUR 100,000 112,687 0.46 Unibail-Rodamco-Westfield SE, REIT, Reg. S
1% 14/03/2025 EUR 100,000 103,559 0.42 Vivendi SA, Reg. S 1.125% 24/11/2023 EUR 100,000 103,703 0.43
2,428,086 9.95
Germanyadidas AG, Reg. S 0% 09/09/2024 EUR 100,000 100,867 0.41 ADLER Group SA, Reg. S 2.75%
13/11/2026 EUR 100,000 102,687 0.42 BMW Finance NV, Reg. S 1.5%
06/02/2029 EUR 100,000 111,651 0.46 Commerzbank AG, Reg. S 1.25%
23/10/2023 EUR 100,000 103,543 0.42 Commerzbank AG 0.01% 11/03/2030 EUR 100,000 102,651 0.42 Kreditanstalt fuer Wiederaufbau, Reg. S
0.01% 05/05/2027 EUR 950,000 983,351 4.03 Muenchener Rueckversicherungs-
Gesellschaft AG, Reg. S 1.25% 26/05/2041 EUR 100,000 104,032 0.43
O2 Telefonica Deutschland Finanzierungs GmbH, Reg. S 1.75% 05/07/2025 EUR 100,000 106,522 0.44
1,715,304 7.03
ItalyAssicurazioni Generali SpA, Reg. S, FRN
5.5% 27/10/2047 EUR 100,000 123,450 0.51 Enel Finance International NV, Reg. S 1%
16/09/2024 EUR 100,000 104,249 0.43 Intesa Sanpaolo SpA, Reg. S, FRN 6.25%
Perpetual EUR 200,000 218,450 0.90 Telecom Italia Finance SA 7.75%
24/01/2033 EUR 75,000 110,969 0.45 UniCredit SpA, Reg. S, FRN 4.375%
03/01/2027 EUR 100,000 103,760 0.42
660,878 2.71
schEDUlE of InVEsTmEnTsAs at 31 December 2020
Investments Currency
Quantity/ Nominal
Value
Market Value EUR
% of Net Assets
Transferable securities and money market instruments admitted to official exchange listing or dealt in on another regulated market
corporate Bonds (continued)
JapanSumitomo Mitsui Banking Corp., Reg. S
0.55% 06/11/2023 EUR 100,000 102,454 0.42
102,454 0.42
luxembourgBlackstone Property Partners Europe
Holdings Sarl, Reg. S 1.25% 26/04/2027 EUR 100,000 102,560 0.42
102,560 0.42
netherlandsAchmea Bank NV, Reg. S 0.5%
20/02/2026 EUR 100,000 104,357 0.43 ASR Nederland NV, Reg. S, FRN 5%
Perpetual EUR 200,000 226,175 0.93 BNG Bank NV, Reg. S 0.05% 20/11/2029 EUR 400,000 413,344 1.70 de Volksbank NV, Reg. S 1.75%
22/10/2030 EUR 100,000 105,644 0.43 Nederlandse Waterschapsbank NV, Reg. S
0.125% 03/09/2035 EUR 100,000 102,491 0.42 NN Group NV, Reg. S, FRN 4.625%
08/04/2044 EUR 100,000 112,650 0.46 Royal Schiphol Group NV, Reg. S 2%
06/04/2029 EUR 100,000 115,617 0.47
1,180,278 4.84
norwaySR-Boligkreditt A/S 0.01% 08/10/2026 EUR 200,000 204,415 0.84
204,415 0.84
PortugalEDP - Energias de Portugal SA, Reg. S,
FRN 1.7% 20/07/2080 EUR 100,000 99,881 0.41
99,881 0.41
south KoreaKorea Development Bank (The), Reg. S 0%
10/07/2024 EUR 100,000 100,465 0.41 Korea Housing Finance Corp., Reg. S
0.01% 07/07/2025 EUR 100,000 101,049 0.42
201,514 0.83
spainAbertis Infraestructuras Finance BV, Reg. S
3.248% 31/12/2164 EUR 100,000 103,925 0.42 Banco Bilbao Vizcaya Argentaria SA,
Reg. S 1% 21/06/2026 EUR 100,000 105,270 0.43 Banco Bilbao Vizcaya Argentaria SA,
Reg. S 6% Perpetual EUR 200,000 215,100 0.88 Banco Santander SA, Reg. S 3.125%
19/01/2027 EUR 100,000 114,371 0.47 CaixaBank SA, Reg. S, FRN 2.25%
17/04/2030 EUR 100,000 104,749 0.43 CaixaBank SA, Reg. S 1.25% 11/01/2027 EUR 100,000 109,483 0.45 Grifols SA, Reg. S 2.25% 15/11/2027 EUR 100,000 101,635 0.42

Morgan Stanley Investment Funds 31 December 2020 252
The accompanying notes are an integral part of these financial statements.
Sustainable Euro Strategic Bond Fund (continued)
schEDUlE of InVEsTmEnTsAs at 31 December 2020
Investments Currency
Quantity/ Nominal
Value
Market Value EUR
% of Net Assets
Transferable securities and money market instruments admitted to official exchange listing or dealt in on another regulated market
corporate Bonds (continued)
spain (continued)Iberdrola International BV, Reg. S, FRN
1.875% Perpetual EUR 100,000 102,812 0.42 Iberdrola International BV, Reg. S, FRN
3.25% Perpetual EUR 100,000 109,763 0.45 Instituto de Credito Oficial, Reg. S 0.25%
30/04/2024 EUR 400,000 409,966 1.68 Repsol International Finance BV, Reg. S,
FRN 4.247% Perpetual EUR 100,000 111,363 0.46 Telefonica Europe BV, Reg. S, FRN 2.502%
Perpetual EUR 100,000 102,231 0.42
1,690,668 6.93
supra-nationalCouncil of Europe Development Bank,
Reg. S 0% 09/04/2027 EUR 200,000 206,268 0.84 European Investment Bank, Reg. S 0.01%
15/11/2035 EUR 325,000 332,531 1.36 European Union, Reg. S 0% 04/10/2030 EUR 60,000 62,526 0.26 European Union, Reg. S 0% 04/07/2035 EUR 30,000 30,840 0.13 International Bank for Reconstruction
& Development 0.1% 17/09/2035 EUR 200,000 204,812 0.84
836,977 3.43
swedenAkelius Residential Property Financing BV,
Reg. S 1% 17/01/2028 EUR 100,000 103,207 0.42 Intrum AB, Reg. S 3.125% 15/07/2024 EUR 100,000 100,532 0.41
203,739 0.83
switzerlandLonza Finance International NV, Reg. S
1.625% 21/04/2027 EUR 100,000 109,637 0.45
109,637 0.45
United KingdomAviva plc, Reg. S, FRN 3.375%
04/12/2045 EUR 100,000 111,473 0.46 BP Capital Markets plc, Reg. S 3.25%
Perpetual EUR 100,000 106,875 0.44 Chanel Ceres plc, Reg. S 0.5%
31/07/2026 EUR 100,000 101,524 0.42 Heathrow Funding Ltd., Reg. S 1.5%
12/10/2027 EUR 100,000 104,723 0.43 HSBC Holdings plc, Reg. S 0.309%
13/11/2026 EUR 100,000 101,306 0.41 HSBC Holdings plc, Reg. S 3%
30/06/2025 EUR 200,000 224,152 0.92 Informa plc, Reg. S 1.5% 05/07/2023 EUR 100,000 102,580 0.42 Lloyds Banking Group plc, Reg. S, FRN
1.75% 07/09/2028 EUR 100,000 103,019 0.42 NGG Finance plc, Reg. S, FRN 1.625%
05/12/2079 EUR 100,000 101,875 0.42 Reckitt Benckiser Treasury Services
Nederland BV, Reg. S 0.375% 19/05/2026 EUR 100,000 102,839 0.42
Vodafone Group plc, Reg. S 0.9% 24/11/2026 EUR 100,000 105,413 0.43
1,265,779 5.19
schEDUlE of InVEsTmEnTsAs at 31 December 2020
Investments Currency
Quantity/ Nominal
Value
Market Value EUR
% of Net Assets
Transferable securities and money market instruments admitted to official exchange listing or dealt in on another regulated market
corporate Bonds (continued)
United states of americaAmerican Honda Finance Corp. 1.95%
18/10/2024 EUR 100,000 107,641 0.44 Coca-Cola Co. (The) 0.125% 15/03/2029 EUR 100,000 100,855 0.41 Digital Dutch Finco BV, Reg. S 1%
15/01/2032 EUR 100,000 103,670 0.43 Verizon Communications, Inc. 1.3%
18/05/2033 EUR 100,000 108,973 0.45
421,139 1.73
Total corporate Bonds 12,699,778 52.07
Government Bonds
australiaAustralia Government Bond, Reg. S 0.5%
21/09/2026 AUD 350,000 220,996 0.91 Australia Government Bond, Reg. S 1%
21/12/2030 AUD 450,000 283,843 1.16
504,839 2.07
austriaAustria Government Bond, Reg. S, 144A
0.85% 30/06/2120 EUR 120,000 158,674 0.65
158,674 0.65
BelgiumBelgium Government Bond, Reg. S, 144A
1.7% 22/06/2050 EUR 175,000 242,496 1.00 Belgium Government Bond, Reg. S 1.25%
22/04/2033 EUR 200,000 237,398 0.97
479,894 1.97
BrazilBrazil Notas do Tesouro Nacional 10%
01/01/2025 BRL 62,500 113,564 0.47
113,564 0.47
BulgariaBulgaria Government Bond, Reg. S
3.125% 26/03/2035 EUR 100,000 131,832 0.54
131,832 0.54
chileChile Government Bond 1.25%
29/01/2040 EUR 125,000 131,867 0.54
131,867 0.54

253 Morgan Stanley Investment Funds 31 December 2020
The accompanying notes are an integral part of these financial statements.
Sustainable Euro Strategic Bond Fund (continued)
schEDUlE of InVEsTmEnTsAs at 31 December 2020
Investments Currency
Quantity/ Nominal
Value
Market Value EUR
% of Net Assets
Transferable securities and money market instruments admitted to official exchange listing or dealt in on another regulated market
Government Bonds (continued)
croatiaCroatia Government Bond, Reg. S 1.125%
19/06/2029 EUR 400,000 421,680 1.73
421,680 1.73
Dominican RepublicDominican Republic Government Bond,
Reg. S 5.875% 30/01/2060 USD 150,000 134,788 0.55
134,788 0.55
EstoniaEstonia Government Bond, Reg. S 0.125%
10/06/2030 EUR 100,000 103,215 0.42
103,215 0.42
finlandFinland Government Bond, Reg. S, 144A
1.125% 15/04/2034 EUR 100,000 118,663 0.49
118,663 0.49
franceFrance Government Bond OAT, Reg. S,
144A 1.75% 25/06/2039 EUR 425,000 561,801 2.30
561,801 2.30
GermanyBundesrepublik Deutschland, Reg. S 0%
15/08/2030 EUR 300,000 318,124 1.31 State of North Rhine-Westphalia Germany,
Reg. S 0% 12/10/2035 EUR 250,000 252,082 1.03
570,206 2.34
GreeceGreece Government Bond, Reg. S, 144A
2% 22/04/2027 EUR 100,000 110,490 0.45
110,490 0.45
hungaryHungary Government Bond, Reg. S
1.625% 28/04/2032 EUR 100,000 109,322 0.45 Hungary Government Bond, Reg. S 1.75%
05/06/2035 EUR 200,000 221,952 0.91
331,274 1.36
IrelandIreland Government Bond, Reg. S 1.35%
18/03/2031 EUR 200,000 234,545 0.96
234,545 0.96
schEDUlE of InVEsTmEnTsAs at 31 December 2020
Investments Currency
Quantity/ Nominal
Value
Market Value EUR
% of Net Assets
Transferable securities and money market instruments admitted to official exchange listing or dealt in on another regulated market
Government Bonds (continued)
ItalyItaly Buoni Poliennali Del Tesoro, Reg. S
0.5% 01/02/2026 EUR 850,000 872,015 3.58 Italy Buoni Poliennali Del Tesoro, Reg. S
0.95% 01/08/2030 EUR 150,000 156,836 0.64 Italy Buoni Poliennali Del Tesoro, Reg. S,
144A 1.4% 26/05/2025 EUR 700,000 741,546 3.04 Italy Buoni Poliennali Del Tesoro, Reg. S,
144A 0.55% 21/05/2026 EUR 200,000 204,609 0.84 Italy Buoni Poliennali Del Tesoro, Reg. S,
144A 0.65% 28/10/2027 EUR 345,000 354,710 1.45 Italy Buoni Poliennali Del Tesoro, Reg. S,
144A 1.65% 01/12/2030 EUR 310,000 344,043 1.41 Italy Buoni Poliennali Del Tesoro, Reg. S,
144A 2.45% 01/09/2050 EUR 400,000 499,834 2.05
3,173,593 13.01
luxembourgState of the Grand-Duchy of Luxembourg,
Reg. S 0% 14/09/2032 EUR 30,000 30,962 0.13
30,962 0.13
mexicoMexican Bonos 8.5% 31/05/2029 MXN 4,000,000 200,235 0.82 Mexican Bonos 7.75% 29/05/2031 MXN 2,500,000 120,634 0.49 Mexico Government Bond 1.35%
18/09/2027 EUR 110,000 113,940 0.47 Mexico Government Bond 1.75%
17/04/2028 EUR 150,000 158,046 0.65
592,855 2.43
montenegroMontenegro Government Bond, Reg. S
2.875% 16/12/2027 EUR 125,000 122,923 0.50 Montenegro Government Bond, Reg. S
2.55% 03/10/2029 EUR 125,000 118,697 0.49
241,620 0.99
new ZealandNew Zealand Government Bond 0.25%
15/05/2028 NZD 130,000 73,954 0.30 New Zealand Government Bond 1.75%
15/05/2041 NZD 50,000 29,059 0.12
103,013 0.42
PortugalPortugal Obrigacoes do Tesouro OT,
Reg. S, 144A 0.7% 15/10/2027 EUR 300,000 319,460 1.31
319,460 1.31

Morgan Stanley Investment Funds 31 December 2020 254
The accompanying notes are an integral part of these financial statements.
Sustainable Euro Strategic Bond Fund (continued)
schEDUlE of InVEsTmEnTsAs at 31 December 2020
Investments Currency
Quantity/ Nominal
Value
Market Value EUR
% of Net Assets
Transferable securities and money market instruments admitted to official exchange listing or dealt in on another regulated market
Government Bonds (continued)
senegalSenegal Government Bond, Reg. S 4.75%
13/03/2028 EUR 100,000 107,065 0.44
107,065 0.44
serbiaSerbia Government Bond, Reg. S 1.5%
26/06/2029 EUR 150,000 155,475 0.64
155,475 0.64
sloveniaSlovenia Government Bond, Reg. S
0.275% 14/01/2030 EUR 275,000 287,072 1.18 Slovenia Government Bond, Reg. S
0.488% 20/10/2050 EUR 100,000 105,559 0.43
392,631 1.61
south KoreaKorea Government Bond 0% 16/09/2025 EUR 100,000 101,303 0.42
101,303 0.42
spainSpain Government Bond, Reg. S, 144A
1.95% 30/04/2026 EUR 550,000 619,899 2.54 Spain Government Bond, Reg. S, 144A
1.25% 31/10/2030 EUR 300,000 335,451 1.37 Spain Government Bond, Reg. S, 144A
3.45% 30/07/2066 EUR 200,000 362,462 1.49 Spain Government Inflation Linked Bond,
Reg. S, 144A 0.65% 30/11/2027 EUR 300,000 352,745 1.45
1,670,557 6.85
Total Government Bonds 10,995,866 45.09
Total Transferable securities and money market instruments admitted to official exchange listing or dealt in on another regulated market 23,915,661 98.06
Total Investments 23,915,661 98.06
cash 420,715 1.72
other assets/(liabilities) 53,461 0.22
Total net assets 24,389,837 100.00
financial futures contracts
security Descriptionnumber
of contracts currency
Global Exposure
EUR
Unrealised Gain/(loss)
EUR
% of net assets
Australia 10 Year Bond, 15/03/2021 2 AUD 185,533 405 0.00Euro-Bobl, 08/03/2021 (10) EUR (1,351,800) 1,100 0.00Euro-BTP, 08/03/2021 2 EUR 304,020 1,472 0.01 Euro-Bund, 08/03/2021 (2) EUR (355,280) 320 0.00US 10 Year Note, 22/03/2021 3 USD 337,425 1,490 0.01
Total Unrealised Gain on financial futures contracts 4,787 0.02
Euro-OAT, 08/03/2021 (3) EUR (503,580) (30) 0.00Euro-Schatz, 08/03/2021 4 EUR 449,100 (410) 0.00US Long Bond, 22/03/2021 (1) USD (141,001) (664) 0.00US Ultra Bond, 22/03/2021 (1) USD (173,730) (1,928) (0.01)
Total Unrealised loss on financial futures contracts (3,032) (0.01)
net Unrealised Gain on financial futures contracts 1,755 0.01
forward currency Exchange contracts
currency Purchased
amount Purchased
currency sold
amount sold
maturity Date counterparty
Unrealised Gain/(loss)
EUR
% of net assets
EUR 218,482 USD 265,000 15/01/2021 State Street 2,553 0.01 EUR 365,631 USD 435,000 15/01/2021 Westpac Banking 11,183 0.05 EUR 146,412 MXN 3,560,000 20/01/2021 UBS 658 0.00MXN 3,000,000 EUR 121,592 20/01/2021 RBC 1,235 0.00NOK 800,000 EUR 72,423 21/01/2021 J.P. Morgan 3,961 0.02 NOK 495,000 USD 55,989 21/01/2021 RBC 1,648 0.01 AUD 354,291 EUR 218,488 22/01/2021 J.P. Morgan 4,687 0.02 ZAR 2,250,000 EUR 119,275 22/01/2021 RBC 5,520 0.02 EUR 176,260 PLN 795,000 25/01/2021 RBC 2,002 0.01 EUR 130,439 USD 160,000 01/02/2021 RBC 120 0.00IDR 1,020,000,000 USD 71,773 01/02/2021 BNP Paribas 1,127 0.00
Unrealised Gain on forward currency Exchange contracts – assets 34,694 0.14
Total Unrealised Gain on forward currency Exchange contracts – assets 34,694 0.14
EUR 193,568 MXN 4,840,000 20/01/2021 State Street (4,592) (0.02) MXN 1,840,000 EUR 75,585 20/01/2021 RBC (252) 0.00EUR 184,804 SEK 1,917,000 21/01/2021 J.P. Morgan (6,478) (0.03) EUR 702,143 AUD 1,160,000 22/01/2021 RBC (28,564) (0.12) EUR 195,569 NZD 345,000 22/01/2021 Westpac Banking (7,645) (0.03) USD 145,713 ZAR 2,240,000 22/01/2021 RBC (5,529) (0.02) PLN 245,000 EUR 54,084 25/01/2021 Westpac Banking (382) 0.00PLN 545,000 USD 147,239 25/01/2021 RBC (486) 0.00EUR 165,971 GBP 150,000 27/01/2021 Westpac Banking (959) 0.00GBP 150,000 EUR 168,138 27/01/2021 Westpac Banking (1,207) (0.01) USD 90,000 EUR 73,955 01/02/2021 RBC (651) 0.00USD 71,849 IDR 1,025,000,000 01/02/2021 Barclays (1,357) (0.01)
Unrealised loss on forward currency Exchange contracts – liabilities (58,102) (0.24)
Total Unrealised loss on forward currency Exchange contracts – liabilities (58,102) (0.24)
net Unrealised loss on forward currency Exchange contracts – liabilities (23,408) (0.10)
DERIVaTIVEs
Over-the-counter (OTC) and exchange traded derivatives as at 31 December 2020, expressed in Euro.

255 Morgan Stanley Investment Funds 31 December 2020
The accompanying notes are an integral part of these financial statements.
Sustainable Euro Strategic Bond Fund (continued)
credit Default swap contracts
nominal amount ccy counterparty
Reference Entity
Buy/ sell
Interest (Paid)/
Received Rate
maturity Date
market Value EUR
% of net assets
250,000 EUR Goldman Sachs ITRAXX.EUROPE.CROSSOVER. 34-V1 Buy (5.00)% 20/12/2025 (30,606) (0.13)
500,000 EUR Goldman Sachs ITRAXX.EUROPE.MAIN. 34-V1 Buy (1.00)% 20/12/2025 (13,285) (0.05)
Total market Value on credit Default swap contracts – liabilities (43,891) (0.18)
net market Value on credit Default swap contracts – liabilities (43,891) (0.18)
Collateral received and paid by the Fund in respect of financial derivative instruments:
Type of collateral counterparty currency amount received amount paid
sustainable Euro strategic Bond fund
Cash Goldman Sachs EUR 12,742 –
12,742 –
DERIVaTIVEs (continued)
Over-the-counter (OTC) and exchange traded derivatives as at 31 December 2020, expressed in Euro.

Morgan Stanley Investment Funds 31 December 2020 256
The accompanying notes are an integral part of these financial statements.
Please refer to the full prospectus for the Fund’s investment objective and policy.
InVEsTmEnT aIm
To provide an attractive rate of relative return, measured in US Dollars, by investing primarily in high quality issues of US Dollar denominated Fixed Income Securities issued by corporations and other non-government issuers.
US Dollar Corporate Bond Fund
schEDUlE of InVEsTmEnTsAs at 31 December 2020
Investments Currency
Quantity/ Nominal
Value
Market Value USD
% of Net Assets
Transferable securities and money market instruments admitted to official exchange listing or dealt in on another regulated market
convertible Bonds
computersWestern Digital Corp. 1.5% 01/02/2024 USD 360,000 357,746 0.11
357,746 0.11
EntertainmentMarriott Vacations Worldwide Corp. 1.5%
15/09/2022 USD 350,000 396,918 0.12
396,918 0.12
InternetBooking Holdings, Inc. 0.9% 15/09/2021 USD 325,000 375,171 0.11 Palo Alto Networks, Inc. 0.75%
01/07/2023 USD 315,000 448,009 0.14 Twitter, Inc. 1% 15/09/2021 USD 345,000 351,695 0.11
1,174,875 0.36
mediaLiberty Latin America Ltd. 2% 15/07/2024 USD 400,000 378,388 0.11
378,388 0.11
PharmaceuticalsJazz Investments I Ltd. 1.875%
15/08/2021 USD 400,000 409,577 0.12
409,577 0.12
softwareAkamai Technologies, Inc. 0.375%
01/09/2027 USD 200,000 223,114 0.07 Akamai Technologies, Inc. 0.375%
01/09/2027 USD 50,000 55,779 0.02 J2 Global, Inc., 144A 1.75% 01/11/2026 USD 365,000 379,566 0.11 Verint Systems, Inc. 1.5% 01/06/2021 USD 325,000 353,981 0.11
1,012,440 0.31
Total convertible Bonds 3,729,944 1.13
corporate Bonds
aerospace & DefenseBoeing Co. (The) 5.15% 01/05/2030 USD 675,000 817,428 0.25 Boeing Co. (The) 3.25% 01/02/2035 USD 500,000 512,753 0.16 Boeing Co. (The) 3.95% 01/08/2059 USD 325,000 347,705 0.11 Embraer Netherlands Finance BV 5.4%
01/02/2027 USD 425,000 452,098 0.14 Raytheon Technologies Corp. 4.05%
04/05/2047 USD 50,000 62,275 0.02 Raytheon Technologies Corp. 4.5%
01/06/2042 USD 650,000 850,217 0.25
3,042,476 0.93

257 Morgan Stanley Investment Funds 31 December 2020
The accompanying notes are an integral part of these financial statements.
US Dollar Corporate Bond Fund (continued)
schEDUlE of InVEsTmEnTsAs at 31 December 2020
Investments Currency
Quantity/ Nominal
Value
Market Value USD
% of Net Assets
Transferable securities and money market instruments admitted to official exchange listing or dealt in on another regulated market
corporate Bonds (continued)
agricultureAltria Group, Inc. 3.875% 16/09/2046 USD 400,000 422,437 0.13 BAT Capital Corp. 3.557% 15/08/2027 USD 1,375,000 1,530,889 0.47 BAT Capital Corp. 3.734% 25/09/2040 USD 725,000 757,433 0.23 Imperial Brands Finance plc, 144A 3.125%
26/07/2024 USD 1,425,000 1,527,544 0.46
4,238,303 1.29
airlinesDelta Air Lines, Inc. 3.625% 15/03/2022 USD 700,000 720,345 0.22
720,345 0.22
apparelNIKE, Inc. 3.375% 27/03/2050 USD 750,000 924,819 0.28
924,819 0.28
auto manufacturersCummins, Inc. 2.6% 01/09/2050 USD 250,000 255,299 0.08 Daimler Finance North America LLC, 144A
2.7% 14/06/2024 USD 750,000 803,260 0.24 Ford Motor Credit Co. LLC 4.389%
08/01/2026 USD 925,000 972,258 0.30 General Motors Co. 6.6% 01/04/2036 USD 450,000 609,137 0.19 General Motors Financial Co., Inc. 4.35%
17/01/2027 USD 50,000 56,959 0.02 General Motors Financial Co., Inc. 3.85%
05/01/2028 USD 1,375,000 1,529,479 0.45 Hyundai Capital America, 144A 2.375%
10/02/2023 USD 675,000 696,384 0.21 Hyundai Capital America, 144A 3%
10/02/2027 USD 2,025,000 2,202,905 0.68 Nissan Motor Co. Ltd., 144A 3.043%
15/09/2023 USD 1,400,000 1,464,782 0.44 Volkswagen Group of America Finance
LLC, 144A 1.25% 24/11/2025 USD 1,175,000 1,187,143 0.36
9,777,606 2.97
BanksAustralia & New Zealand Banking Group
Ltd., 144A 2.57% 25/11/2035 USD 425,000 433,699 0.13 Banco de Credito del Peru, 144A 2.7%
11/01/2025 USD 450,000 470,367 0.14 Banco Santander Chile, 144A 2.7%
10/01/2025 USD 775,000 821,508 0.25 Bank of America Corp. 3.248%
21/10/2027 USD 800,000 895,445 0.27 Bank of America Corp. 1.898%
23/07/2031 USD 4,150,000 4,192,315 1.27 Bank of America Corp. 2.676%
19/06/2041 USD 1,758,000 1,834,683 0.56 Bank of America Corp., FRN 2.592%
29/04/2031 USD 1,375,000 1,472,969 0.45 Barclays plc, FRN 2.852% 07/05/2026 USD 1,325,000 1,424,149 0.43 BNP Paribas SA, FRN, 144A 3.052%
13/01/2031 USD 1,325,000 1,444,824 0.44 BPCE SA, 144A 5.15% 21/07/2024 USD 1,725,000 1,964,363 0.60 BPCE SA, 144A 1.652% 06/10/2026 USD 1,225,000 1,254,738 0.38
schEDUlE of InVEsTmEnTsAs at 31 December 2020
Investments Currency
Quantity/ Nominal
Value
Market Value USD
% of Net Assets
Transferable securities and money market instruments admitted to official exchange listing or dealt in on another regulated market
corporate Bonds (continued)
Banks (continued)Capital One Financial Corp. 3.75%
09/03/2027 USD 850,000 970,216 0.29 Citigroup, Inc. 4.45% 29/09/2027 USD 1,700,000 2,005,108 0.61 Citigroup, Inc. 2.666% 29/01/2031 USD 829,000 889,591 0.27 Citigroup, Inc. 4.412% 31/03/2031 USD 2,457,000 2,985,039 0.91 Commerzbank AG, 144A 8.125%
19/09/2023 USD 875,000 1,023,817 0.31 Credit Agricole SA, 144A 4.125%
10/01/2027 USD 250,000 288,101 0.09 Credit Suisse Group AG, FRN, 144A
2.593% 11/09/2025 USD 750,000 791,490 0.24 Deutsche Bank AG 3.7% 30/05/2024 USD 525,000 565,271 0.17 Goldman Sachs Group, Inc. (The) 6.75%
01/10/2037 USD 1,100,000 1,689,746 0.51 Goldman Sachs Group, Inc. (The) 4.8%
08/07/2044 USD 75,000 104,088 0.03 Goldman Sachs Group, Inc. (The), FRN
3.691% 05/06/2028 USD 2,350,000 2,706,996 0.82 Grupo Aval Ltd., 144A 4.375%
04/02/2030 USD 1,050,000 1,119,825 0.34 HSBC Holdings plc 1.589% 24/05/2027 USD 1,825,000 1,856,215 0.56 HSBC Holdings plc 4.375% 23/11/2026 USD 800,000 923,369 0.28 ING Groep NV, 144A 4.625% 06/01/2026 USD 1,825,000 2,148,749 0.66 Itau Unibanco Holding SA, 144A 2.9%
24/01/2023 USD 1,450,000 1,488,802 0.45 JPMorgan Chase & Co. 4.125%
15/12/2026 USD 750,000 877,341 0.27 JPMorgan Chase & Co. 2.739%
15/10/2030 USD 2,125,000 2,309,208 0.70 JPMorgan Chase & Co. 1.764%
19/11/2031 USD 3,300,000 3,337,431 1.01 JPMorgan Chase & Co., FRN 2.956%
13/05/2031 USD 1,575,000 1,727,843 0.52 Lloyds Banking Group plc 4.375%
22/03/2028 USD 850,000 1,011,108 0.31 Macquarie Bank Ltd., 144A 3.624%
03/06/2030 USD 1,175,000 1,284,210 0.39 National Australia Bank Ltd., 144A 2.332%
21/08/2030 USD 1,650,000 1,679,602 0.51 National Securities Clearing Corp., 144A
1.5% 23/04/2025 USD 1,300,000 1,346,176 0.41 Natwest Group plc 3.875% 12/09/2023 USD 1,125,000 1,221,295 0.37 Oversea-Chinese Banking Corp. Ltd., 144A
1.832% 10/09/2030 USD 450,000 457,384 0.14 PNC Financial Services Group, Inc. (The)
2.2% 01/11/2024 USD 650,000 691,042 0.21 Santander UK Group Holdings plc, FRN
4.796% 15/11/2024 USD 1,725,000 1,919,847 0.58 Shinhan Bank Co. Ltd., Reg. S 4%
23/04/2029 USD 1,125,000 1,280,782 0.39 Societe Generale SA, 144A 2.625%
22/01/2025 USD 1,050,000 1,112,411 0.34 SVB Financial Group 3.125% 05/06/2030 USD 975,000 1,098,971 0.33 Wells Fargo & Co., FRN 2.879%
30/10/2030 USD 50,000 54,542 0.02 Wells Fargo & Co., FRN 2.572%
11/02/2031 USD 1,650,000 1,751,233 0.53 Wells Fargo & Co., FRN 3.068%
30/04/2041 USD 625,000 679,481 0.21 Westpac Banking Corp. 2.668%
15/11/2035 USD 275,000 283,638 0.09
61,889,028 18.79

Morgan Stanley Investment Funds 31 December 2020 258
The accompanying notes are an integral part of these financial statements.
US Dollar Corporate Bond Fund (continued)
schEDUlE of InVEsTmEnTsAs at 31 December 2020
Investments Currency
Quantity/ Nominal
Value
Market Value USD
% of Net Assets
Transferable securities and money market instruments admitted to official exchange listing or dealt in on another regulated market
corporate Bonds (continued)
BeveragesAnheuser-Busch InBev Worldwide, Inc.
4.75% 23/01/2029 USD 1,000,000 1,234,047 0.38 Anheuser-Busch InBev Worldwide, Inc.
4.35% 01/06/2040 USD 675,000 828,875 0.25 Anheuser-Busch InBev Worldwide, Inc.
4.6% 15/04/2048 USD 825,000 1,043,273 0.32 Anheuser-Busch InBev Worldwide, Inc.
4.5% 01/06/2050 USD 950,000 1,198,320 0.36 Coca-Cola Femsa SAB de CV 2.75%
22/01/2030 USD 1,075,000 1,157,437 0.35
5,461,952 1.66
BiotechnologyAmgen, Inc., 144A 2.77% 01/09/2053 USD 500,000 503,602 0.15 Gilead Sciences, Inc. 2.8% 01/10/2050 USD 400,000 400,659 0.12 Royalty Pharma plc, 144A 2.2%
02/09/2030 USD 1,350,000 1,382,150 0.42
2,286,411 0.69
Building materialsFortune Brands Home & Security, Inc. 4%
21/09/2023 USD 75,000 81,758 0.02 Johnson Controls International plc 1.75%
15/09/2030 USD 475,000 484,721 0.16 Standard Industries, Inc., Reg. S 2.25%
21/11/2026 EUR 275,000 342,283 0.10
908,762 0.28
chemicalsAir Products and Chemicals, Inc. 2.8%
15/05/2050 USD 725,000 786,766 0.24 Braskem Netherlands Finance BV, 144A
4.5% 31/01/2030 USD 425,000 436,161 0.13 DuPont de Nemours, Inc. 5.319%
15/11/2038 USD 200,000 270,774 0.08 NOVA Chemicals Corp., 144A 4.875%
01/06/2024 USD 375,000 391,172 0.12 Nutrition & Biosciences, Inc., 144A 2.3%
01/11/2030 USD 250,000 257,469 0.08 Sherwin-Williams Co. (The) 2.95%
15/08/2029 USD 25,000 27,536 0.01 Sherwin-Williams Co. (The) 2.3%
15/05/2030 USD 1,200,000 1,254,006 0.38 Sherwin-Williams Co. (The) 3.3%
15/05/2050 USD 450,000 498,145 0.15 Syngenta Finance NV, 144A 4.892%
24/04/2025 USD 675,000 727,187 0.22
4,649,216 1.41
commercial servicesAutomatic Data Processing, Inc. 1.25%
01/09/2030 USD 1,300,000 1,297,430 0.39 DP World plc, 144A 5.625% 25/09/2048 USD 725,000 926,681 0.28 Garda World Security Corp., 144A 4.625%
15/02/2027 USD 225,000 227,813 0.07 Global Payments, Inc. 2.9% 15/05/2030 USD 1,325,000 1,442,565 0.44 PayPal Holdings, Inc. 2.3% 01/06/2030 USD 1,510,000 1,618,059 0.49
schEDUlE of InVEsTmEnTsAs at 31 December 2020
Investments Currency
Quantity/ Nominal
Value
Market Value USD
% of Net Assets
Transferable securities and money market instruments admitted to official exchange listing or dealt in on another regulated market
corporate Bonds (continued)
commercial services (continued)Q-Park Holding I BV, Reg. S 1.5%
01/03/2025 EUR 425,000 504,981 0.15 Transurban Finance Co. Pty. Ltd., 144A
2.45% 16/03/2031 USD 1,400,000 1,470,382 0.45
7,487,911 2.27
computersApple, Inc. 2.95% 11/09/2049 USD 1,775,000 1,972,682 0.60 Dell International LLC, 144A 4.9%
01/10/2026 USD 1,275,000 1,506,209 0.46 International Business Machines Corp.
3.3% 15/05/2026 USD 600,000 678,264 0.21 International Business Machines Corp.
4.15% 15/05/2039 USD 450,000 569,495 0.17 International Business Machines Corp.
2.95% 15/05/2050 USD 650,000 693,190 0.21
5,419,840 1.65
Diversified financial servicesAir Lease Corp. 3.75% 01/06/2026 USD 1,100,000 1,210,491 0.37 American Express Co. 4.2% 06/11/2025 USD 975,000 1,132,544 0.34 Avolon Holdings Funding Ltd., 144A
2.875% 15/02/2025 USD 900,000 919,217 0.28 Brookfield Finance, Inc. 4.25%
02/06/2026 USD 25,000 29,106 0.01 Brookfield Finance, Inc. 4.85%
29/03/2029 USD 850,000 1,041,874 0.32 Brookfield Finance LLC 3.45%
15/04/2050 USD 150,000 159,328 0.05 Charles Schwab Corp. (The) 1.65%
11/03/2031 USD 1,525,000 1,539,081 0.47 Discover Financial Services 3.95%
06/11/2024 USD 600,000 666,816 0.20 GE Capital International Funding Co.
Unlimited Co. 4.418% 15/11/2035 USD 775,000 925,023 0.28 General Electric Co. 5.875% 14/01/2038 USD 350,000 474,911 0.14 High Street Funding Trust I, 144A 4.111%
15/02/2028 USD 1,275,000 1,469,255 0.44 Intercontinental Exchange, Inc. 1.85%
15/09/2032 USD 1,475,000 1,484,151 0.45 LeasePlan Corp. NV, 144A 2.875%
24/10/2024 USD 400,000 423,023 0.13 Pine Street Trust I, 144A 4.572%
15/02/2029 USD 250,000 296,547 0.09 Quicken Loans LLC, 144A 3.875%
01/03/2031 USD 340,000 353,600 0.11 TD Ameritrade Holding Corp. 3.3%
01/04/2027 USD 150,000 168,197 0.05 USAA Capital Corp., 144A 1.5%
01/05/2023 USD 1,400,000 1,436,547 0.44 Visa, Inc. 2.7% 15/04/2040 USD 200,000 218,429 0.07
13,948,140 4.24
ElectricAmeren Illinois Co. 1.55% 15/11/2030 USD 1,150,000 1,157,840 0.35 American Electric Power Co., Inc. 1%
01/11/2025 USD 900,000 911,283 0.28 Baltimore Gas and Electric Co. 2.4%
15/08/2026 USD 150,000 162,427 0.05

259 Morgan Stanley Investment Funds 31 December 2020
The accompanying notes are an integral part of these financial statements.
US Dollar Corporate Bond Fund (continued)
schEDUlE of InVEsTmEnTsAs at 31 December 2020
Investments Currency
Quantity/ Nominal
Value
Market Value USD
% of Net Assets
Transferable securities and money market instruments admitted to official exchange listing or dealt in on another regulated market
corporate Bonds (continued)
Electric (continued)Berkshire Hathaway Energy Co., 144A
2.85% 15/05/2051 USD 850,000 874,931 0.27 Cleveland Electric Illuminating Co. (The),
144A 4.55% 15/11/2030 USD 575,000 663,094 0.20 Consorcio Transmantaro SA, 144A 4.7%
16/04/2034 USD 700,000 828,282 0.25 Consumers Energy Co. 3.5% 01/08/2051 USD 475,000 582,672 0.18 Consumers Energy Co. 2.5% 01/05/2060 USD 475,000 477,395 0.15 DTE Electric Co. 3.95% 01/03/2049 USD 675,000 876,069 0.27 Duke Energy Corp. 2.45% 01/06/2030 USD 1,425,000 1,517,922 0.45 Duke Energy Indiana LLC 3.25%
01/10/2049 USD 550,000 622,686 0.19 Duke Energy Progress LLC 3.45%
15/03/2029 USD 1,000,000 1,154,778 0.35 Entergy Arkansas LLC 3.5% 01/04/2026 USD 700,000 791,428 0.24 Entergy Texas, Inc. 3.55% 30/09/2049 USD 75,000 86,850 0.03 FirstEnergy Corp. 3.4% 01/03/2050 USD 850,000 816,848 0.25 Indiana Michigan Power Co. 4.25%
15/08/2048 USD 175,000 226,351 0.07 Interstate Power and Light Co. 2.3%
01/06/2030 USD 75,000 79,397 0.02 Interstate Power and Light Co. 3.5%
30/09/2049 USD 525,000 607,857 0.18 Mississippi Power Co. 3.95% 30/03/2028 USD 350,000 408,015 0.12 NextEra Energy Capital Holdings, Inc.
2.25% 01/06/2030 USD 2,275,000 2,385,808 0.71 Northern States Power Co. 2.9%
01/03/2050 USD 600,000 677,658 0.21 NRG Energy, Inc., 144A 3.625%
15/02/2031 USD 295,000 304,605 0.09 Oglethorpe Power Corp. 5.05%
01/10/2048 USD 500,000 633,523 0.19 Oncor Electric Delivery Co. LLC 2.95%
01/04/2025 USD 150,000 164,282 0.05 Pacific Gas and Electric Co. 3.3%
01/08/2040 USD 775,000 776,641 0.24 PacifiCorp 2.7% 15/09/2030 USD 1,225,000 1,348,950 0.41 Public Service Co. of Colorado 3.2%
01/03/2050 USD 525,000 608,512 0.18 Southern California Edison Co. 4%
01/04/2047 USD 450,000 528,406 0.16 Southern Co. (The) 4.4% 01/07/2046 USD 1,175,000 1,476,188 0.45 Virginia Electric and Power Co. 2.875%
15/07/2029 USD 1,300,000 1,462,946 0.44 Virginia Electric and Power Co. 2.45%
15/12/2050 USD 400,000 398,888 0.12 Xcel Energy, Inc. 2.6% 01/12/2029 USD 875,000 947,588 0.30
24,560,120 7.45
ElectronicsRoper Technologies, Inc. 1% 15/09/2025 USD 875,000 883,873 0.27
883,873 0.27
EntertainmentResorts World Las Vegas LLC, 144A
4.625% 16/04/2029 USD 800,000 822,887 0.25
822,887 0.25
schEDUlE of InVEsTmEnTsAs at 31 December 2020
Investments Currency
Quantity/ Nominal
Value
Market Value USD
% of Net Assets
Transferable securities and money market instruments admitted to official exchange listing or dealt in on another regulated market
corporate Bonds (continued)
Environmental controlWaste Management, Inc. 1.15%
15/03/2028 USD 825,000 822,482 0.25
822,482 0.25
foodCampbell Soup Co. 3.125% 24/04/2050 USD 750,000 793,066 0.24 Conagra Brands, Inc. 4.6% 01/11/2025 USD 1,675,000 1,974,179 0.60 Conagra Brands, Inc. 1.375%
01/11/2027 USD 725,000 731,618 0.22 General Mills, Inc. 2.875% 15/04/2030 USD 1,325,000 1,469,808 0.45 Hormel Foods Corp. 1.8% 11/06/2030 USD 476,000 492,230 0.15 Mondelez International, Inc. 2.75%
13/04/2030 USD 800,000 877,073 0.27 Sigma Finance Netherlands BV, 144A
4.875% 27/03/2028 USD 725,000 847,714 0.26 Smithfield Foods, Inc., 144A 3%
15/10/2030 USD 850,000 896,295 0.27 Smithfield Foods, Inc., 144A 5.2%
01/04/2029 USD 875,000 1,052,907 0.32 Sysco Corp. 5.95% 01/04/2030 USD 875,000 1,150,490 0.35
10,285,380 3.13
forest Products & PaperGeorgia-Pacific LLC, 144A 2.3%
30/04/2030 USD 1,725,000 1,844,822 0.56 Inversiones CMPC SA, Reg. S 3.85%
13/01/2030 USD 600,000 673,050 0.20
2,517,872 0.76
GasBoston Gas Co., 144A 3.001%
01/08/2029 USD 575,000 635,109 0.19 NiSource, Inc. 2.95% 01/09/2029 USD 350,000 385,437 0.12 NiSource, Inc. 1.7% 15/02/2031 USD 1,175,000 1,170,024 0.35
2,190,570 0.66
healthcare ProductsAbbott Laboratories 1.15% 30/01/2028 USD 1,725,000 1,747,852 0.53 Boston Scientific Corp. 2.65%
01/06/2030 USD 1,725,000 1,851,891 0.56
3,599,743 1.09
healthcare servicesAnthem, Inc. 2.375% 15/01/2025 USD 750,000 802,386 0.24 Anthem, Inc. 2.25% 15/05/2030 USD 325,000 345,580 0.10 HCA, Inc. 4.75% 01/05/2023 USD 650,000 709,108 0.22 HCA, Inc. 5.5% 15/06/2047 USD 625,000 834,313 0.25 UnitedHealth Group, Inc. 2.9%
15/05/2050 USD 1,100,000 1,213,932 0.38
3,905,319 1.19

Morgan Stanley Investment Funds 31 December 2020 260
The accompanying notes are an integral part of these financial statements.
US Dollar Corporate Bond Fund (continued)
schEDUlE of InVEsTmEnTsAs at 31 December 2020
Investments Currency
Quantity/ Nominal
Value
Market Value USD
% of Net Assets
Transferable securities and money market instruments admitted to official exchange listing or dealt in on another regulated market
corporate Bonds (continued)
household ProductsClorox Co. (The) 1.8% 15/05/2030 USD 850,000 878,180 0.27 Kimberly-Clark de Mexico SAB de CV,
144A 2.431% 01/07/2031 USD 425,000 439,371 0.13
1,317,551 0.40
InsuranceAflac, Inc. 3.6% 01/04/2030 USD 775,000 908,908 0.28 Allstate Corp. (The) 1.45% 15/12/2030 USD 2,325,000 2,320,470 0.69 American International Group, Inc. 3.9%
01/04/2026 USD 650,000 741,310 0.23 American International Group, Inc. 3.875%
15/01/2035 USD 475,000 570,459 0.17 Aon Corp. 2.8% 15/05/2030 USD 750,000 818,782 0.25 Arch Capital Group Ltd. 3.635%
30/06/2050 USD 425,000 495,362 0.15 Belrose Funding Trust, 144A 2.33%
15/08/2030 USD 1,200,000 1,236,379 0.38 Berkshire Hathaway Finance Corp. 1.85%
12/03/2030 USD 825,000 869,663 0.26 Brown & Brown, Inc. 2.375% 15/03/2031 USD 1,425,000 1,493,190 0.45 Brown & Brown, Inc. 4.2% 15/09/2024 USD 50,000 55,697 0.02 Chubb INA Holdings, Inc. 1.375%
15/09/2030 USD 1,400,000 1,397,873 0.42 Equitable Financial Life Global Funding,
144A 1.4% 27/08/2027 USD 1,575,000 1,585,060 0.48 Equitable Financial Life Global Funding,
144A 1.75% 15/11/2030 USD 600,000 602,604 0.18 Five Corners Funding Trust II, 144A 2.85%
15/05/2030 USD 1,419,000 1,569,504 0.48 Global Atlantic Fin Co., 144A 4.4%
15/10/2029 USD 2,475,000 2,729,638 0.83 Kemper Corp. 2.4% 30/09/2030 USD 525,000 535,085 0.16 Marsh & McLennan Cos., Inc. 2.25%
15/11/2030 USD 1,450,000 1,534,523 0.47 MetLife, Inc. 5.875% 06/02/2041 USD 100,000 152,493 0.05 Metropolitan Life Global Funding I, 144A
2.95% 09/04/2030 USD 1,475,000 1,661,288 0.50 Progressive Corp. (The) 3.2% 26/03/2030 USD 475,000 547,609 0.17
21,825,897 6.62
InternetAlphabet, Inc. 1.1% 15/08/2030 USD 850,000 838,253 0.25 Amazon.com, Inc. 2.5% 03/06/2050 USD 800,000 829,384 0.25 Amazon.com, Inc. 4.25% 22/08/2057 USD 625,000 889,839 0.27 Baidu, Inc. 1.72% 09/04/2026 USD 1,250,000 1,269,788 0.39 Meituan, 144A 2.125% 28/10/2025 USD 1,295,000 1,318,939 0.40 Prosus NV, 144A 3.68% 21/01/2030 USD 1,050,000 1,144,144 0.35 Tencent Holdings Ltd., 144A 3.595%
19/01/2028 USD 1,375,000 1,517,217 0.46
7,807,564 2.37
Investment companiesMDGH - GMTN BV, 144A 4.5%
07/11/2028 USD 975,000 1,173,071 0.36 Oaktree Specialty Lending Corp. 3.5%
25/02/2025 USD 250,000 259,054 0.08
1,432,125 0.44
schEDUlE of InVEsTmEnTsAs at 31 December 2020
Investments Currency
Quantity/ Nominal
Value
Market Value USD
% of Net Assets
Transferable securities and money market instruments admitted to official exchange listing or dealt in on another regulated market
corporate Bonds (continued)
Iron/steelPOSCO, 144A 4% 01/08/2023 USD 525,000 566,672 0.17
566,672 0.17
lodgingLas Vegas Sands Corp. 3.2% 08/08/2024 USD 750,000 794,740 0.24 Las Vegas Sands Corp. 3.5% 18/08/2026 USD 200,000 214,110 0.07
1,008,850 0.31
machineryJohn Deere Capital Corp. 2.45%
09/01/2030 USD 1,400,000 1,535,894 0.47
1,535,894 0.47
machinery – construction & miningCaterpillar, Inc. 3.25% 19/09/2049 USD 375,000 440,158 0.13
440,158 0.13
mediaCharter Communications Operating LLC
2.8% 01/04/2031 USD 700,000 740,625 0.22 Charter Communications Operating LLC
5.75% 01/04/2048 USD 475,000 621,613 0.19 Charter Communications Operating LLC
5.125% 01/07/2049 USD 175,000 213,527 0.06 Charter Communications Operating LLC
3.85% 01/04/2061 USD 1,000,000 1,012,571 0.31 Comcast Corp. 1.95% 15/01/2031 USD 1,675,000 1,719,739 0.53 Comcast Corp. 4.25% 15/01/2033 USD 600,000 753,171 0.23 Comcast Corp. 3.75% 01/04/2040 USD 425,000 513,805 0.16 Comcast Corp. 2.8% 15/01/2051 USD 575,000 599,434 0.18 Comcast Corp. 2.45% 15/08/2052 USD 1,225,000 1,191,967 0.36 Diamond Sports Group LLC, 144A 6.625%
15/08/2027 USD 25,000 15,094 0.00 Fox Corp. 5.576% 25/01/2049 USD 475,000 693,878 0.21 TWDC Enterprises 18 Corp. 7%
01/03/2032 USD 25,000 37,451 0.01 Walt Disney Co. (The) 2.75% 01/09/2049 USD 1,145,000 1,210,610 0.37 Walt Disney Co. (The) 2.65% 13/01/2031 USD 750,000 822,114 0.25 Walt Disney Co. (The) 3.6% 13/01/2051 USD 412,000 498,349 0.15
10,643,948 3.23
miningGlencore Funding LLC, 144A 4.125%
12/03/2024 USD 800,000 881,055 0.27 Glencore Funding LLC, 144A 2.5%
01/09/2030 USD 875,000 892,616 0.27 Industrias Penoles SAB de CV, 144A
4.75% 06/08/2050 USD 450,000 522,475 0.16 Newcastle Coal Infrastructure Group Pty.
Ltd., 144A 4.4% 29/09/2027 USD 1,575,000 1,615,588 0.48 Newmont Corp. 2.25% 01/10/2030 USD 550,000 579,249 0.18
4,490,983 1.36

261 Morgan Stanley Investment Funds 31 December 2020
The accompanying notes are an integral part of these financial statements.
US Dollar Corporate Bond Fund (continued)
schEDUlE of InVEsTmEnTsAs at 31 December 2020
Investments Currency
Quantity/ Nominal
Value
Market Value USD
% of Net Assets
Transferable securities and money market instruments admitted to official exchange listing or dealt in on another regulated market
corporate Bonds (continued)
miscellaneous manufacturersGeneral Electric Co. 4.125% 09/10/2042 USD 325,000 380,205 0.12
380,205 0.12
oil & GasAker BP ASA, 144A 4.75% 15/06/2024 USD 1,175,000 1,215,875 0.37 BP Capital Markets plc 4.375% Perpetual USD 925,000 990,061 0.30 BP Capital Markets plc 4.875% Perpetual USD 875,000 978,425 0.30 Canadian Natural Resources Ltd. 2.95%
15/01/2023 USD 1,050,000 1,098,487 0.33 Chevron USA, Inc. 2.343% 12/08/2050 USD 475,000 470,409 0.14 Cimarex Energy Co. 4.375% 15/03/2029 USD 875,000 992,533 0.30 Cimarex Energy Co. 3.9% 15/05/2027 USD 650,000 715,043 0.22 Concho Resources, Inc. 4.875%
01/10/2047 USD 450,000 609,115 0.19 Diamondback Energy, Inc. 3.25%
01/12/2026 USD 1,250,000 1,335,912 0.41 Equinor ASA 3.7% 06/04/2050 USD 500,000 603,337 0.18 Exxon Mobil Corp. 3.452% 15/04/2051 USD 375,000 428,316 0.13 Marathon Petroleum Corp. 4.75%
15/12/2023 USD 1,775,000 1,966,747 0.60 Marathon Petroleum Corp. 4.7%
01/05/2025 USD 625,000 716,490 0.22 Occidental Petroleum Corp. 3.5%
15/08/2029 USD 575,000 524,170 0.16 Phillips 66 2.15% 15/12/2030 USD 675,000 684,920 0.21 Saudi Arabian Oil Co., 144A 3.5%
16/04/2029 USD 775,000 861,461 0.26 Saudi Arabian Oil Co., 144A 2.25%
24/11/2030 USD 985,000 1,003,359 0.30 Shell International Finance BV 3.125%
07/11/2049 USD 525,000 579,555 0.18
15,774,215 4.80
Packaging & containersBerry Global, Inc., 144A 1.57%
15/01/2026 USD 625,000 630,500 0.19 Berry Global, Inc., 144A 4.875%
15/07/2026 USD 630,000 677,398 0.21 Silgan Holdings, Inc. 2.25% 01/06/2028 EUR 400,000 499,350 0.15
1,807,248 0.55
PharmaceuticalsAbbVie, Inc. 3.2% 21/11/2029 USD 1,425,000 1,606,658 0.49 AbbVie, Inc. 4.25% 21/11/2049 USD 1,700,000 2,146,071 0.66 AstraZeneca plc 1.375% 06/08/2030 USD 725,000 717,290 0.22 Bristol-Myers Squibb Co. 3.4%
26/07/2029 USD 1,250,000 1,455,055 0.44 Bristol-Myers Squibb Co. 2.55%
13/11/2050 USD 125,000 127,661 0.04 Cigna Corp. 3.05% 15/10/2027 USD 775,000 869,332 0.26 Cigna Corp. 2.4% 15/03/2030 USD 700,000 746,256 0.23 CVS Health Corp. 3.75% 01/04/2030 USD 1,143,000 1,330,538 0.40 CVS Health Corp. 1.75% 21/08/2030 USD 875,000 880,097 0.27 CVS Health Corp. 5.05% 25/03/2048 USD 150,000 203,161 0.06 Grifols SA, Reg. S 2.25% 15/11/2027 EUR 400,000 498,800 0.15 Viatris, Inc., 144A 1.65% 22/06/2025 USD 700,000 724,574 0.22 Viatris, Inc., 144A 4% 22/06/2050 USD 675,000 772,893 0.23
12,078,386 3.67
schEDUlE of InVEsTmEnTsAs at 31 December 2020
Investments Currency
Quantity/ Nominal
Value
Market Value USD
% of Net Assets
Transferable securities and money market instruments admitted to official exchange listing or dealt in on another regulated market
corporate Bonds (continued)
PipelinesAPT Pipelines Ltd., 144A 4.2%
23/03/2025 USD 325,000 358,819 0.11 APT Pipelines Ltd., 144A 4.25%
15/07/2027 USD 175,000 198,754 0.06 Enbridge, Inc. 4.5% 10/06/2044 USD 272,000 317,813 0.10 Enbridge, Inc. 3.125% 15/11/2029 USD 50,000 55,033 0.02 Enterprise Products Operating LLC 4.2%
31/01/2050 USD 1,150,000 1,359,925 0.42 Enterprise Products Operating LLC 3.95%
31/01/2060 USD 250,000 277,495 0.08 Galaxy Pipeline Assets Bidco Ltd., 144A
1.75% 30/09/2027 USD 1,300,000 1,322,706 0.40 Kinder Morgan, Inc. 5.2% 01/03/2048 USD 475,000 603,827 0.18 Kinder Morgan, Inc. 5.55% 01/06/2045 USD 25,000 32,113 0.01 MPLX LP 5.2% 01/12/2047 USD 175,000 211,815 0.06 ONEOK, Inc. 3.1% 15/03/2030 USD 1,775,000 1,876,004 0.58 Rockies Express Pipeline LLC, 144A 3.6%
15/05/2025 USD 275,000 283,998 0.09 Sabine Pass Liquefaction LLC, 144A 4.5%
15/05/2030 USD 2,000,000 2,371,149 0.72 Sunoco Logistics Partners Operations LP
3.9% 15/07/2026 USD 175,000 192,691 0.06 Sunoco Logistics Partners Operations LP
4% 01/10/2027 USD 1,150,000 1,267,106 0.38 Transcontinental Gas Pipe Line Co. LLC
3.25% 15/05/2030 USD 1,350,000 1,512,316 0.46 Transportadora de Gas Internacional SA
ESP, 144A 5.55% 01/11/2028 USD 600,000 709,506 0.22 Western Midstream Operating LP 4.1%
01/02/2025 USD 650,000 670,534 0.20 Williams Cos., Inc. (The) 5.1% 15/09/2045 USD 325,000 405,559 0.12 Williams Cos., Inc. (The) 4.85%
01/03/2048 USD 325,000 399,224 0.12
14,426,387 4.39
Real Estate Investment Trusts (REITs)Alexandria Real Estate Equities, Inc.
1.875% 01/02/2033 USD 775,000 774,872 0.24 Crown Castle International Corp., REIT
4.15% 01/07/2050 USD 200,000 243,364 0.07 Digital Realty Trust LP 4.45% 15/07/2028 USD 650,000 781,870 0.24 Digital Realty Trust LP 3.6% 01/07/2029 USD 675,000 773,789 0.24 Duke Realty LP 1.75% 01/07/2030 USD 1,450,000 1,467,810 0.45 Equinix, Inc. 1.55% 15/03/2028 USD 1,050,000 1,067,944 0.32 Federal Realty Investment Trust, REIT
3.625% 01/08/2046 USD 250,000 262,915 0.08 GLP Capital LP, REIT 4% 15/01/2030 USD 450,000 488,765 0.15 Kilroy Realty LP 2.5% 15/11/2032 USD 300,000 304,562 0.09 Kilroy Realty LP, REIT 3.05% 15/02/2030 USD 225,000 239,360 0.07 Kimco Realty Corp., REIT 3.7%
01/10/2049 USD 325,000 348,144 0.11 Prologis LP 1.25% 15/10/2030 USD 1,475,000 1,461,040 0.44 Realty Income Corp. 0.75% 15/03/2026 USD 1,032,000 1,030,621 0.31
9,245,056 2.81

Morgan Stanley Investment Funds 31 December 2020 262
The accompanying notes are an integral part of these financial statements.
US Dollar Corporate Bond Fund (continued)
schEDUlE of InVEsTmEnTsAs at 31 December 2020
Investments Currency
Quantity/ Nominal
Value
Market Value USD
% of Net Assets
Transferable securities and money market instruments admitted to official exchange listing or dealt in on another regulated market
corporate Bonds (continued)
RetailCVS Health Corp. 5.125% 20/07/2045 USD 25,000 33,639 0.01 Dollar General Corp. 4.125% 03/04/2050 USD 525,000 665,162 0.20 Home Depot, Inc. (The) 2.5% 15/04/2027 USD 600,000 658,933 0.20 Home Depot, Inc. (The) 2.7% 15/04/2030 USD 538,000 600,388 0.18 Home Depot, Inc. (The) 3.35%
15/04/2050 USD 525,000 624,315 0.19 Lowe’s Cos., Inc. 2.5% 15/04/2026 USD 800,000 868,509 0.26 Lowe’s Cos., Inc. 1.7% 15/10/2030 USD 325,000 328,593 0.10 Lowe’s Cos., Inc. 3% 15/10/2050 USD 775,000 825,574 0.25 McDonald’s Corp. 3.3% 01/07/2025 USD 1,400,000 1,560,192 0.48 Ross Stores, Inc. 0.875% 15/04/2026 USD 500,000 500,273 0.15 Walmart, Inc. 2.95% 24/09/2049 USD 375,000 432,034 0.13
7,097,612 2.15
savings & loansNationwide Building Society, FRN, 144A
4.302% 08/03/2029 USD 1,000,000 1,166,191 0.35
1,166,191 0.35
semiconductorsBroadcom, Inc. 4.15% 15/11/2030 USD 1,150,000 1,332,861 0.40 Intel Corp. 3.25% 15/11/2049 USD 500,000 559,284 0.17 NVIDIA Corp. 3.5% 01/04/2050 USD 600,000 728,799 0.22 NXP BV, 144A 3.4% 01/05/2030 USD 1,275,000 1,447,395 0.45 TSMC Global Ltd., 144A 0.75%
28/09/2025 USD 1,600,000 1,594,184 0.48
5,662,523 1.72
softwareActivision Blizzard, Inc. 2.5% 15/09/2050 USD 325,000 317,579 0.10 Adobe, Inc. 2.3% 01/02/2030 USD 800,000 866,138 0.26 Fiserv, Inc. 2.65% 01/06/2030 USD 375,000 405,831 0.12 Microsoft Corp. 2.4% 08/08/2026 USD 850,000 927,505 0.28 Microsoft Corp. 2.525% 01/06/2050 USD 1,100,000 1,159,559 0.36 Microsoft Corp. 4.45% 03/11/2045 USD 450,000 638,215 0.19 Oracle Corp. 2.5% 01/04/2025 USD 250,000 268,305 0.08 Oracle Corp. 4% 15/07/2046 USD 100,000 122,680 0.04 Oracle Corp. 3.6% 01/04/2050 USD 600,000 702,209 0.22 Oracle Corp. 3.85% 01/04/2060 USD 550,000 673,929 0.20
6,081,950 1.85
TelecommunicationsAT&T, Inc., 144A 3.55% 15/09/2055 USD 1,754,000 1,751,396 0.52 AT&T, Inc., 144A 3.65% 15/09/2059 USD 300,000 302,851 0.09 AT&T, Inc. 2.25% 01/02/2032 USD 2,500,000 2,538,480 0.77 Juniper Networks, Inc. 1.2% 10/12/2025 USD 650,000 658,055 0.20 Level 3 Financing, Inc., 144A 3.4%
01/03/2027 USD 650,000 709,108 0.22 Sprint Spectrum Co. LLC, 144A 4.738%
20/09/2029 USD 200,000 217,243 0.07 Sprint Spectrum Co. LLC, 144A 5.152%
20/09/2029 USD 500,000 580,000 0.18 T-Mobile USA, Inc., 144A 2.25%
15/11/2031 USD 1,150,000 1,182,447 0.36 T-Mobile USA, Inc., 144A 3.6%
15/11/2060 USD 950,000 1,006,682 0.31
schEDUlE of InVEsTmEnTsAs at 31 December 2020
Investments Currency
Quantity/ Nominal
Value
Market Value USD
% of Net Assets
Transferable securities and money market instruments admitted to official exchange listing or dealt in on another regulated market
corporate Bonds (continued)
Telecommunications (continued)Verizon Communications, Inc., 144A
2.987% 30/10/2056 USD 1,507,000 1,516,023 0.46 Verizon Communications, Inc. 1.5%
18/09/2030 USD 2,650,000 2,611,675 0.80 Verizon Communications, Inc. 2.65%
20/11/2040 USD 725,000 732,240 0.22
13,806,200 4.20
TransportationBurlington Northern Santa Fe LLC 4.55%
01/09/2044 USD 1,075,000 1,453,453 0.43 Canadian National Railway Co. 2.45%
01/05/2050 USD 750,000 776,395 0.24 Union Pacific Corp. 3.25% 05/02/2050 USD 800,000 911,432 0.28 Union Pacific Corp. 3.839% 20/03/2060 USD 50,000 61,975 0.02
3,203,255 0.97
Trucking and leasingAviation Capital Group LLC, 144A 4.375%
30/01/2024 USD 225,000 237,616 0.07
237,616 0.07
Total corporate Bonds 312,379,541 94.88
mortgage and asset Backed securities
airlinesAlaska Airlines Pass-Through Trust ‘A’,
144A 4.8% 15/02/2029 USD 400,000 441,388 0.13 Delta Air Lines Pass-Through Trust ‘AA’
3.204% 25/10/2025 USD 50,000 51,197 0.02 JetBlue Pass-Through Trust ‘AA’ 2.75%
15/11/2033 USD 674,395 677,754 0.21
1,170,339 0.36
Real Estate Investment Trusts (REITs)Cubesmart LP ‘J’, 144A 2% 15/02/2031 USD 775,000 777,670 0.24
777,670 0.24
Total mortgage and asset Backed securities 1,948,009 0.60
Total Transferable securities and money market instruments admitted to official exchange listing or dealt in on another regulated market 318,057,494 96.61
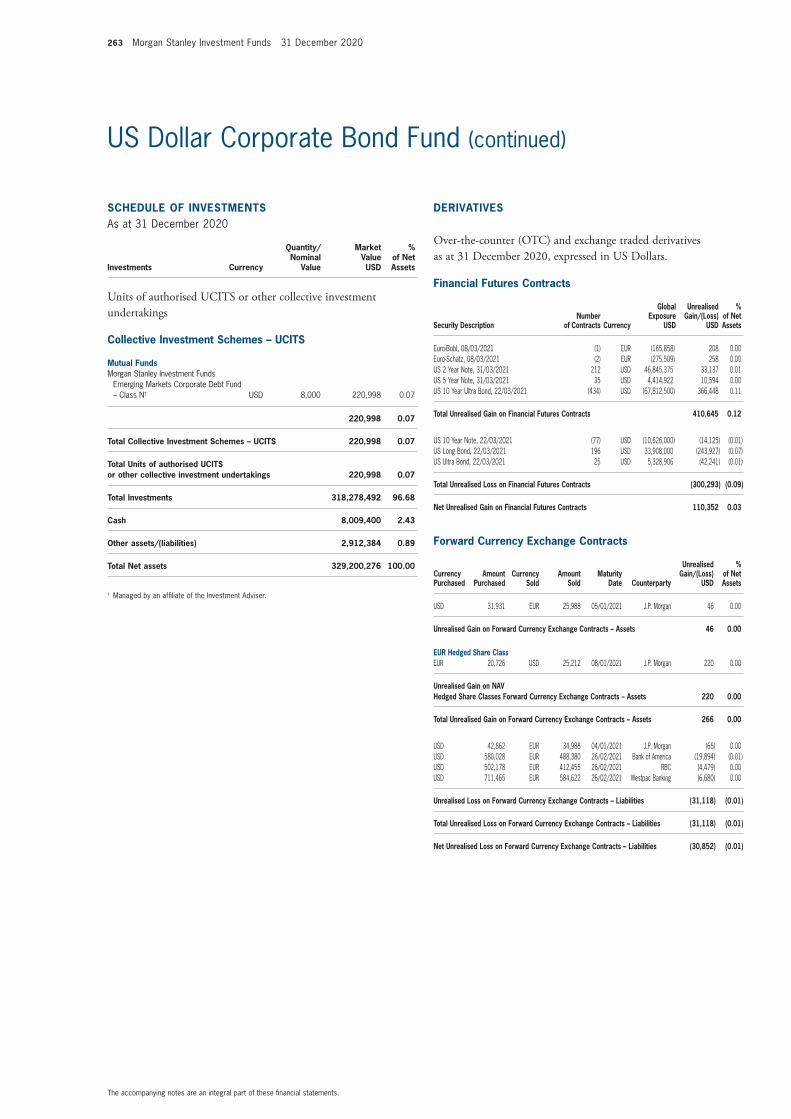
263 Morgan Stanley Investment Funds 31 December 2020
The accompanying notes are an integral part of these financial statements.
US Dollar Corporate Bond Fund (continued)
financial futures contracts
security Descriptionnumber
of contracts currency
Global Exposure
UsD
Unrealised Gain/(loss)
UsD
% of net assets
Euro-Bobl, 08/03/2021 (1) EUR (165,858) 208 0.00Euro-Schatz, 08/03/2021 (2) EUR (275,509) 258 0.00US 2 Year Note, 31/03/2021 212 USD 46,845,375 33,137 0.01 US 5 Year Note, 31/03/2021 35 USD 4,414,922 10,594 0.00US 10 Year Ultra Bond, 22/03/2021 (434) USD (67,812,500) 366,448 0.11
Total Unrealised Gain on financial futures contracts 410,645 0.12
US 10 Year Note, 22/03/2021 (77) USD (10,626,000) (14,125) (0.01) US Long Bond, 22/03/2021 196 USD 33,908,000 (243,927) (0.07) US Ultra Bond, 22/03/2021 25 USD 5,328,906 (42,241) (0.01)
Total Unrealised loss on financial futures contracts (300,293) (0.09)
net Unrealised Gain on financial futures contracts 110,352 0.03
forward currency Exchange contracts
currency Purchased
amount Purchased
currency sold
amount sold
maturity Date counterparty
Unrealised Gain/(loss)
UsD
% of net assets
USD 31,931 EUR 25,988 05/01/2021 J.P. Morgan 46 0.00
Unrealised Gain on forward currency Exchange contracts – assets 46 0.00
EUR hedged share classEUR 20,726 USD 25,212 08/01/2021 J.P. Morgan 220 0.00
Unrealised Gain on naV hedged share classes forward currency Exchange contracts – assets 220 0.00
Total Unrealised Gain on forward currency Exchange contracts – assets 266 0.00
USD 42,862 EUR 34,988 04/01/2021 J.P. Morgan (65) 0.00USD 580,028 EUR 488,380 26/02/2021 Bank of America (19,894) (0.01) USD 502,178 EUR 412,455 26/02/2021 RBC (4,479) 0.00USD 711,465 EUR 584,622 26/02/2021 Westpac Banking (6,680) 0.00
Unrealised loss on forward currency Exchange contracts – liabilities (31,118) (0.01)
Total Unrealised loss on forward currency Exchange contracts – liabilities (31,118) (0.01)
net Unrealised loss on forward currency Exchange contracts – liabilities (30,852) (0.01)
schEDUlE of InVEsTmEnTsAs at 31 December 2020
Investments Currency
Quantity/ Nominal
Value
Market Value USD
% of Net Assets
Units of authorised UCITS or other collective investment undertakings
collective Investment schemes – UcITs
mutual fundsMorgan Stanley Investment Funds
Emerging Markets Corporate Debt Fund – Class N† USD 8,000 220,998 0.07
220,998 0.07
Total collective Investment schemes – UcITs 220,998 0.07
Total Units of authorised UcITs or other collective investment undertakings 220,998 0.07
Total Investments 318,278,492 96.68
cash 8,009,400 2.43
other assets/(liabilities) 2,912,384 0.89
Total net assets 329,200,276 100.00
† Managed by an affiliate of the Investment Adviser.
DERIVaTIVEs
Over-the-counter (OTC) and exchange traded derivatives as at 31 December 2020, expressed in US Dollars.
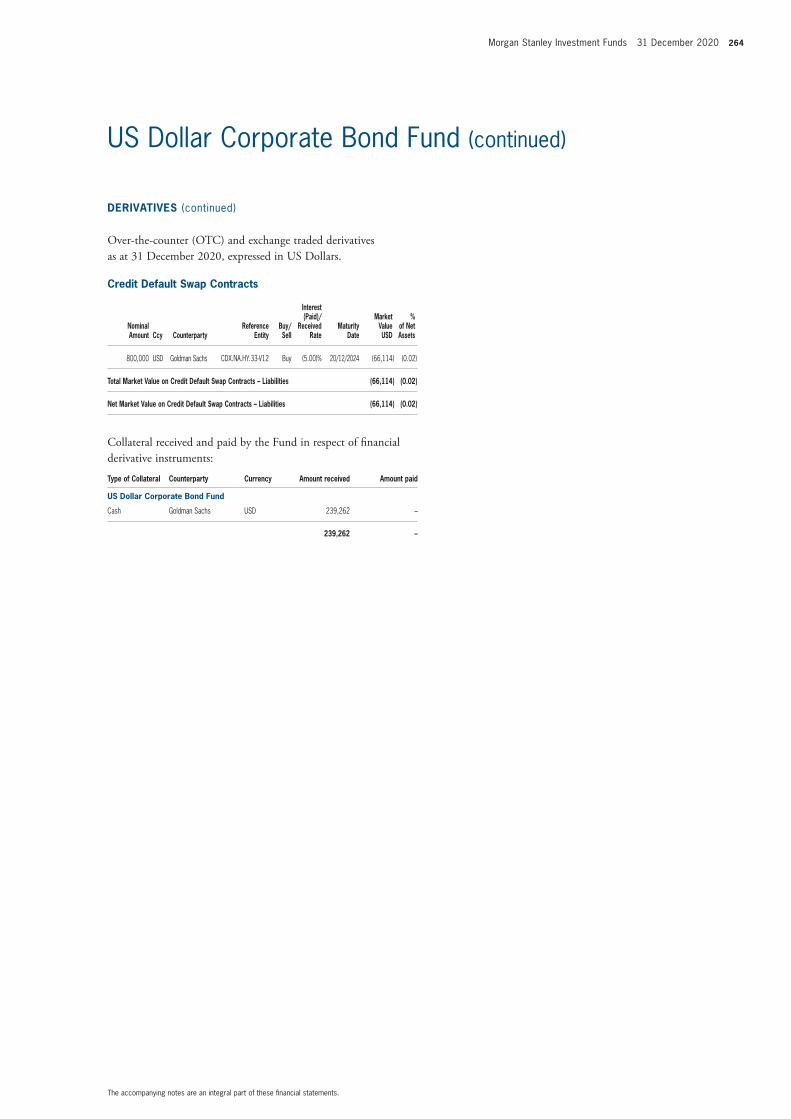
Morgan Stanley Investment Funds 31 December 2020 264
The accompanying notes are an integral part of these financial statements.
US Dollar Corporate Bond Fund (continued)
DERIVaTIVEs (continued)
Over-the-counter (OTC) and exchange traded derivatives as at 31 December 2020, expressed in US Dollars.
credit Default swap contracts
nominal amount ccy counterparty
Reference Entity
Buy/ sell
Interest (Paid)/
Received Rate
maturity Date
market Value UsD
% of net assets
800,000 USD Goldman Sachs CDX.NA.HY. 33-V12 Buy (5.00)% 20/12/2024 (66,114) (0.02)
Total market Value on credit Default swap contracts – liabilities (66,114) (0.02)
net market Value on credit Default swap contracts – liabilities (66,114) (0.02)
Collateral received and paid by the Fund in respect of financial derivative instruments:
Type of collateral counterparty currency amount received amount paid
Us Dollar corporate Bond fund
Cash Goldman Sachs USD 239,262 –
239,262 –

265 Morgan Stanley Investment Funds 31 December 2020
The accompanying notes are an integral part of these financial statements.
Please refer to the full prospectus for the Fund’s investment objective and policy.
InVEsTmEnT aIm
To provide an attractive rate of total return, measured in US Dollars, primarily through investment in high yield and unrated US Dollar denominated Fixed Income Securities, including without limitation those issued by governments, agencies and corporations located in emerging markets and subject to applicable law, including asset-backed securities and loan participations and loan assignments, to the extent that these instruments are securitised.
schEDUlE of InVEsTmEnTsAs at 31 December 2020
Investments Currency
Quantity/ Nominal
Value
Market Value USD
% of Net Assets
Transferable securities and money market instruments admitted to official exchange listing or dealt in on another regulated market
corporate Bonds
advertisingLamar Media Corp. 4% 15/02/2030 USD 350,000 363,781 0.08 Lamar Media Corp. 5.75% 01/02/2026 USD 553,000 571,263 0.12 MDC Partners, Inc., 144A 6.5%
01/05/2024 USD 2,220,000 2,253,877 0.48 Outfront Media Capital LLC, 144A 4.625%
15/03/2030 USD 2,000,000 2,032,500 0.44
5,221,421 1.12
aerospace & DefenseKratos Defense & Security Solutions, Inc.,
144A 6.5% 30/11/2025 USD 2,000,000 2,104,790 0.45 Moog, Inc., 144A 4.25% 15/12/2027 USD 1,000,000 1,038,750 0.22 TransDigm, Inc. 5.5% 15/11/2027 USD 1,900,000 2,002,600 0.43 Triumph Group, Inc., 144A 8.875%
01/06/2024 USD 700,000 769,563 0.17 Triumph Group, Inc., 144A 6.25%
15/09/2024 USD 1,500,000 1,490,625 0.32
7,406,328 1.59
airlinesDelta Air Lines, Inc., 144A 4.75%
20/10/2028 USD 2,000,000 2,184,515 0.47 Mileage Plus Holdings LLC, 144A 6.5%
20/06/2027 USD 1,700,000 1,830,688 0.39 Spirit Loyalty Cayman Ltd., 144A 8%
20/09/2025 USD 1,225,000 1,387,287 0.30
5,402,490 1.16
apparelHanesbrands, Inc., 144A 4.875%
15/05/2026 USD 500,000 543,750 0.12 Wolverine World Wide, Inc., 144A 5%
01/09/2026 USD 1,250,000 1,278,906 0.27
1,822,656 0.39
auto manufacturersFord Motor Co. 8.5% 21/04/2023 USD 1,625,000 1,831,546 0.39 Ford Motor Co. 9% 22/04/2025 USD 1,875,000 2,303,446 0.50 Ford Motor Credit Co. LLC 4.125%
17/08/2027 USD 450,000 471,938 0.10 JB Poindexter & Co., Inc., 144A 7.125%
15/04/2026 USD 2,000,000 2,120,000 0.46 Mclaren Finance plc, 144A 5.75%
01/08/2022 USD 1,300,000 1,267,500 0.27
7,994,430 1.72
auto Parts & EquipmentAdient US LLC, 144A 9% 15/04/2025 USD 675,000 753,469 0.16 American Axle & Manufacturing, Inc.
6.875% 01/07/2028 USD 1,400,000 1,500,562 0.32 Clarios Global LP, 144A 8.5% 15/05/2027 USD 1,000,000 1,088,059 0.23 Dana, Inc. 5.375% 15/11/2027 USD 1,250,000 1,327,344 0.29 Dealer Tire LLC, 144A 8% 01/02/2028 USD 1,350,000 1,431,257 0.31 Meritor, Inc., 144A 6.25% 01/06/2025 USD 500,000 540,060 0.12 Meritor, Inc., 144A 4.5% 15/12/2028 USD 285,000 292,659 0.06 Meritor, Inc. 6.25% 15/02/2024 USD 363,000 371,356 0.08 Tenneco, Inc., 144A 7.875% 15/01/2029 USD 800,000 899,708 0.19
US Dollar High Yield Bond Fund

Morgan Stanley Investment Funds 31 December 2020 266
The accompanying notes are an integral part of these financial statements.
US Dollar High Yield Bond Fund (continued)
schEDUlE of InVEsTmEnTsAs at 31 December 2020
Investments Currency
Quantity/ Nominal
Value
Market Value USD
% of Net Assets
Transferable securities and money market instruments admitted to official exchange listing or dealt in on another regulated market
corporate Bonds (continued)
auto Parts & Equipment (continued)Titan International, Inc. 6.5% 30/11/2023 USD 2,000,000 1,857,290 0.40 Truck Hero, Inc., 144A 8.5% 21/04/2024 USD 2,400,000 2,555,748 0.56
12,617,512 2.72
BanksFreedom Mortgage Corp., 144A 7.625%
01/05/2026 USD 750,000 784,688 0.17 Freedom Mortgage Corp., 144A 8.25%
15/04/2025 USD 1,000,000 1,047,500 0.22
1,832,188 0.39
BiotechnologyEmergent BioSolutions, Inc., 144A 3.875%
15/08/2028 USD 675,000 694,828 0.15
694,828 0.15
Building materialsAmerican Woodmark Corp., 144A 4.875%
15/03/2026 USD 1,850,000 1,902,836 0.41 Builders FirstSource, Inc., 144A 6.75%
01/06/2027 USD 750,000 814,470 0.18 Builders FirstSource, Inc., 144A 5%
01/03/2030 USD 575,000 623,513 0.13 CP Atlas Buyer, Inc., 144A 7%
01/12/2028 USD 1,775,000 1,849,328 0.40 Griffon Corp. 5.75% 01/03/2028 USD 2,000,000 2,117,500 0.46 PGT Innovations, Inc., 144A 6.75%
01/08/2026 USD 2,230,000 2,380,101 0.50 SRM Escrow Issuer LLC, 144A 6%
01/11/2028 USD 1,275,000 1,334,963 0.29 Standard Industries, Inc., 144A 5%
15/02/2027 USD 575,000 601,953 0.13 Summit Materials LLC, 144A 5.25%
15/01/2029 USD 1,050,000 1,103,813 0.24 US Concrete, Inc., 144A 5.125%
01/03/2029 USD 625,000 641,797 0.14
13,370,274 2.88
chemicalsAvient Corp., 144A 5.75% 15/05/2025 USD 750,000 797,813 0.17 Axalta Coating Systems LLC, 144A 4.75%
15/06/2027 USD 500,000 532,500 0.11 Chemours Co. (The), 144A 5.75%
15/11/2028 USD 1,750,000 1,788,281 0.38 HB Fuller Co. 4.25% 15/10/2028 USD 725,000 744,484 0.16 Innophos Holdings, Inc., 144A 9.375%
15/02/2028 USD 2,500,000 2,745,312 0.60 Kraton Polymers LLC, 144A 4.25%
15/12/2025 USD 700,000 716,625 0.15 Minerals Technologies, Inc., 144A 5%
01/07/2028 USD 1,150,000 1,198,875 0.26 Olin Corp., 144A 9.5% 01/06/2025 USD 925,000 1,156,990 0.25 PQ Corp., 144A 5.75% 15/12/2025 USD 1,500,000 1,542,188 0.33
11,223,068 2.41
schEDUlE of InVEsTmEnTsAs at 31 December 2020
Investments Currency
Quantity/ Nominal
Value
Market Value USD
% of Net Assets
Transferable securities and money market instruments admitted to official exchange listing or dealt in on another regulated market
corporate Bonds (continued)
collateralized mortgage obligationFAGE International SA, 144A 5.625%
15/08/2026 USD 1,000,000 1,028,560 0.22
1,028,560 0.22
commercial servicesAhern Rentals, Inc., 144A 7.375%
15/05/2023 USD 1,750,000 1,282,969 0.28 AMN Healthcare, Inc., 144A 4%
15/04/2029 USD 425,000 435,625 0.09 Garda World Security Corp., 144A 9.5%
01/11/2027 USD 2,600,000 2,883,894 0.62 Great Lakes Dredge & Dock Corp. 8%
15/05/2022 USD 1,000,000 1,029,095 0.22 Jaguar Holding Co. II, 144A 5%
15/06/2028 USD 900,000 961,875 0.21 Michael Baker International LLC, 144A
8.75% 01/03/2023 USD 1,500,000 1,515,000 0.33 Nielsen Finance LLC, 144A 5.625%
01/10/2028 USD 1,450,000 1,578,216 0.34 Service Corp. International 5.125%
01/06/2029 USD 1,000,000 1,109,190 0.24 Sotheby’s, 144A 7.375% 15/10/2027 USD 1,750,000 1,877,645 0.40 Tms International Holding Corp., 144A
7.25% 15/08/2025 USD 2,200,000 2,244,000 0.48
14,917,509 3.21
computersDiebold Nixdorf, Inc., 144A 9.375%
15/07/2025 USD 800,000 897,500 0.19 Diebold Nixdorf, Inc. 8.5% 15/04/2024 USD 800,000 811,000 0.17 MTS Systems Corp., 144A 5.75%
15/08/2027 USD 1,735,000 1,888,244 0.41 Unisys Corp., 144A 6.875% 01/11/2027 USD 875,000 958,125 0.21
4,554,869 0.98
cosmetic/Personal careEdgewell Personal Care Co., 144A 5.5%
01/06/2028 USD 1,125,000 1,210,933 0.26
1,210,933 0.26
Distribution/WholesaleAmerican Builders & Contractors Supply
Co., Inc., 144A 5.875% 15/05/2026 USD 1,000,000 1,038,125 0.22 Beacon Roofing Supply, Inc., 144A 4.875%
01/11/2025 USD 1,250,000 1,283,519 0.28 Core & Main Holdings LP, 144A 8.625%
15/09/2024 USD 750,000 769,140 0.17 G-III Apparel Group Ltd., 144A 7.875%
15/08/2025 USD 900,000 984,375 0.21 Performance Food Group, Inc., 144A
6.875% 01/05/2025 USD 500,000 538,963 0.12 Performance Food Group, Inc., 144A 5.5%
15/10/2027 USD 1,720,000 1,815,597 0.38
6,429,719 1.38

267 Morgan Stanley Investment Funds 31 December 2020
The accompanying notes are an integral part of these financial statements.
US Dollar High Yield Bond Fund (continued)
schEDUlE of InVEsTmEnTsAs at 31 December 2020
Investments Currency
Quantity/ Nominal
Value
Market Value USD
% of Net Assets
Transferable securities and money market instruments admitted to official exchange listing or dealt in on another regulated market
corporate Bonds (continued)
Diversified financial servicesFly Leasing Ltd. 5.25% 15/10/2024 USD 1,875,000 1,789,453 0.38 Genworth Mortgage Holdings, Inc., 144A
6.5% 15/08/2025 USD 550,000 596,406 0.13 LD Holdings Group LLC, 144A 6.5%
01/11/2025 USD 825,000 870,375 0.19 Lions Gate Capital Holdings LLC, 144A
6.375% 01/02/2024 USD 930,000 949,172 0.20 Lions Gate Capital Holdings LLC, 144A
5.875% 01/11/2024 USD 1,135,000 1,156,162 0.25 Oxford Finance LLC, 144A 6.375%
15/12/2022 USD 2,000,000 2,002,031 0.42 PennyMac Financial Services, Inc., 144A
5.375% 15/10/2025 USD 1,000,000 1,058,750 0.23 StoneX Group, Inc., 144A 8.625%
15/06/2025 USD 1,398,000 1,522,946 0.33
9,945,295 2.13
ElectricPG&E Corp. 5.25% 01/07/2030 USD 1,500,000 1,651,875 0.36
1,651,875 0.36
Electrical components & EquipmentEnerSys, 144A 4.375% 15/12/2027 USD 1,000,000 1,060,000 0.23 WESCO Distribution, Inc., 144A 7.125%
15/06/2025 USD 300,000 330,023 0.07
1,390,023 0.30
ElectronicsIngram Micro, Inc. 5.45% 15/12/2024 USD 1,500,000 1,726,744 0.37 TTM Technologies, Inc., 144A 5.625%
01/10/2025 USD 2,375,000 2,440,063 0.53
4,166,807 0.90
Engineering & constructionBrand Industrial Services, Inc., 144A 8.5%
15/07/2025 USD 2,500,000 2,559,374 0.55 Cornerstone Building Brands, Inc., 144A
8% 15/04/2026 USD 2,000,000 2,107,500 0.45 KBR, Inc., 144A 4.75% 30/09/2028 USD 780,000 814,125 0.18 New Enterprise Stone & Lime Co., Inc.,
144A 9.75% 15/07/2028 USD 1,000,000 1,100,000 0.24 New Enterprise Stone & Lime Co., Inc.,
144A 6.25% 15/03/2026 USD 1,500,000 1,540,313 0.33 TopBuild Corp., 144A 5.625%
01/05/2026 USD 500,000 519,688 0.11 Tutor Perini Corp., 144A 6.875%
01/05/2025 USD 1,600,000 1,570,000 0.34
10,211,000 2.20
EntertainmentBanijay Entertainment SASU, 144A 5.375%
01/03/2025 USD 1,575,000 1,637,402 0.35 Boyne USA, Inc., 144A 7.25%
01/05/2025 USD 1,737,000 1,824,936 0.39 CCM Merger, Inc., 144A 6.375%
01/05/2026 USD 1,150,000 1,210,375 0.26
schEDUlE of InVEsTmEnTsAs at 31 December 2020
Investments Currency
Quantity/ Nominal
Value
Market Value USD
% of Net Assets
Transferable securities and money market instruments admitted to official exchange listing or dealt in on another regulated market
corporate Bonds (continued)
Entertainment (continued)Downstream Development Authority of the
Quapaw Tribe of Oklahoma, 144A 10.5% 15/02/2023 USD 2,250,000 2,291,950 0.50
International Game Technology plc, 144A 5.25% 15/01/2029 USD 875,000 948,321 0.20
National CineMedia LLC 5.75% 15/08/2026 USD 1,500,000 1,077,840 0.23
Powdr Corp., 144A 6% 01/08/2025 USD 1,575,000 1,655,719 0.36 Scientific Games International, Inc., 144A
8.25% 15/03/2026 USD 1,750,000 1,882,641 0.40 Scientific Games International, Inc., 144A
7% 15/05/2028 USD 425,000 457,683 0.10 Speedway Motorsports LLC, 144A 4.875%
01/11/2027 USD 1,250,000 1,234,375 0.27 Vail Resorts, Inc., 144A 6.25%
15/05/2025 USD 1,250,000 1,341,350 0.29
15,562,592 3.35
Environmental controlCore & Main LP, 144A 6.125%
15/08/2025 USD 1,950,000 2,019,469 0.43 Waste Pro USA, Inc., 144A 5.5%
15/02/2026 USD 1,250,000 1,281,756 0.28
3,301,225 0.71
foodAlbertsons Cos., Inc., 144A 5.875%
15/02/2028 USD 250,000 272,470 0.06 Chobani LLC, 144A 4.625% 15/11/2028 USD 250,000 254,375 0.05 Chobani LLC, 144A 7.5% 15/04/2025 USD 2,000,000 2,103,430 0.45 H-Food Holdings LLC, 144A 8.5%
01/06/2026 USD 2,450,000 2,545,610 0.55 Lamb Weston Holdings, Inc., 144A 4.875%
15/05/2028 USD 500,000 561,563 0.12 Lamb Weston Holdings, Inc., 144A 4.875%
01/11/2026 USD 250,000 260,469 0.06 Post Holdings, Inc., 144A 5.5%
15/12/2029 USD 750,000 818,456 0.18 Simmons Foods, Inc., 144A 5.75%
01/11/2024 USD 2,225,000 2,275,063 0.49 TreeHouse Foods, Inc. 4% 01/09/2028 USD 525,000 541,734 0.12 US Foods, Inc., 144A 5.875%
15/06/2024 USD 500,000 507,813 0.11 US Foods, Inc., 144A 6.25% 15/04/2025 USD 1,000,000 1,070,085 0.23
11,211,068 2.42
food serviceAramark Services, Inc., 144A 6.375%
01/05/2025 USD 750,000 806,303 0.17 Aramark Services, Inc. 4.75%
01/06/2026 USD 500,000 515,475 0.11
1,321,778 0.28
forest Products & PaperSchweitzer-Mauduit International, Inc.,
144A 6.875% 01/10/2026 USD 2,100,000 2,233,476 0.48
2,233,476 0.48

Morgan Stanley Investment Funds 31 December 2020 268
The accompanying notes are an integral part of these financial statements.
US Dollar High Yield Bond Fund (continued)
schEDUlE of InVEsTmEnTsAs at 31 December 2020
Investments Currency
Quantity/ Nominal
Value
Market Value USD
% of Net Assets
Transferable securities and money market instruments admitted to official exchange listing or dealt in on another regulated market
corporate Bonds (continued)
GasLBC Tank Terminals Holding Netherlands
BV, 144A 6.875% 15/05/2023 USD 2,250,000 2,257,031 0.49
2,257,031 0.49
hand/machine ToolsApex Tool Group LLC, 144A 9%
15/02/2023 USD 1,900,000 1,866,750 0.40
1,866,750 0.40
healthcare ProductsTeleflex, Inc. 4.875% 01/06/2026 USD 350,000 365,698 0.08
365,698 0.08
healthcare servicesAcadia Healthcare Co., Inc., 144A 5.5%
01/07/2028 USD 1,875,000 2,014,452 0.43 Akumin, Inc., 144A 7% 01/11/2025 USD 1,350,000 1,422,563 0.31 Catalent Pharma Solutions, Inc., 144A 5%
15/07/2027 USD 750,000 793,373 0.17 Encompass Health Corp. 4.625%
01/04/2031 USD 325,000 345,719 0.07 Hadrian Merger Sub, Inc., 144A 8.5%
01/05/2026 USD 1,000,000 1,036,060 0.22 Providence Service Corp. (The), 144A
5.875% 15/11/2025 USD 850,000 900,469 0.19 RP Escrow Issuer LLC, 144A 5.25%
15/12/2025 USD 1,150,000 1,203,257 0.26 Select Medical Corp., 144A 6.25%
15/08/2026 USD 500,000 537,520 0.12 Surgery Center Holdings, Inc., 144A 10%
15/04/2027 USD 450,000 498,094 0.11 Surgery Center Holdings, Inc., 144A 6.75%
01/07/2025 USD 1,875,000 1,913,671 0.41 Tenet Healthcare Corp., 144A 6.125%
01/10/2028 USD 500,000 521,928 0.11 Tenet Healthcare Corp. 7% 01/08/2025 USD 2,000,000 2,071,050 0.45
13,258,156 2.85
holding companies – DiversifiedPetSmart, Inc., 144A 7.125%
15/03/2023 USD 2,250,000 2,252,813 0.48 Trident TPI Holdings, Inc., 144A 6.625%
01/11/2025 USD 2,497,000 2,543,556 0.55
4,796,369 1.03
home BuildersAshton Woods USA LLC, 144A 6.625%
15/01/2028 USD 2,075,000 2,189,124 0.48 Beazer Homes USA, Inc. 5.875%
15/10/2027 USD 2,000,000 2,108,750 0.45 Century Communities, Inc. 5.875%
15/07/2025 USD 1,263,000 1,318,124 0.28 Century Communities, Inc. 6.75%
01/06/2027 USD 500,000 535,303 0.12 Empire Communities Corp., 144A 7%
15/12/2025 USD 1,350,000 1,425,938 0.31
schEDUlE of InVEsTmEnTsAs at 31 December 2020
Investments Currency
Quantity/ Nominal
Value
Market Value USD
% of Net Assets
Transferable securities and money market instruments admitted to official exchange listing or dealt in on another regulated market
corporate Bonds (continued)
home Builders (continued)Forestar Group, Inc., 144A 5%
01/03/2028 USD 1,500,000 1,552,268 0.33 Installed Building Products, Inc., 144A
5.75% 01/02/2028 USD 1,500,000 1,602,840 0.34 LGI Homes, Inc., 144A 6.875%
15/07/2026 USD 1,800,000 1,894,500 0.41 Mattamy Group Corp., 144A 5.25%
15/12/2027 USD 1,200,000 1,272,750 0.27 New Home Co., Inc. (The), 144A 7.25%
15/10/2025 USD 2,000,000 2,058,979 0.44 Picasso Finance Sub, Inc., 144A 6.125%
15/06/2025 USD 1,900,000 2,035,754 0.44 Taylor Morrison Communities, Inc., 144A
5.875% 15/06/2027 USD 750,000 851,700 0.18 Winnebago Industries, Inc., 144A 6.25%
15/07/2028 USD 900,000 969,188 0.21
19,815,218 4.26
home furnishingsTempur Sealy International, Inc. 5.5%
15/06/2026 USD 1,000,000 1,037,500 0.22
1,037,500 0.22
household ProductsCentral Garden & Pet Co. 5.125%
01/02/2028 USD 925,000 981,481 0.21 Spectrum Brands, Inc., 144A 5%
01/10/2029 USD 1,496,000 1,600,720 0.35
2,582,201 0.56
housewaresCD&R Smokey Buyer, Inc., 144A 6.75%
15/07/2025 USD 1,525,000 1,631,750 0.35
1,631,750 0.35
InsuranceAlliant Holdings Intermediate LLC, 144A
6.75% 15/10/2027 USD 1,350,000 1,436,657 0.31 GTCR AP Finance, Inc., 144A 8%
15/05/2027 USD 2,000,000 2,176,899 0.46 HUB International Ltd., 144A 7%
01/05/2026 USD 2,000,000 2,088,760 0.45 MGIC Investment Corp. 5.25%
15/08/2028 USD 740,000 793,891 0.17 NMI Holdings, Inc., 144A 7.375%
01/06/2025 USD 1,100,000 1,233,590 0.27 Radian Group, Inc. 6.625% 15/03/2025 USD 250,000 283,594 0.06 Radian Group, Inc. 4.875% 15/03/2027 USD 910,000 1,001,636 0.22
9,015,027 1.94

269 Morgan Stanley Investment Funds 31 December 2020
The accompanying notes are an integral part of these financial statements.
US Dollar High Yield Bond Fund (continued)
schEDUlE of InVEsTmEnTsAs at 31 December 2020
Investments Currency
Quantity/ Nominal
Value
Market Value USD
% of Net Assets
Transferable securities and money market instruments admitted to official exchange listing or dealt in on another regulated market
corporate Bonds (continued)
InternetArches Buyer, Inc., 144A 4.25%
01/06/2028 USD 425,000 432,172 0.09 TripAdvisor, Inc., 144A 7% 15/07/2025 USD 400,000 434,110 0.10
866,282 0.19
Investment companiesCompass Group Diversified Holdings LLC,
144A 8% 01/05/2026 USD 2,000,000 2,107,120 0.45 Icahn Enterprises LP 6.25% 15/05/2026 USD 500,000 530,620 0.11 Icahn Enterprises LP 5.25% 15/05/2027 USD 500,000 537,250 0.12
3,174,990 0.68
lodgingBoyd Gaming Corp. 4.75% 01/12/2027 USD 600,000 624,486 0.13 Boyd Gaming Corp. 6% 15/08/2026 USD 1,000,000 1,042,500 0.22 FelCor Lodging LP, REIT 6% 01/06/2025 USD 1,021,000 1,040,037 0.22 Hilton Domestic Operating Co., Inc., 144A
5.375% 01/05/2025 USD 850,000 909,679 0.20 Marriott Ownership Resorts, Inc., 144A
6.125% 15/09/2025 USD 750,000 800,625 0.17 MGM Resorts International 6.75%
01/05/2025 USD 1,175,000 1,274,364 0.28 MGM Resorts International 5.5%
15/04/2027 USD 343,000 382,755 0.08 Station Casinos LLC, 144A 4.5%
15/02/2028 USD 1,750,000 1,766,406 0.38 Sugarhouse HSP Gaming Prop Mezz LP,
144A 5.875% 15/05/2025 USD 2,298,000 2,269,275 0.49 Wyndham Destinations, Inc., 144A 4.625%
01/03/2030 USD 1,000,000 1,058,280 0.23
11,168,407 2.40
machineryCleaver-Brooks, Inc., 144A 7.875%
01/03/2023 USD 2,000,000 1,982,290 0.43 JPW Industries Holding Corp., 144A 9%
01/10/2024 USD 2,245,000 2,222,550 0.47 Manitowoc Co., Inc. (The), 144A 9%
01/04/2026 USD 2,000,000 2,163,750 0.47 Stevens Holding Co., Inc., 144A 6.125%
01/10/2026 USD 1,125,000 1,219,005 0.26 Vertical US Newco, Inc., 144A 5.25%
15/07/2027 USD 1,450,000 1,539,719 0.33
9,127,314 1.96
mediaAltice Financing SA, 144A 5% 15/01/2028 USD 1,650,000 1,692,817 0.36 Altice France SA, 144A 7.375%
01/05/2026 USD 1,750,000 1,844,062 0.40 Block Communications, Inc., 144A 4.875%
01/03/2028 USD 2,500,000 2,580,862 0.56 Cable One, Inc., 144A 4% 15/11/2030 USD 575,000 598,359 0.13 CCO Holdings LLC, 144A 5% 01/02/2028 USD 1,300,000 1,369,550 0.29 Clear Channel Worldwide Holdings, Inc.,
144A 5.125% 15/08/2027 USD 775,000 783,719 0.17 Clear Channel Worldwide Holdings, Inc.
9.25% 15/02/2024 USD 1,649,000 1,671,847 0.36 CSC Holdings LLC, 144A 5.75%
15/01/2030 USD 2,550,000 2,789,074 0.60
schEDUlE of InVEsTmEnTsAs at 31 December 2020
Investments Currency
Quantity/ Nominal
Value
Market Value USD
% of Net Assets
Transferable securities and money market instruments admitted to official exchange listing or dealt in on another regulated market
corporate Bonds (continued)
media (continued)Diamond Sports Group LLC, 144A 6.625%
15/08/2027 USD 1,625,000 981,094 0.21 DISH DBS Corp. 7.75% 01/07/2026 USD 1,425,000 1,597,817 0.34 Entercom Media Corp., 144A 6.5%
01/05/2027 USD 2,500,000 2,549,525 0.55 EW Scripps Co. (The), 144A 5.125%
15/05/2025 USD 2,250,000 2,300,873 0.49 GCI LLC, 144A 4.75% 15/10/2028 USD 750,000 801,319 0.17 Gray Television, Inc., 144A 5.875%
15/07/2026 USD 1,750,000 1,838,594 0.40 iHeartCommunications, Inc., 144A 5.25%
15/08/2027 USD 2,000,000 2,088,380 0.45 LCPR Senior Secured Financing DAC,
144A 6.75% 15/10/2027 USD 2,700,000 2,909,249 0.63 Midcontinent Communications, 144A
5.375% 15/08/2027 USD 2,525,000 2,647,613 0.57 Nexstar Broadcasting, Inc., 144A 5.625%
15/07/2027 USD 1,700,000 1,825,911 0.39 Radiate Holdco LLC, 144A 6.5%
15/09/2028 USD 1,750,000 1,847,344 0.40 Sirius XM Radio, Inc., 144A 5%
01/08/2027 USD 1,250,000 1,329,969 0.29 TEGNA, Inc. 5% 15/09/2029 USD 1,925,000 2,032,685 0.44 Univision Communications, Inc., 144A
6.625% 01/06/2027 USD 925,000 995,231 0.21 Univision Communications, Inc., 144A
9.5% 01/05/2025 USD 2,000,000 2,235,000 0.48 UPC Holding BV, 144A 5.5% 15/01/2028 USD 550,000 581,281 0.13 Virgin Media Finance plc, 144A 5%
15/07/2030 USD 2,049,000 2,128,399 0.46 Virgin Media Secured Finance plc, 144A
5.5% 15/05/2029 USD 500,000 542,670 0.12 Ziggo Bond Co. BV, 144A 5.125%
28/02/2030 USD 525,000 551,250 0.12 Ziggo BV, 144A 4.875% 15/01/2030 USD 1,540,000 1,621,813 0.35
46,736,307 10.07
metal fabricate/hardwareGrinding Media, Inc., 144A 7.375%
15/12/2023 USD 2,550,000 2,594,625 0.56 TriMas Corp., 144A 4.875% 15/10/2025 USD 1,300,000 1,335,549 0.29
3,930,174 0.85
miningAlcoa Nederland Holding BV, 144A 5.5%
15/12/2027 USD 1,000,000 1,086,250 0.23 Eldorado Gold Corp., 144A 9.5%
01/06/2024 USD 1,559,000 1,724,479 0.37 First Quantum Minerals Ltd., 144A 6.875%
15/10/2027 USD 250,000 271,013 0.06 First Quantum Minerals Ltd., 144A 7.5%
01/04/2025 USD 1,750,000 1,813,437 0.38 Hudbay Minerals, Inc., 144A 6.125%
01/04/2029 USD 1,130,000 1,220,400 0.26 Hudbay Minerals, Inc., 144A 7.625%
15/01/2025 USD 250,000 260,156 0.06 IAMGOLD Corp., 144A 5.75%
15/10/2028 USD 1,650,000 1,676,813 0.36 International Wire Group, Inc., 144A
10.75% 01/08/2021 USD 1,420,000 1,420,888 0.31 Kaiser Aluminum Corp., 144A 6.5%
01/05/2025 USD 250,000 268,125 0.06

Morgan Stanley Investment Funds 31 December 2020 270
The accompanying notes are an integral part of these financial statements.
US Dollar High Yield Bond Fund (continued)
schEDUlE of InVEsTmEnTsAs at 31 December 2020
Investments Currency
Quantity/ Nominal
Value
Market Value USD
% of Net Assets
Transferable securities and money market instruments admitted to official exchange listing or dealt in on another regulated market
corporate Bonds (continued)
mining (continued)Kaiser Aluminum Corp., 144A 4.625%
01/03/2028 USD 1,525,000 1,584,765 0.34 Novelis Corp., 144A 4.75% 30/01/2030 USD 1,250,000 1,339,844 0.29
12,666,170 2.72
miscellaneous manufacturersBombardier, Inc., 144A 6.125%
15/01/2023 USD 1,250,000 1,223,125 0.26 EnPro Industries, Inc. 5.75% 15/10/2026 USD 2,125,000 2,265,377 0.48 FXI Holdings, Inc., 144A 7.875%
01/11/2024 USD 1,970,000 1,989,700 0.43 Harsco Corp., 144A 5.75% 31/07/2027 USD 1,700,000 1,800,938 0.39 Koppers, Inc., 144A 6% 15/02/2025 USD 1,752,000 1,807,845 0.39
9,086,985 1.95
office furnishingsInterface, Inc., 144A 5.5% 01/12/2028 USD 425,000 448,109 0.10
448,109 0.10
oil & GasBaytex Energy Corp., 144A 5.625%
01/06/2024 USD 1,400,000 968,191 0.21 CrownRock LP, 144A 5.625%
15/10/2025 USD 1,750,000 1,790,434 0.39 Endeavor Energy Resources LP, 144A
6.625% 15/07/2025 USD 375,000 401,835 0.09 Endeavor Energy Resources LP, 144A
5.75% 30/01/2028 USD 2,125,000 2,271,624 0.49 Energy Ventures Gom LLC, 144A 11%
15/02/2023 USD 2,000,000 1,900,000 0.41 Magnolia Oil & Gas Operating LLC, 144A
6% 01/08/2026 USD 2,000,000 2,045,000 0.44 Matador Resources Co. 5.875%
15/09/2026 USD 1,750,000 1,674,348 0.36 Murphy Oil Corp. 5.75% 15/08/2025 USD 2,125,000 2,098,661 0.45 Murphy Oil Corp. 5.875% 01/12/2027 USD 625,000 619,338 0.13 Murphy Oil USA, Inc. 5.625% 01/05/2027 USD 1,782,000 1,890,809 0.41 Occidental Petroleum Corp. 6.125%
01/01/2031 USD 2,935,000 3,154,537 0.67 Occidental Petroleum Corp. 6.95%
01/07/2024 USD 2,300,000 2,489,749 0.54 Occidental Petroleum Corp. 2.9%
15/08/2024 USD 2,300,000 2,217,199 0.48 Occidental Petroleum Corp. 3.2%
15/08/2026 USD 740,000 693,288 0.15 Parkland Corp., 144A 6% 01/04/2026 USD 500,000 525,938 0.11 Parkland Corp., 144A 5.875%
15/07/2027 USD 500,000 538,438 0.12 PBF Holding Co. LLC 6% 15/02/2028 USD 1,800,000 1,029,375 0.22 Seven Generations Energy Ltd., 144A
5.375% 30/09/2025 USD 1,650,000 1,684,015 0.36 Sunoco LP, 144A 4.5% 15/05/2029 USD 450,000 468,844 0.10 Vermilion Energy, Inc., 144A 5.625%
15/03/2025 USD 1,735,000 1,496,255 0.32 Viper Energy Partners LP, 144A 5.375%
01/11/2027 USD 2,277,000 2,383,312 0.51 WPX Energy, Inc. 5.25% 15/10/2027 USD 500,000 530,405 0.11 WPX Energy, Inc. 4.5% 15/01/2030 USD 2,050,000 2,176,075 0.47
35,047,670 7.54
schEDUlE of InVEsTmEnTsAs at 31 December 2020
Investments Currency
Quantity/ Nominal
Value
Market Value USD
% of Net Assets
Transferable securities and money market instruments admitted to official exchange listing or dealt in on another regulated market
corporate Bonds (continued)
oil, Gas & consumable fuelsArchrock Partners LP, 144A 6.25%
01/04/2028 USD 400,000 418,500 0.09 Archrock Partners LP, 144A 6.875%
01/04/2027 USD 750,000 809,010 0.17 Oceaneering International, Inc. 6%
01/02/2028 USD 1,500,000 1,344,375 0.29
2,571,885 0.55
Packaging & containersFlex Acquisition Co., Inc., 144A 6.875%
15/01/2025 USD 1,750,000 1,780,625 0.38 Graham Packaging Co., Inc., 144A
7.125% 15/08/2028 USD 1,035,000 1,140,441 0.25 Greif, Inc., 144A 6.5% 01/03/2027 USD 300,000 317,813 0.07 Intelligent Packaging Ltd. Finco, Inc., 144A
6% 15/09/2028 USD 1,000,000 1,029,375 0.22 Intertape Polymer Group, Inc., 144A 7%
15/10/2026 USD 1,975,000 2,101,538 0.45 Mauser Packaging Solutions Holding Co.,
144A 7.25% 15/04/2025 USD 2,475,000 2,502,843 0.54 Owens-Brockway Glass Container, Inc.,
144A 6.625% 13/05/2027 USD 1,000,000 1,084,375 0.23 Plastipak Holdings, Inc., 144A 6.25%
15/10/2025 USD 2,250,000 2,321,719 0.50 Trivium Packaging Finance BV, 144A 8.5%
15/08/2027 USD 1,750,000 1,919,356 0.41
14,198,085 3.05
PharmaceuticalsAdaptHealth LLC, 144A 6.125%
01/08/2028 USD 1,000,000 1,076,250 0.23 AdaptHealth LLC, 144A 4.625%
01/08/2029 USD 1,150,000 1,181,912 0.25 Bausch Health Cos., Inc., 144A 9%
15/12/2025 USD 750,000 829,369 0.18 Bausch Health Cos., Inc., 144A 6.125%
15/04/2025 USD 1,000,000 1,030,010 0.22 Cheplapharm Arzneimittel GmbH, 144A
5.5% 15/01/2028 USD 1,300,000 1,360,125 0.29 Endo Dac, 144A 5.875% 15/10/2024 USD 500,000 507,813 0.11 Endo Dac, 144A 6% 15/07/2023 USD 982,000 837,759 0.18 P&L Development LLC, 144A 7.75%
15/11/2025 USD 850,000 915,875 0.20 Teva Pharmaceutical Finance
Netherlands III BV 3.15% 01/10/2026 USD 1,300,000 1,252,076 0.27
8,991,189 1.93
PipelinesAmerican Midstream Partners LP, 144A
9.5% 15/12/2021 USD 2,000,000 1,987,250 0.42 Blue Racer Midstream LLC, 144A 7.625%
15/12/2025 USD 450,000 478,548 0.10 Blue Racer Midstream LLC, 144A 6.625%
15/07/2026 USD 1,000,000 1,010,000 0.22 Global Partners LP 7% 01/08/2027 USD 2,000,000 2,145,870 0.47

271 Morgan Stanley Investment Funds 31 December 2020
The accompanying notes are an integral part of these financial statements.
US Dollar High Yield Bond Fund (continued)
schEDUlE of InVEsTmEnTsAs at 31 December 2020
Investments Currency
Quantity/ Nominal
Value
Market Value USD
% of Net Assets
Transferable securities and money market instruments admitted to official exchange listing or dealt in on another regulated market
corporate Bonds (continued)
Pipelines (continued)Martin Midstream Partners LP, 144A 10%
29/02/2024 USD 256,396 262,165 0.06 Martin Midstream Partners LP, 144A
11.5% 28/02/2025 USD 1,164,348 1,126,507 0.24 NuStar Logistics LP 6.375% 01/10/2030 USD 425,000 482,237 0.10 Rockies Express Pipeline LLC, 144A 3.6%
15/05/2025 USD 1,250,000 1,290,900 0.28 Tallgrass Energy Partners LP, 144A 7.5%
01/10/2025 USD 600,000 642,375 0.14 Tallgrass Energy Partners LP, 144A 6%
31/12/2030 USD 600,000 619,506 0.13 Targa Resources Partners LP 5.5%
01/03/2030 USD 1,253,000 1,357,550 0.29 TransMontaigne Partners LP 6.125%
15/02/2026 USD 945,000 953,089 0.21
12,355,997 2.66
Real EstateCushman & Wakefield US Borrower LLC,
144A 6.75% 15/05/2028 USD 1,050,000 1,158,281 0.25 Hunt Cos., Inc., 144A 6.25% 15/02/2026 USD 2,000,000 2,055,810 0.44 Kennedy-Wilson, Inc. 5.875% 01/04/2024 USD 1,500,000 1,520,625 0.33
4,734,716 1.02
Real Estate Investment Trusts (REITs)AHP Health Partners, Inc., 144A 9.75%
15/07/2026 USD 2,500,000 2,768,275 0.59 CTR Partnership LP, REIT 5.25%
01/06/2025 USD 1,650,000 1,713,764 0.37 Iron Mountain, Inc., REIT, 144A 5.25%
15/07/2030 USD 725,000 783,906 0.17 iStar, Inc., REIT 4.25% 01/08/2025 USD 800,000 792,000 0.17 MGM Growth Properties Operating
Partnership LP, 144A 4.625% 15/06/2025 USD 300,000 321,600 0.07
MGM Growth Properties Operating Partnership LP, REIT 5.75% 01/02/2027 USD 675,000 758,319 0.16
MPT Operating Partnership LP, REIT 4.625% 01/08/2029 USD 1,000,000 1,070,470 0.23
RHP Hotel Properties LP 4.75% 15/10/2027 USD 1,000,000 1,031,690 0.22
SBA Communications Corp., REIT, 144A 3.875% 15/02/2027 USD 875,000 920,106 0.20
10,160,130 2.18
Retail1011778 BC ULC, 144A 5.75%
15/04/2025 USD 575,000 616,153 0.13 99 Escrow Issuer, Inc., 144A 7.5%
15/01/2026 USD 900,000 896,625 0.19 AAG FH LP, 144A 9.75% 15/07/2024 USD 750,000 714,375 0.15 Asbury Automotive Group, Inc. 4.75%
01/03/2030 USD 535,000 574,456 0.12 At Home Holding III, Inc., 144A 8.75%
01/09/2025 USD 1,650,000 1,789,218 0.39 Burlington Coat Factory Warehouse Corp.,
144A 6.25% 15/04/2025 USD 1,150,000 1,223,313 0.26 Carvana Co., 144A 5.875% 01/10/2028 USD 1,450,000 1,502,737 0.32 Ferrellgas LP, 144A 10% 15/04/2025 USD 1,250,000 1,385,938 0.30
schEDUlE of InVEsTmEnTsAs at 31 December 2020
Investments Currency
Quantity/ Nominal
Value
Market Value USD
% of Net Assets
Transferable securities and money market instruments admitted to official exchange listing or dealt in on another regulated market
corporate Bonds (continued)
Retail (continued)Golden Nugget, Inc., 144A 8.75%
01/10/2025 USD 1,500,000 1,555,313 0.34 Guitar Center Escrow Issuer II, Inc., 144A
8.5% 15/01/2026 USD 450,000 468,844 0.10 IRB Holding Corp., 144A 7% 15/06/2025 USD 1,000,000 1,094,275 0.24 Ken Garff Automotive LLC, 144A 4.875%
15/09/2028 USD 675,000 703,266 0.15 L Brands, Inc. 6.95% 01/03/2033 USD 1,100,000 1,141,250 0.25 LBM Acquisition LLC, 144A 6.25%
15/01/2029 USD 1,350,000 1,403,156 0.30 Lithia Motors, Inc., 144A 4.625%
15/12/2027 USD 1,350,000 1,426,781 0.31 Macy’s, Inc., 144A 8.375% 15/06/2025 USD 1,850,000 2,042,288 0.45 Nathan’s Famous, Inc., 144A 6.625%
01/11/2025 USD 2,500,000 2,578,124 0.56 Rite Aid Corp., 144A 8% 15/11/2026 USD 784,000 837,767 0.18 Rite Aid Corp., 144A 7.5% 01/07/2025 USD 1,069,000 1,117,666 0.24 Sally Holdings LLC 5.625% 01/12/2025 USD 1,631,000 1,678,299 0.36 White Cap Buyer LLC, 144A 6.875%
15/10/2028 USD 650,000 694,281 0.15
25,444,125 5.49
semiconductorsON Semiconductor Corp., 144A 3.875%
01/09/2028 USD 775,000 801,156 0.17
801,156 0.17
softwareBlack Knight InfoServ LLC, 144A 3.625%
01/09/2028 USD 840,000 861,000 0.19 Boxer Parent Co., Inc., 144A 7.125%
02/10/2025 USD 1,800,000 1,956,398 0.42 BY Crown Parent LLC, 144A 7.375%
15/10/2024 USD 1,837,000 1,875,843 0.40 CDK Global, Inc., 144A 5.25%
15/05/2029 USD 750,000 831,645 0.18 Change Healthcare Holdings LLC, 144A
5.75% 01/03/2025 USD 1,550,000 1,582,938 0.34 IQVIA, Inc., 144A 5% 15/05/2027 USD 300,000 319,497 0.07 J2 Global, Inc., 144A 4.625%
15/10/2030 USD 2,000,000 2,113,749 0.45 Rackspace Technology Global, Inc., 144A
5.375% 01/12/2028 USD 1,600,000 1,675,500 0.36
11,216,570 2.41
TelecommunicationsAltice France SA, 144A 5.125%
15/01/2029 USD 250,000 257,969 0.06 Avaya, Inc., 144A 6.125% 15/09/2028 USD 1,050,000 1,119,085 0.24 C&W Senior Financing DAC, 144A 6.875%
15/09/2027 USD 825,000 892,130 0.19 CenturyLink, Inc., 144A 4% 15/02/2027 USD 875,000 899,168 0.19 Level 3 Financing, Inc., 144A 4.625%
15/09/2027 USD 1,250,000 1,307,788 0.28 Sable International Finance Ltd., 144A
5.75% 07/09/2027 USD 1,900,000 2,027,888 0.44 Switch Ltd., 144A 3.75% 15/09/2028 USD 725,000 737,234 0.16
7,241,262 1.56

Morgan Stanley Investment Funds 31 December 2020 272
The accompanying notes are an integral part of these financial statements.
US Dollar High Yield Bond Fund (continued)
schEDUlE of InVEsTmEnTsAs at 31 December 2020
Investments Currency
Quantity/ Nominal
Value
Market Value USD
% of Net Assets
Transferable securities and money market instruments admitted to official exchange listing or dealt in on another regulated market
corporate Bonds (continued)
TextilesEagle Intermediate Global Holding BV,
144A 7.5% 01/05/2025 USD 1,000,000 885,000 0.19
885,000 0.19
TransportationCargo Aircraft Management, Inc., 144A
4.75% 01/02/2028 USD 1,500,000 1,549,688 0.33 Kenan Advantage Group, Inc. (The), 144A
7.875% 31/07/2023 USD 2,175,000 2,172,509 0.47 Watco Cos. LLC, 144A 6.5% 15/06/2027 USD 1,850,000 2,006,094 0.43 XPO Logistics, Inc., 144A 6.25%
01/05/2025 USD 1,000,000 1,078,015 0.23
6,806,306 1.46
Total corporate Bonds 451,006,453 97.02
Total Transferable securities and money market instruments admitted to official exchange listing or dealt in on another regulated market 451,006,453 97.02
Other transferable securities and money market instruments not admitted to official exchange listing or dealt in on another regulated market
Equities
miningAmerican Gilsonite Co.* USD 60 28,350 0.01
28,350 0.01
oil, Gas & consumable fuelsLonestar Resources US, Inc.* USD 48,000 116,640 0.03
116,640 0.03
Transportationsyncreon Group BV* USD 3,440 157,690 0.02
157,690 0.02
Total Equities 302,680 0.06
schEDUlE of InVEsTmEnTsAs at 31 December 2020
Investments Currency
Quantity/ Nominal
Value
Market Value USD
% of Net Assets
Other transferable securities and money market instruments not admitted to official exchange listing or dealt in on another regulated market
Warrants
Transportationsyncreon Group BV 30/11/2020* USD 5,413 83,793 0.02
83,793 0.02
Total Warrants 83,793 0.02
Total other transferable securities and money market instruments not admitted to official exchange listing or dealt in on another regulated market 386,473 0.08
Total Investments 451,392,926 97.10
cash 4,527,281 0.97
other assets/(liabilities) 8,948,114 1.93
Total net assets 464,868,321 100.00
* Security is valued at its fair value under the direction of the Board of Directors.

273 Morgan Stanley Investment Funds 31 December 2020
The accompanying notes are an integral part of these financial statements.
US Dollar High Yield Bond Fund (continued)
forward currency Exchange contracts
currency Purchased
amount Purchased
currency sold
amount sold
maturity Date counterparty
Unrealised Gain/(loss)
UsD
% of net assets
EUR hedged share classEUR 122,295,850 USD 148,764,656 08/01/2021 J.P. Morgan 1,297,013 0.28
Unrealised Gain on naV hedged share classes forward currency Exchange contracts – assets 1,297,013 0.28
Total Unrealised Gain on forward currency Exchange contracts – assets 1,297,013 0.28
EUR hedged share classUSD 3,474 EUR 2,831 04/01/2021 J.P. Morgan 0 0.00USD 2,860,802 EUR 2,332,795 08/01/2021 J.P. Morgan (1,626) 0.00
Unrealised loss on naV hedged share classes forward currency Exchange contracts – liabilities (1,626) 0.00
Total Unrealised loss on forward currency Exchange contracts – liabilities (1,626) 0.00
net Unrealised Gain on forward currency Exchange contracts – assets 1,295,387 0.28
DERIVaTIVEs
Over-the-counter (OTC) and exchange traded derivatives as at 31 December 2020, expressed in US Dollars.

Morgan Stanley Investment Funds 31 December 2020 274
The accompanying notes are an integral part of these financial statements.
Please refer to the full prospectus for the Fund’s investment objective and policy.
US Dollar Short Duration Bond Fund
InVEsTmEnT aIm
To provide an attractive rate of return, measured in US Dollars, by investing primarily in high quality USD denominated Fixed Income Securities, including asset backed securities (including mortgage backed securities).
schEDUlE of InVEsTmEnTsAs at 31 December 2020
Investments Currency
Quantity/ Nominal
Value
Market Value USD
% of Net Assets
Transferable securities and money market instruments admitted to official exchange listing or dealt in on another regulated market
certificates of Deposit
BanksNatixis SA 0.55% 19/02/2021 USD 1,500,000 1,500,815 0.48
1,500,815 0.48
Total certificates of Deposit 1,500,815 0.48
commercial Papers
auto manufacturersVolkswagen Investments LP 0%
25/10/2021 USD 1,000,000 994,925 0.32
994,925 0.32
BanksHSBC Bank plc 0% 28/09/2021 USD 1,250,000 1,247,308 0.40 HSBC USA, Inc. 0% 22/03/2021 USD 1,500,000 1,498,975 0.48 Toronto-Dominion Bank (The) 0%
03/06/2021 USD 4,000,000 3,995,608 1.28
6,741,891 2.16
consumer financeVW Credit, Inc. 0% 29/01/2021 USD 490,000 489,912 0.16
489,912 0.16
EntertainmentWalt Disney Co. (The) 0% 15/06/2021 USD 1,800,000 1,797,692 0.58
1,797,692 0.58
oil, Gas & consumable fuelsShell International Finance BV 0%
26/02/2021 USD 3,000,000 2,999,256 0.97
2,999,256 0.97
Total commercial Papers 13,023,676 4.19
corporate Bonds
agricultureAltria Group, Inc. 3.49% 14/02/2022 USD 2,055,000 2,125,980 0.69 Imperial Brands Finance plc, 144A 3.75%
21/07/2022 USD 1,500,000 1,564,678 0.50 Philip Morris International, Inc. 1.125%
01/05/2023 USD 1,050,000 1,069,932 0.34
4,760,590 1.53
auto manufacturersAmerican Honda Finance Corp. 0.65%
08/09/2023 USD 1,250,000 1,258,371 0.40 American Honda Finance Corp. 3.55%
12/01/2024 USD 1,400,000 1,526,415 0.50 Daimler Finance North America LLC, 144A
3.35% 22/02/2023 USD 1,500,000 1,588,433 0.51 Daimler Finance North America LLC, 144A
2% 06/07/2021 USD 1,550,000 1,562,585 0.50
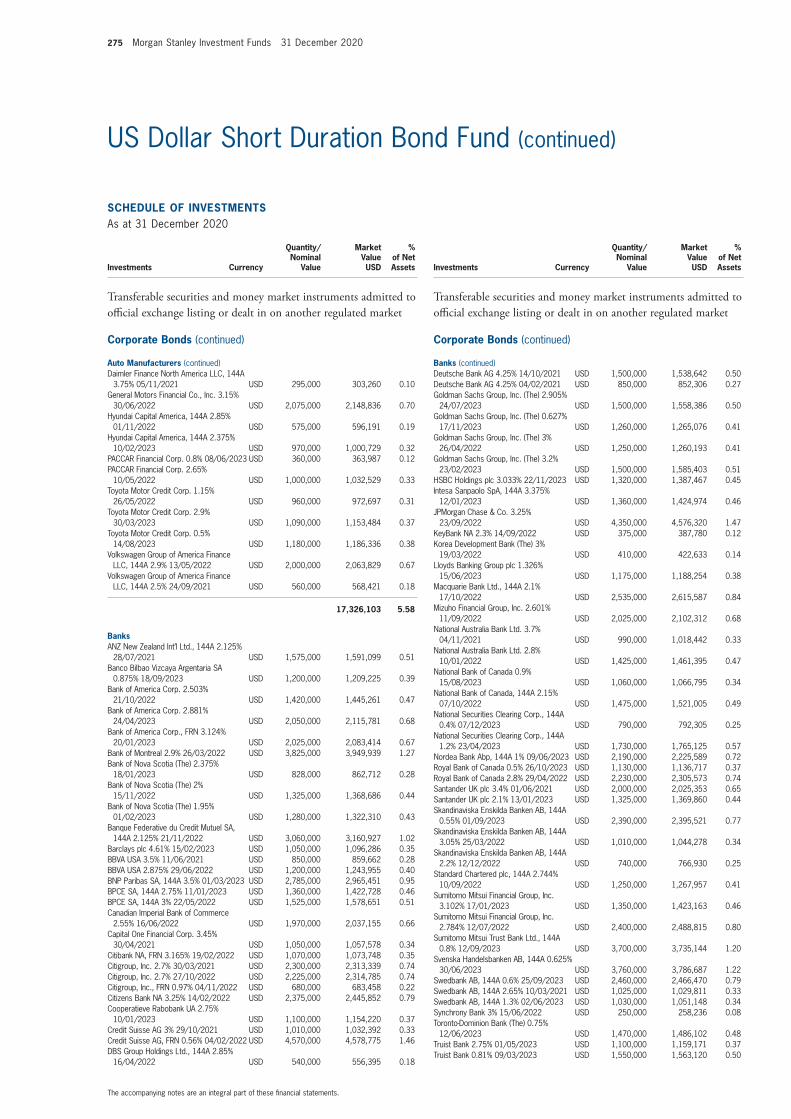
275 Morgan Stanley Investment Funds 31 December 2020
The accompanying notes are an integral part of these financial statements.
US Dollar Short Duration Bond Fund (continued)
schEDUlE of InVEsTmEnTsAs at 31 December 2020
Investments Currency
Quantity/ Nominal
Value
Market Value USD
% of Net Assets
Transferable securities and money market instruments admitted to official exchange listing or dealt in on another regulated market
corporate Bonds (continued)
auto manufacturers (continued)Daimler Finance North America LLC, 144A
3.75% 05/11/2021 USD 295,000 303,260 0.10 General Motors Financial Co., Inc. 3.15%
30/06/2022 USD 2,075,000 2,148,836 0.70 Hyundai Capital America, 144A 2.85%
01/11/2022 USD 575,000 596,191 0.19 Hyundai Capital America, 144A 2.375%
10/02/2023 USD 970,000 1,000,729 0.32 PACCAR Financial Corp. 0.8% 08/06/2023 USD 360,000 363,987 0.12 PACCAR Financial Corp. 2.65%
10/05/2022 USD 1,000,000 1,032,529 0.33 Toyota Motor Credit Corp. 1.15%
26/05/2022 USD 960,000 972,697 0.31 Toyota Motor Credit Corp. 2.9%
30/03/2023 USD 1,090,000 1,153,484 0.37 Toyota Motor Credit Corp. 0.5%
14/08/2023 USD 1,180,000 1,186,336 0.38 Volkswagen Group of America Finance
LLC, 144A 2.9% 13/05/2022 USD 2,000,000 2,063,829 0.67 Volkswagen Group of America Finance
LLC, 144A 2.5% 24/09/2021 USD 560,000 568,421 0.18
17,326,103 5.58
BanksANZ New Zealand Int’l Ltd., 144A 2.125%
28/07/2021 USD 1,575,000 1,591,099 0.51 Banco Bilbao Vizcaya Argentaria SA
0.875% 18/09/2023 USD 1,200,000 1,209,225 0.39 Bank of America Corp. 2.503%
21/10/2022 USD 1,420,000 1,445,261 0.47 Bank of America Corp. 2.881%
24/04/2023 USD 2,050,000 2,115,781 0.68 Bank of America Corp., FRN 3.124%
20/01/2023 USD 2,025,000 2,083,414 0.67 Bank of Montreal 2.9% 26/03/2022 USD 3,825,000 3,949,939 1.27 Bank of Nova Scotia (The) 2.375%
18/01/2023 USD 828,000 862,712 0.28 Bank of Nova Scotia (The) 2%
15/11/2022 USD 1,325,000 1,368,686 0.44 Bank of Nova Scotia (The) 1.95%
01/02/2023 USD 1,280,000 1,322,310 0.43 Banque Federative du Credit Mutuel SA,
144A 2.125% 21/11/2022 USD 3,060,000 3,160,927 1.02 Barclays plc 4.61% 15/02/2023 USD 1,050,000 1,096,286 0.35 BBVA USA 3.5% 11/06/2021 USD 850,000 859,662 0.28 BBVA USA 2.875% 29/06/2022 USD 1,200,000 1,243,955 0.40 BNP Paribas SA, 144A 3.5% 01/03/2023 USD 2,785,000 2,965,451 0.95 BPCE SA, 144A 2.75% 11/01/2023 USD 1,360,000 1,422,728 0.46 BPCE SA, 144A 3% 22/05/2022 USD 1,525,000 1,578,651 0.51 Canadian Imperial Bank of Commerce
2.55% 16/06/2022 USD 1,970,000 2,037,155 0.66 Capital One Financial Corp. 3.45%
30/04/2021 USD 1,050,000 1,057,578 0.34 Citibank NA, FRN 3.165% 19/02/2022 USD 1,070,000 1,073,748 0.35 Citigroup, Inc. 2.7% 30/03/2021 USD 2,300,000 2,313,339 0.74 Citigroup, Inc. 2.7% 27/10/2022 USD 2,225,000 2,314,785 0.74 Citigroup, Inc., FRN 0.97% 04/11/2022 USD 680,000 683,458 0.22 Citizens Bank NA 3.25% 14/02/2022 USD 2,375,000 2,445,852 0.79 Cooperatieve Rabobank UA 2.75%
10/01/2023 USD 1,100,000 1,154,220 0.37 Credit Suisse AG 3% 29/10/2021 USD 1,010,000 1,032,392 0.33 Credit Suisse AG, FRN 0.56% 04/02/2022 USD 4,570,000 4,578,775 1.46 DBS Group Holdings Ltd., 144A 2.85%
16/04/2022 USD 540,000 556,395 0.18
schEDUlE of InVEsTmEnTsAs at 31 December 2020
Investments Currency
Quantity/ Nominal
Value
Market Value USD
% of Net Assets
Transferable securities and money market instruments admitted to official exchange listing or dealt in on another regulated market
corporate Bonds (continued)
Banks (continued)Deutsche Bank AG 4.25% 14/10/2021 USD 1,500,000 1,538,642 0.50 Deutsche Bank AG 4.25% 04/02/2021 USD 850,000 852,306 0.27 Goldman Sachs Group, Inc. (The) 2.905%
24/07/2023 USD 1,500,000 1,558,386 0.50 Goldman Sachs Group, Inc. (The) 0.627%
17/11/2023 USD 1,260,000 1,265,076 0.41 Goldman Sachs Group, Inc. (The) 3%
26/04/2022 USD 1,250,000 1,260,193 0.41 Goldman Sachs Group, Inc. (The) 3.2%
23/02/2023 USD 1,500,000 1,585,403 0.51 HSBC Holdings plc 3.033% 22/11/2023 USD 1,320,000 1,387,467 0.45 Intesa Sanpaolo SpA, 144A 3.375%
12/01/2023 USD 1,360,000 1,424,974 0.46 JPMorgan Chase & Co. 3.25%
23/09/2022 USD 4,350,000 4,576,320 1.47 KeyBank NA 2.3% 14/09/2022 USD 375,000 387,780 0.12 Korea Development Bank (The) 3%
19/03/2022 USD 410,000 422,633 0.14 Lloyds Banking Group plc 1.326%
15/06/2023 USD 1,175,000 1,188,254 0.38 Macquarie Bank Ltd., 144A 2.1%
17/10/2022 USD 2,535,000 2,615,587 0.84 Mizuho Financial Group, Inc. 2.601%
11/09/2022 USD 2,025,000 2,102,312 0.68 National Australia Bank Ltd. 3.7%
04/11/2021 USD 990,000 1,018,442 0.33 National Australia Bank Ltd. 2.8%
10/01/2022 USD 1,425,000 1,461,395 0.47 National Bank of Canada 0.9%
15/08/2023 USD 1,060,000 1,066,795 0.34 National Bank of Canada, 144A 2.15%
07/10/2022 USD 1,475,000 1,521,005 0.49 National Securities Clearing Corp., 144A
0.4% 07/12/2023 USD 790,000 792,305 0.25 National Securities Clearing Corp., 144A
1.2% 23/04/2023 USD 1,730,000 1,765,125 0.57 Nordea Bank Abp, 144A 1% 09/06/2023 USD 2,190,000 2,225,589 0.72 Royal Bank of Canada 0.5% 26/10/2023 USD 1,130,000 1,136,717 0.37 Royal Bank of Canada 2.8% 29/04/2022 USD 2,230,000 2,305,573 0.74 Santander UK plc 3.4% 01/06/2021 USD 2,000,000 2,025,353 0.65 Santander UK plc 2.1% 13/01/2023 USD 1,325,000 1,369,860 0.44 Skandinaviska Enskilda Banken AB, 144A
0.55% 01/09/2023 USD 2,390,000 2,395,521 0.77 Skandinaviska Enskilda Banken AB, 144A
3.05% 25/03/2022 USD 1,010,000 1,044,278 0.34 Skandinaviska Enskilda Banken AB, 144A
2.2% 12/12/2022 USD 740,000 766,930 0.25 Standard Chartered plc, 144A 2.744%
10/09/2022 USD 1,250,000 1,267,957 0.41 Sumitomo Mitsui Financial Group, Inc.
3.102% 17/01/2023 USD 1,350,000 1,423,163 0.46 Sumitomo Mitsui Financial Group, Inc.
2.784% 12/07/2022 USD 2,400,000 2,488,815 0.80 Sumitomo Mitsui Trust Bank Ltd., 144A
0.8% 12/09/2023 USD 3,700,000 3,735,144 1.20 Svenska Handelsbanken AB, 144A 0.625%
30/06/2023 USD 3,760,000 3,786,687 1.22 Swedbank AB, 144A 0.6% 25/09/2023 USD 2,460,000 2,466,470 0.79 Swedbank AB, 144A 2.65% 10/03/2021 USD 1,025,000 1,029,811 0.33 Swedbank AB, 144A 1.3% 02/06/2023 USD 1,030,000 1,051,148 0.34 Synchrony Bank 3% 15/06/2022 USD 250,000 258,236 0.08 Toronto-Dominion Bank (The) 0.75%
12/06/2023 USD 1,470,000 1,486,102 0.48 Truist Bank 2.75% 01/05/2023 USD 1,100,000 1,159,171 0.37 Truist Bank 0.81% 09/03/2023 USD 1,550,000 1,563,120 0.50

Morgan Stanley Investment Funds 31 December 2020 276
The accompanying notes are an integral part of these financial statements.
US Dollar Short Duration Bond Fund (continued)
schEDUlE of InVEsTmEnTsAs at 31 December 2020
Investments Currency
Quantity/ Nominal
Value
Market Value USD
% of Net Assets
Transferable securities and money market instruments admitted to official exchange listing or dealt in on another regulated market
corporate Bonds (continued)
Banks (continued)Truist Bank 2.8% 17/05/2022 USD 470,000 485,593 0.16 Truist Financial Corp. 3.2% 03/09/2021 USD 350,000 356,121 0.11 United Overseas Bank Ltd., 144A 3.2%
23/04/2021 USD 340,000 342,793 0.11 US Bancorp 2.95% 15/07/2022 USD 2,575,000 2,676,507 0.86 Wells Fargo & Co. 3.069% 24/01/2023 USD 2,500,000 2,570,639 0.83 Westpac Banking Corp. 2% 13/01/2023 USD 260,000 269,208 0.09 Westpac Banking Corp. 3.65%
15/05/2023 USD 2,120,000 2,290,080 0.74
121,290,770 39.04
BeveragesKeurig Dr Pepper, Inc. 3.551%
25/05/2021 USD 3,740,000 3,787,007 1.22 PepsiCo, Inc. 0.75% 01/05/2023 USD 1,220,000 1,237,825 0.40
5,024,832 1.62
BiotechnologyGilead Sciences, Inc. 0.75% 29/09/2023 USD 1,020,000 1,023,241 0.33 Royalty Pharma plc, 144A 0.75%
02/09/2023 USD 2,180,000 2,191,860 0.70
3,215,101 1.03
commercial servicesPayPal Holdings, Inc. 2.2% 26/09/2022 USD 2,160,000 2,231,242 0.72
2,231,242 0.72
Diversified financial servicesAmerican Express Co. 2.75% 20/05/2022 USD 2,575,000 2,654,768 0.85 Capital One Financial Corp. 3.2%
30/01/2023 USD 1,110,000 1,170,178 0.38 Discover Financial Services 3.85%
21/11/2022 USD 1,500,000 1,596,245 0.51 Intercontinental Exchange, Inc. 0.7%
15/06/2023 USD 1,140,000 1,148,061 0.37 UBS Group AG, 144A 3.491%
23/05/2023 USD 1,110,000 1,155,531 0.37
7,724,783 2.48
ElectricAmerican Electric Power Co., Inc. 0.75%
01/11/2023 USD 700,000 701,723 0.23 Berkshire Hathaway Energy Co. 2.375%
15/01/2021 USD 450,000 450,267 0.14 Dominion Energy, Inc. 2% 15/08/2021 USD 1,290,000 1,301,045 0.42 DTE Energy Co. 2.25% 01/11/2022 USD 1,940,000 2,004,830 0.65 Duke Energy Corp. 3.05% 15/08/2022 USD 2,050,000 2,124,105 0.69 Enel Finance International NV, 144A 2.75%
06/04/2023 USD 1,370,000 1,434,402 0.46 Eversource Energy 2.75% 15/03/2022 USD 1,175,000 1,206,936 0.39 NextEra Energy Capital Holdings, Inc.
2.403% 01/09/2021 USD 1,350,000 1,368,731 0.44 Southern Co. (The) 2.95% 01/07/2023 USD 1,500,000 1,589,881 0.51 WEC Energy Group, Inc. 0.55%
15/09/2023 USD 1,990,000 2,000,980 0.64 Xcel Energy, Inc. 0.5% 15/10/2023 USD 580,000 582,035 0.19
14,764,935 4.76
schEDUlE of InVEsTmEnTsAs at 31 December 2020
Investments Currency
Quantity/ Nominal
Value
Market Value USD
% of Net Assets
Transferable securities and money market instruments admitted to official exchange listing or dealt in on another regulated market
corporate Bonds (continued)
ElectronicsHoneywell International, Inc. 0.483%
19/08/2022 USD 3,510,000 3,516,437 1.13 Roper Technologies, Inc. 0.45%
15/08/2022 USD 375,000 375,686 0.12
3,892,123 1.25
foodGeneral Mills, Inc. 0.77% 16/04/2021 USD 2,665,000 2,668,925 0.86 Kroger Co. (The) 3.3% 15/01/2021 USD 994,000 994,798 0.32 Mondelez International Holdings
Netherlands BV, 144A 2.125% 19/09/2022 USD 600,000 617,375 0.20
Mondelez International, Inc. 0.625% 01/07/2022 USD 1,990,000 1,999,322 0.64
Seven & i Holdings Co. Ltd., 144A 3.35% 17/09/2021 USD 1,750,000 1,784,461 0.57
8,064,881 2.59
healthcare servicesRoche Holdings, Inc., 144A 2.875%
29/09/2021 USD 1,330,000 1,350,897 0.43
1,350,897 0.43
household ProductsReckitt Benckiser Treasury Services plc,
144A 2.375% 24/06/2022 USD 1,170,000 1,203,388 0.39
1,203,388 0.39
InsuranceAmerican International Group, Inc. 4.875%
01/06/2022 USD 1,680,000 1,782,733 0.57 Aon Corp. 2.2% 15/11/2022 USD 650,000 672,228 0.22 Equitable Financial Life Global Funding,
144A 0.5% 17/11/2023 USD 1,030,000 1,031,032 0.33 Metropolitan Life Global Funding I, 144A
0.9% 08/06/2023 USD 1,620,000 1,640,931 0.53 Metropolitan Life Global Funding I, 144A
2.4% 17/06/2022 USD 950,000 981,387 0.32 Metropolitan Life Global Funding I, 144A
1.95% 13/01/2023 USD 1,100,000 1,135,251 0.37 New York Life Global Funding, 144A 0.4%
21/10/2023 USD 1,420,000 1,423,214 0.46 New York Life Global Funding, 144A 2.25%
12/07/2022 USD 410,000 422,755 0.14 New York Life Global Funding, 144A 1.1%
05/05/2023 USD 2,110,000 2,147,532 0.68 Principal Life Global Funding II, 144A 0.5%
08/01/2024 USD 1,970,000 1,974,774 0.63 Protective Life Global Funding, 144A
0.631% 13/10/2023 USD 340,000 342,134 0.11
13,553,971 4.36

277 Morgan Stanley Investment Funds 31 December 2020
The accompanying notes are an integral part of these financial statements.
US Dollar Short Duration Bond Fund (continued)
schEDUlE of InVEsTmEnTsAs at 31 December 2020
Investments Currency
Quantity/ Nominal
Value
Market Value USD
% of Net Assets
Transferable securities and money market instruments admitted to official exchange listing or dealt in on another regulated market
corporate Bonds (continued)
machineryJohn Deere Capital Corp. 0.7%
05/07/2023 USD 1,340,000 1,354,694 0.43 John Deere Capital Corp. 0.4%
10/10/2023 USD 450,000 452,373 0.15
1,807,067 0.58
machinery – construction & miningCaterpillar Financial Services Corp. 0.65%
07/07/2023 USD 2,430,000 2,450,878 0.79
2,450,878 0.79
mediaFox Corp. 3.666% 25/01/2022 USD 1,495,000 1,547,681 0.50
1,547,681 0.50
miningGlencore Finance Canada Ltd., 144A
4.95% 15/11/2021 USD 1,000,000 1,040,236 0.33
1,040,236 0.33
miscellaneous manufacturersEaton Corp. 2.75% 02/11/2022 USD 1,980,000 2,066,696 0.66
2,066,696 0.66
multi-nationalCorp. Andina de Fomento 2.375%
12/05/2023 USD 1,120,000 1,161,697 0.37
1,161,697 0.37
oil & GasChevron Corp. 1.141% 11/05/2023 USD 1,180,000 1,205,266 0.39 Exxon Mobil Corp. 1.571% 15/04/2023 USD 1,130,000 1,162,612 0.37
2,367,878 0.76
PharmaceuticalsAbbVie, Inc. 3.25% 01/10/2022 USD 1,370,000 1,426,761 0.46 AbbVie, Inc. 2.3% 21/11/2022 USD 1,120,000 1,161,345 0.37 AbbVie, Inc. 0.563% 21/05/2021 USD 1,260,000 1,261,263 0.41 Bayer US Finance II LLC, 144A 3.5%
25/06/2021 USD 2,800,000 2,834,137 0.91 Bristol-Myers Squibb Co. 2.75%
15/02/2023 USD 2,000,000 2,098,130 0.68 Bristol-Myers Squibb Co. 0.537%
13/11/2023 USD 1,140,000 1,142,315 0.37 Cigna Corp. 3.75% 15/07/2023 USD 2,000,000 2,162,650 0.70 CVS Health Corp. 3.7% 09/03/2023 USD 1,518,000 1,624,479 0.52 GlaxoSmithKline Capital plc 0.534%
01/10/2023 USD 1,760,000 1,768,780 0.57 Mylan NV 3.15% 15/06/2021 USD 1,100,000 1,110,671 0.36 Takeda Pharmaceutical Co. Ltd. 4%
26/11/2021 USD 3,080,000 3,170,884 1.02 Upjohn, Inc., 144A 1.125% 22/06/2022 USD 1,130,000 1,141,060 0.37
20,902,475 6.74
schEDUlE of InVEsTmEnTsAs at 31 December 2020
Investments Currency
Quantity/ Nominal
Value
Market Value USD
% of Net Assets
Transferable securities and money market instruments admitted to official exchange listing or dealt in on another regulated market
corporate Bonds (continued)
PipelinesEnterprise Products Operating LLC 2.8%
15/02/2021 USD 720,000 722,041 0.23 Enterprise Products Operating LLC 3.35%
15/03/2023 USD 1,090,000 1,152,768 0.37 Kinder Morgan, Inc., 144A 5%
15/02/2021 USD 975,000 977,894 0.32 Midwest Connector Capital Co. LLC, 144A
3.625% 01/04/2022 USD 425,000 431,669 0.14 Williams Cos., Inc. (The) 3.35%
15/08/2022 USD 1,500,000 1,562,363 0.50
4,846,735 1.56
RetailCVS Health Corp. 2.125% 01/06/2021 USD 1,225,000 1,232,294 0.40 Lowe’s Cos., Inc. 3.12% 15/04/2022 USD 2,350,000 2,419,118 0.77
3,651,412 1.17
savings & loansNationwide Building Society, 144A 2%
27/01/2023 USD 2,350,000 2,425,660 0.78 People’s United Financial, Inc. 3.65%
06/12/2022 USD 1,290,000 1,352,016 0.44
3,777,676 1.22
semiconductorsBroadcom, Inc. 2.25% 15/11/2023 USD 1,630,000 1,703,530 0.55
1,703,530 0.55
softwareAdobe, Inc. 1.7% 01/02/2023 USD 750,000 772,407 0.25
772,407 0.25
TelecommunicationsVerizon Communications, Inc. 2.946%
15/03/2022 USD 1,240,000 1,279,225 0.41
1,279,225 0.41
TransportationUnion Pacific Corp. 3.2% 08/06/2021 USD 460,000 465,721 0.15
465,721 0.15
Total corporate Bonds 254,244,930 81.82
mortgage and asset Backed securities
automobile asset Backed securitiesGM Financial Consumer Automobile
Receivables Trust ‘A3’ 2.81% 16/12/2022 USD 606,755 613,678 0.20
613,678 0.20
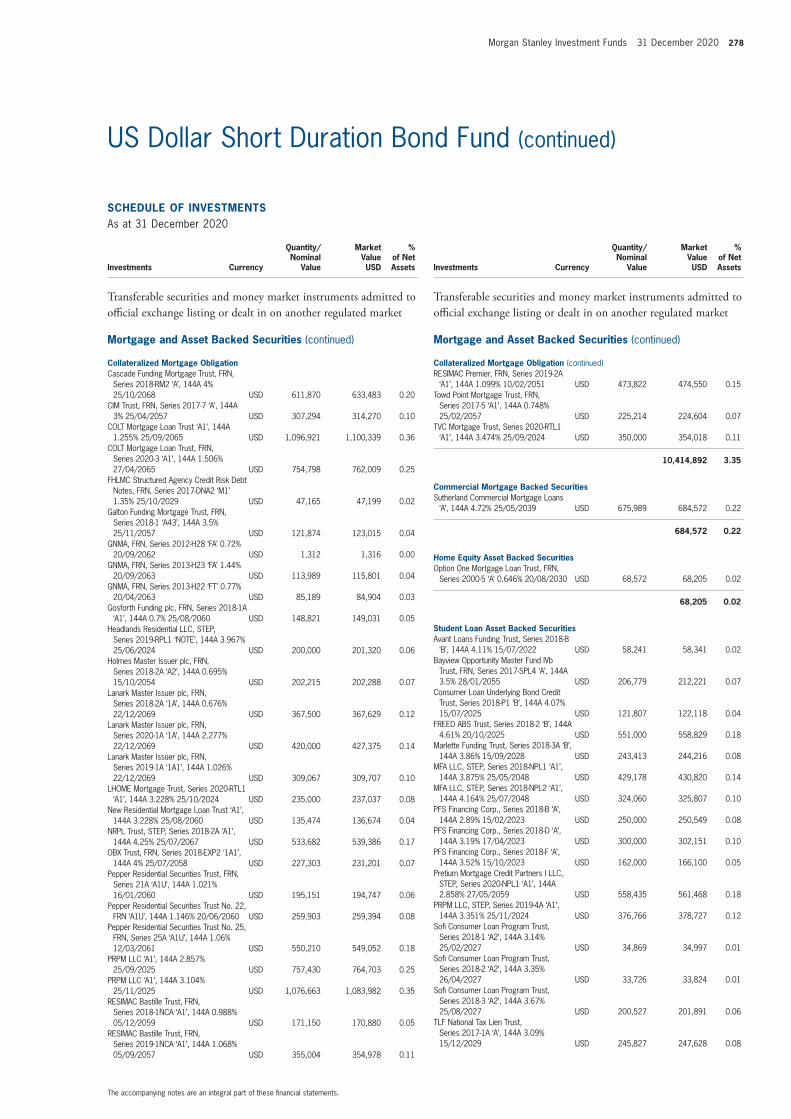
Morgan Stanley Investment Funds 31 December 2020 278
The accompanying notes are an integral part of these financial statements.
US Dollar Short Duration Bond Fund (continued)
schEDUlE of InVEsTmEnTsAs at 31 December 2020
Investments Currency
Quantity/ Nominal
Value
Market Value USD
% of Net Assets
Transferable securities and money market instruments admitted to official exchange listing or dealt in on another regulated market
mortgage and asset Backed securities (continued)
collateralized mortgage obligationCascade Funding Mortgage Trust, FRN,
Series 2018-RM2 ‘A’, 144A 4% 25/10/2068 USD 611,870 633,483 0.20
CIM Trust, FRN, Series 2017-7 ‘A’, 144A 3% 25/04/2057 USD 307,294 314,270 0.10
COLT Mortgage Loan Trust ‘A1’, 144A 1.255% 25/09/2065 USD 1,096,921 1,100,339 0.36
COLT Mortgage Loan Trust, FRN, Series 2020-3 ‘A1’, 144A 1.506% 27/04/2065 USD 754,798 762,009 0.25
FHLMC Structured Agency Credit Risk Debt Notes, FRN, Series 2017-DNA2 ‘M1’ 1.35% 25/10/2029 USD 47,165 47,199 0.02
Galton Funding Mortgage Trust, FRN, Series 2018-1 ‘A43’, 144A 3.5% 25/11/2057 USD 121,874 123,015 0.04
GNMA, FRN, Series 2012-H28 ‘FA’ 0.72% 20/09/2062 USD 1,312 1,316 0.00
GNMA, FRN, Series 2013-H23 ‘FA’ 1.44% 20/09/2063 USD 113,989 115,801 0.04
GNMA, FRN, Series 2013-H22 ‘FT’ 0.77% 20/04/2063 USD 85,189 84,904 0.03
Gosforth Funding plc, FRN, Series 2018-1A ‘A1’, 144A 0.7% 25/08/2060 USD 148,821 149,031 0.05
Headlands Residential LLC, STEP, Series 2019-RPL1 ‘NOTE’, 144A 3.967% 25/06/2024 USD 200,000 201,320 0.06
Holmes Master Issuer plc, FRN, Series 2018-2A ‘A2’, 144A 0.695% 15/10/2054 USD 202,215 202,288 0.07
Lanark Master Issuer plc, FRN, Series 2018-2A ‘1A’, 144A 0.676% 22/12/2069 USD 367,500 367,629 0.12
Lanark Master Issuer plc, FRN, Series 2020-1A ‘1A’, 144A 2.277% 22/12/2069 USD 420,000 427,375 0.14
Lanark Master Issuer plc, FRN, Series 2019-1A ‘1A1’, 144A 1.026% 22/12/2069 USD 309,067 309,707 0.10
LHOME Mortgage Trust, Series 2020-RTL1 ‘A1’, 144A 3.228% 25/10/2024 USD 235,000 237,037 0.08
New Residential Mortgage Loan Trust ‘A1’, 144A 3.228% 25/08/2060 USD 135,474 136,674 0.04
NRPL Trust, STEP, Series 2018-2A ‘A1’, 144A 4.25% 25/07/2067 USD 533,682 539,386 0.17
OBX Trust, FRN, Series 2018-EXP2 ‘1A1’, 144A 4% 25/07/2058 USD 227,303 231,201 0.07
Pepper Residential Securities Trust, FRN, Series 21A ‘A1U’, 144A 1.021% 16/01/2060 USD 195,151 194,747 0.06
Pepper Residential Securities Trust No. 22, FRN ‘A1U’, 144A 1.146% 20/06/2060 USD 259,903 259,394 0.08
Pepper Residential Securities Trust No. 25, FRN, Series 25A ‘A1U’, 144A 1.06% 12/03/2061 USD 550,210 549,052 0.18
PRPM LLC ‘A1’, 144A 2.857% 25/09/2025 USD 757,430 764,703 0.25
PRPM LLC ‘A1’, 144A 3.104% 25/11/2025 USD 1,076,663 1,083,982 0.35
RESIMAC Bastille Trust, FRN, Series 2018-1NCA ‘A1’, 144A 0.988% 05/12/2059 USD 171,150 170,880 0.05
RESIMAC Bastille Trust, FRN, Series 2019-1NCA ‘A1’, 144A 1.068% 05/09/2057 USD 355,004 354,978 0.11
schEDUlE of InVEsTmEnTsAs at 31 December 2020
Investments Currency
Quantity/ Nominal
Value
Market Value USD
% of Net Assets
Transferable securities and money market instruments admitted to official exchange listing or dealt in on another regulated market
mortgage and asset Backed securities (continued)
collateralized mortgage obligation (continued)RESIMAC Premier, FRN, Series 2019-2A
‘A1’, 144A 1.099% 10/02/2051 USD 473,822 474,550 0.15 Towd Point Mortgage Trust, FRN,
Series 2017-5 ‘A1’, 144A 0.748% 25/02/2057 USD 225,214 224,604 0.07
TVC Mortgage Trust, Series 2020-RTL1 ‘A1’, 144A 3.474% 25/09/2024 USD 350,000 354,018 0.11
10,414,892 3.35
commercial mortgage Backed securitiesSutherland Commercial Mortgage Loans
‘A’, 144A 4.72% 25/05/2039 USD 675,989 684,572 0.22
684,572 0.22
home Equity asset Backed securitiesOption One Mortgage Loan Trust, FRN,
Series 2000-5 ‘A’ 0.646% 20/08/2030 USD 68,572 68,205 0.02
68,205 0.02
student loan asset Backed securitiesAvant Loans Funding Trust, Series 2018-B
‘B’, 144A 4.11% 15/07/2022 USD 58,241 58,341 0.02 Bayview Opportunity Master Fund IVb
Trust, FRN, Series 2017-SPL4 ‘A’, 144A 3.5% 28/01/2055 USD 206,779 212,221 0.07
Consumer Loan Underlying Bond Credit Trust, Series 2018-P1 ‘B’, 144A 4.07% 15/07/2025 USD 121,807 122,118 0.04
FREED ABS Trust, Series 2018-2 ‘B’, 144A 4.61% 20/10/2025 USD 551,000 558,829 0.18
Marlette Funding Trust, Series 2018-3A ‘B’, 144A 3.86% 15/09/2028 USD 243,413 244,216 0.08
MFA LLC, STEP, Series 2018-NPL1 ‘A1’, 144A 3.875% 25/05/2048 USD 429,178 430,820 0.14
MFA LLC, STEP, Series 2018-NPL2 ‘A1’, 144A 4.164% 25/07/2048 USD 324,060 325,807 0.10
PFS Financing Corp., Series 2018-B ‘A’, 144A 2.89% 15/02/2023 USD 250,000 250,549 0.08
PFS Financing Corp., Series 2018-D ‘A’, 144A 3.19% 17/04/2023 USD 300,000 302,151 0.10
PFS Financing Corp., Series 2018-F ‘A’, 144A 3.52% 15/10/2023 USD 162,000 166,100 0.05
Pretium Mortgage Credit Partners I LLC, STEP, Series 2020-NPL1 ‘A1’, 144A 2.858% 27/05/2059 USD 558,435 561,468 0.18
PRPM LLC, STEP, Series 2019-4A ‘A1’, 144A 3.351% 25/11/2024 USD 376,766 378,727 0.12
Sofi Consumer Loan Program Trust, Series 2018-1 ‘A2’, 144A 3.14% 25/02/2027 USD 34,869 34,997 0.01
Sofi Consumer Loan Program Trust, Series 2018-2 ‘A2’, 144A 3.35% 26/04/2027 USD 33,726 33,824 0.01
Sofi Consumer Loan Program Trust, Series 2018-3 ‘A2’, 144A 3.67% 25/08/2027 USD 200,527 201,891 0.06
TLF National Tax Lien Trust, Series 2017-1A ‘A’, 144A 3.09% 15/12/2029 USD 245,827 247,628 0.08

279 Morgan Stanley Investment Funds 31 December 2020
The accompanying notes are an integral part of these financial statements.
US Dollar Short Duration Bond Fund (continued)
schEDUlE of InVEsTmEnTsAs at 31 December 2020
Investments Currency
Quantity/ Nominal
Value
Market Value USD
% of Net Assets
Transferable securities and money market instruments admitted to official exchange listing or dealt in on another regulated market
mortgage and asset Backed securities (continued)
student loan asset Backed securities (continued)Towd Point Mortgage Trust, FRN,
Series 2017-2 ‘A1’, 144A 2.75% 25/04/2057 USD 74,295 76,043 0.02
VCAT LLC ‘A1’, 144A 3.671% 25/08/2050 USD 461,067 467,142 0.15
Vericrest Opportunity Loan Trust, STEP, Series 2020-NPL2 ‘A1A’, 144A 2.981% 25/02/2050 USD 603,891 605,782 0.19
Vericrest Opportunity Loan Trust, STEP, Series 2020-NPL5 ‘A1A’, 144A 2.981% 25/03/2050 USD 544,356 545,709 0.18
VOLT LXXXV LLC ‘A1A’, 144A 3.228% 25/01/2050 USD 403,700 405,463 0.13
VOLT LXXXVIII LLC, STEP, Series 2020-NPL4 ‘A1’, 144A 2.981% 25/03/2050 USD 618,511 620,145 0.21
6,849,971 2.20
Total mortgage and asset Backed securities 18,631,318 5.99
Total Transferable securities and money market instruments admitted to official exchange listing or dealt in on another regulated market 287,400,739 92.48
Units of authorised UCITS or other collective investment undertakings
collective Investment schemes – UcITs
mutual fundsMorgan Stanley Liquidity Funds US Dollar
Treasury Liquidity Fund – MS Reserve† USD 21,600,000 21,600,000 6.95
21,600,000 6.95
Total collective Investment schemes – UcITs 21,600,000 6.95
Total Units of authorised UcITs or other collective investment undertakings 21,600,000 6.95
Total Investments 309,000,739 99.43
cash 626,536 0.20
other assets/(liabilities) 1,154,892 0.37
Total net assets 310,782,167 100.00
† Managed by an affiliate of the Investment Adviser.
financial futures contracts
security Descriptionnumber
of contracts currency
Global Exposure
UsD
Unrealised Gain/(loss)
UsD
% of net assets
US 2 Year Note, 31/03/2021 (294) USD (64,964,813) (58,936) (0.02)
Total Unrealised loss on financial futures contracts (58,936) (0.02)
net Unrealised loss on financial futures contracts (58,936) (0.02)
Collateral received and paid by the Fund in respect of financial derivative instruments:
Type of collateral counterparty currency amount received amount paid
Us Dollar short Duration Bond fund
Cash Goldman Sachs USD 182,847 –
182,847 –
DERIVaTIVEs
Over-the-counter (OTC) and exchange traded derivatives as at 31 December 2020, expressed in US Dollars.

Morgan Stanley Investment Funds 31 December 2020 280
The accompanying notes are an integral part of these financial statements.
Please refer to the full prospectus for the Fund’s investment objective and policy.
US Dollar Short Duration High Yield Bond Fund
InVEsTmEnT aIm
To provide an attractive rate of total return, measured in US Dollars, by investing primarily in high yield and unrated USD denominated Fixed Income Securities, issued by but not limited to governments, agencies and corporations located in emerging markets and subject to applicable law, including asset-backed securities, loan participations and loan assignments, to the extent that these instruments are securitised. The weighted average duration of the Fund will normally be less than 3 years, although this may be higher under certain market conditions.
schEDUlE of InVEsTmEnTsAs at 31 December 2020
Investments Currency
Quantity/ Nominal
Value
Market Value USD
% of Net Assets
Transferable securities and money market instruments admitted to official exchange listing or dealt in on another regulated market
corporate Bonds
advertisingMDC Partners, Inc., 144A 6.5%
01/05/2024 USD 1,250,000 1,269,075 0.86
1,269,075 0.86
aerospace & DefenseTransDigm, Inc., 144A 6.25%
15/03/2026 USD 1,000,000 1,066,255 0.73 Triumph Group, Inc., 144A 6.25%
15/09/2024 USD 1,000,000 993,750 0.67
2,060,005 1.40
airlinesDelta Air Lines, Inc., 144A 4.5%
20/10/2025 USD 1,000,000 1,073,066 0.73 Spirit Loyalty Cayman Ltd., 144A 8%
20/09/2025 USD 1,000,000 1,132,479 0.77 United Airlines Holdings, Inc. 4.25%
01/10/2022 USD 400,000 400,500 0.27 United Airlines Holdings, Inc. 4.875%
15/01/2025 USD 500,000 486,563 0.33
3,092,608 2.10
apparelLevi Strauss & Co. 5% 01/05/2025 USD 500,000 513,125 0.35 Wolverine World Wide, Inc., 144A 6.375%
15/05/2025 USD 500,000 534,688 0.36
1,047,813 0.71
auto manufacturersFord Motor Co. 8.5% 21/04/2023 USD 375,000 422,664 0.29 Ford Motor Co. 9% 22/04/2025 USD 1,000,000 1,228,505 0.83 Ford Motor Credit Co. LLC 3.375%
13/11/2025 USD 1,000,000 1,028,610 0.70 JB Poindexter & Co., Inc., 144A 7.125%
15/04/2026 USD 1,000,000 1,060,000 0.72 Mclaren Finance plc, 144A 5.75%
01/08/2022 USD 1,000,000 975,000 0.66
4,714,779 3.20
auto Parts & EquipmentMeritor, Inc., 144A 6.25% 01/06/2025 USD 500,000 540,060 0.37 Titan International, Inc. 6.5% 30/11/2023 USD 1,250,000 1,160,806 0.79 Truck Hero, Inc., 144A 8.5% 21/04/2024 USD 1,100,000 1,171,385 0.79
2,872,251 1.95
BanksFreedom Mortgage Corp., 144A 8.25%
15/04/2025 USD 1,250,000 1,309,375 0.89
1,309,375 0.89
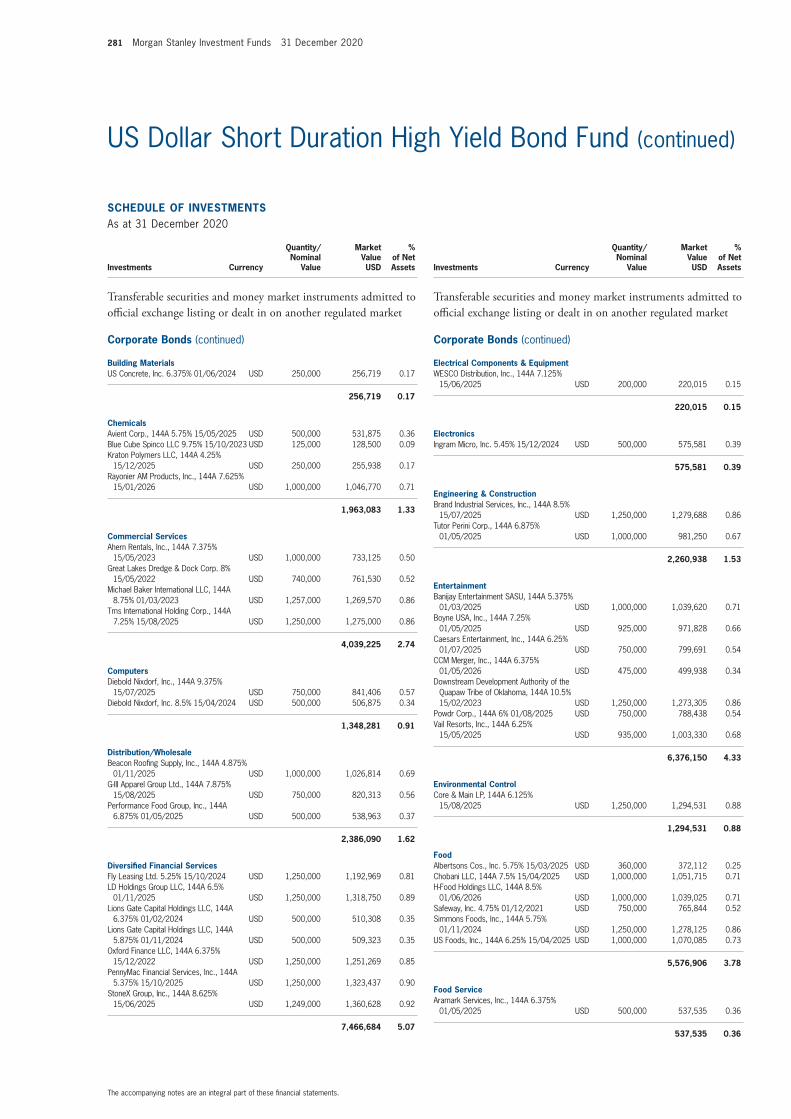
281 Morgan Stanley Investment Funds 31 December 2020
The accompanying notes are an integral part of these financial statements.
US Dollar Short Duration High Yield Bond Fund (continued)
schEDUlE of InVEsTmEnTsAs at 31 December 2020
Investments Currency
Quantity/ Nominal
Value
Market Value USD
% of Net Assets
Transferable securities and money market instruments admitted to official exchange listing or dealt in on another regulated market
corporate Bonds (continued)
Building materialsUS Concrete, Inc. 6.375% 01/06/2024 USD 250,000 256,719 0.17
256,719 0.17
chemicalsAvient Corp., 144A 5.75% 15/05/2025 USD 500,000 531,875 0.36 Blue Cube Spinco LLC 9.75% 15/10/2023 USD 125,000 128,500 0.09 Kraton Polymers LLC, 144A 4.25%
15/12/2025 USD 250,000 255,938 0.17 Rayonier AM Products, Inc., 144A 7.625%
15/01/2026 USD 1,000,000 1,046,770 0.71
1,963,083 1.33
commercial servicesAhern Rentals, Inc., 144A 7.375%
15/05/2023 USD 1,000,000 733,125 0.50 Great Lakes Dredge & Dock Corp. 8%
15/05/2022 USD 740,000 761,530 0.52 Michael Baker International LLC, 144A
8.75% 01/03/2023 USD 1,257,000 1,269,570 0.86 Tms International Holding Corp., 144A
7.25% 15/08/2025 USD 1,250,000 1,275,000 0.86
4,039,225 2.74
computersDiebold Nixdorf, Inc., 144A 9.375%
15/07/2025 USD 750,000 841,406 0.57 Diebold Nixdorf, Inc. 8.5% 15/04/2024 USD 500,000 506,875 0.34
1,348,281 0.91
Distribution/WholesaleBeacon Roofing Supply, Inc., 144A 4.875%
01/11/2025 USD 1,000,000 1,026,814 0.69 G-III Apparel Group Ltd., 144A 7.875%
15/08/2025 USD 750,000 820,313 0.56 Performance Food Group, Inc., 144A
6.875% 01/05/2025 USD 500,000 538,963 0.37
2,386,090 1.62
Diversified financial servicesFly Leasing Ltd. 5.25% 15/10/2024 USD 1,250,000 1,192,969 0.81 LD Holdings Group LLC, 144A 6.5%
01/11/2025 USD 1,250,000 1,318,750 0.89 Lions Gate Capital Holdings LLC, 144A
6.375% 01/02/2024 USD 500,000 510,308 0.35 Lions Gate Capital Holdings LLC, 144A
5.875% 01/11/2024 USD 500,000 509,323 0.35 Oxford Finance LLC, 144A 6.375%
15/12/2022 USD 1,250,000 1,251,269 0.85 PennyMac Financial Services, Inc., 144A
5.375% 15/10/2025 USD 1,250,000 1,323,437 0.90 StoneX Group, Inc., 144A 8.625%
15/06/2025 USD 1,249,000 1,360,628 0.92
7,466,684 5.07
schEDUlE of InVEsTmEnTsAs at 31 December 2020
Investments Currency
Quantity/ Nominal
Value
Market Value USD
% of Net Assets
Transferable securities and money market instruments admitted to official exchange listing or dealt in on another regulated market
corporate Bonds (continued)
Electrical components & EquipmentWESCO Distribution, Inc., 144A 7.125%
15/06/2025 USD 200,000 220,015 0.15
220,015 0.15
ElectronicsIngram Micro, Inc. 5.45% 15/12/2024 USD 500,000 575,581 0.39
575,581 0.39
Engineering & constructionBrand Industrial Services, Inc., 144A 8.5%
15/07/2025 USD 1,250,000 1,279,688 0.86 Tutor Perini Corp., 144A 6.875%
01/05/2025 USD 1,000,000 981,250 0.67
2,260,938 1.53
EntertainmentBanijay Entertainment SASU, 144A 5.375%
01/03/2025 USD 1,000,000 1,039,620 0.71 Boyne USA, Inc., 144A 7.25%
01/05/2025 USD 925,000 971,828 0.66 Caesars Entertainment, Inc., 144A 6.25%
01/07/2025 USD 750,000 799,691 0.54 CCM Merger, Inc., 144A 6.375%
01/05/2026 USD 475,000 499,938 0.34 Downstream Development Authority of the
Quapaw Tribe of Oklahoma, 144A 10.5% 15/02/2023 USD 1,250,000 1,273,305 0.86
Powdr Corp., 144A 6% 01/08/2025 USD 750,000 788,438 0.54 Vail Resorts, Inc., 144A 6.25%
15/05/2025 USD 935,000 1,003,330 0.68
6,376,150 4.33
Environmental controlCore & Main LP, 144A 6.125%
15/08/2025 USD 1,250,000 1,294,531 0.88
1,294,531 0.88
foodAlbertsons Cos., Inc. 5.75% 15/03/2025 USD 360,000 372,112 0.25 Chobani LLC, 144A 7.5% 15/04/2025 USD 1,000,000 1,051,715 0.71 H-Food Holdings LLC, 144A 8.5%
01/06/2026 USD 1,000,000 1,039,025 0.71 Safeway, Inc. 4.75% 01/12/2021 USD 750,000 765,844 0.52 Simmons Foods, Inc., 144A 5.75%
01/11/2024 USD 1,250,000 1,278,125 0.86 US Foods, Inc., 144A 6.25% 15/04/2025 USD 1,000,000 1,070,085 0.73
5,576,906 3.78
food serviceAramark Services, Inc., 144A 6.375%
01/05/2025 USD 500,000 537,535 0.36
537,535 0.36

Morgan Stanley Investment Funds 31 December 2020 282
The accompanying notes are an integral part of these financial statements.
US Dollar Short Duration High Yield Bond Fund (continued)
schEDUlE of InVEsTmEnTsAs at 31 December 2020
Investments Currency
Quantity/ Nominal
Value
Market Value USD
% of Net Assets
Transferable securities and money market instruments admitted to official exchange listing or dealt in on another regulated market
corporate Bonds (continued)
forest Products & PaperSchweitzer-Mauduit International, Inc.,
144A 6.875% 01/10/2026 USD 1,000,000 1,063,560 0.72
1,063,560 0.72
GasLBC Tank Terminals Holding Netherlands
BV, 144A 6.875% 15/05/2023 USD 1,350,000 1,354,219 0.92
1,354,219 0.92
hand/machine ToolsApex Tool Group LLC, 144A 9%
15/02/2023 USD 1,250,000 1,228,125 0.83
1,228,125 0.83
healthcare servicesAcadia Healthcare Co., Inc. 5.625%
15/02/2023 USD 581,000 583,905 0.40 Akumin, Inc., 144A 7% 01/11/2025 USD 1,250,000 1,317,188 0.89 Providence Service Corp. (The), 144A
5.875% 15/11/2025 USD 1,250,000 1,324,218 0.90 RP Escrow Issuer LLC, 144A 5.25%
15/12/2025 USD 800,000 837,048 0.57 Tenet Healthcare Corp. 6.75%
15/06/2023 USD 500,000 536,750 0.36
4,599,109 3.12
holding companies – DiversifiedPetSmart, Inc., 144A 7.125%
15/03/2023 USD 1,250,000 1,251,563 0.85
1,251,563 0.85
home BuildersBeazer Homes USA, Inc. 6.75%
15/03/2025 USD 1,250,000 1,306,056 0.89 Empire Communities Corp., 144A 7%
15/12/2025 USD 1,000,000 1,056,250 0.72 New Home Co., Inc. (The), 144A 7.25%
15/10/2025 USD 1,250,000 1,286,863 0.87 Picasso Finance Sub, Inc., 144A 6.125%
15/06/2025 USD 750,000 806,355 0.55
4,455,524 3.03
home furnishingsTempur Sealy International, Inc. 5.625%
15/10/2023 USD 417,000 425,296 0.29
425,296 0.29
household ProductsSpectrum Brands, Inc. 5.75% 15/07/2025 USD 250,000 258,463 0.18
258,463 0.18
schEDUlE of InVEsTmEnTsAs at 31 December 2020
Investments Currency
Quantity/ Nominal
Value
Market Value USD
% of Net Assets
Transferable securities and money market instruments admitted to official exchange listing or dealt in on another regulated market
corporate Bonds (continued)
housewaresCD&R Smokey Buyer, Inc., 144A 6.75%
15/07/2025 USD 1,000,000 1,070,000 0.73
1,070,000 0.73
InsuranceNMI Holdings, Inc., 144A 7.375%
01/06/2025 USD 1,000,000 1,121,445 0.76 Radian Group, Inc. 4.5% 01/10/2024 USD 750,000 793,125 0.54
1,914,570 1.30
InternetNetflix, Inc. 5.5% 15/02/2022 USD 250,000 262,031 0.18 TripAdvisor, Inc., 144A 7% 15/07/2025 USD 750,000 813,957 0.55
1,075,988 0.73
Investment companiesCompass Group Diversified Holdings LLC,
144A 8% 01/05/2026 USD 1,000,000 1,053,560 0.71
1,053,560 0.71
leisure TimeSabre GLBL, Inc., 144A 9.25%
15/04/2025 USD 600,000 716,298 0.49
716,298 0.49
lodgingFelCor Lodging LP, REIT 6% 01/06/2025 USD 1,000,000 1,018,645 0.69 MGM Resorts International 6%
15/03/2023 USD 750,000 809,250 0.55 Sugarhouse HSP Gaming Prop Mezz LP,
144A 5.875% 15/05/2025 USD 1,207,000 1,191,913 0.81
3,019,808 2.05
machineryClark Equipment Co., 144A 5.875%
01/06/2025 USD 1,000,000 1,058,125 0.72 Cleaver-Brooks, Inc., 144A 7.875%
01/03/2023 USD 1,250,000 1,238,932 0.84 JPW Industries Holding Corp., 144A 9%
01/10/2024 USD 880,000 871,200 0.59 Manitowoc Co., Inc. (The), 144A 9%
01/04/2026 USD 750,000 811,406 0.55
3,979,663 2.70
mediaCCO Holdings LLC, 144A 4% 01/03/2023 USD 750,000 756,094 0.51 Clear Channel Worldwide Holdings, Inc.
9.25% 15/02/2024 USD 1,266,000 1,283,539 0.87 CSC Holdings LLC 5.875% 15/09/2022 USD 450,000 477,281 0.32 CSC Holdings LLC 5.25% 01/06/2024 USD 750,000 813,206 0.55 DISH DBS Corp. 5% 15/03/2023 USD 500,000 516,875 0.35 DISH DBS Corp. 5.875% 15/11/2024 USD 500,000 525,000 0.36 Entercom Media Corp., 144A 7.25%
01/11/2024 USD 1,264,000 1,263,210 0.86

283 Morgan Stanley Investment Funds 31 December 2020
The accompanying notes are an integral part of these financial statements.
US Dollar Short Duration High Yield Bond Fund (continued)
schEDUlE of InVEsTmEnTsAs at 31 December 2020
Investments Currency
Quantity/ Nominal
Value
Market Value USD
% of Net Assets
Transferable securities and money market instruments admitted to official exchange listing or dealt in on another regulated market
corporate Bonds (continued)
media (continued)EW Scripps Co. (The), 144A 5.125%
15/05/2025 USD 1,250,000 1,278,263 0.87 Sirius XM Radio, Inc., 144A 4.625%
15/07/2024 USD 750,000 778,125 0.53 TEGNA, Inc., 144A 4.75% 15/03/2026 USD 850,000 902,063 0.61 Townsquare Media, Inc., 144A 6.875%
01/02/2026 USD 1,250,000 1,309,024 0.90 Univision Communications, Inc., 144A
5.125% 15/02/2025 USD 1,250,000 1,261,719 0.86
11,164,399 7.59
metal fabricate/hardwareGrinding Media, Inc., 144A 7.375%
15/12/2023 USD 1,250,000 1,271,875 0.86
1,271,875 0.86
miningEldorado Gold Corp., 144A 9.5%
01/06/2024 USD 964,000 1,066,323 0.72 FMG Resources August 2006 Pty. Ltd.,
144A 4.75% 15/05/2022 USD 500,000 515,313 0.35 Hudbay Minerals, Inc., 144A 7.625%
15/01/2025 USD 1,000,000 1,040,625 0.71 International Wire Group, Inc., 144A
10.75% 01/08/2021 USD 475,000 475,297 0.32 Kaiser Aluminum Corp., 144A 6.5%
01/05/2025 USD 975,000 1,045,688 0.71
4,143,246 2.81
miscellaneous manufacturersBombardier, Inc., 144A 6.125%
15/01/2023 USD 1,250,000 1,223,125 0.83 FXI Holdings, Inc., 144A 7.875%
01/11/2024 USD 1,238,000 1,250,380 0.85 Hillenbrand, Inc. 5.75% 15/06/2025 USD 750,000 811,875 0.55 Koppers, Inc., 144A 6% 15/02/2025 USD 1,000,000 1,031,875 0.70 SBA Communications Corp., REIT 4.875%
01/09/2024 USD 500,000 513,490 0.35
4,830,745 3.28
oil & GasBaytex Energy Corp., 144A 5.625%
01/06/2024 USD 750,000 518,674 0.35 Continental Resources, Inc. 5%
15/09/2022 USD 1,250,000 1,253,124 0.86 Energy Ventures Gom LLC, 144A 11%
15/02/2023 USD 1,000,000 950,000 0.64 Occidental Petroleum Corp. 5.875%
01/09/2025 USD 2,000,000 2,133,000 1.44 Occidental Petroleum Corp. 3.2%
15/08/2026 USD 1,000,000 936,875 0.63 PBF Holding Co. LLC, 144A 9.25%
15/05/2025 USD 1,000,000 994,310 0.68 Southwestern Energy Co. 4.1%
15/03/2022 USD 325,000 326,142 0.22 Vermilion Energy, Inc., 144A 5.625%
15/03/2025 USD 1,100,000 948,635 0.64
8,060,760 5.46
schEDUlE of InVEsTmEnTsAs at 31 December 2020
Investments Currency
Quantity/ Nominal
Value
Market Value USD
% of Net Assets
Transferable securities and money market instruments admitted to official exchange listing or dealt in on another regulated market
corporate Bonds (continued)
Packaging & containersMauser Packaging Solutions Holding Co.,
144A 7.25% 15/04/2025 USD 1,500,000 1,516,875 1.03 Plastipak Holdings, Inc., 144A 6.25%
15/10/2025 USD 1,000,000 1,031,875 0.70 Reynolds Group Issuer, Inc., 144A 5.125%
15/07/2023 USD 19,000 19,243 0.01
2,567,993 1.74
PharmaceuticalsBausch Health Cos., Inc., 144A 6.125%
15/04/2025 USD 1,100,000 1,131,350 0.77 Endo Dac, 144A 6% 15/07/2023 USD 890,000 759,272 0.52 P&L Development LLC, 144A 7.75%
15/11/2025 USD 1,250,000 1,346,875 0.91 Teva Pharmaceutical Finance Netherlands
III BV 2.8% 21/07/2023 USD 500,000 495,970 0.33 Teva Pharmaceutical Finance Netherlands
III BV 3.15% 01/10/2026 USD 500,000 481,568 0.33
4,215,035 2.86
PipelinesAmerican Midstream Partners LP, 144A
9.5% 15/12/2021 USD 1,150,000 1,142,669 0.77 Blue Racer Midstream LLC, 144A 6.625%
15/07/2026 USD 1,000,000 1,010,000 0.69 Buckeye Partners LP, 144A 4.125%
01/03/2025 USD 750,000 760,313 0.52 Martin Midstream Partners LP, 144A 10%
29/02/2024 USD 189,922 194,195 0.13 Martin Midstream Partners LP, 144A
11.5% 28/02/2025 USD 862,480 834,449 0.57 NuStar Logistics LP 5.75% 01/10/2025 USD 1,000,000 1,056,500 0.72 Rockies Express Pipeline LLC, 144A 3.6%
15/05/2025 USD 1,000,000 1,032,720 0.70 Tallgrass Energy Partners LP, 144A 7.5%
01/10/2025 USD 1,150,000 1,231,219 0.83
7,262,065 4.93
Private EquityIcahn Enterprises LP 6.375% 15/12/2025 USD 500,000 518,500 0.35
518,500 0.35
Real EstateHunt Cos., Inc., 144A 6.25% 15/02/2026 USD 1,250,000 1,284,881 0.87 Kennedy-Wilson, Inc. 5.875% 01/04/2024 USD 1,250,000 1,267,188 0.86
2,552,069 1.73
Real Estate Investment Trusts (REITs)AHP Health Partners, Inc., 144A 9.75%
15/07/2026 USD 1,250,000 1,384,138 0.94 iStar, Inc., REIT 4.75% 01/10/2024 USD 725,000 735,349 0.50 MGM Growth Properties Operating
Partnership LP, 144A 4.625% 15/06/2025 USD 500,000 536,000 0.36
Starwood Property Trust, Inc., 144A 5.5% 01/11/2023 USD 1,000,000 1,046,250 0.71
3,701,737 2.51

Morgan Stanley Investment Funds 31 December 2020 284
The accompanying notes are an integral part of these financial statements.
US Dollar Short Duration High Yield Bond Fund (continued)
schEDUlE of InVEsTmEnTsAs at 31 December 2020
Investments Currency
Quantity/ Nominal
Value
Market Value USD
% of Net Assets
Transferable securities and money market instruments admitted to official exchange listing or dealt in on another regulated market
corporate Bonds (continued)
Retail1011778 BC ULC, 144A 5.75%
15/04/2025 USD 500,000 535,785 0.36 AAG FH LP, 144A 9.75% 15/07/2024 USD 500,000 476,250 0.32 At Home Holding III, Inc., 144A 8.75%
01/09/2025 USD 1,250,000 1,355,468 0.92 Burlington Coat Factory Warehouse Corp.,
144A 6.25% 15/04/2025 USD 500,000 531,875 0.36 Carvana Co., 144A 5.625% 01/10/2025 USD 1,250,000 1,284,375 0.87 Ferrellgas LP, 144A 10% 15/04/2025 USD 750,000 831,563 0.56 Macy’s, Inc., 144A 8.375% 15/06/2025 USD 1,250,000 1,379,924 0.95 Nathan’s Famous, Inc., 144A 6.625%
01/11/2025 USD 1,250,000 1,289,063 0.87 Rite Aid Corp., 144A 6.125% 01/04/2023 USD 925,000 921,531 0.63 Rite Aid Corp., 144A 7.5% 01/07/2025 USD 275,000 287,519 0.20 Sally Holdings LLC 5.5% 01/11/2023 USD 1,250,000 1,260,156 0.86 Yum! Brands, Inc., 144A 7.75%
01/04/2025 USD 250,000 277,188 0.19
10,430,697 7.09
softwareBoxer Parent Co., Inc., 144A 7.125%
02/10/2025 USD 850,000 923,854 0.63 BY Crown Parent LLC, 144A 7.375%
15/10/2024 USD 1,000,000 1,021,145 0.69
1,944,999 1.32
TelecommunicationsSprint Corp. 7.875% 15/09/2023 USD 250,000 289,688 0.20 Sprint Corp. 7.125% 15/06/2024 USD 500,000 584,645 0.39 T-Mobile USA, Inc. 4% 15/04/2022 USD 250,000 258,591 0.18
1,132,924 0.77
TransportationKenan Advantage Group, Inc. (The), 144A
7.875% 31/07/2023 USD 1,000,000 998,855 0.67 Martin Midstream Partners LP 7.25%
15/02/2021 USD 750,000 749,906 0.51 XPO Logistics, Inc., 144A 6.125%
01/09/2023 USD 500,000 509,688 0.35
2,258,449 1.53
Total corporate Bonds 144,188,883 97.85
Total Transferable securities and money market instruments admitted to official exchange listing or dealt in on another regulated market 144,188,883 97.85
schEDUlE of InVEsTmEnTsAs at 31 December 2020
Investments Currency
Quantity/ Nominal
Value
Market Value USD
% of Net Assets
Other transferable securities and money market instruments not admitted to official exchange listing or dealt in on another regulated market
Equities
miningAmerican Gilsonite Co.* USD 72 34,020 0.02
34,020 0.02
Transportationsyncreon Group BV* USD 1,921 88,059 0.06
88,059 0.06
Total Equities 122,079 0.08
Warrants
Transportationsyncreon Group BV 30/11/2020* USD 3,021 46,765 0.03
46,765 0.03
Total Warrants 46,765 0.03
Total other transferable securities and money market instruments not admitted to official exchange listing or dealt in on another regulated market 168,844 0.11
Total Investments 144,357,727 97.96
cash 1,815,884 1.23
other assets/(liabilities) 1,194,280 0.81
Total net assets 147,367,891 100.00
* Security is valued at its fair value under the direction of the Board of Directors.

285 Morgan Stanley Investment Funds 31 December 2020
The accompanying notes are an integral part of these financial statements.
US Dollar Short Duration High Yield Bond Fund (continued)
forward currency Exchange contracts
currency Purchased
amount Purchased
currency sold
amount sold
maturity Date counterparty
Unrealised Gain/(loss)
UsD
% of net assets
EUR hedged share classEUR 10,170 USD 12,476 04/01/2021 J.P. Morgan 1 0.00USD 45,249 EUR 36,798 05/01/2021 J.P. Morgan 100 0.00EUR 8,046,825 USD 9,788,493 08/01/2021 J.P. Morgan 85,269 0.06
Unrealised Gain on naV hedged share classes forward currency Exchange contracts – assets 85,370 0.06
Total Unrealised Gain on forward currency Exchange contracts – assets 85,370 0.06
EUR hedged share classUSD 12,476 EUR 10,170 04/01/2021 J.P. Morgan (2) 0.00EUR 36,798 USD 45,253 08/01/2021 J.P. Morgan (100) 0.00USD 182,269 EUR 149,701 08/01/2021 J.P. Morgan (1,420) 0.00
Unrealised loss on naV hedged share classes forward currency Exchange contracts – liabilities (1,522) 0.00
Total Unrealised loss on forward currency Exchange contracts – liabilities (1,522) 0.00
net Unrealised Gain on forward currency Exchange contracts – assets 83,848 0.06
DERIVaTIVEs
Over-the-counter (OTC) and exchange traded derivatives as at 31 December 2020, expressed in US Dollars.

Morgan Stanley Investment Funds 31 December 2020 286
The accompanying notes are an integral part of these financial statements.
Please refer to the full prospectus for the Fund’s investment objective and policy.
Global Balanced Defensive Fund
InVEsTmEnT aIm
To provide an attractive level of total return, measured in Euro, by investing primarily in portfolio of transferable securities such as equity securities, including closed-end Real Estate Investment Trusts (REITS); Fixed Income Securities (including investment grade, non-investment grade and unrated) and money market instruments and cash globally and through the use of financial derivative instruments. The investments will target total portfolio risk and volatility below that of the Global Balanced Fund.
schEDUlE of InVEsTmEnTsAs at 31 December 2020
Investments Currency
Quantity/ Nominal
Value
Market Value EUR
% of Net Assets
Transferable securities and money market instruments admitted to official exchange listing or dealt in on another regulated market
corporate Bonds
australiaAurizon Network Pty. Ltd., Reg. S 3.125%
01/06/2026 EUR 100,000 114,765 0.19 BHP Billiton Finance Ltd., Reg. S, FRN
4.75% 22/04/2076 EUR 100,000 101,360 0.17 Commonwealth Bank of Australia, Reg. S,
FRN 2% 22/04/2027 EUR 100,000 102,213 0.17
318,338 0.53
austriaCA Immobilien Anlagen AG, Reg. S 1%
27/10/2025 EUR 100,000 101,889 0.17 CA Immobilien Anlagen AG, Reg. S 0.875%
05/02/2027 EUR 100,000 100,678 0.17
202,567 0.34
chinaChina Merchants Bank Co. Ltd., Reg. S
0.25% 19/06/2022 EUR 100,000 99,660 0.17 State Grid Overseas Investment 2016 Ltd.,
Reg. S 0.797% 05/08/2026 EUR 100,000 101,594 0.17
201,254 0.34
DenmarkDanske Bank A/S, Reg. S, FRN 1.375%
12/02/2030 EUR 100,000 101,682 0.17 STG Global Finance BV, Reg. S 1.375%
24/09/2025 EUR 100,000 101,959 0.17
203,641 0.34
finlandKojamo OYJ, Reg. S 1.875% 27/05/2027 EUR 100,000 108,171 0.18 Sampo OYJ, Reg. S 2.5% 03/09/2052 EUR 100,000 108,457 0.18
216,628 0.36
franceAXA SA, Reg. S, FRN 3.25% 28/05/2049 EUR 100,000 117,183 0.20 BNP Paribas Cardif SA, Reg. S, FRN
4.032% Perpetual EUR 100,000 113,688 0.19 Bureau Veritas SA, Reg. S 1.125%
18/01/2027 EUR 100,000 102,636 0.17 Credit Agricole Assurances SA, Reg. S,
FRN 4.5% Perpetual EUR 100,000 114,688 0.19 Credit Agricole SA, Reg. S 4%
31/12/2164 EUR 100,000 108,494 0.18 Orange SA, Reg. S, FRN 2.375% Perpetual EUR 100,000 105,625 0.18 SEB SA, Reg. S 1.375% 16/06/2025 EUR 100,000 103,199 0.18 Unibail-Rodamco-Westfield SE, REIT, Reg. S
2.625% 09/04/2030 EUR 100,000 113,869 0.19
879,382 1.48
GermanyBayer AG, Reg. S, FRN 3.125% 12/11/2079 EUR 100,000 105,252 0.18 Muenchener Rueckversicherungs-Gesellschaft
AG, Reg. S 1.25% 26/05/2041 EUR 100,000 104,032 0.17 Volkswagen International Finance NV,
Reg. S 4.125% 16/11/2038 EUR 100,000 143,612 0.24
Asset Allocation Funds

287 Morgan Stanley Investment Funds 31 December 2020
The accompanying notes are an integral part of these financial statements.
Global Balanced Defensive Fund (continued)
schEDUlE of InVEsTmEnTsAs at 31 December 2020
Investments Currency
Quantity/ Nominal
Value
Market Value EUR
% of Net Assets
Transferable securities and money market instruments admitted to official exchange listing or dealt in on another regulated market
corporate Bonds (continued)
Germany (continued)Volkswagen International Finance NV,
Reg. S, FRN 2.7% Perpetual EUR 100,000 102,312 0.17 Vonovia Finance BV, Reg. S, FRN 4% Perpetual EUR 100,000 103,539 0.17 Wintershall Dea Finance BV, Reg. S
0.452% 25/09/2023 EUR 100,000 100,907 0.17 Wintershall Dea Finance BV, Reg. S
1.823% 25/09/2031 EUR 100,000 105,478 0.18
765,132 1.28
hong KongCheung Kong Infrastructure Finance BVI
Ltd., Reg. S 1% 12/12/2024 EUR 100,000 101,460 0.17
101,460 0.17
IrelandBank of Ireland Group plc, Reg. S, FRN
0.75% 08/07/2024 EUR 100,000 101,663 0.17 Dell Bank International DAC, Reg. S
0.625% 17/10/2022 EUR 100,000 100,951 0.17 Ryanair DAC, Reg. S 2.875% 15/09/2025 EUR 100,000 107,171 0.18
309,785 0.52
ItalyAssicurazioni Generali SpA, Reg. S 2.429%
14/07/2031 EUR 100,000 109,788 0.18 Assicurazioni Generali SpA, Reg. S, FRN
5.5% 27/10/2047 EUR 100,000 123,450 0.21 Enel SpA, Reg. S, FRN 2.5% 24/11/2078 EUR 100,000 104,625 0.18 FCA Bank SpA, Reg. S 0.25%
28/02/2023 EUR 100,000 100,410 0.17 UniCredit SpA, Reg. S, FRN 1.25%
25/06/2025 EUR 100,000 103,380 0.17
541,653 0.91
JapanNissan Motor Co. Ltd., Reg. S 1.94%
15/09/2023 EUR 100,000 104,300 0.18
104,300 0.18
luxembourgBlackstone Property Partners Europe
Holdings Sarl, Reg. S 1.25% 26/04/2027 EUR 100,000 102,560 0.17 Logicor Financing Sarl, Reg. S 1.5%
13/07/2026 EUR 100,000 105,644 0.18 SELP Finance Sarl, REIT, Reg. S 1.5%
20/12/2026 EUR 100,000 107,464 0.18
315,668 0.53
netherlandsASR Nederland NV, Reg. S, FRN 5% Perpetual EUR 100,000 113,088 0.19 NN Group NV, Reg. S, FRN 4.625%
08/04/2044 EUR 100,000 112,650 0.19 Shell International Finance BV, Reg. S
1.25% 11/11/2032 EUR 100,000 110,750 0.18 Signify NV, Reg. S 2% 11/05/2024 EUR 100,000 105,808 0.18
442,296 0.74
schEDUlE of InVEsTmEnTsAs at 31 December 2020
Investments Currency
Quantity/ Nominal
Value
Market Value EUR
% of Net Assets
Transferable securities and money market instruments admitted to official exchange listing or dealt in on another regulated market
corporate Bonds (continued)
singaporeDBS Group Holdings Ltd., Reg. S, FRN
1.5% 11/04/2028 EUR 100,000 102,130 0.17
102,130 0.17
spainAbertis Infraestructuras SA, Reg. S
2.375% 27/09/2027 EUR 100,000 110,876 0.19 Amadeus IT Group SA, Reg. S 1.875%
24/09/2028 EUR 100,000 106,834 0.18 Banco Bilbao Vizcaya Argentaria SA,
Reg. S, FRN 1% 16/01/2030 EUR 100,000 100,027 0.17 Banco Santander SA, Reg. S 3.125%
19/01/2027 EUR 100,000 114,371 0.19 CaixaBank SA, Reg. S, FRN 2.25%
17/04/2030 EUR 100,000 104,749 0.18 Iberdrola International BV, Reg. S, FRN
1.875% Perpetual EUR 100,000 102,813 0.17 Inmobiliaria Colonial Socimi SA, Reg. S
1.35% 14/10/2028 EUR 100,000 103,487 0.17 NorteGas Energia Distribucion SA, Reg. S
0.918% 28/09/2022 EUR 100,000 101,161 0.17 Redexis Gas Finance BV, Reg. S 1.875%
28/05/2025 EUR 100,000 106,625 0.18
950,943 1.60
swedenAkelius Residential Property Financing BV,
Reg. S 1% 17/01/2028 EUR 100,000 103,207 0.17
103,207 0.17
switzerlandSyngenta Finance NV, Reg. S 3.375%
16/04/2026 EUR 100,000 108,183 0.18
108,183 0.18
United KingdomAnnington Funding plc, Reg. S 1.65%
12/07/2024 EUR 100,000 105,037 0.18 BP Capital Markets plc, Reg. S, FRN
3.25% Perpetual EUR 100,000 106,875 0.18 BP Capital Markets plc, Reg. S, FRN
3.625% Perpetual EUR 100,000 109,625 0.18 CNH Industrial Finance Europe SA, Reg. S
0% 01/04/2024 EUR 100,000 99,928 0.17 Imperial Brands Finance plc, Reg. S
2.125% 12/02/2027 EUR 100,000 108,397 0.18 Informa plc, Reg. S 1.5% 05/07/2023 EUR 100,000 102,580 0.17 Lloyds Banking Group plc, Reg. S, FRN
0.625% 15/01/2024 EUR 100,000 101,157 0.17 Lloyds Banking Group plc, Reg. S, FRN
1.75% 07/09/2028 EUR 100,000 103,019 0.17 NGG Finance plc, Reg. S, FRN 1.625%
05/12/2079 EUR 100,000 101,875 0.17 Santander UK Group Holdings plc, Reg. S,
FRN 0.391% 28/02/2025 EUR 100,000 100,886 0.17
1,039,379 1.74

Morgan Stanley Investment Funds 31 December 2020 288
The accompanying notes are an integral part of these financial statements.
Global Balanced Defensive Fund (continued)
schEDUlE of InVEsTmEnTsAs at 31 December 2020
Investments Currency
Quantity/ Nominal
Value
Market Value EUR
% of Net Assets
Transferable securities and money market instruments admitted to official exchange listing or dealt in on another regulated market
corporate Bonds (continued)
United states of americaBank of America Corp., Reg. S, FRN
3.648% 31/03/2029 EUR 100,000 124,462 0.21 Becton Dickinson Euro Finance Sarl
0.632% 04/06/2023 EUR 100,000 101,478 0.17 Capital One Financial Corp. 0.8%
12/06/2024 EUR 100,000 102,369 0.17 Discovery Communications LLC 1.9%
19/03/2027 EUR 100,000 107,279 0.18 DXC Technology Co. 1.75% 15/01/2026 EUR 100,000 102,836 0.17 General Electric Co. 0.875% 17/05/2025 EUR 100,000 103,055 0.17 Liberty Mutual Group, Inc., Reg. S, FRN
3.625% 23/05/2059 EUR 100,000 103,472 0.17 Thermo Fisher Scientific, Inc. 1.875%
01/10/2049 EUR 100,000 116,189 0.20 Upjohn Finance BV, Reg. S 1.362%
23/06/2027 EUR 100,000 106,123 0.18
967,263 1.62
Total corporate Bonds 7,873,209 13.20
Government Bonds
franceFrance Government Bond OAT, Reg. S 0%
25/02/2021 EUR 301,000 301,334 0.51 France Government Bond OAT, Reg. S
2.25% 25/05/2024 EUR 656,000 723,011 1.21 France Government Bond OAT, Reg. S
3.4% 25/07/2029 EUR 312,000 580,327 0.97 France Government Bond OAT, Reg. S
2.5% 25/05/2030 EUR 1,983,000 2,533,539 4.25
4,138,211 6.94
GermanyBundesobligation, Reg. S 0% 05/04/2024 EUR 986,000 1,011,200 1.70 Bundesrepublik Deutschland, Reg. S 5.5%
04/01/2031 EUR 604,000 985,369 1.65
1,996,569 3.35
ItalyItaly Buoni Poliennali Del Tesoro, Reg. S
0.45% 01/06/2021 EUR 470,000 471,857 0.79 Italy Buoni Poliennali Del Tesoro, Reg. S
1.75% 01/07/2024 EUR 1,060,000 1,133,480 1.90 Italy Buoni Poliennali Del Tesoro, Reg. S
1.35% 01/04/2030 EUR 1,082,000 1,171,419 1.97
2,776,756 4.66
JapanJapan Government Twenty Year Bond 2.2%
20/03/2030 JPY 182,600,000 1,738,229 2.92 Japan Government Twenty Year Bond 1.7%
20/06/2033 JPY 198,050,000 1,868,714 3.13
3,606,943 6.05
schEDUlE of InVEsTmEnTsAs at 31 December 2020
Investments Currency
Quantity/ Nominal
Value
Market Value EUR
% of Net Assets
Transferable securities and money market instruments admitted to official exchange listing or dealt in on another regulated market
Government Bonds (continued)
spainSpain Government Bond 0.05%
31/01/2021 EUR 168,000 168,094 0.28 Spain Government Bond, Reg. S, 144A
3.8% 30/04/2024 EUR 1,526,000 1,748,790 2.93 Spain Government Bond, Reg. S, 144A
1.95% 30/07/2030 EUR 585,000 694,159 1.17
2,611,043 4.38
United KingdomUK Treasury, Reg. S 4.75% 07/12/2038 GBP 496,000 947,408 1.59 UK Treasury, Reg. S 4.25% 07/06/2032 GBP 31,000 49,830 0.08
997,238 1.67
United states of americaUS Treasury 1.75% 31/01/2023 USD 3,508,000 2,955,642 4.96 US Treasury 2.5% 31/01/2024 USD 287,000 250,627 0.42 US Treasury 2.5% 15/05/2024 USD 1,967,000 1,727,860 2.90 US Treasury 1.625% 15/05/2026 USD 2,166,000 1,879,358 3.15 US Treasury 2.625% 15/02/2029 USD 4,980,000 4,656,770 7.81 US Treasury 2.375% 15/05/2029 USD 1,469,000 1,352,421 2.27 US Treasury Inflation Indexed 0.125%
15/07/2024 USD 551,000 526,828 0.88 US Treasury Inflation Indexed 2.125%
15/02/2040 USD 253,000 384,123 0.65
13,733,629 23.04
Total Government Bonds 29,860,389 50.09
Warrants
switzerlandCie Financiere Richemont SA 22/11/2023 CHF 862 184 0.00
184 0.00
Total Warrants 184 0.00
Equities
argentinaGlobant SA USD 41 7,208 0.01
7,208 0.01
austriaANDRITZ AG EUR 171 6,369 0.01 Erste Group Bank AG EUR 342 8,587 0.01 OMV AG EUR 1,184 38,488 0.06 Verbund AG EUR 242 16,809 0.03 voestalpine AG EUR 133 3,866 0.01
74,119 0.12
BelgiumKBC Group NV EUR 191 10,940 0.02 UCB SA EUR 189 15,967 0.03
26,907 0.05

289 Morgan Stanley Investment Funds 31 December 2020
The accompanying notes are an integral part of these financial statements.
Global Balanced Defensive Fund (continued)
schEDUlE of InVEsTmEnTsAs at 31 December 2020
Investments Currency
Quantity/ Nominal
Value
Market Value EUR
% of Net Assets
Transferable securities and money market instruments admitted to official exchange listing or dealt in on another regulated market
Equities (continued)
BrazilAtacadao SA BRL 1,600 4,857 0.01 Banco Bradesco SA BRL 6,000 22,721 0.04 Banco Bradesco SA Preference BRL 297 1,262 0.00 Banco do Brasil SA BRL 600 3,661 0.01 Banco Santander Brasil SA BRL 2,700 19,010 0.03 CCR SA BRL 600 1,265 0.00 Cia Brasileira de Distribuicao BRL 200 2,354 0.00 Cia Energetica de Minas Gerais Preference BRL 1,561 3,569 0.01 Cosan SA BRL 400 4,736 0.01 CPFL Energia SA BRL 400 2,042 0.00 Engie Brasil Energia SA BRL 100 689 0.00 Klabin SA BRL 1,900 7,837 0.01 Localiza Rent a Car SA BRL 100 1,080 0.00 Lojas Renner SA BRL 700 4,767 0.01 Magazine Luiza SA BRL 900 3,512 0.01 Natura & Co. Holding SA BRL 600 4,921 0.01 Rumo SA BRL 300 901 0.00 Ultrapar Participacoes SA BRL 900 3,333 0.01 Via Varejo S/A BRL 2,700 6,815 0.01 WEG SA BRL 30 356 0.00
99,688 0.17
china3SBio, Inc., Reg. S HKD 4,000 2,973 0.01 51job, Inc., ADR USD 50 2,783 0.01 Agricultural Bank of China Ltd. ‘H’ HKD 75,000 22,389 0.04 Alibaba Group Holding Ltd., ADR USD 673 129,368 0.22 Baidu, Inc., ADR USD 103 18,220 0.03 Baozun, Inc., ADR USD 147 4,023 0.01 Beijing Enterprises Water Group Ltd. HKD 4,000 1,312 0.00 BYD Co. Ltd. ‘H’ HKD 500 10,680 0.02 BYD Electronic International Co. Ltd. HKD 1,000 4,268 0.01 CGN Power Co. Ltd., Reg. S ‘H’ HKD 10,000 1,755 0.00 China Conch Venture Holdings Ltd. HKD 1,500 5,944 0.01 China Construction Bank Corp. ‘H’ HKD 19,000 11,763 0.02 China East Education Holdings Ltd., Reg. S HKD 2,000 3,919 0.01 China Everbright Bank Co. Ltd. ‘H’ HKD 10,000 3,101 0.01 China Everbright Environment Group Ltd. HKD 2,000 921 0.00 China Evergrande Group HKD 1,000 1,566 0.00 China Gas Holdings Ltd. HKD 400 1,295 0.00 China Lesso Group Holdings Ltd. HKD 1,000 1,276 0.00 China Literature Ltd., Reg. S HKD 400 2,559 0.00 China Longyuan Power Group Corp. Ltd. ‘H’ HKD 8,000 6,534 0.01 China Medical System Holdings Ltd. HKD 3,000 2,731 0.00 China Mobile Ltd. HKD 3,000 13,938 0.02 China Molybdenum Co. Ltd. ‘H’ HKD 36,000 19,147 0.03 China Overseas Land & Investment Ltd. HKD 2,500 4,431 0.01 China Petroleum & Chemical Corp. ‘H’ HKD 20,000 7,295 0.01 China Railway Construction Corp. Ltd. ‘H’ HKD 2,000 891 0.00 China Railway Signal & Communication
Corp. Ltd., Reg. S ‘H’ HKD 33,000 9,019 0.02 China Resources Land Ltd. HKD 2,000 6,727 0.01 China State Construction International
Holdings Ltd. HKD 2,000 929 0.00 China Vanke Co. Ltd. ‘H’ HKD 2,200 6,186 0.01 COSCO SHIPPING Energy
Transportation Co. Ltd. ‘H’ HKD 22,000 7,053 0.01 CRRC Corp. Ltd. ‘H’ HKD 4,000 1,123 0.00 CSPC Pharmaceutical Group Ltd. HKD 4,480 3,734 0.01 Dongfeng Motor Group Co. Ltd. ‘H’ HKD 30,000 28,507 0.05 ENN Energy Holdings Ltd. HKD 200 2,392 0.00 Fosun International Ltd. HKD 1,500 1,920 0.00 Fuyao Glass Industry Group Co. Ltd., Reg. S ‘H’ HKD 2,400 10,747 0.02
schEDUlE of InVEsTmEnTsAs at 31 December 2020
Investments Currency
Quantity/ Nominal
Value
Market Value EUR
% of Net Assets
Transferable securities and money market instruments admitted to official exchange listing or dealt in on another regulated market
Equities (continued)
china (continued)GDS Holdings Ltd., ADR USD 32 2,431 0.00 Geely Automobile Holdings Ltd. HKD 6,000 16,713 0.03 GOME Retail Holdings Ltd. HKD 73,000 7,136 0.01 GSX Techedu, Inc., ADR USD 31 1,289 0.00 Haitong Securities Co. Ltd. ‘H’ HKD 4,000 2,914 0.01 Huazhu Group Ltd., ADR USD 98 3,594 0.01 JD.com, Inc., ADR USD 164 11,753 0.02 Koolearn Technology Holding Ltd., Reg. S HKD 3,500 10,264 0.02 Lee & Man Paper Manufacturing Ltd. HKD 3,000 2,002 0.00 Lenovo Group Ltd. HKD 18,000 13,850 0.02 Li Ning Co. Ltd. HKD 500 2,801 0.01 Logan Group Co. Ltd. HKD 1,000 1,335 0.00 Longfor Group Holdings Ltd., Reg. S HKD 500 2,386 0.00 Luye Pharma Group Ltd., Reg. S HKD 7,000 2,656 0.00 Meituan Dianping, Reg. S ‘B’ HKD 1,000 30,966 0.05 NetEase, Inc., ADR USD 85 6,623 0.01 Ping An Healthcare and Technology Co.
Ltd., Reg. S HKD 300 2,964 0.01 Ping An Insurance Group Co. of China Ltd. ‘H’ HKD 8,500 84,879 0.14 Semiconductor Manufacturing International Corp. HKD 3,000 6,969 0.01 Shanghai Electric Group Co. Ltd. ‘H’ HKD 18,000 4,503 0.01 Shanghai Pharmaceuticals Holding Co. Ltd. ‘H’ HKD 10,400 14,933 0.03 Shenzhen Investment Ltd. HKD 8,000 2,237 0.00 Shenzhou International Group Holdings Ltd. HKD 500 7,989 0.01 Sinopharm Group Co. Ltd. ‘H’ HKD 2,000 3,965 0.01 Sun Art Retail Group Ltd. HKD 1,500 1,242 0.00 Sunac China Holdings Ltd. HKD 1,000 3,012 0.01 Sunny Optical Technology Group Co. Ltd. HKD 300 5,351 0.01 TAL Education Group, ADR USD 54 3,163 0.01 Tencent Holdings Ltd. HKD 1,600 94,854 0.16 Tencent Music Entertainment Group, ADR USD 109 1,672 0.00 Tongcheng-Elong Holdings Ltd., Reg. S HKD 7,200 11,352 0.02 Trip.com Group Ltd., ADR USD 401 10,867 0.02 Weichai Power Co. Ltd. ‘H’ HKD 2,000 3,271 0.01 Wuxi Biologics Cayman, Inc., Reg. S HKD 3,000 32,417 0.05 Xiaomi Corp., Reg. S ‘B’ HKD 2,600 9,073 0.02 Xinyi Solar Holdings Ltd. HKD 14,000 29,800 0.05 Yum China Holdings, Inc. USD 99 4,616 0.01 Yuzhou Group Holdings Co. Ltd. HKD 4,000 1,177 0.00 Zhaojin Mining Industry Co. Ltd. ‘H’ HKD 2,000 1,940 0.00 ZhongAn Online P&C Insurance Co. Ltd., Reg. S ‘H’ HKD 2,000 7,610 0.01 Zhuzhou CRRC Times Electric Co. Ltd. ‘H’ HKD 400 1,421 0.00 ZTE Corp. ‘H’ HKD 1,800 3,690 0.01 ZTO Express Cayman, Inc., ADR USD 37 873 0.00
837,972 1.41
colombiaInterconexion Electrica SA ESP COP 263 1,614 0.00
1,614 0.00
DenmarkGenmab A/S DKK 81 26,510 0.04 H Lundbeck A/S DKK 454 12,683 0.02 Novo Nordisk A/S ‘B’ DKK 2,098 118,978 0.20 Novozymes A/S ‘B’ DKK 345 16,071 0.03 Orsted A/S, Reg. S DKK 103 17,020 0.03 Pandora A/S DKK 87 7,907 0.01 Tryg A/S DKK 133 3,414 0.01 Vestas Wind Systems A/S DKK 57 10,977 0.02
213,560 0.36

Morgan Stanley Investment Funds 31 December 2020 290
The accompanying notes are an integral part of these financial statements.
Global Balanced Defensive Fund (continued)
schEDUlE of InVEsTmEnTsAs at 31 December 2020
Investments Currency
Quantity/ Nominal
Value
Market Value EUR
% of Net Assets
Transferable securities and money market instruments admitted to official exchange listing or dealt in on another regulated market
Equities (continued)
finlandNeste OYJ EUR 234 13,821 0.02 Nokia OYJ EUR 4,415 13,889 0.02 UPM-Kymmene OYJ EUR 677 20,600 0.04
48,310 0.08
franceAirbus SE EUR 313 28,101 0.05 Alstom SA EUR 72 3,356 0.01 Amundi SA, Reg. S EUR 84 5,611 0.01 Atos SE EUR 186 13,909 0.02 AXA SA EUR 1,413 27,570 0.05 BNP Paribas SA EUR 853 36,769 0.06 Capgemini SE EUR 161 20,415 0.03 Carrefour SA EUR 2,762 38,751 0.07 Cie Generale des Etablissements Michelin SCA EUR 85 8,921 0.02 Dassault Systemes SE EUR 149 24,756 0.04 EssilorLuxottica SA EUR 42 5,357 0.01 Gecina SA, REIT EUR 231 29,175 0.05 Getlink SE EUR 608 8,621 0.02 Kering SA EUR 4 2,378 0.00 Legrand SA EUR 180 13,140 0.02 L’Oreal SA EUR 214 66,511 0.11 LVMH Moet Hennessy Louis Vuitton SE EUR 108 55,177 0.09 Natixis SA EUR 1,881 5,246 0.01 Orange SA EUR 620 6,035 0.01 Orpea SA EUR 72 7,744 0.01 Pernod Ricard SA EUR 388 60,838 0.10 Publicis Groupe SA EUR 151 6,155 0.01 Sanofi EUR 446 35,100 0.06 Schneider Electric SE EUR 259 30,640 0.05 Societe Generale SA EUR 436 7,422 0.01 Teleperformance EUR 29 7,868 0.01 Thales SA EUR 151 11,310 0.02 TOTAL SE EUR 1,789 63,152 0.11 Valeo SA EUR 890 28,729 0.05 Vinci SA EUR 241 19,608 0.03 Vivendi SA EUR 284 7,492 0.01
685,857 1.15
Germanyadidas AG EUR 157 46,456 0.08 Allianz SE EUR 180 35,794 0.06 BASF SE EUR 110 7,050 0.01 Beiersdorf AG EUR 438 42,174 0.07 Brenntag AG EUR 212 13,371 0.02 Deutsche Boerse AG EUR 111 15,327 0.03 Deutsche Post AG EUR 594 23,993 0.04 Fresenius SE & Co. KGaA EUR 759 28,462 0.05 KION Group AG EUR 108 7,637 0.01 Merck KGaA EUR 179 24,971 0.04 MTU Aero Engines AG EUR 77 16,354 0.03 SAP SE EUR 496 52,689 0.09 Siemens AG EUR 483 56,423 0.09 thyssenkrupp AG EUR 1,372 10,999 0.02 Zalando SE, Reg. S EUR 8 723 0.00
382,423 0.64
hong KongAIA Group Ltd. HKD 3,400 33,952 0.06 BeiGene Ltd., ADR USD 6 1,242 0.00 BOC Hong Kong Holdings Ltd. HKD 5,000 12,351 0.02 CK Hutchison Holdings Ltd. HKD 500 2,843 0.01
schEDUlE of InVEsTmEnTsAs at 31 December 2020
Investments Currency
Quantity/ Nominal
Value
Market Value EUR
% of Net Assets
Transferable securities and money market instruments admitted to official exchange listing or dealt in on another regulated market
Equities (continued)
hong Kong (continued)CLP Holdings Ltd. HKD 500 3,768 0.01 Dairy Farm International Holdings Ltd. USD 1,100 3,739 0.01 Henderson Land Development Co. Ltd. HKD 100 318 0.00 HK Electric Investments & HK Electric
Investments Ltd., Reg. S HKD 500 401 0.00 Hong Kong Exchanges & Clearing Ltd. HKD 50 2,234 0.00 Link REIT HKD 317 2,352 0.00 MTR Corp. Ltd. HKD 1,646 7,500 0.01 New World Development Co. Ltd. HKD 263 998 0.00 Power Assets Holdings Ltd. HKD 500 2,207 0.00 Sino Land Co. Ltd. HKD 2,191 2,326 0.00 Sun Hung Kai Properties Ltd. HKD 500 5,256 0.01 Sunac Services Holdings Ltd., Reg. S HKD 32 58 0.00 Swire Properties Ltd. HKD 1,800 4,266 0.01
85,811 0.14
hungaryMOL Hungarian Oil & Gas plc HUF 682 4,101 0.01
4,101 0.01
IndonesiaAstra International Tbk. PT IDR 3,300 1,148 0.00 Bank Negara Indonesia Persero Tbk. PT IDR 12,200 4,348 0.01 Bank Rakyat Indonesia Persero Tbk. PT IDR 78,800 18,967 0.03 Barito Pacific Tbk. PT IDR 77,000 4,889 0.01 Unilever Indonesia Tbk. PT IDR 4,500 1,910 0.00 XL Axiata Tbk. PT IDR 62,600 9,864 0.02
41,126 0.07
IrelandCRH plc EUR 458 15,581 0.03
15,581 0.03
ItalyEnel SpA EUR 4,512 37,297 0.06 Intesa Sanpaolo SpA EUR 22,813 43,740 0.07 Prysmian SpA EUR 329 9,525 0.02 Telecom Italia SpA EUR 13,686 5,769 0.01 Terna Rete Elettrica Nazionale SpA EUR 496 3,094 0.01
99,425 0.17
JapanAdvantest Corp. JPY 200 12,205 0.02 Aeon Co. Ltd. JPY 1,600 42,798 0.07 Alfresa Holdings Corp. JPY 2,700 40,252 0.07 Asahi Kasei Corp. JPY 1,400 11,650 0.02 Astellas Pharma, Inc. JPY 3,100 39,004 0.07 Benesse Holdings, Inc. JPY 900 14,309 0.02 Chubu Electric Power Co., Inc. JPY 1,100 10,807 0.02 Chugai Pharmaceutical Co. Ltd. JPY 1,200 52,087 0.09 Dai Nippon Printing Co. Ltd. JPY 1,200 17,562 0.03 Daifuku Co. Ltd. JPY 200 20,174 0.03 Dai-ichi Life Holdings, Inc. JPY 1,200 14,663 0.02 Daiichi Sankyo Co. Ltd. JPY 1,300 36,288 0.06 Daikin Industries Ltd. JPY 200 36,324 0.06 Daiwa House Industry Co. Ltd. JPY 1,500 36,296 0.06 East Japan Railway Co. JPY 800 43,531 0.07 Eisai Co. Ltd. JPY 400 23,303 0.04 ENEOS Holdings, Inc. JPY 3,500 10,237 0.02

291 Morgan Stanley Investment Funds 31 December 2020
The accompanying notes are an integral part of these financial statements.
Global Balanced Defensive Fund (continued)
schEDUlE of InVEsTmEnTsAs at 31 December 2020
Investments Currency
Quantity/ Nominal
Value
Market Value EUR
% of Net Assets
Transferable securities and money market instruments admitted to official exchange listing or dealt in on another regulated market
Equities (continued)
Japan (continued)Fast Retailing Co. Ltd. JPY 100 73,125 0.12 FUJIFILM Holdings Corp. JPY 500 21,514 0.04 Fujitsu Ltd. JPY 200 23,521 0.04 Hamamatsu Photonics KK JPY 700 32,588 0.05 Hankyu Hanshin Holdings, Inc. JPY 900 24,380 0.04 Hitachi Construction Machinery Co. Ltd. JPY 300 6,942 0.01 Hitachi Ltd. JPY 800 25,668 0.04 Honda Motor Co. Ltd. JPY 700 16,077 0.03 Inpex Corp. JPY 1,200 5,270 0.01 ITOCHU Corp. JPY 3,400 79,508 0.13 Japan Post Holdings Co. Ltd. JPY 1,500 9,501 0.02 Kansai Electric Power Co., Inc. (The) JPY 900 6,929 0.01 Kansai Paint Co. Ltd. JPY 300 7,527 0.01 Kao Corp. JPY 200 12,572 0.02 Kawasaki Heavy Industries Ltd. JPY 1,700 31,188 0.05 KDDI Corp. JPY 5,300 127,781 0.21 Keyence Corp. JPY 100 45,844 0.08 Kikkoman Corp. JPY 200 11,319 0.02 Kobayashi Pharmaceutical Co. Ltd. JPY 100 9,963 0.02 Kobe Bussan Co. Ltd. JPY 300 7,524 0.01 Koito Manufacturing Co. Ltd. JPY 1,000 55,460 0.09 Komatsu Ltd. JPY 1,300 29,049 0.05 Kose Corp. JPY 100 13,884 0.02 Kyocera Corp. JPY 300 14,992 0.03 Kyushu Railway Co. JPY 900 15,819 0.03 Lawson, Inc. JPY 900 34,144 0.06 Lion Corp. JPY 700 13,814 0.02 Marubeni Corp. JPY 1,400 7,579 0.01 Marui Group Co. Ltd. JPY 900 12,870 0.02 Mitsui Chemicals, Inc. JPY 500 11,946 0.02 Mitsui Fudosan Co. Ltd. JPY 1,600 27,216 0.05 Mizuho Financial Group, Inc. JPY 2,590 26,738 0.04 MS&AD Insurance Group Holdings, Inc. JPY 900 22,317 0.04 Murata Manufacturing Co. Ltd. JPY 300 22,084 0.04 Nabtesco Corp. JPY 400 14,317 0.02 NGK Insulators Ltd. JPY 100 1,255 0.00 Nidec Corp. JPY 200 20,533 0.03 Nikon Corp. JPY 900 4,617 0.01 Nippon Express Co. Ltd. JPY 300 16,425 0.03 Nippon Paint Holdings Co. Ltd. JPY 100 8,944 0.02 Nippon Prologis REIT, Inc. JPY 5 12,735 0.02 Nippon Telegraph & Telephone Corp. JPY 1,400 29,242 0.05 Nippon Yusen KK JPY 1,600 30,339 0.05 Nissan Chemical Corp. JPY 200 10,193 0.02 Nitori Holdings Co. Ltd. JPY 100 17,087 0.03 Nitto Denko Corp. JPY 400 29,174 0.05 Nomura Holdings, Inc. JPY 2,900 12,480 0.02 Nomura Real Estate Holdings, Inc. JPY 600 10,847 0.02 Nomura Real Estate Master Fund, Inc., REIT JPY 5 5,845 0.01 NTT Data Corp. JPY 2,000 22,268 0.04 Odakyu Electric Railway Co. Ltd. JPY 1,000 25,602 0.04 Omron Corp. JPY 600 43,656 0.07 Oriental Land Co. Ltd. JPY 200 26,912 0.05 ORIX Corp. JPY 1,400 17,514 0.03 Orix JREIT, Inc., REIT JPY 2 2,696 0.00 Osaka Gas Co. Ltd. JPY 800 13,339 0.02 Pan Pacific International Holdings Corp. JPY 600 11,317 0.02 Panasonic Corp. JPY 3,300 31,215 0.05 Persol Holdings Co. Ltd. JPY 1,000 14,695 0.02 Pola Orbis Holdings, Inc. JPY 700 11,570 0.02 Rakuten, Inc. JPY 1,700 13,353 0.02 Recruit Holdings Co. Ltd. JPY 600 20,472 0.03 Resona Holdings, Inc. JPY 4,200 11,950 0.02 Santen Pharmaceutical Co. Ltd. JPY 1,700 22,486 0.04 Sekisui Chemical Co. Ltd. JPY 500 7,711 0.01 Sekisui House Ltd. JPY 2,900 48,076 0.08 Seven & i Holdings Co. Ltd. JPY 1,000 28,838 0.05
schEDUlE of InVEsTmEnTsAs at 31 December 2020
Investments Currency
Quantity/ Nominal
Value
Market Value EUR
% of Net Assets
Transferable securities and money market instruments admitted to official exchange listing or dealt in on another regulated market
Equities (continued)
Japan (continued)SG Holdings Co. Ltd. JPY 1,600 35,541 0.06 Shimizu Corp. JPY 3,300 19,567 0.03 Shin-Etsu Chemical Co. Ltd. JPY 200 28,519 0.05 Shionogi & Co. Ltd. JPY 700 31,105 0.05 Shiseido Co. Ltd. JPY 600 33,780 0.06 SoftBank Group Corp. JPY 1,200 76,390 0.13 Sompo Holdings, Inc. JPY 300 9,892 0.02 Sony Corp. JPY 1,300 106,585 0.18 Sumitomo Chemical Co. Ltd. JPY 7,200 23,572 0.04 Sumitomo Electric Industries Ltd. JPY 300 3,239 0.01 Sumitomo Metal Mining Co. Ltd. JPY 500 18,088 0.03 Sumitomo Mitsui Financial Group, Inc. JPY 2,500 63,029 0.11 Sumitomo Mitsui Trust Holdings, Inc. JPY 600 15,036 0.03 Sundrug Co. Ltd. JPY 300 9,761 0.02 Sysmex Corp. JPY 400 39,168 0.07 Takeda Pharmaceutical Co. Ltd. JPY 1,400 41,224 0.07 Teijin Ltd. JPY 700 10,732 0.02 TIS, Inc. JPY 1,400 23,396 0.04 Tohoku Electric Power Co., Inc. JPY 700 4,696 0.01 Tokio Marine Holdings, Inc. JPY 400 16,754 0.03 Tokyo Electron Ltd. JPY 100 30,317 0.05 Tokyu Corp. JPY 3,100 31,355 0.05 Tokyu Fudosan Holdings Corp. JPY 400 1,738 0.00 TOTO Ltd. JPY 800 39,156 0.07 Toyoda Gosei Co. Ltd. JPY 600 14,176 0.02 USS Co. Ltd. JPY 900 14,821 0.03 Yamada Holdings Co. Ltd. JPY 7,400 32,057 0.05 Yamaha Motor Co. Ltd. JPY 1,800 29,906 0.05 Yaskawa Electric Corp. JPY 800 32,415 0.05 Yokogawa Electric Corp. JPY 2,300 37,275 0.06 Z Holdings Corp. JPY 6,500 32,046 0.05
2,851,182 4.78
malaysiaDialog Group Bhd. MYR 2,400 1,678 0.00 HAP Seng Consolidated Bhd. MYR 2,600 4,530 0.01 Hartalega Holdings Bhd. MYR 1,100 2,706 0.01 IHH Healthcare Bhd. MYR 5,400 6,018 0.01 Maxis Bhd. MYR 11,900 12,176 0.02 Petronas Dagangan Bhd. MYR 3,500 15,176 0.03 PPB Group Bhd. MYR 700 2,627 0.00 RHB Bank Bhd. MYR 25,300 27,938 0.05 Sime Darby Bhd. MYR 2,700 1,264 0.00 Supermax Corp. Bhd. MYR 1,533 1,867 0.00 Tenaga Nasional Bhd. MYR 2,500 5,278 0.01 Westports Holdings Bhd. MYR 2,100 1,830 0.00
83,088 0.14
mexicoCemex SAB de CV MXN 488 206 0.00 Fibra Uno Administracion SA de CV, REIT MXN 1,700 1,575 0.00 Grupo Aeroportuario del Sureste SAB de CV ‘B’ MXN 215 2,835 0.01 Grupo Financiero Banorte SAB de CV ‘O’ MXN 600 2,733 0.01 Infraestructura Energetica Nova SAB de CV MXN 500 1,605 0.00 Wal-Mart de Mexico SAB de CV MXN 6,200 14,653 0.02
23,607 0.04
netherlandsAkzo Nobel NV EUR 451 39,625 0.07 ASML Holding NV EUR 203 80,703 0.14 ING Groep NV EUR 1,743 13,318 0.02 Just Eat Takeaway.com NV, Reg. S EUR 41 3,788 0.01

Morgan Stanley Investment Funds 31 December 2020 292
The accompanying notes are an integral part of these financial statements.
Global Balanced Defensive Fund (continued)
schEDUlE of InVEsTmEnTsAs at 31 December 2020
Investments Currency
Quantity/ Nominal
Value
Market Value EUR
% of Net Assets
Transferable securities and money market instruments admitted to official exchange listing or dealt in on another regulated market
Equities (continued)
netherlands (continued)Koninklijke Ahold Delhaize NV EUR 1,275 29,465 0.05 Koninklijke KPN NV EUR 4,849 12,059 0.02 NN Group NV EUR 409 14,532 0.02 Prosus NV EUR 133 11,752 0.02 Wolters Kluwer NV EUR 181 12,500 0.02
217,742 0.37
norwayAdevinta ASA ‘B’ NOK 251 3,446 0.01 Equinor ASA NOK 771 10,563 0.02 Norsk Hydro ASA NOK 2,082 7,893 0.01
21,902 0.04
PhilippinesAboitiz Equity Ventures, Inc. PHP 3,230 2,582 0.00 Ayala Corp. PHP 310 4,342 0.01 Ayala Land, Inc. PHP 5,500 3,807 0.01 Jollibee Foods Corp. PHP 1,540 5,095 0.01 Manila Electric Co. PHP 250 1,237 0.00
17,063 0.03
PolandJeronimo Martins SGPS SA EUR 1,287 17,786 0.03 KGHM Polska Miedz SA PLN 255 10,100 0.02 Polski Koncern Naftowy ORLEN SA PLN 422 5,250 0.01 Powszechny Zaklad Ubezpieczen SA PLN 397 2,788 0.00
35,924 0.06
PortugalEDP - Energias de Portugal SA EUR 7,770 40,062 0.07 Galp Energia SGPS SA EUR 2,271 19,880 0.03
59,942 0.10
singaporeCapitaLand Ltd. SGD 1,565 3,168 0.01 City Developments Ltd. SGD 700 3,443 0.01 Keppel Corp. Ltd. SGD 1,100 3,652 0.01 Mapletree Logistics Trust, REIT SGD 1,300 1,612 0.00 Oversea-Chinese Banking Corp. Ltd. SGD 181 1,124 0.00 Singapore Airlines Ltd. SGD 100 264 0.00 Singapore Technologies Engineering Ltd. SGD 1,200 2,829 0.00 Singapore Telecommunications Ltd. SGD 12,900 18,389 0.03
34,481 0.06
south africaAspen Pharmacare Holdings Ltd. ZAR 75 523 0.00 Bid Corp. Ltd. ZAR 194 2,839 0.01 Bidvest Group Ltd. (The) ZAR 229 2,000 0.00 Clicks Group Ltd. ZAR 657 9,234 0.02 Gold Fields Ltd. ZAR 458 3,505 0.01 Growthpoint Properties Ltd., REIT ZAR 4,741 3,315 0.01 Kumba Iron Ore Ltd. ZAR 401 13,892 0.02 Life Healthcare Group Holdings Ltd. ZAR 2,939 2,750 0.01 Mr Price Group Ltd. ZAR 209 1,984 0.00 MultiChoice Group ZAR 1,025 7,640 0.01 Naspers Ltd. ‘N’ ZAR 166 27,881 0.05 NEPI Rockcastle plc ZAR 367 1,909 0.00
schEDUlE of InVEsTmEnTsAs at 31 December 2020
Investments Currency
Quantity/ Nominal
Value
Market Value EUR
% of Net Assets
Transferable securities and money market instruments admitted to official exchange listing or dealt in on another regulated market
Equities (continued)
south africa (continued)Old Mutual Ltd. ZAR 14,306 9,462 0.02 Sanlam Ltd. ZAR 4,116 13,451 0.02 SPAR Group Ltd. (The) ZAR 755 7,960 0.01 Vodacom Group Ltd. ZAR 1,782 12,330 0.02 Woolworths Holdings Ltd. ZAR 881 1,938 0.00
122,613 0.21
south KoreaAMOREPACIFIC Group KRW 258 10,589 0.02 Celltrion Pharm, Inc. KRW 17 3,033 0.01 Celltrion, Inc. KRW 53 14,230 0.02 CJ CheilJedang Corp. KRW 17 4,843 0.01 CJ Logistics Corp. KRW 13 1,609 0.00 Douzone Bizon Co. Ltd. KRW 29 2,256 0.00 E-MART, Inc. KRW 11 1,246 0.00 GS Engineering & Construction Corp. KRW 162 4,577 0.01 GS Holdings Corp. KRW 592 16,628 0.03 Hankook Tire & Technology Co. Ltd. KRW 473 13,926 0.02 Hanon Systems KRW 2,154 26,169 0.04 Hanwha Solutions Corp. KRW 140 5,005 0.01 Hyundai Glovis Co. Ltd. KRW 8 1,100 0.00 Hyundai Marine & Fire Insurance Co. Ltd. KRW 547 9,302 0.02 Hyundai Motor Co. KRW 45 6,455 0.01 Korea Aerospace Industries Ltd. KRW 49 945 0.00 Korea Electric Power Corp. KRW 138 2,827 0.00 LG Chem Ltd. KRW 17 10,471 0.02 LG Corp. KRW 95 6,215 0.01 LG Household & Health Care Ltd. KRW 5 6,061 0.01 NAVER Corp. KRW 47 10,279 0.02 S-1 Corp. KRW 62 3,943 0.01 Samsung C&T Corp. KRW 7 722 0.00 Samsung Electro-Mechanics Co. Ltd. KRW 142 18,891 0.03 Samsung Electronics Co. Ltd. KRW 2,642 160,003 0.27 Samsung Fire & Marine Insurance Co. Ltd. KRW 27 3,785 0.01 Samsung SDI Co. Ltd. KRW 38 17,837 0.03 Samsung SDS Co. Ltd. KRW 14 1,868 0.00 Shinhan Financial Group Co. Ltd. KRW 735 17,625 0.03 SK Holdings Co. Ltd. KRW 8 1,438 0.00 SK Hynix, Inc. KRW 321 28,432 0.05 SK Innovation Co. Ltd. KRW 11 1,562 0.00 SK Telecom Co. Ltd. KRW 2 356 0.00
414,228 0.69
spainAena SME SA, Reg. S EUR 76 10,807 0.02 Amadeus IT Group SA ‘A’ EUR 474 28,232 0.05 Banco Bilbao Vizcaya Argentaria SA EUR 5,363 21,640 0.04 CaixaBank SA EUR 3,419 7,183 0.01 Iberdrola SA EUR 972 11,372 0.02 Industria de Diseno Textil SA EUR 2,075 54,033 0.09 Red Electrica Corp. SA EUR 1,558 26,136 0.04 Telefonica SA EUR 2,065 6,701 0.01
166,104 0.28
swedenAssa Abloy AB ‘B’ SEK 445 8,902 0.01 Atlas Copco AB ‘A’ SEK 261 10,965 0.02 Boliden AB SEK 917 26,442 0.04 Hennes & Mauritz AB ‘B’ SEK 635 10,880 0.02 Hexagon AB ‘B’ SEK 269 19,999 0.03 Husqvarna AB ‘B’ SEK 975 10,303 0.02

293 Morgan Stanley Investment Funds 31 December 2020
The accompanying notes are an integral part of these financial statements.
Global Balanced Defensive Fund (continued)
schEDUlE of InVEsTmEnTsAs at 31 December 2020
Investments Currency
Quantity/ Nominal
Value
Market Value EUR
% of Net Assets
Transferable securities and money market instruments admitted to official exchange listing or dealt in on another regulated market
Equities (continued)
sweden (continued)ICA Gruppen AB SEK 1,554 63,458 0.11 Investor AB ‘B’ SEK 160 9,488 0.02 Kinnevik AB ‘B’ SEK 415 17,079 0.03 SKF AB ‘B’ SEK 922 19,496 0.03 Svenska Cellulosa AB SCA ‘B’ SEK 945 13,450 0.02 Svenska Handelsbanken AB ‘A’ SEK 1,526 12,534 0.02 Swedbank AB ‘A’ SEK 668 9,541 0.02 Telefonaktiebolaget LM Ericsson ‘B’ SEK 1,642 15,943 0.03 Telia Co. AB SEK 4,018 13,628 0.02 Volvo AB ‘B’ SEK 331 6,358 0.01
268,466 0.45
switzerlandABB Ltd. CHF 424 9,661 0.02 Cie Financiere Richemont SA CHF 431 31,522 0.05 Julius Baer Group Ltd. CHF 274 12,977 0.02 Kuehne + Nagel International AG CHF 47 8,686 0.01 Novartis AG CHF 1,187 90,929 0.15 Roche Holding AG CHF 219 62,547 0.11 SGS SA CHF 10 24,622 0.04 Swiss Re AG CHF 260 19,907 0.03 Swisscom AG CHF 43 18,869 0.03 UBS Group AG CHF 1,884 21,648 0.04 Zurich Insurance Group AG CHF 50 17,194 0.03
318,562 0.53
TaiwanAcer, Inc. TWD 13,000 8,911 0.01 Catcher Technology Co. Ltd. TWD 1,000 5,971 0.01 Cathay Financial Holding Co. Ltd. TWD 33,000 40,411 0.07 Cheng Shin Rubber Industry Co. Ltd. TWD 1,000 1,277 0.00 China Steel Corp. TWD 14,000 10,043 0.02 Chunghwa Telecom Co. Ltd. TWD 21,000 66,345 0.11 CTBC Financial Holding Co. Ltd. TWD 7,000 3,997 0.01 Delta Electronics, Inc. TWD 7,000 53,360 0.09 Eclat Textile Co. Ltd. TWD 1,000 12,246 0.02 Eva Airways Corp. TWD 7,301 2,783 0.00 Evergreen Marine Corp. Taiwan Ltd. TWD 4,000 4,719 0.01 Far Eastern New Century Corp. TWD 4,000 3,356 0.01 First Financial Holding Co. Ltd. TWD 44,000 27,228 0.05 Hon Hai Precision Industry Co. Ltd. TWD 2,000 5,333 0.01 Hotai Motor Co. Ltd. TWD 1,000 18,637 0.03 Inventec Corp. TWD 11,000 7,652 0.01 Nan Ya Plastics Corp. TWD 9,000 18,756 0.03 Nanya Technology Corp. TWD 2,000 5,032 0.01 Pou Chen Corp. TWD 3,000 2,730 0.00 President Chain Store Corp. TWD 5,000 38,621 0.06 Synnex Technology International Corp. TWD 1,000 1,362 0.00 Taishin Financial Holding Co. Ltd. TWD 55,000 21,122 0.04 Taiwan Cement Corp. TWD 73 91 0.00 Taiwan High Speed Rail Corp. TWD 2,000 1,838 0.00 Taiwan Semiconductor Manufacturing Co. Ltd. TWD 8,000 122,893 0.21 United Microelectronics Corp. TWD 6,000 8,200 0.01 Win Semiconductors Corp. TWD 1,000 10,028 0.02
502,942 0.84
ThailandAirports of Thailand PCL THB 1,000 1,693 0.00 B Grimm Power PCL THB 1,500 1,979 0.00 Bangkok Dusit Medical Services PCL ‘F’ THB 46,900 26,533 0.04 Central Pattana PCL THB 1,600 2,078 0.00
schEDUlE of InVEsTmEnTsAs at 31 December 2020
Investments Currency
Quantity/ Nominal
Value
Market Value EUR
% of Net Assets
Transferable securities and money market instruments admitted to official exchange listing or dealt in on another regulated market
Equities (continued)
Thailand (continued)CP ALL PCL THB 1,900 3,010 0.01 Home Product Center PCL THB 48,500 18,072 0.03 Land & Houses PCL THB 33,800 7,309 0.01 PTT Exploration & Production PCL THB 2,000 5,344 0.01 PTT PCL THB 21,500 24,810 0.04 Siam Cement PCL (The) THB 900 9,342 0.02 Siam Commercial Bank PCL (The) THB 6,600 15,707 0.03
115,877 0.19
TurkeyAselsan Elektronik Sanayi ve Ticaret A/S TRY 1,006 2,025 0.00
2,025 0.00
United Kingdom3i Group plc GBP 867 11,177 0.02 Ashtead Group plc GBP 312 11,942 0.02 AstraZeneca plc GBP 467 38,078 0.06 Aviva plc GBP 2,514 9,102 0.01 BAE Systems plc GBP 2,895 15,754 0.03 Barratt Developments plc GBP 674 5,027 0.01 Berkeley Group Holdings plc GBP 421 22,225 0.04 British American Tobacco plc GBP 23 693 0.00 British Land Co. plc (The), REIT GBP 1,719 9,358 0.01 BT Group plc GBP 8,137 11,980 0.02 Burberry Group plc GBP 662 13,188 0.02 Compass Group plc GBP 1,054 15,993 0.03 Croda International plc GBP 494 36,275 0.06 Diageo plc GBP 2,228 71,386 0.12 Ferguson plc GBP 169 16,715 0.03 GlaxoSmithKline plc GBP 2,052 30,657 0.05 HSBC Holdings plc GBP 7,692 32,442 0.05 Informa plc GBP 1,833 11,203 0.02 J Sainsbury plc GBP 6,204 15,575 0.03 Johnson Matthey plc GBP 678 18,304 0.03 Kingfisher plc GBP 6,221 18,727 0.03 Legal & General Group plc GBP 6,268 18,576 0.03 Mondi plc GBP 690 13,209 0.02 Natwest Group plc GBP 12,832 23,950 0.04 Prudential plc GBP 1,043 15,641 0.03 RELX plc GBP 1,708 34,084 0.06 Rentokil Initial plc GBP 1,090 6,184 0.01 Rio Tinto plc GBP 513 31,240 0.05 Rolls-Royce Holdings plc GBP 9,584 11,870 0.02 Segro plc, REIT GBP 425 4,484 0.01 SSE plc GBP 466 7,782 0.01 St James’s Place plc GBP 780 9,843 0.02 Standard Chartered plc GBP 2,593 13,449 0.02 Taylor Wimpey plc GBP 6,929 12,790 0.02 Tesco plc GBP 23,502 60,544 0.10 Unilever plc GBP 2 98 0.00 United Utilities Group plc GBP 1,006 10,024 0.02 Vodafone Group plc GBP 13,065 17,591 0.03 WPP plc GBP 448 3,990 0.01
711,150 1.19
United states of americaAbbVie, Inc. USD 155 13,339 0.02 Accenture plc ‘A’ USD 103 21,716 0.04 Adobe, Inc. USD 34 13,835 0.02 Agilent Technologies, Inc. USD 164 15,703 0.03 Alexandria Real Estate Equities, Inc., REIT USD 38 5,430 0.01

Morgan Stanley Investment Funds 31 December 2020 294
The accompanying notes are an integral part of these financial statements.
Global Balanced Defensive Fund (continued)
schEDUlE of InVEsTmEnTsAs at 31 December 2020
Investments Currency
Quantity/ Nominal
Value
Market Value EUR
% of Net Assets
Transferable securities and money market instruments admitted to official exchange listing or dealt in on another regulated market
Equities (continued)
United states of america (continued)Alliant Energy Corp. USD 152 6,318 0.01 Allstate Corp. (The) USD 121 10,690 0.02 Alphabet, Inc. ‘A’ USD 84 119,594 0.20 Amazon.com, Inc. USD 36 96,012 0.16 Amcor plc USD 409 3,897 0.01 American Express Co. USD 192 18,710 0.03 American Tower Corp., REIT USD 57 10,284 0.02 Amgen, Inc. USD 220 40,529 0.07 Amphenol Corp. ‘A’ USD 157 16,612 0.03 Anthem, Inc. USD 42 10,796 0.02 Apple, Inc. USD 1,710 185,977 0.31 Applied Materials, Inc. USD 298 20,774 0.03 Archer-Daniels-Midland Co. USD 164 6,674 0.01 AT&T, Inc. USD 801 18,564 0.03 Autodesk, Inc. USD 72 17,764 0.03 Baker Hughes Co. USD 387 6,624 0.01 Ball Corp. USD 109 8,203 0.01 Bank of America Corp. USD 168 4,102 0.01 Becton Dickinson and Co. USD 81 16,370 0.03 Best Buy Co., Inc. USD 250 20,559 0.03 Biogen, Inc. USD 15 2,950 0.00 BlackRock, Inc. USD 29 16,792 0.03 Booking Holdings, Inc. USD 11 19,793 0.03 BorgWarner, Inc. USD 121 3,815 0.01 Bristol-Myers Squibb Co. USD 232 11,570 0.02 Broadcom, Inc. USD 26 9,213 0.02 Brown-Forman Corp. ‘B’ USD 81 5,153 0.01 Cardinal Health, Inc. USD 325 13,991 0.02 CarMax, Inc. USD 71 5,401 0.01 Cerner Corp. USD 418 26,475 0.04 Chevron Corp. USD 221 15,237 0.03 Chubb Ltd. USD 153 18,846 0.03 Cigna Corp. USD 135 22,468 0.04 Cincinnati Financial Corp. USD 61 4,264 0.01 Cintas Corp. USD 19 5,418 0.01 Cisco Systems, Inc. USD 820 29,574 0.05 Citigroup, Inc. USD 616 30,440 0.05 Citrix Systems, Inc. USD 67 7,018 0.01 Clorox Co. (The) USD 44 7,209 0.01 CMS Energy Corp. USD 95 4,660 0.01 Coca-Cola Co. (The) USD 499 22,173 0.04 Cognizant Technology Solutions Corp. ‘A’ USD 137 9,044 0.01 Colgate-Palmolive Co. USD 256 17,706 0.03 Comcast Corp. ‘A’ USD 689 29,224 0.05 ConocoPhillips USD 327 10,599 0.02 Consolidated Edison, Inc. USD 89 5,178 0.01 Copart, Inc. USD 65 6,700 0.01 Crown Castle International Corp., REIT USD 50 6,384 0.01 Deere & Co. USD 43 9,354 0.02 Discovery, Inc. ‘C’ USD 498 10,533 0.02 Dominion Energy, Inc. USD 114 6,894 0.01 DuPont de Nemours, Inc. USD 183 10,552 0.02 Eaton Corp. plc USD 40 3,900 0.01 eBay, Inc. USD 430 17,681 0.03 Ecolab, Inc. USD 26 4,595 0.01 Edison International USD 108 5,441 0.01 Edwards Lifesciences Corp. USD 381 27,826 0.05 Eli Lilly and Co. USD 164 22,321 0.04 Emerson Electric Co. USD 261 16,937 0.03 Equinix, Inc., REIT USD 11 6,303 0.01 Equity Residential, REIT USD 285 13,572 0.02 Estee Lauder Cos., Inc. (The) ‘A’ USD 36 7,733 0.01 Etsy, Inc. USD 255 37,088 0.06 Eversource Energy USD 50 3,494 0.01 Exelon Corp. USD 265 9,086 0.01 Expedia Group, Inc. USD 85 9,099 0.01
schEDUlE of InVEsTmEnTsAs at 31 December 2020
Investments Currency
Quantity/ Nominal
Value
Market Value EUR
% of Net Assets
Transferable securities and money market instruments admitted to official exchange listing or dealt in on another regulated market
Equities (continued)
United states of america (continued)Expeditors International of Washington, Inc. USD 283 21,802 0.04 Exxon Mobil Corp. USD 573 19,344 0.03 Facebook, Inc. ‘A’ USD 224 50,159 0.08 Fastenal Co. USD 107 4,266 0.01 FedEx Corp. USD 16 3,373 0.01 Fidelity National Information Services, Inc. USD 234 26,884 0.04 General Electric Co. USD 1,699 14,664 0.02 Genuine Parts Co. USD 248 20,094 0.03 Gilead Sciences, Inc. USD 403 18,712 0.03 Hasbro, Inc. USD 104 7,975 0.01 HCA Healthcare, Inc. USD 41 5,432 0.01 Healthpeak Properties, Inc., REIT USD 189 4,573 0.01 Henry Schein, Inc. USD 549 29,590 0.05 Hess Corp. USD 211 9,108 0.01 Hologic, Inc. USD 113 6,567 0.01 Home Depot, Inc. (The) USD 307 66,220 0.11 Honeywell International, Inc. USD 132 22,662 0.04 Host Hotels & Resorts, Inc., REIT USD 444 5,233 0.01 HP, Inc. USD 550 10,875 0.02 Humana, Inc. USD 37 12,274 0.02 IDEXX Laboratories, Inc. USD 32 12,910 0.02 IHS Markit Ltd. USD 209 15,154 0.03 Intel Corp. USD 767 30,556 0.05 International Business Machines Corp. USD 268 27,118 0.05 International Flavors & Fragrances, Inc. USD 66 5,891 0.01 Intuit, Inc. USD 82 25,302 0.04 Invesco Ltd. USD 461 6,466 0.01 Jacobs Engineering Group, Inc. USD 90 7,882 0.01 Johnson & Johnson USD 217 27,617 0.05 Johnson Controls International plc USD 425 15,989 0.03 Kellogg Co. USD 429 21,605 0.04 Kimberly-Clark Corp. USD 69 7,545 0.01 KLA Corp. USD 41 8,588 0.01 L3Harris Technologies, Inc. USD 64 9,797 0.02 Lockheed Martin Corp. USD 58 16,754 0.03 Lowe’s Cos., Inc. USD 104 13,555 0.02 Marsh & McLennan Cos., Inc. USD 477 44,915 0.07 Mastercard, Inc. ‘A’ USD 130 37,971 0.06 Merck & Co., Inc. USD 279 18,348 0.03 Mettler-Toledo International, Inc. USD 9 8,292 0.01 Microsoft Corp. USD 949 171,323 0.29 Netflix, Inc. USD 57 25,036 0.04 Newmont Corp. USD 96 4,659 0.01 NextEra Energy, Inc. USD 258 16,027 0.03 Nielsen Holdings plc USD 265 4,469 0.01 Northern Trust Corp. USD 164 12,283 0.02 NVIDIA Corp. USD 50 21,253 0.04 Omnicom Group, Inc. USD 104 5,275 0.01 ONEOK, Inc. USD 173 5,320 0.01 Oracle Corp. USD 405 21,208 0.04 PayPal Holdings, Inc. USD 150 28,235 0.05 People’s United Financial, Inc. USD 10 104 0.00 PepsiCo, Inc. USD 545 65,434 0.11 PNC Financial Services Group, Inc. (The) USD 367 43,857 0.07 PPG Industries, Inc. USD 217 25,189 0.04 Procter & Gamble Co. (The) USD 234 26,340 0.04 Prologis, Inc., REIT USD 139 11,159 0.02 Public Service Enterprise Group, Inc. USD 168 7,869 0.01 QUALCOMM, Inc. USD 158 19,489 0.03 Quanta Services, Inc. USD 159 9,233 0.02 Raytheon Technologies Corp. USD 304 17,666 0.03 Regency Centers Corp., REIT USD 141 5,177 0.01 Robert Half International, Inc. USD 273 13,838 0.02 Rockwell Automation, Inc. USD 8 1,619 0.00 salesforce.com, Inc. USD 128 23,075 0.04 SBA Communications Corp., REIT ‘A’ USD 21 4,726 0.01

295 Morgan Stanley Investment Funds 31 December 2020
The accompanying notes are an integral part of these financial statements.
Global Balanced Defensive Fund (continued)
schEDUlE of InVEsTmEnTsAs at 31 December 2020
Investments Currency
Quantity/ Nominal
Value
Market Value EUR
% of Net Assets
Transferable securities and money market instruments admitted to official exchange listing or dealt in on another regulated market
Equities (continued)
United states of america (continued)Schlumberger NV USD 244 4,319 0.01 Sherwin-Williams Co. (The) USD 27 15,950 0.03 Skyworks Solutions, Inc. USD 63 7,843 0.01 Southern Co. (The) USD 247 12,246 0.02 Southwest Airlines Co. USD 158 5,921 0.01 State Street Corp. USD 467 27,283 0.05 SVB Financial Group USD 39 12,097 0.02 Synchrony Financial USD 654 18,262 0.03 Synopsys, Inc. USD 81 17,071 0.03 Sysco Corp. USD 172 10,222 0.02 T Rowe Price Group, Inc. USD 67 8,152 0.01 Target Corp. USD 4 570 0.00 Teledyne Technologies, Inc. USD 23 7,319 0.01 Texas Instruments, Inc. USD 191 25,289 0.04 Textron, Inc. USD 150 5,873 0.01 Thermo Fisher Scientific, Inc. USD 31 11,663 0.02 Tiffany & Co. USD 54 5,784 0.01 TJX Cos., Inc. (The) USD 155 8,651 0.01 T-Mobile US, Inc. USD 41 4,467 0.01 Travelers Cos., Inc. (The) USD 304 34,383 0.06 Ulta Beauty, Inc. USD 33 7,586 0.01 United Parcel Service, Inc. ‘B’ USD 23 3,115 0.00 United Rentals, Inc. USD 48 9,002 0.01 Verisk Analytics, Inc. USD 29 4,873 0.01 Verizon Communications, Inc. USD 727 34,503 0.06 Vertex Pharmaceuticals, Inc. USD 103 19,341 0.03 Visa, Inc. ‘A’ USD 255 45,549 0.08 Walgreens Boots Alliance, Inc. USD 443 14,211 0.02 Walt Disney Co. (The) USD 223 33,089 0.06 Willis Towers Watson plc USD 49 8,286 0.01 WW Grainger, Inc. USD 34 11,162 0.02 Xcel Energy, Inc. USD 128 6,877 0.01 Xilinx, Inc. USD 105 12,017 0.02 Zions Bancorp NA USD 289 10,126 0.02 Zoetis, Inc. USD 169 22,528 0.04
3,096,335 5.19
Total Equities 11,686,935 19.60
Total Transferable securities and money market instruments admitted to official exchange listing or dealt in on another regulated market 49,420,717 82.89
Other transferable securities and money market instruments not admitted to official exchange listing or dealt in on another regulated market
Equities
spainTelefonica SA Rights 28/12/2020* EUR 2,065 375 0.00
375 0.00
Total Equities 375 0.00
Total other transferable securities and money market instruments not admitted to official exchange listing or dealt in on another regulated market 375 0.00
schEDUlE of InVEsTmEnTsAs at 31 December 2020
Investments Currency
Quantity/ Nominal
Value
Market Value EUR
% of Net Assets
Units of authorised UCITS or other collective investment undertakings
collective Investment schemes – UcITs
luxembourgMorgan Stanley Investment Funds
Emerging Markets Corporate Debt Fund – Class N† USD 65,923 1,484,265 2.49
Morgan Stanley Investment Funds Global Infrastructure Fund – Class Z† EUR 1,457 81,883 0.14
Morgan Stanley Investment Funds Global Infrastructure Fund – Class Z† USD 3,810 214,095 0.36
1,780,243 2.99
Total collective Investment schemes – UcITs 1,780,243 2.99
Exchange Traded funds
franceAmundi Index Solutions Msci EM Latin
America UCITS ETF – Eur Class A EUR 52,321 606,348 1.02
606,348 1.02
GermanyXtrackers MSCI World Financials UCITS ETF EUR 18,520 301,483 0.50
301,483 0.50
ItalyiShares Global Clean Energy UCITS ETF EUR 92,517 1,218,720 2.04 iShares J.P. Morgan EM Local Government
Bond Fund – USD (Dist) EUR 24,346 1,198,800 2.01
2,417,520 4.05
United KingdomInvesco Physical Gold ETC – Class A USD USD 3,941 589,252 0.99 iShares MSCI China A UCITS ETF USD 120,946 619,546 1.04 WisdomTree Industrial Metals Enhanced
UCITS ETF USD 13,000 291,958 0.49
1,500,756 2.52
Total Exchange Traded funds 4,826,107 8.09
Total Units of authorised UcITs or other collective investment undertakings 6,606,350 11.08
Total Investments 56,027,442 93.97
cash 1,759,251 2.95
other assets/(liabilities) 1,832,908 3.08
Total net assets 59,619,601 100.00
* Security is valued at its fair value under the direction of the Board of Directors.† Managed by an affiliate of the Investment Adviser. The country disclosed within the Schedule of Investments refers to the country of risk. The country of incorporation may differ.

Morgan Stanley Investment Funds 31 December 2020 296
The accompanying notes are an integral part of these financial statements.
Global Balanced Defensive Fund (continued)
option Purchased contracts
Quantity security Description currency counterparty
market Value EUR
% of net assets
50 EURO STOXX 50 Index, Call, 3,450.000, 18/06/2021 EUR Goldman Sachs 108,450 0.18
53 EURO STOXX 50 Index, Put, 3,300.000, 19/03/2021 EUR Goldman Sachs 32,595 0.06
4 Nikkei 225 Index, Call, 24,000.000, 11/06/2021 JPY Goldman Sachs 118,322 0.20
7 S&P 500 Index, Call, 3,350.000, 18/06/2021 USD Goldman Sachs 267,576 0.45
7 S&P 500 Index, Call, 3,775.000, 17/09/2021 USD Goldman Sachs 121,807 0.20
7 S&P 500 Index, Put, 3,400.000, 19/03/2021 USD Goldman Sachs 31,893 0.05
Total market Value on option Purchased contracts – assets 680,643 1.14
financial futures contracts
security Descriptionnumber
of contracts currency
Global Exposure
EUR
Unrealised Gain/(loss)
EUR
% of net assets
DAX Index, 19/03/2021 2 EUR 687,300 24,625 0.04 Russell 2000 Emini Index, 19/03/2021 4 USD 320,195 8,810 0.02
Total Unrealised Gain on financial futures contracts 33,435 0.06
EURO STOXX 50 Index, 19/03/2021 (37) EUR (1,313,500) (16,097) (0.03) MSCI Emerging Markets Index, 19/03/2021 (23) USD (1,207,325) (31,422) (0.05) S&P 500 Emini Index, 19/03/2021 (6) USD (910,069) (16,614) (0.03) Yen Denominated Nikkei 225 Index, 11/03/2021 (14) JPY (1,520,592) (42,908) (0.07)
Total Unrealised loss on financial futures contracts (107,041) (0.18)
net Unrealised loss on financial futures contracts (73,606) (0.12)
forward currency Exchange contracts
currency Purchased
amount Purchased
currency sold
amount sold
maturity Date counterparty
Unrealised Gain/(loss)
EUR
% of net assets
EUR 1,272,656 GBP 1,141,000 25/01/2021 State Street 2,826 0.00EUR 367,747 JPY 46,500,000 25/01/2021 RBC 55 0.00EUR 2,061,447 JPY 255,000,000 25/01/2021 State Street 45,074 0.08 EUR 7,100,962 USD 8,470,000 25/01/2021 J.P. Morgan 201,064 0.34 EUR 894,941 USD 1,085,000 25/01/2021 UBS 11,070 0.02 EUR 876,241 USD 1,061,000 25/01/2021 Westpac Banking 11,921 0.02
Unrealised Gain on forward currency Exchange contracts – assets 272,010 0.46
Total Unrealised Gain on forward currency Exchange contracts – assets 272,010 0.46
GBP 80,000 EUR 89,552 25/01/2021 RBC (519) 0.00GBP 120,000 EUR 134,415 25/01/2021 Westpac Banking (866) 0.00JPY 21,000,000 EUR 169,082 25/01/2021 Commonwealth
Bank of Australia (3,027) (0.01) JPY 54,500,000 EUR 431,477 25/01/2021 J.P. Morgan (527) 0.00USD 421,000 EUR 349,700 25/01/2021 J.P. Morgan (6,742) (0.01)
Unrealised loss on forward currency Exchange contracts – liabilities (11,681) (0.02)
Total Unrealised loss on forward currency Exchange contracts – liabilities (11,681) (0.02)
net Unrealised Gain on forward currency Exchange contracts – assets 260,329 0.44
credit Default swap contracts
nominal amount ccy counterparty
Reference Entity
Buy/ sell
Interest (Paid)/
Received Rate
maturity Date
market Value
EUR
% of net assets
900,000 USD Barclays CDX.NA.EM. 28-V3 Sell 1.00% 20/12/2022 5,229 0.01 500,000 USD Barclays CDX.NA.EM. 30-V3 Sell 1.00% 20/12/2023 2,327 0.00 800,000 USD Goldman Sachs CDX.NA.EM. 31-V2 Sell 1.00% 20/06/2024 3,713 0.01 700,000 USD Barclays CDX.NA.EM. 31-V2 Sell 1.00% 20/06/2024 3,248 0.01 375,000 USD Barclays CDX.NA.HY. 30-V14 Sell 5.00% 20/06/2023 18,632 0.03
1,600,000 USD Goldman Sachs CDX.NA.HY. 31-V14 Sell 5.00% 20/12/2023 89,720 0.15 1,950,000 USD Goldman Sachs CDX.NA.HY. 33-V12 Sell 5.00% 20/12/2024 131,345 0.22 1,250,000 USD Goldman Sachs CDX.NA.HY. 35-V1 Sell 5.00% 20/12/2025 94,973 0.16 4,700,000 USD Goldman Sachs CDX.NA.IG. 33-V1 Sell 1.00% 20/12/2024 62,537 0.10 2,025,000 USD Goldman Sachs CDX.NA.IG. 35-V1 Sell 1.00% 20/12/2025 39,957 0.07
500,000 EUR Barclays ITRAXX.EUROPE.CROSSOVER. 28-V9 Sell 5.00% 20/12/2022 31,244 0.05
450,000 EUR Goldman Sachs ITRAXX.EUROPE.CROSSOVER. 31-V6 Sell 5.00% 20/06/2024 44,092 0.07
500,000 EUR Goldman Sachs ITRAXX.EUROPE.CROSSOVER. 32-V4 Sell 5.00% 20/12/2024 53,773 0.09
950,000 EUR Goldman Sachs ITRAXX.EUROPE.CROSSOVER. 33-V4 Sell 5.00% 20/06/2025 106,210 0.18
Total market Value on credit Default swap contracts – assets 687,000 1.15
650,000 USD Barclays CDX.NA.EM. 33-V2 Sell 1.00% 20/06/2025 (886) 0.00
Total market Value on credit Default swap contracts – liabilities (886) 0.00
net market Value on credit Default swap contracts – assets 686,114 1.15
Collateral received and paid by the Fund in respect of financial derivative instruments:
Type of collateral counterparty currency amount received amount paid
Global Balanced Defensive fund
Cash Goldman Sachs EUR – 386,174
– 386,174
DERIVaTIVEs
Over-the-counter (OTC) and exchange traded derivatives as at 31 December 2020, expressed in Euro.
DERIVaTIVEs (continued)
Over-the-counter (OTC) and exchange traded derivatives as at 31 December 2020, expressed in Euro.

297 Morgan Stanley Investment Funds 31 December 2020
The accompanying notes are an integral part of these financial statements.
Please refer to the full prospectus for the Fund’s investment objective and policy.
Global Balanced Fund
InVEsTmEnT aIm
To provide an attractive level of total return, measured in Euro, by investing primarily in portfolio of transferable securities such as equity securities, including closed-end Real Estate Investment Trusts (REITS); Fixed Income Securities (including investment grade, non-investment grade and unrated) and money market instruments and cash globally and through the use of financial derivative instruments.
schEDUlE of InVEsTmEnTsAs at 31 December 2020
Investments Currency
Quantity/ Nominal
Value
Market Value EUR
% of Net Assets
Transferable securities and money market instruments admitted to official exchange listing or dealt in on another regulated market
corporate Bonds
australiaAPT Pipelines Ltd., Reg. S 1.375%
22/03/2022 EUR 820,000 835,309 0.08 Aurizon Network Pty. Ltd., Reg. S 3.125%
01/06/2026 EUR 900,000 1,032,881 0.09 Ausgrid Finance Pty. Ltd., Reg. S 1.25%
30/07/2025 EUR 500,000 526,136 0.05 AusNet Services Holdings Pty. Ltd., Reg. S
0.625% 25/08/2030 EUR 800,000 831,682 0.08 BHP Billiton Finance Ltd., Reg. S, FRN
4.75% 22/04/2076 EUR 1,000,000 1,013,600 0.09 Commonwealth Bank of Australia, Reg. S,
FRN 2% 22/04/2027 EUR 800,000 817,708 0.07 Commonwealth Bank of Australia, Reg. S,
FRN 1.936% 03/10/2029 EUR 500,000 523,718 0.05 Optus Finance Pty. Ltd., Reg. S 1%
20/06/2029 EUR 850,000 896,414 0.08 Origin Energy Finance Ltd., Reg. S 1%
17/09/2029 EUR 700,000 700,854 0.06 Scentre Group Trust 1, REIT, Reg. S 1.45%
28/03/2029 EUR 400,000 425,420 0.04
7,603,722 0.69
austriaCA Immobilien Anlagen AG, Reg. S 1%
27/10/2025 EUR 300,000 305,665 0.03 CA Immobilien Anlagen AG, Reg. S 0.875%
05/02/2027 EUR 200,000 201,356 0.02 Vienna Insurance Group AG Wiener
Versicherung Gruppe, Reg. S, FRN 5.5% 09/10/2043 EUR 1,000,000 1,142,500 0.10
1,649,521 0.15
BelgiumAnheuser-Busch InBev SA/NV, Reg. S 3.7%
02/04/2040 EUR 500,000 708,978 0.06
708,978 0.06
chinaChina Merchants Bank Co. Ltd., Reg. S
0.25% 19/06/2022 EUR 250,000 249,150 0.02 State Grid Overseas Investment 2016 Ltd.,
Reg. S 0.797% 05/08/2026 EUR 700,000 713,409 0.07
962,559 0.09
DenmarkDanske Bank A/S, Reg. S 0.875%
22/05/2023 EUR 750,000 765,406 0.07 Danske Bank A/S, Reg. S, FRN 1.375%
12/02/2030 EUR 650,000 660,930 0.06 STG Global Finance BV, Reg. S 1.375%
24/09/2025 EUR 300,000 305,877 0.03
1,732,213 0.16
finlandKojamo OYJ, Reg. S 1.875% 27/05/2027 EUR 600,000 649,024 0.06 Sampo OYJ, Reg. S 2.5% 03/09/2052 EUR 600,000 650,745 0.06 SATO OYJ, Reg. S 1.375% 31/05/2024 EUR 350,000 361,905 0.03
1,661,674 0.15

Morgan Stanley Investment Funds 31 December 2020 298
The accompanying notes are an integral part of these financial statements.
Global Balanced Fund (continued)
schEDUlE of InVEsTmEnTsAs at 31 December 2020
Investments Currency
Quantity/ Nominal
Value
Market Value EUR
% of Net Assets
Transferable securities and money market instruments admitted to official exchange listing or dealt in on another regulated market
corporate Bonds (continued)
franceAirbus SE, Reg. S 2.375% 07/04/2032 EUR 450,000 534,244 0.05 Airbus SE, Reg. S 2.375% 09/06/2040 EUR 150,000 179,305 0.02 AXA SA, Reg. S, FRN 3.25% 28/05/2049 EUR 1,000,000 1,171,833 0.11 Banque Federative du Credit Mutuel SA,
Reg. S 2.375% 24/03/2026 EUR 1,000,000 1,103,439 0.10 BNP Paribas Cardif SA, Reg. S, FRN
4.032% Perpetual EUR 1,000,000 1,136,875 0.10 BNP Paribas SA, Reg. S, FRN 1.125%
17/04/2029 EUR 400,000 422,733 0.04 BPCE SA, Reg. S 1.125% 18/01/2023 EUR 1,000,000 1,026,722 0.09 Bureau Veritas SA, Reg. S 1.125%
18/01/2027 EUR 200,000 205,273 0.02 Credit Agricole Assurances SA, Reg. S,
FRN 4.5% Perpetual EUR 1,000,000 1,146,875 0.10 Credit Agricole SA, Reg. S 4% Perpetual EUR 500,000 542,468 0.05 Engie SA, Reg. S, FRN 3.25% Perpetual EUR 700,000 769,292 0.07 Orange SA, Reg. S, FRN 2.375% Perpetual EUR 1,000,000 1,056,250 0.09 SEB SA, Reg. S 1.375% 16/06/2025 EUR 200,000 206,399 0.02 Societe Generale SA 1% 24/11/2030 EUR 300,000 301,066 0.03 TOTAL SE, Reg. S, FRN 3.875% Perpetual EUR 900,000 944,437 0.08 Unibail-Rodamco-Westfield SE, Reg. S
0.625% 04/05/2027 EUR 300,000 299,009 0.03 Unibail-Rodamco-Westfield SE, REIT, Reg. S
2.625% 09/04/2030 EUR 300,000 341,609 0.03
11,387,829 1.03
GermanyAllianz SE, Reg. S, FRN 2.121%
08/07/2050 EUR 500,000 548,718 0.05 Bayer AG, Reg. S 0.375% 06/07/2024 EUR 300,000 304,306 0.03 Bayer AG, Reg. S 1.375% 06/07/2032 EUR 800,000 855,498 0.08 Bayer AG, Reg. S, FRN 3.125%
12/11/2079 EUR 900,000 947,272 0.09 BMW Finance NV, Reg. S 0.125%
13/07/2022 EUR 500,000 502,889 0.04 Continental AG 2.5% 27/08/2026 EUR 200,000 223,509 0.02 Continental AG, Reg. S 0% 12/09/2023 EUR 400,000 400,378 0.04 Daimler International Finance BV, Reg. S
0.25% 06/11/2023 EUR 600,000 604,641 0.05 Daimler International Finance BV, Reg. S
1.5% 09/02/2027 EUR 300,000 323,678 0.03 Grand City Properties SA, Reg. S 1.5%
22/02/2027 EUR 500,000 535,279 0.05 Muenchener Rueckversicherungs-
Gesellschaft AG, Reg. S 1.25% 26/05/2041 EUR 900,000 936,289 0.08
Volkswagen International Finance NV, Reg. S 4.125% 16/11/2038 EUR 600,000 861,670 0.08
Volkswagen International Finance NV, Reg. S, FRN 2.7% Perpetual EUR 1,000,000 1,023,125 0.09
Vonovia Finance BV, Reg. S, FRN 4% Perpetual EUR 500,000 517,696 0.05
Wintershall Dea Finance BV, Reg. S 0.452% 25/09/2023 EUR 800,000 807,254 0.07
Wintershall Dea Finance BV, Reg. S 1.823% 25/09/2031 EUR 400,000 421,911 0.04
9,814,113 0.89
schEDUlE of InVEsTmEnTsAs at 31 December 2020
Investments Currency
Quantity/ Nominal
Value
Market Value EUR
% of Net Assets
Transferable securities and money market instruments admitted to official exchange listing or dealt in on another regulated market
corporate Bonds (continued)
hong KongCheung Kong Infrastructure Finance BVI
Ltd., Reg. S 1% 12/12/2024 EUR 320,000 324,672 0.03
324,672 0.03
IcelandLandsbankinn HF, Reg. S 0.5%
20/05/2024 EUR 550,000 549,898 0.05
549,898 0.05
IrelandBank of Ireland Group plc, Reg. S, FRN
0.75% 08/07/2024 EUR 500,000 508,315 0.05 DAA Finance plc, Reg. S 1.601%
05/11/2032 EUR 200,000 219,066 0.02 Dell Bank International DAC, Reg. S
0.625% 17/10/2022 EUR 400,000 403,805 0.04 Ryanair DAC, Reg. S 2.875% 15/09/2025 EUR 450,000 482,268 0.04 Ryanair DAC, Reg. S 1.875% 17/06/2021 EUR 560,000 563,914 0.05
2,177,368 0.20
ItalyAssicurazioni Generali SpA, Reg. S 2.429%
14/07/2031 EUR 1,050,000 1,152,176 0.10 Assicurazioni Generali SpA, Reg. S, FRN
5.5% 27/10/2047 EUR 570,000 703,665 0.06 Enel SpA, Reg. S, FRN 2.5% 24/11/2078 EUR 1,000,000 1,046,250 0.09 FCA Bank SpA, Reg. S 0.5% 18/09/2023 EUR 750,000 757,552 0.07 FCA Bank SpA, Reg. S 0.25%
28/02/2023 EUR 200,000 200,821 0.02 Intesa Sanpaolo SpA, Reg. S 1.125%
04/03/2022 EUR 500,000 507,695 0.05 Intesa Sanpaolo SpA, Reg. S 1%
04/07/2024 EUR 300,000 309,623 0.03 Intesa Sanpaolo SpA, Reg. S 1.75%
04/07/2029 EUR 450,000 492,225 0.04 UniCredit SpA, Reg. S 0.5% 09/04/2025 EUR 500,000 507,195 0.05 UniCredit SpA, Reg. S, FRN 1.25%
25/06/2025 EUR 100,000 103,379 0.01 UniCredit SpA, Reg. S 2.125%
24/10/2026 EUR 700,000 776,233 0.07
6,556,814 0.59
JapanAsahi Group Holdings Ltd., Reg. S 0.155%
23/10/2024 EUR 400,000 402,656 0.04 Asahi Group Holdings Ltd., Reg. S 0.541%
23/10/2028 EUR 500,000 508,529 0.04 Nissan Motor Co. Ltd., Reg. S 1.94%
15/09/2023 EUR 100,000 104,300 0.01 Nissan Motor Co. Ltd., Reg. S 2.652%
17/03/2026 EUR 400,000 423,411 0.04
1,438,896 0.13

299 Morgan Stanley Investment Funds 31 December 2020
The accompanying notes are an integral part of these financial statements.
Global Balanced Fund (continued)
schEDUlE of InVEsTmEnTsAs at 31 December 2020
Investments Currency
Quantity/ Nominal
Value
Market Value EUR
% of Net Assets
Transferable securities and money market instruments admitted to official exchange listing or dealt in on another regulated market
corporate Bonds (continued)
luxembourgBlackstone Property Partners Europe
Holdings Sarl, Reg. S 1.4% 06/07/2022 EUR 1,050,000 1,066,872 0.10 Blackstone Property Partners Europe
Holdings Sarl, Reg. S 1.25% 26/04/2027 EUR 550,000 564,083 0.05
Logicor Financing Sarl, Reg. S 1.5% 14/11/2022 EUR 1,070,000 1,096,663 0.10
Logicor Financing Sarl, Reg. S 1.5% 13/07/2026 EUR 750,000 792,330 0.07
SELP Finance Sarl, REIT, Reg. S 1.25% 25/10/2023 EUR 570,000 589,134 0.05
SELP Finance Sarl, REIT, Reg. S 1.5% 20/12/2026 EUR 600,000 644,786 0.06
4,753,868 0.43
netherlandsASR Nederland NV, Reg. S, FRN 5.125%
29/09/2045 EUR 500,000 596,250 0.05 ASR Nederland NV, Reg. S, FRN 5%
Perpetual EUR 600,000 678,525 0.06 de Volksbank NV, Reg. S 1.75%
22/10/2030 EUR 500,000 528,220 0.05 ING Groep NV, Reg. S, FRN 2%
22/03/2030 EUR 500,000 530,391 0.05 LeasePlan Corp. NV, Reg. S 0.75%
03/10/2022 EUR 300,000 304,142 0.03 NN Group NV, Reg. S, FRN 4.625%
08/04/2044 EUR 1,000,000 1,126,500 0.10 Shell International Finance BV, Reg. S
1.25% 11/11/2032 EUR 400,000 443,002 0.04 Signify NV, Reg. S 2% 11/05/2024 EUR 800,000 846,464 0.08 Signify NV, Reg. S 2.375% 11/05/2027 EUR 450,000 499,347 0.04
5,552,841 0.50
singaporeDBS Group Holdings Ltd., Reg. S, FRN
1.5% 11/04/2028 EUR 1,100,000 1,123,426 0.10
1,123,426 0.10
spainAbertis Infraestructuras SA, Reg. S
2.375% 27/09/2027 EUR 200,000 221,752 0.02 Amadeus IT Group SA, Reg. S 1.875%
24/09/2028 EUR 500,000 534,237 0.05 Banco Bilbao Vizcaya Argentaria SA,
Reg. S, FRN 1% 16/01/2030 EUR 400,000 400,110 0.04 Banco Santander SA, Reg. S 3.125%
19/01/2027 EUR 1,000,000 1,143,707 0.10 Banco Santander SA, Reg. S 2.125%
08/02/2028 EUR 500,000 546,574 0.05 CaixaBank SA, Reg. S, FRN 2.25%
17/04/2030 EUR 1,000,000 1,047,493 0.09 Cellnex Telecom SA 1.875% 26/06/2029 EUR 400,000 411,715 0.04 Iberdrola International BV, Reg. S, FRN
1.875% Perpetual EUR 800,000 822,500 0.07 Inmobiliaria Colonial Socimi SA, Reg. S
1.35% 14/10/2028 EUR 500,000 517,433 0.05 Inmobiliaria Colonial Socimi SA, REIT,
Reg. S 2% 17/04/2026 EUR 500,000 538,562 0.05 Madrilena Red de Gas Finance BV, Reg. S
1.375% 11/04/2025 EUR 500,000 517,407 0.05
schEDUlE of InVEsTmEnTsAs at 31 December 2020
Investments Currency
Quantity/ Nominal
Value
Market Value EUR
% of Net Assets
Transferable securities and money market instruments admitted to official exchange listing or dealt in on another regulated market
corporate Bonds (continued)
spain (continued)NorteGas Energia Distribucion SA, Reg. S
0.918% 28/09/2022 EUR 700,000 708,124 0.06 Prosegur Cia de Seguridad SA, Reg. S
1% 08/02/2023 EUR 500,000 509,111 0.04 Redexis Gas Finance BV, Reg. S 1.875%
28/05/2025 EUR 800,000 853,000 0.08
8,771,725 0.79
swedenAkelius Residential Property Financing BV,
Reg. S 1% 17/01/2028 EUR 550,000 567,639 0.05 Akelius Residential Property Financing BV,
Reg. S 1.125% 11/01/2029 EUR 300,000 310,571 0.03 Scania CV AB, Reg. S 0% 23/11/2022 EUR 500,000 500,388 0.04
1,378,598 0.12
switzerlandSyngenta Finance NV, Reg. S 3.375%
16/04/2026 EUR 450,000 486,825 0.04
486,825 0.04
United KingdomAnnington Funding plc, Reg. S 1.65%
12/07/2024 EUR 750,000 787,781 0.07 Barclays plc, Reg. S, FRN 3.375%
02/04/2025 EUR 400,000 441,658 0.04 BAT Netherlands Finance BV, Reg. S
3.125% 07/04/2028 EUR 350,000 408,946 0.04 BP Capital Markets plc, Reg. S 0.831%
08/11/2027 EUR 400,000 418,692 0.04 BP Capital Markets plc, Reg. S 3.25%
Perpetual EUR 750,000 801,563 0.07 BP Capital Markets plc, Reg. S, FRN
3.625% Perpetual EUR 400,000 438,500 0.04 CK Hutchison Group Telecom Finance SA,
Reg. S 0.375% 17/10/2023 EUR 650,000 656,443 0.06 CK Hutchison Group Telecom Finance SA,
Reg. S 1.5% 17/10/2031 EUR 250,000 269,243 0.02 CNH Industrial Finance Europe SA, Reg. S
0% 01/04/2024 EUR 300,000 299,782 0.03 Heathrow Funding Ltd., Reg. S 1.5%
12/10/2027 EUR 350,000 366,533 0.03 Heathrow Funding Ltd., Reg. S 1.875%
23/05/2024 EUR 1,000,000 1,026,954 0.09 HSBC Holdings plc, Reg. S 3%
30/06/2025 EUR 1,000,000 1,120,762 0.10 Imperial Brands Finance plc, Reg. S
1.125% 14/08/2023 EUR 600,000 615,846 0.06 Imperial Brands Finance plc, Reg. S
2.125% 12/02/2027 EUR 600,000 650,384 0.06 Informa plc, Reg. S 1.5% 05/07/2023 EUR 800,000 820,637 0.07 Lloyds Banking Group plc, Reg. S, FRN
0.625% 15/01/2024 EUR 900,000 910,413 0.08 Lloyds Banking Group plc, Reg. S, FRN
1.75% 07/09/2028 EUR 970,000 999,285 0.09 NGG Finance plc, Reg. S, FRN 1.625%
05/12/2079 EUR 800,000 815,000 0.07 Santander UK Group Holdings plc, Reg. S,
FRN 0.391% 28/02/2025 EUR 550,000 554,872 0.05 Standard Chartered plc, Reg. S, FRN
0.75% 03/10/2023 EUR 320,000 325,105 0.03

Morgan Stanley Investment Funds 31 December 2020 300
The accompanying notes are an integral part of these financial statements.
Global Balanced Fund (continued)
schEDUlE of InVEsTmEnTsAs at 31 December 2020
Investments Currency
Quantity/ Nominal
Value
Market Value EUR
% of Net Assets
Transferable securities and money market instruments admitted to official exchange listing or dealt in on another regulated market
corporate Bonds (continued)
United Kingdom (continued)Tesco Corporate Treasury Services plc,
Reg. S 2.5% 01/07/2024 EUR 800,000 867,698 0.08 Vodafone Group plc, Reg. S 2.875%
20/11/2037 EUR 300,000 385,861 0.04 Yorkshire Building Society, Reg. S
0.875% 20/03/2023 EUR 500,000 511,230 0.05
14,493,188 1.31
United states of americaAbbVie, Inc. 1.25% 01/06/2024 EUR 500,000 520,213 0.05 AT&T, Inc. 1.6% 19/05/2028 EUR 750,000 819,476 0.07 AT&T, Inc. 2.45% 15/03/2035 EUR 500,000 588,935 0.05 Bank of America Corp., Reg. S 0.654%
26/10/2031 EUR 800,000 820,588 0.07 Bank of America Corp., Reg. S, FRN
3.648% 31/03/2029 EUR 650,000 809,006 0.07 Becton Dickinson Euro Finance Sarl
0.632% 04/06/2023 EUR 750,000 761,086 0.07 Capital One Financial Corp. 0.8%
12/06/2024 EUR 800,000 818,948 0.07 Chubb INA Holdings, Inc. 0.875%
15/06/2027 EUR 500,000 526,466 0.05 DH Europe Finance II Sarl 1.8%
18/09/2049 EUR 400,000 454,430 0.04 Discovery Communications LLC 1.9%
19/03/2027 EUR 600,000 643,671 0.06 DXC Technology Co. 1.75% 15/01/2026 EUR 850,000 874,110 0.08 Eli Lilly and Co. 1.7% 01/11/2049 EUR 300,000 356,277 0.03 General Electric Co. 0.875%
17/05/2025 EUR 400,000 412,220 0.04 JPMorgan Chase & Co., Reg. S, FRN
0.389% 24/02/2028 EUR 550,000 559,641 0.05 Liberty Mutual Group, Inc., Reg. S, FRN
3.625% 23/05/2059 EUR 500,000 516,934 0.05 Marsh & McLennan Cos., Inc. 1.349%
21/09/2026 EUR 800,000 855,886 0.08 Marsh & McLennan Cos., Inc. 1.979%
21/03/2030 EUR 500,000 574,074 0.05 Mohawk Industries, Inc. 2% 14/01/2022 EUR 870,000 883,631 0.08 PACCAR Financial Europe BV, Reg. S 0%
03/03/2023 EUR 300,000 300,490 0.03 Philip Morris International, Inc. 0.125%
03/08/2026 EUR 650,000 650,777 0.06 Thermo Fisher Scientific, Inc. 1.875%
01/10/2049 EUR 200,000 232,379 0.02 Upjohn Finance BV, Reg. S 1.362%
23/06/2027 EUR 800,000 848,982 0.08 Upjohn Finance BV, Reg. S 1.908%
23/06/2032 EUR 350,000 387,701 0.03 Verizon Communications, Inc. 1.3%
18/05/2033 EUR 500,000 544,865 0.05 Verizon Communications, Inc. 1.85%
18/05/2040 EUR 300,000 345,487 0.03 Wells Fargo & Co., Reg. S 0.5%
26/04/2024 EUR 500,000 507,770 0.05 Wells Fargo & Co., Reg. S, FRN 1.338%
04/05/2025 EUR 450,000 468,908 0.04
16,082,951 1.45
Total corporate Bonds 99,211,679 8.96
schEDUlE of InVEsTmEnTsAs at 31 December 2020
Investments Currency
Quantity/ Nominal
Value
Market Value EUR
% of Net Assets
Transferable securities and money market instruments admitted to official exchange listing or dealt in on another regulated market
Government Bonds
franceFrance Government Bond OAT, Reg. S
0% 25/03/2023 EUR 10,908,000 11,084,248 1.00 France Government Bond OAT, Reg. S
0% 25/03/2024 EUR 11,364,000 11,629,634 1.05 France Government Bond OAT, Reg. S
1.75% 25/11/2024 EUR 17,380,000 19,068,936 1.72 France Government Bond OAT, Reg. S
2.5% 25/05/2030 EUR 22,517,000 28,768,384 2.60
70,551,202 6.37
GermanyBundesobligation, Reg. S 0%
14/04/2023 EUR 27,039,000 27,511,155 2.48 Bundesobligation, Reg. S 0%
05/04/2024 EUR 7,112,000 7,293,768 0.66 Bundesrepublik Deutschland, Reg. S 0%
15/08/2026 EUR 5,264,000 5,487,878 0.50 Bundesrepublik Deutschland, Reg. S 5.5%
04/01/2031 EUR 8,215,000 13,401,992 1.21 Bundesschatzanweisungen, Reg. S 0%
15/12/2022 EUR 10,931,000 11,083,794 1.00
64,778,587 5.85
ItalyItaly Buoni Poliennali Del Tesoro, Reg. S
0.45% 01/06/2021 EUR 9,535,000 9,572,663 0.87 Italy Buoni Poliennali Del Tesoro, Reg. S
1.75% 01/07/2024 EUR 11,003,000 11,765,739 1.06 Italy Buoni Poliennali Del Tesoro, Reg. S
1.35% 01/04/2030 EUR 15,681,000 16,976,917 1.53
38,315,319 3.46
JapanJapan Government Twenty Year Bond
2.2% 20/03/2030 JPY 2,347,550,000 22,347,097 2.02 Japan Government Twenty Year Bond
1.7% 20/06/2033 JPY 2,619,800,000 24,719,295 2.23
47,066,392 4.25
spainSpain Government Bond 0.05%
31/01/2021 EUR 4,470,000 4,472,490 0.40 Spain Government Bond, Reg. S, 144A
3.8% 30/04/2024 EUR 14,014,000 16,059,988 1.45 Spain Government Bond, Reg. S, 144A
1.95% 30/04/2026 EUR 10,953,000 12,345,000 1.11 Spain Government Bond, Reg. S, 144A
1.95% 30/07/2030 EUR 5,592,000 6,635,451 0.60
39,512,929 3.56
United KingdomUK Treasury, Reg. S 4.75% 07/12/2038 GBP 6,329,000 12,089,002 1.09 UK Treasury, Reg. S 4.25% 07/06/2032 GBP 1,055,000 1,695,844 0.15
13,784,846 1.24

301 Morgan Stanley Investment Funds 31 December 2020
The accompanying notes are an integral part of these financial statements.
Global Balanced Fund (continued)
schEDUlE of InVEsTmEnTsAs at 31 December 2020
Investments Currency
Quantity/ Nominal
Value
Market Value EUR
% of Net Assets
Transferable securities and money market instruments admitted to official exchange listing or dealt in on another regulated market
Government Bonds (continued)
United states of americaUS Treasury 1.75% 31/01/2023 USD 68,245,000 57,499,365 5.19 US Treasury 2.5% 15/05/2024 USD 19,865,000 17,449,892 1.58 US Treasury 1.625% 15/05/2026 USD 33,201,000 28,807,276 2.60 US Treasury 2.625% 15/02/2029 USD 90,157,000 84,305,305 7.61
188,061,838 16.98
Total Government Bonds 462,071,113 41.71
Warrants
switzerlandCie Financiere Richemont SA 22/11/2023 CHF 21,066 4,485 0.00
4,485 0.00
Total Warrants 4,485 0.00
Equities
argentinaGlobant SA USD 594 104,427 0.01
104,427 0.01
austriaANDRITZ AG EUR 4,185 155,883 0.01 Erste Group Bank AG EUR 5,287 132,743 0.01 OMV AG EUR 28,828 937,114 0.09 Verbund AG EUR 5,903 410,010 0.04 voestalpine AG EUR 3,246 94,355 0.01
1,730,105 0.16
BelgiumKBC Group NV EUR 4,651 266,410 0.02 UCB SA EUR 4,613 389,706 0.04
656,116 0.06
BrazilAtacadao SA BRL 23,300 70,737 0.01 Banco Bradesco SA BRL 86,500 327,556 0.03 Banco Bradesco SA Preference BRL 4,230 17,969 0.00 Banco do Brasil SA BRL 9,000 54,912 0.01 Banco Santander Brasil SA BRL 39,700 279,523 0.03 CCR SA BRL 7,600 16,017 0.00 Cia Brasileira de Distribuicao BRL 5,000 58,851 0.01 Cia Energetica de Minas Gerais Preference BRL 22,904 52,369 0.00 Cosan SA BRL 5,400 63,941 0.01 CPFL Energia SA BRL 5,300 27,054 0.00 Engie Brasil Energia SA BRL 1,650 11,368 0.00 Klabin SA BRL 28,200 116,310 0.01 Localiza Rent a Car SA BRL 1,600 17,279 0.00 Lojas Renner SA BRL 9,930 67,630 0.01 Magazine Luiza SA BRL 13,700 53,458 0.00 Natura & Co. Holding SA BRL 8,000 65,612 0.01 Notre Dame Intermedica Participacoes SA BRL 2,100 25,786 0.00 Rumo SA BRL 4,200 12,614 0.00 Ultrapar Participacoes SA BRL 13,100 48,515 0.00
schEDUlE of InVEsTmEnTsAs at 31 December 2020
Investments Currency
Quantity/ Nominal
Value
Market Value EUR
% of Net Assets
Transferable securities and money market instruments admitted to official exchange listing or dealt in on another regulated market
Equities (continued)
Brazil (continued)Via Varejo S/A BRL 39,500 99,701 0.01 WEG SA BRL 550 6,527 0.00
1,493,729 0.14
china3SBio, Inc., Reg. S HKD 113,500 84,348 0.01 51job, Inc., ADR USD 1,200 66,781 0.01 Agricultural Bank of China Ltd. ‘H’ HKD 1,135,000 338,822 0.03 AK Medical Holdings Ltd., Reg. S HKD 22,000 31,126 0.00 Alibaba Group Holding Ltd., ADR USD 19,769 3,800,120 0.34 Alibaba Health Information Technology Ltd. HKD 34,000 81,841 0.01 AviChina Industry & Technology Co. Ltd. ‘H’ HKD 40,000 22,746 0.00 Baidu, Inc., ADR USD 2,506 443,300 0.04 Baozun, Inc., ADR USD 3,281 89,797 0.01 Beijing Capital International Airport Co. Ltd. ‘H’ HKD 22,000 14,962 0.00 Beijing Enterprises Water Group Ltd. HKD 98,000 32,139 0.00 BYD Co. Ltd. ‘H’ HKD 10,000 213,590 0.02 BYD Electronic International Co. Ltd. HKD 26,000 110,957 0.01 CGN Power Co. Ltd., Reg. S ‘H’ HKD 466,000 81,801 0.01 China Communications Services Corp. Ltd. ‘H’ HKD 42,000 15,098 0.00 China Conch Venture Holdings Ltd. HKD 31,000 122,846 0.01 China Construction Bank Corp. ‘H’ HKD 778,000 481,673 0.04 China East Education Holdings Ltd., Reg. S HKD 50,500 98,945 0.01 China Everbright Bank Co. Ltd. ‘H’ HKD 416,000 128,995 0.01 China Everbright Environment Group Ltd. HKD 21,000 9,668 0.00 China Evergrande Group HKD 25,000 39,155 0.00 China Gas Holdings Ltd. HKD 14,400 46,620 0.00 China Jinmao Holdings Group Ltd. HKD 36,000 13,509 0.00 China Lesso Group Holdings Ltd. HKD 10,000 12,761 0.00 China Literature Ltd., Reg. S HKD 7,200 46,052 0.00 China Longyuan Power Group Corp. Ltd. ‘H’ HKD 189,000 154,362 0.01 China Medical System Holdings Ltd. HKD 126,000 114,695 0.01 China Mobile Ltd. HKD 40,000 185,840 0.02 China Molybdenum Co. Ltd. ‘H’ HKD 909,000 483,472 0.04 China Overseas Land & Investment Ltd. HKD 63,500 112,535 0.01 China Petroleum & Chemical Corp. ‘H’ HKD 644,000 234,894 0.02 China Railway Construction Corp. Ltd. ‘H’ HKD 55,500 24,735 0.00 China Railway Signal & Communication
Corp. Ltd., Reg. S ‘H’ HKD 815,000 222,735 0.02 China Resources Gas Group Ltd. HKD 6,000 26,015 0.00 China Resources Land Ltd. HKD 58,000 195,090 0.02 China Southern Airlines Co. Ltd. ‘H’ HKD 16,000 7,770 0.00 China State Construction International
Holdings Ltd. HKD 48,000 22,301 0.00 China Vanke Co. Ltd. ‘H’ HKD 58,600 164,770 0.02 COSCO SHIPPING Energy
Transportation Co. Ltd. ‘H’ HKD 508,000 162,862 0.02 COSCO SHIPPING Holdings Co. Ltd. ‘H’ HKD 3,000 2,933 0.00 CRRC Corp. Ltd. ‘H’ HKD 59,000 16,558 0.00 CSPC Pharmaceutical Group Ltd. HKD 163,200 136,035 0.01 Dongfeng Motor Group Co. Ltd. ‘H’ HKD 758,000 720,269 0.07 ENN Energy Holdings Ltd. HKD 4,100 49,044 0.01 Fosun International Ltd. HKD 26,000 33,287 0.00 Fuyao Glass Industry Group Co. Ltd., Reg. S ‘H’ HKD 81,200 363,599 0.03 GDS Holdings Ltd., ADR USD 1,226 93,149 0.01 Geely Automobile Holdings Ltd. HKD 151,000 420,610 0.04 GOME Retail Holdings Ltd. HKD 1,715,000 167,650 0.02 Greentown Service Group Co. Ltd., Reg. S HKD 28,000 28,166 0.00 GSX Techedu, Inc., ADR USD 863 35,872 0.00 Guangdong Investment Ltd. HKD 36,000 52,826 0.01 Guangzhou R&F Properties Co. Ltd. ‘H’ HKD 27,600 28,924 0.00 Haitian International Holdings Ltd. HKD 4,000 11,268 0.00 Haitong Securities Co. Ltd. ‘H’ HKD 178,000 129,661 0.01 Huazhu Group Ltd., ADR USD 2,607 95,616 0.01

Morgan Stanley Investment Funds 31 December 2020 302
The accompanying notes are an integral part of these financial statements.
Global Balanced Fund (continued)
schEDUlE of InVEsTmEnTsAs at 31 December 2020
Investments Currency
Quantity/ Nominal
Value
Market Value EUR
% of Net Assets
Transferable securities and money market instruments admitted to official exchange listing or dealt in on another regulated market
Equities (continued)
china (continued)JD.com, Inc., ADR USD 4,658 333,821 0.03 Kaisa Group Holdings Ltd. HKD 41,000 16,506 0.00 Kingdee International Software Group Co. Ltd. HKD 10,000 33,216 0.00 Kingsoft Corp. Ltd. HKD 13,000 68,324 0.01 Koolearn Technology Holding Ltd., Reg. S HKD 92,000 269,804 0.02 KWG Group Holdings Ltd. HKD 19,000 21,130 0.00 Lee & Man Paper Manufacturing Ltd. HKD 77,000 51,395 0.01 Lenovo Group Ltd. HKD 48,000 36,933 0.00 Li Ning Co. Ltd. HKD 15,000 84,038 0.01 Logan Group Co. Ltd. HKD 67,000 89,441 0.01 Longfor Group Holdings Ltd., Reg. S HKD 5,500 26,247 0.00 Luye Pharma Group Ltd., Reg. S HKD 188,000 71,338 0.01 Meituan Dianping, Reg. S ‘B’ HKD 26,700 826,801 0.08 NetEase, Inc., ADR USD 1,724 134,330 0.01 Ping An Healthcare and Technology Co. Ltd.,
Reg. S HKD 7,800 77,069 0.01 Ping An Insurance Group Co. of China Ltd. ‘H’ HKD 178,500 1,782,456 0.16 Seazen Group Ltd. HKD 14,000 9,492 0.00 Semiconductor Manufacturing
International Corp. HKD 80,500 187,002 0.02 Shanghai Electric Group Co. Ltd. ‘H’ HKD 564,000 141,095 0.01 Shanghai Pharmaceuticals Holding Co. Ltd. ‘H’ HKD 250,300 359,392 0.03 Shenzhen International Holdings Ltd. HKD 6,500 8,554 0.00 Shenzhen Investment Ltd. HKD 150,000 41,940 0.00 Shenzhou International Group Holdings Ltd. HKD 22,300 356,292 0.03 Sinopharm Group Co. Ltd. ‘H’ HKD 27,200 53,922 0.01 SOHO China Ltd. HKD 30,500 7,406 0.00 Sun Art Retail Group Ltd. HKD 32,000 26,505 0.00 Sunac China Holdings Ltd. HKD 20,000 60,230 0.01 Sunny Optical Technology Group Co. Ltd. HKD 5,100 90,972 0.01 TAL Education Group, ADR USD 1,389 81,352 0.01 Tencent Holdings Ltd. HKD 43,100 2,555,133 0.23 Tencent Music Entertainment Group, ADR USD 4,327 66,372 0.01 Tongcheng-Elong Holdings Ltd., Reg. S HKD 190,800 300,834 0.03 Trip.com Group Ltd., ADR USD 9,431 255,580 0.02 Vinda International Holdings Ltd. HKD 13,000 28,901 0.00 Weichai Power Co. Ltd. ‘H’ HKD 43,000 70,329 0.01 Wharf Holdings Ltd. (The) HKD 5,000 10,958 0.00 Wuxi Biologics Cayman, Inc., Reg. S HKD 57,000 615,921 0.06 Xiaomi Corp., Reg. S ‘B’ HKD 65,600 228,928 0.02 Xinyi Solar Holdings Ltd. HKD 370,000 787,560 0.07 Yihai International Holding Ltd. HKD 12,000 145,056 0.01 Yum China Holdings, Inc. USD 2,433 113,446 0.01 Yuzhou Group Holdings Co. Ltd. HKD 35,000 10,301 0.00 Zhaojin Mining Industry Co. Ltd. ‘H’ HKD 82,500 80,041 0.01 Zhenro Properties Group Ltd., Reg. S HKD 31,000 15,217 0.00 ZhongAn Online P&C Insurance Co. Ltd.,
Reg. S ‘H’ HKD 54,800 208,519 0.02 Zhuzhou CRRC Times Electric Co. Ltd. ‘H’ HKD 20,600 73,188 0.01 ZTE Corp. ‘H’ HKD 41,400 84,858 0.01 ZTO Express Cayman, Inc., ADR USD 1,283 30,262 0.00
21,953,602 1.98
colombiaInterconexion Electrica SA ESP COP 3,842 23,582 0.00
23,582 0.00
DenmarkGenmab A/S DKK 1,975 646,383 0.06 H Lundbeck A/S DKK 11,083 309,618 0.03 Novo Nordisk A/S ‘B’ DKK 51,277 2,907,927 0.26 Novozymes A/S ‘B’ DKK 8,434 392,874 0.03
schEDUlE of InVEsTmEnTsAs at 31 December 2020
Investments Currency
Quantity/ Nominal
Value
Market Value EUR
% of Net Assets
Transferable securities and money market instruments admitted to official exchange listing or dealt in on another regulated market
Equities (continued)
Denmark (continued)Orsted A/S, Reg. S DKK 2,507 414,265 0.04 Pandora A/S DKK 2,119 192,592 0.02 Tryg A/S DKK 3,258 83,617 0.01 Vestas Wind Systems A/S DKK 1,385 266,727 0.02
5,214,003 0.47
finlandNeste OYJ EUR 5,715 337,539 0.03 Nokia OYJ EUR 107,914 339,493 0.03 UPM-Kymmene OYJ EUR 16,784 510,704 0.05
1,187,736 0.11
franceAirbus SE EUR 7,647 686,548 0.06 Alstom SA EUR 3,208 149,525 0.01 Amundi SA, Reg. S EUR 1,845 123,246 0.01 Atos SE EUR 4,541 339,576 0.03 AXA SA EUR 34,530 673,749 0.06 BNP Paribas SA EUR 20,824 897,619 0.08 Capgemini SE EUR 3,934 498,831 0.05 Carrefour SA EUR 67,495 946,955 0.09 Cie Generale des Etablissements Michelin SCA EUR 2,281 239,391 0.02 Dassault Systemes SE EUR 3,634 603,789 0.05 EssilorLuxottica SA EUR 1,018 129,846 0.01 Gecina SA, REIT EUR 5,646 713,090 0.06 Getlink SE EUR 14,870 210,857 0.02 Kering SA EUR 156 92,726 0.01 Legrand SA EUR 4,388 320,324 0.03 L’Oreal SA EUR 4,598 1,429,058 0.13 LVMH Moet Hennessy Louis Vuitton SE EUR 2,643 1,350,309 0.12 Natixis SA EUR 45,963 128,191 0.01 Orange SA EUR 15,137 147,344 0.01 Orpea SA EUR 1,597 171,757 0.02 Pernod Ricard SA EUR 9,479 1,486,307 0.13 Publicis Groupe SA EUR 2,319 94,522 0.01 Sanofi EUR 10,893 857,279 0.08 Schneider Electric SE EUR 6,335 749,431 0.07 Societe Generale SA EUR 6,473 110,183 0.01 Teleperformance EUR 698 189,367 0.02 Thales SA EUR 4,135 309,712 0.03 TOTAL SE EUR 45,419 1,603,291 0.15 Valeo SA EUR 21,753 702,187 0.06 Vinci SA EUR 5,903 480,268 0.04 Vivendi SA EUR 6,938 183,024 0.02
16,618,302 1.50
Germanyadidas AG EUR 3,840 1,136,252 0.10 Allianz SE EUR 4,407 876,350 0.08 BASF SE EUR 2,686 172,144 0.02 Beiersdorf AG EUR 10,692 1,029,508 0.09 Brenntag AG EUR 5,181 326,780 0.03 Deutsche Boerse AG EUR 2,714 374,748 0.03 Deutsche Post AG EUR 14,509 586,042 0.05 Fresenius SE & Co. KGaA EUR 18,547 695,497 0.06 KION Group AG EUR 2,639 186,613 0.02 Merck KGaA EUR 4,096 571,407 0.05 MTU Aero Engines AG EUR 2,129 452,188 0.04 SAP SE EUR 12,114 1,286,840 0.12 Siemens AG EUR 11,801 1,378,563 0.13
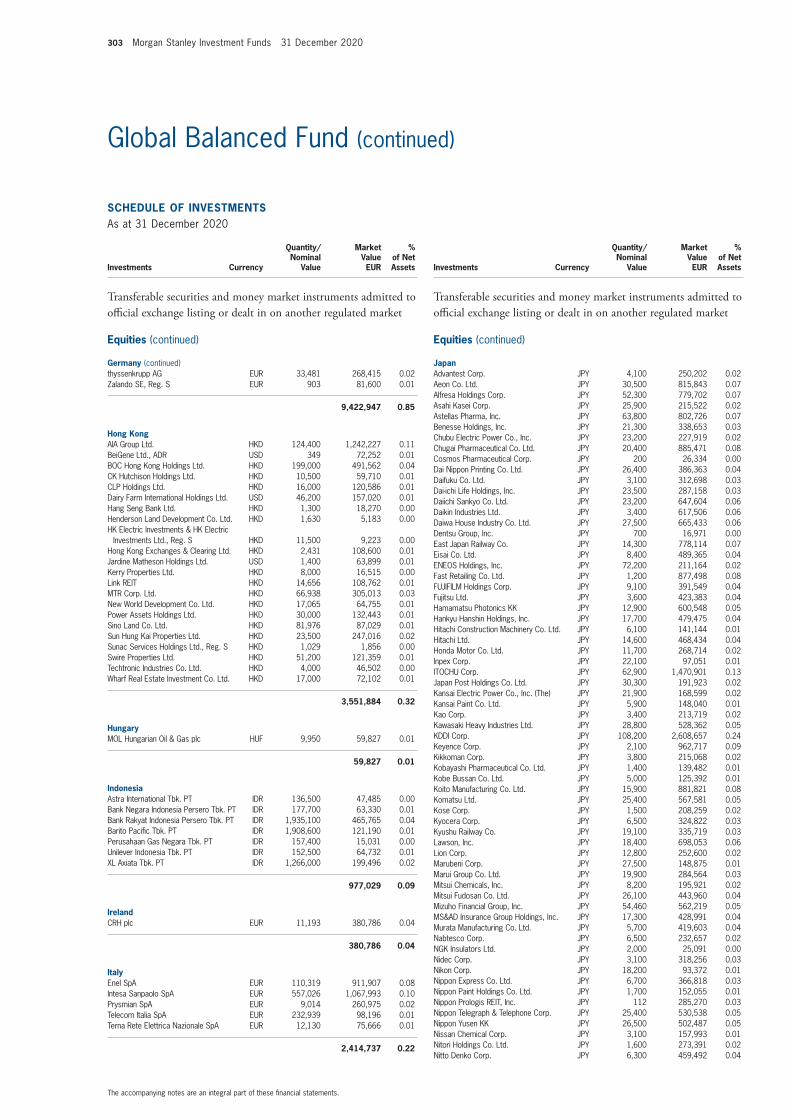
303 Morgan Stanley Investment Funds 31 December 2020
The accompanying notes are an integral part of these financial statements.
Global Balanced Fund (continued)
schEDUlE of InVEsTmEnTsAs at 31 December 2020
Investments Currency
Quantity/ Nominal
Value
Market Value EUR
% of Net Assets
Transferable securities and money market instruments admitted to official exchange listing or dealt in on another regulated market
Equities (continued)
Germany (continued)thyssenkrupp AG EUR 33,481 268,415 0.02 Zalando SE, Reg. S EUR 903 81,600 0.01
9,422,947 0.85
hong KongAIA Group Ltd. HKD 124,400 1,242,227 0.11 BeiGene Ltd., ADR USD 349 72,252 0.01 BOC Hong Kong Holdings Ltd. HKD 199,000 491,562 0.04 CK Hutchison Holdings Ltd. HKD 10,500 59,710 0.01 CLP Holdings Ltd. HKD 16,000 120,586 0.01 Dairy Farm International Holdings Ltd. USD 46,200 157,020 0.01 Hang Seng Bank Ltd. HKD 1,300 18,270 0.00 Henderson Land Development Co. Ltd. HKD 1,630 5,183 0.00 HK Electric Investments & HK Electric
Investments Ltd., Reg. S HKD 11,500 9,223 0.00 Hong Kong Exchanges & Clearing Ltd. HKD 2,431 108,600 0.01 Jardine Matheson Holdings Ltd. USD 1,400 63,899 0.01 Kerry Properties Ltd. HKD 8,000 16,515 0.00 Link REIT HKD 14,656 108,762 0.01 MTR Corp. Ltd. HKD 66,938 305,013 0.03 New World Development Co. Ltd. HKD 17,065 64,755 0.01 Power Assets Holdings Ltd. HKD 30,000 132,443 0.01 Sino Land Co. Ltd. HKD 81,976 87,029 0.01 Sun Hung Kai Properties Ltd. HKD 23,500 247,016 0.02 Sunac Services Holdings Ltd., Reg. S HKD 1,029 1,856 0.00 Swire Properties Ltd. HKD 51,200 121,359 0.01 Techtronic Industries Co. Ltd. HKD 4,000 46,502 0.00 Wharf Real Estate Investment Co. Ltd. HKD 17,000 72,102 0.01
3,551,884 0.32
hungaryMOL Hungarian Oil & Gas plc HUF 9,950 59,827 0.01
59,827 0.01
IndonesiaAstra International Tbk. PT IDR 136,500 47,485 0.00 Bank Negara Indonesia Persero Tbk. PT IDR 177,700 63,330 0.01 Bank Rakyat Indonesia Persero Tbk. PT IDR 1,935,100 465,765 0.04 Barito Pacific Tbk. PT IDR 1,908,600 121,190 0.01 Perusahaan Gas Negara Tbk. PT IDR 157,400 15,031 0.00 Unilever Indonesia Tbk. PT IDR 152,500 64,732 0.01 XL Axiata Tbk. PT IDR 1,266,000 199,496 0.02
977,029 0.09
IrelandCRH plc EUR 11,193 380,786 0.04
380,786 0.04
ItalyEnel SpA EUR 110,319 911,907 0.08 Intesa Sanpaolo SpA EUR 557,026 1,067,993 0.10 Prysmian SpA EUR 9,014 260,975 0.02 Telecom Italia SpA EUR 232,939 98,196 0.01 Terna Rete Elettrica Nazionale SpA EUR 12,130 75,666 0.01
2,414,737 0.22
schEDUlE of InVEsTmEnTsAs at 31 December 2020
Investments Currency
Quantity/ Nominal
Value
Market Value EUR
% of Net Assets
Transferable securities and money market instruments admitted to official exchange listing or dealt in on another regulated market
Equities (continued)
JapanAdvantest Corp. JPY 4,100 250,202 0.02 Aeon Co. Ltd. JPY 30,500 815,843 0.07 Alfresa Holdings Corp. JPY 52,300 779,702 0.07 Asahi Kasei Corp. JPY 25,900 215,522 0.02 Astellas Pharma, Inc. JPY 63,800 802,726 0.07 Benesse Holdings, Inc. JPY 21,300 338,653 0.03 Chubu Electric Power Co., Inc. JPY 23,200 227,919 0.02 Chugai Pharmaceutical Co. Ltd. JPY 20,400 885,471 0.08 Cosmos Pharmaceutical Corp. JPY 200 26,334 0.00 Dai Nippon Printing Co. Ltd. JPY 26,400 386,363 0.04 Daifuku Co. Ltd. JPY 3,100 312,698 0.03 Dai-ichi Life Holdings, Inc. JPY 23,500 287,158 0.03 Daiichi Sankyo Co. Ltd. JPY 23,200 647,604 0.06 Daikin Industries Ltd. JPY 3,400 617,506 0.06 Daiwa House Industry Co. Ltd. JPY 27,500 665,433 0.06 Dentsu Group, Inc. JPY 700 16,971 0.00 East Japan Railway Co. JPY 14,300 778,114 0.07 Eisai Co. Ltd. JPY 8,400 489,365 0.04 ENEOS Holdings, Inc. JPY 72,200 211,164 0.02 Fast Retailing Co. Ltd. JPY 1,200 877,498 0.08 FUJIFILM Holdings Corp. JPY 9,100 391,549 0.04 Fujitsu Ltd. JPY 3,600 423,383 0.04 Hamamatsu Photonics KK JPY 12,900 600,548 0.05 Hankyu Hanshin Holdings, Inc. JPY 17,700 479,475 0.04 Hitachi Construction Machinery Co. Ltd. JPY 6,100 141,144 0.01 Hitachi Ltd. JPY 14,600 468,434 0.04 Honda Motor Co. Ltd. JPY 11,700 268,714 0.02 Inpex Corp. JPY 22,100 97,051 0.01 ITOCHU Corp. JPY 62,900 1,470,901 0.13 Japan Post Holdings Co. Ltd. JPY 30,300 191,923 0.02 Kansai Electric Power Co., Inc. (The) JPY 21,900 168,599 0.02 Kansai Paint Co. Ltd. JPY 5,900 148,040 0.01 Kao Corp. JPY 3,400 213,719 0.02 Kawasaki Heavy Industries Ltd. JPY 28,800 528,362 0.05 KDDI Corp. JPY 108,200 2,608,657 0.24 Keyence Corp. JPY 2,100 962,717 0.09 Kikkoman Corp. JPY 3,800 215,068 0.02 Kobayashi Pharmaceutical Co. Ltd. JPY 1,400 139,482 0.01 Kobe Bussan Co. Ltd. JPY 5,000 125,392 0.01 Koito Manufacturing Co. Ltd. JPY 15,900 881,821 0.08 Komatsu Ltd. JPY 25,400 567,581 0.05 Kose Corp. JPY 1,500 208,259 0.02 Kyocera Corp. JPY 6,500 324,822 0.03 Kyushu Railway Co. JPY 19,100 335,719 0.03 Lawson, Inc. JPY 18,400 698,053 0.06 Lion Corp. JPY 12,800 252,600 0.02 Marubeni Corp. JPY 27,500 148,875 0.01 Marui Group Co. Ltd. JPY 19,900 284,564 0.03 Mitsui Chemicals, Inc. JPY 8,200 195,921 0.02 Mitsui Fudosan Co. Ltd. JPY 26,100 443,960 0.04 Mizuho Financial Group, Inc. JPY 54,460 562,219 0.05 MS&AD Insurance Group Holdings, Inc. JPY 17,300 428,991 0.04 Murata Manufacturing Co. Ltd. JPY 5,700 419,603 0.04 Nabtesco Corp. JPY 6,500 232,657 0.02 NGK Insulators Ltd. JPY 2,000 25,091 0.00 Nidec Corp. JPY 3,100 318,256 0.03 Nikon Corp. JPY 18,200 93,372 0.01 Nippon Express Co. Ltd. JPY 6,700 366,818 0.03 Nippon Paint Holdings Co. Ltd. JPY 1,700 152,055 0.01 Nippon Prologis REIT, Inc. JPY 112 285,270 0.03 Nippon Telegraph & Telephone Corp. JPY 25,400 530,538 0.05 Nippon Yusen KK JPY 26,500 502,487 0.05 Nissan Chemical Corp. JPY 3,100 157,993 0.01 Nitori Holdings Co. Ltd. JPY 1,600 273,391 0.02 Nitto Denko Corp. JPY 6,300 459,492 0.04

Morgan Stanley Investment Funds 31 December 2020 304
The accompanying notes are an integral part of these financial statements.
Global Balanced Fund (continued)
schEDUlE of InVEsTmEnTsAs at 31 December 2020
Investments Currency
Quantity/ Nominal
Value
Market Value EUR
% of Net Assets
Transferable securities and money market instruments admitted to official exchange listing or dealt in on another regulated market
Equities (continued)
Japan (continued)Nomura Holdings, Inc. JPY 63,600 273,699 0.02 Nomura Real Estate Holdings, Inc. JPY 9,700 175,366 0.02 Nomura Real Estate Master Fund, Inc., REIT JPY 89 104,044 0.01 NTT Data Corp. JPY 35,600 396,366 0.04 Odakyu Electric Railway Co. Ltd. JPY 17,600 450,592 0.04 Omron Corp. JPY 10,700 778,535 0.07 Oriental Land Co. Ltd. JPY 4,400 592,054 0.05 ORIX Corp. JPY 23,900 298,985 0.03 Orix JREIT, Inc., REIT JPY 46 62,002 0.01 Osaka Gas Co. Ltd. JPY 16,100 268,437 0.02 Pan Pacific International Holdings Corp. JPY 10,800 203,707 0.02 Panasonic Corp. JPY 58,800 556,201 0.05 Persol Holdings Co. Ltd. JPY 15,900 233,642 0.02 Pola Orbis Holdings, Inc. JPY 14,000 231,405 0.02 Rakuten, Inc. JPY 35,800 281,197 0.03 Recruit Holdings Co. Ltd. JPY 12,400 423,096 0.04 Resona Holdings, Inc. JPY 82,000 233,309 0.02 Santen Pharmaceutical Co. Ltd. JPY 40,700 538,353 0.05 Sekisui Chemical Co. Ltd. JPY 9,800 151,130 0.01 Sekisui House Ltd. JPY 54,300 900,181 0.08 Seven & i Holdings Co. Ltd. JPY 19,600 565,217 0.05 SG Holdings Co. Ltd. JPY 23,400 519,789 0.05 Shimizu Corp. JPY 54,500 323,148 0.03 Shin-Etsu Chemical Co. Ltd. JPY 3,000 427,787 0.04 Shionogi & Co. Ltd. JPY 13,500 599,872 0.05 Shiseido Co. Ltd. JPY 10,400 585,520 0.05 SoftBank Group Corp. JPY 22,700 1,445,046 0.13 Sohgo Security Services Co. Ltd. JPY 500 21,108 0.00 Sompo Holdings, Inc. JPY 6,000 197,844 0.02 Sony Corp. JPY 23,600 1,934,936 0.17 Stanley Electric Co. Ltd. JPY 2,600 68,314 0.01 Sumitomo Chemical Co. Ltd. JPY 127,700 418,082 0.04 Sumitomo Electric Industries Ltd. JPY 6,100 65,852 0.01 Sumitomo Metal Mining Co. Ltd. JPY 7,600 274,935 0.02 Sumitomo Mitsui Financial Group, Inc. JPY 49,300 1,242,937 0.11 Sumitomo Mitsui Trust Holdings, Inc. JPY 10,600 265,633 0.02 Sundrug Co. Ltd. JPY 5,900 191,964 0.02 Sysmex Corp. JPY 6,900 675,639 0.06 Takeda Pharmaceutical Co. Ltd. JPY 25,200 742,036 0.07 Teijin Ltd. JPY 12,000 183,973 0.02 TIS, Inc. JPY 29,600 494,661 0.04 Tohoku Electric Power Co., Inc. JPY 16,200 108,681 0.01 Tokio Marine Holdings, Inc. JPY 8,300 347,651 0.03 Tokyo Electron Ltd. JPY 2,400 727,611 0.07 Tokyu Corp. JPY 66,000 667,568 0.06 Tokyu Fudosan Holdings Corp. JPY 5,900 25,638 0.00 TOTO Ltd. JPY 13,700 670,543 0.06 Toyoda Gosei Co. Ltd. JPY 11,000 259,897 0.02 USS Co. Ltd. JPY 18,000 296,426 0.03 Yamada Holdings Co. Ltd. JPY 158,300 685,760 0.06 Yamaha Motor Co. Ltd. JPY 25,300 420,351 0.04 Yaskawa Electric Corp. JPY 13,000 526,739 0.05 Yokogawa Electric Corp. JPY 38,400 622,331 0.06 Z Holdings Corp. JPY 140,700 693,663 0.06
52,875,265 4.77
malaysiaDialog Group Bhd. MYR 101,600 71,022 0.01 HAP Seng Consolidated Bhd. MYR 47,300 82,422 0.01 Hartalega Holdings Bhd. MYR 35,600 87,569 0.01 IHH Healthcare Bhd. MYR 165,200 184,100 0.02 Malaysia Airports Holdings Bhd. MYR 9,400 11,275 0.00 Maxis Bhd. MYR 391,700 400,798 0.03 Petronas Dagangan Bhd. MYR 82,100 355,990 0.03
schEDUlE of InVEsTmEnTsAs at 31 December 2020
Investments Currency
Quantity/ Nominal
Value
Market Value EUR
% of Net Assets
Transferable securities and money market instruments admitted to official exchange listing or dealt in on another regulated market
Equities (continued)
malaysia (continued)PPB Group Bhd. MYR 30,800 115,577 0.01 RHB Bank Bhd. MYR 678,700 749,471 0.07 Sime Darby Bhd. MYR 132,800 62,157 0.00 Supermax Corp. Bhd. MYR 71,986 87,660 0.01 Tenaga Nasional Bhd. MYR 45,500 96,064 0.01 Westports Holdings Bhd. MYR 71,100 61,947 0.00
2,366,052 0.21
mexicoCemex SAB de CV MXN 6,576 2,771 0.00 Fibra Uno Administracion SA de CV, REIT MXN 19,900 18,437 0.00 Grupo Aeroportuario del Sureste SAB
de CV ‘B’ MXN 3,120 41,147 0.00 Grupo Financiero Banorte SAB de CV ‘O’ MXN 9,300 42,361 0.01 Infraestructura Energetica Nova SAB
de CV MXN 7,500 24,077 0.00 Wal-Mart de Mexico SAB de CV MXN 90,200 213,181 0.02
341,974 0.03
netherlandsAkzo Nobel NV EUR 11,742 1,031,652 0.09 ASML Holding NV EUR 4,972 1,976,618 0.18 ING Groep NV EUR 42,574 325,308 0.03 Just Eat Takeaway.com NV, Reg. S EUR 999 92,308 0.01 Koninklijke Ahold Delhaize NV EUR 31,155 719,992 0.06 Koninklijke KPN NV EUR 140,180 348,628 0.03 NN Group NV EUR 9,993 355,051 0.03 Prosus NV EUR 3,250 287,170 0.03 Wolters Kluwer NV EUR 4,415 304,900 0.03
5,441,627 0.49
norwayAdevinta ASA ‘B’ NOK 6,135 84,229 0.01 Equinor ASA NOK 18,839 258,093 0.02 Norsk Hydro ASA NOK 50,856 192,803 0.02
535,125 0.05
PhilippinesAboitiz Equity Ventures, Inc. PHP 29,490 23,573 0.00 Aboitiz Power Corp. PHP 13,900 6,259 0.00 Ayala Corp. PHP 7,700 107,853 0.01 Ayala Land, Inc. PHP 101,270 70,105 0.01 International Container Terminal Services, Inc. PHP 9,390 19,629 0.00 JG Summit Holdings, Inc. PHP 18,990 23,036 0.00 Jollibee Foods Corp. PHP 22,490 74,401 0.01 Manila Electric Co. PHP 11,260 55,727 0.01 SM Investments Corp. PHP 1,975 35,135 0.00
415,718 0.04
PolandJeronimo Martins SGPS SA EUR 26,595 367,543 0.03 KGHM Polska Miedz SA PLN 3,717 147,216 0.01 Polski Koncern Naftowy ORLEN SA PLN 6,153 76,552 0.01 Powszechny Zaklad Ubezpieczen SA PLN 6,069 42,611 0.01
633,922 0.06

305 Morgan Stanley Investment Funds 31 December 2020
The accompanying notes are an integral part of these financial statements.
Global Balanced Fund (continued)
schEDUlE of InVEsTmEnTsAs at 31 December 2020
Investments Currency
Quantity/ Nominal
Value
Market Value EUR
% of Net Assets
Transferable securities and money market instruments admitted to official exchange listing or dealt in on another regulated market
Equities (continued)
PortugalEDP - Energias de Portugal SA EUR 189,891 979,078 0.09 Galp Energia SGPS SA EUR 55,376 484,762 0.04
1,463,840 0.13
singaporeCapitaLand Ltd. SGD 33,880 68,577 0.01 City Developments Ltd. SGD 28,200 138,698 0.01 Keppel Corp. Ltd. SGD 40,700 135,126 0.01 Mapletree Logistics Trust, REIT SGD 60,000 74,424 0.01 Oversea-Chinese Banking Corp. Ltd. SGD 6,222 38,627 0.00 Singapore Airlines Ltd. SGD 2,400 6,339 0.00 Singapore Technologies Engineering Ltd. SGD 48,000 113,153 0.01 Singapore Telecommunications Ltd. SGD 474,500 676,411 0.06
1,251,355 0.11
south africaAspen Pharmacare Holdings Ltd. ZAR 1,096 7,643 0.00 Bid Corp. Ltd. ZAR 2,833 41,451 0.00 Bidvest Group Ltd. (The) ZAR 3,338 29,156 0.00 Clicks Group Ltd. ZAR 9,595 134,858 0.01 Gold Fields Ltd. ZAR 8,482 64,909 0.01 Growthpoint Properties Ltd., REIT ZAR 69,194 48,382 0.01 Kumba Iron Ore Ltd. ZAR 5,853 202,775 0.02 Life Healthcare Group Holdings Ltd. ZAR 42,896 40,135 0.00 Mr Price Group Ltd. ZAR 3,044 28,895 0.00 MultiChoice Group ZAR 14,965 111,548 0.01 Naspers Ltd. ‘N’ ZAR 2,425 407,291 0.04 NEPI Rockcastle plc ZAR 5,295 27,540 0.00 Old Mutual Ltd. ZAR 208,797 138,097 0.01 Sanlam Ltd. ZAR 60,069 196,308 0.02 SPAR Group Ltd. (The) ZAR 11,013 116,114 0.01 Vodacom Group Ltd. ZAR 26,016 180,014 0.02 Woolworths Holdings Ltd. ZAR 12,853 28,270 0.00
1,803,386 0.16
south KoreaAMOREPACIFIC Group KRW 6,334 259,979 0.02 Celltrion Pharm, Inc. KRW 326 58,154 0.01 Celltrion, Inc. KRW 1,168 313,590 0.03 CJ CheilJedang Corp. KRW 450 128,192 0.01 CJ Logistics Corp. KRW 335 41,472 0.00 Daewoo Shipbuilding & Marine
Engineering Co. Ltd. KRW 813 16,648 0.00 Douzone Bizon Co. Ltd. KRW 588 45,742 0.00 E-MART, Inc. KRW 439 49,717 0.00 GS Engineering & Construction Corp. KRW 3,571 100,897 0.01 GS Holdings Corp. KRW 14,352 403,117 0.04 Hankook Tire & Technology Co. Ltd. KRW 12,739 375,056 0.03 Hanmi Pharm Co. Ltd. KRW 127 34,792 0.00 Hanon Systems KRW 49,820 605,257 0.06 Hanwha Solutions Corp. KRW 5,080 181,625 0.02 Hyundai Glovis Co. Ltd. KRW 338 46,481 0.00 Hyundai Heavy Industries Holdings Co. Ltd. KRW 59 12,507 0.00 Hyundai Marine & Fire Insurance Co. Ltd. KRW 15,533 264,145 0.02 Hyundai Motor Co. KRW 945 135,551 0.01 Korea Aerospace Industries Ltd. KRW 1,837 35,449 0.00 Korea Electric Power Corp. KRW 3,318 67,984 0.01 Korean Air Lines Co. Ltd. KRW 847 17,201 0.00 LG Chem Ltd. KRW 513 315,966 0.03 LG Corp. KRW 2,092 136,854 0.01
schEDUlE of InVEsTmEnTsAs at 31 December 2020
Investments Currency
Quantity/ Nominal
Value
Market Value EUR
% of Net Assets
Transferable securities and money market instruments admitted to official exchange listing or dealt in on another regulated market
Equities (continued)
south Korea (continued)LG Household & Health Care Ltd.
Preference KRW 12 6,447 0.00 LG Household & Health Care Ltd. KRW 169 204,874 0.02 Lotte Chemical Corp. KRW 71 14,640 0.00 Lotte Corp. KRW 845 22,311 0.00 NAVER Corp. KRW 1,381 302,019 0.03 S-1 Corp. KRW 1,707 108,562 0.01 Samsung C&T Corp. KRW 274 28,261 0.00 Samsung Electro-Mechanics Co. Ltd. KRW 3,307 439,940 0.04 Samsung Electronics Co. Ltd. KRW 61,193 3,705,937 0.34 Samsung Fire & Marine Insurance Co. Ltd. KRW 400 56,075 0.01 Samsung SDI Co. Ltd. KRW 885 415,407 0.04 Samsung SDS Co. Ltd. KRW 591 78,840 0.01 Shinhan Financial Group Co. Ltd. KRW 20,405 489,307 0.04 SK Holdings Co. Ltd. KRW 359 64,549 0.01 SK Hynix, Inc. KRW 7,626 675,457 0.06 SK Innovation Co. Ltd. KRW 398 56,507 0.01 SK Telecom Co. Ltd. KRW 64 11,404 0.00
10,326,913 0.93
spainAbertis Infraestructuras SA EUR 8,197 150,497 0.01 Aena SME SA, Reg. S EUR 1,864 265,061 0.02 Amadeus IT Group SA ‘A’ EUR 11,589 690,241 0.06 Banco Bilbao Vizcaya Argentaria SA EUR 130,977 528,492 0.05 CaixaBank SA EUR 102,142 214,600 0.02 Iberdrola SA EUR 23,733 277,676 0.03 Industria de Diseno Textil SA EUR 50,637 1,318,587 0.12 Red Electrica Corp. SA EUR 38,077 638,742 0.06 Telefonica SA EUR 50,444 163,691 0.01
4,247,587 0.38
swedenAssa Abloy AB ‘B’ SEK 13,239 264,836 0.02 Atlas Copco AB ‘A’ SEK 2,432 102,172 0.01 Atlas Copco AB ‘B’ SEK 3,051 111,172 0.01 Boliden AB SEK 22,406 646,091 0.06 Hennes & Mauritz AB ‘B’ SEK 15,504 265,634 0.02 Hexagon AB ‘B’ SEK 6,588 489,799 0.05 Husqvarna AB ‘B’ SEK 23,843 251,945 0.02 ICA Gruppen AB SEK 37,993 1,551,444 0.14 Investor AB ‘B’ SEK 3,921 232,527 0.02 Kinnevik AB ‘B’ SEK 10,133 417,015 0.04 SKF AB ‘B’ SEK 22,536 476,523 0.04 Svenska Cellulosa AB SCA ‘B’ SEK 23,118 329,023 0.03 Svenska Handelsbanken AB ‘A’ SEK 33,709 276,873 0.03 Swedbank AB ‘A’ SEK 16,303 232,856 0.02 Telefonaktiebolaget LM Ericsson ‘B’ SEK 40,120 389,544 0.04 Telia Co. AB SEK 98,172 332,986 0.03 Volvo AB ‘B’ SEK 8,099 155,578 0.01
6,526,018 0.59
switzerlandABB Ltd. CHF 11,042 251,609 0.02 Cie Financiere Richemont SA CHF 10,533 770,356 0.07 Givaudan SA CHF 12 41,083 0.00 Julius Baer Group Ltd. CHF 6,690 316,841 0.03 Kuehne + Nagel International AG CHF 1,161 214,571 0.02 Novartis AG CHF 29,003 2,221,754 0.20 Roche Holding AG CHF 5,361 1,531,104 0.14 SGS SA CHF 216 531,829 0.05

Morgan Stanley Investment Funds 31 December 2020 306
The accompanying notes are an integral part of these financial statements.
Global Balanced Fund (continued)
schEDUlE of InVEsTmEnTsAs at 31 December 2020
Investments Currency
Quantity/ Nominal
Value
Market Value EUR
% of Net Assets
Transferable securities and money market instruments admitted to official exchange listing or dealt in on another regulated market
Equities (continued)
switzerland (continued)Swiss Re AG CHF 5,270 403,498 0.04 Swisscom AG CHF 1,059 464,703 0.04 UBS Group AG CHF 46,077 529,444 0.05 Zurich Insurance Group AG CHF 1,232 423,667 0.04
7,700,459 0.70
TaiwanAccton Technology Corp. TWD 7,000 64,113 0.01 Acer, Inc. TWD 364,000 249,513 0.02 Airtac International Group TWD 1,000 26,086 0.00 Catcher Technology Co. Ltd. TWD 22,000 131,356 0.01 Cathay Financial Holding Co. Ltd. TWD 763,000 934,357 0.09 Cheng Shin Rubber Industry Co. Ltd. TWD 31,000 39,579 0.00 China Steel Corp. TWD 224,000 160,688 0.02 Chunghwa Telecom Co. Ltd. TWD 570,000 1,800,789 0.16 CTBC Financial Holding Co. Ltd. TWD 274,000 156,451 0.02 Delta Electronics, Inc. TWD 167,000 1,273,015 0.12 Eclat Textile Co. Ltd. TWD 9,000 110,213 0.01 Eva Airways Corp. TWD 143,368 54,644 0.01 Evergreen Marine Corp. Taiwan Ltd. TWD 91,000 107,349 0.01 Far Eastern New Century Corp. TWD 68,000 57,058 0.01 First Financial Holding Co. Ltd. TWD 1,385,000 857,056 0.08 Giant Manufacturing Co. Ltd. TWD 2,000 15,941 0.00 Globalwafers Co. Ltd. TWD 16,000 328,333 0.03 Hiwin Technologies Corp. TWD 1,000 11,145 0.00 Hon Hai Precision Industry Co. Ltd. TWD 45,000 119,995 0.01 Hotai Motor Co. Ltd. TWD 32,000 596,379 0.05 Inventec Corp. TWD 304,000 211,469 0.02 MediaTek, Inc. TWD 2,000 43,302 0.00 Nan Ya Plastics Corp. TWD 233,000 485,564 0.04 Nanya Technology Corp. TWD 59,000 148,434 0.01 Nien Made Enterprise Co. Ltd. TWD 13,000 122,835 0.01 Pou Chen Corp. TWD 49,000 44,595 0.01 President Chain Store Corp. TWD 113,000 872,845 0.08 Ruentex Development Co. Ltd. TWD 18,000 21,338 0.00 Synnex Technology International Corp. TWD 28,000 38,143 0.00 Taishin Financial Holding Co. Ltd. TWD 916,000 351,781 0.03 Taiwan Cement Corp. TWD 33,635 42,115 0.00 Taiwan High Speed Rail Corp. TWD 44,000 40,427 0.00 Taiwan Semiconductor Manufacturing
Co. Ltd. TWD 203,000 3,118,410 0.28 United Microelectronics Corp. TWD 140,000 191,325 0.02 Win Semiconductors Corp. TWD 27,000 270,770 0.03 Wiwynn Corp. TWD 13,000 265,263 0.02 Yageo Corp. TWD 8,000 120,111 0.01
13,482,787 1.22
ThailandAirports of Thailand PCL THB 20,600 34,878 0.00 B Grimm Power PCL THB 32,100 42,344 0.00 Bangkok Dusit Medical Services PCL ‘F’ THB 1,090,300 616,818 0.06 Central Pattana PCL THB 23,600 30,650 0.00 CP ALL PCL THB 73,900 117,082 0.01 Home Product Center PCL THB 1,255,900 467,976 0.04 Land & Houses PCL THB 805,300 174,130 0.02 Minor International PCL THB 156,900 109,888 0.01 PTT Exploration & Production PCL THB 46,300 123,726 0.01 PTT PCL THB 476,700 550,100 0.05 Siam Cement PCL (The) THB 29,400 305,159 0.03 Siam Commercial Bank PCL (The) THB 144,700 344,369 0.03
2,917,120 0.26
schEDUlE of InVEsTmEnTsAs at 31 December 2020
Investments Currency
Quantity/ Nominal
Value
Market Value EUR
% of Net Assets
Transferable securities and money market instruments admitted to official exchange listing or dealt in on another regulated market
Equities (continued)
TurkeyAselsan Elektronik Sanayi ve Ticaret A/S TRY 15,021 30,228 0.00
30,228 0.00
United Kingdom3i Group plc GBP 21,190 273,177 0.02 Ashtead Group plc GBP 7,638 292,342 0.03 AstraZeneca plc GBP 11,408 930,171 0.08 Aviva plc GBP 61,400 222,292 0.02 BAE Systems plc GBP 70,585 384,104 0.03 Barratt Developments plc GBP 16,530 123,297 0.01 Berkeley Group Holdings plc GBP 10,280 542,700 0.05 British American Tobacco plc GBP 446 13,446 0.00 British Land Co. plc (The), REIT GBP 42,013 228,717 0.02 BT Group plc GBP 199,053 293,069 0.03 Burberry Group plc GBP 16,189 322,520 0.03 Compass Group plc GBP 25,756 390,822 0.04 Croda International plc GBP 12,066 886,031 0.08 Diageo plc GBP 54,432 1,744,015 0.16 Ferguson plc GBP 4,152 410,649 0.04 GlaxoSmithKline plc GBP 50,183 749,746 0.07 HSBC Holdings plc GBP 188,004 792,938 0.07 Informa plc GBP 44,756 273,545 0.03 J Sainsbury plc GBP 151,705 380,848 0.03 Johnson Matthey plc GBP 16,558 447,018 0.04 Kingfisher plc GBP 151,900 457,267 0.04 Legal & General Group plc GBP 152,934 453,229 0.04 Mondi plc GBP 16,864 322,826 0.03 Natwest Group plc GBP 313,227 584,612 0.05 Prudential plc GBP 25,489 382,231 0.03 RELX plc GBP 41,771 833,564 0.08 Rentokil Initial plc GBP 26,628 151,068 0.01 Rio Tinto plc GBP 12,537 763,460 0.07 Rolls-Royce Holdings plc GBP 234,247 290,121 0.03 Segro plc, REIT GBP 10,375 109,451 0.01 SSE plc GBP 11,389 190,187 0.02 St James’s Place plc GBP 19,039 240,254 0.02 Standard Chartered plc GBP 67,487 350,040 0.03 Taylor Wimpey plc GBP 169,354 312,597 0.03 Tesco plc GBP 574,465 1,479,899 0.13 Unilever plc GBP 51 2,494 0.00 United Utilities Group plc GBP 24,633 245,440 0.02 Vodafone Group plc GBP 312,611 420,900 0.04 WPP plc GBP 10,945 97,479 0.01
17,388,566 1.57
United states of americaAbbVie, Inc. USD 5,579 480,127 0.04 Accenture plc ‘A’ USD 3,716 783,457 0.07 Adobe, Inc. USD 1,355 551,369 0.05 Agilent Technologies, Inc. USD 6,220 595,568 0.05 Alexandria Real Estate Equities, Inc., REIT USD 1,424 203,490 0.02 Alliant Energy Corp. USD 6,251 259,834 0.02 Allstate Corp. (The) USD 4,262 376,547 0.03 Alphabet, Inc. ‘A’ USD 3,184 4,533,179 0.41 Amazon.com, Inc. USD 1,469 3,917,836 0.35 Amcor plc USD 13,154 125,328 0.01 American Express Co. USD 6,632 646,260 0.06 American Tower Corp., REIT USD 2,378 429,049 0.04 Amgen, Inc. USD 8,847 1,629,817 0.15 Amphenol Corp. ‘A’ USD 5,481 579,933 0.05 Anthem, Inc. USD 1,694 435,436 0.04 Apple, Inc. USD 63,336 6,888,321 0.62

307 Morgan Stanley Investment Funds 31 December 2020
The accompanying notes are an integral part of these financial statements.
Global Balanced Fund (continued)
schEDUlE of InVEsTmEnTsAs at 31 December 2020
Investments Currency
Quantity/ Nominal
Value
Market Value EUR
% of Net Assets
Transferable securities and money market instruments admitted to official exchange listing or dealt in on another regulated market
Equities (continued)
United states of america (continued)Applied Materials, Inc. USD 10,710 746,594 0.07 Archer-Daniels-Midland Co. USD 5,359 218,083 0.02 AT&T, Inc. USD 29,351 680,225 0.06 Autodesk, Inc. USD 2,542 627,182 0.06 Baker Hughes Co. USD 11,083 189,694 0.02 Ball Corp. USD 4,391 330,468 0.03 Bank of America Corp. USD 4,810 117,453 0.01 Becton Dickinson and Co. USD 3,170 640,645 0.06 Best Buy Co., Inc. USD 11,138 915,957 0.08 Biogen, Inc. USD 840 165,194 0.02 BlackRock, Inc. USD 1,031 596,980 0.05 Booking Holdings, Inc. USD 403 725,137 0.07 BorgWarner, Inc. USD 3,845 121,216 0.01 Bristol-Myers Squibb Co. USD 9,746 486,053 0.04 Broadcom, Inc. USD 942 333,801 0.03 Brown-Forman Corp. ‘B’ USD 2,520 160,306 0.01 Cabot Oil & Gas Corp. USD 5,521 73,122 0.01 Cardinal Health, Inc. USD 11,493 494,776 0.04 CarMax, Inc. USD 2,203 167,594 0.02 Cerner Corp. USD 16,175 1,024,467 0.09 Chevron Corp. USD 7,573 522,112 0.05 Chipotle Mexican Grill, Inc. USD 99 111,691 0.01 Chubb Ltd. USD 5,248 646,430 0.06 Cigna Corp. USD 5,584 929,324 0.08 Cincinnati Financial Corp. USD 2,180 152,376 0.01 Cintas Corp. USD 716 204,190 0.02 Cisco Systems, Inc. USD 27,897 1,006,115 0.09 Citigroup, Inc. USD 20,753 1,025,522 0.09 Citrix Systems, Inc. USD 2,417 253,177 0.02 Clorox Co. (The) USD 1,857 304,263 0.03 CMS Energy Corp. USD 3,418 167,649 0.02 Coca-Cola Co. (The) USD 18,411 818,107 0.07 Cognizant Technology Solutions Corp. ‘A’ USD 5,041 332,796 0.03 Colgate-Palmolive Co. USD 9,982 690,394 0.06 Comcast Corp. ‘A’ USD 23,722 1,006,156 0.09 ConocoPhillips USD 11,456 371,334 0.03 Consolidated Edison, Inc. USD 3,694 214,937 0.02 Copart, Inc. USD 2,731 281,505 0.03 Crown Castle International Corp., REIT USD 1,926 245,903 0.02 Deere & Co. USD 1,567 340,887 0.03 Discovery, Inc. ‘C’ USD 16,895 357,332 0.03 Dominion Energy, Inc. USD 4,761 287,925 0.03 DuPont de Nemours, Inc. USD 6,165 355,497 0.03 Eaton Corp. plc USD 1,141 111,251 0.01 eBay, Inc. USD 16,198 666,038 0.06 Ecolab, Inc. USD 1,310 231,498 0.02 Edison International USD 4,752 239,393 0.02 Edwards Lifesciences Corp. USD 13,698 1,000,438 0.09 Eli Lilly and Co. USD 6,715 913,930 0.08 Emerson Electric Co. USD 9,326 605,194 0.05 Equinix, Inc., REIT USD 470 269,323 0.02 Equity Residential, REIT USD 10,251 488,179 0.04 Estee Lauder Cos., Inc. (The) ‘A’ USD 1,337 287,180 0.03 Etsy, Inc. USD 9,202 1,338,368 0.12 Eversource Energy USD 1,734 121,188 0.01 Exelon Corp. USD 11,612 398,159 0.04 Expedia Group, Inc. USD 2,975 318,464 0.03 Expeditors International of Washington, Inc. USD 10,981 845,945 0.08 Exxon Mobil Corp. USD 19,210 648,506 0.06 Facebook, Inc. ‘A’ USD 9,046 2,025,607 0.18 Fastenal Co. USD 3,374 134,527 0.01 FedEx Corp. USD 836 176,223 0.02 Fidelity National Information Services, Inc. USD 8,315 955,289 0.09 FMC Corp. USD 553 51,264 0.00 Gap, Inc. (The) USD 4,117 68,620 0.01
schEDUlE of InVEsTmEnTsAs at 31 December 2020
Investments Currency
Quantity/ Nominal
Value
Market Value EUR
% of Net Assets
Transferable securities and money market instruments admitted to official exchange listing or dealt in on another regulated market
Equities (continued)
United states of america (continued)General Dynamics Corp. USD 688 82,822 0.01 General Electric Co. USD 53,109 458,396 0.04 Genuine Parts Co. USD 9,577 775,954 0.07 Gilead Sciences, Inc. USD 15,689 728,481 0.07 Halliburton Co. USD 3,974 61,346 0.01 Hasbro, Inc. USD 3,652 280,030 0.03 HCA Healthcare, Inc. USD 1,178 156,076 0.01 Healthpeak Properties, Inc., REIT USD 8,702 210,575 0.02 Henry Schein, Inc. USD 19,618 1,057,377 0.10 Hess Corp. USD 6,025 260,065 0.02 Hologic, Inc. USD 4,539 263,771 0.02 Home Depot, Inc. (The) USD 12,804 2,761,813 0.25 Honeywell International, Inc. USD 4,611 791,613 0.07 Host Hotels & Resorts, Inc., REIT USD 12,720 149,910 0.01 HP, Inc. USD 18,448 364,768 0.03 Humana, Inc. USD 1,639 543,688 0.05 IDEXX Laboratories, Inc. USD 1,273 513,593 0.05 IHS Markit Ltd. USD 7,873 570,836 0.05 Intel Corp. USD 27,238 1,085,133 0.10 International Business Machines Corp. USD 9,604 971,797 0.09 International Flavors & Fragrances, Inc. USD 2,934 261,885 0.02 Intuit, Inc. USD 3,051 941,405 0.09 Invesco Ltd. USD 16,002 224,456 0.02 Iron Mountain, Inc., REIT USD 4,778 113,322 0.01 Jacobs Engineering Group, Inc. USD 2,793 244,599 0.02 Johnson & Johnson USD 8,039 1,023,106 0.09 Johnson Controls International plc USD 15,383 578,740 0.05 Kellogg Co. USD 17,138 863,088 0.08 Kimberly-Clark Corp. USD 2,662 291,099 0.03 KLA Corp. USD 1,496 313,346 0.03 L3Harris Technologies, Inc. USD 2,358 360,963 0.03 Lockheed Martin Corp. USD 2,247 649,080 0.06 Lowe’s Cos., Inc. USD 4,567 595,228 0.05 Marsh & McLennan Cos., Inc. USD 17,669 1,663,732 0.15 Mastercard, Inc. ‘A’ USD 4,704 1,373,965 0.12 McDonald’s Corp. USD 278 48,010 0.00 Merck & Co., Inc. USD 10,957 720,590 0.07 Mettler-Toledo International, Inc. USD 357 328,913 0.03 Microsoft Corp. USD 37,980 6,856,546 0.62 Netflix, Inc. USD 2,271 997,475 0.09 Newmont Corp. USD 3,460 167,904 0.02 NextEra Energy, Inc. USD 10,196 633,396 0.06 Nielsen Holdings plc USD 13,423 226,353 0.02 Northern Trust Corp. USD 5,448 408,021 0.04 NVIDIA Corp. USD 2,025 860,758 0.08 Omnicom Group, Inc. USD 2,967 150,485 0.01 ONEOK, Inc. USD 4,456 137,028 0.01 Oracle Corp. USD 15,298 801,096 0.07 PayPal Holdings, Inc. USD 5,364 1,009,679 0.09 People’s United Financial, Inc. USD 285 2,969 0.00 PepsiCo, Inc. USD 20,591 2,472,216 0.22 PNC Financial Services Group, Inc. (The) USD 12,214 1,459,580 0.13 PPG Industries, Inc. USD 7,844 910,511 0.08 Procter & Gamble Co. (The) USD 9,486 1,067,788 0.10 Prologis, Inc., REIT USD 6,004 482,007 0.04 Prudential Financial, Inc. USD 1,614 101,778 0.01 Public Service Enterprise Group, Inc. USD 6,763 316,780 0.03 QUALCOMM, Inc. USD 5,398 665,830 0.06 Quanta Services, Inc. USD 5,749 333,852 0.03 Raytheon Technologies Corp. USD 10,599 615,930 0.06 Regency Centers Corp., REIT USD 5,359 196,768 0.02 Robert Half International, Inc. USD 9,087 460,593 0.04 Rockwell Automation, Inc. USD 229 46,336 0.00 S&P Global, Inc. USD 7 1,857 0.00 salesforce.com, Inc. USD 5,754 1,037,271 0.09

Morgan Stanley Investment Funds 31 December 2020 308
The accompanying notes are an integral part of these financial statements.
Global Balanced Fund (continued)
schEDUlE of InVEsTmEnTsAs at 31 December 2020
Investments Currency
Quantity/ Nominal
Value
Market Value EUR
% of Net Assets
Transferable securities and money market instruments admitted to official exchange listing or dealt in on another regulated market
Equities (continued)
United states of america (continued)SBA Communications Corp., REIT ‘A’ USD 736 165,647 0.02 Schlumberger Ltd. USD 8,625 152,685 0.01 Sherwin-Williams Co. (The) USD 1,101 650,393 0.06 Simon Property Group, Inc., REIT USD 1,132 76,670 0.01 Skyworks Solutions, Inc. USD 2,135 265,800 0.02 Southern Co. (The) USD 9,468 469,410 0.04 Southwest Airlines Co. USD 4,524 169,538 0.02 State Street Corp. USD 15,850 925,985 0.08 SVB Financial Group USD 1,302 403,841 0.04 Synchrony Financial USD 22,675 633,157 0.06 Synopsys, Inc. USD 3,182 670,613 0.06 Sysco Corp. USD 6,259 371,987 0.03 T Rowe Price Group, Inc. USD 2,327 283,142 0.03 Target Corp. USD 109 15,533 0.00 Teledyne Technologies, Inc. USD 828 263,468 0.02 Texas Instruments, Inc. USD 7,106 940,853 0.09 Textron, Inc. USD 4,302 168,442 0.02 Thermo Fisher Scientific, Inc. USD 1,300 489,087 0.04 Tiffany & Co. USD 1,827 195,694 0.02 TJX Cos., Inc. (The) USD 5,337 297,877 0.03 T-Mobile US, Inc. USD 1,370 149,256 0.01 TransDigm Group, Inc. USD 219 109,657 0.01 Travelers Cos., Inc. (The) USD 11,009 1,245,137 0.11 Ulta Beauty, Inc. USD 1,128 259,315 0.02 United Parcel Service, Inc. ‘B’ USD 725 98,190 0.01 United Rentals, Inc. USD 1,604 300,827 0.03 Valero Energy Corp. USD 2,153 98,706 0.01 Verisk Analytics, Inc. USD 929 156,090 0.01 Verizon Communications, Inc. USD 26,686 1,266,505 0.11 Vertex Pharmaceuticals, Inc. USD 3,859 724,628 0.07 Visa, Inc. ‘A’ USD 9,430 1,684,417 0.15 Walgreens Boots Alliance, Inc. USD 15,498 497,173 0.05 Walt Disney Co. (The) USD 7,625 1,131,408 0.10 Waters Corp. USD 551 109,913 0.01 Willis Towers Watson plc USD 1,656 280,049 0.03 WW Grainger, Inc. USD 1,237 406,082 0.04 Xcel Energy, Inc. USD 5,488 294,855 0.03 Xilinx, Inc. USD 3,721 425,858 0.04 Zions Bancorp NA USD 8,289 290,433 0.03 Zoetis, Inc. USD 7,442 992,012 0.09
117,005,415 10.56
Total Equities 312,542,169 28.22
Total Transferable securities and money market instruments admitted to official exchange listing or dealt in on another regulated market 873,829,446 78.89
schEDUlE of InVEsTmEnTsAs at 31 December 2020
Investments Currency
Quantity/ Nominal
Value
Market Value EUR
% of Net Assets
Other transferable securities and money market instruments not admitted to official exchange listing or dealt in on another regulated market
Equities
spainTelefonica SA Rights 28/12/2020* EUR 50,444 9,167 0.00
9,167 0.00
Total Equities 9,167 0.00
Total other transferable securities and money market instruments not admitted to official exchange listing or dealt in on another regulated market 9,167 0.00
Units of authorised UCITS or other collective investment undertakings
collective Investment schemes – UcITs
luxembourgMorgan Stanley Investment Funds
Emerging Markets Corporate Debt Fund – Class N† USD 957,692 21,562,598 1.94
Morgan Stanley Investment Funds Global Infrastructure Fund – Class Z† EUR 50,846 2,857,032 0.26
Morgan Stanley Investment Funds Global Infrastructure Fund – Class Z† USD 39,601 2,225,200 0.20
26,644,830 2.40
Total collective Investment schemes – UcITs 26,644,830 2.40
Exchange Traded funds
franceAmundi Index Solutions Msci EM Latin
America UCITS ETF – Eur Class A EUR 1,419,423 16,449,693 1.49
16,449,693 1.49
GermanyXtrackers MSCI World Financials
UCITS ETF EUR 473,783 7,712,606 0.70
7,712,606 0.70

309 Morgan Stanley Investment Funds 31 December 2020
The accompanying notes are an integral part of these financial statements.
Global Balanced Fund (continued)
option Purchased contracts
Quantity security Description currency counterparty
market Value EUR
% of net assets
1,727 EURO STOXX 50 Index, Call, 3,450.000, 18/06/2021 EUR Goldman Sachs 3,745,863 0.34
1,941 EURO STOXX 50 Index, Put, 3,300.000, 19/03/2021 EUR Goldman Sachs 1,193,715 0.11
47 Nikkei 225 Index, Call, 24,000.000, 11/06/2021 JPY Goldman Sachs 1,390,287 0.12
226 S&P 500 Index, Call, 3,350.000, 18/06/2021 USD Goldman Sachs 8,638,891 0.78
202 S&P 500 Index, Call, 3,775.000, 17/09/2021 USD Goldman Sachs 3,515,005 0.32
246 S&P 500 Index, Put, 3,400.000, 19/03/2021 USD Goldman Sachs 1,120,788 0.10
Total market Value on option Purchased contracts – assets 19,604,549 1.77
financial futures contracts
security Descriptionnumber
of contracts currency
Global Exposure
EUR
Unrealised Gain/(loss)
EUR
% of net assets
DAX Index, 19/03/2021 33 EUR 11,340,450 406,313 0.04 EURO STOXX 50 Index, 19/03/2021 563 EUR 19,986,500 256,913 0.02 Russell 2000 Emini Index, 19/03/2021 136 USD 10,866,677 279,606 0.02 Yen Denominated Nikkei 225 Index, 11/03/2021 142 JPY 15,420,339 415,616 0.04
Total Unrealised Gain on financial futures contracts 1,358,448 0.12
MSCI Emerging Markets Index, 19/03/2021 (91) USD (4,773,098) (120,613) (0.01) S&P 500 Emini Index, 19/03/2021 (80) USD (12,133,438) (220,712) (0.02)
Total Unrealised loss on financial futures contracts (341,325) (0.03)
net Unrealised Gain on financial futures contracts 1,017,123 0.09
schEDUlE of InVEsTmEnTsAs at 31 December 2020
Investments Currency
Quantity/ Nominal
Value
Market Value EUR
% of Net Assets
Units of authorised UCITS or other collective investment undertakings
Exchange Traded funds (continued)
ItalyiShares Global Clean Energy UCITS ETF EUR 1,978,599 26,063,950 2.35 iShares J.P. Morgan EM Local Government
Bond Fund – USD (Dist) EUR 333,414 16,417,348 1.48
42,481,298 3.83
United KingdomInvesco Physical Gold ETC USD 108,492 16,221,541 1.46 iShares MSCI China A UCITS ETF USD 2,202,705 11,283,357 1.02 WisdomTree Industrial Metals Enhanced
UCITS ETF USD 473,000 10,622,781 0.96
38,127,679 3.44
Total Exchange Traded funds 104,771,276 9.46
Total Units of authorised UcITs or other collective investment undertakings 131,416,106 11.86
Total Investments 1,005,254,719 90.75
cash 64,410,974 5.81
other assets/(liabilities) 38,080,953 3.44
Total net assets 1,107,746,646 100.00
* Security is valued at its fair value under the direction of the Board of Directors.† Managed by an affiliate of the Investment Adviser.The country disclosed within the Schedule of Investments refers to the country of risk. The country of incorporation may differ.
DERIVaTIVEs
Over-the-counter (OTC) and exchange traded derivatives as at 31 December 2020, expressed in Euro.

Morgan Stanley Investment Funds 31 December 2020 310
The accompanying notes are an integral part of these financial statements.
Global Balanced Fund (continued)
credit Default swap contracts
nominal amount ccy counterparty
Reference Entity
Buy/ sell
Interest (Paid)/
Received Rate
maturity Date
market Value
EUR
% of net assets
6,000,000 USD Barclays CDX.NA.EM. 31-V2 Sell 1.00% 20/06/2024 27,845 0.00 5,000,000 USD Goldman Sachs CDX.NA.EM. 31-V2 Sell 1.00% 20/06/2024 23,204 0.00 8,500,000 USD BNP Paribas CDX.NA.EM. 32-V3 Sell 1.00% 20/12/2024 28,500 0.00 2,000,000 USD Citigroup CDX.NA.EM. 32-V3 Sell 1.00% 20/12/2024 6,706 0.00 4,400,000 USD Goldman Sachs CDX.NA.HY. 31-V14 Sell 5.00% 20/12/2023 246,729 0.02
21,700,000 USD Goldman Sachs CDX.NA.HY. 33-V12 Sell 5.00% 20/12/2024 1,461,629 0.13 13,700,000 USD Goldman Sachs CDX.NA.HY. 34-V9 Sell 5.00% 20/06/2025 956,074 0.09 25,150,000 USD Goldman Sachs CDX.NA.HY. 35-V1 Sell 5.00% 20/12/2025 1,910,851 0.17 63,000,000 USD Goldman Sachs CDX.NA.IG. 33-V1 Sell 1.00% 20/12/2024 838,266 0.08 30,700,000 USD Goldman Sachs CDX.NA.IG. 34-V1 Sell 1.00% 20/06/2025 401,874 0.04 12,350,000 USD Goldman Sachs CDX.NA.IG. 35-V1 Sell 1.00% 20/12/2025 243,690 0.02
1,000,000 EUR Goldman Sachs ITRAXX.EUROPE.CROSSOVER. 30-V8 Sell 5.00% 20/12/2023 85,468 0.01
4,800,000 EUR Goldman Sachs ITRAXX.EUROPE.CROSSOVER. 31-V6 Sell 5.00% 20/06/2024 470,317 0.04
5,000,000 EUR Goldman Sachs ITRAXX.EUROPE.CROSSOVER. 32-V4 Sell 5.00% 20/12/2024 537,734 0.05
17,900,000 EUR Goldman Sachs ITRAXX.EUROPE.CROSSOVER. 33-V4 Sell 5.00% 20/06/2025 2,001,219 0.18
2,700,000 EUR Goldman Sachs ITRAXX.EUROPE.CROSSOVER. 34-V1 Sell 5.00% 20/12/2025 330,543 0.03
Total market Value on credit Default swap contracts – assets 9,570,649 0.86
22,450,000 USD Barclays CDX.NA.EM. 33-V2 Sell 1.00% 20/06/2025 (30,614) 0.00 4,600,000 USD Goldman Sachs CDX.NA.EM. 34-V1 Sell 1.00% 20/12/2025 (91,027) (0.01)
Total market Value on credit Default swap contracts – liabilities (121,641) (0.01)
net market Value on credit Default swap contracts – assets 9,449,008 0.85
Collateral received and paid by the Fund in respect of financial derivative instruments:
Type of collateral counterparty currency amount received amount paid
Global Balanced fund
Cash Barclays EUR – 40,000BNP Paribas EUR – 200,000Goldman Sachs EUR – 9,423,852
– 9,663,852
forward currency Exchange contracts (continued)
currency Purchased
amount Purchased
currency sold
amount sold
maturity Date counterparty
Unrealised Gain/(loss)
EUR
% of net assets
CHF 10,560,000 EUR 9,774,746 25/01/2021 RBC 1,450 0.00EUR 2,072,225 GBP 1,850,000 25/01/2021 Westpac Banking 13,343 0.00EUR 13,718,618 JPY 1,730,000,000 25/01/2021 Barclays 38,906 0.00EUR 4,019,420 JPY 495,000,000 25/01/2021 RBC 105,283 0.01 EUR 4,100,865 USD 4,980,000 25/01/2021 Commonwealth
Bank of Australia 44,018 0.00EUR 147,411,520 USD 175,790,000 25/01/2021 J.P. Morgan 4,208,084 0.38 EUR 3,893,201 USD 4,720,000 25/01/2021 UBS 48,157 0.01 EUR 10,706,423 USD 12,765,000 25/01/2021 Westpac Banking 307,698 0.03 GBP 1,485,000 EUR 1,627,041 25/01/2021 J.P. Morgan 25,630 0.00
Unrealised Gain on forward currency Exchange contracts – assets 4,792,569 0.43
Total Unrealised Gain on forward currency Exchange contracts – assets 4,792,569 0.43
JPY 530,000,000 EUR 4,195,395 25/01/2021 Barclays (4,500) 0.00JPY 530,000,000 EUR 4,267,300 25/01/2021 Commonwealth
Bank of Australia (76,406) (0.01) JPY 375,000,000 EUR 2,965,566 25/01/2021 J.P. Morgan (311) 0.00USD 2,015,000 EUR 1,649,970 25/01/2021 Commonwealth
Bank of Australia (8,495) 0.00USD 5,010,000 EUR 4,113,142 25/01/2021 J.P. Morgan (31,856) 0.00
Unrealised loss on forward currency Exchange contracts – liabilities (121,568) (0.01)
Total Unrealised loss on forward currency Exchange contracts – liabilities (121,568) (0.01)
net Unrealised Gain on forward currency Exchange contracts – assets 4,671,001 0.42
DERIVaTIVEs (continued)
Over-the-counter (OTC) and exchange traded derivatives as at 31 December 2020, expressed in Euro.
DERIVaTIVEs (continued)
Over-the-counter (OTC) and exchange traded derivatives as at 31 December 2020, expressed in Euro.

311 Morgan Stanley Investment Funds 31 December 2020
The accompanying notes are an integral part of these financial statements.
Please refer to the full prospectus for the Fund’s investment objective and policy.
InVEsTmEnT aIm
To provide regular income and capital appreciation, measured in Euro, through investing primarily in a portfolio of transferable securities and money market instruments globally and through the use of financial derivative instruments.
schEDUlE of InVEsTmEnTsAs at 31 December 2020
Investments Currency
Quantity/ Nominal
Value
Market Value EUR
% of Net Assets
Transferable securities and money market instruments admitted to official exchange listing or dealt in on another regulated market
corporate Bonds
australiaAurizon Network Pty. Ltd., Reg. S 3.125%
01/06/2026 EUR 300,000 344,294 0.12 BHP Billiton Finance Ltd., Reg. S, FRN
5.625% 22/10/2079 EUR 350,000 409,208 0.14 Commonwealth Bank of Australia, Reg. S,
FRN 2% 22/04/2027 EUR 300,000 306,640 0.11 Goodman Australia Finance Pty. Ltd., REIT,
Reg. S 1.375% 27/09/2025 EUR 175,000 184,903 0.06 Optus Finance Pty. Ltd., Reg. S 1%
20/06/2029 EUR 200,000 210,921 0.07 Origin Energy Finance Ltd., Reg. S 1%
17/09/2029 EUR 300,000 300,366 0.11 Scentre Group Trust 1, REIT, Reg. S 1.45%
28/03/2029 EUR 150,000 159,533 0.06 Sydney Airport Finance Co. Pty. Ltd., Reg. S
1.75% 26/04/2028 EUR 300,000 326,259 0.11
2,242,124 0.78
austriaCA Immobilien Anlagen AG, Reg. S 1%
27/10/2025 EUR 100,000 101,888 0.04 CA Immobilien Anlagen AG, Reg. S 0.875%
05/02/2027 EUR 100,000 100,678 0.03 Vienna Insurance Group AG Wiener
Versicherung Gruppe, Reg. S, FRN 5.5% 09/10/2043 EUR 300,000 342,750 0.12
545,316 0.19
BelgiumAnheuser-Busch InBev SA/NV, Reg. S 3.7%
02/04/2040 EUR 100,000 141,796 0.05
141,796 0.05
BrazilVale SA 3.75% 10/01/2023 EUR 300,000 320,313 0.11
320,313 0.11
chinaCGNPC International Ltd., Reg. S 1.625%
11/12/2024 EUR 300,000 313,389 0.11 China Merchants Bank Co. Ltd., Reg. S
0.25% 19/06/2022 EUR 250,000 249,150 0.09 CNAC HK Finbridge Co. Ltd., Reg. S
1.75% 14/06/2022 EUR 300,000 300,585 0.10 State Grid Overseas Investment 2016 Ltd.,
Reg. S 0.797% 05/08/2026 EUR 150,000 152,391 0.05
1,015,515 0.35
DenmarkDanske Bank A/S, Reg. S, FRN 1.375%
12/02/2030 EUR 150,000 152,522 0.05 STG Global Finance BV, Reg. S 1.375%
24/09/2025 EUR 150,000 152,939 0.06
305,461 0.11
Global Balanced Income Fund

Morgan Stanley Investment Funds 31 December 2020 312
The accompanying notes are an integral part of these financial statements.
Global Balanced Income Fund (continued)
schEDUlE of InVEsTmEnTsAs at 31 December 2020
Investments Currency
Quantity/ Nominal
Value
Market Value EUR
% of Net Assets
Transferable securities and money market instruments admitted to official exchange listing or dealt in on another regulated market
corporate Bonds (continued)
finlandKojamo OYJ, Reg. S 1.875% 27/05/2027 EUR 100,000 108,171 0.04 Sampo OYJ, Reg. S 2.5% 03/09/2052 EUR 100,000 108,458 0.04 SATO OYJ, Reg. S 1.375% 31/05/2024 EUR 100,000 103,401 0.03
320,030 0.11
franceAirbus SE, Reg. S 2.375% 09/06/2040 EUR 100,000 119,536 0.04 AXA SA, Reg. S, FRN 3.25% 28/05/2049 EUR 300,000 351,550 0.12 BNP Paribas Cardif SA, Reg. S, FRN
4.032% Perpetual EUR 200,000 227,375 0.08 BNP Paribas SA, Reg. S, FRN 1.125%
17/04/2029 EUR 200,000 211,367 0.07 Bureau Veritas SA, Reg. S 1.125%
18/01/2027 EUR 100,000 102,636 0.04 Credit Agricole Assurances SA, Reg. S,
FRN 4.5% Perpetual EUR 200,000 229,375 0.08 Credit Agricole SA, Reg. S 4%
31/12/2164 EUR 100,000 108,494 0.04 Engie SA, Reg. S, FRN 1.375% Perpetual EUR 100,000 101,687 0.03 Engie SA, Reg. S, FRN 3.25% Perpetual EUR 100,000 109,899 0.04 Klepierre SA, REIT, Reg. S 2%
12/05/2029 EUR 200,000 224,185 0.08 Orange SA, Reg. S, FRN 5% Perpetual EUR 300,000 364,125 0.13 SEB SA, Reg. S 1.375% 16/06/2025 EUR 100,000 103,199 0.04 Societe Generale SA 1% 24/11/2030 EUR 100,000 100,355 0.03 TOTAL SE, Reg. S, FRN 2.708% Perpetual EUR 300,000 314,513 0.11 TOTAL SE, Reg. S, FRN 3.369% Perpetual EUR 300,000 338,063 0.12 Unibail-Rodamco-Westfield SE, Reg. S
0.625% 04/05/2027 EUR 100,000 99,670 0.03 Unibail-Rodamco-Westfield SE, REIT, Reg. S
2.625% 09/04/2030 EUR 100,000 113,869 0.04
3,219,898 1.12
GermanyAllianz SE, Reg. S, FRN 2.121%
08/07/2050 EUR 200,000 219,487 0.08 Bayer AG, Reg. S 1.375% 06/07/2032 EUR 200,000 213,874 0.07 Bayer AG, Reg. S, FRN 3.125%
12/11/2079 EUR 100,000 105,253 0.04 Continental AG 2.5% 27/08/2026 EUR 100,000 111,755 0.04 Muenchener Rueckversicherungs-
Gesellschaft AG, Reg. S 1.25% 26/05/2041 EUR 100,000 104,032 0.04
Santander Consumer Bank AG, Reg. S 0.25% 15/10/2024 EUR 100,000 100,768 0.03
Volkswagen International Finance NV, Reg. S 4.125% 16/11/2038 EUR 100,000 143,612 0.05
Volkswagen International Finance NV, Reg. S, FRN 4.625% Perpetual EUR 200,000 222,600 0.08
Vonovia Finance BV, Reg. S, FRN 4% Perpetual EUR 300,000 310,618 0.11
Wintershall Dea Finance BV, Reg. S 0.452% 25/09/2023 EUR 300,000 302,720 0.10
Wintershall Dea Finance BV, Reg. S 1.823% 25/09/2031 EUR 200,000 210,955 0.07
2,045,674 0.71
schEDUlE of InVEsTmEnTsAs at 31 December 2020
Investments Currency
Quantity/ Nominal
Value
Market Value EUR
% of Net Assets
Transferable securities and money market instruments admitted to official exchange listing or dealt in on another regulated market
corporate Bonds (continued)
IcelandArion Banki HF, Reg. S 1% 20/03/2023 EUR 400,000 406,100 0.14 Landsbankinn HF, Reg. S 1% 30/05/2023 EUR 100,000 101,775 0.04
507,875 0.18
IndiaBharti Airtel International Netherlands BV,
Reg. S 3.375% 20/05/2021 EUR 300,000 303,813 0.11 NTPC Ltd., Reg. S 2.75% 01/02/2027 EUR 200,000 212,692 0.07
516,505 0.18
IndonesiaPerusahaan Perseroan Persero PT
Perusahaan Listrik Negara, Reg. S 2.875% 25/10/2025 EUR 175,000 189,299 0.06
189,299 0.06
IrelandBank of Ireland Group plc, Reg. S, FRN
0.75% 08/07/2024 EUR 200,000 203,326 0.07 DAA Finance plc, Reg. S 1.601%
05/11/2032 EUR 100,000 109,533 0.04 Ryanair DAC, Reg. S 2.875% 15/09/2025 EUR 100,000 107,171 0.04 Ryanair DAC, Reg. S 1.125% 10/03/2023 EUR 300,000 302,935 0.10
722,965 0.25
ItalyAssicurazioni Generali SpA, Reg. S 2.429%
14/07/2031 EUR 100,000 109,788 0.04 CDP Reti SpA, Reg. S 1.875%
29/05/2022 EUR 300,000 306,576 0.11 FCA Bank SpA, Reg. S 0.5% 18/09/2023 EUR 150,000 151,510 0.05 Intesa Sanpaolo SpA, Reg. S 1%
04/07/2024 EUR 150,000 154,812 0.05 Intesa Sanpaolo SpA, Reg. S 1.75%
04/07/2029 EUR 200,000 218,767 0.07 UniCredit SpA, Reg. S, FRN 1.25%
25/06/2025 EUR 100,000 103,379 0.04
1,044,832 0.36
JapanAsahi Group Holdings Ltd., Reg. S 0.155%
23/10/2024 EUR 100,000 100,664 0.03 Asahi Group Holdings Ltd., Reg. S 0.541%
23/10/2028 EUR 100,000 101,706 0.04 Nissan Motor Co. Ltd., Reg. S 2.652%
17/03/2026 EUR 150,000 158,779 0.05
361,149 0.12
luxembourgBlackstone Property Partners Europe
Holdings Sarl, Reg. S 1.25% 26/04/2027 EUR 150,000 153,841 0.05
Blackstone Property Partners Europe Holdings Sarl, Reg. S 2.2% 24/07/2025 EUR 100,000 107,314 0.04
Logicor Financing Sarl, Reg. S 1.5% 13/07/2026 EUR 200,000 211,288 0.07
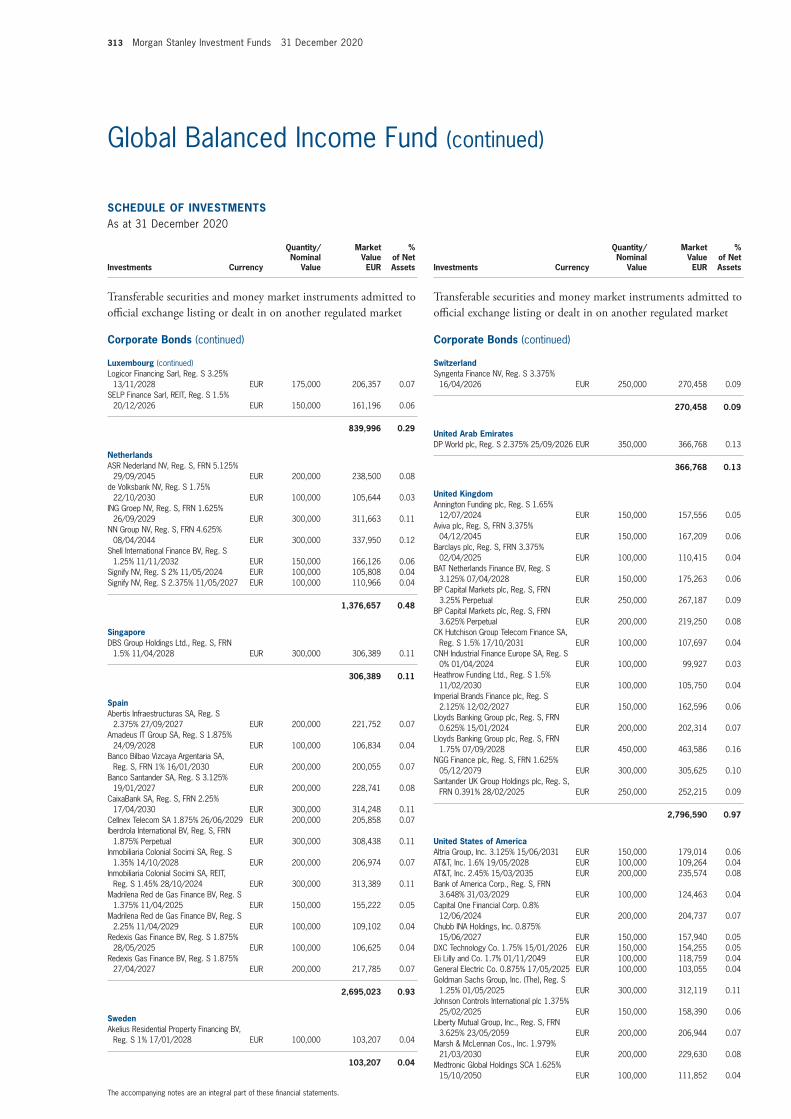
313 Morgan Stanley Investment Funds 31 December 2020
The accompanying notes are an integral part of these financial statements.
Global Balanced Income Fund (continued)
schEDUlE of InVEsTmEnTsAs at 31 December 2020
Investments Currency
Quantity/ Nominal
Value
Market Value EUR
% of Net Assets
Transferable securities and money market instruments admitted to official exchange listing or dealt in on another regulated market
corporate Bonds (continued)
luxembourg (continued)Logicor Financing Sarl, Reg. S 3.25%
13/11/2028 EUR 175,000 206,357 0.07 SELP Finance Sarl, REIT, Reg. S 1.5%
20/12/2026 EUR 150,000 161,196 0.06
839,996 0.29
netherlandsASR Nederland NV, Reg. S, FRN 5.125%
29/09/2045 EUR 200,000 238,500 0.08 de Volksbank NV, Reg. S 1.75%
22/10/2030 EUR 100,000 105,644 0.03 ING Groep NV, Reg. S, FRN 1.625%
26/09/2029 EUR 300,000 311,663 0.11 NN Group NV, Reg. S, FRN 4.625%
08/04/2044 EUR 300,000 337,950 0.12 Shell International Finance BV, Reg. S
1.25% 11/11/2032 EUR 150,000 166,126 0.06 Signify NV, Reg. S 2% 11/05/2024 EUR 100,000 105,808 0.04 Signify NV, Reg. S 2.375% 11/05/2027 EUR 100,000 110,966 0.04
1,376,657 0.48
singaporeDBS Group Holdings Ltd., Reg. S, FRN
1.5% 11/04/2028 EUR 300,000 306,389 0.11
306,389 0.11
spainAbertis Infraestructuras SA, Reg. S
2.375% 27/09/2027 EUR 200,000 221,752 0.07 Amadeus IT Group SA, Reg. S 1.875%
24/09/2028 EUR 100,000 106,834 0.04 Banco Bilbao Vizcaya Argentaria SA,
Reg. S, FRN 1% 16/01/2030 EUR 200,000 200,055 0.07 Banco Santander SA, Reg. S 3.125%
19/01/2027 EUR 200,000 228,741 0.08 CaixaBank SA, Reg. S, FRN 2.25%
17/04/2030 EUR 300,000 314,248 0.11 Cellnex Telecom SA 1.875% 26/06/2029 EUR 200,000 205,858 0.07 Iberdrola International BV, Reg. S, FRN
1.875% Perpetual EUR 300,000 308,438 0.11 Inmobiliaria Colonial Socimi SA, Reg. S
1.35% 14/10/2028 EUR 200,000 206,974 0.07 Inmobiliaria Colonial Socimi SA, REIT,
Reg. S 1.45% 28/10/2024 EUR 300,000 313,389 0.11 Madrilena Red de Gas Finance BV, Reg. S
1.375% 11/04/2025 EUR 150,000 155,222 0.05 Madrilena Red de Gas Finance BV, Reg. S
2.25% 11/04/2029 EUR 100,000 109,102 0.04 Redexis Gas Finance BV, Reg. S 1.875%
28/05/2025 EUR 100,000 106,625 0.04 Redexis Gas Finance BV, Reg. S 1.875%
27/04/2027 EUR 200,000 217,785 0.07
2,695,023 0.93
swedenAkelius Residential Property Financing BV,
Reg. S 1% 17/01/2028 EUR 100,000 103,207 0.04
103,207 0.04
schEDUlE of InVEsTmEnTsAs at 31 December 2020
Investments Currency
Quantity/ Nominal
Value
Market Value EUR
% of Net Assets
Transferable securities and money market instruments admitted to official exchange listing or dealt in on another regulated market
corporate Bonds (continued)
switzerlandSyngenta Finance NV, Reg. S 3.375%
16/04/2026 EUR 250,000 270,458 0.09
270,458 0.09
United arab EmiratesDP World plc, Reg. S 2.375% 25/09/2026 EUR 350,000 366,768 0.13
366,768 0.13
United KingdomAnnington Funding plc, Reg. S 1.65%
12/07/2024 EUR 150,000 157,556 0.05 Aviva plc, Reg. S, FRN 3.375%
04/12/2045 EUR 150,000 167,209 0.06 Barclays plc, Reg. S, FRN 3.375%
02/04/2025 EUR 100,000 110,415 0.04 BAT Netherlands Finance BV, Reg. S
3.125% 07/04/2028 EUR 150,000 175,263 0.06 BP Capital Markets plc, Reg. S, FRN
3.25% Perpetual EUR 250,000 267,187 0.09 BP Capital Markets plc, Reg. S, FRN
3.625% Perpetual EUR 200,000 219,250 0.08 CK Hutchison Group Telecom Finance SA,
Reg. S 1.5% 17/10/2031 EUR 100,000 107,697 0.04 CNH Industrial Finance Europe SA, Reg. S
0% 01/04/2024 EUR 100,000 99,927 0.03 Heathrow Funding Ltd., Reg. S 1.5%
11/02/2030 EUR 100,000 105,750 0.04 Imperial Brands Finance plc, Reg. S
2.125% 12/02/2027 EUR 150,000 162,596 0.06 Lloyds Banking Group plc, Reg. S, FRN
0.625% 15/01/2024 EUR 200,000 202,314 0.07 Lloyds Banking Group plc, Reg. S, FRN
1.75% 07/09/2028 EUR 450,000 463,586 0.16 NGG Finance plc, Reg. S, FRN 1.625%
05/12/2079 EUR 300,000 305,625 0.10 Santander UK Group Holdings plc, Reg. S,
FRN 0.391% 28/02/2025 EUR 250,000 252,215 0.09
2,796,590 0.97
United states of americaAltria Group, Inc. 3.125% 15/06/2031 EUR 150,000 179,014 0.06 AT&T, Inc. 1.6% 19/05/2028 EUR 100,000 109,264 0.04 AT&T, Inc. 2.45% 15/03/2035 EUR 200,000 235,574 0.08 Bank of America Corp., Reg. S, FRN
3.648% 31/03/2029 EUR 100,000 124,463 0.04 Capital One Financial Corp. 0.8%
12/06/2024 EUR 200,000 204,737 0.07 Chubb INA Holdings, Inc. 0.875%
15/06/2027 EUR 150,000 157,940 0.05 DXC Technology Co. 1.75% 15/01/2026 EUR 150,000 154,255 0.05 Eli Lilly and Co. 1.7% 01/11/2049 EUR 100,000 118,759 0.04 General Electric Co. 0.875% 17/05/2025 EUR 100,000 103,055 0.04 Goldman Sachs Group, Inc. (The), Reg. S
1.25% 01/05/2025 EUR 300,000 312,119 0.11 Johnson Controls International plc 1.375%
25/02/2025 EUR 150,000 158,390 0.06 Liberty Mutual Group, Inc., Reg. S, FRN
3.625% 23/05/2059 EUR 200,000 206,944 0.07 Marsh & McLennan Cos., Inc. 1.979%
21/03/2030 EUR 200,000 229,630 0.08 Medtronic Global Holdings SCA 1.625%
15/10/2050 EUR 100,000 111,852 0.04

Morgan Stanley Investment Funds 31 December 2020 314
The accompanying notes are an integral part of these financial statements.
Global Balanced Income Fund (continued)
schEDUlE of InVEsTmEnTsAs at 31 December 2020
Investments Currency
Quantity/ Nominal
Value
Market Value EUR
% of Net Assets
Transferable securities and money market instruments admitted to official exchange listing or dealt in on another regulated market
corporate Bonds (continued)
United states of america (continued)Molson Coors Beverage Co. 1.25%
15/07/2024 EUR 300,000 309,491 0.11 Thermo Fisher Scientific, Inc. 1.875%
01/10/2049 EUR 100,000 116,189 0.04 Upjohn Finance BV, Reg. S 1.362%
23/06/2027 EUR 200,000 212,245 0.07 Upjohn Finance BV, Reg. S 1.908%
23/06/2032 EUR 150,000 166,157 0.06 Verizon Communications, Inc. 1.85%
18/05/2040 EUR 100,000 115,162 0.04 Verizon Communications, Inc. 1.3%
18/05/2033 EUR 100,000 108,973 0.04 Wells Fargo & Co., Reg. S 0.5%
26/04/2024 EUR 150,000 152,331 0.05 Wells Fargo & Co., Reg. S, FRN 1.338%
04/05/2025 EUR 250,000 260,504 0.09 Zimmer Biomet Holdings, Inc. 2.425%
13/12/2026 EUR 100,000 111,950 0.04
3,958,998 1.37
Total corporate Bonds 26,212,838 9.09
Government Bonds
franceFrance Government Bond OAT, Reg. S 0%
25/03/2024 EUR 6,784,000 6,942,576 2.41 France Government Bond OAT, Reg. S
0.75% 25/11/2028 EUR 9,016,000 9,920,902 3.44
16,863,478 5.85
GermanyBundesobligation, Reg. S 0% 08/10/2021 EUR 9,206,000 9,255,702 3.21 Bundesrepublik Deutschland, Reg. S 2.5%
04/01/2021 EUR 808,000 808,000 0.28 Bundesrepublik Deutschland, Reg. S 4.75%
04/07/2034 EUR 2,430,000 4,218,845 1.46
14,282,547 4.95
ItalyItaly Buoni Poliennali Del Tesoro, Reg. S
0.45% 01/06/2021 EUR 754,000 756,978 0.26 Italy Buoni Poliennali Del Tesoro, Reg. S
1% 15/07/2022 EUR 1,121,000 1,146,222 0.40 Italy Buoni Poliennali Del Tesoro, Reg. S
1.75% 01/07/2024 EUR 4,214,000 4,506,119 1.56 Italy Buoni Poliennali Del Tesoro, Reg. S
1.35% 01/04/2030 EUR 3,614,000 3,912,670 1.36
10,321,989 3.58
JapanJapan Government Twenty Year Bond 2.2%
20/03/2030 JPY 627,400,000 5,972,426 2.07 Japan Government Twenty Year Bond 1.7%
20/06/2033 JPY 714,550,000 6,742,183 2.34
12,714,609 4.41
schEDUlE of InVEsTmEnTsAs at 31 December 2020
Investments Currency
Quantity/ Nominal
Value
Market Value EUR
% of Net Assets
Transferable securities and money market instruments admitted to official exchange listing or dealt in on another regulated market
Government Bonds (continued)
spainSpain Government Bond, Reg. S, 144A
1.6% 30/04/2025 EUR 1,627,000 1,775,458 0.62 Spain Government Bond, Reg. S, 144A
1.4% 30/07/2028 EUR 655,000 734,266 0.25 Spain Government Bond 0.75%
30/07/2021 EUR 4,475,000 4,509,775 1.56 Spain Government Bond, Reg. S, 144A
1.95% 30/04/2026 EUR 757,000 853,206 0.30 Spain Government Bond, Reg. S, 144A
1.95% 30/07/2030 EUR 2,760,000 3,275,008 1.13
11,147,713 3.86
United KingdomUK Treasury, Reg. S 4.75% 07/12/2038 GBP 1,699,000 3,245,254 1.12 UK Treasury, Reg. S 4.25% 07/06/2032 GBP 162,000 260,404 0.09
3,505,658 1.21
United states of americaUS Treasury 1.625% 15/05/2026 USD 6,531,000 5,666,707 1.96 US Treasury 2.625% 15/02/2029 USD 27,140,000 25,378,462 8.80 US Treasury 1.625% 31/08/2022 USD 21,380,000 17,861,442 6.19
48,906,611 16.95
Total Government Bonds 117,742,605 40.81
Warrants
switzerlandCie Financiere Richemont SA 22/11/2023 CHF 4,990 1,063 0.00
1,063 0.00
Total Warrants 1,063 0.00
Equities
argentinaGlobant SA USD 514 90,363 0.03
90,363 0.03
austriaANDRITZ AG EUR 1,008 37,546 0.01 Erste Group Bank AG EUR 1,739 43,662 0.02 OMV AG EUR 6,994 227,354 0.08 Verbund AG EUR 1,425 98,978 0.03 voestalpine AG EUR 782 22,731 0.01
430,271 0.15
BelgiumKBC Group NV EUR 1,118 64,039 0.02 UCB SA EUR 1,112 93,942 0.03
157,981 0.05

315 Morgan Stanley Investment Funds 31 December 2020
The accompanying notes are an integral part of these financial statements.
Global Balanced Income Fund (continued)
schEDUlE of InVEsTmEnTsAs at 31 December 2020
Investments Currency
Quantity/ Nominal
Value
Market Value EUR
% of Net Assets
Transferable securities and money market instruments admitted to official exchange listing or dealt in on another regulated market
Equities (continued)
BrazilAtacadao SA BRL 20,200 61,326 0.02 Banco Bradesco SA BRL 32,000 121,177 0.04 Banco Bradesco SA Preference BRL 42,400 180,116 0.06 Banco do Brasil SA BRL 6,000 36,608 0.01 Banco Santander Brasil SA BRL 34,400 242,206 0.08 Cia Brasileira de Distribuicao BRL 4,400 51,789 0.02 Cia Energetica de Minas Gerais Preference BRL 12,400 28,352 0.01 Cosan SA BRL 3,900 46,179 0.02 CPFL Energia SA BRL 4,600 23,481 0.01 Klabin SA BRL 24,400 100,638 0.03 Lojas Renner SA BRL 8,600 58,572 0.02 Magazine Luiza SA BRL 11,800 46,044 0.02 Natura & Co. Holding SA BRL 7,000 57,410 0.02 Notre Dame Intermedica Participacoes SA BRL 1,800 22,102 0.01 Ultrapar Participacoes SA BRL 13,000 48,145 0.02 Via Varejo S/A BRL 34,200 86,324 0.03 WEG SA BRL 1,900 22,547 0.01
1,233,016 0.43
chileAguas Andinas SA ‘A’ CLP 75,277 19,718 0.01 Banco Santander Chile CLP 1,332,655 51,683 0.02 Empresas COPEC SA CLP 5,829 48,078 0.01 Enel Americas SA CLP 298,988 39,613 0.01 Sociedad Quimica y Minera de Chile SA
Preference ‘B’ CLP 3,415 135,377 0.05
294,469 0.10
china3SBio, Inc., Reg. S HKD 42,000 31,212 0.01 51job, Inc., ADR USD 568 31,610 0.01 Agricultural Bank of China Ltd. ‘H’ HKD 939,000 280,312 0.10 AK Medical Holdings Ltd., Reg. S HKD 6,000 8,489 0.00 Alibaba Group Holding Ltd., ADR USD 8,256 1,587,019 0.55 Alibaba Health Information Technology Ltd. HKD 8,000 19,257 0.01 Anhui Gujing Distillery Co. Ltd. ‘B’ HKD 1,600 18,162 0.01 AviChina Industry & Technology Co. Ltd. ‘H’ HKD 9,000 5,118 0.00 Baidu, Inc., ADR USD 1,181 208,913 0.07 Baozun, Inc., ADR USD 1,757 48,087 0.02 Beijing Capital International Airport Co. Ltd. ‘H’ HKD 6,000 4,081 0.00 Beijing Enterprises Water Group Ltd. HKD 22,000 7,215 0.00 BYD Co. Ltd. ‘H’ HKD 5,000 106,795 0.04 BYD Electronic International Co. Ltd. HKD 10,500 44,810 0.02 CGN Power Co. Ltd., Reg. S ‘H’ HKD 106,000 18,607 0.01 China Communications Services Corp. Ltd. ‘H’ HKD 10,000 3,595 0.00 China Conch Venture Holdings Ltd. HKD 16,000 63,404 0.02 China Construction Bank Corp. ‘H’ HKD 176,000 108,965 0.04 China East Education Holdings Ltd., Reg. S HKD 22,500 44,084 0.02 China Everbright Bank Co. Ltd. ‘H’ HKD 94,000 29,148 0.01 China Evergrande Group HKD 4,000 6,265 0.00 China Gas Holdings Ltd. HKD 3,000 9,712 0.00 China Lesso Group Holdings Ltd. HKD 2,000 2,552 0.00 China Literature Ltd., Reg. S HKD 6,200 39,656 0.01 China Longyuan Power Group Corp. Ltd. ‘H’ HKD 93,000 75,956 0.03 China Medical System Holdings Ltd. HKD 48,000 43,693 0.02 China Merchants Port Holdings Co. Ltd. HKD 3,189 3,181 0.00 China Mobile Ltd. HKD 35,000 162,610 0.06 China Molybdenum Co. Ltd. ‘H’ HKD 417,000 221,791 0.08 China Overseas Land & Investment Ltd. HKD 30,500 54,052 0.02 China Petroleum & Chemical Corp. ‘H’ HKD 206,000 75,137 0.03 China Railway Construction Corp. Ltd. ‘H’ HKD 12,500 5,571 0.00 China Railway Signal & Communication
Corp. Ltd., Reg. S ‘H’ HKD 392,000 107,131 0.04
schEDUlE of InVEsTmEnTsAs at 31 December 2020
Investments Currency
Quantity/ Nominal
Value
Market Value EUR
% of Net Assets
Transferable securities and money market instruments admitted to official exchange listing or dealt in on another regulated market
Equities (continued)
china (continued)China Resources Gas Group Ltd. HKD 2,000 8,672 0.00 China Resources Land Ltd. HKD 20,000 67,272 0.02 China Southern Airlines Co. Ltd. ‘H’ HKD 4,000 1,943 0.00 China State Construction International
Holdings Ltd. HKD 6,000 2,788 0.00 China Vanke Co. Ltd. ‘H’ HKD 24,600 69,170 0.02 COSCO SHIPPING Energy Transportation
Co. Ltd. ‘H’ HKD 236,000 75,660 0.03 CRRC Corp. Ltd. ‘H’ HKD 51,000 14,313 0.00 CSPC Pharmaceutical Group Ltd. HKD 42,880 35,743 0.01 Dongfeng Motor Group Co. Ltd. ‘H’ HKD 302,000 286,967 0.10 ENN Energy Holdings Ltd. HKD 3,400 40,670 0.01 Fosun International Ltd. HKD 2,500 3,201 0.00 Fuyao Glass Industry Group Co. Ltd.,
Reg. S ‘H’ HKD 26,800 120,006 0.04 GDS Holdings Ltd., ADR USD 481 36,545 0.01 Geely Automobile Holdings Ltd. HKD 64,000 178,272 0.06 GOME Retail Holdings Ltd. HKD 784,000 76,640 0.03 Greentown Service Group Co. Ltd., Reg. S HKD 6,000 6,036 0.00 GSX Techedu, Inc., ADR USD 481 19,994 0.01 Guangdong Investment Ltd. HKD 8,000 11,739 0.00 Guangzhou R&F Properties Co. Ltd. ‘H’ HKD 6,400 6,707 0.00 Haitian International Holdings Ltd. HKD 1,000 2,817 0.00 Haitong Securities Co. Ltd. ‘H’ HKD 40,400 29,429 0.01 Huazhu Group Ltd., ADR USD 941 34,513 0.01 JD.com, Inc., ADR USD 1,851 132,654 0.05 Kaisa Group Holdings Ltd. HKD 9,000 3,623 0.00 Kingdee International Software Group Co. Ltd. HKD 2,000 6,643 0.00 Kingsoft Corp. Ltd. HKD 7,000 36,790 0.01 Koolearn Technology Holding Ltd., Reg. S HKD 34,000 99,710 0.03 KWG Group Holdings Ltd. HKD 4,500 5,004 0.00 Lee & Man Paper Manufacturing Ltd. HKD 39,000 26,031 0.01 Li Ning Co. Ltd. HKD 3,500 19,609 0.01 Logan Group Co. Ltd. HKD 13,000 17,354 0.01 Longfor Group Holdings Ltd.§ HKD 5,000 23,861 0.01 Luye Pharma Group Ltd., Reg. S HKD 71,500 27,131 0.01 Meituan Dianping, Reg. S ‘B’ HKD 11,300 349,920 0.12 NetEase, Inc., ADR USD 1,073 83,605 0.03 Ping An Healthcare and Technology Co.
Ltd., Reg. S HKD 3,700 36,558 0.01 Ping An Insurance Group Co. of China Ltd. ‘H’ HKD 98,000 978,603 0.34 Seazen Group Ltd. HKD 2,000 1,356 0.00 Semiconductor Manufacturing International
Corp. HKD 30,000 69,690 0.02 Shanghai Electric Group Co. Ltd. ‘H’ HKD 270,000 67,546 0.02 Shanghai Pharmaceuticals Holding Co. Ltd. ‘H’ HKD 122,100 175,317 0.06 Shenzhen International Holdings Ltd. HKD 1,500 1,974 0.00 Shenzhen Investment Ltd. HKD 102,000 28,519 0.01 Shenzhou International Group Holdings Ltd. HKD 5,100 81,484 0.03 Sinopharm Group Co. Ltd. ‘H’ HKD 23,600 46,785 0.02 Sun Art Retail Group Ltd. HKD 12,500 10,354 0.00 Sunac China Holdings Ltd. HKD 12,000 36,138 0.01 Sunny Optical Technology Group Co. Ltd. HKD 3,100 55,297 0.02 TAL Education Group, ADR USD 616 36,078 0.01 Tencent Holdings Ltd. HKD 18,800 1,114,536 0.39 Tencent Music Entertainment Group, ADR USD 1,936 29,696 0.01 Tongcheng-Elong Holdings Ltd., Reg. S HKD 78,000 122,982 0.04 Trip.com Group Ltd., ADR USD 4,974 134,795 0.05 Vinda International Holdings Ltd. HKD 3,000 6,669 0.00 Weichai Power Co. Ltd. ‘H’ HKD 9,000 14,720 0.01 Wuxi Biologics Cayman, Inc., Reg. S HKD 31,500 340,377 0.12 Xiaomi Corp., Reg. S ‘B’ HKD 29,800 103,995 0.04 Xinyi Solar Holdings Ltd. HKD 164,000 349,081 0.12 Yihai International Holding Ltd. HKD 5,000 60,440 0.02 Yum China Holdings, Inc. USD 1,116 52,037 0.02 Yuzhou Group Holdings Co. Ltd. HKD 8,000 2,355 0.00

Morgan Stanley Investment Funds 31 December 2020 316
The accompanying notes are an integral part of these financial statements.
Global Balanced Income Fund (continued)
schEDUlE of InVEsTmEnTsAs at 31 December 2020
Investments Currency
Quantity/ Nominal
Value
Market Value EUR
% of Net Assets
Transferable securities and money market instruments admitted to official exchange listing or dealt in on another regulated market
Equities (continued)
china (continued)Zhaojin Mining Industry Co. Ltd. ‘H’ HKD 18,500 17,949 0.01 Zhenro Properties Group Ltd., Reg. S HKD 7,000 3,436 0.00 ZhongAn Online P&C Insurance Co. Ltd.,
Reg. S ‘H’ HKD 24,800 94,366 0.03 Zhuzhou CRRC Times Electric Co. Ltd. ‘H’ HKD 4,200 14,922 0.01 ZTE Corp. ‘H’ HKD 20,000 40,994 0.01 ZTO Express Cayman, Inc., ADR USD 885 20,875 0.01
9,587,146 3.32
czech RepublicCEZ A/S CZK 789 15,472 0.01
15,472 0.01
DenmarkGenmab A/S DKK 476 155,787 0.05 H Lundbeck A/S DKK 2,662 74,367 0.03 Novo Nordisk A/S ‘B’ DKK 12,332 699,350 0.24 Novozymes A/S ‘B’ DKK 2,031 94,608 0.03 Orsted A/S, Reg. S DKK 606 100,137 0.03 Pandora A/S DKK 511 46,444 0.02 Tryg A/S DKK 785 20,147 0.01 Vestas Wind Systems A/S DKK 335 64,515 0.02
1,255,355 0.43
finlandNeste OYJ EUR 1,376 81,269 0.03 Nokia OYJ EUR 26,039 81,918 0.03 UPM-Kymmene OYJ EUR 4,166 126,763 0.04
289,950 0.10
franceAir Liquide SA EUR 1,430 191,978 0.07 Airbus SE EUR 1,891 169,774 0.06 Alstom SA EUR 771 35,936 0.01 Amundi SA, Reg. S EUR 533 35,605 0.01 Atos SE EUR 1,093 81,735 0.03 AXA SA EUR 8,500 165,852 0.06 BNP Paribas SA EUR 5,037 217,120 0.08 Capgemini SE EUR 947 120,080 0.04 Carrefour SA EUR 16,244 227,903 0.08 Cie Generale des Etablissements Michelin SCA EUR 577 60,556 0.02 Dassault Systemes SE EUR 874 145,215 0.05 EssilorLuxottica SA EUR 245 31,250 0.01 Gecina SA, REIT EUR 1,361 171,894 0.06 Getlink SE EUR 3,586 50,850 0.02 Kering SA EUR 25 14,860 0.00 Legrand SA EUR 1,057 77,161 0.03 L’Oreal SA EUR 1,149 357,109 0.12 LVMH Moet Hennessy Louis Vuitton SE EUR 637 325,443 0.11 Natixis SA EUR 11,044 30,802 0.01 Orange SA EUR 3,643 35,461 0.01 Orpea SA EUR 229 24,629 0.01 Pernod Ricard SA EUR 2,283 357,974 0.12 Publicis Groupe SA EUR 890 36,276 0.01 Sanofi EUR 2,813 221,383 0.08 Schneider Electric SE EUR 1,627 192,474 0.07 Societe Generale SA EUR 2,467 41,993 0.01 Teleperformance EUR 169 45,850 0.02 Thales SA EUR 996 74,600 0.03
schEDUlE of InVEsTmEnTsAs at 31 December 2020
Investments Currency
Quantity/ Nominal
Value
Market Value EUR
% of Net Assets
Transferable securities and money market instruments admitted to official exchange listing or dealt in on another regulated market
Equities (continued)
france (continued)TOTAL SE EUR 10,961 386,923 0.13 Valeo SA EUR 5,253 169,567 0.06 Vinci SA EUR 1,420 115,531 0.04 Vivendi SA EUR 1,672 44,107 0.02
4,257,891 1.48
Germanyadidas AG EUR 927 274,299 0.09 Allianz SE EUR 1,102 219,137 0.08 BASF SE EUR 648 41,530 0.01 Beiersdorf AG EUR 2,573 247,748 0.09 Brenntag AG§ EUR 1,251 78,904 0.03 Deutsche Boerse AG EUR 652 90,028 0.03 Deutsche Post AG EUR 3,497 141,250 0.05 Fresenius SE & Co. KGaA EUR 4,467 167,509 0.06 KION Group AG EUR 635 44,903 0.02 Merck KGaA EUR 1,051 146,618 0.05 MTU Aero Engines AG EUR 419 88,993 0.03 SAP SE EUR 2,919 310,078 0.11 Siemens AG EUR 2,848 332,696 0.11 thyssenkrupp AG EUR 8,041 64,464 0.02 Vonovia SE EUR 292 17,405 0.01
2,265,562 0.79
hong KongAIA Group Ltd. HKD 28,200 281,598 0.10 BeiGene Ltd., ADR USD 79 16,355 0.01 BOC Hong Kong Holdings Ltd. HKD 45,000 111,157 0.04 CK Hutchison Holdings Ltd. HKD 2,684 15,263 0.01 CLP Holdings Ltd. HKD 3,500 26,378 0.01 Dairy Farm International Holdings Ltd. USD 10,500 35,686 0.01 Hang Seng Bank Ltd. HKD 300 4,216 0.00 HK Electric Investments & HK Electric
Investments Ltd., Reg. S HKD 3,500 2,807 0.00 Hong Kong Exchanges & Clearing Ltd. HKD 517 23,096 0.01 Jardine Matheson Holdings Ltd. USD 300 13,693 0.00 Kerry Properties Ltd. HKD 500 1,032 0.00 Link REIT HKD 3,351 24,868 0.01 MTR Corp. Ltd. HKD 15,000 68,350 0.02 New World Development Co. Ltd. HKD 1,000 3,795 0.00 Power Assets Holdings Ltd. HKD 7,000 30,903 0.01 Sino Land Co. Ltd. HKD 14,000 14,863 0.01 Sun Hung Kai Properties Ltd. HKD 5,500 57,812 0.02 Sunac Services Holdings Ltd., Reg. S HKD 450 812 0.00 Swire Properties Ltd. HKD 11,600 27,495 0.01 Techtronic Industries Co. Ltd. HKD 1,000 11,626 0.00 Wharf Real Estate Investment Co. Ltd. HKD 2,000 8,483 0.00
780,288 0.27
hungaryMOL Hungarian Oil & Gas plc HUF 8,619 51,824 0.02
51,824 0.02
IndonesiaAstra International Tbk. PT IDR 30,900 10,749 0.00 Bank Central Asia Tbk. PT IDR 200 391 0.00 Bank Negara Indonesia Persero Tbk. PT IDR 153,900 54,848 0.02 Bank Rakyat Indonesia Persero Tbk. PT IDR 783,200 188,511 0.07 Barito Pacific Tbk. PT IDR 811,900 51,553 0.02

317 Morgan Stanley Investment Funds 31 December 2020
The accompanying notes are an integral part of these financial statements.
Global Balanced Income Fund (continued)
schEDUlE of InVEsTmEnTsAs at 31 December 2020
Investments Currency
Quantity/ Nominal
Value
Market Value EUR
% of Net Assets
Transferable securities and money market instruments admitted to official exchange listing or dealt in on another regulated market
Equities (continued)
Indonesia (continued)Perusahaan Gas Negara Tbk. PT IDR 35,600 3,399 0.00 Unilever Indonesia Tbk. PT IDR 30,100 12,777 0.00 XL Axiata Tbk. PT IDR 714,100 112,528 0.04
434,756 0.15
IrelandCRH plc EUR 3,215 109,374 0.04
109,374 0.04
ItalyEnel SpA EUR 25,523 210,975 0.07 Intesa Sanpaolo SpA EUR 134,196 257,296 0.09 Prysmian SpA EUR 2,173 62,913 0.02 Terna Rete Elettrica Nazionale SpA EUR 2,924 18,240 0.01
549,424 0.19
JapanAdvantest Corp. JPY 1,300 79,332 0.03 Aeon Co. Ltd. JPY 8,500 227,366 0.08 Alfresa Holdings Corp. JPY 14,100 210,206 0.07 Asahi Kasei Corp. JPY 7,800 64,906 0.02 Astellas Pharma, Inc. JPY 16,400 206,343 0.07 Benesse Holdings, Inc. JPY 4,700 74,726 0.03 Chubu Electric Power Co., Inc. JPY 5,900 57,962 0.02 Chugai Pharmaceutical Co. Ltd. JPY 6,200 269,114 0.09 Cosmos Pharmaceutical Corp. JPY 100 13,167 0.00 Dai Nippon Printing Co. Ltd. JPY 6,400 93,664 0.03 Daifuku Co. Ltd. JPY 900 90,783 0.03 Dai-ichi Life Holdings, Inc. JPY 6,500 79,427 0.03 Daiichi Sankyo Co. Ltd. JPY 7,100 198,189 0.07 Daikin Industries Ltd. JPY 1,000 181,620 0.06 Daiwa House Industry Co. Ltd. JPY 7,900 191,161 0.07 East Japan Railway Co. JPY 4,400 239,420 0.08 Eisai Co. Ltd. JPY 2,000 116,515 0.04 ENEOS Holdings, Inc. JPY 18,300 53,522 0.02 Fast Retailing Co. Ltd. JPY 300 219,375 0.08 FUJIFILM Holdings Corp. JPY 2,500 107,568 0.04 Fujitsu Ltd. JPY 1,100 129,367 0.05 Hamamatsu Photonics KK JPY 3,600 167,595 0.06 Hankyu Hanshin Holdings, Inc. JPY 4,700 127,318 0.04 Hitachi Construction Machinery Co. Ltd. JPY 1,800 41,649 0.01 Hitachi Ltd. JPY 4,300 137,964 0.05 Honda Motor Co. Ltd. JPY 3,600 82,681 0.03 Inpex Corp. JPY 6,300 27,666 0.01 ITOCHU Corp. JPY 17,700 413,910 0.14 Japan Post Holdings Co. Ltd. JPY 8,100 51,306 0.02 Kansai Electric Power Co., Inc. (The) JPY 5,500 42,342 0.01 Kansai Paint Co. Ltd. JPY 1,700 42,656 0.02 Kao Corp. JPY 900 56,573 0.02 Kawasaki Heavy Industries Ltd. JPY 8,700 159,609 0.06 KDDI Corp. JPY 27,800 670,246 0.23 Keyence Corp. JPY 600 275,062 0.10 Kikkoman Corp. JPY 1,200 67,916 0.02 Kobayashi Pharmaceutical Co. Ltd. JPY 400 39,852 0.01 Kobe Bussan Co. Ltd. JPY 1,500 37,618 0.01 Koito Manufacturing Co. Ltd. JPY 5,300 293,940 0.10 Komatsu Ltd. JPY 7,000 156,420 0.05 Kose Corp. JPY 500 69,420 0.02 Kyocera Corp. JPY 1,900 94,948 0.03 Kyushu Railway Co. JPY 4,900 86,127 0.03 Lawson, Inc. JPY 4,500 170,720 0.06
schEDUlE of InVEsTmEnTsAs at 31 December 2020
Investments Currency
Quantity/ Nominal
Value
Market Value EUR
% of Net Assets
Transferable securities and money market instruments admitted to official exchange listing or dealt in on another regulated market
Equities (continued)
Japan (continued)Lion Corp. JPY 3,600 71,044 0.02 Marubeni Corp. JPY 7,600 41,144 0.01 Marui Group Co. Ltd. JPY 5,000 71,499 0.03 Mitsui Chemicals, Inc. JPY 2,200 52,564 0.02 Mitsui Fudosan Co. Ltd. JPY 7,700 130,977 0.05 Mizuho Financial Group, Inc. JPY 13,740 141,845 0.05 MS&AD Insurance Group Holdings, Inc. JPY 4,700 116,547 0.04 Murata Manufacturing Co. Ltd. JPY 1,800 132,506 0.05 Nabtesco Corp. JPY 1,800 64,428 0.02 Nidec Corp. JPY 900 92,397 0.03 Nikon Corp. JPY 4,600 23,599 0.01 Nippon Express Co. Ltd. JPY 1,800 98,548 0.03 Nippon Paint Holdings Co. Ltd. JPY 600 53,667 0.02 Nippon Prologis REIT, Inc. JPY 26 66,224 0.02 Nippon Telegraph & Telephone Corp. JPY 6,800 142,034 0.05 Nippon Yusen KK JPY 8,300 157,383 0.05 Nissan Chemical Corp. JPY 900 45,869 0.02 Nitori Holdings Co. Ltd. JPY 400 68,348 0.02 Nitto Denko Corp. JPY 1,900 138,577 0.05 Nomura Holdings, Inc. JPY 21,000 90,372 0.03 Nomura Real Estate Holdings, Inc. JPY 3,100 56,045 0.02 Nomura Real Estate Master Fund, Inc., REIT JPY 24 28,057 0.01 NTT Data Corp. JPY 10,400 115,792 0.04 Odakyu Electric Railway Co. Ltd. JPY 5,300 135,690 0.05 Omron Corp. JPY 3,400 247,385 0.09 Oriental Land Co. Ltd. JPY 1,300 174,925 0.06 ORIX Corp. JPY 7,600 95,075 0.03 Orix JREIT, Inc., REIT JPY 13 17,522 0.01 Osaka Gas Co. Ltd. JPY 4,000 66,692 0.02 Pan Pacific International Holdings Corp. JPY 3,000 56,585 0.02 Panasonic Corp. JPY 17,300 163,644 0.06 Persol Holdings Co. Ltd. JPY 5,000 73,472 0.03 Pola Orbis Holdings, Inc. JPY 3,800 62,810 0.02 Rakuten, Inc. JPY 9,100 71,477 0.02 Recruit Holdings Co. Ltd. JPY 3,000 102,362 0.04 Resona Holdings, Inc. JPY 24,300 69,139 0.02 Santen Pharmaceutical Co. Ltd. JPY 9,100 120,369 0.04 Sekisui Chemical Co. Ltd. JPY 2,900 44,722 0.02 Sekisui House Ltd. JPY 15,100 250,327 0.09 Seven & i Holdings Co. Ltd. JPY 5,300 152,839 0.05 SG Holdings Co. Ltd. JPY 5,800 128,837 0.04 Shimizu Corp. JPY 15,100 89,533 0.03 Shin-Etsu Chemical Co. Ltd. JPY 900 128,336 0.04 Shionogi & Co. Ltd. JPY 3,700 164,409 0.06 Shiseido Co. Ltd. JPY 3,000 168,900 0.06 SoftBank Group Corp. JPY 6,200 394,682 0.14 Sompo Holdings, Inc. JPY 1,600 52,758 0.02 Sony Corp. JPY 6,600 541,126 0.19 Stanley Electric Co. Ltd. JPY 700 18,392 0.01 Sumitomo Chemical Co. Ltd. JPY 38,100 124,737 0.04 Sumitomo Electric Industries Ltd. JPY 1,600 17,273 0.01 Sumitomo Metal Mining Co. Ltd. JPY 2,500 90,439 0.03 Sumitomo Mitsui Financial Group, Inc. JPY 13,000 327,752 0.11 Sumitomo Mitsui Trust Holdings, Inc. JPY 2,900 72,673 0.03 Sundrug Co. Ltd. JPY 1,700 55,312 0.02 Sysmex Corp. JPY 2,000 195,837 0.07 Takeda Pharmaceutical Co. Ltd. JPY 7,700 226,733 0.08 Teijin Ltd. JPY 3,500 53,659 0.02 TIS, Inc. JPY 7,500 125,336 0.04 Tohoku Electric Power Co., Inc. JPY 3,800 25,493 0.01 Tokio Marine Holdings, Inc. JPY 2,300 96,337 0.03 Tokyo Electron Ltd. JPY 800 242,537 0.08 Tokyu Corp. JPY 16,500 166,892 0.06 TOTO Ltd. JPY 4,100 200,673 0.07 Toyoda Gosei Co. Ltd. JPY 3,000 70,881 0.02 USS Co. Ltd. JPY 4,900 80,694 0.03
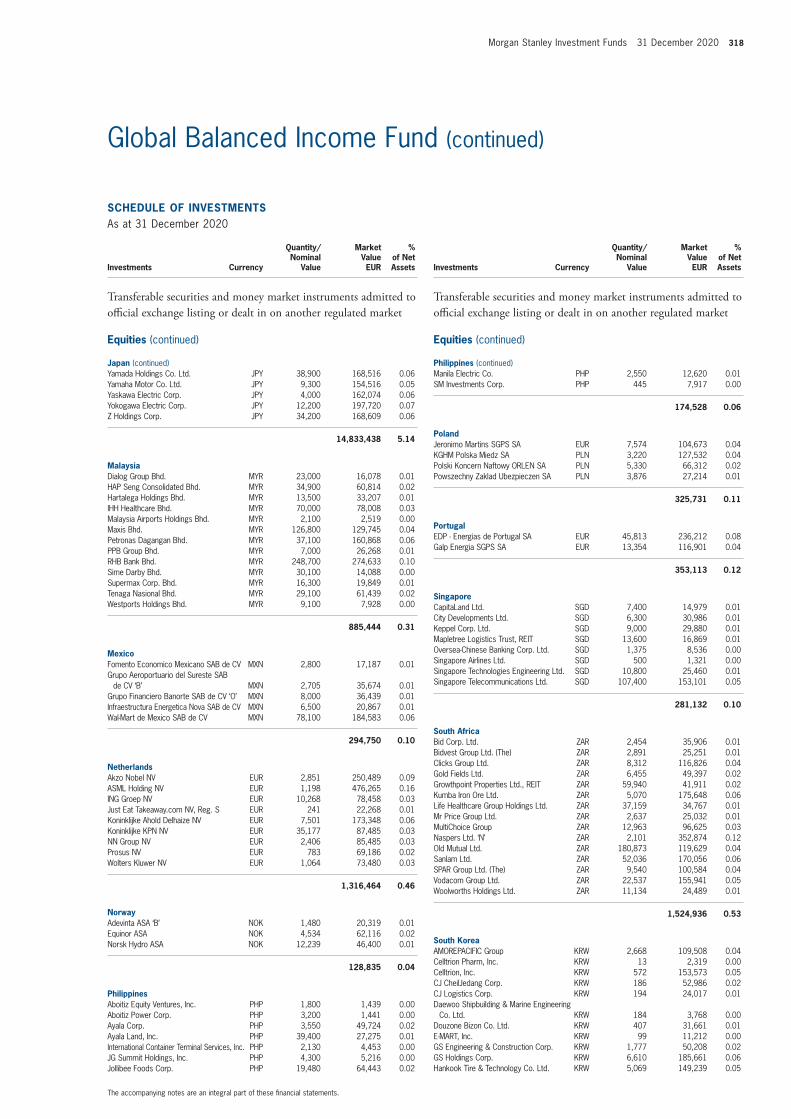
Morgan Stanley Investment Funds 31 December 2020 318
The accompanying notes are an integral part of these financial statements.
Global Balanced Income Fund (continued)
schEDUlE of InVEsTmEnTsAs at 31 December 2020
Investments Currency
Quantity/ Nominal
Value
Market Value EUR
% of Net Assets
Transferable securities and money market instruments admitted to official exchange listing or dealt in on another regulated market
Equities (continued)
Japan (continued)Yamada Holdings Co. Ltd. JPY 38,900 168,516 0.06 Yamaha Motor Co. Ltd. JPY 9,300 154,516 0.05 Yaskawa Electric Corp. JPY 4,000 162,074 0.06 Yokogawa Electric Corp. JPY 12,200 197,720 0.07 Z Holdings Corp. JPY 34,200 168,609 0.06
14,833,438 5.14
malaysiaDialog Group Bhd. MYR 23,000 16,078 0.01 HAP Seng Consolidated Bhd. MYR 34,900 60,814 0.02 Hartalega Holdings Bhd. MYR 13,500 33,207 0.01 IHH Healthcare Bhd. MYR 70,000 78,008 0.03 Malaysia Airports Holdings Bhd. MYR 2,100 2,519 0.00 Maxis Bhd. MYR 126,800 129,745 0.04 Petronas Dagangan Bhd. MYR 37,100 160,868 0.06 PPB Group Bhd. MYR 7,000 26,268 0.01 RHB Bank Bhd. MYR 248,700 274,633 0.10 Sime Darby Bhd. MYR 30,100 14,088 0.00 Supermax Corp. Bhd. MYR 16,300 19,849 0.01 Tenaga Nasional Bhd. MYR 29,100 61,439 0.02 Westports Holdings Bhd. MYR 9,100 7,928 0.00
885,444 0.31
mexicoFomento Economico Mexicano SAB de CV MXN 2,800 17,187 0.01 Grupo Aeroportuario del Sureste SAB
de CV ‘B’ MXN 2,705 35,674 0.01 Grupo Financiero Banorte SAB de CV ‘O’ MXN 8,000 36,439 0.01 Infraestructura Energetica Nova SAB de CV MXN 6,500 20,867 0.01 Wal-Mart de Mexico SAB de CV MXN 78,100 184,583 0.06
294,750 0.10
netherlandsAkzo Nobel NV EUR 2,851 250,489 0.09 ASML Holding NV EUR 1,198 476,265 0.16 ING Groep NV EUR 10,268 78,458 0.03 Just Eat Takeaway.com NV, Reg. S EUR 241 22,268 0.01 Koninklijke Ahold Delhaize NV EUR 7,501 173,348 0.06 Koninklijke KPN NV EUR 35,177 87,485 0.03 NN Group NV EUR 2,406 85,485 0.03 Prosus NV EUR 783 69,186 0.02 Wolters Kluwer NV EUR 1,064 73,480 0.03
1,316,464 0.46
norwayAdevinta ASA ‘B’ NOK 1,480 20,319 0.01 Equinor ASA NOK 4,534 62,116 0.02 Norsk Hydro ASA NOK 12,239 46,400 0.01
128,835 0.04
PhilippinesAboitiz Equity Ventures, Inc. PHP 1,800 1,439 0.00 Aboitiz Power Corp. PHP 3,200 1,441 0.00 Ayala Corp. PHP 3,550 49,724 0.02 Ayala Land, Inc. PHP 39,400 27,275 0.01 International Container Terminal Services, Inc. PHP 2,130 4,453 0.00 JG Summit Holdings, Inc. PHP 4,300 5,216 0.00 Jollibee Foods Corp. PHP 19,480 64,443 0.02
schEDUlE of InVEsTmEnTsAs at 31 December 2020
Investments Currency
Quantity/ Nominal
Value
Market Value EUR
% of Net Assets
Transferable securities and money market instruments admitted to official exchange listing or dealt in on another regulated market
Equities (continued)
Philippines (continued)Manila Electric Co. PHP 2,550 12,620 0.01 SM Investments Corp. PHP 445 7,917 0.00
174,528 0.06
PolandJeronimo Martins SGPS SA EUR 7,574 104,673 0.04 KGHM Polska Miedz SA PLN 3,220 127,532 0.04 Polski Koncern Naftowy ORLEN SA PLN 5,330 66,312 0.02 Powszechny Zaklad Ubezpieczen SA PLN 3,876 27,214 0.01
325,731 0.11
PortugalEDP - Energias de Portugal SA EUR 45,813 236,212 0.08 Galp Energia SGPS SA EUR 13,354 116,901 0.04
353,113 0.12
singaporeCapitaLand Ltd. SGD 7,400 14,979 0.01 City Developments Ltd. SGD 6,300 30,986 0.01 Keppel Corp. Ltd. SGD 9,000 29,880 0.01 Mapletree Logistics Trust, REIT SGD 13,600 16,869 0.01 Oversea-Chinese Banking Corp. Ltd. SGD 1,375 8,536 0.00 Singapore Airlines Ltd. SGD 500 1,321 0.00 Singapore Technologies Engineering Ltd. SGD 10,800 25,460 0.01 Singapore Telecommunications Ltd. SGD 107,400 153,101 0.05
281,132 0.10
south africaBid Corp. Ltd. ZAR 2,454 35,906 0.01 Bidvest Group Ltd. (The) ZAR 2,891 25,251 0.01 Clicks Group Ltd. ZAR 8,312 116,826 0.04 Gold Fields Ltd. ZAR 6,455 49,397 0.02 Growthpoint Properties Ltd., REIT ZAR 59,940 41,911 0.02 Kumba Iron Ore Ltd. ZAR 5,070 175,648 0.06 Life Healthcare Group Holdings Ltd. ZAR 37,159 34,767 0.01 Mr Price Group Ltd. ZAR 2,637 25,032 0.01 MultiChoice Group ZAR 12,963 96,625 0.03 Naspers Ltd. ‘N’ ZAR 2,101 352,874 0.12 Old Mutual Ltd. ZAR 180,873 119,629 0.04 Sanlam Ltd. ZAR 52,036 170,056 0.06 SPAR Group Ltd. (The) ZAR 9,540 100,584 0.04 Vodacom Group Ltd. ZAR 22,537 155,941 0.05 Woolworths Holdings Ltd. ZAR 11,134 24,489 0.01
1,524,936 0.53
south KoreaAMOREPACIFIC Group KRW 2,668 109,508 0.04 Celltrion Pharm, Inc. KRW 13 2,319 0.00 Celltrion, Inc. KRW 572 153,573 0.05 CJ CheilJedang Corp. KRW 186 52,986 0.02 CJ Logistics Corp. KRW 194 24,017 0.01 Daewoo Shipbuilding & Marine Engineering
Co. Ltd. KRW 184 3,768 0.00 Douzone Bizon Co. Ltd. KRW 407 31,661 0.01 E-MART, Inc. KRW 99 11,212 0.00 GS Engineering & Construction Corp. KRW 1,777 50,208 0.02 GS Holdings Corp. KRW 6,610 185,661 0.06 Hankook Tire & Technology Co. Ltd. KRW 5,069 149,239 0.05

319 Morgan Stanley Investment Funds 31 December 2020
The accompanying notes are an integral part of these financial statements.
Global Balanced Income Fund (continued)
schEDUlE of InVEsTmEnTsAs at 31 December 2020
Investments Currency
Quantity/ Nominal
Value
Market Value EUR
% of Net Assets
Transferable securities and money market instruments admitted to official exchange listing or dealt in on another regulated market
Equities (continued)
south Korea (continued)Hanmi Pharm Co. Ltd. KRW 29 7,824 0.00 Hanon Systems KRW 22,521 273,605 0.10 Hanwha Solutions Corp. KRW 1,516 54,202 0.02 Hyundai Glovis Co. Ltd. KRW 77 10,589 0.00 Hyundai Heavy Industries Holdings Co. Ltd. KRW 13 2,756 0.00 Hyundai Marine & Fire Insurance Co. Ltd. KRW 6,242 106,148 0.04 Hyundai Mobis Co. Ltd. KRW 35 6,684 0.00 Hyundai Motor Co. KRW 512 73,441 0.03 Korea Aerospace Industries Ltd. KRW 292 5,635 0.00 Korea Electric Power Corp. KRW 1,605 32,886 0.01 Korean Air Lines Co. Ltd. KRW 192 3,899 0.00 LG Chem Ltd. KRW 150 92,388 0.03 LG Corp. KRW 1,111 72,679 0.03 LG Household & Health Care Ltd. KRW 61 73,948 0.03 Lotte Chemical Corp. KRW 16 3,299 0.00 Lotte Corp. KRW 191 5,043 0.00 NAVER Corp. KRW 509 111,316 0.04 S-1 Corp. KRW 717 45,600 0.02 Samsung C&T Corp. KRW 13 1,341 0.00 Samsung Electro-Mechanics Co. Ltd. KRW 1,512 201,146 0.07 Samsung Electronics Co. Ltd. Preference KRW 1,571 86,437 0.03 Samsung Electronics Co. Ltd. KRW 26,901 1,629,164 0.56 Samsung Fire & Marine Insurance Co. Ltd. KRW 347 48,645 0.02 Samsung SDI Co. Ltd. KRW 407 191,040 0.07 Samsung SDS Co. Ltd. KRW 134 17,876 0.01 Shinhan Financial Group Co. Ltd. KRW 8,424 202,005 0.07 SK Holdings Co. Ltd. KRW 56 10,069 0.00 SK Hynix, Inc. KRW 3,244 287,330 0.10 SK Innovation Co. Ltd. KRW 77 10,932 0.00 SK Telecom Co. Ltd. KRW 16 2,851 0.00
4,444,930 1.54
spainAena SME SA, Reg. S EUR 449 63,848 0.02 Amadeus IT Group SA ‘A’ EUR 2,783 165,756 0.06 Banco Bilbao Vizcaya Argentaria SA EUR 31,483 127,034 0.05 CaixaBank SA EUR 20,083 42,194 0.02 Iberdrola SA EUR 5,719 66,912 0.02 Industria de Diseno Textil SA EUR 12,197 317,610 0.11 Red Electrica Corp. SA EUR 9,173 153,877 0.05 Telefonica SA EUR 12,119 39,326 0.01
976,557 0.34
swedenAssa Abloy AB ‘B’ SEK 3,188 63,774 0.02 Atlas Copco AB ‘A’ SEK 1,537 64,571 0.02 Boliden AB SEK 5,403 155,799 0.06 Hennes & Mauritz AB ‘B’ SEK 3,738 64,044 0.02 Hexagon AB ‘B’ SEK 1,588 118,063 0.04 Husqvarna AB ‘B’ SEK 5,748 60,738 0.02 ICA Gruppen AB SEK 9,143 373,354 0.13 Investor AB ‘B’ SEK 944 55,982 0.02 Kinnevik AB ‘B’ SEK 2,442 100,498 0.04 SKF AB ‘B’ SEK 5,434 114,902 0.04 Svenska Cellulosa AB SCA ‘B’ SEK 5,570 79,274 0.03 Svenska Handelsbanken AB ‘A’ SEK 7,535 61,890 0.02 Swedbank AB ‘A’ SEK 3,931 56,147 0.02 Telefonaktiebolaget LM Ericsson ‘B’ SEK 9,400 91,269 0.03 Telia Co. AB SEK 23,615 80,099 0.03 Volvo AB ‘B’ SEK 1,952 37,497 0.01
1,577,901 0.55
schEDUlE of InVEsTmEnTsAs at 31 December 2020
Investments Currency
Quantity/ Nominal
Value
Market Value EUR
% of Net Assets
Transferable securities and money market instruments admitted to official exchange listing or dealt in on another regulated market
Equities (continued)
switzerlandABB Ltd. CHF 2,850 64,942 0.02 Cie Financiere Richemont SA CHF 2,495 182,478 0.06 Givaudan SA CHF 3 10,270 0.00 Julius Baer Group Ltd. CHF 1,650 78,145 0.03 Kuehne + Nagel International AG CHF 280 51,748 0.02 Novartis AG CHF 6,983 534,928 0.19 Roche Holding AG CHF 1,289 368,139 0.13 SGS SA CHF 52 128,033 0.04 Swiss Re AG CHF 1,526 116,838 0.04 Swisscom AG CHF 280 122,868 0.04 UBS Group AG CHF 12,461 143,182 0.05 Zurich Insurance Group AG CHF 297 102,134 0.04
1,903,705 0.66
TaiwanAccton Technology Corp. TWD 2,000 18,318 0.01 Acer, Inc. TWD 144,000 98,709 0.03 Catcher Technology Co. Ltd. TWD 12,000 71,649 0.02 Cathay Financial Holding Co. Ltd. TWD 390,000 477,587 0.17 Cheng Shin Rubber Industry Co. Ltd. TWD 7,000 8,937 0.00 China Steel Corp. TWD 177,000 126,972 0.04 Chunghwa Telecom Co. Ltd. TWD 253,000 799,297 0.28 CTBC Financial Holding Co. Ltd. TWD 62,000 35,401 0.01 Delta Electronics, Inc. TWD 80,000 609,828 0.21 Eclat Textile Co. Ltd. TWD 7,000 85,721 0.03 Eva Airways Corp. TWD 89,000 33,922 0.01 Evergreen Marine Corp. Taiwan Ltd. TWD 15,000 17,695 0.01 Far Eastern New Century Corp. TWD 44,000 36,920 0.01 First Financial Holding Co. Ltd. TWD 480,850 297,556 0.10 Globalwafers Co. Ltd. TWD 7,000 143,646 0.05 Hon Hai Precision Industry Co. Ltd. TWD 17,896 47,720 0.02 Hotai Motor Co. Ltd. TWD 12,000 223,642 0.08 Inventec Corp. TWD 113,000 78,605 0.03 MediaTek, Inc. TWD 1,000 21,651 0.01 Nan Ya Plastics Corp. TWD 102,000 212,564 0.07 Nanya Technology Corp. TWD 25,000 62,896 0.02 Nien Made Enterprise Co. Ltd. TWD 3,000 28,347 0.01 Pou Chen Corp. TWD 37,000 33,674 0.01 President Chain Store Corp. TWD 51,000 393,939 0.14 Ruentex Development Co. Ltd. TWD 15,000 17,782 0.01 Synnex Technology International Corp. TWD 10,000 13,623 0.00 Taishin Financial Holding Co. Ltd. TWD 684,000 262,684 0.09 Taiwan Cement Corp. TWD 5,000 6,261 0.00 Taiwan High Speed Rail Corp. TWD 3,000 2,756 0.00 Taiwan Semiconductor Manufacturing Co. Ltd. TWD 90,000 1,382,546 0.48 United Microelectronics Corp. TWD 64,000 87,463 0.03 Win Semiconductors Corp. TWD 13,000 130,371 0.05 Wiwynn Corp. TWD 6,000 122,429 0.04 Yageo Corp. TWD 3,000 45,041 0.02
6,036,152 2.09
ThailandAirports of Thailand PCL THB 4,200 7,111 0.00 B Grimm Power PCL THB 21,200 27,966 0.01 Bangkok Dusit Medical Services PCL ‘F’ THB 501,200 283,545 0.10 BTS Group Holdings PCL THB 52,900 13,381 0.00 CP ALL PCL THB 16,700 26,458 0.01 Home Product Center PCL THB 531,400 198,012 0.07 Land & Houses PCL THB 352,000 76,113 0.03 Minor International PCL THB 35,500 24,863 0.01 PTT Exploration & Production PCL THB 21,700 57,988 0.02 PTT PCL THB 229,200 264,491 0.09
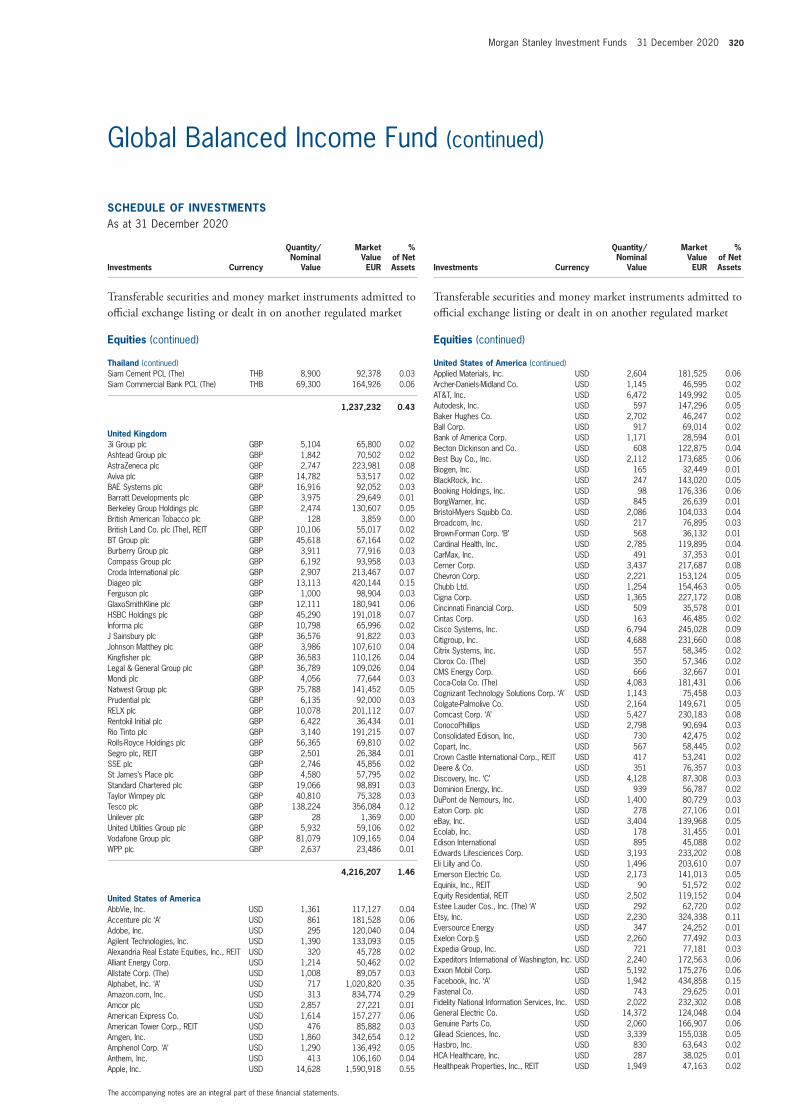
Morgan Stanley Investment Funds 31 December 2020 320
The accompanying notes are an integral part of these financial statements.
Global Balanced Income Fund (continued)
schEDUlE of InVEsTmEnTsAs at 31 December 2020
Investments Currency
Quantity/ Nominal
Value
Market Value EUR
% of Net Assets
Transferable securities and money market instruments admitted to official exchange listing or dealt in on another regulated market
Equities (continued)
Thailand (continued)Siam Cement PCL (The) THB 8,900 92,378 0.03 Siam Commercial Bank PCL (The) THB 69,300 164,926 0.06
1,237,232 0.43
United Kingdom3i Group plc GBP 5,104 65,800 0.02 Ashtead Group plc GBP 1,842 70,502 0.02 AstraZeneca plc GBP 2,747 223,981 0.08 Aviva plc GBP 14,782 53,517 0.02 BAE Systems plc GBP 16,916 92,052 0.03 Barratt Developments plc GBP 3,975 29,649 0.01 Berkeley Group Holdings plc GBP 2,474 130,607 0.05 British American Tobacco plc GBP 128 3,859 0.00 British Land Co. plc (The), REIT GBP 10,106 55,017 0.02 BT Group plc GBP 45,618 67,164 0.02 Burberry Group plc GBP 3,911 77,916 0.03 Compass Group plc GBP 6,192 93,958 0.03 Croda International plc GBP 2,907 213,467 0.07 Diageo plc GBP 13,113 420,144 0.15 Ferguson plc GBP 1,000 98,904 0.03 GlaxoSmithKline plc GBP 12,111 180,941 0.06 HSBC Holdings plc GBP 45,290 191,018 0.07 Informa plc GBP 10,798 65,996 0.02 J Sainsbury plc GBP 36,576 91,822 0.03 Johnson Matthey plc GBP 3,986 107,610 0.04 Kingfisher plc GBP 36,583 110,126 0.04 Legal & General Group plc GBP 36,789 109,026 0.04 Mondi plc GBP 4,056 77,644 0.03 Natwest Group plc GBP 75,788 141,452 0.05 Prudential plc GBP 6,135 92,000 0.03 RELX plc GBP 10,078 201,112 0.07 Rentokil Initial plc GBP 6,422 36,434 0.01 Rio Tinto plc GBP 3,140 191,215 0.07 Rolls-Royce Holdings plc GBP 56,365 69,810 0.02 Segro plc, REIT GBP 2,501 26,384 0.01 SSE plc GBP 2,746 45,856 0.02 St James’s Place plc GBP 4,580 57,795 0.02 Standard Chartered plc GBP 19,066 98,891 0.03 Taylor Wimpey plc GBP 40,810 75,328 0.03 Tesco plc GBP 138,224 356,084 0.12 Unilever plc GBP 28 1,369 0.00 United Utilities Group plc GBP 5,932 59,106 0.02 Vodafone Group plc GBP 81,079 109,165 0.04 WPP plc GBP 2,637 23,486 0.01
4,216,207 1.46
United states of americaAbbVie, Inc. USD 1,361 117,127 0.04 Accenture plc ‘A’ USD 861 181,528 0.06 Adobe, Inc. USD 295 120,040 0.04 Agilent Technologies, Inc. USD 1,390 133,093 0.05 Alexandria Real Estate Equities, Inc., REIT USD 320 45,728 0.02 Alliant Energy Corp. USD 1,214 50,462 0.02 Allstate Corp. (The) USD 1,008 89,057 0.03 Alphabet, Inc. ‘A’ USD 717 1,020,820 0.35 Amazon.com, Inc. USD 313 834,774 0.29 Amcor plc USD 2,857 27,221 0.01 American Express Co. USD 1,614 157,277 0.06 American Tower Corp., REIT USD 476 85,882 0.03 Amgen, Inc. USD 1,860 342,654 0.12 Amphenol Corp. ‘A’ USD 1,290 136,492 0.05 Anthem, Inc. USD 413 106,160 0.04 Apple, Inc. USD 14,628 1,590,918 0.55
schEDUlE of InVEsTmEnTsAs at 31 December 2020
Investments Currency
Quantity/ Nominal
Value
Market Value EUR
% of Net Assets
Transferable securities and money market instruments admitted to official exchange listing or dealt in on another regulated market
Equities (continued)
United states of america (continued)Applied Materials, Inc. USD 2,604 181,525 0.06 Archer-Daniels-Midland Co. USD 1,145 46,595 0.02 AT&T, Inc. USD 6,472 149,992 0.05 Autodesk, Inc. USD 597 147,296 0.05 Baker Hughes Co. USD 2,702 46,247 0.02 Ball Corp. USD 917 69,014 0.02 Bank of America Corp. USD 1,171 28,594 0.01 Becton Dickinson and Co. USD 608 122,875 0.04 Best Buy Co., Inc. USD 2,112 173,685 0.06 Biogen, Inc. USD 165 32,449 0.01 BlackRock, Inc. USD 247 143,020 0.05 Booking Holdings, Inc. USD 98 176,336 0.06 BorgWarner, Inc. USD 845 26,639 0.01 Bristol-Myers Squibb Co. USD 2,086 104,033 0.04 Broadcom, Inc. USD 217 76,895 0.03 Brown-Forman Corp. ‘B’ USD 568 36,132 0.01 Cardinal Health, Inc. USD 2,785 119,895 0.04 CarMax, Inc. USD 491 37,353 0.01 Cerner Corp. USD 3,437 217,687 0.08 Chevron Corp. USD 2,221 153,124 0.05 Chubb Ltd. USD 1,254 154,463 0.05 Cigna Corp. USD 1,365 227,172 0.08 Cincinnati Financial Corp. USD 509 35,578 0.01 Cintas Corp. USD 163 46,485 0.02 Cisco Systems, Inc. USD 6,794 245,028 0.09 Citigroup, Inc. USD 4,688 231,660 0.08 Citrix Systems, Inc. USD 557 58,345 0.02 Clorox Co. (The) USD 350 57,346 0.02 CMS Energy Corp. USD 666 32,667 0.01 Coca-Cola Co. (The) USD 4,083 181,431 0.06 Cognizant Technology Solutions Corp. ‘A’ USD 1,143 75,458 0.03 Colgate-Palmolive Co. USD 2,164 149,671 0.05 Comcast Corp. ‘A’ USD 5,427 230,183 0.08 ConocoPhillips USD 2,798 90,694 0.03 Consolidated Edison, Inc. USD 730 42,475 0.02 Copart, Inc. USD 567 58,445 0.02 Crown Castle International Corp., REIT USD 417 53,241 0.02 Deere & Co. USD 351 76,357 0.03 Discovery, Inc. ‘C’ USD 4,128 87,308 0.03 Dominion Energy, Inc. USD 939 56,787 0.02 DuPont de Nemours, Inc. USD 1,400 80,729 0.03 Eaton Corp. plc USD 278 27,106 0.01 eBay, Inc. USD 3,404 139,968 0.05 Ecolab, Inc. USD 178 31,455 0.01 Edison International USD 895 45,088 0.02 Edwards Lifesciences Corp. USD 3,193 233,202 0.08 Eli Lilly and Co. USD 1,496 203,610 0.07 Emerson Electric Co. USD 2,173 141,013 0.05 Equinix, Inc., REIT USD 90 51,572 0.02 Equity Residential, REIT USD 2,502 119,152 0.04 Estee Lauder Cos., Inc. (The) ‘A’ USD 292 62,720 0.02 Etsy, Inc. USD 2,230 324,338 0.11 Eversource Energy USD 347 24,252 0.01 Exelon Corp.§ USD 2,260 77,492 0.03 Expedia Group, Inc. USD 721 77,181 0.03 Expeditors International of Washington, Inc. USD 2,240 172,563 0.06 Exxon Mobil Corp. USD 5,192 175,276 0.06 Facebook, Inc. ‘A’ USD 1,942 434,858 0.15 Fastenal Co. USD 743 29,625 0.01 Fidelity National Information Services, Inc. USD 2,022 232,302 0.08 General Electric Co. USD 14,372 124,048 0.04 Genuine Parts Co. USD 2,060 166,907 0.06 Gilead Sciences, Inc. USD 3,339 155,038 0.05 Hasbro, Inc. USD 830 63,643 0.02 HCA Healthcare, Inc. USD 287 38,025 0.01 Healthpeak Properties, Inc., REIT USD 1,949 47,163 0.02

321 Morgan Stanley Investment Funds 31 December 2020
The accompanying notes are an integral part of these financial statements.
Global Balanced Income Fund (continued)
schEDUlE of InVEsTmEnTsAs at 31 December 2020
Investments Currency
Quantity/ Nominal
Value
Market Value EUR
% of Net Assets
Transferable securities and money market instruments admitted to official exchange listing or dealt in on another regulated market
Equities (continued)
United states of america (continued)Henry Schein, Inc. USD 4,233 228,152 0.08 Hess Corp. USD 1,468 63,365 0.02 Hologic, Inc. USD 954 55,439 0.02 Home Depot, Inc. (The) USD 2,580 556,504 0.19 Honeywell International, Inc. USD 1,126 193,311 0.07 Host Hotels & Resorts, Inc., REIT USD 3,098 36,511 0.01 HP, Inc. USD 4,492 88,819 0.03 Humana, Inc. USD 338 112,121 0.04 IDEXX Laboratories, Inc. USD 269 108,528 0.04 IHS Markit Ltd. USD 1,764 127,900 0.04 Intel Corp. USD 6,323 251,902 0.09 International Business Machines Corp. USD 2,154 217,956 0.08 International Flavors & Fragrances, Inc.§ USD 647 57,750 0.02 Intuit, Inc. USD 708 218,458 0.08 Invesco Ltd. USD 3,892 54,592 0.02 Jacobs Engineering Group, Inc. USD 631 55,260 0.02 Johnson & Johnson USD 1,772 225,519 0.08 Johnson Controls International plc USD 3,319 124,868 0.04 Kellogg Co. USD 3,455 173,997 0.06 Kimberly-Clark Corp. USD 554 60,582 0.02 KLA Corp. USD 365 76,451 0.03 L3Harris Technologies, Inc. USD 573 87,715 0.03 Lockheed Martin Corp. USD 397 114,679 0.04 Lowe’s Cos., Inc. USD 879 114,562 0.04 Marsh & McLennan Cos., Inc. USD 4,048 381,164 0.13 Mastercard, Inc. ‘A’ USD 1,100 321,293 0.11 McDonald’s Corp. USD 56 9,671 0.00 Merck & Co., Inc. USD 2,398 157,705 0.06 Mettler-Toledo International, Inc. USD 80 73,706 0.03 Microsoft Corp. USD 8,126 1,466,990 0.51 Netflix, Inc. USD 479 210,388 0.07 Newmont Corp. USD 668 32,416 0.01 NextEra Energy, Inc. USD 2,054 127,599 0.04 Nielsen Holdings plc USD 3,255 54,889 0.02 Northern Trust Corp. USD 1,330 99,609 0.04 NVIDIA Corp. USD 435 184,904 0.06 Omnicom Group, Inc. USD 723 36,670 0.01 ONEOK, Inc. USD 1,249 38,408 0.01 Oracle Corp. USD 3,248 170,085 0.06 PayPal Holdings, Inc. USD 1,298 244,326 0.09 PepsiCo, Inc. USD 4,496 539,803 0.19 PNC Financial Services Group, Inc. (The) USD 2,971 355,036 0.12 PPG Industries, Inc. USD 1,752 203,368 0.07 Procter & Gamble Co. (The) USD 1,921 216,237 0.08 Prologis, Inc., REIT USD 1,178 94,571 0.03 Prudential Financial, Inc. USD 402 25,350 0.01 Public Service Enterprise Group, Inc. USD 1,363 63,843 0.02 QUALCOMM, Inc. USD 1,248 153,938 0.05 Quanta Services, Inc.§ USD 1,279 74,273 0.03 Raytheon Technologies Corp. USD 2,480 144,118 0.05 Regency Centers Corp., REIT USD 1,307 47,990 0.02 Robert Half International, Inc. USD 2,213 112,170 0.04 S&P Global, Inc. USD 2 530 0.00 salesforce.com, Inc. USD 1,175 211,817 0.07 SBA Communications Corp., REIT ‘A’ USD 147 33,084 0.01 Schlumberger Ltd. USD 2,102 37,211 0.01 Sherwin-Williams Co. (The) USD 226 133,505 0.05 Skyworks Solutions, Inc. USD 436 54,281 0.02 Southern Co. (The) USD 2,057 101,983 0.04 Southwest Airlines Co. USD 1,100 41,223 0.01 State Street Corp. USD 3,860 225,508 0.08 SVB Financial Group USD 316 98,014 0.03 Synchrony Financial USD 5,519 154,108 0.05 Synopsys, Inc. USD 701 147,737 0.05 Sysco Corp. USD 1,529 90,872 0.03
schEDUlE of InVEsTmEnTsAs at 31 December 2020
Investments Currency
Quantity/ Nominal
Value
Market Value EUR
% of Net Assets
Transferable securities and money market instruments admitted to official exchange listing or dealt in on another regulated market
Equities (continued)
United states of america (continued)T Rowe Price Group, Inc. USD 566 68,869 0.02 Teledyne Technologies, Inc. USD 201 63,958 0.02 Texas Instruments, Inc. USD 1,644 217,670 0.08 Textron, Inc. USD 1,052 41,190 0.01 Thermo Fisher Scientific, Inc. USD 261 98,194 0.03 Tiffany & Co. USD 375 40,167 0.01 TJX Cos., Inc. (The) USD 1,300 72,558 0.03 T-Mobile US, Inc. USD 350 38,131 0.01 Travelers Cos., Inc. (The) USD 2,519 284,903 0.10 Ulta Beauty, Inc. USD 274 62,990 0.02 United Parcel Service, Inc. ‘B’ USD 157 21,263 0.01 United Rentals, Inc. USD 375 70,330 0.02 Verisk Analytics, Inc. USD 202 33,940 0.01 Verizon Communications, Inc. USD 5,887 279,394 0.10 Vertex Pharmaceuticals, Inc. USD 855 160,549 0.06 Visa, Inc. ‘A’ USD 2,166 386,898 0.13 Walgreens Boots Alliance, Inc. USD 3,782 121,326 0.04 Walt Disney Co. (The) USD 2,032 301,511 0.10 Willis Towers Watson plc USD 405 68,490 0.02 WW Grainger, Inc. USD 285 93,560 0.03 Xcel Energy, Inc. USD 1,065 57,219 0.02 Xilinx, Inc. USD 904 103,460 0.04 Zions Bancorp NA USD 2,015 70,602 0.02 Zoetis, Inc. USD 1,469 195,816 0.07
25,926,061 8.99
Total Equities 88,240,258 30.59
Total Transferable securities and money market instruments admitted to official exchange listing or dealt in on another regulated market 232,196,764 80.49
Other transferable securities and money market instruments not admitted to official exchange listing or dealt in on another regulated market
Equities
chinaChina Common Rich Renewable Energy
Investments Ltd.* HKD 18,000 0 0.00
0 0.00
spainTelefonica SA Rights 28/12/2020* EUR 12,119 2,202 0.00
2,202 0.00
Total Equities 2,202 0.00
Total other transferable securities and money market instruments not admitted to official exchange listing or dealt in on another regulated market 2,202 0.00

Morgan Stanley Investment Funds 31 December 2020 322
The accompanying notes are an integral part of these financial statements.
Global Balanced Income Fund (continued)
schEDUlE of InVEsTmEnTsAs at 31 December 2020
Investments Currency
Quantity/ Nominal
Value
Market Value EUR
% of Net Assets
Units of authorised UCITS or other collective investment undertakings
collective Investment schemes – UcITs
luxembourgMorgan Stanley Investment Funds
Emerging Markets Corporate Debt Fund – Class N† USD 256,702 5,779,685 2.00
Morgan Stanley Investment Funds Global Infrastructure Fund – Class Z† EUR 7,876 442,527 0.15
Morgan Stanley Investment Funds Global Infrastructure Fund – Class Z† USD 18,032 1,013,220 0.35
7,235,432 2.50
Total collective Investment schemes – UcITs 7,235,432 2.50
Exchange Traded funds
franceAmundi Index Solutions Msci EM Latin
America UCITS ETF – Eur Class A EUR 382,805 4,436,327 1.54
4,436,327 1.54
GermanyXtrackers MSCI World Financials
UCITS ETF EUR 129,642 2,110,413 0.73
2,110,413 0.73
ItalyiShares Global Clean Energy UCITS ETF EUR 513,338 6,762,167 2.34 iShares J.P. Morgan EM Local Government
Bond Fund – USD (Dist) EUR 89,062 4,385,424 1.52
11,147,591 3.86
United KingdomInvesco Physical Gold ETC USD 29,327 4,384,924 1.52 iShares MSCI China A UCITS ETF USD 604,075 3,094,374 1.08 WisdomTree Industrial Metals Enhanced
UCITS ETF USD 130,000 2,919,580 1.01
10,398,878 3.61
Total Exchange Traded funds 28,093,209 9.74
Total Units of authorised UcITs or other collective investment undertakings 35,328,641 12.24
Total Investments 267,527,607 92.73
cash 17,796,769 6.17
other assets/(liabilities) 3,162,370 1.10
Total net assets 288,486,746 100.00
* Security is valued at its fair value under the direction of the Board of Directors.† Managed by an affiliate of the Investment Adviser.The country disclosed within the Schedule of Investments refers to the country of risk. The country of incorporation may differ.
option Written contracts
Quantity security Description currency counterparty
Global Exposure
UsD
market Value EUR
% of net assets
(370) EURO STOXX 50 Index, Put, 3,550.000, 15/01/2021 EUR Goldman Sachs 5,849,422 (191,290) (0.06)
(60) Nikkei 225 Index, Put, 26,375.000, 08/01/2021 JPY Goldman Sachs (13,023,759) (20,406) (0.01)
(50) S&P 500 Emini Index, Put, 3,690.000, 08/01/2021 USD Goldman Sachs (7,638,414) (60,109) (0.02)
Total market Value on option Written contracts – liabilities (271,805) (0.09)
financial futures contracts
security Descriptionnumber
of contracts currency
Global Exposure
EUR
Unrealised Gain/(loss)
EUR
% of net assets
DAX Index, 19/03/2021 9 EUR 3,092,850 110,813 0.04 Euro-Bobl, 08/03/2021 (22) EUR (2,973,960) 2,420 0.00EURO STOXX 50 Index, 19/03/2021 116 EUR 4,118,000 9,666 0.00Russell 2000 Emini Index, 19/03/2021 36 USD 2,876,473 74,013 0.02 S&P 500 Emini Index, 19/03/2021 82 USD 12,436,774 166,662 0.06
Total Unrealised Gain on financial futures contracts 363,574 0.12
MSCI Emerging Markets Index, 19/03/2021 (322) USD (16,889,425) (426,786) (0.15) Yen Denominated Nikkei 225 Index, 11/03/2021 26 JPY 2,823,442 (9,856) 0.00
Total Unrealised loss on financial futures contracts (436,642) (0.15)
net Unrealised loss on financial futures contracts (73,068) (0.03)
forward currency Exchange contracts (continued)
currency Purchased
amount Purchased
currency sold
amount sold
maturity Date counterparty
Unrealised Gain/(loss)
EUR
% of net assets
CHF 3,220,000 EUR 2,980,557 25/01/2021 RBC 442 0.00EUR 372,907 GBP 335,000 25/01/2021 J.P. Morgan 82 0.00EUR 483,091 JPY 60,000,000 25/01/2021 Commonwealth
Bank of Australia 8,650 0.00EUR 4,514,440 JPY 560,000,000 25/01/2021 RBC 86,325 0.03 EUR 2,350,082 USD 2,870,000 25/01/2021 Commonwealth
Bank of Australia 12,100 0.01 EUR 29,361,258 USD 34,930,000 25/01/2021 J.P. Morgan 906,306 0.31 EUR 292,815 USD 355,000 25/01/2021 UBS 3,622 0.00EUR 2,579,799 USD 3,105,000 25/01/2021 Westpac Banking 50,379 0.02
Unrealised Gain on forward currency Exchange contracts – assets 1,067,906 0.37
aUD hedged share classAUD 333,770 EUR 207,464 08/01/2021 J.P. Morgan 2,829 0.00
Unrealised Gain on naV hedged share classes forward currency Exchange contracts – assets 2,829 0.00
GBP hedged share classGBP 103,994 EUR 114,836 08/01/2021 J.P. Morgan 933 0.00
Unrealised Gain on naV hedged share classes forward currency Exchange contracts – assets 933 0.00
DERIVaTIVEs
Over-the-counter (OTC) and exchange traded derivatives as at 31 December 2020, expressed in Euro.

323 Morgan Stanley Investment Funds 31 December 2020
The accompanying notes are an integral part of these financial statements.
Global Balanced Income Fund (continued)
Collateral received and paid by the Fund in respect of financial derivative instruments:
Type of collateral counterparty currency amount received amount paid
Global Balanced Income fund
Cash Barclays EUR 280,000 –Goldman Sachs EUR 3,897,839 –
4,177,839 –
forward currency Exchange contracts (continued)
currency Purchased
amount Purchased
currency sold
amount sold
maturity Date counterparty
Unrealised Gain/(loss)
EUR
% of net assets
UsD hedged share classEUR 10,813 USD 13,265 04/01/2021 J.P. Morgan 1 0.00USD 51,638 EUR 41,994 05/01/2021 J.P. Morgan 93 0.00EUR 45,126 USD 55,330 08/01/2021 J.P. Morgan 33 0.00USD 10,000 EUR 8,132 08/01/2021 J.P. Morgan 18 0.00
Unrealised Gain on naV hedged share classes forward currency Exchange contracts – assets 145 0.00
Total Unrealised Gain on forward currency Exchange contracts – assets 1,071,813 0.37
EUR 896,164 GBP 810,000 25/01/2021 J.P. Morgan (5,292) 0.00GBP 1,115,000 EUR 1,248,936 25/01/2021 Westpac Banking (8,042) 0.00JPY 265,000,000 EUR 2,097,965 25/01/2021 J.P. Morgan (2,518) 0.00USD 680,000 EUR 558,271 25/01/2021 J.P. Morgan (4,324) 0.00
Unrealised loss on forward currency Exchange contracts – liabilities (20,176) 0.00
aUD hedged share classEUR 6,715 AUD 10,834 08/01/2021 J.P. Morgan (111) 0.00
UsD hedged share classUSD 10,131 EUR 8,258 04/01/2021 J.P. Morgan (1) 0.00EUR 8,132 USD 10,000 05/01/2021 J.P. Morgan (18) 0.00EUR 41,991 USD 51,638 08/01/2021 J.P. Morgan (93) 0.00USD 36,772,784 EUR 30,221,095 08/01/2021 J.P. Morgan (252,356) (0.09)
Unrealised loss on naV hedged share classes forward currency Exchange contracts – liabilities (252,579) (0.09)
Total Unrealised loss on forward currency Exchange contracts – liabilities (272,755) (0.09)
net Unrealised Gain on forward currency Exchange contracts – assets 799,058 0.28
credit Default swap contracts
nominal amount ccy counterparty
Reference Entity
Buy/ sell
Interest (Paid)/
Received Rate
maturity Date
market Value EUR
% of net assets
9,000,000 USD Barclays CDX.NA.EM. 31-V2 Sell 1.00% 20/06/2024 41,767 0.01 1,200,000 USD Goldman Sachs CDX.NA.EM. 31-V2 Sell 1.00% 20/06/2024 5,569 0.00 1,925,000 USD BNP Paribas CDX.NA.HY. 30-V14 Sell 5.00% 20/06/2023 95,642 0.03 1,300,000 USD Goldman Sachs CDX.NA.HY. 31-V14 Sell 5.00% 20/12/2023 72,897 0.03 7,900,000 USD Goldman Sachs CDX.NA.HY. 33-V12 Sell 5.00% 20/12/2024 532,114 0.18 6,250,000 USD Goldman Sachs CDX.NA.HY. 35-V1 Sell 5.00% 20/12/2025 474,864 0.17
26,500,000 USD Goldman Sachs CDX.NA.IG. 33-V1 Sell 1.00% 20/12/2024 352,604 0.12 1,800,000 USD Goldman Sachs CDX.NA.IG. 35-V1 Sell 1.00% 20/12/2025 35,517 0.01 5,850,000 EUR Barclays ITRAXX.EUROPE.
CROSSOVER. 28-V9 Sell 5.00% 20/12/2022 365,561 0.13 2,800,000 EUR Goldman Sachs ITRAXX.EUROPE.
CROSSOVER. 33-V4 Sell 5.00% 20/06/2025 313,040 0.11
Total market Value on credit Default swap contracts – assets 2,289,575 0.79
3,250,000 USD Barclays CDX.NA.EM. 33-V2 Sell 1.00% 20/06/2025 (4,432) 0.00
Total market Value on credit Default swap contracts – liabilities (4,432) 0.00
net market Value on credit Default swap contracts – assets 2,285,143 0.79
DERIVaTIVEs (continued)
Over-the-counter (OTC) and exchange traded derivatives as at 31 December 2020, expressed in Euro.
DERIVaTIVEs (continued)

Morgan Stanley Investment Funds 31 December 2020 324
The accompanying notes are an integral part of these financial statements.
Please refer to the full prospectus for the Fund’s investment objective and policy.
InVEsTmEnT aIm
To provide an attractive level of total return, measured in Euro, by investing primarily in undertakings for collective investments (including the Company’s Funds), ETFs, futures, investment funds managed by the investment adviser or its affiliates and other collective investment schemes.
schEDUlE of InVEsTmEnTsAs at 31 December 2020
Investments Currency
Quantity/ Nominal
Value
Market Value EUR
% of Net Assets
Units of authorised UCITS or other collective investment undertakings
collective Investment schemes – UcITs – Bond funds
luxembourgMorgan Stanley Investment Funds Emerging
Markets Corporate Debt Fund – Class N† USD 5,332,348 120,058,744 3.00 Morgan Stanley Investment Funds Euro
Bond Fund – Class N† EUR 6,946,529 179,756,723 4.49 Morgan Stanley Investment Funds Euro
Corporate Bond Fund – Class N† EUR 13,775,792 359,658,450 8.99 Morgan Stanley Investment Funds Euro
Strategic Bond Fund – Class N† EUR 6,768,470 178,359,285 4.46 Morgan Stanley Investment Funds European
High Yield Bond Fund – Class N† EUR 3,817,251 100,759,001 2.52 Morgan Stanley Investment Funds Global
Bond Fund – Class ZH (EUR)† EUR 12,492,761 361,790,355 9.05 Morgan Stanley Investment Funds Global
Fixed Income Opportunities – Class N† USD 7,855,260 173,366,089 4.34 Morgan Stanley Investment Funds Global
Fixed Income Opportunities Fund – Class N† EUR 271,853 5,999,797 0.15 Morgan Stanley Investment Funds Global
High Yield Bond Fund – Class N† USD 7,095,641 160,152,721 4.00 Morgan Stanley Investment Funds US
Dollar Corporate Bond Fund – Class Z† EUR 5,890,397 159,806,465 4.00
1,799,707,630 45.00
Total collective Investment schemes – UcITs – Bond funds 1,799,707,630 45.00
collective Investment schemes – UcITs – Equity funds
IrelandBaillie Gifford Worldwide Japanese Fund
– Class B EUR EUR 13,754,927 219,126,997 5.48 Wellington Strategic European Equity Fund
– EUR Class S Accumulating Unhedged EUR 4,268,840 121,569,316 3.04
340,696,313 8.52
luxembourgMFS Meridian European Research Fund
– Class I1EUR EUR 364,021 101,055,891 2.53 Morgan Stanley Investment Funds Asia
Opportunity Fund – Class N† USD 1,692,589 60,913,987 1.52 Morgan Stanley Investment Funds Emerging
Leaders Equity Fund – Class E† EUR 1,097,155 41,066,494 1.03 Morgan Stanley Investment Funds Europe
Opportunity Fund – Class N† EUR 1,544,303 42,144,018 1.05 Morgan Stanley Investment Funds Global
Infrastructure Fund – Class N† USD 937,623 20,343,375 0.51 Morgan Stanley Investment Funds US
Advantage Fund – Class NH (EUR)† EUR 5,928,383 251,126,309 6.28 Morgan Stanley Investment Funds US
Growth Fund – Class NH (EUR)† EUR 2,613,131 130,891,736 3.27 Schroder ISF China Fund – Class A
EUR Accumulation EUR 344,166 39,810,734 1.00 Schroder ISF Emerging Asia – Class A
EUR Accumulation EUR 1,274,489 60,159,336 1.50
747,511,880 18.69
Total collective Investment schemes – UcITs – Equity funds 1,088,208,193 27.21
Global Balanced Risk Control Fund of Funds
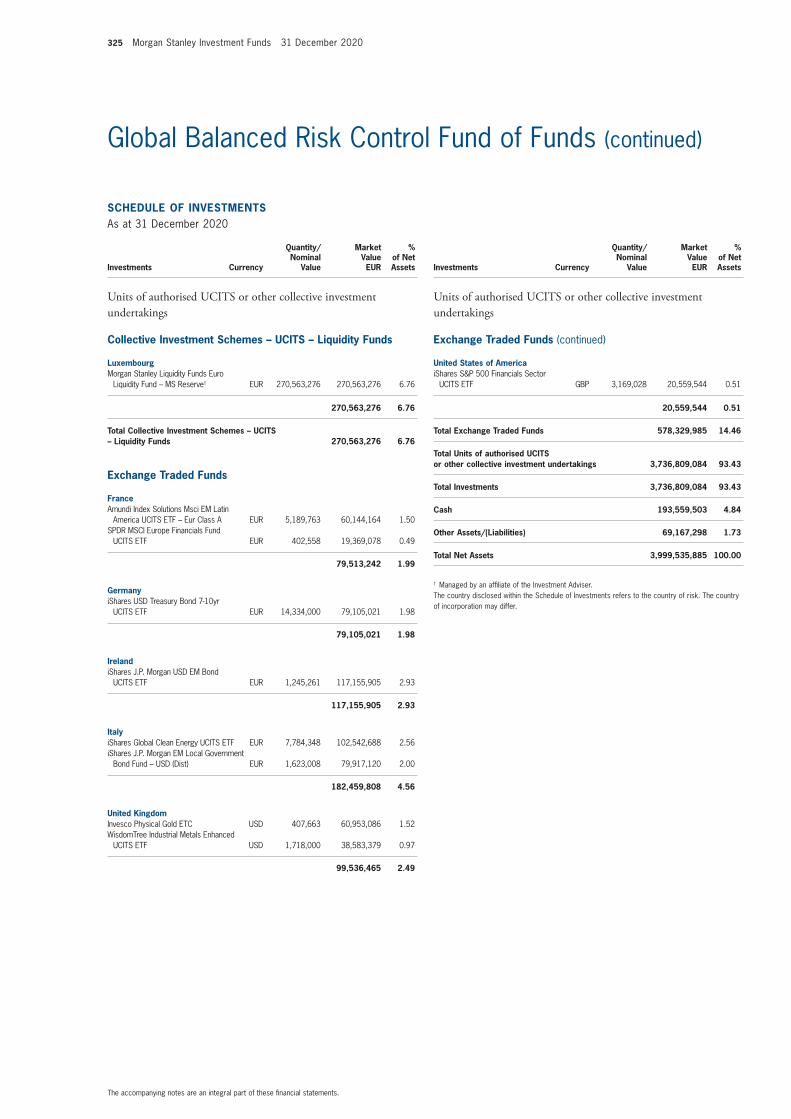
325 Morgan Stanley Investment Funds 31 December 2020
The accompanying notes are an integral part of these financial statements.
Global Balanced Risk Control Fund of Funds (continued)
schEDUlE of InVEsTmEnTsAs at 31 December 2020
Investments Currency
Quantity/ Nominal
Value
Market Value EUR
% of Net Assets
Units of authorised UCITS or other collective investment undertakings
collective Investment schemes – UcITs – liquidity funds
luxembourgMorgan Stanley Liquidity Funds Euro
Liquidity Fund – MS Reserve† EUR 270,563,276 270,563,276 6.76
270,563,276 6.76
Total collective Investment schemes – UcITs – liquidity funds 270,563,276 6.76
Exchange Traded funds
franceAmundi Index Solutions Msci EM Latin
America UCITS ETF – Eur Class A EUR 5,189,763 60,144,164 1.50 SPDR MSCI Europe Financials Fund
UCITS ETF EUR 402,558 19,369,078 0.49
79,513,242 1.99
GermanyiShares USD Treasury Bond 7-10yr
UCITS ETF EUR 14,334,000 79,105,021 1.98
79,105,021 1.98
IrelandiShares J.P. Morgan USD EM Bond
UCITS ETF EUR 1,245,261 117,155,905 2.93
117,155,905 2.93
ItalyiShares Global Clean Energy UCITS ETF EUR 7,784,348 102,542,688 2.56 iShares J.P. Morgan EM Local Government
Bond Fund – USD (Dist) EUR 1,623,008 79,917,120 2.00
182,459,808 4.56
United KingdomInvesco Physical Gold ETC USD 407,663 60,953,086 1.52 WisdomTree Industrial Metals Enhanced
UCITS ETF USD 1,718,000 38,583,379 0.97
99,536,465 2.49
schEDUlE of InVEsTmEnTsAs at 31 December 2020
Investments Currency
Quantity/ Nominal
Value
Market Value EUR
% of Net Assets
Units of authorised UCITS or other collective investment undertakings
Exchange Traded funds (continued)
United states of americaiShares S&P 500 Financials Sector
UCITS ETF GBP 3,169,028 20,559,544 0.51
20,559,544 0.51
Total Exchange Traded funds 578,329,985 14.46
Total Units of authorised UcITs or other collective investment undertakings 3,736,809,084 93.43
Total Investments 3,736,809,084 93.43
cash 193,559,503 4.84
other assets/(liabilities) 69,167,298 1.73
Total net assets 3,999,535,885 100.00
† Managed by an affiliate of the Investment Adviser.The country disclosed within the Schedule of Investments refers to the country of risk. The country of incorporation may differ.

Morgan Stanley Investment Funds 31 December 2020 326
The accompanying notes are an integral part of these financial statements.
Global Balanced Risk Control Fund of Funds (continued)
option Purchased contracts
Quantity security Description currency counterparty
market Value EUR
% of net assets
5,234 EURO STOXX 50 Index, Call, 3,450.000, 18/06/2021 EUR Goldman Sachs 11,352,546 0.28
6,120 EURO STOXX 50 Index, Put, 3,300.000, 19/03/2021 EUR Goldman Sachs 3,763,800 0.10
270 Nikkei 225 Index, Call, 24,000.000, 11/06/2021 JPY Goldman Sachs 7,986,756 0.20
776 S&P 500 Index, Call, 3,350.000, 18/06/2021 USD Goldman Sachs 29,662,739 0.74
771 S&P 500 Index, Call, 3,775.000, 17/09/2021 USD Goldman Sachs 13,416,182 0.34
805 S&P 500 Index, Put, 3,400.000, 19/03/2021 USD Goldman Sachs 3,667,620 0.09
Total market Value on option Purchased contracts – assets 69,849,643 1.75
financial futures contracts
security Descriptionnumber
of contracts currency
Global Exposure
EUR
Unrealised Gain/(loss)
EUR
% of net assets
DAX Index, 19/03/2021 119 EUR 40,894,350 1,465,187 0.04 EURO STOXX 50 Index, 19/03/2021 2,707 EUR 96,098,500 1,244,657 0.03 Russell 2000 Emini Index, 19/03/2021 497 USD 39,711,311 1,021,796 0.03 Yen Denominated Nikkei 225 Index, 11/03/2021 186 JPY 20,198,472 534,933 0.01
Total Unrealised Gain on financial futures contracts 4,266,573 0.11
net Unrealised Gain on financial futures contracts 4,266,573 0.11
forward currency Exchange contracts (continued)
currency Purchased
amount Purchased
currency sold
amount sold
maturity Date counterparty
Unrealised Gain/(loss)
EUR
% of net assets
USD 306 EUR 249 05/01/2021 J.P. Morgan 1 0.00
Unrealised Gain on forward currency Exchange contracts – assets 1 0.00
EUR hedged share classBRL 2,424,757 EUR 380,000 29/01/2021 J.P. Morgan 194 0.00
Unrealised Gain on naV hedged share classes forward currency Exchange contracts – assets 194 0.00
forward currency Exchange contracts (continued)
currency Purchased
amount Purchased
currency sold
amount sold
maturity Date counterparty
Unrealised Gain/(loss)
EUR
% of net assets
GBP hedged share classGBP 567,381 EUR 626,542 08/01/2021 J.P. Morgan 5,082 0.00
Unrealised Gain on naV hedged share classes forward currency Exchange contracts – assets 5,082 0.00
UsD hedged share classUSD 359,956 EUR 292,730 05/01/2021 J.P. Morgan 647 0.00EUR 1,245,500 USD 1,521,561 08/01/2021 J.P. Morgan 5,472 0.00USD 281,870 EUR 229,373 08/01/2021 J.P. Morgan 342 0.00
Unrealised Gain on naV hedged share classes forward currency Exchange contracts – assets 6,461 0.00
Total Unrealised Gain on forward currency Exchange contracts – assets 11,738 0.00
EUR hedged share classBRL 109,680,531 EUR 17,593,785 29/01/2021 J.P. Morgan (396,233) (0.01)
GBP hedged share classEUR 215 GBP 195 05/01/2021 J.P. Morgan (1) 0.00
UsD hedged share classUSD 7,506 EUR 6,118 04/01/2021 J.P. Morgan (1) 0.00EUR 292,704 USD 359,956 08/01/2021 J.P. Morgan (649) 0.00USD 280,702,684 EUR 230,756,890 08/01/2021 J.P. Morgan (1,992,450) (0.05) COP 2,019,768,437 EUR 484,334 29/01/2021 J.P. Morgan (2,477) 0.00
Unrealised loss on naV hedged share classes forward currency Exchange contracts – liabilities (2,391,811) (0.06)
Total Unrealised loss on forward currency Exchange contracts – liabilities (2,391,811) (0.06)
net Unrealised loss on forward currency Exchange contracts – liabilities (2,380,073) (0.06)
Collateral received and paid by the Fund in respect of financial derivative instruments:
Type of collateral counterparty currency amount received amount paid
Global Balanced Risk control fund of funds
Cash Goldman Sachs EUR – 597,414J.P. Morgan EUR 400,000 –
400,000 597,414
DERIVaTIVEs
Over-the-counter (OTC) and exchange traded derivatives as at 31 December 2020, expressed in Euro.
DERIVaTIVEs (continued)
Over-the-counter (OTC) and exchange traded derivatives as at 31 December 2020, expressed in Euro.

327 Morgan Stanley Investment Funds 31 December 2020
The accompanying notes are an integral part of these financial statements.
Please refer to the full prospectus for the Fund’s investment objective and policy.
Global Balanced Sustainable Fund
*Fund commenced operations on 30 June 2020.
InVEsTmEnT aIm
To provide an attractive level of total return, measured in Euro, by investing in a broad and balanced asset mix of both equity and Fixed Income Securities while incorporating environmental, social and corporate governance (ESG) considerations.
schEDUlE of InVEsTmEnTsAs at 31 December 2020
Investments Currency
Quantity/ Nominal
Value
Market Value EUR
% of Net Assets
Transferable securities and money market instruments admitted to official exchange listing or dealt in on another regulated market
Government Bonds
franceFrance Government Bond OAT, Reg. S
8.5% 25/04/2023 EUR 70,000 85,020 0.42 France Government Bond OAT, Reg. S 0%
25/03/2024 EUR 153,000 156,576 0.77 France Government Bond OAT, Reg. S
1.75% 25/11/2024 EUR 178,000 195,298 0.95 France Government Bond OAT, Reg. S
0.5% 25/05/2026 EUR 281,000 298,497 1.46 France Government Bond OAT, Reg. S
5.5% 25/04/2029 EUR 260,000 392,809 1.92 France Government Bond OAT, Reg. S
2.5% 25/05/2030 EUR 366,000 467,613 2.28
1,595,813 7.80
GermanyBundesobligation, Reg. S 0% 14/04/2023 EUR 121,000 123,113 0.60 Bundesobligation, Reg. S 0% 05/04/2024 EUR 156,000 159,987 0.78 Bundesrepublik Deutschland, Reg. S 0%
15/08/2026 EUR 386,000 402,416 1.97 Bundesrepublik Deutschland, Reg. S 5.5%
04/01/2031 EUR 278,000 453,531 2.21
1,139,047 5.56
ItalyItaly Buoni Poliennali Del Tesoro, Reg. S
0.45% 01/06/2021 EUR 93,000 93,367 0.45 Italy Buoni Poliennali Del Tesoro, Reg. S 1%
15/07/2022 EUR 129,000 131,903 0.64 Italy Buoni Poliennali Del Tesoro, Reg. S
1.75% 01/07/2024 EUR 162,000 173,230 0.85 Italy Buoni Poliennali Del Tesoro, Reg. S
1.35% 01/04/2030 EUR 298,000 322,627 1.58
721,127 3.52
JapanJapan Government Twenty Year Bond 2%
20/03/2027 JPY 8,300,000 74,230 0.36 Japan Government Twenty Year Bond 2.2%
20/03/2030 JPY 31,550,000 300,335 1.47 Japan Government Twenty Year Bond 1.7%
20/06/2033 JPY 57,200,000 539,714 2.64
914,279 4.47
spainSpain Government Bond 0.4%
30/04/2022 EUR 95,000 96,299 0.47 Spain Government Bond 0.45%
31/10/2022 EUR 116,000 118,211 0.58 Spain Government Bond, Reg. S, 144A
4.4% 31/10/2023 EUR 138,000 157,554 0.77 Spain Government Bond, Reg. S, 144A
3.8% 30/04/2024 EUR 151,000 173,045 0.84 Spain Government Bond, Reg. S, 144A
1.95% 30/04/2026 EUR 198,000 223,164 1.09 Spain Government Bond, Reg. S, 144A
1.95% 30/07/2030 EUR 364,000 431,921 2.11
1,200,194 5.86
*

Morgan Stanley Investment Funds 31 December 2020 328
The accompanying notes are an integral part of these financial statements.
Global Balanced Sustainable Fund (continued)
schEDUlE of InVEsTmEnTsAs at 31 December 2020
Investments Currency
Quantity/ Nominal
Value
Market Value EUR
% of Net Assets
Transferable securities and money market instruments admitted to official exchange listing or dealt in on another regulated market
Government Bonds (continued)
United KingdomUK Treasury, Reg. S 4.75% 07/12/2038 GBP 123,000 234,942 1.15 UK Treasury, Reg. S 4.25% 07/06/2032 GBP 10,000 16,074 0.08
251,016 1.23
United states of americaUS Treasury 1.75% 31/01/2023 USD 909,000 765,872 3.74 US Treasury 2.5% 15/05/2024 USD 510,000 447,996 2.19 US Treasury 2% 15/02/2025 USD 542,000 473,034 2.31 US Treasury 1.625% 15/05/2026 USD 744,000 645,541 3.15 US Treasury 5.5% 15/08/2028 USD 602,000 665,772 3.25 US Treasury 2.375% 15/05/2029 USD 150,000 138,096 0.68 US Treasury 6.25% 15/05/2030 USD 736,000 893,684 4.37
4,029,995 19.69
Total Government Bonds 9,851,471 48.13
Warrants
switzerlandCie Financiere Richemont SA 22/11/2023 CHF 264 56 0.00
56 0.00
Total Warrants 56 0.00
Equities
argentinaGlobant SA USD 18 3,164 0.02
3,164 0.02
austriaANDRITZ AG EUR 75 2,793 0.02 Erste Group Bank AG EUR 92 2,310 0.01 OMV AG EUR 461 14,986 0.07 Verbund AG EUR 118 8,196 0.04 voestalpine AG EUR 56 1,628 0.01
29,913 0.15
BelgiumKBC Group NV EUR 73 4,182 0.02 UCB SA EUR 106 8,955 0.04 Umicore SA EUR 29 1,139 0.01
14,276 0.07
BrazilAtacadao SA BRL 700 2,125 0.01 Banco Bradesco SA BRL 2,700 10,224 0.05 Banco Santander Brasil SA BRL 1,200 8,449 0.04 Klabin SA BRL 800 3,300 0.02
schEDUlE of InVEsTmEnTsAs at 31 December 2020
Investments Currency
Quantity/ Nominal
Value
Market Value EUR
% of Net Assets
Transferable securities and money market instruments admitted to official exchange listing or dealt in on another regulated market
Equities (continued)
Brazil (continued)Lojas Renner SA BRL 300 2,043 0.01 Magazine Luiza SA BRL 400 1,561 0.01 Natura & Co. Holding SA BRL 200 1,640 0.01 Via Varejo S/A BRL 1,200 3,029 0.01 WEG SA BRL 100 1,187 0.00
33,558 0.16
china3SBio, Inc., Reg. S HKD 1,500 1,115 0.00 51job, Inc., ADR USD 19 1,057 0.00 Agricultural Bank of China Ltd. ‘H’ HKD 33,000 9,851 0.05 Alibaba Group Holding Ltd., ADR USD 521 100,150 0.49 Baidu, Inc., ADR USD 65 11,498 0.06 Baozun, Inc., ADR USD 86 2,354 0.01 BYD Electronic International Co. Ltd. HKD 500 2,134 0.01 CGN Power Co. Ltd., Reg. S ‘H’ HKD 11,000 1,931 0.01 China Conch Venture Holdings Ltd. HKD 1,000 3,963 0.02 China Construction Bank Corp. ‘H’ HKD 19,000 11,763 0.06 China East Education Holdings Ltd., Reg. S HKD 1,000 1,959 0.01 China Everbright Bank Co. Ltd. ‘H’ HKD 11,000 3,411 0.02 China Gas Holdings Ltd. HKD 400 1,295 0.01 China Literature Ltd., Reg. S HKD 200 1,279 0.01 China Longyuan Power Group Corp. Ltd. ‘H’ HKD 4,000 3,267 0.02 China Medical System Holdings Ltd. HKD 2,000 1,821 0.01 China Mobile Ltd. HKD 1,000 4,646 0.02 China Molybdenum Co. Ltd. ‘H’ HKD 21,000 11,169 0.05 China Overseas Land & Investment Ltd. HKD 1,000 1,772 0.01 China Petroleum & Chemical Corp. ‘H’ HKD 16,000 5,836 0.03 China Railway Construction Corp. Ltd. ‘H’ HKD 1,500 669 0.00 China Railway Signal & Communication
Corp. Ltd., Reg. S ‘H’ HKD 16,000 4,373 0.02 China Vanke Co. Ltd. ‘H’ HKD 1,500 4,218 0.02 COSCO SHIPPING Energy Transportation
Co. Ltd. ‘H’ HKD 14,000 4,488 0.02 Dongfeng Motor Group Co. Ltd. ‘H’ HKD 16,000 15,204 0.07 ENN Energy Holdings Ltd. HKD 100 1,196 0.01 Fuyao Glass Industry Group Co. Ltd.,
Reg. S ‘H’ HKD 1,600 7,165 0.03 GDS Holdings Ltd., ADR USD 25 1,899 0.01 Geely Automobile Holdings Ltd. HKD 3,000 8,356 0.04 GOME Retail Holdings Ltd. HKD 27,000 2,639 0.01 Haitong Securities Co. Ltd. ‘H’ HKD 4,400 3,205 0.02 Huazhu Group Ltd., ADR USD 38 1,394 0.01 JD.com, Inc., ADR USD 116 8,313 0.04 Koolearn Technology Holding Ltd., Reg. S HKD 2,000 5,865 0.03 Li Ning Co. Ltd. HKD 500 2,801 0.01 Logan Group Co. Ltd. HKD 1,000 1,335 0.01 Luye Pharma Group Ltd., Reg. S HKD 2,500 949 0.00 Meituan Dianping, Reg. S ‘B’ HKD 600 18,580 0.09 NetEase, Inc., ADR USD 46 3,584 0.02 Ping An Healthcare and Technology Co. Ltd.,
Reg. S HKD 200 1,976 0.01 Ping An Insurance Group Co. of China Ltd. ‘H’ HKD 4,000 39,943 0.19 Semiconductor Manufacturing International
Corp. HKD 2,000 4,646 0.02 Shanghai Electric Group Co. Ltd. ‘H’ HKD 12,000 3,002 0.01 Shanghai Pharmaceuticals Holding Co. Ltd. ‘H’ HKD 6,700 9,620 0.05 Shenzhou International Group Holdings Ltd. HKD 500 7,989 0.04 Sinopharm Group Co. Ltd. ‘H’ HKD 800 1,586 0.01
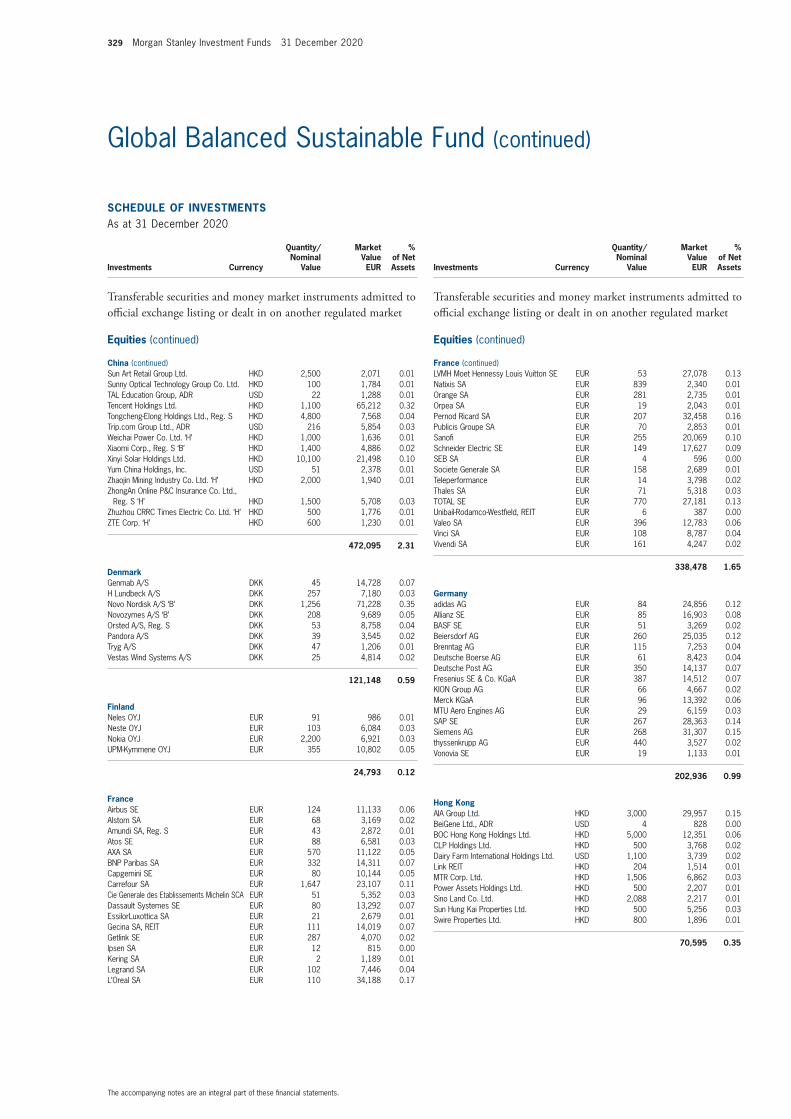
329 Morgan Stanley Investment Funds 31 December 2020
The accompanying notes are an integral part of these financial statements.
Global Balanced Sustainable Fund (continued)
schEDUlE of InVEsTmEnTsAs at 31 December 2020
Investments Currency
Quantity/ Nominal
Value
Market Value EUR
% of Net Assets
Transferable securities and money market instruments admitted to official exchange listing or dealt in on another regulated market
Equities (continued)
china (continued)Sun Art Retail Group Ltd. HKD 2,500 2,071 0.01 Sunny Optical Technology Group Co. Ltd. HKD 100 1,784 0.01 TAL Education Group, ADR USD 22 1,288 0.01 Tencent Holdings Ltd. HKD 1,100 65,212 0.32 Tongcheng-Elong Holdings Ltd., Reg. S HKD 4,800 7,568 0.04 Trip.com Group Ltd., ADR USD 216 5,854 0.03 Weichai Power Co. Ltd. ‘H’ HKD 1,000 1,636 0.01 Xiaomi Corp., Reg. S ‘B’ HKD 1,400 4,886 0.02 Xinyi Solar Holdings Ltd. HKD 10,100 21,498 0.10 Yum China Holdings, Inc. USD 51 2,378 0.01 Zhaojin Mining Industry Co. Ltd. ‘H’ HKD 2,000 1,940 0.01 ZhongAn Online P&C Insurance Co. Ltd.,
Reg. S ‘H’ HKD 1,500 5,708 0.03 Zhuzhou CRRC Times Electric Co. Ltd. ‘H’ HKD 500 1,776 0.01 ZTE Corp. ‘H’ HKD 600 1,230 0.01
472,095 2.31
DenmarkGenmab A/S DKK 45 14,728 0.07 H Lundbeck A/S DKK 257 7,180 0.03 Novo Nordisk A/S ‘B’ DKK 1,256 71,228 0.35 Novozymes A/S ‘B’ DKK 208 9,689 0.05 Orsted A/S, Reg. S DKK 53 8,758 0.04 Pandora A/S DKK 39 3,545 0.02 Tryg A/S DKK 47 1,206 0.01 Vestas Wind Systems A/S DKK 25 4,814 0.02
121,148 0.59
finlandNeles OYJ EUR 91 986 0.01 Neste OYJ EUR 103 6,084 0.03 Nokia OYJ EUR 2,200 6,921 0.03 UPM-Kymmene OYJ EUR 355 10,802 0.05
24,793 0.12
franceAirbus SE EUR 124 11,133 0.06 Alstom SA EUR 68 3,169 0.02 Amundi SA, Reg. S EUR 43 2,872 0.01 Atos SE EUR 88 6,581 0.03 AXA SA EUR 570 11,122 0.05 BNP Paribas SA EUR 332 14,311 0.07 Capgemini SE EUR 80 10,144 0.05 Carrefour SA EUR 1,647 23,107 0.11 Cie Generale des Etablissements Michelin SCA EUR 51 5,352 0.03 Dassault Systemes SE EUR 80 13,292 0.07 EssilorLuxottica SA EUR 21 2,679 0.01 Gecina SA, REIT EUR 111 14,019 0.07 Getlink SE EUR 287 4,070 0.02 Ipsen SA EUR 12 815 0.00 Kering SA EUR 2 1,189 0.01 Legrand SA EUR 102 7,446 0.04 L’Oreal SA EUR 110 34,188 0.17
schEDUlE of InVEsTmEnTsAs at 31 December 2020
Investments Currency
Quantity/ Nominal
Value
Market Value EUR
% of Net Assets
Transferable securities and money market instruments admitted to official exchange listing or dealt in on another regulated market
Equities (continued)
france (continued)LVMH Moet Hennessy Louis Vuitton SE EUR 53 27,078 0.13 Natixis SA EUR 839 2,340 0.01 Orange SA EUR 281 2,735 0.01 Orpea SA EUR 19 2,043 0.01 Pernod Ricard SA EUR 207 32,458 0.16 Publicis Groupe SA EUR 70 2,853 0.01 Sanofi EUR 255 20,069 0.10 Schneider Electric SE EUR 149 17,627 0.09 SEB SA EUR 4 596 0.00 Societe Generale SA EUR 158 2,689 0.01 Teleperformance EUR 14 3,798 0.02 Thales SA EUR 71 5,318 0.03 TOTAL SE EUR 770 27,181 0.13 Unibail-Rodamco-Westfield, REIT EUR 6 387 0.00 Valeo SA EUR 396 12,783 0.06 Vinci SA EUR 108 8,787 0.04 Vivendi SA EUR 161 4,247 0.02
338,478 1.65
Germanyadidas AG EUR 84 24,856 0.12 Allianz SE EUR 85 16,903 0.08 BASF SE EUR 51 3,269 0.02 Beiersdorf AG EUR 260 25,035 0.12 Brenntag AG EUR 115 7,253 0.04 Deutsche Boerse AG EUR 61 8,423 0.04 Deutsche Post AG EUR 350 14,137 0.07 Fresenius SE & Co. KGaA EUR 387 14,512 0.07 KION Group AG EUR 66 4,667 0.02 Merck KGaA EUR 96 13,392 0.06 MTU Aero Engines AG EUR 29 6,159 0.03 SAP SE EUR 267 28,363 0.14 Siemens AG EUR 268 31,307 0.15 thyssenkrupp AG EUR 440 3,527 0.02 Vonovia SE EUR 19 1,133 0.01
202,936 0.99
hong KongAIA Group Ltd. HKD 3,000 29,957 0.15 BeiGene Ltd., ADR USD 4 828 0.00 BOC Hong Kong Holdings Ltd. HKD 5,000 12,351 0.06 CLP Holdings Ltd. HKD 500 3,768 0.02 Dairy Farm International Holdings Ltd. USD 1,100 3,739 0.02 Link REIT HKD 204 1,514 0.01 MTR Corp. Ltd. HKD 1,506 6,862 0.03 Power Assets Holdings Ltd. HKD 500 2,207 0.01 Sino Land Co. Ltd. HKD 2,088 2,217 0.01 Sun Hung Kai Properties Ltd. HKD 500 5,256 0.03 Swire Properties Ltd. HKD 800 1,896 0.01
70,595 0.35

Morgan Stanley Investment Funds 31 December 2020 330
The accompanying notes are an integral part of these financial statements.
Global Balanced Sustainable Fund (continued)
schEDUlE of InVEsTmEnTsAs at 31 December 2020
Investments Currency
Quantity/ Nominal
Value
Market Value EUR
% of Net Assets
Transferable securities and money market instruments admitted to official exchange listing or dealt in on another regulated market
Equities (continued)
hungaryMOL Hungarian Oil & Gas plc HUF 496 2,982 0.01
2,982 0.01
IndonesiaAstra International Tbk. PT IDR 3,300 1,148 0.00 Bank Negara Indonesia Persero Tbk. PT IDR 5,300 1,889 0.01 Bank Rakyat Indonesia Persero Tbk. PT IDR 42,500 10,229 0.05 Barito Pacific Tbk. PT IDR 20,300 1,289 0.01 Unilever Indonesia Tbk. PT IDR 2,900 1,231 0.01 XL Axiata Tbk. PT IDR 31,000 4,885 0.02
20,671 0.10
IrelandCRH plc EUR 237 8,063 0.04
8,063 0.04
ItalyEnel SpA EUR 2,229 18,425 0.09 Intesa Sanpaolo SpA EUR 9,667 18,535 0.09 Prysmian SpA EUR 188 5,443 0.03 Telecom Italia SpA EUR 3,206 1,351 0.01 Terna Rete Elettrica Nazionale SpA EUR 172 1,073 0.00
44,827 0.22
JapanAdvantest Corp. JPY 100 6,102 0.03 Aeon Co. Ltd. JPY 800 21,399 0.10 Alfresa Holdings Corp. JPY 1,300 19,381 0.09 Asahi Kasei Corp. JPY 700 5,825 0.03 Astellas Pharma, Inc. JPY 1,600 20,131 0.10 Benesse Holdings, Inc. JPY 500 7,950 0.04 Chubu Electric Power Co., Inc. JPY 600 5,894 0.03 Chugai Pharmaceutical Co. Ltd. JPY 500 21,703 0.11 Dai Nippon Printing Co. Ltd. JPY 700 10,244 0.05 Daifuku Co. Ltd. JPY 100 10,087 0.05 Dai-ichi Life Holdings, Inc. JPY 500 6,110 0.03 Daiichi Sankyo Co. Ltd. JPY 500 13,957 0.07 Daikin Industries Ltd. JPY 100 18,162 0.09 Daiwa House Industry Co. Ltd. JPY 700 16,938 0.08 East Japan Railway Co. JPY 300 16,324 0.08 Eisai Co. Ltd. JPY 200 11,652 0.06 ENEOS Holdings, Inc. JPY 1,400 4,095 0.02 FUJIFILM Holdings Corp. JPY 200 8,605 0.04 Fujitsu Ltd. JPY 100 11,761 0.06 Hamamatsu Photonics KK JPY 300 13,966 0.07 Hankyu Hanshin Holdings, Inc. JPY 400 10,836 0.05 Hitachi Construction Machinery Co. Ltd. JPY 100 2,314 0.01 Hitachi Ltd. JPY 300 9,625 0.05 Honda Motor Co. Ltd. JPY 300 6,890 0.03 Inpex Corp. JPY 500 2,196 0.01 ITOCHU Corp. JPY 1,500 35,077 0.17
schEDUlE of InVEsTmEnTsAs at 31 December 2020
Investments Currency
Quantity/ Nominal
Value
Market Value EUR
% of Net Assets
Transferable securities and money market instruments admitted to official exchange listing or dealt in on another regulated market
Equities (continued)
Japan (continued)Japan Post Holdings Co. Ltd. JPY 800 5,067 0.02 Kansai Electric Power Co., Inc. (The) JPY 400 3,079 0.01 Kansai Paint Co. Ltd. JPY 100 2,509 0.01 Kao Corp. JPY 100 6,286 0.03 Kawasaki Heavy Industries Ltd. JPY 700 12,842 0.06 KDDI Corp. JPY 2,700 65,096 0.32 Keyence Corp. JPY 100 45,844 0.22 Kikkoman Corp. JPY 100 5,660 0.03 Kobe Bussan Co. Ltd. JPY 100 2,508 0.01 Koito Manufacturing Co. Ltd. JPY 400 22,184 0.11 Komatsu Ltd. JPY 600 13,407 0.07 Kyocera Corp. JPY 100 4,997 0.02 Kyushu Railway Co. JPY 400 7,031 0.03 Lawson, Inc. JPY 400 15,175 0.07 Lion Corp. JPY 300 5,920 0.03 Marubeni Corp. JPY 600 3,248 0.02 Marui Group Co. Ltd. JPY 500 7,150 0.03 Mitsui Chemicals, Inc. JPY 200 4,779 0.02 Mitsui Fudosan Co. Ltd. JPY 600 10,206 0.05 Mizuho Financial Group, Inc. JPY 1,420 14,659 0.07 MS&AD Insurance Group Holdings, Inc. JPY 400 9,919 0.05 Murata Manufacturing Co. Ltd. JPY 100 7,361 0.04 Nabtesco Corp. JPY 100 3,579 0.02 NGK Insulators Ltd. JPY 100 1,255 0.01 Nidec Corp. JPY 100 10,266 0.05 Nikon Corp. JPY 400 2,052 0.01 Nippon Express Co. Ltd. JPY 200 10,950 0.05 Nippon Prologis REIT, Inc. JPY 3 7,641 0.04 Nippon Telegraph & Telephone Corp. JPY 600 12,532 0.06 Nippon Yusen KK JPY 600 11,377 0.06 Nissan Chemical Corp. JPY 100 5,097 0.02 Nitto Denko Corp. JPY 100 7,294 0.04 Nomura Holdings, Inc. JPY 1,600 6,886 0.03 Nomura Real Estate Holdings, Inc. JPY 200 3,616 0.02 Nomura Real Estate Master Fund, Inc., REIT JPY 2 2,338 0.01 NTT Data Corp. JPY 900 10,020 0.05 Odakyu Electric Railway Co. Ltd. JPY 400 10,241 0.05 Omron Corp. JPY 200 14,552 0.07 Oriental Land Co. Ltd. JPY 100 13,456 0.07 ORIX Corp. JPY 500 6,255 0.03 Orix JREIT, Inc., REIT JPY 1 1,348 0.01 Osaka Gas Co. Ltd. JPY 300 5,002 0.02 Pan Pacific International Holdings Corp. JPY 200 3,772 0.02 Panasonic Corp. JPY 1,500 14,189 0.07 Persol Holdings Co. Ltd. JPY 400 5,878 0.03 Pola Orbis Holdings, Inc. JPY 300 4,959 0.02 Rakuten, Inc. JPY 800 6,284 0.03 Recruit Holdings Co. Ltd. JPY 300 10,236 0.05 Resona Holdings, Inc. JPY 1,800 5,121 0.02 Santen Pharmaceutical Co. Ltd. JPY 900 11,905 0.06 Sekisui Chemical Co. Ltd. JPY 200 3,084 0.02 Sekisui House Ltd. JPY 1,300 21,551 0.11 Seven & i Holdings Co. Ltd. JPY 400 11,535 0.06 SG Holdings Co. Ltd. JPY 500 11,107 0.05 Shimizu Corp. JPY 1,400 8,301 0.04 Shin-Etsu Chemical Co. Ltd. JPY 100 14,260 0.07 Shionogi & Co. Ltd. JPY 300 13,330 0.07

331 Morgan Stanley Investment Funds 31 December 2020
The accompanying notes are an integral part of these financial statements.
Global Balanced Sustainable Fund (continued)
schEDUlE of InVEsTmEnTsAs at 31 December 2020
Investments Currency
Quantity/ Nominal
Value
Market Value EUR
% of Net Assets
Transferable securities and money market instruments admitted to official exchange listing or dealt in on another regulated market
Equities (continued)
Japan (continued)Shiseido Co. Ltd. JPY 200 11,260 0.05 SoftBank Group Corp. JPY 500 31,829 0.16 Sompo Holdings, Inc. JPY 100 3,297 0.02 Sony Corp. JPY 500 40,994 0.20 Stanley Electric Co. Ltd. JPY 100 2,627 0.01 Sumitomo Chemical Co. Ltd. JPY 3,200 10,477 0.05 Sumitomo Electric Industries Ltd. JPY 100 1,080 0.01 Sumitomo Metal Mining Co. Ltd. JPY 200 7,235 0.04 Sumitomo Mitsui Financial Group, Inc. JPY 1,300 32,775 0.16 Sumitomo Mitsui Trust Holdings, Inc. JPY 200 5,012 0.02 Sundrug Co. Ltd. JPY 100 3,254 0.02 Sysmex Corp. JPY 200 19,584 0.10 Takeda Pharmaceutical Co. Ltd. JPY 600 17,668 0.09 Teijin Ltd. JPY 300 4,599 0.02 TIS, Inc. JPY 700 11,698 0.06 Tohoku Electric Power Co., Inc. JPY 300 2,013 0.01 Tokio Marine Holdings, Inc. JPY 200 8,377 0.04 Tokyo Electron Ltd. JPY 100 30,317 0.15 Tokyu Corp. JPY 1,700 17,195 0.08 TOTO Ltd. JPY 300 14,683 0.07 Toyoda Gosei Co. Ltd. JPY 300 7,088 0.03 USS Co. Ltd. JPY 400 6,587 0.03 Yamada Holdings Co. Ltd. JPY 4,000 17,328 0.08 Yamaha Motor Co. Ltd. JPY 600 9,969 0.05 Yaskawa Electric Corp. JPY 300 12,156 0.06 Yokogawa Electric Corp. JPY 1,000 16,207 0.08 Z Holdings Corp. JPY 3,600 17,748 0.09
1,246,477 6.09
malaysiaDialog Group Bhd. MYR 1,500 1,049 0.00 HAP Seng Consolidated Bhd. MYR 1,800 3,137 0.01 Hartalega Holdings Bhd. MYR 600 1,476 0.01 IHH Healthcare Bhd. MYR 4,400 4,903 0.02 Maxis Bhd. MYR 9,800 10,028 0.05 Petronas Dagangan Bhd. MYR 1,900 8,238 0.04 PPB Group Bhd. MYR 500 1,876 0.01 Press Metal Aluminium Holdings Bhd. MYR 200 340 0.00 RHB Bank Bhd. MYR 14,500 16,012 0.08 Sime Darby Bhd. MYR 2,600 1,217 0.01 Supermax Corp. Bhd. MYR 1,737 2,115 0.01 Tenaga Nasional Bhd. MYR 800 1,689 0.01
52,080 0.25
mexicoFomento Economico Mexicano SAB de CV MXN 200 1,228 0.01 Grupo Aeroportuario del Sureste SAB
de CV ‘B’ MXN 130 1,714 0.01 Grupo Financiero Banorte SAB de CV ‘O’ MXN 300 1,366 0.01 Industrias Penoles SAB de CV MXN 60 858 0.00 Wal-Mart de Mexico SAB de CV MXN 2,800 6,618 0.03
11,784 0.06
netherlandsAkzo Nobel NV EUR 263 23,107 0.11 ASML Holding NV EUR 103 40,948 0.20 ING Groep NV EUR 725 5,540 0.03
schEDUlE of InVEsTmEnTsAs at 31 December 2020
Investments Currency
Quantity/ Nominal
Value
Market Value EUR
% of Net Assets
Transferable securities and money market instruments admitted to official exchange listing or dealt in on another regulated market
Equities (continued)
netherlands (continued)Just Eat Takeaway.com NV, Reg. S EUR 25 2,310 0.01 Koninklijke Ahold Delhaize NV EUR 801 18,511 0.09 Koninklijke KPN NV EUR 3,121 7,762 0.04 NN Group NV EUR 214 7,603 0.04 Prosus NV EUR 75 6,627 0.03 Wolters Kluwer NV EUR 114 7,873 0.04
120,281 0.59
norwayAdevinta ASA ‘B’ NOK 97 1,332 0.01 Equinor ASA NOK 361 4,945 0.02 Norsk Hydro ASA NOK 623 2,362 0.01
8,639 0.04
PhilippinesAyala Corp. PHP 170 2,381 0.01 Jollibee Foods Corp. PHP 660 2,183 0.01 Manila Electric Co. PHP 260 1,287 0.01
5,851 0.03
PolandJeronimo Martins SGPS SA EUR 723 9,992 0.05 KGHM Polska Miedz SA PLN 110 4,356 0.02 Polski Koncern Naftowy ORLEN SA PLN 188 2,339 0.01 Powszechny Zaklad Ubezpieczen SA PLN 134 941 0.01
17,628 0.09
PortugalEDP - Energias de Portugal SA EUR 4,185 21,578 0.11 Galp Energia SGPS SA EUR 1,007 8,815 0.04
30,393 0.15
singaporeCapitaLand Ltd. SGD 665 1,346 0.01 City Developments Ltd. SGD 600 2,951 0.01 Keppel Corp. Ltd. SGD 800 2,656 0.01 Mapletree Logistics Trust, REIT SGD 900 1,116 0.00 Oversea-Chinese Banking Corp. Ltd. SGD 200 1,242 0.01 Singapore Technologies Engineering Ltd. SGD 800 1,886 0.01 Singapore Telecommunications Ltd. SGD 11,500 16,394 0.08
27,591 0.13
south africaBid Corp. Ltd. ZAR 107 1,565 0.01 Clicks Group Ltd. ZAR 283 3,977 0.02 Gold Fields Ltd. ZAR 199 1,523 0.01 Growthpoint Properties Ltd., REIT ZAR 2,155 1,507 0.01 Kumba Iron Ore Ltd. ZAR 139 4,816 0.02 Life Healthcare Group Holdings Ltd. ZAR 1,638 1,532 0.01 Mr Price Group Ltd. ZAR 90 854 0.00 MultiChoice Group ZAR 443 3,302 0.02 Naspers Ltd. ‘N’ ZAR 74 12,429 0.06
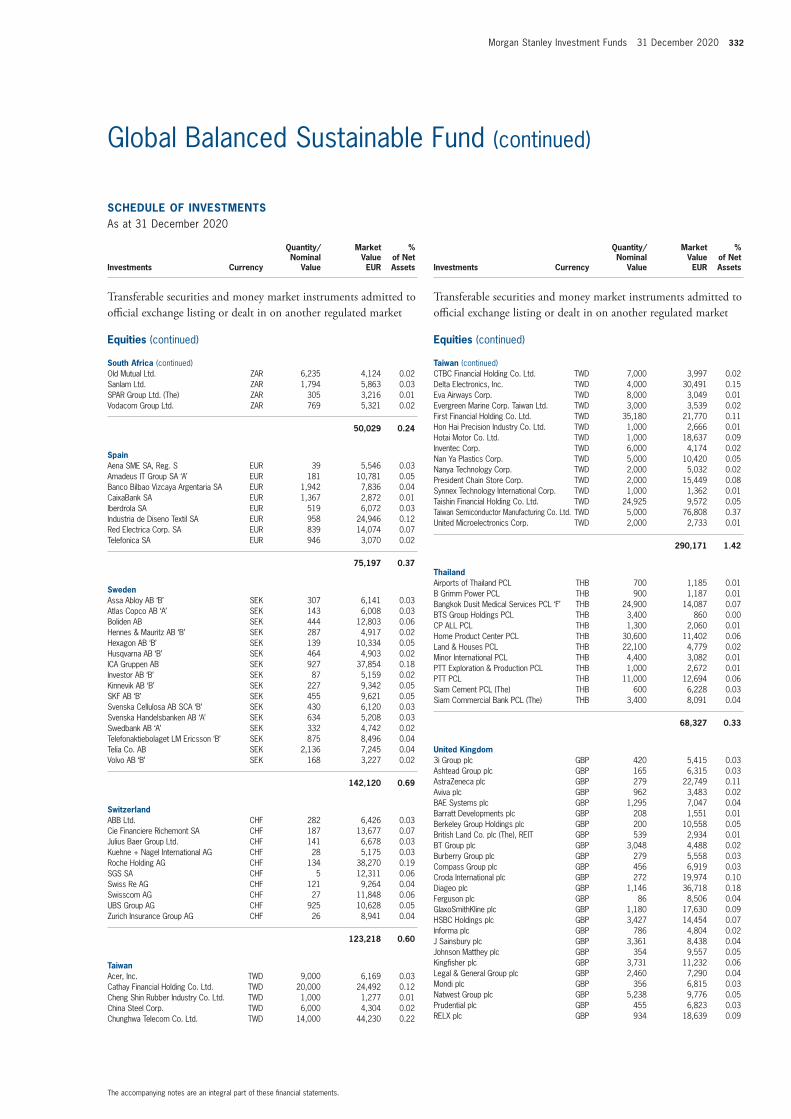
Morgan Stanley Investment Funds 31 December 2020 332
The accompanying notes are an integral part of these financial statements.
Global Balanced Sustainable Fund (continued)
schEDUlE of InVEsTmEnTsAs at 31 December 2020
Investments Currency
Quantity/ Nominal
Value
Market Value EUR
% of Net Assets
Transferable securities and money market instruments admitted to official exchange listing or dealt in on another regulated market
Equities (continued)
south africa (continued)Old Mutual Ltd. ZAR 6,235 4,124 0.02 Sanlam Ltd. ZAR 1,794 5,863 0.03 SPAR Group Ltd. (The) ZAR 305 3,216 0.01 Vodacom Group Ltd. ZAR 769 5,321 0.02
50,029 0.24
spainAena SME SA, Reg. S EUR 39 5,546 0.03 Amadeus IT Group SA ‘A’ EUR 181 10,781 0.05 Banco Bilbao Vizcaya Argentaria SA EUR 1,942 7,836 0.04 CaixaBank SA EUR 1,367 2,872 0.01 Iberdrola SA EUR 519 6,072 0.03 Industria de Diseno Textil SA EUR 958 24,946 0.12 Red Electrica Corp. SA EUR 839 14,074 0.07 Telefonica SA EUR 946 3,070 0.02
75,197 0.37
swedenAssa Abloy AB ‘B’ SEK 307 6,141 0.03 Atlas Copco AB ‘A’ SEK 143 6,008 0.03 Boliden AB SEK 444 12,803 0.06 Hennes & Mauritz AB ‘B’ SEK 287 4,917 0.02 Hexagon AB ‘B’ SEK 139 10,334 0.05 Husqvarna AB ‘B’ SEK 464 4,903 0.02 ICA Gruppen AB SEK 927 37,854 0.18 Investor AB ‘B’ SEK 87 5,159 0.02 Kinnevik AB ‘B’ SEK 227 9,342 0.05 SKF AB ‘B’ SEK 455 9,621 0.05 Svenska Cellulosa AB SCA ‘B’ SEK 430 6,120 0.03 Svenska Handelsbanken AB ‘A’ SEK 634 5,208 0.03 Swedbank AB ‘A’ SEK 332 4,742 0.02 Telefonaktiebolaget LM Ericsson ‘B’ SEK 875 8,496 0.04 Telia Co. AB SEK 2,136 7,245 0.04 Volvo AB ‘B’ SEK 168 3,227 0.02
142,120 0.69
switzerlandABB Ltd. CHF 282 6,426 0.03 Cie Financiere Richemont SA CHF 187 13,677 0.07 Julius Baer Group Ltd. CHF 141 6,678 0.03 Kuehne + Nagel International AG CHF 28 5,175 0.03 Roche Holding AG CHF 134 38,270 0.19 SGS SA CHF 5 12,311 0.06 Swiss Re AG CHF 121 9,264 0.04 Swisscom AG CHF 27 11,848 0.06 UBS Group AG CHF 925 10,628 0.05 Zurich Insurance Group AG CHF 26 8,941 0.04
123,218 0.60
TaiwanAcer, Inc. TWD 9,000 6,169 0.03 Cathay Financial Holding Co. Ltd. TWD 20,000 24,492 0.12 Cheng Shin Rubber Industry Co. Ltd. TWD 1,000 1,277 0.01 China Steel Corp. TWD 6,000 4,304 0.02 Chunghwa Telecom Co. Ltd. TWD 14,000 44,230 0.22
schEDUlE of InVEsTmEnTsAs at 31 December 2020
Investments Currency
Quantity/ Nominal
Value
Market Value EUR
% of Net Assets
Transferable securities and money market instruments admitted to official exchange listing or dealt in on another regulated market
Equities (continued)
Taiwan (continued)CTBC Financial Holding Co. Ltd. TWD 7,000 3,997 0.02 Delta Electronics, Inc. TWD 4,000 30,491 0.15 Eva Airways Corp. TWD 8,000 3,049 0.01 Evergreen Marine Corp. Taiwan Ltd. TWD 3,000 3,539 0.02 First Financial Holding Co. Ltd. TWD 35,180 21,770 0.11 Hon Hai Precision Industry Co. Ltd. TWD 1,000 2,666 0.01 Hotai Motor Co. Ltd. TWD 1,000 18,637 0.09 Inventec Corp. TWD 6,000 4,174 0.02 Nan Ya Plastics Corp. TWD 5,000 10,420 0.05 Nanya Technology Corp. TWD 2,000 5,032 0.02 President Chain Store Corp. TWD 2,000 15,449 0.08 Synnex Technology International Corp. TWD 1,000 1,362 0.01 Taishin Financial Holding Co. Ltd. TWD 24,925 9,572 0.05 Taiwan Semiconductor Manufacturing Co. Ltd. TWD 5,000 76,808 0.37 United Microelectronics Corp. TWD 2,000 2,733 0.01
290,171 1.42
ThailandAirports of Thailand PCL THB 700 1,185 0.01 B Grimm Power PCL THB 900 1,187 0.01 Bangkok Dusit Medical Services PCL ‘F’ THB 24,900 14,087 0.07 BTS Group Holdings PCL THB 3,400 860 0.00 CP ALL PCL THB 1,300 2,060 0.01 Home Product Center PCL THB 30,600 11,402 0.06 Land & Houses PCL THB 22,100 4,779 0.02 Minor International PCL THB 4,400 3,082 0.01 PTT Exploration & Production PCL THB 1,000 2,672 0.01 PTT PCL THB 11,000 12,694 0.06 Siam Cement PCL (The) THB 600 6,228 0.03 Siam Commercial Bank PCL (The) THB 3,400 8,091 0.04
68,327 0.33
United Kingdom3i Group plc GBP 420 5,415 0.03 Ashtead Group plc GBP 165 6,315 0.03 AstraZeneca plc GBP 279 22,749 0.11 Aviva plc GBP 962 3,483 0.02 BAE Systems plc GBP 1,295 7,047 0.04 Barratt Developments plc GBP 208 1,551 0.01 Berkeley Group Holdings plc GBP 200 10,558 0.05 British Land Co. plc (The), REIT GBP 539 2,934 0.01 BT Group plc GBP 3,048 4,488 0.02 Burberry Group plc GBP 279 5,558 0.03 Compass Group plc GBP 456 6,919 0.03 Croda International plc GBP 272 19,974 0.10 Diageo plc GBP 1,146 36,718 0.18 Ferguson plc GBP 86 8,506 0.04 GlaxoSmithKline plc GBP 1,180 17,630 0.09 HSBC Holdings plc GBP 3,427 14,454 0.07 Informa plc GBP 786 4,804 0.02 J Sainsbury plc GBP 3,361 8,438 0.04 Johnson Matthey plc GBP 354 9,557 0.05 Kingfisher plc GBP 3,731 11,232 0.06 Legal & General Group plc GBP 2,460 7,290 0.04 Mondi plc GBP 356 6,815 0.03 Natwest Group plc GBP 5,238 9,776 0.05 Prudential plc GBP 455 6,823 0.03 RELX plc GBP 934 18,639 0.09

333 Morgan Stanley Investment Funds 31 December 2020
The accompanying notes are an integral part of these financial statements.
Global Balanced Sustainable Fund (continued)
schEDUlE of InVEsTmEnTsAs at 31 December 2020
Investments Currency
Quantity/ Nominal
Value
Market Value EUR
% of Net Assets
Transferable securities and money market instruments admitted to official exchange listing or dealt in on another regulated market
Equities (continued)
United Kingdom (continued)Rentokil Initial plc GBP 567 3,217 0.02 Rio Tinto plc GBP 239 14,554 0.07 Rolls-Royce Holdings plc GBP 2,982 3,693 0.02 Segro plc, REIT GBP 239 2,521 0.01 SSE plc GBP 208 3,473 0.02 St James’s Place plc GBP 357 4,505 0.02 Standard Chartered plc GBP 1,343 6,966 0.03 Taylor Wimpey plc GBP 2,610 4,818 0.02 Tesco plc GBP 13,015 33,528 0.16 United Utilities Group plc GBP 532 5,301 0.03 Vodafone Group plc GBP 6,466 8,706 0.04 Wm Morrison Supermarkets plc GBP 30 59 0.00 WPP plc GBP 234 2,084 0.01
351,098 1.72
United states of americaAbbVie, Inc. USD 108 9,294 0.05 Accenture plc ‘A’ USD 80 16,867 0.08 Adobe, Inc. USD 27 10,987 0.05 Agilent Technologies, Inc. USD 134 12,831 0.06 Alexandria Real Estate Equities, Inc., REIT USD 28 4,001 0.02 Alliant Energy Corp. USD 117 4,863 0.02 Allstate Corp. (The) USD 82 7,245 0.04 Alphabet, Inc. ‘A’ USD 69 98,238 0.48 Amazon.com, Inc. USD 32 85,344 0.42 Amcor plc USD 253 2,411 0.01 American Express Co. USD 120 11,694 0.06 American Tower Corp., REIT USD 52 9,382 0.05 Amgen, Inc. USD 191 35,187 0.17 Amphenol Corp. ‘A’ USD 118 12,485 0.06 Anthem, Inc. USD 34 8,740 0.04 Apple, Inc. USD 1,368 148,781 0.73 Applied Materials, Inc. USD 192 13,384 0.07 Archer-Daniels-Midland Co. USD 117 4,761 0.02 AT&T, Inc. USD 633 14,670 0.07 Autodesk, Inc. USD 55 13,570 0.07 Baker Hughes Co. USD 202 3,457 0.02 Ball Corp. USD 82 6,171 0.03 Bank of America Corp. USD 65 1,587 0.01 Becton Dickinson and Co. USD 69 13,945 0.07 Best Buy Co., Inc. USD 242 19,901 0.10 Biogen, Inc. USD 18 3,540 0.02 BlackRock, Inc. USD 22 12,739 0.06 Booking Holdings, Inc. USD 8 14,395 0.07 BorgWarner, Inc. USD 75 2,364 0.01 Bristol-Myers Squibb Co. USD 211 10,523 0.05 Broadcom, Inc. USD 18 6,378 0.03 Brown-Forman Corp. ‘B’ USD 48 3,053 0.01 Cabot Oil & Gas Corp. USD 78 1,033 0.00 Cardinal Health, Inc. USD 228 9,815 0.05 CarMax, Inc. USD 48 3,652 0.02 Cerner Corp. USD 350 22,168 0.11 Chevron Corp. USD 138 9,514 0.05 Chipotle Mexican Grill, Inc. USD 2 2,256 0.01 Chubb Ltd. USD 113 13,919 0.07 Cigna Corp. USD 114 18,973 0.09
schEDUlE of InVEsTmEnTsAs at 31 December 2020
Investments Currency
Quantity/ Nominal
Value
Market Value EUR
% of Net Assets
Transferable securities and money market instruments admitted to official exchange listing or dealt in on another regulated market
Equities (continued)
United states of america (continued)Cincinnati Financial Corp. USD 47 3,285 0.02 Cintas Corp. USD 12 3,422 0.02 Cisco Systems, Inc. USD 582 20,990 0.10 Citigroup, Inc. USD 392 19,371 0.09 Citrix Systems, Inc. USD 52 5,447 0.03 Clorox Co. (The) USD 36 5,899 0.03 CMS Energy Corp. USD 71 3,482 0.02 Coca-Cola Co. (The) USD 402 17,863 0.09 Cognizant Technology Solutions Corp. ‘A’ USD 99 6,536 0.03 Colgate-Palmolive Co. USD 218 15,078 0.07 Comcast Corp. ‘A’ USD 499 21,165 0.10 ConocoPhillips USD 206 6,677 0.03 Consolidated Edison, Inc. USD 69 4,015 0.02 Copart, Inc. USD 54 5,566 0.03 Crown Castle International Corp., REIT USD 42 5,362 0.03 Deere & Co. USD 30 6,526 0.03 Discovery, Inc. ‘C’ USD 295 6,239 0.03 Dominion Energy, Inc. USD 87 5,261 0.03 DuPont de Nemours, Inc. USD 133 7,669 0.04 Eaton Corp. plc USD 18 1,755 0.01 eBay, Inc. USD 351 14,433 0.07 Ecolab, Inc. USD 14 2,474 0.01 Edison International USD 75 3,778 0.02 Edwards Lifesciences Corp. USD 296 21,618 0.11 Eli Lilly and Co. USD 145 19,735 0.10 Emerson Electric Co. USD 202 13,108 0.06 Equinix, Inc., REIT USD 9 5,157 0.03 Equity Residential, REIT USD 189 9,001 0.04 Estee Lauder Cos., Inc. (The) ‘A’ USD 26 5,585 0.03 Etsy, Inc. USD 192 27,925 0.14 Eversource Energy USD 28 1,957 0.01 Exelon Corp. USD 202 6,926 0.03 Expedia Group, Inc. USD 52 5,566 0.03 Expeditors International of Washington, Inc. USD 238 18,335 0.09 Exxon Mobil Corp. USD 382 12,896 0.06 Facebook, Inc. ‘A’ USD 195 43,665 0.21 Fastenal Co. USD 65 2,592 0.01 FedEx Corp. USD 7 1,476 0.01 Fidelity National Information Services, Inc. USD 181 20,795 0.10 FMC Corp. USD 6 556 0.00 Gap, Inc. (The) USD 64 1,067 0.01 General Dynamics Corp. USD 9 1,083 0.01 General Electric Co. USD 1,011 8,726 0.04 Genuine Parts Co. USD 208 16,853 0.08 Gilead Sciences, Inc. USD 339 15,741 0.08 Halliburton Co. USD 81 1,250 0.01 Hasbro, Inc. USD 79 6,058 0.03 HCA Healthcare, Inc. USD 23 3,047 0.01 Healthpeak Properties, Inc., REIT USD 177 4,283 0.02 Henry Schein, Inc. USD 424 22,853 0.11 Hess Corp. USD 101 4,360 0.02 Hologic, Inc. USD 93 5,404 0.03 Home Depot, Inc. (The) USD 278 59,964 0.29 Honeywell International, Inc. USD 97 16,653 0.08 Host Hotels & Resorts, Inc., REIT USD 151 1,780 0.01 HP, Inc. USD 331 6,545 0.03 Humana, Inc. USD 32 10,615 0.05 IDEXX Laboratories, Inc. USD 25 10,086 0.05

Morgan Stanley Investment Funds 31 December 2020 334
The accompanying notes are an integral part of these financial statements.
Global Balanced Sustainable Fund (continued)
schEDUlE of InVEsTmEnTsAs at 31 December 2020
Investments Currency
Quantity/ Nominal
Value
Market Value EUR
% of Net Assets
Transferable securities and money market instruments admitted to official exchange listing or dealt in on another regulated market
Equities (continued)
United states of america (continued)IHS Markit Ltd. USD 170 12,326 0.06 Intel Corp. USD 588 23,425 0.11 International Business Machines Corp. USD 207 20,946 0.10 International Flavors & Fragrances, Inc. USD 63 5,623 0.03 Intuit, Inc. USD 66 20,365 0.10 Invesco Ltd. USD 265 3,717 0.02 Iron Mountain, Inc., REIT USD 81 1,921 0.01 Jacobs Engineering Group, Inc. USD 60 5,255 0.03 Johnson & Johnson USD 174 22,145 0.11 Johnson Controls International plc USD 333 12,528 0.06 Kellogg Co. USD 374 18,835 0.09 Kimberly-Clark Corp. USD 51 5,577 0.03 KLA Corp. USD 30 6,284 0.03 L3Harris Technologies, Inc. USD 47 7,195 0.03 Lockheed Martin Corp. USD 49 14,154 0.07 Lowe’s Cos., Inc. USD 99 12,903 0.06 Marsh & McLennan Cos., Inc. USD 381 35,875 0.18 Mastercard, Inc. ‘A’ USD 102 29,793 0.15 McDonald’s Corp. USD 3 518 0.00 Merck & Co., Inc. USD 237 15,586 0.08 Mettler-Toledo International, Inc. USD 7 6,449 0.03 Microsoft Corp. USD 820 148,035 0.72 Netflix, Inc. USD 49 21,522 0.10 Newmont Corp. USD 74 3,591 0.02 NextEra Energy, Inc. USD 212 13,170 0.06 Nielsen Holdings plc USD 247 4,165 0.02 Northern Trust Corp. USD 107 8,014 0.04 NVIDIA Corp. USD 44 18,703 0.09 Omnicom Group, Inc. USD 56 2,840 0.01 ONEOK, Inc. USD 89 2,737 0.01 Oracle Corp. USD 330 17,281 0.08 PayPal Holdings, Inc. USD 116 21,835 0.11 PepsiCo, Inc. USD 450 54,028 0.26 PNC Financial Services Group, Inc. (The) USD 251 29,995 0.15 PPG Industries, Inc. USD 169 19,617 0.10 Procter & Gamble Co. (The) USD 207 23,301 0.11 Prologis, Inc., REIT USD 132 10,597 0.05 Prudential Financial, Inc. USD 35 2,207 0.01 Public Service Enterprise Group, Inc. USD 127 5,949 0.03 QUALCOMM, Inc. USD 117 14,432 0.07 Quanta Services, Inc. USD 113 6,562 0.03 Raytheon Technologies Corp. USD 188 10,925 0.05 Regency Centers Corp., REIT USD 97 3,562 0.02 Robert Half International, Inc. USD 167 8,465 0.04 Rockwell Automation, Inc. USD 5 1,012 0.00 salesforce.com, Inc. USD 124 22,353 0.11 SBA Communications Corp., REIT ‘A’ USD 16 3,601 0.02 Schlumberger Ltd. USD 136 2,408 0.01 Sherwin-Williams Co. (The) USD 24 14,178 0.07 Simon Property Group, Inc., REIT USD 17 1,151 0.01 Skyworks Solutions, Inc. USD 42 5,229 0.03 Southern Co. (The) USD 181 8,974 0.04 Southwest Airlines Co. USD 86 3,223 0.02 State Street Corp. USD 327 19,104 0.09 SVB Financial Group USD 28 8,685 0.04 Synchrony Financial USD 431 12,035 0.06 Synopsys, Inc. USD 64 13,488 0.07 Sysco Corp. USD 121 7,191 0.03
schEDUlE of InVEsTmEnTsAs at 31 December 2020
Investments Currency
Quantity/ Nominal
Value
Market Value EUR
% of Net Assets
Transferable securities and money market instruments admitted to official exchange listing or dealt in on another regulated market
Equities (continued)
United states of america (continued)T Rowe Price Group, Inc. USD 48 5,841 0.03 Teledyne Technologies, Inc. USD 16 5,091 0.02 Texas Instruments, Inc. USD 153 20,258 0.10 Textron, Inc. USD 71 2,780 0.01 Thermo Fisher Scientific, Inc. USD 26 9,782 0.05 Tiffany & Co. USD 40 4,284 0.02 TJX Cos., Inc. (The) USD 99 5,526 0.03 T-Mobile US, Inc. USD 29 3,159 0.02 TransDigm Group, Inc. USD 3 1,502 0.01 Travelers Cos., Inc. (The) USD 238 26,918 0.13 Ulta Beauty, Inc. USD 20 4,598 0.02 United Parcel Service, Inc. ‘B’ USD 10 1,354 0.01 United Rentals, Inc. USD 29 5,439 0.03 Valero Energy Corp. USD 30 1,375 0.01 Verisk Analytics, Inc. USD 18 3,024 0.01 Verizon Communications, Inc. USD 576 27,337 0.13 Vertex Pharmaceuticals, Inc. USD 83 15,585 0.08 Visa, Inc. ‘A’ USD 204 36,439 0.18 Walgreens Boots Alliance, Inc. USD 324 10,394 0.05 Walt Disney Co. (The) USD 156 23,148 0.11 Waters Corp. USD 8 1,596 0.01 Willis Towers Watson plc USD 33 5,581 0.03 WW Grainger, Inc. USD 24 7,879 0.04 Xcel Energy, Inc. USD 101 5,426 0.03 Xilinx, Inc. USD 79 9,041 0.04 Zions Bancorp NA USD 134 4,695 0.02 Zoetis, Inc. USD 161 21,461 0.10
2,434,770 11.90
Total Equities 6,443,153 31.48
Total Transferable securities and money market instruments admitted to official exchange listing or dealt in on another regulated market 16,294,680 79.61
Other transferable securities and money market instruments not admitted to official exchange listing or dealt in on another regulated market
Equities
spainTelefonica SA Rights 28/12/2020* EUR 946 172 0.00
172 0.00
Total Equities 172 0.00
Total other transferable securities and money market instruments not admitted to official exchange listing or dealt in on another regulated market 172 0.00

335 Morgan Stanley Investment Funds 31 December 2020
The accompanying notes are an integral part of these financial statements.
Global Balanced Sustainable Fund (continued)
financial futures contracts
security Descriptionnumber
of contracts currency
Global Exposure
EUR
Unrealised Gain/(loss)
EUR
% of net assets
DAX Index, 19/03/2021 1 EUR 343,650 12,312 0.06 MSCI Emerging Markets Index, 19/03/2021 6 USD 314,710 8,029 0.04 Russell 2000 Emini Index, 19/03/2021 2 USD 159,804 4,112 0.02
Total Unrealised Gain on financial futures contracts 24,453 0.12
net Unrealised Gain on financial futures contracts 24,453 0.12
forward currency Exchange contracts
currency Purchased
amount Purchased
currency sold
amount sold
maturity Date counterparty
Unrealised Gain/(loss)
EUR
% of net assets
CHF 268,000 EUR 248,071 25/01/2021 RBC 37 0.00EUR 22,235 CHF 24,000 25/01/2021 Barclays 17 0.00EUR 10,186 CHF 11,000 25/01/2021 J.P. Morgan 2 0.00EUR 50,373 GBP 45,000 25/01/2021 RBC 292 0.00EUR 54,886 GBP 49,000 25/01/2021 Westpac Banking 353 0.00EUR 194,281 JPY 24,500,000 25/01/2021 Barclays 551 0.00EUR 415,746 JPY 51,200,000 25/01/2021 RBC 10,890 0.06 EUR 4,154,470 USD 4,956,000 25/01/2021 J.P. Morgan 117,174 0.57 EUR 108,197 USD 129,000 25/01/2021 Westpac Banking 3,110 0.02 GBP 123,000 EUR 136,520 25/01/2021 J.P. Morgan 368 0.00
Unrealised Gain on forward currency Exchange contracts – assets 132,794 0.65
Total Unrealised Gain on forward currency Exchange contracts – assets 132,794 0.65
EUR 12,010 CHF 13,000 25/01/2021 J.P. Morgan (25) 0.00EUR 60,658 GBP 55,000 25/01/2021 J.P. Morgan (553) 0.00EUR 276,600 JPY 35,000,000 25/01/2021 J.P. Morgan (157) 0.00JPY 32,700,000 EUR 262,199 25/01/2021 J.P. Morgan (3,629) (0.02) USD 874,000 EUR 723,838 25/01/2021 J.P. Morgan (11,853) (0.06)
Unrealised loss on forward currency Exchange contracts – liabilities (16,217) (0.08)
Total Unrealised loss on forward currency Exchange contracts – liabilities (16,217) (0.08)
net Unrealised Gain on forward currency Exchange contracts – assets 116,577 0.57
schEDUlE of InVEsTmEnTsAs at 31 December 2020
Investments Currency
Quantity/ Nominal
Value
Market Value EUR
% of Net Assets
Units of authorised UCITS or other collective investment undertakings
collective Investment schemes – UcITs
IrelandBaillie Gifford Worldwide Positive Change
Funds – Class B EUR EUR 15,590 339,532 1.66 Impax Environmental Markets Ireland Fund
– EUR Class X Accumulation EUR 187,253 242,493 1.19 KBI Water Fund ICAV – EUR Class D EUR 3,622 117,194 0.57 Wellington Strategic European Equity Fund
– EUR Class S Accumulating Unhedged EUR 22,599 324,302 1.58
1,023,521 5.00
Total collective Investment schemes – UcITs 1,023,521 5.00
Exchange Traded funds
luxembourgLyxor Green Bond DR Fund UCITS ETF EUR 17,700 980,929 4.79
980,929 4.79
United KingdomInvesco Physical Gold ETC USD 2,053 306,961 1.50 WisdomTree Industrial Metals Enhanced
UCITS ETF USD 9,000 202,125 0.99
509,086 2.49
Total Exchange Traded funds 1,490,015 7.28
Total Units of authorised UcITs or other collective investment undertakings 2,513,536 12.28
Total Investments 18,808,388 91.89
cash 1,247,728 6.10
other assets/(liabilities) 412,757 2.01
Total net assets 20,468,873 100.00
* Security is valued at its fair value under the direction of the Board of Directors.The country disclosed within the Schedule of Investments refers to the country of risk. The country of incorporation may differ.
DERIVaTIVEs
Over-the-counter (OTC) and exchange traded derivatives as at 31 December 2020, expressed in Euro.

Morgan Stanley Investment Funds 31 December 2020 336
The accompanying notes are an integral part of these financial statements.
Global Balanced Sustainable Fund (continued)
credit Default swap contracts
nominal amount ccy counterparty
Reference Entity
Buy/ sell
Interest (Paid)/
Received Rate
maturity Date
market Value EUR
% of net assets
1,250,000 USD Goldman Sachs CDX.NA.HY. 33-V12 Sell 5.00% 20/12/2024 84,195 0.41 1,900,000 USD Goldman Sachs CDX.NA.IG. 33-V1 Sell 1.00% 20/12/2024 25,281 0.12
60,000 USD Goldman Sachs CDX.NA.IG. 35-V1 Sell 1.00% 20/12/2025 1,184 0.01 500,000 EUR Goldman Sachs ITRAXX.EUROPE.
CROSSOVER. 33-V4 Sell 5.00% 20/06/2025 55,900 0.27 55,000 EUR Goldman Sachs ITRAXX.EUROPE.
CROSSOVER. 34-V1 Sell 5.00% 20/12/2025 6,733 0.03 1,400,000 EUR Goldman Sachs ITRAXX.EUROPE.
MAIN. 33-V1 Sell 1.00% 20/06/2025 33,489 0.17
Total market Value on credit Default swap contracts – assets 206,782 1.01
1,390,000 USD Barclays CDX.NA.EM. 33-V2 Sell 1.00% 20/06/2025 (1,896) (0.01) 125,000 USD BNP Paribas CDX.NA.EM. 33-V2 Sell 1.00% 20/06/2025 (170) 0.00 60,000 USD Barclays CDX.NA.EM. 34-V1 Sell 1.00% 20/12/2025 (1,187) (0.01)
Total market Value on credit Default swap contracts – liabilities (3,253) (0.02)
net market Value on credit Default swap contracts – assets 203,529 0.99
Collateral received and paid by the Fund in respect of financial derivative instruments:
Type of collateral counterparty currency amount received amount paid
Global Balanced sustainable fund
Cash Goldman Sachs EUR – 169,333
– 169,333
DERIVaTIVEs (continued)
Over-the-counter (OTC) and exchange traded derivatives as at 31 December 2020, expressed in Euro.
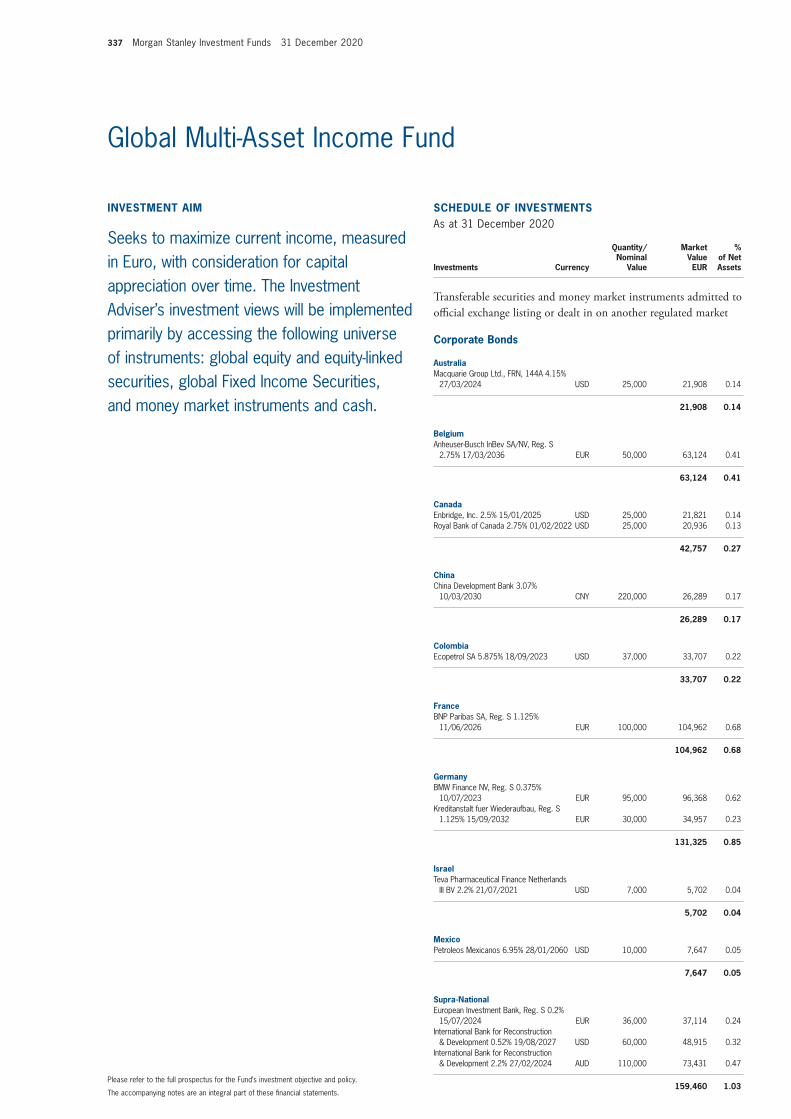
337 Morgan Stanley Investment Funds 31 December 2020
The accompanying notes are an integral part of these financial statements.
Please refer to the full prospectus for the Fund’s investment objective and policy.
Global Multi-Asset Income Fund
schEDUlE of InVEsTmEnTsAs at 31 December 2020
Investments Currency
Quantity/ Nominal
Value
Market Value EUR
% of Net Assets
Transferable securities and money market instruments admitted to official exchange listing or dealt in on another regulated market
corporate Bonds
australiaMacquarie Group Ltd., FRN, 144A 4.15%
27/03/2024 USD 25,000 21,908 0.14
21,908 0.14
BelgiumAnheuser-Busch InBev SA/NV, Reg. S
2.75% 17/03/2036 EUR 50,000 63,124 0.41
63,124 0.41
canadaEnbridge, Inc. 2.5% 15/01/2025 USD 25,000 21,821 0.14 Royal Bank of Canada 2.75% 01/02/2022 USD 25,000 20,936 0.13
42,757 0.27
chinaChina Development Bank 3.07%
10/03/2030 CNY 220,000 26,289 0.17
26,289 0.17
colombiaEcopetrol SA 5.875% 18/09/2023 USD 37,000 33,707 0.22
33,707 0.22
franceBNP Paribas SA, Reg. S 1.125%
11/06/2026 EUR 100,000 104,962 0.68
104,962 0.68
GermanyBMW Finance NV, Reg. S 0.375%
10/07/2023 EUR 95,000 96,368 0.62 Kreditanstalt fuer Wiederaufbau, Reg. S
1.125% 15/09/2032 EUR 30,000 34,957 0.23
131,325 0.85
IsraelTeva Pharmaceutical Finance Netherlands
III BV 2.2% 21/07/2021 USD 7,000 5,702 0.04
5,702 0.04
mexicoPetroleos Mexicanos 6.95% 28/01/2060 USD 10,000 7,647 0.05
7,647 0.05
supra-nationalEuropean Investment Bank, Reg. S 0.2%
15/07/2024 EUR 36,000 37,114 0.24 International Bank for Reconstruction
& Development 0.52% 19/08/2027 USD 60,000 48,915 0.32 International Bank for Reconstruction
& Development 2.2% 27/02/2024 AUD 110,000 73,431 0.47
159,460 1.03
InVEsTmEnT aIm
Seeks to maximize current income, measured in Euro, with consideration for capital appreciation over time. The Investment Adviser’s investment views will be implemented primarily by accessing the following universe of instruments: global equity and equity-linked securities, global Fixed Income Securities, and money market instruments and cash.

Morgan Stanley Investment Funds 31 December 2020 338
The accompanying notes are an integral part of these financial statements.
Global Multi-Asset Income Fund (continued)
schEDUlE of InVEsTmEnTsAs at 31 December 2020
Investments Currency
Quantity/ Nominal
Value
Market Value EUR
% of Net Assets
Transferable securities and money market instruments admitted to official exchange listing or dealt in on another regulated market
corporate Bonds (continued)
United KingdomBAT Capital Corp. 3.557% 15/08/2027 USD 25,000 22,686 0.15 HBOS plc, FRN 4.5% 18/03/2030 EUR 60,000 68,800 0.44
91,486 0.59
United states of americaAbbVie, Inc. 3.2% 21/11/2029 USD 25,000 22,973 0.15 Air Lease Corp. 2.3% 01/02/2025 USD 25,000 21,099 0.14 American International Group, Inc. 4.875%
01/06/2022 USD 25,000 21,622 0.14 Apple, Inc. 2.95% 11/09/2049 USD 25,000 22,645 0.15 Bank of America Corp. 3.248%
21/10/2027 USD 25,000 22,807 0.15 Bank of America Corp. 4.25%
22/10/2026 USD 50,000 47,791 0.31 Bank of New York Mellon Corp. (The)
3.65% 04/02/2024 USD 25,000 22,350 0.14 Boston Properties LP, REIT 3.85%
01/02/2023 USD 50,000 43,378 0.28 Campbell Soup Co. 2.375% 24/04/2030 USD 25,000 21,538 0.14 Capital One Financial Corp. 3.3%
30/10/2024 USD 50,000 44,781 0.29 Cigna Corp. 3.05% 15/10/2027 USD 25,000 22,856 0.15 Citigroup, Inc. 5.5% 13/09/2025 USD 50,000 48,990 0.32 Comcast Corp. 1.95% 15/01/2031 USD 25,000 20,920 0.13 Diamondback Energy, Inc. 2.875%
01/12/2024 USD 25,000 21,432 0.14 Energy Transfer Operating LP 2.9%
15/05/2025 USD 25,000 21,573 0.14 Fox Corp. 4.709% 25/01/2029 USD 25,000 24,763 0.16 General Motors Financial Co., Inc. 4.3%
13/07/2025 USD 7,000 6,397 0.04 Georgia-Pacific LLC, 144A 2.3%
30/04/2030 USD 25,000 21,791 0.14 Goldman Sachs Group, Inc. (The) 3.8%
15/03/2030 USD 25,000 23,955 0.15 HSBC USA, Inc. 3.5% 23/06/2024 USD 100,000 89,270 0.58 JPMorgan Chase & Co. 1.764%
19/11/2031 USD 50,000 41,214 0.27 JPMorgan Chase & Co., FRN 2.776%
25/04/2023 USD 50,000 42,085 0.27 Las Vegas Sands Corp. 3.5% 18/08/2026 USD 25,000 21,813 0.14 Level 3 Financing, Inc., 144A 3.4%
01/03/2027 USD 25,000 22,229 0.14 McDonald’s Corp. 3.375% 26/05/2025 USD 25,000 22,626 0.14 NextEra Energy Capital Holdings, Inc.
2.25% 01/06/2030 USD 25,000 21,368 0.14 NIKE, Inc. 2.85% 27/03/2030 USD 25,000 23,080 0.15 NiSource, Inc. 3.6% 01/05/2030 USD 25,000 23,594 0.15 NVIDIA Corp. 2.85% 01/04/2030 USD 25,000 22,919 0.15 Occidental Petroleum Corp. 3.2%
15/08/2026 USD 15,000 11,454 0.07 Occidental Petroleum Corp. 5.55%
15/03/2026 USD 25,000 21,300 0.14 PepsiCo, Inc. 1.7% 06/10/2021 USD 25,000 20,574 0.13 Progressive Corp. (The) 3.2% 26/03/2030 USD 25,000 23,491 0.15 Union Pacific Corp. 3.95% 10/09/2028 USD 25,000 24,204 0.16 UnitedHealth Group, Inc. 2.875%
15/03/2023 USD 25,000 21,562 0.14 Verizon Communications, Inc. 4.672%
15/03/2055 USD 25,000 27,371 0.18 Walmart, Inc. 2.55% 11/04/2023 USD 25,000 21,351 0.14
schEDUlE of InVEsTmEnTsAs at 31 December 2020
Investments Currency
Quantity/ Nominal
Value
Market Value EUR
% of Net Assets
Transferable securities and money market instruments admitted to official exchange listing or dealt in on another regulated market
corporate Bonds (continued)
United states of america (continued)Walt Disney Co. (The) 2.75% 01/09/2049 USD 25,000 21,543 0.14 Wells Fargo & Co., FRN 5.013%
04/04/2051 USD 25,000 28,939 0.19
1,055,648 6.83
Total corporate Bonds 1,744,015 11.28
Government Bonds
australiaAustralia Government Bond, Reg. S 0.5%
21/09/2026 AUD 120,000 75,770 0.49 Australia Government Bond, Reg. S 1.75%
21/06/2051 AUD 15,000 8,970 0.06 Australia Government Bond, Reg. S 2.75%
21/11/2029 AUD 51,000 37,282 0.24 Australia Government Bond, Reg. S 2.5%
21/05/2030 AUD 40,000 28,764 0.18 Australia Government Bond, Reg. S 1%
21/12/2030 AUD 53,000 33,430 0.22
184,216 1.19
austriaAustria Government Bond, Reg. S, 144A
2.1% 20/09/2117 EUR 3,000 6,722 0.04
6,722 0.04
BelgiumBelgium Government Bond, Reg. S, 144A
0.9% 22/06/2029 EUR 19,000 21,216 0.14 Belgium Government Bond, Reg. S, 144A
1.7% 22/06/2050 EUR 17,000 23,557 0.15
44,773 0.29
BrazilBrazil Government Bond 0% 01/01/2024 BRL 200,000 266,951 1.73
266,951 1.73
canadaCanada Government Bond 1.25%
01/06/2030 CAD 20,000 13,447 0.09 Canada Government Bond 2.25%
01/06/2029 CAD 255,000 185,263 1.20 Province of Ontario Canada 2.3%
15/06/2026 USD 40,000 35,456 0.23 Province of Quebec Canada 1.35%
28/05/2030 USD 40,000 33,077 0.21
267,243 1.73
chinaChina Government Bond 3.13%
21/11/2029 CNY 1,200,000 148,611 0.96 China Government Bond 3.86%
22/07/2049 CNY 300,000 38,019 0.25
186,630 1.21

339 Morgan Stanley Investment Funds 31 December 2020
The accompanying notes are an integral part of these financial statements.
Global Multi-Asset Income Fund (continued)
schEDUlE of InVEsTmEnTsAs at 31 December 2020
Investments Currency
Quantity/ Nominal
Value
Market Value EUR
% of Net Assets
Transferable securities and money market instruments admitted to official exchange listing or dealt in on another regulated market
Government Bonds (continued)
DenmarkDenmark Government Bond 0.5%
15/11/2027 DKK 100,000 14,408 0.09
14,408 0.09
finlandFinland Government Bond, Reg. S, 144A
1.125% 15/04/2034 EUR 12,000 14,239 0.09
14,239 0.09
franceFrance Government Bond OAT, Reg. S 0%
25/11/2029 EUR 139,000 144,203 0.93 France Government Bond OAT, Reg. S,
144A 2% 25/05/2048 EUR 20,000 29,160 0.19 France Government Bond OAT, Reg. S
3.25% 25/05/2045 EUR 18,000 31,119 0.20
204,482 1.32
GermanyBundesrepublik Deutschland, Reg. S 0%
15/08/2050 EUR 7,000 7,349 0.05 Bundesrepublik Deutschland, Reg. S 0.25%
15/02/2029 EUR 182,000 195,783 1.27 Bundesrepublik Deutschland, Reg. S 4.25%
04/07/2039 EUR 3,000 5,666 0.04 State of North Rhine-Westphalia Germany,
Reg. S 1.65% 22/02/2038 EUR 50,000 64,173 0.41
272,971 1.77
GreeceGreece Government Bond, Reg. S 3.75%
30/01/2028 EUR 319,000 392,835 2.54
392,835 2.54
hungaryHungary Government Bond 3%
21/08/2030 HUF 1,000,000 2,986 0.02
2,986 0.02
IndonesiaIndonesia Treasury 6.125% 15/05/2028 IDR 174,000,000 10,213 0.06 Indonesia Treasury 8.25% 15/05/2029 IDR 43,000,000 2,868 0.02 Indonesia Treasury 8.375% 15/03/2034 IDR 180,000,000 12,151 0.08
25,232 0.16
ItalyItaly Buoni Poliennali Del Tesoro, Reg. S,
144A 2.45% 01/09/2050 EUR 50,000 62,479 0.41 Italy Buoni Poliennali Del Tesoro, Reg. S
1.75% 01/07/2024 EUR 94,000 100,516 0.65 Italy Buoni Poliennali Del Tesoro 1.45%
15/09/2022 EUR 29,000 29,944 0.19
192,939 1.25
schEDUlE of InVEsTmEnTsAs at 31 December 2020
Investments Currency
Quantity/ Nominal
Value
Market Value EUR
% of Net Assets
Transferable securities and money market instruments admitted to official exchange listing or dealt in on another regulated market
Government Bonds (continued)
JapanJapan Government Ten Year Bond 0.1%
20/06/2029 JPY 17,900,000 143,302 0.93 Japan Government Ten Year Bond 1.1%
20/06/2021 JPY 11,000,000 87,478 0.57 Japan Government Ten Year Bond 0.5%
20/09/2024 JPY 15,000,000 121,392 0.79 Japan Government Ten Year Bond 0.1%
20/06/2026 JPY 20,000,000 159,972 1.03 Japan Government Thirty Year Bond 0.4%
20/09/2049 JPY 4,000,000 29,806 0.19 Japan Government Thirty Year Bond 1.7%
20/06/2033 JPY 14,300,000 134,962 0.87 Japan Government Thirty Year Bond 2%
20/09/2040 JPY 14,000,000 144,374 0.93 Japan Government Thirty Year Bond 0.3%
20/06/2046 JPY 10,900,000 81,495 0.53
902,781 5.84
malaysiaMalaysia Government Bond 3.885%
15/08/2029 MYR 90,000 20,070 0.13
20,070 0.13
mexicoMexican Bonos 8.5% 31/05/2029 MXN 314,000 15,718 0.10 Mexican Bonos 7.5% 03/06/2027 MXN 300,000 14,020 0.09 Mexican Bonos 7.75% 29/05/2031 MXN 300,000 14,476 0.10
44,214 0.29
netherlandsNetherlands Government Bond, Reg. S,
144A 0% 15/07/2030 EUR 14,000 14,674 0.10 Netherlands Government Bond, Reg. S,
144A 3.75% 15/01/2042 EUR 14,000 26,176 0.17
40,850 0.27
new ZealandNew Zealand Government Bond 0.25%
15/05/2028 NZD 40,000 22,755 0.14 New Zealand Government Bond, Reg. S
2.75% 15/04/2037 NZD 15,000 10,408 0.07 New Zealand Government Bond 3%
20/04/2029 NZD 20,000 13,854 0.09
47,017 0.30
norwayNorway Government Bond, Reg. S, 144A
1.375% 19/08/2030 NOK 40,000 3,972 0.03
3,972 0.03
PolandPoland Government Bond 2.5%
25/07/2027 PLN 40,000 9,768 0.06
9,768 0.06

Morgan Stanley Investment Funds 31 December 2020 340
The accompanying notes are an integral part of these financial statements.
Global Multi-Asset Income Fund (continued)
schEDUlE of InVEsTmEnTsAs at 31 December 2020
Investments Currency
Quantity/ Nominal
Value
Market Value EUR
% of Net Assets
Transferable securities and money market instruments admitted to official exchange listing or dealt in on another regulated market
Government Bonds (continued)
PortugalPortugal Obrigacoes do Tesouro OT,
Reg. S, 144A 0.7% 15/10/2027 EUR 26,000 27,687 0.18
27,687 0.18
RussiaRussian Federal Bond - OFZ 7.95%
07/10/2026 RUB 900,000 11,122 0.07
11,122 0.07
sloveniaSlovenia Government Bond, Reg. S
0.275% 14/01/2030 EUR 8,000 8,351 0.05
8,351 0.05
spainSpain Government Bond, Reg. S, 144A
1.6% 30/04/2025 EUR 75,000 81,843 0.53 Spain Government Bond, Reg. S, 144A
1.25% 31/10/2030 EUR 24,000 26,836 0.17 Spain Government Bond, Reg. S, 144A
2.7% 31/10/2048 EUR 10,000 14,711 0.09 Spain Government Bond, Reg. S, 144A
3.45% 30/07/2066 EUR 9,000 16,311 0.11
139,701 0.90
swedenSweden Government Bond 0.75%
12/05/2028 SEK 85,000 9,047 0.06 Sweden Government Bond, Reg. S 1%
12/11/2026 SEK 65,000 6,957 0.04
16,004 0.10
United KingdomUK Treasury, Reg. S 1.625% 22/10/2028 GBP 62,000 77,457 0.50 UK Treasury, Reg. S 3.5% 22/01/2045 GBP 37,000 66,406 0.43 UK Treasury, Reg. S 0.625% 22/10/2050 GBP 49,000 52,799 0.34 UK Treasury, Reg. S 4.25% 07/06/2032 GBP 24,000 38,579 0.25 UK Treasury, Reg. S 4.25% 07/09/2039 GBP 24,000 43,952 0.29
279,193 1.81
United states of americaUS Treasury 1.625% 30/06/2021 USD 250,000 205,273 1.33 US Treasury 1.75% 15/05/2023 USD 80,000 67,696 0.44 US Treasury 0.5% 30/04/2027 USD 160,000 130,042 0.84 US Treasury 1.75% 15/11/2029 USD 192,000 169,055 1.09 US Treasury 1.125% 15/05/2040 USD 160,000 123,600 0.80 US Treasury 1.25% 15/05/2050 USD 30,000 22,138 0.14 US Treasury 3.125% 15/05/2048 USD 97,000 105,972 0.69 US Treasury 1.75% 30/04/2022 USD 408,000 339,796 2.20 US Treasury 2.125% 15/05/2025 USD 140,000 123,162 0.80 US Treasury 2.5% 15/02/2045 USD 85,000 82,492 0.53 US Treasury Bill 0% 06/05/2021 USD 297,000 242,003 1.57 US Treasury Bill 0% 13/05/2021 USD 297,000 241,995 1.57 US Treasury Bill 0% 20/05/2021 USD 297,000 241,994 1.57 US Treasury Bill 0% 27/05/2021 USD 297,000 241,986 1.57
schEDUlE of InVEsTmEnTsAs at 31 December 2020
Investments Currency
Quantity/ Nominal
Value
Market Value EUR
% of Net Assets
Transferable securities and money market instruments admitted to official exchange listing or dealt in on another regulated market
Government Bonds (continued)
United states of america (continued)US Treasury Bill 0% 03/06/2021 USD 297,000 241,982 1.56 US Treasury Bill 0% 17/06/2021 USD 297,000 241,975 1.56
2,821,161 18.26
Total Government Bonds 6,448,518 41.72
mortgage and asset Backed securities
United states of americaCOLT Mortgage Loan Trust, FRN, Series
2020-2 ‘A1’, 144A 1.853% 25/03/2065 USD 78,902 65,211 0.42 FHLMC Q31314 3.5% 01/02/2045 USD 10,778 9,523 0.06 FHLMC Q31356 3.5% 01/02/2045 USD 15,966 14,295 0.09 FHLMC T65531 4.5% 01/01/2049 USD 7,885 6,981 0.05 FHLMC Whole Loan Securities Trust,
Series 2017-SC01 ‘1A’ 3% 25/12/2046 USD 9,505 7,888 0.05 FHLMC Whole Loan Securities Trust,
Series 2017-SC02 ‘1A’ 3% 25/05/2047 USD 11,163 9,190 0.06 GNMA BG8497 5% 20/02/2049 USD 2,248 2,028 0.02 GNMA MA5808 4.5% 20/03/2049 USD 7,230 6,277 0.04 GNMA MA5809 5% 20/03/2049 USD 5,600 4,948 0.03 Seasoned Credit Risk Transfer Trust,
Series 2019-3 ‘HT’ 3% 25/10/2058 USD 5,244 4,626 0.03 Seasoned Credit Risk Transfer Trust,
Series 2019-3 ‘M55D’ 4% 25/10/2058 USD 5,350 4,822 0.03 UMBS ZA7151 4.5% 01/01/2049 USD 47,536 42,056 0.27 WFRBS Commercial Mortgage Trust, FRN,
Series 2013-C16 ‘D’, 144A 5.185% 15/09/2046 USD 30,000 15,418 0.10
193,263 1.25
Total mortgage and asset Backed securities 193,263 1.25
To Be announced contracts
United states of americaUMBS 2.5% 25/01/2050 USD 60,000 51,488 0.33 UMBS 2% 25/02/2050 USD 110,000 92,854 0.60 UMBS 3% 25/01/2050 USD 160,000 136,585 0.89 UMBS 3.5% 25/01/2050 USD 300,000 258,389 1.67
539,316 3.49
Total To Be announced contracts 539,316 3.49
Warrants
switzerlandCie Financiere Richemont SA 22/11/2023 CHF 98 21 0.00
21 0.00
United states of americaOccidental Petroleum Corp. 03/08/2027 USD 12 66 0.00
66 0.00
Total Warrants 87 0.00

341 Morgan Stanley Investment Funds 31 December 2020
The accompanying notes are an integral part of these financial statements.
Global Multi-Asset Income Fund (continued)
schEDUlE of InVEsTmEnTsAs at 31 December 2020
Investments Currency
Quantity/ Nominal
Value
Market Value EUR
% of Net Assets
Transferable securities and money market instruments admitted to official exchange listing or dealt in on another regulated market
Equities
australiaAGL Energy Ltd. AUD 73 550 0.00 Alumina Ltd. AUD 274 317 0.00 Amcor plc, CDI AUD 125 1,208 0.01 AMP Ltd. AUD 203 199 0.00 Ampol Ltd. AUD 98 1,755 0.01 APA Group AUD 1,710 10,397 0.07 Aristocrat Leisure Ltd. AUD 58 1,133 0.01 ASX Ltd. AUD 13 590 0.00 Atlas Arteria Ltd. AUD 677 2,773 0.02 Aurizon Holdings Ltd. AUD 142 349 0.00 AusNet Services AUD 2,841 3,142 0.02 Australia & New Zealand Banking Group Ltd. AUD 346 4,949 0.03 Bank of Queensland Ltd. AUD 47 229 0.00 Bendigo & Adelaide Bank Ltd. AUD 59 346 0.00 BHP Group Ltd. AUD 301 8,047 0.05 Boral Ltd. AUD 133 415 0.00 Brambles Ltd. AUD 172 1,149 0.01 BWP Trust, REIT AUD 483 1,345 0.01 Challenger Ltd. AUD 62 252 0.00 Charter Hall Retail REIT AUD 268 620 0.00 CIMIC Group Ltd. AUD 11 169 0.00 Coca-Cola Amatil Ltd. AUD 63 513 0.00 Cochlear Ltd. AUD 4 476 0.00 Coles Group Ltd. AUD 120 1,372 0.01 Commonwealth Bank of Australia AUD 171 8,847 0.06 Computershare Ltd. AUD 32 294 0.00 Cromwell Property Group, REIT AUD 1,073 588 0.00 Crown Resorts Ltd. AUD 39 237 0.00 CSL Ltd. AUD 44 7,851 0.05 Dexus, REIT AUD 1,003 5,940 0.04 Domino’s Pizza Enterprises Ltd. AUD 6 328 0.00 Evolution Mining Ltd. AUD 1,168 3,672 0.02 Flight Centre Travel Group Ltd. AUD 6 60 0.00 Fortescue Metals Group Ltd. AUD 104 1,535 0.01 Gold Road Resources Ltd. AUD 602 503 0.00 Goodman Group, REIT AUD 1,928 22,972 0.15 GPT Group (The), REIT AUD 1,788 5,070 0.03 Harvey Norman Holdings Ltd. AUD 61 180 0.00 Incitec Pivot Ltd. AUD 186 267 0.00 Insurance Australia Group Ltd. AUD 255 755 0.01 James Hardie Industries plc AUD 31 747 0.01 Janus Henderson Group plc, CDI AUD 47 1,251 0.01 Lendlease Corp. Ltd. AUD 38 314 0.00 Macquarie Group Ltd. AUD 30 2,618 0.02 Medibank Pvt Ltd. AUD 190 360 0.00 Mirvac Group, REIT AUD 3,824 6,361 0.04 National Australia Bank Ltd. AUD 339 4,827 0.03 Newcrest Mining Ltd. AUD 551 8,950 0.06 Northern Star Resources Ltd. AUD 506 4,046 0.03 Oil Search Ltd. AUD 311 727 0.01 Orica Ltd. AUD 41 391 0.00 Origin Energy Ltd. AUD 582 1,745 0.01 Perseus Mining Ltd. AUD 800 655 0.00 Qantas Airways Ltd. AUD 53 162 0.00 QBE Insurance Group Ltd. AUD 168 903 0.01 Ramelius Resources Ltd. AUD 550 584 0.00 Ramsay Health Care Ltd. AUD 10 392 0.00 REA Group Ltd. AUD 6 563 0.00 Regis Resources Ltd. AUD 346 815 0.01 Resolute Mining Ltd. AUD 370 185 0.00 Rio Tinto Ltd. AUD 44 3,156 0.02 Santos Ltd. AUD 303 1,197 0.01 Saracen Mineral Holdings Ltd. AUD 756 2,263 0.02 Scentre Group, REIT AUD 5,506 9,644 0.06 SEEK Ltd. AUD 37 665 0.01
schEDUlE of InVEsTmEnTsAs at 31 December 2020
Investments Currency
Quantity/ Nominal
Value
Market Value EUR
% of Net Assets
Transferable securities and money market instruments admitted to official exchange listing or dealt in on another regulated market
Equities (continued)
australia (continued)Shopping Centres Australasia Property
Group, REIT AUD 1,057 1,678 0.01 Silver Lake Resources Ltd. AUD 598 674 0.01 Sonic Healthcare Ltd. AUD 28 567 0.00 South32 Ltd. AUD 561 873 0.01 Spark Infrastructure Group AUD 2,968 3,946 0.03 St Barbara Ltd. AUD 480 714 0.01 Stockland, REIT AUD 2,602 6,853 0.05 Suncorp Group Ltd. AUD 134 822 0.01 Sydney Airport AUD 1,671 6,749 0.04 Tabcorp Holdings Ltd. AUD 137 337 0.00 Telstra Corp. Ltd. AUD 458 860 0.01 TPG Telecom Ltd. AUD 37 168 0.00 Transurban Group AUD 3,164 27,232 0.18 Treasury Wine Estates Ltd. AUD 51 302 0.00 Tuas Ltd. AUD 18 8 0.00 Vicinity Centres, REIT AUD 2,902 2,935 0.02 Vocus Group Ltd. AUD 59 150 0.00 Wesfarmers Ltd. AUD 118 3,747 0.03 Westpac Banking Corp. AUD 381 4,650 0.03 Woodside Petroleum Ltd. AUD 238 3,410 0.02 Woolworths Group Ltd. AUD 139 3,443 0.02
225,033 1.46
austriaCA Immobilien Anlagen AG EUR 63 1,963 0.01 OMV AG EUR 16 520 0.01
2,483 0.02
BelgiumAedifica SA, REIT EUR 12 1,180 0.01 Anheuser-Busch InBev SA/NV EUR 157 8,951 0.06 Befimmo SA, REIT EUR 14 508 0.00 Cofinimmo SA, REIT EUR 19 2,314 0.01 Elia Group SA/NV EUR 45 4,388 0.03 Intervest Offices & Warehouses NV, REIT EUR 11 248 0.00 KBC Group NV EUR 83 4,754 0.03 Leasinvest Real Estate SCA, REIT EUR 1 78 0.00 Warehouses De Pauw CVA, REIT, CVA EUR 100 2,826 0.02 Wereldhave Belgium Comm VA, REIT EUR 1 39 0.00
25,286 0.16
BrazilCia de Saneamento Basico do Estado de
Sao Paulo, ADR USD 300 2,110 0.01 Petroleo Brasileiro SA, ADR Preference USD 334 2,992 0.02 Petroleo Brasileiro SA, ADR USD 274 2,493 0.02
7,595 0.05
canadaAgnico Eagle Mines Ltd. USD 130 7,536 0.05 Alamos Gold, Inc. ‘A’ USD 264 1,863 0.01 Artis Real Estate Investment Trust CAD 100 675 0.00 B2Gold Corp. USD 706 3,222 0.02 Barrick Gold Corp. USD 848 15,751 0.10 Cameco Corp. CAD 80 866 0.01 Canadian Apartment Properties REIT CAD 100 3,191 0.02 Canadian Natural Resources Ltd. CAD 84 1,677 0.01 Cenovus Energy, Inc. CAD 82 413 0.00

Morgan Stanley Investment Funds 31 December 2020 342
The accompanying notes are an integral part of these financial statements.
Global Multi-Asset Income Fund (continued)
schEDUlE of InVEsTmEnTsAs at 31 December 2020
Investments Currency
Quantity/ Nominal
Value
Market Value EUR
% of Net Assets
Transferable securities and money market instruments admitted to official exchange listing or dealt in on another regulated market
Equities (continued)
canada (continued)Centerra Gold, Inc. CAD 202 1,902 0.01 Chartwell Retirement Residences CAD 100 717 0.00 Cominar Real Estate Investment Trust CAD 100 516 0.00 Crombie Real Estate Investment Trust CAD 100 912 0.01 Dream Office Real Estate Investment Trust CAD 100 1,263 0.01 Dundee Precious Metals, Inc. CAD 122 710 0.00 Enbridge, Inc. USD 1,043 27,347 0.18 Enbridge, Inc. CAD 1,232 32,300 0.21 Endeavour Mining Corp. CAD 110 2,071 0.01 Equinox Gold Corp. USD 162 1,363 0.01 First Majestic Silver Corp. USD 148 1,614 0.01 Fortis, Inc. CAD 374 12,517 0.08 Fortuna Silver Mines, Inc. USD 126 832 0.01 Franco-Nevada Corp. USD 90 9,283 0.06 H&R Real Estate Investment Trust CAD 200 1,687 0.01 Hydro One Ltd., Reg. S CAD 200 3,672 0.02 IAMGOLD Corp. USD 322 945 0.01 Imperial Oil Ltd. CAD 13 208 0.00 Inter Pipeline Ltd. CAD 295 2,247 0.01 K92 Mining, Inc. CAD 148 735 0.00 Keyera Corp. CAD 201 2,906 0.02 Kinross Gold Corp. USD 850 5,112 0.03 Kirkland Lake Gold Ltd. CAD 184 6,251 0.04 Magna International, Inc. CAD 69 4,040 0.03 New Gold, Inc. USD 454 814 0.01 OceanaGold Corp. CAD 424 664 0.00 Osisko Gold Royalties Ltd. USD 112 1,158 0.01 Pan American Silver Corp. USD 142 3,949 0.03 Parkland Corp. CAD 16 414 0.00 Pembina Pipeline Corp. CAD 734 14,255 0.09 Pretium Resources, Inc. USD 128 1,182 0.01 RioCan Real Estate Investment Trust CAD 300 3,205 0.02 Sandstorm Gold Ltd. USD 128 748 0.01 Silvercorp Metals, Inc. USD 118 637 0.00 SmartCentres Real Estate Investment Trust CAD 100 1,470 0.01 SSR Mining, Inc. USD 148 2,400 0.02 Suncor Energy, Inc. CAD 111 1,541 0.01 TC Energy Corp. CAD 1,137 37,908 0.25 Teranga Gold Corp. CAD 112 988 0.01 Torex Gold Resources, Inc. CAD 58 698 0.00 Wesdome Gold Mines Ltd. CAD 96 657 0.00 Westshore Terminals Investment Corp. CAD 100 983 0.01 Wheaton Precious Metals Corp. USD 210 7,192 0.05 Yamana Gold, Inc. USD 644 3,002 0.02
240,209 1.55
chinaBAIC Motor Corp. Ltd., Reg. S ‘H’(1) HKD 500 151 0.00 Beijing Capital International Airport Co. Ltd. ‘H’ HKD 2,000 1,360 0.01 Beijing Enterprises Holdings Ltd. HKD 500 1,330 0.01 Beijing Enterprises Water Group Ltd. HKD 4,000 1,312 0.01 Brilliance China Automotive Holdings Ltd. HKD 2,000 1,484 0.01 China Gas Holdings Ltd.(Bermuda) (2) HKD 2,255 7,300 0.05 China Merchants Port Holdings Co. Ltd. HKD 50 50 0.00 China Oilfield Services Ltd. ‘H’ HKD 337 232 0.00 China Petroleum & Chemical Corp. ‘H’ HKD 6,676 2,435 0.02 China Shenhua Energy Co. Ltd. ‘H’ HKD 1,384 2,124 0.01 CNOOC Ltd. HKD 1,477 1,115 0.01 Geely Automobile Holdings Ltd. HKD 1,376 3,833 0.02 Great Wall Motor Co. Ltd. ‘H’ HKD 1,000 2,796 0.02 Guangzhou Automobile Group Co. Ltd. ‘H’ HKD 1,582 1,433 0.01 Jiangsu Expressway Co. Ltd. ‘H’ HKD 2,000 1,823 0.01 NIO, Inc., ADR USD 307 12,526 0.08 PetroChina Co. Ltd. ‘H’ HKD 5,260 1,327 0.01
schEDUlE of InVEsTmEnTsAs at 31 December 2020
Investments Currency
Quantity/ Nominal
Value
Market Value EUR
% of Net Assets
Transferable securities and money market instruments admitted to official exchange listing or dealt in on another regulated market
Equities (continued)
china (continued)Shenzhen Investment Holdings Bay Area
Development Co. Ltd. HKD 1,000 274 0.00 Towngas China Co. Ltd. HKD 1,089 401 0.00 Wharf Holdings Ltd. (The) HKD 1,000 2,191 0.01 Zhejiang Expressway Co. Ltd. ‘H’ HKD 2,000 1,377 0.01
46,874 0.30
DenmarkAP Moller - Maersk A/S ‘B’ DKK 1 1,821 0.01 Carlsberg A/S ‘B’ DKK 12 1,564 0.01 Chr Hansen Holding A/S DKK 11 921 0.00 Coloplast A/S ‘B’ DKK 11 1,369 0.01 Danske Bank A/S DKK 76 1,020 0.01 Demant A/S DKK 13 417 0.00 Drilling Co. of 1972 A/S (The) DKK 2 51 0.00 DSV PANALPINA A/S DKK 18 2,471 0.02 Genmab A/S DKK 5 1,637 0.01 ISS A/S DKK 18 254 0.00 Novo Nordisk A/S ‘B’ DKK 187 10,605 0.07 Novozymes A/S ‘B’ DKK 26 1,211 0.01 Orsted A/S, Reg. S DKK 14 2,313 0.01 Pandora A/S DKK 13 1,182 0.01 Tryg A/S DKK 12 308 0.00 Vestas Wind Systems A/S DKK 22 4,237 0.03
31,381 0.20
finlandCitycon OYJ EUR 57 452 0.00 Kone OYJ ‘B’ EUR 92 6,109 0.04 Neste OYJ EUR 64 3,780 0.02 Nokia OYJ EUR 785 2,470 0.02 Nordea Bank Abp EUR 12 80 0.00 Sampo OYJ ‘A’ EUR 126 4,349 0.03 UPM-Kymmene OYJ EUR 178 5,416 0.04
22,656 0.15
franceAccor SA EUR 620 18,352 0.12 Aeroports de Paris EUR 42 4,456 0.03 Air Liquide SA EUR 62 8,324 0.05 Airbus SE EUR 75 6,734 0.04 ArcelorMittal SA EUR 71 1,340 0.01 AXA SA EUR 232 4,527 0.03 BNP Paribas SA EUR 131 5,647 0.04 Capgemini SE EUR 29 3,677 0.02 Carrefour SA EUR 90 1,263 0.01 Cie de Saint-Gobain EUR 72 2,700 0.02 Cie Generale des Etablissements Michelin SCA EUR 80 8,396 0.05 Covivio, REIT EUR 34 2,562 0.02 Credit Agricole SA EUR 163 1,682 0.01 Danone SA EUR 83 4,462 0.03 Engie SA EUR 195 2,441 0.02 EssilorLuxottica SA EUR 33 4,209 0.03 Eutelsat Communications SA EUR 201 1,861 0.01 Faurecia SE EUR 28 1,173 0.01 Gecina SA, REIT EUR 35 4,420 0.03 Getlink SE EUR 776 11,004 0.07 ICADE, REIT EUR 32 2,013 0.01 Kering SA EUR 10 5,944 0.04 Klepierre SA, REIT EUR 167 3,071 0.02 Legrand SA EUR 56 4,088 0.03

343 Morgan Stanley Investment Funds 31 December 2020
The accompanying notes are an integral part of these financial statements.
Global Multi-Asset Income Fund (continued)
schEDUlE of InVEsTmEnTsAs at 31 December 2020
Investments Currency
Quantity/ Nominal
Value
Market Value EUR
% of Net Assets
Transferable securities and money market instruments admitted to official exchange listing or dealt in on another regulated market
Equities (continued)
france (continued)L’Oreal SA EUR 31 9,635 0.06 LVMH Moet Hennessy Louis Vuitton SE EUR 33 16,860 0.11 Mercialys SA, REIT EUR 30 217 0.00 Orange SA EUR 251 2,443 0.02 Pernod Ricard SA EUR 33 5,174 0.03 Peugeot SA EUR 183 4,094 0.03 Publicis Groupe SA EUR 37 1,508 0.01 Renault SA EUR 29 1,037 0.01 Safran SA EUR 56 6,493 0.04 Sanofi EUR 141 11,097 0.07 Schneider Electric SE EUR 111 13,131 0.08 SES SA, FDR EUR 431 3,326 0.02 Societe de la Tour Eiffel, REIT EUR 1 30 0.00 Societe Generale SA EUR 97 1,651 0.01 Sodexo SA EUR 31 2,146 0.01 TOTAL SE EUR 537 18,956 0.12 Unibail-Rodamco-Westfield, REIT, CDI AUD 627 2,015 0.01 Unibail-Rodamco-Westfield, REIT EUR 95 6,135 0.04 Valeo SA EUR 123 3,970 0.03 Vinci SA EUR 72 5,858 0.04 Vivendi SA EUR 171 4,511 0.03
234,633 1.52
Germanyadidas AG EUR 32 9,469 0.06 ADLER Group SA, Reg. S EUR 21 605 0.00 Allianz SE EUR 53 10,539 0.07 alstria office REIT-AG EUR 116 1,705 0.01 BASF SE EUR 106 6,793 0.04 Bayer AG EUR 94 4,476 0.03 Bayerische Motoren Werke AG Preference EUR 21 1,151 0.01 Bayerische Motoren Werke AG EUR 141 10,097 0.07 Commerzbank AG EUR 182 951 0.01 Continental AG EUR 50 6,027 0.04 Daimler AG EUR 367 20,980 0.14 Deutsche Bank AG EUR 178 1,580 0.01 Deutsche Boerse AG EUR 39 5,385 0.03 Deutsche EuroShop AG EUR 33 601 0.00 Deutsche Post AG EUR 131 5,291 0.03 Deutsche Telekom AG EUR 368 5,493 0.04 Deutsche Wohnen SE EUR 304 13,240 0.09 DIC Asset AG EUR 32 427 0.00 E.ON SE EUR 262 2,372 0.02 Fraport AG Frankfurt Airport Services
Worldwide EUR 35 1,713 0.01 Fresenius Medical Care AG & Co. KGaA EUR 30 2,020 0.01 Fresenius SE & Co. KGaA EUR 47 1,762 0.01 Grand City Properties SA EUR 88 1,836 0.01 Hamborner REIT AG EUR 57 511 0.00 HeidelbergCement AG EUR 32 1,958 0.01 Henkel AG & Co. KGaA EUR 18 1,411 0.01 Henkel AG & Co. KGaA Preference EUR 25 2,296 0.02 Infineon Technologies AG EUR 203 6,385 0.04 LEG Immobilien AG EUR 58 7,349 0.05 Linde plc EUR 35 7,430 0.05 Merck KGaA EUR 29 4,046 0.03 Muenchener Rueckversicherungs-
Gesellschaft AG EUR 23 5,545 0.04 Porsche Automobil Holding SE Preference EUR 80 4,619 0.03 ProSiebenSat.1 Media SE EUR 47 643 0.00 RWE AG EUR 87 2,997 0.02 SAP SE EUR 106 11,260 0.07 Siemens AG EUR 94 10,981 0.07 Siemens Energy AG EUR 47 1,403 0.01
schEDUlE of InVEsTmEnTsAs at 31 December 2020
Investments Currency
Quantity/ Nominal
Value
Market Value EUR
% of Net Assets
Transferable securities and money market instruments admitted to official exchange listing or dealt in on another regulated market
Equities (continued)
Germany (continued)TAG Immobilien AG EUR 137 3,538 0.02 thyssenkrupp AG EUR 94 754 0.01 TLG Immobilien AG EUR 70 1,595 0.01 Uniper SE EUR 25 705 0.00 Volkswagen AG EUR 11 1,854 0.01 Volkswagen AG Preference EUR 77 11,621 0.08 Vonovia SE EUR 996 59,369 0.38
262,783 1.70
hong KongAIA Group Ltd. HKD 2,400 23,966 0.15 Bank of East Asia Ltd. (The) HKD 12 21 0.00 Champion REIT HKD 1,000 476 0.00 CK Asset Holdings Ltd. HKD 3,000 12,551 0.08 Fortune Real Estate Investment Trust HKD 1,000 777 0.00 Hang Lung Properties Ltd. HKD 1,000 2,150 0.01 Henderson Land Development Co. Ltd. HKD 1,331 4,232 0.03 Hong Kong & China Gas Co. Ltd. HKD 14,371 17,493 0.11 Hong Kong Exchanges & Clearing Ltd. HKD 321 14,340 0.09 Hongkong Land Holdings Ltd. USD 1,200 4,039 0.03 I-CABLE Communications Ltd. HKD 766 5 0.00 Kerry Properties Ltd. HKD 500 1,032 0.01 Link REIT HKD 1,889 14,018 0.09 New World Development Co. Ltd. HKD 1,163 4,413 0.03 Sino Land Co. Ltd. HKD 2,470 2,622 0.02 Sun Hung Kai Properties Ltd. HKD 1,000 10,511 0.07 Swire Properties Ltd. HKD 800 1,896 0.01 WH Group Ltd., Reg. S HKD 1,500 1,025 0.01 Wharf Real Estate Investment Co. Ltd. HKD 1,000 4,241 0.03
119,808 0.77
IrelandBank of Ireland Group plc EUR 290 955 0.01 CRH plc GBP 610 20,767 0.14 Hibernia REIT plc EUR 499 564 0.00 Irish Residential Properties REIT plc EUR 257 379 0.00 Kerry Group plc ‘A’ EUR 42 4,973 0.03
27,638 0.18
ItalyACEA SpA EUR 49 838 0.01 Assicurazioni Generali SpA EUR 270 3,828 0.02 ASTM SpA EUR 22 450 0.00 Atlantia SpA EUR 816 11,913 0.08 Enel SpA EUR 1,427 11,796 0.08 Eni SpA EUR 836 7,095 0.05 Ferrari NV EUR 66 12,415 0.08 Fiat Chrysler Automobiles NV EUR 560 8,163 0.05 Immobiliare Grande Distribuzione SIIQ SpA,
REIT EUR 25 89 0.00 Infrastrutture Wireless Italiane SpA, Reg. S EUR 351 3,479 0.02 Intesa Sanpaolo SpA EUR 2,580 4,947 0.03 Italgas SpA EUR 801 4,155 0.03 Pirelli & C SpA, Reg. S EUR 128 562 0.00 Rizzoli Corriere Della Sera Mediagroup SpA EUR 23 13 0.00 Snam SpA EUR 4,081 18,701 0.12 Telecom Italia SpA EUR 2,708 1,018 0.01 Tenaris SA EUR 104 677 0.00 Terna Rete Elettrica Nazionale SpA EUR 1,981 12,357 0.08 UniCredit SpA EUR 336 2,547 0.02
105,043 0.68

Morgan Stanley Investment Funds 31 December 2020 344
The accompanying notes are an integral part of these financial statements.
Global Multi-Asset Income Fund (continued)
schEDUlE of InVEsTmEnTsAs at 31 December 2020
Investments Currency
Quantity/ Nominal
Value
Market Value EUR
% of Net Assets
Transferable securities and money market instruments admitted to official exchange listing or dealt in on another regulated market
Equities (continued)
JapanAdvance Residence Investment Corp., REIT JPY 1 2,450 0.02 Aeon Mall Co. Ltd. JPY 100 1,345 0.01 AEON REIT Investment Corp. JPY 1 1,044 0.01 Aisin Seiki Co. Ltd. JPY 69 1,685 0.01 Bridgestone Corp. JPY 138 3,689 0.02 Daiwa House REIT Investment Corp. JPY 1 2,019 0.01 Daiwa Securities Living Investments
Corp., REIT JPY 1 757 0.01 Denso Corp. JPY 130 6,298 0.04 ENEOS Holdings, Inc. JPY 682 1,995 0.01 GLP J-Reit, REIT JPY 1 1,289 0.01 Honda Motor Co. Ltd. JPY 492 11,300 0.07 Hulic Co. Ltd. JPY 300 2,680 0.02 Hulic Reit, Inc. JPY 1 1,218 0.01 Idemitsu Kosan Co. Ltd. JPY 41 736 0.00 Invincible Investment Corp., REIT JPY 2 523 0.00 Isuzu Motors Ltd. JPY 200 1,547 0.01 Japan Airport Terminal Co. Ltd. JPY 93 4,596 0.03 Japan Excellent, Inc., REIT JPY 1 1,012 0.01 Japan Hotel REIT Investment Corp. JPY 3 1,256 0.01 Japan Real Estate Investment Corp., REIT JPY 1 4,715 0.03 Japan Retail Fund Investment Corp., REIT JPY 1 1,485 0.01 JTEKT Corp. JPY 100 632 0.00 Mazda Motor Corp. JPY 200 1,089 0.01 Mitsubishi Estate Co. Ltd. JPY 1,700 22,262 0.14 Mitsubishi Motors Corp. JPY 200 342 0.00 Mitsui Fudosan Co. Ltd. JPY 1,700 28,917 0.19 Mori Hills REIT Investment Corp. JPY 1 1,127 0.01 Mori Trust Sogo Reit, Inc. JPY 1 1,052 0.01 NGK Spark Plug Co. Ltd. JPY 100 1,391 0.01 Nippon Building Fund, Inc., REIT JPY 1 4,732 0.03 Nippon Prologis REIT, Inc. JPY 1 2,547 0.02 Nissan Motor Co. Ltd. JPY 820 3,615 0.02 Nomura Real Estate Holdings, Inc. JPY 100 1,808 0.01 Nomura Real Estate Master Fund, Inc.,
REIT JPY 4 4,676 0.03 Orix JREIT, Inc., REIT JPY 1 1,348 0.01 Premier Investment Corp., REIT JPY 1 1,008 0.01 Sekisui House Reit, Inc. JPY 1 593 0.00 Subaru Corp. JPY 138 2,245 0.01 Sumitomo Electric Industries Ltd. JPY 307 3,314 0.02 Sumitomo Rubber Industries Ltd. JPY 100 700 0.00 Tokyo Gas Co. Ltd. JPY 374 7,049 0.05 Tokyo Tatemono Co. Ltd. JPY 100 1,119 0.01 Tokyu REIT, Inc. JPY 1 1,295 0.01 Toyota Industries Corp. JPY 69 4,462 0.03 Toyota Motor Corp. JPY 714 44,930 0.29 United Urban Investment Corp., REIT JPY 3 3,028 0.02 Yamaha Motor Co. Ltd. JPY 100 1,661 0.01
200,581 1.30
netherlandsAegon NV EUR 479 1,550 0.01 Akzo Nobel NV EUR 65 5,711 0.04 ASML Holding NV EUR 64 25,443 0.16 Basic-Fit NV, Reg. S EUR 143 4,290 0.03 Eurocommercial Properties NV, REIT, CVA EUR 32 492 0.00 Heineken NV EUR 61 5,564 0.04 ING Groep NV EUR 720 5,502 0.04 Koninklijke Ahold Delhaize NV EUR 251 5,801 0.04 Koninklijke KPN NV EUR 920 2,288 0.01 Koninklijke Philips NV EUR 234 10,244 0.07 Koninklijke Vopak NV EUR 116 4,987 0.03 Vastned Retail NV, REIT EUR 14 324 0.00
schEDUlE of InVEsTmEnTsAs at 31 December 2020
Investments Currency
Quantity/ Nominal
Value
Market Value EUR
% of Net Assets
Transferable securities and money market instruments admitted to official exchange listing or dealt in on another regulated market
Equities (continued)
netherlands (continued)Wereldhave NV, REIT EUR 29 312 0.00 Wolters Kluwer NV EUR 132 9,116 0.06
81,624 0.53
new ZealandAuckland International Airport Ltd. NZD 1,489 6,650 0.04 Contact Energy Ltd. NZD 100 525 0.00 Fletcher Building Ltd. NZD 94 327 0.00 Kiwi Property Group Ltd., REIT NZD 959 690 0.01 Mercury NZ Ltd. NZD 96 369 0.00 Meridian Energy Ltd. NZD 179 783 0.01 Ryman Healthcare Ltd. NZD 53 474 0.00 Spark New Zealand Ltd. NZD 255 706 0.01
10,524 0.07
norwayEntra ASA, Reg. S NOK 94 1,731 0.01 Equinor ASA NOK 152 2,083 0.01
3,814 0.02
PeruCia de Minas Buenaventura SAA, ADR USD 172 1,679 0.01
1,679 0.01
PortugalEDP - Energias de Portugal SA EUR 1,055 5,439 0.04 Galp Energia SGPS SA EUR 86 753 0.00
6,192 0.04
RussiaGazprom PJSC, ADR USD 792 3,611 0.02 LUKOIL PJSC, ADR USD 65 3,613 0.02 Novatek PJSC, Reg. S, GDR USD 8 1,065 0.01 Rosneft Oil Co. PJSC, Reg. S, GDR USD 197 906 0.01 Tatneft PJSC, ADR USD 26 865 0.00
10,060 0.06
singaporeAscendas Real Estate Investment Trust SGD 2,900 5,333 0.04 CapitaLand Integrated Commercial Trust,
REIT SGD 4,556 6,073 0.04 CapitaLand Ltd. SGD 2,400 4,858 0.03 CDL Hospitality Trusts, REIT SGD 400 313 0.00 City Developments Ltd. SGD 400 1,967 0.01 ComfortDelGro Corp. Ltd. SGD 300 309 0.00 DBS Group Holdings Ltd. SGD 200 3,091 0.02 Genting Singapore Ltd. SGD 700 367 0.00 Golden Agri-Resources Ltd. SGD 900 88 0.00 Hutchison Port Holdings Trust SGD 6,300 1,011 0.01 Keppel Corp. Ltd. SGD 200 664 0.01 Keppel REIT SGD 1,900 1,313 0.01 Mapletree Commercial Trust, REIT SGD 1,800 2,366 0.02 Mapletree Industrial Trust, REIT SGD 1,200 2,140 0.01 Mapletree Logistics Trust, REIT SGD 1,300 1,613 0.01 Oversea-Chinese Banking Corp. Ltd. SGD 200 1,242 0.01 SATS Ltd. SGD 100 246 0.00

345 Morgan Stanley Investment Funds 31 December 2020
The accompanying notes are an integral part of these financial statements.
Global Multi-Asset Income Fund (continued)
schEDUlE of InVEsTmEnTsAs at 31 December 2020
Investments Currency
Quantity/ Nominal
Value
Market Value EUR
% of Net Assets
Transferable securities and money market instruments admitted to official exchange listing or dealt in on another regulated market
Equities (continued)
singapore (continued)Sembcorp Industries Ltd. SGD 100 106 0.00 Sembcorp Marine Ltd. SGD 491 43 0.00 Singapore Airlines Ltd. SGD 100 264 0.00 Singapore Exchange Ltd. SGD 100 573 0.00 Singapore Technologies Engineering Ltd. SGD 200 471 0.00 Singapore Telecommunications Ltd. SGD 600 855 0.01 StarHub Ltd. SGD 100 81 0.00 Suntec Real Estate Investment Trust SGD 2,200 2,023 0.01 United Overseas Bank Ltd. SGD 100 1,394 0.01 UOL Group Ltd. SGD 500 2,379 0.02 Wilmar International Ltd. SGD 100 287 0.00 Yangzijiang Shipbuilding Holdings Ltd. SGD 200 118 0.00
41,588 0.27
south africaAngloGold Ashanti Ltd., ADR USD 284 5,238 0.04 DRDGOLD Ltd. USD 60 559 0.00 Gold Fields Ltd., ADR USD 592 4,449 0.03 Harmony Gold Mining Co. Ltd., ADR USD 410 1,574 0.01
11,820 0.08
spainAena SME SA, Reg. S EUR 103 14,647 0.10 Amadeus IT Group SA ‘A’ EUR 125 7,445 0.05 Banco Bilbao Vizcaya Argentaria SA EUR 1,352 5,455 0.04 Banco de Sabadell SA EUR 1,398 495 0.00 Banco Santander SA EUR 2,573 6,530 0.04 CaixaBank SA EUR 770 1,618 0.01 Cellnex Telecom SA, Reg. S EUR 224 11,003 0.07 Enagas SA EUR 326 5,857 0.04 Ferrovial SA EUR 760 17,176 0.11 Iberdrola SA EUR 1,376 16,099 0.10 Industria de Diseno Textil SA EUR 220 5,729 0.04 Inmobiliaria Colonial Socimi SA, REIT EUR 205 1,645 0.01 Lar Espana Real Estate Socimi SA, REIT EUR 63 294 0.00 Melia Hotels International SA EUR 597 3,415 0.02 Merlin Properties Socimi SA, REIT EUR 259 2,015 0.01 Red Electrica Corp. SA EUR 621 10,417 0.07 Repsol SA EUR 577 4,760 0.03 Telefonica SA EUR 902 2,927 0.02
117,527 0.76
swedenCastellum AB SEK 229 4,739 0.03 Dios Fastigheter AB SEK 34 259 0.00 Fabege AB SEK 254 3,256 0.02 Fastighets AB Balder ‘B’ SEK 91 3,869 0.03 Hufvudstaden AB ‘A’ SEK 112 1,512 0.01 Klovern AB ‘B’ SEK 404 621 0.01 Kungsleden AB SEK 158 1,412 0.01 Lundin Energy AB SEK 24 527 0.00 Nyfosa AB SEK 68 553 0.00 Pandox AB SEK 39 560 0.00 Wallenstam AB ‘B’ SEK 152 1,973 0.01 Wihlborgs Fastigheter AB SEK 116 2,133 0.02
21,414 0.14
schEDUlE of InVEsTmEnTsAs at 31 December 2020
Investments Currency
Quantity/ Nominal
Value
Market Value EUR
% of Net Assets
Transferable securities and money market instruments admitted to official exchange listing or dealt in on another regulated market
Equities (continued)
switzerlandABB Ltd. CHF 165 3,760 0.02 Adecco Group AG CHF 18 978 0.01 Alcon, Inc. CHF 47 2,532 0.02 Allreal Holding AG CHF 8 1,501 0.01 Aryzta AG CHF 9 6 0.00 Baloise Holding AG CHF 6 869 0.01 Cie Financiere Richemont SA CHF 46 3,364 0.02 Credit Suisse Group AG CHF 221 2,312 0.01 Dufry AG CHF 5 257 0.00 EMS-Chemie Holding AG CHF 1 784 0.01 Flughafen Zurich AG CHF 33 4,746 0.03 Geberit AG CHF 4 2,038 0.01 Givaudan SA CHF 1 3,424 0.02 Idorsia Ltd. CHF 11 258 0.00 Julius Baer Group Ltd. CHF 26 1,231 0.01 Kuehne + Nagel International AG CHF 6 1,109 0.01 LafargeHolcim Ltd. CHF 53 2,364 0.02 Lonza Group AG CHF 7 3,662 0.02 Mobimo Holding AG CHF 6 1,583 0.01 Nestle SA CHF 311 30,061 0.19 Novartis AG CHF 222 17,006 0.11 Pargesa Holding SA CHF 4 300 0.00 Partners Group Holding AG CHF 2 1,917 0.01 PSP Swiss Property AG CHF 35 3,812 0.02 Roche Holding AG CHF 69 19,706 0.13 Schindler Holding AG CHF 2 439 0.00 Schindler Holding AG CHF 5 1,098 0.01 SGS SA CHF 1 2,462 0.02 Sonova Holding AG CHF 6 1,269 0.01 Swatch Group AG (The) CHF 6 257 0.00 Swatch Group AG (The) CHF 4 886 0.01 Swiss Life Holding AG CHF 4 1,517 0.01 Swiss Prime Site AG CHF 65 5,201 0.03 Swiss Re AG CHF 34 2,603 0.02 Swisscom AG CHF 3 1,316 0.01 UBS Group AG CHF 316 3,631 0.02 Zurich Insurance Group AG CHF 14 4,814 0.03
135,073 0.87
TurkeyEldorado Gold Corp. USD 118 1,275 0.01
1,275 0.01
United KingdomAssura plc, REIT GBP 1,653 1,413 0.01 Big Yellow Group plc, REIT GBP 126 1,539 0.01 BP plc GBP 2,337 6,629 0.04 British Land Co. plc (The), REIT GBP 1,001 5,449 0.04 Capital & Counties Properties plc, REIT GBP 746 1,204 0.01 Capital & Regional plc, REIT GBP 38 30 0.00 Centamin plc GBP 794 1,093 0.01 Derwent London plc, REIT GBP 85 2,930 0.02 Empiric Student Property plc, REIT GBP 368 307 0.00 Grainger plc GBP 413 1,304 0.01 Great Portland Estates plc, REIT GBP 219 1,629 0.01 Hammerson plc GBP 116 32 0.00 Helical plc GBP 73 304 0.00 InterContinental Hotels Group plc GBP 345 18,013 0.12 Intu Properties plc, REIT GBP 639 13 0.00 Land Securities Group plc, REIT GBP 720 5,401 0.03 LondonMetric Property plc, REIT GBP 585 1,491 0.01 National Grid plc GBP 4,790 46,127 0.30

Morgan Stanley Investment Funds 31 December 2020 346
The accompanying notes are an integral part of these financial statements.
Global Multi-Asset Income Fund (continued)
schEDUlE of InVEsTmEnTsAs at 31 December 2020
Investments Currency
Quantity/ Nominal
Value
Market Value EUR
% of Net Assets
Transferable securities and money market instruments admitted to official exchange listing or dealt in on another regulated market
Equities (continued)
United Kingdom (continued)NewRiver REIT plc GBP 169 159 0.00 Pennon Group plc GBP 547 5,785 0.04 Picton Property Income Ltd. (The), REIT GBP 313 262 0.00 Primary Health Properties plc, REIT GBP 567 965 0.01 RDI REIT plc GBP 173 183 0.00 Regional REIT Ltd., Reg. S GBP 164 151 0.00 RELX plc EUR 317 6,349 0.04 Royal Dutch Shell plc ‘A’ GBP 472 6,820 0.04 Royal Dutch Shell plc ‘B’ GBP 423 5,931 0.04 Safestore Holdings plc, REIT GBP 206 1,789 0.01 Schroder Real Estate Investment Trust Ltd. GBP 378 164 0.00 Segro plc, REIT GBP 810 8,545 0.06 Severn Trent plc GBP 316 8,053 0.05 Shaftesbury plc, REIT GBP 240 1,520 0.01 Target Healthcare REIT plc GBP 174 221 0.00 Tritax Big Box REIT plc GBP 969 1,811 0.01 Unilever plc EUR 300 14,869 0.10 UNITE Group plc (The), REIT GBP 156 1,815 0.01 United Utilities Group plc GBP 909 9,057 0.06 Whitbread plc GBP 332 11,458 0.07 Workspace Group plc, REIT GBP 118 1,010 0.01
181,825 1.18
United states of americaAlaska Air Group, Inc. USD 85 3,600 0.02 Allegiant Travel Co. USD 12 1,814 0.01 American Airlines Group, Inc. USD 423 5,401 0.03 American Campus Communities, Inc., REIT USD 92 3,151 0.02 American Homes 4 Rent, REIT ‘A’ USD 100 2,425 0.02 American Tower Corp., REIT USD 480 86,604 0.56 American Water Works Co., Inc. USD 190 23,522 0.15 Apartment Income REIT Corp. USD 90 2,787 0.02 Apartment Investment and Management Co. ‘A’ USD 90 373 0.00 Apple Hospitality REIT, Inc. USD 100 1,051 0.01 Aptiv plc USD 66 6,999 0.04 Ashford Hospitality Trust, Inc. USD 10 20 0.00 Atmos Energy Corp. USD 93 7,144 0.05 AvalonBay Communities, Inc., REIT USD 92 11,837 0.08 Baker Hughes Co. USD 100 1,712 0.01 BorgWarner, Inc. USD 69 2,175 0.01 Boston Properties, Inc., REIT USD 92 6,986 0.04 Brandywine Realty Trust, REIT USD 100 948 0.01 Brixmor Property Group, Inc., REIT USD 184 2,438 0.02 Brookfield Property Partners LP USD 112 1,333 0.01 CenterPoint Energy, Inc. USD 374 6,511 0.04 Centerspace USD 10 572 0.00 Cheniere Energy, Inc. USD 187 9,325 0.06 Chevron Corp. USD 100 6,894 0.04 Choice Hotels International, Inc. USD 139 11,799 0.08 Coeur Mining, Inc. USD 168 1,388 0.01 Columbia Property Trust, Inc., REIT USD 100 1,148 0.01 ConocoPhillips USD 100 3,241 0.02 Consolidated Edison, Inc. USD 284 16,525 0.11 Corporate Office Properties Trust, REIT USD 100 2,079 0.01 Cousins Properties, Inc., REIT USD 50 1,347 0.01 Crown Castle International Corp., REIT USD 284 36,260 0.23 CubeSmart, REIT USD 100 2,742 0.02 Delta Air Lines, Inc. USD 380 12,382 0.08 DiamondRock Hospitality Co., REIT USD 100 678 0.00 Digital Realty Trust, Inc., REIT USD 92 10,335 0.07 Diversified Healthcare Trust, REIT USD 100 331 0.00 Douglas Emmett, Inc., REIT USD 92 2,150 0.01 DR Horton, Inc. USD 114 6,432 0.04
schEDUlE of InVEsTmEnTsAs at 31 December 2020
Investments Currency
Quantity/ Nominal
Value
Market Value EUR
% of Net Assets
Transferable securities and money market instruments admitted to official exchange listing or dealt in on another regulated market
Equities (continued)
United states of america (continued)Duke Realty Corp., REIT USD 184 5,876 0.04 Eagle Materials, Inc. USD 54 4,452 0.03 Edison International USD 284 14,307 0.09 Empire State Realty Trust, Inc., REIT ‘A’ USD 1,021 7,614 0.05 Energy Transfer LP USD 72 359 0.00 Equity Commonwealth, REIT USD 92 2,021 0.01 Equity Residential, REIT USD 184 8,763 0.06 Essential Utilities, Inc. USD 187 7,090 0.05 Eversource Energy USD 284 19,849 0.13 Extended Stay America, Inc. USD 296 3,493 0.02 Extra Space Storage, Inc., REIT USD 92 8,598 0.06 Exxon Mobil Corp. USD 400 13,504 0.09 Fidelity National Financial, Inc. USD 163 5,153 0.03 First American Financial Corp. USD 45 1,866 0.01 First Industrial Realty Trust, Inc., REIT USD 92 3,107 0.02 Five Star Senior Living, Inc. USD 6 33 0.00 Ford Motor Co. USD 1,280 9,181 0.06 Franklin Street Properties Corp., REIT USD 100 348 0.00 Gaming and Leisure Properties, Inc., REIT USD 94 3,189 0.02 General Motors Co. USD 427 14,387 0.09 Halliburton Co. USD 100 1,544 0.01 Healthcare Realty Trust, Inc., REIT USD 92 2,192 0.01 Healthcare Trust of America, Inc., REIT ‘A’ USD 100 2,223 0.01 Healthpeak Properties, Inc., REIT USD 468 11,325 0.07 Hecla Mining Co. USD 358 1,864 0.01 Highwoods Properties, Inc., REIT USD 92 2,912 0.02 Hilton Worldwide Holdings, Inc. USD 492 43,949 0.28 Host Hotels & Resorts, Inc., REIT USD 660 7,778 0.05 Hudson Pacific Properties, Inc., REIT USD 92 1,767 0.01 Hyatt Hotels Corp. ‘A’ USD 196 11,647 0.08 JBG SMITH Properties, REIT USD 50 1,256 0.01 JetBlue Airways Corp. USD 202 2,387 0.02 KB Home USD 34 936 0.01 Kilroy Realty Corp., REIT USD 92 4,189 0.03 Kimco Realty Corp., REIT USD 184 2,193 0.01 Kinder Morgan, Inc. USD 2,979 32,875 0.21 Lennar Corp. ‘A’ USD 124 7,735 0.05 Lexington Realty Trust, REIT USD 100 859 0.01 Louisiana-Pacific Corp. USD 44 1,315 0.01 M/I Homes, Inc. USD 43 1,568 0.01 Macerich Co. (The), REIT USD 105 909 0.01 Mack-Cali Realty Corp., REIT USD 100 1,002 0.01 Marriott International, Inc. ‘A’ USD 740 78,045 0.50 Marriott Vacations Worldwide Corp. USD 45 4,988 0.03 Masco Corp. USD 74 3,267 0.02 Medical Properties Trust, Inc., REIT USD 184 3,236 0.02 Meritage Homes Corp. USD 51 3,510 0.02 MGIC Investment Corp. USD 141 1,411 0.01 Mid-America Apartment Communities, Inc.,
REIT USD 92 9,340 0.06 National Retail Properties, Inc., REIT USD 92 3,049 0.02 New Jersey Resources Corp. USD 93 2,666 0.02 Newmont Corp. CAD 65 3,154 0.02 Newmont Corp. USD 378 18,343 0.12 NiSource, Inc. USD 280 5,183 0.03 NVR, Inc. USD 6 20,001 0.13 Occidental Petroleum Corp. USD 100 1,443 0.01 Omega Healthcare Investors, Inc., REIT USD 92 2,738 0.02 ONE Gas, Inc. USD 93 5,783 0.04 ONEOK, Inc. USD 187 5,751 0.04 Ovintiv, Inc. USD 20 235 0.00 Owens Corning USD 35 2,157 0.01 Paramount Group, Inc., REIT USD 1,299 9,380 0.06 Pebblebrook Hotel Trust, REIT USD 57 873 0.01 Physicians Realty Trust, REIT USD 100 1,448 0.01

347 Morgan Stanley Investment Funds 31 December 2020
The accompanying notes are an integral part of these financial statements.
Global Multi-Asset Income Fund (continued)
schEDUlE of InVEsTmEnTsAs at 31 December 2020
Investments Currency
Quantity/ Nominal
Value
Market Value EUR
% of Net Assets
Transferable securities and money market instruments admitted to official exchange listing or dealt in on another regulated market
Equities (continued)
United states of america (continued)Piedmont Office Realty Trust, Inc., REIT ‘A’ USD 100 1,302 0.01 Prologis, Inc., REIT USD 632 50,738 0.33 Public Storage, REIT USD 92 17,167 0.11 PulteGroup, Inc. USD 69 2,431 0.02 Realty Income Corp., REIT USD 92 4,566 0.03 Regency Centers Corp., REIT USD 133 4,883 0.03 Retail Opportunity Investments Corp., REIT USD 100 1,064 0.01 Retail Properties of America, Inc., REIT ‘A’ USD 100 688 0.00 Retail Value, Inc., REIT USD 10 123 0.00 RLJ Lodging Trust, REIT USD 136 1,570 0.01 Royal Gold, Inc. USD 44 3,833 0.02 SBA Communications Corp., REIT ‘A’ USD 94 21,156 0.14 Schlumberger Ltd. USD 100 1,770 0.01 Sempra Energy USD 190 19,543 0.13 Service Properties Trust, REIT USD 100 952 0.01 Simon Property Group, Inc., REIT USD 284 19,235 0.12 SITE Centers Corp., REIT USD 100 815 0.00 SL Green Realty Corp., REIT USD 478 22,468 0.15 Southwest Airlines Co. USD 381 14,278 0.09 Spirit Realty Capital, Inc., REIT USD 55 1,777 0.01 Stewart Information Services Corp. USD 36 1,408 0.01 STORE Capital Corp., REIT USD 92 2,513 0.02 Sunstone Hotel Investors, Inc., REIT USD 100 916 0.01 Tanger Factory Outlet Centers, Inc., REIT USD 100 819 0.01 Targa Resources Corp. USD 187 3,952 0.03 Toll Brothers, Inc. USD 64 2,288 0.01 UDR, Inc., REIT USD 284 8,747 0.06 United Airlines Holdings, Inc. USD 270 9,643 0.06 Urban Edge Properties, REIT USD 100 1,033 0.01 Ventas, Inc., REIT USD 184 7,282 0.05 VEREIT, Inc. USD 207 6,249 0.04 Vornado Realty Trust, REIT USD 1,123 32,905 0.21 Vulcan Materials Co. USD 85 10,071 0.06 Washington Prime Group, Inc. USD 11 58 0.00 Watsco, Inc. USD 47 8,657 0.06 Weingarten Realty Investors, REIT USD 92 1,592 0.01 Welltower, Inc., REIT USD 284 14,763 0.10 Williams Cos., Inc. (The) USD 847 13,745 0.09 WP Carey, Inc., REIT USD 92 5,219 0.03 Wyndham Hotels & Resorts, Inc. USD 184 8,664 0.06 Xenia Hotels & Resorts, Inc., REIT USD 100 1,246 0.01
1,100,204 7.12
Total Equities 3,276,622 21.20
Total Transferable securities and money market instruments admitted to official exchange listing or dealt in on another regulated market 12,201,821 78.94
Other transferable securities and money market instruments not admitted to official exchange listing or dealt in on another regulated market
Equities
australiaOnemarket Ltd.* AUD 81 0 0.00
0 0.00
schEDUlE of InVEsTmEnTsAs at 31 December 2020
Investments Currency
Quantity/ Nominal
Value
Market Value EUR
% of Net Assets
Other transferable securities and money market instruments not admitted to official exchange listing or dealt in on another regulated market
Equities (continued)
austriaBUWOG Group GmbH Rights
22/01/2025* EUR 67 0 0.00
0 0.00
United states of americaESC, Inc., REIT* USD 30 19 0.00 New York REIT Liquidating LLC* USD 10 88 0.00
107 0.00
Total Equities 107 0.00
Total other transferable securities and money market instruments not admitted to official exchange listing or dealt in on another regulated market 107 0.00
Units of authorised UCITS or other collective investment undertakings
collective Investment schemes – aIf
United KingdomHicl Infrastructure plc GBP 1,485 2,877 0.02
2,877 0.02
Total collective Investment schemes – aIf 2,877 0.02
collective Investment schemes – UcITs
luxembourgMorgan Stanley Investment Funds
Emerging Markets Debt Fund – Class AX† USD 17,294 733,287 4.74 Morgan Stanley Investment Funds Global
High Yield Bond Fund – Class IX† USD 40,827 711,378 4.60
1,444,665 9.34
Total collective Investment schemes – UcITs 1,444,665 9.34
Total Units of authorised UcITs or other collective investment undertakings 1,447,542 9.36
Total Investments 13,649,470 88.30
cash 2,047,264 13.24
other assets/(liabilities) (239,486) (1.54)
Total net assets 15,457,248 100.00
* Security is valued at its fair value under the direction of the Board of Directors.† Managed by an affiliate of the Investment Adviser.The country disclosed within the Schedule of Investments refers to the country of risk. The country of incorporation may differ.

Morgan Stanley Investment Funds 31 December 2020 348
The accompanying notes are an integral part of these financial statements.
Global Multi-Asset Income Fund (continued)
option Written contracts
Quantity security Description currency counterparty
Global exposure
UsD
market Value EUR
% of net assets
(22) EURO STOXX 50 Index, Call, 3,575.000, 15/01/2021 EUR Goldman Sachs (376,722) (10,362) (0.07)
(1,040,000) MXEF MSCI Emerging Markets Index, Call, 1,300.000, 15/01/2021 USD Goldman Sachs (425,768,300) (9,411) (0.06)
(3) Nikkei 225 Index, Call, 26,750.000, 08/01/2021 JPY Goldman Sachs (651,188) (18,270) (0.12)
(3) S&P 500 Index, Call, 3,750.000, 15/01/2021 USD Goldman Sachs (476,649) (9,536) (0.06)
Total market Value on option Written contracts – liabilities (47,579) (0.31)
financial futures contracts
security Descriptionnumber
of contracts currency
Global Exposure
EUR
Unrealised Gain/(loss)
EUR
% of net assets
BIST 30 Index, 26/02/2021 48 TRY 88,137 2,155 0.01 EURO STOXX 50 Index, 16/12/2022 5 EUR 48,500 11,177 0.07 S&P 500 Emini Index, 19/03/2021 13 USD 1,971,816 23,383 0.15 US 5 Year Note, 31/03/2021 7 USD 719,575 2,232 0.02 US 10 Year Note, 22/03/2021 11 USD 1,237,224 1,998 0.01 US 10 Year Ultra Bond, 22/03/2021 (1) USD (127,349) 847 0.01 US Ultra Bond, 22/03/2021 (2) USD (347,460) 5,738 0.04
Total Unrealised Gain on financial futures contracts 47,530 0.31
Euro-BTP, 08/03/2021 (2) EUR (304,020) (1,300) (0.01) EURO STOXX 50 Index, 19/03/2021 (7) EUR (248,500) (4,865) (0.03) FTSE 100 Index, 19/03/2021 2 GBP 142,945 (1,993) (0.02) MSCI Emerging Markets Index, 19/03/2021 1 USD 52,492 (88) 0.00OMXS30 Index, 15/01/2021 2 SEK 37,488 (364) 0.00S&P/TSX 60 Index, 18/03/2021 1 CAD 132,144 (1,299) (0.01) US 10 Year Note, 22/03/2021 (1) USD (112,475) (30) 0.00US 10 Year Ultra Bond, 22/03/2021 (7) USD (890,911) (3,343) (0.02) Yen Denominated Nikkei 225 Index, 11/03/2021 (1) JPY (108,614) (2,649) (0.02)
Total Unrealised loss on financial futures contracts (15,931) (0.11)
net Unrealised Gain on financial futures contracts 31,599 0.20
forward currency Exchange contracts (continued)
currency Purchased
amount Purchased
currency sold
amount sold
maturity Date counterparty
Unrealised Gain/(loss)
EUR
% of net assets
HKD 17,827 EUR 1,871 05/01/2021 State Street 3 0.00THB 807,000 USD 26,532 25/02/2021 BNP Paribas 349 0.00AUD 15,000 USD 11,053 26/02/2021 J.P. Morgan 446 0.00AUD 4,720 USD 3,497 26/02/2021 RBC 125 0.00CAD 10,000 USD 7,776 26/02/2021 RBC 68 0.00CHF 44,672 USD 49,213 26/02/2021 Barclays 1,303 0.01 CNH 1,816,205 USD 274,463 26/02/2021 Bank of America 3,189 0.02 COP 31,280,000 USD 8,540 26/02/2021 BNP Paribas 501 0.00CZK 185,000 USD 8,338 26/02/2021 UBS 257 0.00EUR 349,812 USD 415,455 26/02/2021 Goldman Sachs 11,601 0.08 GBP 73,391 USD 97,899 26/02/2021 J.P. Morgan 1,939 0.01 HUF 1,130,650 USD 3,698 26/02/2021 Barclays 94 0.00JPY 12,242,148 USD 117,272 26/02/2021 Bank of America 1,301 0.01 JPY 216,450 USD 2,098 26/02/2021 J.P. Morgan 3 0.00KRW 110,611,700 USD 99,209 26/02/2021 BNP Paribas 1,766 0.01 MXN 36,623 USD 1,797 26/02/2021 UBS 29 0.00
forward currency Exchange contracts (continued)
currency Purchased
amount Purchased
currency sold
amount sold
maturity Date counterparty
Unrealised Gain/(loss)
EUR
% of net assets
NOK 31,840 USD 3,517 26/02/2021 J.P. Morgan 174 0.00PLN 24,090 USD 6,429 26/02/2021 Barclays 44 0.00RON 35,000 USD 8,479 26/02/2021 J.P. Morgan 259 0.00RUB 244,000 USD 3,189 26/02/2021 Barclays 71 0.00SEK 71,000 USD 8,667 26/02/2021 Barclays 26 0.00SEK 97,840 USD 11,327 26/02/2021 J.P. Morgan 537 0.01 SGD 25,000 USD 18,608 26/02/2021 BNP Paribas 261 0.00CAD 15,123 USD 11,852 18/03/2021 Citigroup 29 0.00EUR 40,415 USD 49,232 18/03/2021 Bank of America 355 0.00EUR 1,496,761 USD 1,823,325 18/03/2021 BNP Paribas 13,104 0.09 EUR 1,313,418 USD 1,600,122 18/03/2021 Goldman Sachs 11,384 0.08 EUR 1,814,583 USD 2,212,615 18/03/2021 J.P. Morgan 14,158 0.09 EUR 1,467,522 USD 1,788,354 18/03/2021 UBS 12,323 0.08 GBP 9,126 USD 12,437 18/03/2021 UBS 27 0.00ILS 23,587 USD 7,256 18/03/2021 Bank of America 68 0.00JPY 5,739,519 USD 55,558 18/03/2021 BNP Paribas 151 0.00JPY 3,105,356 USD 30,095 18/03/2021 UBS 53 0.00SGD 8,392 USD 6,340 18/03/2021 BNP Paribas 12 0.00USD 329,159 BRL 1,702,574 18/03/2021 BNP Paribas 1,504 0.01 USD 12,867 EUR 10,455 18/03/2021 BNP Paribas 15 0.00USD 575,888 EUR 467,855 18/03/2021 UBS 750 0.01 USD 117,337 HKD 909,500 18/03/2021 BNP Paribas 13 0.00USD 80,528 HKD 624,210 18/03/2021 UBS 7 0.00USD 1,825 HUF 533,958 18/03/2021 Bank of Montreal 19 0.00USD 35,106 HUF 10,273,141 18/03/2021 UBS 366 0.00USD 140,767 KRW 153,162,429 18/03/2021 BNP Paribas 326 0.00USD 13,253 PLN 48,371 18/03/2021 Bank of America 192 0.00USD 42,666 RUB 3,148,878 18/03/2021 BNP Paribas 388 0.00USD 9,715 TWD 268,637 18/03/2021 BNP Paribas 32 0.00CNH 3,739,707 USD 528,333 12/08/2021 Barclays 31,602 0.21
Unrealised Gain on forward currency Exchange contracts – assets 111,224 0.72
Total Unrealised Gain on forward currency Exchange contracts – assets 111,224 0.72
PEN 30,000 USD 8,358 26/02/2021 BNP Paribas (68) 0.00USD 194,990 AUD 266,243 26/02/2021 Barclays (8,892) (0.06) USD 3,888 CAD 5,040 26/02/2021 Barclays (60) 0.00USD 11,832 CAD 15,498 26/02/2021 UBS (285) 0.00USD 27,289 EUR 22,814 26/02/2021 UBS (599) (0.01) USD 9,727 GBP 7,289 26/02/2021 J.P. Morgan (189) 0.00USD 11,689 JPY 1,214,789 26/02/2021 Barclays (87) 0.00USD 30,954 MXN 629,247 26/02/2021 UBS (435) 0.00USD 46,254 NZD 66,300 26/02/2021 UBS (1,374) (0.01) BRL 1,925,456 USD 379,465 18/03/2021 BNP Paribas (7,573) (0.05) EUR 21,991 USD 27,058 18/03/2021 UBS (26) 0.00PEN 4,477 USD 1,242 18/03/2021 BNP Paribas (6) 0.00TRY 2,407,154 USD 317,693 18/03/2021 UBS (2,009) (0.01) USD 11,909 AUD 15,783 18/03/2021 Barclays (244) 0.00USD 137,786 AUD 182,604 18/03/2021 BNP Paribas (2,816) (0.02) USD 1,683 AUD 2,230 18/03/2021 Citigroup (34) 0.00USD 9,148 AUD 12,124 18/03/2021 State Street (187) 0.00USD 41,837 AUD 55,443 18/03/2021 UBS (853) (0.01) USD 16,496 BRL 85,896 18/03/2021 BNP Paribas (14) 0.00USD 40,543 CAD 51,602 18/03/2021 Goldman Sachs (16) 0.00USD 2,393 CAD 3,045 18/03/2021 J.P. Morgan (1) 0.00USD 91,587 CAD 116,569 18/03/2021 UBS (35) 0.00USD 31,222 CHF 27,591 18/03/2021 BNP Paribas (147) 0.00USD 31,583 CLP 23,196,579 18/03/2021 BNP Paribas (852) (0.01) USD 150,589 CNH 988,356 18/03/2021 Bank of America (567) (0.01) USD 47,131 CNY 310,053 18/03/2021 Barclays (195) 0.00USD 38,636 COP 133,294,258 18/03/2021 Barclays (281) 0.00USD 6,658 CZK 144,026 18/03/2021 BNP Paribas (65) 0.00USD 15,553 CZK 336,689 18/03/2021 UBS (161) 0.00USD 21,976 DKK 134,291 18/03/2021 UBS (165) 0.00USD 117,884 EUR 96,283 18/03/2021 Barclays (360) 0.00USD 185,714 EUR 151,602 18/03/2021 BNP Paribas (485) 0.00
DERIVaTIVEs
Over-the-counter (OTC) and exchange traded derivatives as at 31 December 2020, expressed in Euro.
DERIVaTIVEs (continued)
Over-the-counter (OTC) and exchange traded derivatives as at 31 December 2020, expressed in Euro.

349 Morgan Stanley Investment Funds 31 December 2020
The accompanying notes are an integral part of these financial statements.
Global Multi-Asset Income Fund (continued)
forward currency Exchange contracts (continued)
currency Purchased
amount Purchased
currency sold
amount sold
maturity Date counterparty
Unrealised Gain/(loss)
EUR
% of net assets
USD 12,647 EUR 10,336 18/03/2021 Goldman Sachs (45) 0.00USD 416,467 EUR 339,218 18/03/2021 J.P. Morgan (334) 0.00USD 145,811 EUR 118,894 18/03/2021 UBS (247) 0.00USD 22,595 GBP 16,849 18/03/2021 Bank of America (349) 0.00USD 29,697 GBP 22,145 18/03/2021 BNP Paribas (459) 0.00USD 20,025 GBP 14,932 18/03/2021 Goldman Sachs (309) 0.00USD 95,826 GBP 71,452 18/03/2021 UBS (1,478) (0.01) USD 20,171 IDR 287,331,679 18/03/2021 BNP Paribas (297) 0.00USD 77,045 INR 5,725,769 18/03/2021 BNP Paribas (588) (0.01) USD 15,663 JPY 1,617,981 18/03/2021 BNP Paribas (42) 0.00USD 113,433 JPY 11,750,719 18/03/2021 Goldman Sachs (563) (0.01) USD 39,699 JPY 4,112,449 18/03/2021 J.P. Morgan (197) 0.00USD 754,681 JPY 78,180,093 18/03/2021 UBS (3,762) (0.03) USD 107,890 MXN 2,185,917 18/03/2021 UBS (1,013) (0.01) USD 1,632 NOK 14,256 18/03/2021 UBS (31) 0.00USD 7,574 NZD 10,702 18/03/2021 Commonwealth
Bank of Australia (134) 0.00USD 3,208 NZD 4,534 18/03/2021 Goldman Sachs (58) 0.00USD 6,903 SEK 56,539 18/03/2021 UBS (20) 0.00USD 38,718 SGD 51,618 18/03/2021 Barclays (298) 0.00USD 14,902 SGD 19,866 18/03/2021 BNP Paribas (114) 0.00USD 35,126 SGD 46,831 18/03/2021 UBS (271) 0.00USD 17,721 THB 531,990 18/03/2021 BNP Paribas (40) 0.00USD 35,606 TRY 289,581 18/03/2021 UBS (1,884) (0.01) USD 46,066 TWD 1,280,323 18/03/2021 BNP Paribas (38) 0.00USD 27,624 ZAR 416,201 18/03/2021 UBS (425) 0.00USD 33,267 CNH 227,948 12/08/2021 Barclays (1,064) (0.01)
Unrealised loss on forward currency Exchange contracts – liabilities (43,141) (0.28)
UsD hedged share classUSD 10,170 EUR 8,360 08/01/2021 J.P. Morgan (72) 0.00
Unrealised loss on naV hedged share classes forward currency Exchange contracts – liabilities (72) 0.00
Total Unrealised loss on forward currency Exchange contracts – liabilities (43,213) (0.28)
net Unrealised Gain on forward currency Exchange contracts – assets 68,011 0.44
credit Default swap contracts
nominal amount ccy counterparty
Reference Entity
Buy/ sell
Interest (Paid)/
Received Rate
maturity Date
market Value EUR
% of net assets
55,000 USD Barclays CDX.NA.HY. 27-V16 Sell 5.00% 20/12/2021 1,397 0.01 14,000 EUR Barclays ITRAXX.EUROPE.
CROSSOVER. 27-V8 Sell 5.00% 20/06/2022 708 0.00
Total market Value on credit Default swap contracts – assets 2,105 0.01
net market Value on credit Default swap contracts – assets 2,105 0.01
Interest Rate swap contracts
nominal amount ccy counterparty
security Description
maturity Date
market Value EUR
% of net assets
783,000 MXN Goldman Sachs Pay floating TIIE 4 week Receive fixed 5.57% 01/11/2030 471 0.00
785,000 MXN Goldman Sachs Pay floating TIIE 4 week Receive fixed 5.585% 01/11/2030 510 0.00
1,285,000 MXN Goldman Sachs Pay floating TIIE 4 week Receive fixed 5.605% 01/11/2030 919 0.01
1,540,000 MXN Goldman Sachs Pay floating TIIE 4 week Receive fixed 5.6% 01/11/2030 1,076 0.01
1,795,000 MXN Goldman Sachs Pay floating TIIE 4 week Receive fixed 5.61% 01/11/2030 1,313 0.01
1,795,000 MXN Goldman Sachs Pay floating TIIE 4 week Receive fixed 5.612% 01/11/2030 1,326 0.01
2,095,000 MXN Goldman Sachs Pay floating TIIE 4 week Receive fixed 5.78% 03/10/2030 2,743 0.02
2,414,000 MXN Goldman Sachs Pay floating TIIE 4 week Receive fixed 5.775% 04/10/2030 3,116 0.02
2,570,000 MXN Goldman Sachs Pay floating TIIE 4 week Receive fixed 5.773% 03/10/2030 3,303 0.02
2,883,000 MXN Goldman Sachs Pay floating TIIE 4 week Receive fixed 5.787% 03/10/2030 3,836 0.02
6,935,000 MXN Goldman Sachs Pay floating TIIE 4 week Receive fixed 5.81% 03/10/2030 9,757 0.06
Total market Value on Interest Rate swap contracts – assets 28,370 0.18
net market Value on Interest Rate swap contracts – assets 28,370 0.18
Inflation Rate swap contracts
nominal amount ccy counterparty
security Description
maturity Date
market Value EUR
% of net assets
206,165 USD Goldman Sachs Pay fixed 1.269% Receive floating USCPI
1 month 30/03/2030 14,579 0.09 93,443 USD Goldman Sachs Pay fixed 1.176%
Receive floating USCPI 1 month 31/03/2030 7,353 0.05
56,000 USD Goldman Sachs Pay fixed 1.235% Receive floating USCPI
1 month 30/03/2030 4,125 0.03 55,827 USD Goldman Sachs Pay fixed 1.298%
Receive floating USCPI 1 month 30/03/2030 3,813 0.03
53,000 USD Goldman Sachs Pay fixed 1.745% Receive floating USCPI
1 month 30/07/2030 2,554 0.02 29,000 USD Goldman Sachs Pay fixed 1.311%
Receive floating USCPI 1 month 28/04/2030 1,971 0.01
23,000 USD Goldman Sachs Pay fixed 1.367% Receive floating USCPI
1 month 29/05/2030 1,581 0.01 20,000 USD Goldman Sachs Pay fixed 1.956%
Receive floating USCPI 1 month 28/08/2030 527 0.00
72,000 USD Goldman Sachs Pay fixed 2.183% Receive floating USCPI
1 month 23/12/2030 19 0.00
Total market Value on Inflation Rate swap contracts – assets 36,522 0.24
net market Value on Inflation Rate swap contracts – assets 36,522 0.24
DERIVaTIVEs (continued)
Over-the-counter (OTC) and exchange traded derivatives as at 31 December 2020, expressed in Euro.
DERIVaTIVEs (continued)
Over-the-counter (OTC) and exchange traded derivatives as at 31 December 2020, expressed in Euro.

Morgan Stanley Investment Funds 31 December 2020 350
The accompanying notes are an integral part of these financial statements.
Global Multi-Asset Income Fund (continued)
Total Return swap contracts
nominal amount ccy security Description
maturity Date counterparty
Unrealised Gain/(loss)
EUR
% of net assets
818,556 USD Receive Barclays US Value Pay USD LIBOR 3 month + 20.00bp 23/07/2021 Barclays 19,206 0.13
91,349 USD Receive BNP US Banks Pay USD LIBOR 3 month + 15.00bp 14/09/2021 BNP Paribas 3,549 0.02
132,585 USD Receive BNP US Banks Pay USD LIBOR 3 month + 25.00bp 14/09/2021 BNP Paribas 3,704 0.03
572,701 USD Receive MSCI Emerging Net Total Return Pay USD LIBOR 3 month + 28.00bp 22/01/2021 BNP Paribas 64,775 0.42
382,670 USD Receive MSCI Japan Net Total Return US Pay USD LIBOR 3 month + - 10.00bp 08/02/2021 BNP Paribas 31,413 0.20
Total Unrealised Gain on Total Return swap contracts 122,647 0.80
770,513 USD Pay Barclays Short SP500 Anti Value Receive USD LIBOR 3 month + 17.00bp 16/06/2021 Barclays (7,042) (0.04)
408,365 USD Pay Barclays Short SP500 Low Vol Receive USD LIBOR 3 month + 17.00bp 16/06/2021 Barclays (2,020) (0.01)
565,601 USD Pay Barclays Short US Low Vol (SP1500) Receive USD LIBOR 3 month + 17.00bp 28/01/2021 Barclays (8,729) (0.06)
247,647 USD Pay Barclays SPX1500 Anti Value Receive USD LIBOR 3 month + 17.00bp 28/01/2021 Barclays (10,080) (0.07)
1,191,156 USD Receive Barclays Long SP500 Value Pay USD LIBOR 3 month + 20.00bp 16/06/2021 Barclays (7,213) (0.05)
Total Unrealised loss on Total Return swap contracts (35,084) (0.23)
net Unrealised Gain on Total Return swap contracts 87,563 0.57
Geographic Distribution based on Economic Exposure of Total Return swap contracts
country currency
Unrealised Gain/(loss)
EUR
% of net assets
United States of America USD 70,200 0.45United Kingdom of Great Britain USD 204 0.00Cayman Islands HKD 852 0.01Bermuda HKD 380 0.00Marshall Islands USD 59 0.00Ireland EUR 1,370 0.01Switzerland USD 213 0.00Netherlands EUR 164 0.00Jersey RUB 104 0.00China CNY 878 0.01South Korea KRW 1,397 0.01Hong Kong HKD 76 0.00Taiwan TWD 1,265 0.01Singapore HKD 2 0.00Japan JPY 10,399 0.07
87,563 0.57
Collateral received and paid by the Fund in respect of financial derivative instruments:
Type of collateral counterparty currency amount received amount paid
Global multi-asset Income fund
Cash Goldman Sachs EUR 318,805 –
318,805 –
DERIVaTIVEs (continued)
Over-the-counter (OTC) and exchange traded derivatives as at 31 December 2020, expressed in Euro.
DERIVaTIVEs (continued)

351 Morgan Stanley Investment Funds 31 December 2020
The accompanying notes are an integral part of these financial statements.
Please refer to the full prospectus for the Fund’s investment objective and policy.
schEDUlE of InVEsTmEnTsAs at 31 December 2020
Investments Currency
Quantity/ Nominal
Value
Market Value EUR
% of Net Assets
Transferable securities and money market instruments admitted to official exchange listing or dealt in on another regulated market
Government Bonds
BelgiumBelgium Treasury Bill 0% 11/03/2021 EUR 1,000,000 1,001,440 1.56
1,001,440 1.56
BrazilBrazil Government Bond 0% 01/01/2024 BRL 2,100,000 2,802,981 4.37
2,802,981 4.37
franceFrance Treasury Bill BTF, Reg. S 0%
13/01/2021** EUR 500,000 500,110 0.78 France Treasury Bill BTF, Reg. S 0%
20/01/2021 EUR 500,000 500,205 0.78 France Treasury Bill BTF, Reg. S 0%
03/02/2021 EUR 1,000,000 1,000,690 1.56 France Treasury Bill BTF, Reg. S 0%
10/02/2021 EUR 500,000 500,400 0.78 France Treasury Bill BTF, Reg. S 0%
03/03/2021 EUR 1,000,000 1,001,225 1.56 France Treasury Bill BTF, Reg. S 0%
10/03/2021 EUR 1,000,000 1,001,335 1.56 France Treasury Bill BTF, Reg. S 0%
08/04/2021 EUR 1,000,000 1,001,905 1.57 France Treasury Bill BTF, Reg. S 0%
05/05/2021 EUR 500,000 501,207 0.78
6,007,077 9.37
GermanyGermany Treasury Bill, Reg. S 0%
03/02/2021 EUR 1,000,000 1,000,690 1.56
1,000,690 1.56
GreeceGreece Government Bond, Reg. S 3.75%
30/01/2028 EUR 4,377,500 5,390,712 8.41
5,390,712 8.41
netherlandsDutch Treasury Certificate 0%
28/01/2021 EUR 500,000 500,315 0.78
500,315 0.78
United states of americaUS Treasury Bill 0% 06/05/2021 USD 4,302,000 3,505,379 5.47 US Treasury Bill 0% 13/05/2021 USD 4,302,000 3,505,256 5.47 US Treasury Bill 0% 20/05/2021 USD 4,302,000 3,505,248 5.47 US Treasury Bill 0% 27/05/2021 USD 4,302,000 3,505,124 5.47 US Treasury Bill 0% 03/06/2021 USD 4,302,000 3,505,069 5.47 US Treasury Bill 0% 17/06/2021 USD 4,302,000 3,504,975 5.46
21,031,051 32.81
Total Government Bonds 37,734,266 58.86
Global Multi-Asset Opportunities Fund
InVEsTmEnT aIm
To provide an absolute return, measured in Euro, while actively managing total portfolio risk. The Investment Adviser seeks to manage downside risk and targets below market volatility. The Fund will seek to achieve its investment objective by investing in baskets of stocks, ETFs, bonds and derivatives.

Morgan Stanley Investment Funds 31 December 2020 352
The accompanying notes are an integral part of these financial statements.
Global Multi-Asset Opportunities Fund (continued)
schEDUlE of InVEsTmEnTsAs at 31 December 2020
Investments Currency
Quantity/ Nominal
Value
Market Value EUR
% of Net Assets
Transferable securities and money market instruments admitted to official exchange listing or dealt in on another regulated market
Warrants
United states of americaOccidental Petroleum Corp. 03/08/2027 USD 75 416 0.00
416 0.00
Total Warrants 416 0.00
Equities
australiaAmpol Ltd. AUD 867 15,525 0.02 Evolution Mining Ltd. AUD 16,435 51,673 0.08 Gold Road Resources Ltd. AUD 8,467 7,069 0.01 Newcrest Mining Ltd. AUD 6,618 107,499 0.17 Northern Star Resources Ltd. AUD 7,105 56,810 0.09 Oil Search Ltd. AUD 3,164 7,396 0.01 Origin Energy Ltd. AUD 4,196 12,585 0.02 Perseus Mining Ltd. AUD 11,253 9,217 0.01 Ramelius Resources Ltd. AUD 7,748 8,226 0.01 Regis Resources Ltd. AUD 4,871 11,479 0.02 Resolute Min Total To Be announced
contracts ing Ltd. AUD 10,402 5,210 0.01 Santos Ltd. AUD 2,618 10,343 0.02 Saracen Mineral Holdings Ltd. AUD 10,642 31,850 0.05 Silver Lake Resources Ltd. AUD 8,405 9,480 0.01 St Barbara Ltd. AUD 6,746 10,031 0.02 Woodside Petroleum Ltd. AUD 1,608 23,039 0.04
377,432 0.59
austriaOMV AG EUR 234 7,607 0.01
7,607 0.01
BrazilPetroleo Brasileiro SA, ADR Preference USD 3,796 34,002 0.05 Petroleo Brasileiro SA, ADR USD 2,802 25,498 0.04
59,500 0.09
canadaAgnico Eagle Mines Ltd. USD 1,783 103,352 0.16 Alamos Gold, Inc. ‘A’ USD 3,619 25,544 0.04 B2Gold Corp. USD 10,007 45,674 0.07 Barrick Gold Corp. USD 11,956 222,079 0.35 Cameco Corp. CAD 1,285 13,910 0.02 Canadian Natural Resources Ltd. CAD 1,325 26,446 0.04 Cenovus Energy, Inc. CAD 1,306 6,579 0.01 Centerra Gold, Inc. CAD 2,874 27,062 0.04 Dundee Precious Metals, Inc. CAD 1,687 9,812 0.02 Enbridge, Inc. CAD 2,814 73,776 0.11 Endeavour Mining Corp. CAD 1,552 29,217 0.05 Equinox Gold Corp. USD 2,386 20,069 0.03 First Majestic Silver Corp. USD 1,999 21,799 0.03 Fortuna Silver Mines, Inc. USD 1,739 11,481 0.02 Franco-Nevada Corp. USD 1,308 134,911 0.21 IAMGOLD Corp. USD 4,529 13,289 0.02 Imperial Oil Ltd. CAD 126 2,011 0.00 Inter Pipeline Ltd. CAD 151 1,150 0.00 K92 Mining, Inc. CAD 1,995 9,904 0.02 Keyera Corp. CAD 138 1,995 0.00 Kinross Gold Corp. USD 11,972 72,001 0.11 Kirkland Lake Gold Ltd. CAD 2,634 89,489 0.14
schEDUlE of InVEsTmEnTsAs at 31 December 2020
Investments Currency
Quantity/ Nominal
Value
Market Value EUR
% of Net Assets
Transferable securities and money market instruments admitted to official exchange listing or dealt in on another regulated market
Equities (continued)
canada (continued)Magna International, Inc. CAD 1,200 70,255 0.11 New Gold, Inc. USD 6,354 11,393 0.02 OceanaGold Corp. CAD 5,969 9,348 0.01 Osisko Gold Royalties Ltd. USD 1,570 16,238 0.03 Pan American Silver Corp. USD 1,945 54,089 0.08 Parkland Corp. CAD 159 4,113 0.01 Pembina Pipeline Corp. CAD 575 11,167 0.02 Pretium Resources, Inc. USD 1,751 16,169 0.03 Sandstorm Gold Ltd. USD 1,767 10,326 0.02 Silvercorp Metals, Inc. USD 1,636 8,827 0.01 SSR Mining, Inc. USD 2,005 32,520 0.05 Suncor Energy, Inc. CAD 1,790 24,858 0.04 TC Energy Corp. CAD 1,423 47,443 0.07 Teranga Gold Corp. CAD 1,576 13,901 0.02 Torex Gold Resources, Inc. CAD 897 10,802 0.02 Wesdome Gold Mines Ltd. CAD 1,362 9,326 0.01 Wheaton Precious Metals Corp. USD 2,966 101,579 0.16 Yamana Gold, Inc. USD 9,064 42,256 0.07
1,456,160 2.27
chinaBAIC Motor Corp. Ltd., Reg. S ‘H’ HKD 8,000 2,413 0.00 Brilliance China Automotive Holdings Ltd. HKD 12,003 8,908 0.01 BYD Co. Ltd. ‘H’ HKD 2,674 57,114 0.09 China Oilfield Services Ltd. ‘H’ HKD 3,307 2,280 0.00 China Petroleum & Chemical Corp. ‘H’ HKD 75,859 27,669 0.04 China Shenhua Energy Co. Ltd. ‘H’ HKD 14,175 21,754 0.04 CNOOC Ltd. HKD 24,484 18,478 0.03 Dongfeng Motor Group Co. Ltd. ‘H’ HKD 10,696 10,164 0.02 Fuyao Glass Industry Group Co. Ltd., Reg. S ‘H’ HKD 2,401 10,751 0.02 Geely Automobile Holdings Ltd. HKD 23,734 66,111 0.10 Great Wall Motor Co. Ltd. ‘H’ HKD 13,445 37,592 0.06 Guangzhou Automobile Group Co. Ltd. ‘H’ HKD 12,003 10,876 0.02 NIO, Inc., ADR USD 3,193 130,277 0.20 PetroChina Co. Ltd. ‘H’ HKD 49,975 12,607 0.02
416,994 0.65
finlandNeste OYJ EUR 670 39,571 0.06
39,571 0.06
franceAccor SA EUR 8,089 239,434 0.37 Cie Generale des Etablissements Michelin SCA EUR 681 71,471 0.11 Faurecia SE EUR 305 12,783 0.02 Peugeot SA EUR 2,365 52,905 0.08 TOTAL SE EUR 2,984 105,335 0.17 Valeo SA EUR 925 29,859 0.05
511,787 0.80
GermanyBayerische Motoren Werke AG Preference EUR 231 12,666 0.02 Bayerische Motoren Werke AG EUR 1,378 98,676 0.15 Continental AG EUR 448 54,002 0.08 Daimler AG EUR 3,541 202,421 0.32 Porsche Automobil Holding SE Preference EUR 637 36,782 0.06 Volkswagen AG EUR 124 20,897 0.03 Volkswagen AG Preference EUR 758 114,400 0.18
539,844 0.84

353 Morgan Stanley Investment Funds 31 December 2020
The accompanying notes are an integral part of these financial statements.
Global Multi-Asset Opportunities Fund (continued)
schEDUlE of InVEsTmEnTsAs at 31 December 2020
Investments Currency
Quantity/ Nominal
Value
Market Value EUR
% of Net Assets
Transferable securities and money market instruments admitted to official exchange listing or dealt in on another regulated market
Equities (continued)
ItalyEni SpA EUR 3,262 27,685 0.04 Ferrari NV EUR 505 94,995 0.15 Fiat Chrysler Automobiles NV EUR 4,673 68,114 0.11 Pirelli & C SpA, Reg. S EUR 1,398 6,140 0.01 Tenaris SA EUR 802 5,221 0.01
202,155 0.32
JapanAisin Seiki Co. Ltd. JPY 754 18,417 0.03 Bridgestone Corp. JPY 2,317 61,936 0.10 Denso Corp. JPY 1,774 85,939 0.13 ENEOS Holdings, Inc. JPY 7,628 22,310 0.03 Honda Motor Co. Ltd. JPY 6,845 157,209 0.24 Idemitsu Kosan Co. Ltd. JPY 604 10,836 0.02 Isuzu Motors Ltd. JPY 2,631 20,356 0.03 JTEKT Corp. JPY 850 5,369 0.01 Koito Manufacturing Co. Ltd. JPY 535 29,671 0.05 Mazda Motor Corp. JPY 2,317 12,613 0.02 Mitsubishi Motors Corp. JPY 2,481 4,246 0.01 NGK Spark Plug Co. Ltd. JPY 754 10,485 0.02 Nissan Motor Co. Ltd. JPY 10,214 45,023 0.07 Stanley Electric Co. Ltd. JPY 535 14,057 0.02 Subaru Corp. JPY 2,689 43,751 0.07 Sumitomo Electric Industries Ltd. JPY 3,135 33,844 0.05 Sumitomo Rubber Industries Ltd. JPY 782 5,476 0.01 Toyoda Gosei Co. Ltd. JPY 285 6,734 0.01 Toyota Industries Corp. JPY 754 48,757 0.08 Toyota Motor Corp. JPY 8,860 557,539 0.87 Yamaha Motor Co. Ltd. JPY 1,200 19,938 0.03 Yokohama Rubber Co. Ltd. (The) JPY 535 6,483 0.01
1,220,989 1.91
netherlandsBasic-Fit NV, Reg. S EUR 1,507 45,210 0.07 Koninklijke Vopak NV EUR 288 12,381 0.02
57,591 0.09
norwayEquinor ASA NOK 1,639 22,454 0.04
22,454 0.04
PeruCia de Minas Buenaventura SAA, ADR USD 2,496 24,371 0.04
24,371 0.04
PortugalGalp Energia SGPS SA EUR 1,010 8,842 0.01
8,842 0.01
RussiaGazprom PJSC, ADR USD 8,449 38,521 0.06 LUKOIL PJSC, ADR USD 707 39,299 0.06 Novatek PJSC, Reg. S, GDR USD 100 13,318 0.02 Rosneft Oil Co. PJSC, Reg. S, GDR USD 2,314 10,637 0.02 Tatneft PJSC, ADR USD 301 10,009 0.02
111,784 0.18
schEDUlE of InVEsTmEnTsAs at 31 December 2020
Investments Currency
Quantity/ Nominal
Value
Market Value EUR
% of Net Assets
Transferable securities and money market instruments admitted to official exchange listing or dealt in on another regulated market
Equities (continued)
south africaAngloGold Ashanti Ltd., ADR USD 4,066 74,994 0.12 DRDGOLD Ltd. USD 929 8,655 0.01 Gold Fields Ltd., ADR USD 8,427 63,326 0.10 Harmony Gold Mining Co. Ltd., ADR USD 5,807 22,292 0.03
169,267 0.26
spainMelia Hotels International SA EUR 7,686 43,964 0.07 Repsol SA EUR 2,383 19,660 0.03
63,624 0.10
swedenLundin Energy AB SEK 350 7,690 0.01
7,690 0.01
TurkeyEldorado Gold Corp. USD 1,636 17,681 0.03
17,681 0.03
United KingdomBP plc GBP 24,954 70,786 0.11 Centamin plc GBP 11,165 15,376 0.02 InterContinental Hotels Group plc GBP 4,841 252,763 0.40 Royal Dutch Shell plc ‘A’ GBP 5,048 72,934 0.11 Royal Dutch Shell plc ‘B’ GBP 4,515 63,303 0.10 Whitbread plc GBP 4,678 161,446 0.25
636,608 0.99
United states of americaAlaska Air Group, Inc. USD 1,250 52,937 0.08 Allegiant Travel Co. USD 135 20,407 0.03 American Airlines Group, Inc. USD 6,015 76,797 0.12 Aptiv plc USD 1,200 127,263 0.20 Autoliv, Inc. USD 285 21,596 0.03 Baker Hughes Co. USD 800 13,693 0.02 BorgWarner, Inc. USD 820 25,851 0.04 Cabot Oil & Gas Corp. USD 600 7,947 0.01 Cheniere Energy, Inc. USD 500 24,932 0.04 Chevron Corp. USD 2,300 158,571 0.25 Choice Hotels International, Inc. USD 1,420 120,538 0.19 Coeur Mining, Inc. USD 2,454 20,281 0.03 Concho Resources, Inc. USD 100 4,721 0.01 ConocoPhillips USD 1,400 45,380 0.07 Delta Air Lines, Inc. USD 5,380 175,308 0.27 Diamondback Energy, Inc. USD 100 3,981 0.01 DR Horton, Inc. USD 2,777 156,669 0.25 Eagle Materials, Inc. USD 199 16,407 0.03 Empire State Realty Trust, Inc., REIT ‘A’ USD 12,645 94,301 0.15 EOG Resources, Inc. USD 600 24,255 0.04 Extended Stay America, Inc. USD 4,624 54,571 0.09 Exxon Mobil Corp. USD 5,300 178,922 0.28 Fidelity National Financial, Inc. USD 2,059 65,096 0.10 First American Financial Corp. USD 700 29,034 0.05 Ford Motor Co. USD 16,400 117,626 0.18 General Motors Co. USD 5,540 186,662 0.29 Halliburton Co. USD 800 12,349 0.02 Hecla Mining Co. USD 4,963 25,848 0.04 Hess Corp. USD 200 8,633 0.01

Morgan Stanley Investment Funds 31 December 2020 354
The accompanying notes are an integral part of these financial statements.
Global Multi-Asset Opportunities Fund (continued)
schEDUlE of InVEsTmEnTsAs at 31 December 2020
Investments Currency
Quantity/ Nominal
Value
Market Value EUR
% of Net Assets
Transferable securities and money market instruments admitted to official exchange listing or dealt in on another regulated market
Equities (continued)
United states of america (continued)Hilton Worldwide Holdings, Inc. USD 7,499 669,870 1.05 HollyFrontier Corp. USD 100 2,114 0.00 Hyatt Hotels Corp. ‘A’ USD 3,122 185,523 0.29 JetBlue Airways Corp. USD 2,690 31,790 0.05 KB Home USD 707 19,471 0.03 Kinder Morgan, Inc. USD 2,800 30,900 0.05 Lear Corp. USD 219 28,461 0.04 Lennar Corp. ‘A’ USD 2,189 136,556 0.21 Louisiana-Pacific Corp. USD 682 20,389 0.03 M/I Homes, Inc. USD 101 3,682 0.01 Marathon Petroleum Corp. USD 600 20,246 0.03 Marriott International, Inc. ‘A’ USD 9,315 982,412 1.53 Marriott Vacations Worldwide Corp. USD 943 104,519 0.16 Martin Marietta Materials, Inc. USD 483 110,292 0.17 Masco Corp. USD 2,052 90,580 0.14 MDC Holdings, Inc. USD 468 18,671 0.03 Meritage Homes Corp. USD 205 14,110 0.02 MGIC Investment Corp. USD 2,653 26,542 0.04 Mohawk Industries, Inc. USD 532 60,981 0.10 National Oilwell Varco, Inc. USD 200 2,236 0.00 Newmont Corp. USD 5,424 263,212 0.41 NVR, Inc. USD 16 53,336 0.08 Occidental Petroleum Corp. USD 1,000 14,434 0.02 ONEOK, Inc. USD 500 15,376 0.02 Owens Corning USD 715 44,062 0.07 Paramount Group, Inc., REIT USD 16,528 119,352 0.19 Phillips 66 USD 500 28,620 0.05 Pioneer Natural Resources Co. USD 100 9,212 0.01 PulteGroup, Inc. USD 1,996 70,327 0.11 Royal Gold, Inc. USD 545 47,480 0.07 Schlumberger Ltd. USD 1,300 23,013 0.04 Scotts Miracle-Gro Co. (The) USD 451 71,498 0.11 Skyline Champion Corp. USD 456 11,559 0.02 SL Green Realty Corp., REIT USD 5,311 249,634 0.39 Southwest Airlines Co. USD 5,405 202,554 0.32 Stewart Information Services Corp. USD 123 4,812 0.01 Toll Brothers, Inc. USD 936 33,460 0.05 UFP Industries, Inc. USD 467 20,778 0.03 United Airlines Holdings, Inc. USD 3,832 136,859 0.21 Valero Energy Corp. USD 500 22,923 0.04 Vornado Realty Trust, REIT USD 14,189 415,745 0.65 Vulcan Materials Co. USD 1,099 130,211 0.20 Watsco, Inc. USD 151 27,814 0.04 Williams Cos., Inc. (The) USD 1,600 25,964 0.04 Wyndham Hotels & Resorts, Inc. USD 2,250 105,940 0.17
6,578,096 10.26
Total Equities 12,530,047 19.55
Total Transferable securities and money market instruments admitted to official exchange listing or dealt in on another regulated market 50,264,729 78.41
schEDUlE of InVEsTmEnTsAs at 31 December 2020
Investments Currency
Quantity/ Nominal
Value
Market Value EUR
% of Net Assets
Other transferable securities and money market instruments not admitted to official exchange listing or dealt in on another regulated market
Equities
chinaChina Common Rich Renewable Energy
Investments Ltd.* HKD 2,648,000 0 0.00
0 0.00
Total Equities 0 0.00
Total other transferable securities and money market instruments not admitted to official exchange listing or dealt in on another regulated market 0 0.00
Units of authorised UCITS or other collective investment undertakings
collective Investment schemes – UcITs
luxembourgMorgan Stanley Liquidity Funds Euro
Liquidity Fund – MS Reserve† EUR 945,416 945,416 1.48
945,416 1.48
Total collective Investment schemes – UcITs 945,416 1.48
Total Units of authorised UcITs or other collective investment undertakings 945,416 1.48
Total Investments 51,210,145 79.89
cash 9,679,799 15.10
other assets/(liabilities) 3,214,099 5.01
Total net assets 64,104,043 100.00
* Security is valued at its fair value under the direction of the Board of Directors.** All or a portion of the security has been pledged as collateral in respect of financial derivative
instruments.† Managed by an affiliate of the Investment Adviser.The country disclosed within the Schedule of Investments refers to the country of risk. The country of incorporation may differ.

355 Morgan Stanley Investment Funds 31 December 2020
The accompanying notes are an integral part of these financial statements.
Global Multi-Asset Opportunities Fund (continued)
forward currency Exchange contracts (continued)
currency Purchased
amount Purchased
currency sold
amount sold
maturity Date counterparty
Unrealised Gain/(loss)
EUR
% of net assets
GBP hedged share classGBP 52,644,000 EUR 58,132,524 08/01/2021 J.P. Morgan 472,226 0.74
Unrealised Gain on naV hedged share classes forward currency Exchange contracts – assets 472,226 0.74
UsD hedged share classEUR 8,600 USD 10,524 08/01/2021 J.P. Morgan 23 0.00
Unrealised Gain on naV hedged share classes forward currency Exchange contracts – assets 23 0.00
Total Unrealised Gain on forward currency Exchange contracts – assets 1,350,904 2.11
BRL 27,803,128 USD 5,473,380 18/03/2021 Goldman Sachs (104,465) (0.16) CLP 29,285,412 USD 41,247 18/03/2021 Goldman Sachs (42) 0.00EUR 305,149 USD 375,457 18/03/2021 UBS (363) 0.00HKD 1,719,782 USD 221,873 18/03/2021 BNP Paribas (25) 0.00HKD 529,216 USD 68,278 18/03/2021 Goldman Sachs (10) 0.00HKD 435,886 USD 56,232 18/03/2021 UBS (4) 0.00TRY 33,276,978 USD 4,391,799 18/03/2021 UBS (27,728) (0.04) USD 199,065 BRL 1,036,255 18/03/2021 Goldman Sachs (121) 0.00USD 62,806 CAD 79,940 18/03/2021 BNP Paribas (26) 0.00USD 542,247 CLP 398,025,277 18/03/2021 Goldman Sachs (14,366) (0.02) USD 3,261 CNH 21,405 18/03/2021 Bank of America (12) 0.00USD 543,685 COP 1,875,713,871 18/03/2021 Barclays (3,954) (0.01) USD 967,002 CZK 20,926,690 18/03/2021 Citigroup (9,742) (0.02) USD 11,552 DKK 70,589 18/03/2021 UBS (87) 0.00USD 1,658,457 EUR 1,354,561 18/03/2021 Barclays (5,060) (0.01) USD 2,629,739 EUR 2,146,750 18/03/2021 BNP Paribas (6,908) (0.01) USD 2,742,214 EUR 2,243,125 18/03/2021 Goldman Sachs (11,761) (0.02) USD 6,036,239 EUR 4,919,059 18/03/2021 UBS (7,317) (0.01) USD 538,093 INR 40,033,425 18/03/2021 BNP Paribas (4,586) (0.01) USD 855,203 JPY 88,356,765 18/03/2021 BNP Paribas (2,392) 0.00USD 439,090 JPY 45,485,909 18/03/2021 Goldman Sachs (2,181) 0.00USD 294,280 JPY 30,484,966 18/03/2021 J.P. Morgan (1,463) 0.00USD 438,272 JPY 45,402,141 18/03/2021 UBS (2,185) 0.00USD 1,090,645 MXN 22,092,829 18/03/2021 UBS (10,063) (0.02) USD 8,583 NOK 74,958 18/03/2021 UBS (163) 0.00USD 130,456 RUB 9,782,889 18/03/2021 BNP Paribas (501) 0.00USD 4,908 SGD 6,543 18/03/2021 Barclays (38) 0.00USD 42,477 SGD 56,626 18/03/2021 BNP Paribas (324) 0.00USD 474,604 SGD 632,755 18/03/2021 UBS (3,661) (0.01) USD 5,855 THB 175,791 18/03/2021 Citigroup (14) 0.00USD 81,006 TRY 659,364 18/03/2021 BNP Paribas (4,345) (0.01) USD 409,060 TRY 3,326,865 18/03/2021 UBS (21,648) (0.03) USD 9,577 TWD 266,175 18/03/2021 BNP Paribas (8) 0.00USD 358,151 ZAR 5,395,113 18/03/2021 Goldman Sachs (5,456) (0.01) USD 655,840 ZAR 9,881,240 18/03/2021 UBS (10,089) (0.02) ZAR 1,036,073 USD 70,197 18/03/2021 UBS (106) 0.00USD 419,281 CNH 2,899,303 12/08/2021 J.P. Morgan (16,651) (0.03)
Unrealised loss on forward currency Exchange contracts – liabilities (277,865) (0.44)
financial futures contracts
security Descriptionnumber
of contracts currency
Global Exposure
EUR
Unrealised Gain/(loss)
EUR
% of net assets
BIST 30 Index, 26/02/2021 658 TRY 1,203,514 24,696 0.04 EURO STOXX 50 Index, 16/12/2022 68 EUR 659,600 129,727 0.20 US 5 Year Note, 31/03/2021 105 USD 10,794,958 34,819 0.05 US 10 Year Note, 22/03/2021 66 USD 7,423,346 34,498 0.05 US Ultra Bond, 22/03/2021 (29) USD (5,038,169) 54,348 0.09
Total Unrealised Gain on financial futures contracts 278,088 0.43
Euro-BTP, 08/03/2021 (28) EUR (4,256,280) (18,600) (0.03) EURO STOXX 50 Index, 19/03/2021 (64) EUR (2,272,000) (35,307) (0.06) MSCI Emerging Markets Index, 19/03/2021 (16) USD (839,226) (20,020) (0.03) S&P 500 Emini Index, 19/03/2021 (62) USD (9,403,414) (116,017) (0.18) US 10 Year Ultra Bond, 22/03/2021 (74) USD (9,423,851) (47,736) (0.07) Yen Denominated Nikkei 225 Index, 11/03/2021 (12) JPY (1,303,127) (25,155) (0.04)
Total Unrealised loss on financial futures contracts (262,835) (0.41)
net Unrealised Gain on financial futures contracts 15,253 0.02
forward currency Exchange contracts (continued)
currency Purchased
amount Purchased
currency sold
amount sold
maturity Date counterparty
Unrealised Gain/(loss)
EUR
% of net assets
AUD 4,338 USD 3,273 18/03/2021 BNP Paribas 67 0.00AUD 5,050 USD 3,811 18/03/2021 UBS 78 0.00CHF 263,788 USD 298,504 18/03/2021 BNP Paribas 1,401 0.00CHF 736,999 USD 834,056 18/03/2021 UBS 3,864 0.01 EUR 6,658,408 USD 8,110,939 18/03/2021 Bank of America 58,464 0.09 EUR 624,845 USD 761,138 18/03/2021 Bank of Montreal 5,500 0.01 EUR 5,316,508 USD 6,476,097 18/03/2021 Barclays 46,849 0.07 EUR 6,574,896 USD 8,009,833 18/03/2021 BNP Paribas 57,223 0.09 EUR 55,416 USD 67,504 18/03/2021 BNY Mellon 488 0.00EUR 1,458,227 USD 1,776,296 18/03/2021 Citigroup 12,839 0.02 EUR 412,876 USD 502,951 18/03/2021 Commonwealth
Bank of Australia 3,620 0.01 EUR 17,294,361 USD 21,069,603 18/03/2021 Goldman Sachs 149,836 0.23 EUR 16,884,637 USD 20,605,160 18/03/2021 J.P. Morgan 118,033 0.19 EUR 1,069,509 USD 1,302,800 18/03/2021 State Street 9,409 0.02 EUR 1,588,095 USD 1,946,063 18/03/2021 UBS 4,566 0.01 GBP 722,818 USD 969,348 18/03/2021 BNP Paribas 14,981 0.02 GBP 64,639 USD 86,689 18/03/2021 UBS 1,337 0.00IDR 10,095,508 USD 709 18/03/2021 BNP Paribas 10 0.00JPY 79,917,760 USD 773,594 18/03/2021 BNP Paribas 2,105 0.00JPY 43,324,927 USD 419,880 18/03/2021 UBS 734 0.00NZD 10,001 USD 7,078 18/03/2021 Commonwealth
Bank of Australia 125 0.00USD 4,444,129 BRL 22,985,035 18/03/2021 Goldman Sachs 20,654 0.03 USD 178,575 EUR 145,104 18/03/2021 BNP Paribas 204 0.00USD 11,258,317 EUR 9,146,329 18/03/2021 UBS 14,664 0.02 USD 535,430 HUF 156,685,231 18/03/2021 UBS 5,586 0.01 USD 551,067 KRW 599,568,681 18/03/2021 BNP Paribas 1,297 0.00USD 12,314 PLN 44,943 18/03/2021 Bank of America 178 0.00USD 404,580 RUB 29,859,419 18/03/2021 BNP Paribas 3,679 0.01 USD 68,517 TRY 520,535 18/03/2021 UBS 286 0.00USD 23,691 TWD 655,104 18/03/2021 BNP Paribas 79 0.00CNH 52,030,616 USD 7,472,986 12/08/2021 J.P. Morgan 340,499 0.53
Unrealised Gain on forward currency Exchange contracts – assets 878,655 1.37
DERIVaTIVEs (continued)
Over-the-counter (OTC) and exchange traded derivatives as at 31 December 2020, expressed in Euro.
DERIVaTIVEs
Over-the-counter (OTC) and exchange traded derivatives as at 31 December 2020, expressed in Euro.

Morgan Stanley Investment Funds 31 December 2020 356
The accompanying notes are an integral part of these financial statements.
Global Multi-Asset Opportunities Fund (continued)
forward currency Exchange contracts (continued)
currency Purchased
amount Purchased
currency sold
amount sold
maturity Date counterparty
Unrealised Gain/(loss)
EUR
% of net assets
chf hedged share classCHF 9,193 EUR 8,536 08/01/2021 J.P. Morgan (27) 0.00
GBP hedged share classEUR 506,350 GBP 460,102 08/01/2021 J.P. Morgan (5,848) (0.01)
UsD hedged share classUSD 2,043,153 EUR 1,679,630 08/01/2021 J.P. Morgan (14,521) (0.02)
Unrealised loss on naV hedged share classes forward currency Exchange contracts – liabilities (20,396) (0.03)
Total Unrealised loss on forward currency Exchange contracts – liabilities (298,261) (0.47)
net Unrealised Gain on forward currency Exchange contracts – assets 1,052,643 1.64
Interest Rate swap contracts
nominal amount ccy counterparty
security Description
maturity Date
market Value EUR
% of net assets
13,712,000 MXN Goldman Sachs Pay floating TIIE 4 week Receive fixed 5.57% 01/11/2030 8,240 0.01
13,711,000 MXN Goldman Sachs Pay floating TIIE 4 week Receive fixed 5.585% 01/11/2030 8,912 0.01
22,403,000 MXN Goldman Sachs Pay floating TIIE 4 week Receive fixed 5.605% 01/11/2030 16,025 0.02
45,300,000 MXN Goldman Sachs Pay floating TIIE 4 week Receive fixed 5.51% 26/11/2030 17,451 0.03
26,885,000 MXN Goldman Sachs Pay floating TIIE 4 week Receive fixed 5.6% 01/11/2030 18,792 0.03
31,368,000 MXN Goldman Sachs Pay floating TIIE 4 week Receive fixed 5.61% 01/11/2030 22,950 0.04
31,368,000 MXN Goldman Sachs Pay floating TIIE 4 week Receive fixed 5.612% 01/11/2030 23,169 0.04
19,806,000 MXN Goldman Sachs Pay floating TIIE 4 week Receive fixed 5.78% 03/10/2030 25,934 0.04
22,793,000 MXN Goldman Sachs Pay floating TIIE 4 week Receive fixed 5.775% 04/10/2030 29,422 0.05
24,309,000 MXN Goldman Sachs Pay floating TIIE 4 week Receive fixed 5.773% 03/10/2030 31,238 0.05
27,245,000 MXN Goldman Sachs Pay floating TIIE 4 week Receive fixed 5.787% 03/10/2030 36,251 0.06
65,551,000 MXN Goldman Sachs Pay floating TIIE 4 week Receive fixed 5.81% 03/10/2030 92,222 0.14
Total market Value on Interest Rate swap contracts – assets 330,606 0.52
net market Value on Interest Rate swap contracts – assets 330,606 0.52
Inflation Rate swap contracts
nominal amount ccy counterparty
security Description
maturity Date
market Value EUR
% of net assets
2,010,416 USD Goldman Sachs Pay fixed 1.269% Receive floating USCPI
1 month 30/03/2030 142,165 0.22 1,029,386 USD Goldman Sachs Pay fixed 1.176%
Receive floating USCPI 1 month 31/03/2030 81,003 0.13
621,558 USD Goldman Sachs Pay fixed 1.235% Receive floating USCPI
1 month 30/03/2030 45,784 0.07 616,731 USD Goldman Sachs Pay fixed 1.298%
Receive floating USCPI 1 month 30/03/2030 42,121 0.06
1,735,000 USD Goldman Sachs Pay fixed 2.006% Receive floating USCPI
1 month 16/11/2030 28,267 0.04 483,000 USD Goldman Sachs Pay fixed 1.745%
Receive floating USCPI 1 month 30/07/2030 23,278 0.04
157,000 USD Goldman Sachs Pay fixed 1.367% Receive floating USCPI
1 month 29/05/2030 10,789 0.02 71,000 USD Goldman Sachs Pay fixed 1.311%
Receive floating USCPI 1 month 28/04/2030 4,826 0.01
950,000 USD Goldman Sachs Pay fixed 2.138% Receive floating USCPI
1 month 09/12/2030 4,232 0.01 94,000 USD Goldman Sachs Pay fixed 1.956%
Receive floating USCPI 1 month 28/08/2030 2,474 0.00
531,000 USD Goldman Sachs Pay fixed 2.183% Receive floating USCPI
1 month 23/12/2030 143 0.00
Total market Value on Inflation Rate swap contracts – assets 385,082 0.60
net market Value on Inflation Rate swap contracts – assets 385,082 0.60
DERIVaTIVEs (continued)
Over-the-counter (OTC) and exchange traded derivatives as at 31 December 2020, expressed in Euro.
DERIVaTIVEs (continued)
Over-the-counter (OTC) and exchange traded derivatives as at 31 December 2020, expressed in Euro.

357 Morgan Stanley Investment Funds 31 December 2020
The accompanying notes are an integral part of these financial statements.
Global Multi-Asset Opportunities Fund (continued)
Total Return swap contracts
nominal amount ccy security Description
maturity Date counterparty
Unrealised Gain/(loss)
EUR
% of net assets
961,416 USD Receive BNP US Banks Pay USD LIBOR 3 month + 15.00bp 14/09/2021 BNP Paribas 37,345 0.06
2,137,195 USD Receive BNP US Banks Pay USD LIBOR 3 month + 25.00bp 14/09/2021 BNP Paribas 63,751 0.10
14,239,014 USD Receive JPM SPX500 Value Pay USD LIBOR 3 month + 20.00bp 12/05/2021 J.P. Morgan 112,755 0.18
7,888,357 USD Receive JPM SPX1500 Value Pay USD LIBOR 3 month + 20.00bp 12/05/2021 J.P. Morgan 51,453 0.08
Total Unrealised Gain on Total Return swap contracts 265,304 0.42
10,539,628 USD Pay JPM SPX500 Anti Value Receive USD LIBOR 3 month + 20.00bp 12/05/2021 J.P. Morgan (264,373) (0.41)
5,673,400 USD Pay JPM SPX500 Low Volatility Receive USD LIBOR 3 month + 20.00bp 12/05/2021 J.P. Morgan (48,072) (0.07)
2,125,581 USD Receive JPM SPX500 Value Pay USD LIBOR 3 month + 20.00bp 12/05/2021 J.P. Morgan (24,846) (0.04)
7,833,915 USD Pay JPM SPX1500 Low Volatility Receive USD LIBOR 3 month + 20.00bp 12/05/2021 J.P. Morgan (62,182) (0.10)
3,433,043 USD Pay JPM SPX1500 Anti Value Receive USD LIBOR 3 month + 20.00bp 12/05/2021 J.P. Morgan (88,022) (0.14)
3,531,375 USD Receive JPM SPX1500 Value Pay USD LIBOR 3 month + 20.00bp 12/05/2021 J.P. Morgan (4,021) (0.01)
Total Unrealised loss on Total Return swap contracts (491,516) (0.77)
net Unrealised loss on Total Return swap contracts (226,212) (0.35)
Geographic Distribution based on Economic Exposure of Total Return swap contracts
country currency
Unrealised Gain/(loss)
EUR
% of net assets
United States of America USD (187,596) (0.29)Jersey RUB (323) 0.00Bermuda HKD (823) 0.00Ireland EUR (3,425) (0.01)Netherlands EUR (6,947) (0.01)United Kingdom of Great Britain USD (634) 0.00Cayman Islands HKD (481) 0.00Marshall Islands USD (184) 0.00Switzerland USD (495) 0.00France EUR (7,550) (0.01)Germany EUR (11,149) (0.02)Spain EUR (1,977) 0.00Italy EUR (1,880) 0.00Belgium EUR (2,124) 0.00Luxembourg EUR (624) 0.00
(226,212) (0.35)
Collateral received and paid by the Fund in respect of financial derivative instruments:
Type of collateral counterparty currency amount received amount paid
Global multi-asset opportunities fund
Cash BNP Paribas EUR 270,000 –Goldman Sachs EUR 379,370 –
Non Cash Goldman Sachs EUR – 460,000Cash J.P. Morgan EUR 150,000 –
799,370 460,000
DERIVaTIVEs (continued)
Over-the-counter (OTC) and exchange traded derivatives as at 31 December 2020, expressed in Euro.
DERIVaTIVEs (continued)

Morgan Stanley Investment Funds 31 December 2020 358
The accompanying notes are an integral part of these financial statements.
Please refer to the full prospectus for the Fund’s investment objective and policy.
Multi-Asset Risk Control Fund
InVEsTmEnT aIm
To provide an attractive level of total return, measured in USD, through investing primarily in a portfolio of transferable securities and money market instruments globally and through the use of financial derivative instruments. The Fund will implement top-down, tactical views on global asset classes across (1) equity including closed-end Real Estate Investment Trusts (REITS); (2) Fixed Income Securities; and (3) cash and money market instruments.
schEDUlE of InVEsTmEnTsAs at 31 December 2020
Investments Currency
Quantity/ Nominal
Value
Market Value USD
% of Net Assets
Transferable securities and money market instruments admitted to official exchange listing or dealt in on another regulated market
Government Bonds
franceFrance Government Bond OAT, Reg. S
0.5% 25/05/2026 EUR 148,000 192,894 1.85 France Government Bond OAT, Reg. S
2.5% 25/05/2030 EUR 170,000 266,488 2.55
459,382 4.40
GermanyBundesrepublik Deutschland, Reg. S 0.5%
15/02/2026 EUR 237,000 309,766 2.97 Bundesrepublik Deutschland, Reg. S 4.75%
04/07/2034 EUR 32,000 68,165 0.65
377,931 3.62
ItalyItaly Buoni Poliennali Del Tesoro 3.75%
01/03/2021 EUR 23,000 28,412 0.27 Italy Buoni Poliennali Del Tesoro, Reg. S,
144A 4.5% 01/03/2026 EUR 28,000 42,376 0.40 Italy Buoni Poliennali Del Tesoro, Reg. S,
144A 3.5% 01/03/2030 EUR 90,000 140,833 1.35
211,621 2.02
JapanJapan Government Ten Year Bond 0.1%
20/03/2028 JPY 2,050,000 20,158 0.20 Japan Government Twenty Year Bond 2.1%
20/03/2030 JPY 17,150,000 198,773 1.90 Japan Government Twenty Year Bond 1.7%
20/06/2033 JPY 22,500,000 260,480 2.49
479,411 4.59
spainSpain Government Bond, Reg. S, 144A
4.4% 31/10/2023 EUR 58,000 81,246 0.78 Spain Government Bond, Reg. S, 144A
1.95% 30/04/2026 EUR 48,000 66,378 0.63 Spain Government Bond, Reg. S, 144A
1.95% 30/07/2030 EUR 83,000 120,838 1.16
268,462 2.57
United KingdomUK Treasury, Reg. S 4.75% 07/12/2030 GBP 4,000 7,909 0.08 UK Treasury, Reg. S 4.75% 07/12/2038 GBP 54,000 126,553 1.21
134,462 1.29
United states of americaUS Treasury 1.625% 31/08/2022 USD 156,000 159,903 1.53 US Treasury 7.125% 15/02/2023 USD 319,000 366,277 3.51 US Treasury 2.5% 31/01/2024 USD 572,000 612,867 5.87 US Treasury 1.625% 15/05/2026 USD 658,000 700,487 6.70 US Treasury 2.75% 15/02/2028 USD 578,000 662,634 6.34 US Treasury 2.625% 15/02/2029 USD 227,000 260,438 2.49 US Treasury 4.5% 15/02/2036 USD 425,000 623,040 5.96
3,385,646 32.40
Total Government Bonds 5,316,915 50.89

359 Morgan Stanley Investment Funds 31 December 2020
The accompanying notes are an integral part of these financial statements.
Multi-Asset Risk Control Fund (continued)
schEDUlE of InVEsTmEnTsAs at 31 December 2020
Investments Currency
Quantity/ Nominal
Value
Market Value USD
% of Net Assets
Transferable securities and money market instruments admitted to official exchange listing or dealt in on another regulated market
Warrants
switzerlandCie Financiere Richemont SA 22/11/2023 CHF 132 35 0.00
35 0.00
Total Warrants 35 0.00
Equities
argentinaGlobant SA USD 10 2,157 0.02
2,157 0.02
austriaErste Group Bank AG EUR 61 1,879 0.02 OMV AG EUR 181 7,219 0.07 Verbund AG EUR 37 3,153 0.03
12,251 0.12
BelgiumKBC Group NV EUR 8 562 0.00 UCB SA EUR 29 3,006 0.03
3,568 0.03
BrazilAtacadao SA BRL 400 1,490 0.01 Banco Bradesco SA BRL 1,300 6,040 0.06 Banco Bradesco SA Preference BRL 220 1,147 0.01 Banco do Brasil SA BRL 100 749 0.01 Banco Santander Brasil SA BRL 700 6,047 0.06 Cosan SA BRL 100 1,453 0.01 Engie Brasil Energia SA BRL 100 845 0.01 Klabin SA BRL 500 2,530 0.02 Lojas Renner SA BRL 200 1,671 0.02 Via Varejo S/A BRL 700 2,168 0.02
24,140 0.23
chinaAgricultural Bank of China Ltd. ‘H’ HKD 19,000 6,959 0.07 Alibaba Group Holding Ltd., ADR USD 188 44,340 0.42 Baidu, Inc., ADR USD 28 6,077 0.06 China Construction Bank Corp. ‘H’ HKD 6,000 4,558 0.04 China Literature Ltd., Reg. S HKD 200 1,569 0.02 China Mobile Ltd. HKD 500 2,850 0.03 China Molybdenum Co. Ltd. ‘H’ HKD 12,000 7,831 0.07 China Overseas Land & Investment Ltd. HKD 500 1,087 0.01 China Petroleum & Chemical Corp. ‘H’ HKD 4,000 1,790 0.02 China Railway Signal & Communication
Corp. Ltd., Reg. S ‘H’ HKD 9,000 3,018 0.03 CITIC Securities Co. Ltd. ‘H’ HKD 500 1,127 0.01 COSCO SHIPPING Energy Transportation
Co. Ltd. ‘H’ HKD 4,000 1,573 0.02 Dongfeng Motor Group Co. Ltd. ‘H’ HKD 8,000 9,327 0.09 Fuyao Glass Industry Group Co. Ltd.,
Reg. S ‘H’ HKD 400 2,198 0.02 GDS Holdings Ltd., ADR USD 9 839 0.01 Geely Automobile Holdings Ltd. HKD 2,000 6,835 0.07 GOME Retail Holdings Ltd. HKD 10,000 1,199 0.01 JD.com, Inc., ADR USD 35 3,078 0.03
schEDUlE of InVEsTmEnTsAs at 31 December 2020
Investments Currency
Quantity/ Nominal
Value
Market Value USD
% of Net Assets
Transferable securities and money market instruments admitted to official exchange listing or dealt in on another regulated market
Equities (continued)
china (continued)Koolearn Technology Holding Ltd., Reg. S HKD 1,000 3,598 0.03 Meituan Dianping, Reg. S ‘B’ HKD 200 7,599 0.07 NetEase, Inc., ADR USD 5 478 0.00 Ping An Insurance Group Co. of China Ltd. ‘H’ HKD 2,000 24,504 0.23 Semiconductor Manufacturing International
Corp. HKD 1,000 2,850 0.03 Shanghai Pharmaceuticals Holding Co. Ltd. ‘H’ HKD 2,800 4,933 0.05 Shenzhou International Group Holdings Ltd. HKD 200 3,921 0.04 Sinopharm Group Co. Ltd. ‘H’ HKD 1,200 2,919 0.03 Tencent Holdings Ltd. HKD 400 29,095 0.28 Tongcheng-Elong Holdings Ltd., Reg. S HKD 2,000 3,869 0.04 Trip.com Group Ltd., ADR USD 112 3,724 0.04 Xinyi Solar Holdings Ltd. HKD 4,000 10,446 0.10 Yum China Holdings, Inc. USD 27 1,545 0.01 ZhongAn Online P&C Insurance Co. Ltd.,
Reg. S ‘H’ HKD 300 1,401 0.01 Zhuzhou CRRC Times Electric Co. Ltd. ‘H’ HKD 100 436 0.00
207,573 1.99
DenmarkGenmab A/S DKK 12 4,819 0.05 H Lundbeck A/S DKK 69 2,365 0.02 Novo Nordisk A/S ‘B’ DKK 321 22,335 0.21 Novozymes A/S ‘B’ DKK 53 3,029 0.03 Orsted A/S, Reg. S DKK 16 3,244 0.03 Vestas Wind Systems A/S DKK 9 2,127 0.02
37,919 0.36
finlandNeste OYJ EUR 53 3,841 0.04 Nokia OYJ EUR 647 2,497 0.02 UPM-Kymmene OYJ EUR 108 4,032 0.04
10,370 0.10
franceAirbus SE EUR 48 5,287 0.05 Alstom SA EUR 13 743 0.01 Atos SE EUR 14 1,285 0.01 AXA SA EUR 216 5,171 0.05 BNP Paribas SA EUR 130 6,875 0.07 Capgemini SE EUR 15 2,334 0.02 Carrefour SA EUR 422 7,264 0.07 Cie Generale des Etablissements Michelin SCA EUR 20 2,575 0.02 Dassault Systemes SE EUR 23 4,689 0.04 Gecina SA, REIT EUR 35 5,424 0.05 Getlink SE EUR 93 1,618 0.02 Kering SA EUR 1 729 0.01 Legrand SA EUR 27 2,418 0.02 L’Oreal SA EUR 38 14,491 0.14 LVMH Moet Hennessy Louis Vuitton SE EUR 17 10,656 0.10 Orpea SA EUR 13 1,715 0.02 Pernod Ricard SA EUR 59 11,351 0.11 Sanofi EUR 68 6,566 0.06 Schneider Electric SE EUR 40 5,806 0.06 Teleperformance EUR 4 1,332 0.01 Thales SA EUR 11 1,011 0.01 TOTAL SE EUR 284 12,300 0.12 Valeo SA EUR 136 5,386 0.05 Vinci SA EUR 37 3,694 0.04 Vivendi SA EUR 43 1,392 0.01
122,112 1.17
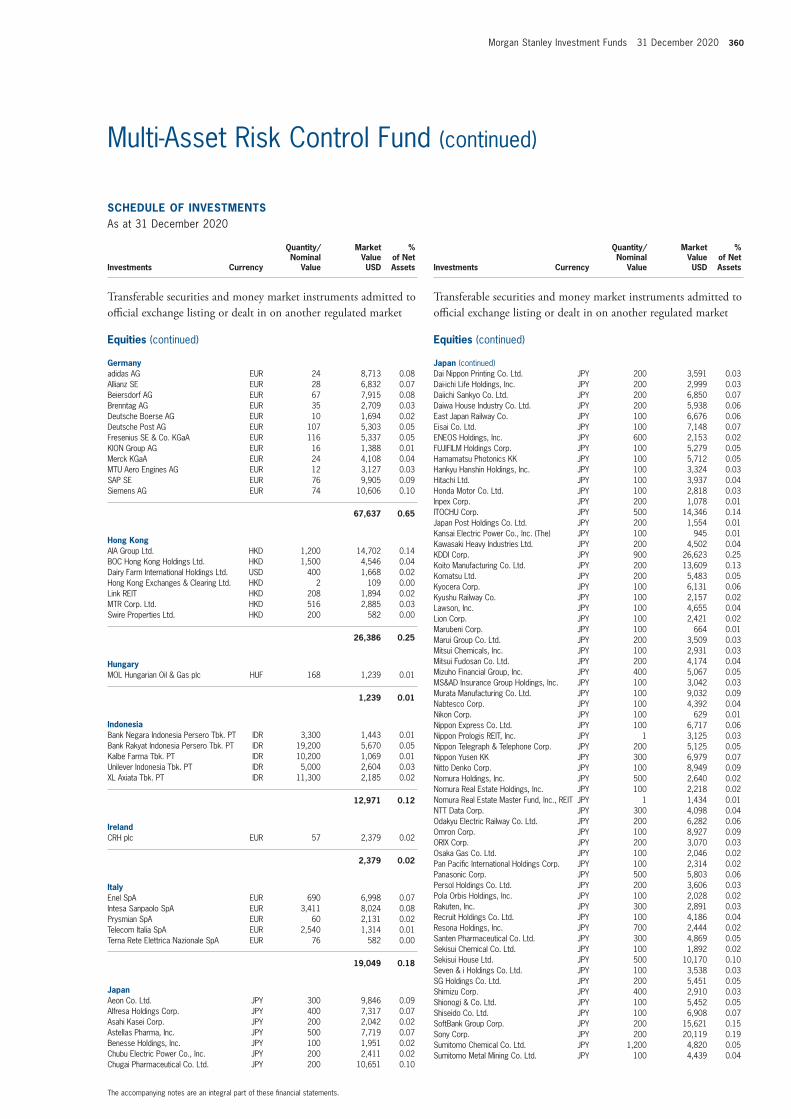
Morgan Stanley Investment Funds 31 December 2020 360
The accompanying notes are an integral part of these financial statements.
Multi-Asset Risk Control Fund (continued)
schEDUlE of InVEsTmEnTsAs at 31 December 2020
Investments Currency
Quantity/ Nominal
Value
Market Value USD
% of Net Assets
Transferable securities and money market instruments admitted to official exchange listing or dealt in on another regulated market
Equities (continued)
Germanyadidas AG EUR 24 8,713 0.08 Allianz SE EUR 28 6,832 0.07 Beiersdorf AG EUR 67 7,915 0.08 Brenntag AG EUR 35 2,709 0.03 Deutsche Boerse AG EUR 10 1,694 0.02 Deutsche Post AG EUR 107 5,303 0.05 Fresenius SE & Co. KGaA EUR 116 5,337 0.05 KION Group AG EUR 16 1,388 0.01 Merck KGaA EUR 24 4,108 0.04 MTU Aero Engines AG EUR 12 3,127 0.03 SAP SE EUR 76 9,905 0.09 Siemens AG EUR 74 10,606 0.10
67,637 0.65
hong KongAIA Group Ltd. HKD 1,200 14,702 0.14 BOC Hong Kong Holdings Ltd. HKD 1,500 4,546 0.04 Dairy Farm International Holdings Ltd. USD 400 1,668 0.02 Hong Kong Exchanges & Clearing Ltd. HKD 2 109 0.00 Link REIT HKD 208 1,894 0.02 MTR Corp. Ltd. HKD 516 2,885 0.03 Swire Properties Ltd. HKD 200 582 0.00
26,386 0.25
hungaryMOL Hungarian Oil & Gas plc HUF 168 1,239 0.01
1,239 0.01
IndonesiaBank Negara Indonesia Persero Tbk. PT IDR 3,300 1,443 0.01 Bank Rakyat Indonesia Persero Tbk. PT IDR 19,200 5,670 0.05 Kalbe Farma Tbk. PT IDR 10,200 1,069 0.01 Unilever Indonesia Tbk. PT IDR 5,000 2,604 0.03 XL Axiata Tbk. PT IDR 11,300 2,185 0.02
12,971 0.12
IrelandCRH plc EUR 57 2,379 0.02
2,379 0.02
ItalyEnel SpA EUR 690 6,998 0.07 Intesa Sanpaolo SpA EUR 3,411 8,024 0.08 Prysmian SpA EUR 60 2,131 0.02 Telecom Italia SpA EUR 2,540 1,314 0.01 Terna Rete Elettrica Nazionale SpA EUR 76 582 0.00
19,049 0.18
JapanAeon Co. Ltd. JPY 300 9,846 0.09 Alfresa Holdings Corp. JPY 400 7,317 0.07 Asahi Kasei Corp. JPY 200 2,042 0.02 Astellas Pharma, Inc. JPY 500 7,719 0.07 Benesse Holdings, Inc. JPY 100 1,951 0.02 Chubu Electric Power Co., Inc. JPY 200 2,411 0.02 Chugai Pharmaceutical Co. Ltd. JPY 200 10,651 0.10
schEDUlE of InVEsTmEnTsAs at 31 December 2020
Investments Currency
Quantity/ Nominal
Value
Market Value USD
% of Net Assets
Transferable securities and money market instruments admitted to official exchange listing or dealt in on another regulated market
Equities (continued)
Japan (continued)Dai Nippon Printing Co. Ltd. JPY 200 3,591 0.03 Dai-ichi Life Holdings, Inc. JPY 200 2,999 0.03 Daiichi Sankyo Co. Ltd. JPY 200 6,850 0.07 Daiwa House Industry Co. Ltd. JPY 200 5,938 0.06 East Japan Railway Co. JPY 100 6,676 0.06 Eisai Co. Ltd. JPY 100 7,148 0.07 ENEOS Holdings, Inc. JPY 600 2,153 0.02 FUJIFILM Holdings Corp. JPY 100 5,279 0.05 Hamamatsu Photonics KK JPY 100 5,712 0.05 Hankyu Hanshin Holdings, Inc. JPY 100 3,324 0.03 Hitachi Ltd. JPY 100 3,937 0.04 Honda Motor Co. Ltd. JPY 100 2,818 0.03 Inpex Corp. JPY 200 1,078 0.01 ITOCHU Corp. JPY 500 14,346 0.14 Japan Post Holdings Co. Ltd. JPY 200 1,554 0.01 Kansai Electric Power Co., Inc. (The) JPY 100 945 0.01 Kawasaki Heavy Industries Ltd. JPY 200 4,502 0.04 KDDI Corp. JPY 900 26,623 0.25 Koito Manufacturing Co. Ltd. JPY 200 13,609 0.13 Komatsu Ltd. JPY 200 5,483 0.05 Kyocera Corp. JPY 100 6,131 0.06 Kyushu Railway Co. JPY 100 2,157 0.02 Lawson, Inc. JPY 100 4,655 0.04 Lion Corp. JPY 100 2,421 0.02 Marubeni Corp. JPY 100 664 0.01 Marui Group Co. Ltd. JPY 200 3,509 0.03 Mitsui Chemicals, Inc. JPY 100 2,931 0.03 Mitsui Fudosan Co. Ltd. JPY 200 4,174 0.04 Mizuho Financial Group, Inc. JPY 400 5,067 0.05 MS&AD Insurance Group Holdings, Inc. JPY 100 3,042 0.03 Murata Manufacturing Co. Ltd. JPY 100 9,032 0.09 Nabtesco Corp. JPY 100 4,392 0.04 Nikon Corp. JPY 100 629 0.01 Nippon Express Co. Ltd. JPY 100 6,717 0.06 Nippon Prologis REIT, Inc. JPY 1 3,125 0.03 Nippon Telegraph & Telephone Corp. JPY 200 5,125 0.05 Nippon Yusen KK JPY 300 6,979 0.07 Nitto Denko Corp. JPY 100 8,949 0.09 Nomura Holdings, Inc. JPY 500 2,640 0.02 Nomura Real Estate Holdings, Inc. JPY 100 2,218 0.02 Nomura Real Estate Master Fund, Inc., REIT JPY 1 1,434 0.01 NTT Data Corp. JPY 300 4,098 0.04 Odakyu Electric Railway Co. Ltd. JPY 200 6,282 0.06 Omron Corp. JPY 100 8,927 0.09 ORIX Corp. JPY 200 3,070 0.03 Osaka Gas Co. Ltd. JPY 100 2,046 0.02 Pan Pacific International Holdings Corp. JPY 100 2,314 0.02 Panasonic Corp. JPY 500 5,803 0.06 Persol Holdings Co. Ltd. JPY 200 3,606 0.03 Pola Orbis Holdings, Inc. JPY 100 2,028 0.02 Rakuten, Inc. JPY 300 2,891 0.03 Recruit Holdings Co. Ltd. JPY 100 4,186 0.04 Resona Holdings, Inc. JPY 700 2,444 0.02 Santen Pharmaceutical Co. Ltd. JPY 300 4,869 0.05 Sekisui Chemical Co. Ltd. JPY 100 1,892 0.02 Sekisui House Ltd. JPY 500 10,170 0.10 Seven & i Holdings Co. Ltd. JPY 100 3,538 0.03 SG Holdings Co. Ltd. JPY 200 5,451 0.05 Shimizu Corp. JPY 400 2,910 0.03 Shionogi & Co. Ltd. JPY 100 5,452 0.05 Shiseido Co. Ltd. JPY 100 6,908 0.07 SoftBank Group Corp. JPY 200 15,621 0.15 Sony Corp. JPY 200 20,119 0.19 Sumitomo Chemical Co. Ltd. JPY 1,200 4,820 0.05 Sumitomo Metal Mining Co. Ltd. JPY 100 4,439 0.04

361 Morgan Stanley Investment Funds 31 December 2020
The accompanying notes are an integral part of these financial statements.
Multi-Asset Risk Control Fund (continued)
schEDUlE of InVEsTmEnTsAs at 31 December 2020
Investments Currency
Quantity/ Nominal
Value
Market Value USD
% of Net Assets
Transferable securities and money market instruments admitted to official exchange listing or dealt in on another regulated market
Equities (continued)
Japan (continued)Sumitomo Mitsui Financial Group, Inc. JPY 400 12,373 0.12 Sumitomo Mitsui Trust Holdings, Inc. JPY 100 3,075 0.03 Sundrug Co. Ltd. JPY 100 3,992 0.04 Sysmex Corp. JPY 100 12,014 0.11 Takeda Pharmaceutical Co. Ltd. JPY 200 7,226 0.07 Teijin Ltd. JPY 100 1,881 0.02 TIS, Inc. JPY 200 4,101 0.04 Tohoku Electric Power Co., Inc. JPY 200 1,646 0.02 Tokio Marine Holdings, Inc. JPY 100 5,139 0.05 Tokyu Corp. JPY 500 6,205 0.06 Tokyu Fudosan Holdings Corp. JPY 200 1,066 0.01 TOTO Ltd. JPY 100 6,005 0.06 Toyoda Gosei Co. Ltd. JPY 100 2,899 0.03 USS Co. Ltd. JPY 200 4,041 0.04 Yamada Holdings Co. Ltd. JPY 1,200 6,378 0.06 Yamaha Motor Co. Ltd. JPY 300 6,116 0.06 Yaskawa Electric Corp. JPY 100 4,971 0.05 Yokogawa Electric Corp. JPY 400 7,954 0.08 Z Holdings Corp. JPY 1,000 6,049 0.06
489,508 4.69
malaysiaDiGi.Com Bhd. MYR 1,100 1,132 0.01 Hartalega Holdings Bhd. MYR 500 1,509 0.02 Kuala Lumpur Kepong Bhd. MYR 200 1,177 0.01 Maxis Bhd. MYR 3,600 4,520 0.04 Petronas Dagangan Bhd. MYR 1,000 5,320 0.05 RHB Bank Bhd. MYR 7,400 10,026 0.10 Tenaga Nasional Bhd. MYR 900 2,332 0.02
26,016 0.25
mexicoCemex SAB de CV MXN 100 52 0.00 Grupo Aeroportuario del Sureste SAB
de CV ‘B’ MXN 45 728 0.01 Grupo Financiero Banorte SAB de CV ‘O’ MXN 300 1,676 0.02 Wal-Mart de Mexico SAB de CV MXN 1,500 4,350 0.04
6,806 0.07
netherlandsAkzo Nobel NV EUR 65 7,007 0.07 ASML Holding NV EUR 31 15,121 0.15 ING Groep NV EUR 266 2,494 0.02 Koninklijke Ahold Delhaize NV EUR 195 5,529 0.05 Koninklijke KPN NV EUR 1,158 3,534 0.03 NN Group NV EUR 95 4,141 0.04 Prosus NV EUR 16 1,735 0.02 Wolters Kluwer NV EUR 28 2,372 0.02
41,933 0.40
norwayEquinor ASA NOK 118 1,984 0.02 Norsk Hydro ASA NOK 318 1,479 0.01
3,463 0.03
schEDUlE of InVEsTmEnTsAs at 31 December 2020
Investments Currency
Quantity/ Nominal
Value
Market Value USD
% of Net Assets
Transferable securities and money market instruments admitted to official exchange listing or dealt in on another regulated market
Equities (continued)
PhilippinesAyala Land, Inc. PHP 1,600 1,359 0.01 GT Capital Holdings, Inc. PHP 10 122 0.00 Jollibee Foods Corp. PHP 380 1,542 0.02 SM Prime Holdings, Inc. PHP 1,400 1,120 0.01
4,143 0.04
PolandJeronimo Martins SGPS SA EUR 147 2,492 0.02 KGHM Polska Miedz SA PLN 24 1,166 0.01 Powszechny Zaklad Ubezpieczen SA PLN 211 1,818 0.02
5,476 0.05
PortugalEDP - Energias de Portugal SA EUR 1,187 7,509 0.07 Galp Energia SGPS SA EUR 347 3,727 0.04
11,236 0.11
singaporeCapitaLand Ltd. SGD 834 2,071 0.02 City Developments Ltd. SGD 100 604 0.01 Keppel Corp. Ltd. SGD 400 1,629 0.02 Oversea-Chinese Banking Corp. Ltd. SGD 204 1,554 0.01 Singapore Technologies Engineering Ltd. SGD 200 579 0.00 Singapore Telecommunications Ltd. SGD 3,700 6,471 0.06
12,908 0.12
south africaClicks Group Ltd. ZAR 162 2,794 0.03 Gold Fields Ltd. ZAR 110 1,033 0.01 Kumba Iron Ore Ltd. ZAR 99 4,208 0.04 Life Healthcare Group Holdings Ltd. ZAR 826 948 0.01 Mr Price Group Ltd. ZAR 51 594 0.01 MultiChoice Group ZAR 253 2,314 0.02 Naspers Ltd. ‘N’ ZAR 46 9,479 0.09 NEPI Rockcastle plc ZAR 150 957 0.01 Old Mutual Ltd. ZAR 3,526 2,861 0.03 Sanlam Ltd. ZAR 733 2,939 0.03 SPAR Group Ltd. (The) ZAR 163 2,109 0.02 Vodacom Group Ltd. ZAR 439 3,727 0.03 Woolworths Holdings Ltd. ZAR 217 586 0.00
34,549 0.33
south KoreaAMOREPACIFIC Group KRW 74 3,727 0.04 Celltrion, Inc. KRW 9 3,024 0.03 CJ CheilJedang Corp. KRW 9 3,146 0.03 GS Holdings Corp. KRW 165 5,686 0.05 Hankook Tire & Technology Co. Ltd. KRW 135 4,877 0.05 Hanon Systems KRW 527 7,855 0.08 Hanwha Solutions Corp. KRW 33 1,448 0.01 Hyundai Marine & Fire Insurance Co. Ltd. KRW 155 3,234 0.03 Hyundai Motor Co. KRW 8 1,408 0.01 LG Chem Ltd. KRW 5 3,778 0.04 LG Household & Health Care Ltd. KRW 2 2,975 0.03 NAVER Corp. KRW 13 3,488 0.03 Samsung Card Co. Ltd. KRW 38 1,133 0.01 Samsung Electro-Mechanics Co. Ltd. KRW 39 6,366 0.06

Morgan Stanley Investment Funds 31 December 2020 362
The accompanying notes are an integral part of these financial statements.
Multi-Asset Risk Control Fund (continued)
schEDUlE of InVEsTmEnTsAs at 31 December 2020
Investments Currency
Quantity/ Nominal
Value
Market Value USD
% of Net Assets
Transferable securities and money market instruments admitted to official exchange listing or dealt in on another regulated market
Equities (continued)
south Korea (continued)Samsung Electronics Co. Ltd. KRW 738 54,837 0.53 Samsung SDI Co. Ltd. KRW 10 5,759 0.06 Shinhan Financial Group Co. Ltd. KRW 211 6,208 0.06 SK Hynix, Inc. KRW 91 9,889 0.09 SK Telecom Co. Ltd. KRW 1 219 0.00
129,057 1.24
spainAena SME SA, Reg. S EUR 12 2,094 0.02 Amadeus IT Group SA ‘A’ EUR 72 5,261 0.05 Banco Bilbao Vizcaya Argentaria SA EUR 819 4,055 0.04 CaixaBank SA EUR 523 1,348 0.01 Iberdrola SA EUR 149 2,139 0.02 Industria de Diseno Textil SA EUR 317 10,128 0.10 Red Electrica Corp. SA EUR 278 5,722 0.06 Telefonica SA EUR 375 1,493 0.01
32,240 0.31
swedenAssa Abloy AB ‘B’ SEK 71 1,743 0.02 Atlas Copco AB ‘A’ SEK 58 2,990 0.03 Boliden AB SEK 140 4,953 0.05 Hennes & Mauritz AB ‘B’ SEK 97 2,039 0.02 Hexagon AB ‘B’ SEK 41 3,740 0.03 Husqvarna AB ‘B’ SEK 149 1,932 0.02 ICA Gruppen AB SEK 238 11,924 0.11 Investor AB ‘B’ SEK 25 1,819 0.02 Kinnevik AB ‘B’ SEK 63 3,181 0.03 SKF AB ‘B’ SEK 141 3,658 0.03 Svenska Cellulosa AB SCA ‘B’ SEK 145 2,532 0.02 Svenska Handelsbanken AB ‘A’ SEK 165 1,663 0.02 Swedbank AB ‘A’ SEK 102 1,787 0.02 Telefonaktiebolaget LM Ericsson ‘B’ SEK 251 2,990 0.03 Telia Co. AB SEK 614 2,555 0.02
49,506 0.47
switzerlandABB Ltd. CHF 62 1,733 0.02 Cie Financiere Richemont SA CHF 66 5,923 0.06 Julius Baer Group Ltd. CHF 37 2,150 0.02 Kuehne + Nagel International AG CHF 7 1,587 0.01 Novartis AG CHF 181 17,012 0.16 Roche Holding AG CHF 33 11,564 0.11 SGS SA CHF 1 3,021 0.03 Swiss Re AG CHF 38 3,570 0.03 Swisscom AG CHF 7 3,769 0.04 UBS Group AG CHF 288 4,060 0.04 Zurich Insurance Group AG CHF 8 3,375 0.03
57,764 0.55
TaiwanAcer, Inc. TWD 6,000 5,046 0.05 Cathay Financial Holding Co. Ltd. TWD 9,000 13,522 0.13 China Steel Corp. TWD 3,000 2,640 0.03 Chunghwa Telecom Co. Ltd. TWD 6,000 23,257 0.22 CTBC Financial Holding Co. Ltd. TWD 2,000 1,401 0.01 Delta Electronics, Inc. TWD 2,000 18,706 0.18
schEDUlE of InVEsTmEnTsAs at 31 December 2020
Investments Currency
Quantity/ Nominal
Value
Market Value USD
% of Net Assets
Transferable securities and money market instruments admitted to official exchange listing or dealt in on another regulated market
Equities (continued)
Taiwan (continued)Eva Airways Corp. TWD 5,000 2,338 0.02 First Financial Holding Co. Ltd. TWD 13,000 9,870 0.09 Inventec Corp. TWD 2,000 1,707 0.02 Nan Ya Plastics Corp. TWD 2,000 5,114 0.05 President Chain Store Corp. TWD 1,000 9,477 0.09 Taishin Financial Holding Co. Ltd. TWD 13,000 6,126 0.06 Taiwan Semiconductor Manufacturing
Co. Ltd. TWD 2,000 37,696 0.36 United Microelectronics Corp. TWD 2,000 3,354 0.03
140,254 1.34
ThailandAirports of Thailand PCL THB 1,300 2,700 0.03 Bangkok Dusit Medical Services PCL ‘F’ THB 13,100 9,093 0.09 Home Product Center PCL THB 11,000 5,029 0.05 IRPC PCL THB 16,100 1,999 0.02 PTT Exploration & Production PCL THB 300 984 0.01 PTT PCL THB 4,900 6,938 0.07 Siam Cement PCL (The) THB 200 2,547 0.02 Siam Commercial Bank PCL (The) THB 1,600 4,672 0.04
33,962 0.33
United Kingdom3i Group plc GBP 222 3,511 0.03 Ashtead Group plc GBP 36 1,691 0.02 AstraZeneca plc GBP 71 7,103 0.07 Aviva plc GBP 384 1,706 0.02 BAE Systems plc GBP 442 2,951 0.03 Barratt Developments plc GBP 103 943 0.01 Berkeley Group Holdings plc GBP 64 4,145 0.04 British American Tobacco plc GBP 2 74 0.00 British Land Co. plc (The), REIT GBP 263 1,757 0.02 BT Group plc GBP 1,106 1,998 0.02 Burberry Group plc GBP 101 2,469 0.02 Compass Group plc GBP 161 2,997 0.03 Croda International plc GBP 75 6,757 0.06 Diageo plc GBP 340 13,366 0.13 Ferguson plc GBP 25 3,034 0.03 GlaxoSmithKline plc GBP 314 5,756 0.05 HSBC Holdings plc GBP 1,175 6,080 0.06 Informa plc GBP 280 2,100 0.02 J Sainsbury plc GBP 947 2,917 0.03 Johnson Matthey plc GBP 104 3,445 0.03 Kingfisher plc GBP 950 3,509 0.03 Legal & General Group plc GBP 637 2,316 0.02 Mondi plc GBP 105 2,466 0.02 Natwest Group plc GBP 1,959 4,486 0.04 Prudential plc GBP 161 2,962 0.03 RELX plc GBP 261 6,390 0.06 Rio Tinto plc GBP 78 5,828 0.06 Rolls-Royce Holdings plc GBP 1,465 2,226 0.02 St James’s Place plc GBP 119 1,842 0.02 Standard Chartered plc GBP 483 3,074 0.03 Taylor Wimpey plc GBP 1,059 2,398 0.02 Tesco plc GBP 3,595 11,363 0.11 United Utilities Group plc GBP 154 1,883 0.02 Vodafone Group plc GBP 1,599 2,642 0.03
128,185 1.23

363 Morgan Stanley Investment Funds 31 December 2020
The accompanying notes are an integral part of these financial statements.
Multi-Asset Risk Control Fund (continued)
schEDUlE of InVEsTmEnTsAs at 31 December 2020
Investments Currency
Quantity/ Nominal
Value
Market Value USD
% of Net Assets
Transferable securities and money market instruments admitted to official exchange listing or dealt in on another regulated market
Equities (continued)
United states of americaAbbVie, Inc. USD 45 4,752 0.05 Accenture plc ‘A’ USD 22 5,691 0.05 Adobe, Inc. USD 7 3,495 0.03 Agilent Technologies, Inc. USD 35 4,112 0.04 Alexandria Real Estate Equities, Inc., REIT USD 8 1,403 0.01 Alliant Energy Corp. USD 31 1,581 0.02 Allstate Corp. (The) USD 25 2,710 0.03 Alphabet, Inc. ‘A’ USD 18 31,443 0.30 Amazon.com, Inc. USD 8 26,178 0.25 American Express Co. USD 41 4,902 0.05 American Tower Corp., REIT USD 11 2,435 0.02 Amgen, Inc. USD 47 10,623 0.10 Amphenol Corp. ‘A’ USD 32 4,154 0.04 Anthem, Inc. USD 11 3,469 0.03 Apple, Inc. USD 366 48,839 0.47 Applied Materials, Inc. USD 66 5,645 0.05 Archer-Daniels-Midland Co. USD 29 1,448 0.01 AT&T, Inc. USD 162 4,606 0.04 Autodesk, Inc. USD 15 4,541 0.04 Ball Corp. USD 16 1,477 0.01 Bank of America Corp. USD 29 869 0.01 Becton Dickinson and Co. USD 17 4,215 0.04 Best Buy Co., Inc. USD 53 5,348 0.05 Biogen, Inc. USD 7 1,689 0.02 BlackRock, Inc. USD 6 4,263 0.04 Booking Holdings, Inc. USD 2 4,415 0.04 Bristol-Myers Squibb Co. USD 52 3,182 0.03 Broadcom, Inc. USD 5 2,174 0.02 Cardinal Health, Inc. USD 72 3,803 0.04 Cerner Corp. USD 86 6,683 0.06 Chevron Corp. USD 46 3,891 0.04 Chipotle Mexican Grill, Inc. USD 1 1,384 0.01 Chubb Ltd. USD 26 3,929 0.04 Cigna Corp. USD 34 6,943 0.07 Cincinnati Financial Corp. USD 23 1,972 0.02 Cintas Corp. USD 4 1,400 0.01 Cisco Systems, Inc. USD 171 7,567 0.07 Citigroup, Inc. USD 127 7,700 0.07 Citrix Systems, Inc. USD 14 1,799 0.02 Clorox Co. (The) USD 9 1,809 0.02 CMS Energy Corp. USD 17 1,023 0.01 Coca-Cola Co. (The) USD 103 5,616 0.05 Cognizant Technology Solutions Corp. ‘A’ USD 29 2,349 0.02 Colgate-Palmolive Co. USD 66 5,601 0.05 Comcast Corp. ‘A’ USD 145 7,546 0.07 ConocoPhillips USD 70 2,784 0.03 Consolidated Edison, Inc. USD 18 1,285 0.01 Copart, Inc. USD 14 1,771 0.02 Crown Castle International Corp., REIT USD 10 1,567 0.02 Deere & Co. USD 4 1,068 0.01 Discovery, Inc. ‘C’ USD 103 2,673 0.03 Dominion Energy, Inc. USD 24 1,781 0.02 DuPont de Nemours, Inc. USD 40 2,830 0.03 Eaton Corp. plc USD 7 837 0.01 eBay, Inc. USD 87 4,389 0.04 Ecolab, Inc. USD 4 867 0.01 Edison International USD 42 2,596 0.02 Edwards Lifesciences Corp. USD 81 7,258 0.07 Eli Lilly and Co. USD 38 6,346 0.06 Emerson Electric Co. USD 55 4,379 0.04 Equinix, Inc., REIT USD 2 1,406 0.01 Equity Residential, REIT USD 62 3,623 0.03 Estee Lauder Cos., Inc. (The) ‘A’ USD 12 3,162 0.03 Etsy, Inc. USD 56 9,993 0.10 Eversource Energy USD 9 772 0.01
schEDUlE of InVEsTmEnTsAs at 31 December 2020
Investments Currency
Quantity/ Nominal
Value
Market Value USD
% of Net Assets
Transferable securities and money market instruments admitted to official exchange listing or dealt in on another regulated market
Equities (continued)
United states of america (continued)Exelon Corp. USD 57 2,398 0.02 Expedia Group, Inc. USD 18 2,364 0.02 Expeditors International of Washington, Inc. USD 56 5,293 0.05 Exxon Mobil Corp. USD 134 5,550 0.05 Facebook, Inc. ‘A’ USD 49 13,462 0.13 FedEx Corp. USD 3 776 0.01 Fidelity National Information Services, Inc. USD 51 7,189 0.07 General Electric Co. USD 435 4,607 0.04 Genuine Parts Co. USD 52 5,169 0.05 Gilead Sciences, Inc. USD 84 4,785 0.05 Hasbro, Inc. USD 21 1,976 0.02 Healthpeak Properties, Inc., REIT USD 72 2,138 0.02 Henry Schein, Inc. USD 107 7,076 0.07 Hess Corp. USD 37 1,960 0.02 Hologic, Inc. USD 24 1,711 0.02 Home Depot, Inc. (The) USD 65 17,202 0.16 Honeywell International, Inc. USD 28 5,898 0.06 HP, Inc. USD 152 3,688 0.04 Humana, Inc. USD 8 3,256 0.03 IDEXX Laboratories, Inc. USD 7 3,465 0.03 IHS Markit Ltd. USD 44 3,914 0.04 Intel Corp. USD 160 7,821 0.08 International Business Machines Corp. USD 54 6,704 0.06 International Flavors & Fragrances, Inc. USD 12 1,314 0.01 Intuit, Inc. USD 18 6,814 0.07 Invesco Ltd. USD 98 1,687 0.02 Jacobs Engineering Group, Inc. USD 16 1,719 0.02 Johnson & Johnson USD 45 7,027 0.07 Johnson Controls International plc USD 83 3,831 0.04 Kellogg Co. USD 87 5,376 0.05 Kimberly-Clark Corp. USD 14 1,878 0.02 KLA Corp. USD 9 2,313 0.02 L3Harris Technologies, Inc. USD 14 2,629 0.03 Lockheed Martin Corp. USD 10 3,544 0.03 Lowe’s Cos., Inc. USD 22 3,518 0.03 Marsh & McLennan Cos., Inc. USD 101 11,669 0.11 Mastercard, Inc. ‘A’ USD 28 10,034 0.10 Merck & Co., Inc. USD 60 4,841 0.05 Mettler-Toledo International, Inc. USD 2 2,261 0.02 Microsoft Corp. USD 209 46,294 0.44 Netflix, Inc. USD 12 6,467 0.06 Newmont Corp. USD 17 1,012 0.01 NextEra Energy, Inc. USD 52 3,963 0.04 Nielsen Holdings plc USD 95 1,966 0.02 Northern Trust Corp. USD 26 2,389 0.02 NVIDIA Corp. USD 11 5,737 0.06 ONEOK, Inc. USD 32 1,207 0.01 Oracle Corp. USD 82 5,269 0.05 PayPal Holdings, Inc. USD 26 6,005 0.06 People’s United Financial, Inc. USD 106 1,355 0.01 PepsiCo, Inc. USD 115 16,941 0.16 PNC Financial Services Group, Inc. (The) USD 75 10,997 0.11 PPG Industries, Inc. USD 44 6,266 0.06 Procter & Gamble Co. (The) USD 48 6,629 0.06 Prologis, Inc., REIT USD 30 2,955 0.03 Public Service Enterprise Group, Inc. USD 34 1,954 0.02 QUALCOMM, Inc. USD 29 4,389 0.04 Quanta Services, Inc. USD 32 2,280 0.02 Raytheon Technologies Corp. USD 65 4,635 0.04 Regency Centers Corp., REIT USD 30 1,352 0.01 Robert Half International, Inc. USD 56 3,483 0.03 Rockwell Automation, Inc. USD 1 248 0.00 salesforce.com, Inc. USD 28 6,193 0.06 SBA Communications Corp., REIT ‘A’ USD 4 1,105 0.01 Schlumberger NV USD 53 1,151 0.01

Morgan Stanley Investment Funds 31 December 2020 364
The accompanying notes are an integral part of these financial statements.
Multi-Asset Risk Control Fund (continued)
schEDUlE of InVEsTmEnTsAs at 31 December 2020
Investments Currency
Quantity/ Nominal
Value
Market Value USD
% of Net Assets
Transferable securities and money market instruments admitted to official exchange listing or dealt in on another regulated market
Equities (continued)
United states of america (continued)Sherwin-Williams Co. (The) USD 6 4,349 0.04 Skyworks Solutions, Inc. USD 15 2,291 0.02 Southern Co. (The) USD 52 3,163 0.03 State Street Corp. USD 97 6,953 0.07 SVB Financial Group USD 8 3,044 0.03 Synchrony Financial USD 138 4,728 0.05 Synopsys, Inc. USD 18 4,654 0.04 Sysco Corp. USD 38 2,771 0.03 T Rowe Price Group, Inc. USD 12 1,791 0.02 Target Corp. USD 1 175 0.00 Teledyne Technologies, Inc. USD 5 1,952 0.02 Texas Instruments, Inc. USD 41 6,660 0.06 Thermo Fisher Scientific, Inc. USD 7 3,231 0.03 Tiffany & Co. USD 9 1,183 0.01 TJX Cos., Inc. (The) USD 33 2,260 0.02 T-Mobile US, Inc. USD 9 1,203 0.01 Travelers Cos., Inc. (The) USD 63 8,742 0.08 Ulta Beauty, Inc. USD 7 1,974 0.02 United Parcel Service, Inc. ‘B’ USD 4 665 0.01 United Rentals, Inc. USD 13 2,991 0.03 Verizon Communications, Inc. USD 148 8,618 0.08 Vertex Pharmaceuticals, Inc. USD 22 5,069 0.05 Visa, Inc. ‘A’ USD 55 12,054 0.12 Walgreens Boots Alliance, Inc. USD 95 3,739 0.04 Walt Disney Co. (The) USD 47 8,557 0.08 Willis Towers Watson plc USD 10 2,075 0.02 WW Grainger, Inc. USD 7 2,819 0.03 Xcel Energy, Inc. USD 43 2,835 0.03 Xilinx, Inc. USD 23 3,230 0.03 Zions Bancorp NA USD 51 2,192 0.02 Zoetis, Inc. USD 37 6,051 0.06
795,179 7.61
Total Equities 2,551,936 24.42
Total Transferable securities and money market instruments admitted to official exchange listing or dealt in on another regulated market 7,868,886 75.31
Other transferable securities and money market instruments not admitted to official exchange listing or dealt in on another regulated market
Equities
spainTelefonica SA Rights 28/12/2020* EUR 375 83 0.00
83 0.00
Total Equities 83 0.00
Total other transferable securities and money market instruments not admitted to official exchange listing or dealt in on another regulated market 83 0.00
schEDUlE of InVEsTmEnTsAs at 31 December 2020
Investments Currency
Quantity/ Nominal
Value
Market Value USD
% of Net Assets
Units of authorised UCITS or other collective investment undertakings
Exchange Traded funds
franceAmundi Index Solutions Msci EM Latin
America UCITS ETF – Eur Class A USD 11,489 164,611 1.58
164,611 1.58
GermanyXtrackers DAX UCITS ETF EUR 679 108,923 1.04
108,923 1.04
ItalyiShares J.P. Morgan EM Local Government
Bond UCITS ETF GBP 2,553 154,083 1.47
154,083 1.47
switzerlandiShares Global Clean Energy UCITS ETF USD 15,268 248,302 2.38
248,302 2.38
United KingdomInvesco Physical Gold ETC – Class A USD USD 870 159,601 1.53 iShares J.P. Morgan USD EM Bond
UCITS ETF GBP 457 52,882 0.51 iShares JP Morgan USD EM Corp Bond
UCITS ETF USD 25,000 153,575 1.47 iShares MSCI China A UCITS ETF USD 8,567 53,844 0.51 WisdomTree Industrial Metals Enhanced
UCITS ETF USD 4,000 110,220 1.05 Xtrackers MSCI World Financials UCITS ETF USD 3,877 77,249 0.74
607,371 5.81
Total Exchange Traded funds 1,283,290 12.28
Total Units of authorised UcITs or other collective investment undertakings 1,283,290 12.28
Total Investments 9,152,259 87.59
cash 1,162,493 11.13
other assets/(liabilities) 134,152 1.28
Total net assets 10,448,904 100.00
* Security is valued at its fair value under the direction of the Board of Directors.The country disclosed within the Schedule of Investments refers to the country of risk. The country of incorporation may differ.

365 Morgan Stanley Investment Funds 31 December 2020
The accompanying notes are an integral part of these financial statements.
Multi-Asset Risk Control Fund (continued)
financial futures contracts
security Descriptionnumber
of contracts currency
Global Exposure
UsD
Unrealised Gain/(loss)
UsD
% of net assets
EURO STOXX 50 Index, 19/03/2021 7 EUR 304,895 3,949 0.04 Russell 2000 Emini Index, 19/03/2021 1 USD 98,035 2,522 0.03 S&P 500 Emini Index, 19/03/2021 2 USD 372,175 6,663 0.06 Yen Denominated Nikkei 225 Index, 11/03/2021 1 JPY 133,238 3,529 0.03
Total Unrealised Gain on financial futures contracts 16,663 0.16
MSCI Emerging Markets Index, 19/03/2021 (2) USD (128,710) (3,253) (0.03)
Total Unrealised loss on financial futures contracts (3,253) (0.03)
net Unrealised Gain on financial futures contracts 13,410 0.13
forward currency Exchange contracts
currency Purchased
amount Purchased
currency sold
amount sold
maturity Date counterparty
Unrealised Gain/(loss)
UsD
% of net assets
EUR 102,000 USD 123,758 25/01/2021 ANZ 1,453 0.01
Unrealised Gain on forward currency Exchange contracts – assets 1,453 0.01
Total Unrealised Gain on forward currency Exchange contracts – assets 1,453 0.01
USD 490,524 EUR 413,000 25/01/2021 ANZ (16,456) (0.15) USD 489,141 JPY 50,800,000 25/01/2021 ANZ (3,959) (0.04)
Unrealised loss on forward currency Exchange contracts – liabilities (20,415) (0.19)
Total Unrealised loss on forward currency Exchange contracts – liabilities (20,415) (0.19)
net Unrealised loss on forward currency Exchange contracts – liabilities (18,962) (0.18)
credit Default swap contracts
nominal amount ccy counterparty
Reference Entity
Buy/ sell
Interest (Paid)/
Received Rate
maturity Date
market Value UsD
% of net assets
600,000 USD Barclays CDX.NA.EM. 32-V3 Sell 1.00% 20/12/2024 2,468 0.02 475,000 USD Goldman Sachs CDX.NA.HY. 33-V12 Sell 5.00% 20/12/2024 39,255 0.38 125,000 USD Goldman Sachs CDX.NA.HY. 35-V1 Sell 5.00% 20/12/2025 11,653 0.11 750,000 USD Goldman Sachs CDX.NA.IG. 33-V1 Sell 1.00% 20/12/2024 12,244 0.12 100,000 EUR Goldman Sachs ITRAXX.EUROPE.
CROSSOVER. 32-V4 Sell 5.00% 20/12/2024 13,195 0.13 50,000 EUR Goldman Sachs ITRAXX.EUROPE.
CROSSOVER. 33-V4 Sell 5.00% 20/06/2025 6,859 0.06 250,000 EUR Goldman Sachs ITRAXX.EUROPE.
MAIN. 32-V1 Sell 1.00% 20/12/2024 7,105 0.07 250,000 EUR Goldman Sachs ITRAXX.EUROPE.
MAIN. 33-V1 Sell 1.00% 20/06/2025 7,337 0.07
Total market Value on credit Default swap contracts – assets 100,116 0.96
50,000 USD BNP Paribas CDX.NA.EM. 33-V2 Sell 1.00% 20/06/2025 (84) 0.00
Total market Value on credit Default swap contracts – liabilities (84) 0.00
net market Value on credit Default swap contracts – assets 100,032 0.96
Collateral received and paid by the Fund in respect of financial derivative instruments:
Type of collateral counterparty currency amount received amount paid
multi-asset Risk control fund
Cash Goldman Sachs USD – 48,651
– 48,651
DERIVaTIVEs
Over-the-counter (OTC) and exchange traded derivatives as at 31 December 2020, expressed in US Dollars.
DERIVaTIVEs (continued)
Over-the-counter (OTC) and exchange traded derivatives as at 31 December 2020, expressed in US Dollars.
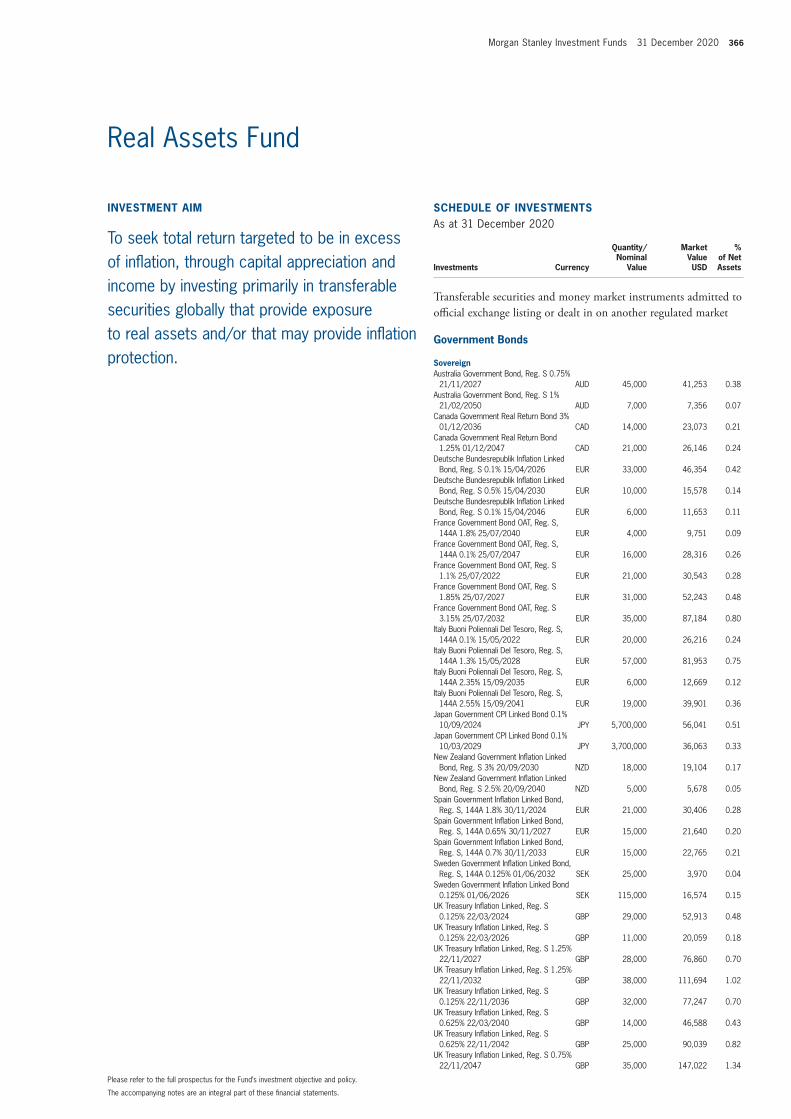
Morgan Stanley Investment Funds 31 December 2020 366
The accompanying notes are an integral part of these financial statements.
Please refer to the full prospectus for the Fund’s investment objective and policy.
Real Assets Fund
InVEsTmEnT aIm
To seek total return targeted to be in excess of inflation, through capital appreciation and income by investing primarily in transferable securities globally that provide exposure to real assets and/or that may provide inflation protection.
schEDUlE of InVEsTmEnTsAs at 31 December 2020
Investments Currency
Quantity/ Nominal
Value
Market Value USD
% of Net Assets
Transferable securities and money market instruments admitted to official exchange listing or dealt in on another regulated market
Government Bonds
sovereignAustralia Government Bond, Reg. S 0.75%
21/11/2027 AUD 45,000 41,253 0.38 Australia Government Bond, Reg. S 1%
21/02/2050 AUD 7,000 7,356 0.07 Canada Government Real Return Bond 3%
01/12/2036 CAD 14,000 23,073 0.21 Canada Government Real Return Bond
1.25% 01/12/2047 CAD 21,000 26,146 0.24 Deutsche Bundesrepublik Inflation Linked
Bond, Reg. S 0.1% 15/04/2026 EUR 33,000 46,354 0.42 Deutsche Bundesrepublik Inflation Linked
Bond, Reg. S 0.5% 15/04/2030 EUR 10,000 15,578 0.14 Deutsche Bundesrepublik Inflation Linked
Bond, Reg. S 0.1% 15/04/2046 EUR 6,000 11,653 0.11 France Government Bond OAT, Reg. S,
144A 1.8% 25/07/2040 EUR 4,000 9,751 0.09 France Government Bond OAT, Reg. S,
144A 0.1% 25/07/2047 EUR 16,000 28,316 0.26 France Government Bond OAT, Reg. S
1.1% 25/07/2022 EUR 21,000 30,543 0.28 France Government Bond OAT, Reg. S
1.85% 25/07/2027 EUR 31,000 52,243 0.48 France Government Bond OAT, Reg. S
3.15% 25/07/2032 EUR 35,000 87,184 0.80 Italy Buoni Poliennali Del Tesoro, Reg. S,
144A 0.1% 15/05/2022 EUR 20,000 26,216 0.24 Italy Buoni Poliennali Del Tesoro, Reg. S,
144A 1.3% 15/05/2028 EUR 57,000 81,953 0.75 Italy Buoni Poliennali Del Tesoro, Reg. S,
144A 2.35% 15/09/2035 EUR 6,000 12,669 0.12 Italy Buoni Poliennali Del Tesoro, Reg. S,
144A 2.55% 15/09/2041 EUR 19,000 39,901 0.36 Japan Government CPI Linked Bond 0.1%
10/09/2024 JPY 5,700,000 56,041 0.51 Japan Government CPI Linked Bond 0.1%
10/03/2029 JPY 3,700,000 36,063 0.33 New Zealand Government Inflation Linked
Bond, Reg. S 3% 20/09/2030 NZD 18,000 19,104 0.17 New Zealand Government Inflation Linked
Bond, Reg. S 2.5% 20/09/2040 NZD 5,000 5,678 0.05 Spain Government Inflation Linked Bond,
Reg. S, 144A 1.8% 30/11/2024 EUR 21,000 30,406 0.28 Spain Government Inflation Linked Bond,
Reg. S, 144A 0.65% 30/11/2027 EUR 15,000 21,640 0.20 Spain Government Inflation Linked Bond,
Reg. S, 144A 0.7% 30/11/2033 EUR 15,000 22,765 0.21 Sweden Government Inflation Linked Bond,
Reg. S, 144A 0.125% 01/06/2032 SEK 25,000 3,970 0.04 Sweden Government Inflation Linked Bond
0.125% 01/06/2026 SEK 115,000 16,574 0.15 UK Treasury Inflation Linked, Reg. S
0.125% 22/03/2024 GBP 29,000 52,913 0.48 UK Treasury Inflation Linked, Reg. S
0.125% 22/03/2026 GBP 11,000 20,059 0.18 UK Treasury Inflation Linked, Reg. S 1.25%
22/11/2027 GBP 28,000 76,860 0.70 UK Treasury Inflation Linked, Reg. S 1.25%
22/11/2032 GBP 38,000 111,694 1.02 UK Treasury Inflation Linked, Reg. S
0.125% 22/11/2036 GBP 32,000 77,247 0.70 UK Treasury Inflation Linked, Reg. S
0.625% 22/03/2040 GBP 14,000 46,588 0.43 UK Treasury Inflation Linked, Reg. S
0.625% 22/11/2042 GBP 25,000 90,039 0.82 UK Treasury Inflation Linked, Reg. S 0.75%
22/11/2047 GBP 35,000 147,022 1.34

367 Morgan Stanley Investment Funds 31 December 2020
The accompanying notes are an integral part of these financial statements.
Real Assets Fund (continued)
schEDUlE of InVEsTmEnTsAs at 31 December 2020
Investments Currency
Quantity/ Nominal
Value
Market Value USD
% of Net Assets
Transferable securities and money market instruments admitted to official exchange listing or dealt in on another regulated market
Government Bonds (continued)
sovereign (continued)UK Treasury Inflation Linked, Reg. S 0.25%
22/03/2052 GBP 35,000 124,859 1.14 UK Treasury Inflation Linked, Reg. S
0.375% 22/03/2062 GBP 36,000 163,524 1.49 US Treasury Inflation Indexed 0.125%
15/07/2022 USD 67,000 78,198 0.72 US Treasury Inflation Indexed 0.375%
15/07/2023 USD 86,000 101,907 0.93 US Treasury Inflation Indexed 0.125%
15/07/2024 USD 112,000 131,388 1.20 US Treasury Inflation Indexed 0.25%
15/01/2025 USD 88,000 104,255 0.95 US Treasury Inflation Indexed 0.375%
15/07/2025 USD 92,400 111,262 1.02 US Treasury Inflation Indexed 0.375%
15/07/2027 USD 109,000 130,390 1.19 US Treasury Inflation Indexed 0.375%
15/01/2027 USD 5,000 6,008 0.05 US Treasury Inflation Indexed 0.875%
15/01/2029 USD 71,000 85,941 0.78 US Treasury Inflation Indexed 3.875%
15/04/2029 USD 12,000 27,355 0.25 US Treasury Inflation Indexed 0.125%
15/01/2030 USD 77,000 86,778 0.79 US Treasury Inflation Indexed 0.75%
15/02/2042 USD 52,000 76,082 0.69 US Treasury Inflation Indexed 1%
15/02/2046 USD 44,000 65,763 0.60 US Treasury Inflation Indexed 0.25%
15/02/2050 USD 25,000 30,093 0.27
2,698,655 24.63
Total Government Bonds 2,698,655 24.63
Warrants
Textiles, apparel & luxury GoodsCie Financiere Richemont SA 22/11/2023 CHF 588 154 0.00
154 0.00
Total Warrants 154 0.00
Equities
automobilesTesla, Inc. USD 54 37,436 0.34 Toyota Motor Corp. JPY 322 24,861 0.23
62,297 0.57
BanksBank of America Corp. USD 1,201 35,981 0.33 Bank of Montreal CAD 301 22,949 0.21 DBS Group Holdings Ltd. SGD 1,429 27,093 0.25 JPMorgan Chase & Co. USD 417 52,191 0.47 National Bank of Canada CAD 4 225 0.00 PNC Financial Services Group, Inc. (The) USD 199 29,177 0.27
schEDUlE of InVEsTmEnTsAs at 31 December 2020
Investments Currency
Quantity/ Nominal
Value
Market Value USD
% of Net Assets
Transferable securities and money market instruments admitted to official exchange listing or dealt in on another regulated market
Equities (continued)
Banks (continued)Royal Bank of Canada CAD 317 26,117 0.24 Sumitomo Mitsui Financial Group, Inc. JPY 988 30,562 0.28
224,295 2.05
BeveragesCoca-Cola Co. (The) USD 397 21,644 0.20 PepsiCo, Inc. USD 149 21,950 0.20
43,594 0.40
BiotechnologyAmgen, Inc. USD 76 17,178 0.16 CSL Ltd. AUD 103 22,549 0.20
39,727 0.36
capital marketsGoldman Sachs Group, Inc. (The) USD 94 24,424 0.22
24,424 0.22
chemicalsAir Liquide SA EUR 158 26,025 0.24 BASF SE EUR 415 32,634 0.30 Celanese Corp. USD 199 25,607 0.23 Linde plc USD 84 21,974 0.20 Sumitomo Chemical Co. Ltd. JPY 7,051 28,323 0.26
134,563 1.23
commercial services & suppliesChina Everbright Environment Group Ltd. HKD 102,318 57,798 0.52 Copart, Inc. USD 196 24,788 0.23 Republic Services, Inc. USD 182 17,346 0.16 Waste Management, Inc. USD 391 45,669 0.42
145,601 1.33
construction & EngineeringFerrovial SA EUR 1,234 34,217 0.31 Vinci SA EUR 1,296 129,372 1.18
163,589 1.49
consumer financeAmerican Express Co. USD 246 29,412 0.27
29,412 0.27
Diversified financial servicesBerkshire Hathaway, Inc. ‘B’ USD 99 22,703 0.21 Voya Financial, Inc. USD 416 24,290 0.22
46,993 0.43
Diversified Telecommunication servicesAT&T, Inc. USD 633 17,999 0.16 Cellnex Telecom SA, Reg. S EUR 565 34,052 0.32

Morgan Stanley Investment Funds 31 December 2020 368
The accompanying notes are an integral part of these financial statements.
Real Assets Fund (continued)
schEDUlE of InVEsTmEnTsAs at 31 December 2020
Investments Currency
Quantity/ Nominal
Value
Market Value USD
% of Net Assets
Transferable securities and money market instruments admitted to official exchange listing or dealt in on another regulated market
Equities (continued)
Diversified Telecommunication services (continued)China Tower Corp. Ltd., Reg. S ‘H’ HKD 77,178 11,347 0.10 Infrastrutture Wireless Italiane SpA, Reg. S EUR 2,696 32,787 0.30 Telia Co. AB SEK 5,526 22,997 0.21 TELUS Corp. CAD 13 257 0.00
119,439 1.09
Electric UtilitiesAmerican Electric Power Co., Inc. USD 471 38,688 0.35 Avangrid, Inc. USD 469 21,222 0.19 Edison International USD 800 49,447 0.45 Eversource Energy USD 546 46,820 0.43 NextEra Energy, Inc. USD 396 30,183 0.28 Orsted A/S, Reg. S DKK 64 12,976 0.12 Power Assets Holdings Ltd. HKD 6,500 35,208 0.32 Terna Rete Elettrica Nazionale SpA EUR 3,732 28,563 0.26 Xcel Energy, Inc. USD 337 22,215 0.20
285,322 2.60
Electrical EquipmentLegrand SA EUR 323 28,930 0.27 Siemens Energy AG EUR 99 3,626 0.03
32,556 0.30
EntertainmentNetflix, Inc. USD 38 20,478 0.19 Walt Disney Co. (The) USD 210 38,232 0.35
58,710 0.54
Equity Real Estate Investment Trusts (REITs)Alexandria Real Estate Equities, Inc., REIT USD 130 22,793 0.21 American Campus Communities, Inc., REIT USD 210 8,824 0.08 American Tower Corp., REIT USD 812 179,751 1.65 Apartment Income REIT Corp. USD 89 3,381 0.03 AvalonBay Communities, Inc., REIT USD 524 82,719 0.75 Boston Properties, Inc., REIT USD 1,180 109,941 1.00 British Land Co. plc (The), REIT GBP 10,480 70,000 0.64 Brixmor Property Group, Inc., REIT USD 855 13,902 0.13 Camden Property Trust, REIT USD 375 36,735 0.34 Crown Castle International Corp., REIT USD 829 129,862 1.18 CubeSmart, REIT USD 431 14,499 0.13 Derwent London plc, REIT GBP 963 40,724 0.37 Dexus, REIT AUD 4,807 34,932 0.32 DiamondRock Hospitality Co., REIT USD 106 882 0.01 Digital Realty Trust, Inc., REIT USD 120 16,540 0.15 Equity Residential, REIT USD 1,233 72,044 0.66 Essex Property Trust, Inc., REIT USD 112 26,285 0.24 Eurocommercial Properties NV, REIT, CVA EUR 1,887 35,608 0.32 Federal Realty Investment Trust, REIT USD 85 7,123 0.06 Gecina SA, REIT EUR 500 77,481 0.71 GLP J-Reit, REIT JPY 7 11,068 0.10 GPT Group (The), REIT AUD 2,801 9,744 0.09 Great Portland Estates plc, REIT GBP 6,889 62,858 0.57 Hammerson plc GBP 123,608 41,957 0.38 Healthcare Realty Trust, Inc., REIT USD 382 11,166 0.10 Healthpeak Properties, Inc., REIT USD 762 22,624 0.21 Hibernia REIT plc EUR 17,750 25,132 0.23 Host Hotels & Resorts, Inc., REIT USD 3,575 51,695 0.47 Hudson Pacific Properties, Inc., REIT USD 1,508 35,544 0.32 ICADE, REIT EUR 37 2,855 0.03
schEDUlE of InVEsTmEnTsAs at 31 December 2020
Investments Currency
Quantity/ Nominal
Value
Market Value USD
% of Net Assets
Transferable securities and money market instruments admitted to official exchange listing or dealt in on another regulated market
Equities (continued)
Equity Real Estate Investment Trusts (REITs) (continued)Inmobiliaria Colonial Socimi SA, REIT EUR 1,103 10,860 0.10 Invitation Homes, Inc., REIT USD 1,364 40,088 0.37 Japan Hotel REIT Investment Corp. JPY 50 25,685 0.23 JBG SMITH Properties, REIT USD 427 13,156 0.12 Kimco Realty Corp., REIT USD 920 13,455 0.12 Klepierre SA, REIT EUR 3,516 79,333 0.72 Land Securities Group plc, REIT GBP 8,968 82,538 0.75 Link REIT HKD 2,859 26,032 0.24 Mack-Cali Realty Corp., REIT USD 2,150 26,445 0.24 Mercialys SA, REIT EUR 2,849 25,238 0.23 Merlin Properties Socimi SA, REIT EUR 4,166 39,767 0.36 Mid-America Apartment Communities, Inc.,
REIT USD 63 7,847 0.07 Nippon Building Fund, Inc., REIT JPY 7 40,639 0.37 Paramount Group, Inc., REIT USD 554 4,908 0.04 Prologis, Inc., REIT USD 1,682 165,676 1.51 Public Storage, REIT USD 114 26,099 0.24 QTS Realty Trust, Inc., REIT ‘A’ USD 136 8,231 0.08 Regency Centers Corp., REIT USD 922 41,536 0.38 RioCan Real Estate Investment Trust CAD 2,845 37,295 0.34 RLJ Lodging Trust, REIT USD 1,795 25,417 0.23 SBA Communications Corp., REIT ‘A’ USD 247 68,207 0.62 Scentre Group, REIT AUD 4,196 9,018 0.08 Segro plc, REIT GBP 2,520 32,618 0.30 Simon Property Group, Inc., REIT USD 1,478 122,822 1.12 SL Green Realty Corp., REIT USD 2,204 127,105 1.16 Sunstone Hotel Investors, Inc., REIT USD 3,233 36,339 0.33 Ventas, Inc., REIT USD 987 47,929 0.44 Vornado Realty Trust, REIT USD 2,000 71,900 0.66 Weingarten Realty Investors, REIT USD 2,204 46,791 0.43 Weyerhaeuser Co., REIT USD 596 19,841 0.18
2,581,484 23.54
food & staples RetailingCostco Wholesale Corp. USD 50 18,706 0.17 Woolworths Group Ltd. AUD 649 19,722 0.18
38,428 0.35
food ProductsBarry Callebaut AG CHF 10 23,768 0.22 Nestle SA CHF 197 23,363 0.21
47,131 0.43
Gas UtilitiesAtmos Energy Corp. USD 513 48,350 0.44 China Gas Holdings Ltd. HKD 15,020 59,663 0.55 Hong Kong & China Gas Co. Ltd. HKD 12,280 18,339 0.17 Snam SpA EUR 2,402 13,505 0.12
139,857 1.28
health care Equipment & suppliesAbbott Laboratories USD 203 21,975 0.20 Danaher Corp. USD 90 19,896 0.18 Medtronic plc USD 199 23,046 0.21
64,917 0.59

369 Morgan Stanley Investment Funds 31 December 2020
The accompanying notes are an integral part of these financial statements.
Real Assets Fund (continued)
schEDUlE of InVEsTmEnTsAs at 31 December 2020
Investments Currency
Quantity/ Nominal
Value
Market Value USD
% of Net Assets
Transferable securities and money market instruments admitted to official exchange listing or dealt in on another regulated market
Equities (continued)
healthcare servicesUnitedHealth Group, Inc. USD 91 31,501 0.29
31,501 0.29
hotels, Restaurants & leisureHilton Worldwide Holdings, Inc. USD 223 24,441 0.22 Marriott International, Inc. ‘A’ USD 199 25,750 0.24
50,191 0.46
household DurablesGarmin Ltd. USD 199 23,731 0.22
23,731 0.22
household ProductsProcter & Gamble Co. (The) USD 229 31,627 0.29
31,627 0.29
Industrial conglomeratesHoneywell International, Inc. USD 99 20,853 0.19 Siemens AG EUR 188 26,946 0.25
47,799 0.44
Industrial Power and Renewable Electricity ProducersAES Corp. (The) USD 993 22,869 0.21 Azure Power Global Ltd. USD 1,818 73,338 0.67
96,207 0.88
InsuranceAIA Group Ltd. HKD 1,788 21,906 0.20 Globe Life, Inc. USD 199 18,575 0.17 Manulife Financial Corp. CAD 1,497 26,484 0.24 Sun Life Financial, Inc. CAD 491 21,771 0.20
88,736 0.81
Interactive media & servicesAlphabet, Inc. ‘A’ USD 44 76,861 0.70 Facebook, Inc. ‘A’ USD 177 48,629 0.44
125,490 1.14
Internet & Direct marketing RetailAmazon.com, Inc. USD 26 85,079 0.78
85,079 0.78
IT servicesAccenture plc ‘A’ USD 88 22,764 0.21 Edenred EUR 430 24,485 0.22 Fidelity National Information Services, Inc. USD 138 19,452 0.18 Mastercard, Inc. ‘A’ USD 92 32,970 0.30 PayPal Holdings, Inc. USD 99 22,864 0.21 Visa, Inc. ‘A’ USD 141 30,902 0.28
153,437 1.40
schEDUlE of InVEsTmEnTsAs at 31 December 2020
Investments Currency
Quantity/ Nominal
Value
Market Value USD
% of Net Assets
Transferable securities and money market instruments admitted to official exchange listing or dealt in on another regulated market
Equities (continued)
life sciences Tools & servicesThermo Fisher Scientific, Inc. USD 46 21,234 0.19
21,234 0.19
machineryDover Corp. USD 199 24,766 0.23
24,766 0.23
mediaComcast Corp. ‘A’ USD 452 23,522 0.21
23,522 0.21
metals & miningAnglo American plc GBP 963 31,892 0.29
31,892 0.29
multiline RetailWesfarmers Ltd. AUD 790 30,781 0.28
30,781 0.28
multi-UtilitiesAmeren Corp. USD 505 39,016 0.36 CMS Energy Corp. USD 314 18,897 0.17 E.ON SE EUR 1,852 20,575 0.19 National Grid plc GBP 8,843 104,482 0.96 NiSource, Inc. USD 1,712 38,880 0.35 Sempra Energy USD 550 69,409 0.63
291,259 2.66
oil, Gas & consumable fuelsBP plc GBP 68 237 0.00 Cheniere Energy, Inc. USD 881 53,900 0.49 Enbridge, Inc. CAD 1,949 62,694 0.57 Gibson Energy, Inc. CAD 4,645 75,273 0.69 Keyera Corp. CAD 729 12,931 0.12 Marathon Oil Corp. USD 5,187 34,551 0.32 ONEOK, Inc. USD 1,670 63,009 0.57 Pembina Pipeline Corp. CAD 801 19,087 0.17 Royal Dutch Shell plc ‘B’ GBP 1,897 32,633 0.30 Targa Resources Corp. USD 1,336 34,642 0.32 TC Energy Corp. CAD 1,373 56,165 0.51 Williams Cos., Inc. (The) USD 1,720 34,245 0.31
479,367 4.37
PharmaceuticalsGlaxoSmithKline plc GBP 1,233 22,602 0.21 Johnson & Johnson USD 192 29,982 0.27 Merck & Co., Inc. USD 283 22,835 0.21 Novartis AG CHF 295 27,727 0.25 Novo Nordisk A/S ‘B’ DKK 287 19,969 0.18 Roche Holding AG CHF 82 28,734 0.26 Zoetis, Inc. USD 99 16,191 0.15
168,040 1.53

Morgan Stanley Investment Funds 31 December 2020 370
The accompanying notes are an integral part of these financial statements.
Real Assets Fund (continued)
schEDUlE of InVEsTmEnTsAs at 31 December 2020
Investments Currency
Quantity/ Nominal
Value
Market Value USD
% of Net Assets
Transferable securities and money market instruments admitted to official exchange listing or dealt in on another regulated market
Equities (continued)
Professional servicesRandstad NV EUR 443 28,938 0.26
28,938 0.26
Real Estate management & DevelopmentChina Overseas Land & Investment Ltd. HKD 803 1,746 0.02 China Resources Land Ltd. HKD 2,081 8,588 0.08 China Resources Mixc Lifestyle Services
Ltd., Reg. S HKD 16 74 0.00 Citycon OYJ EUR 973 9,453 0.09 CK Asset Holdings Ltd. HKD 1,136 5,831 0.05 Deutsche Wohnen SE EUR 1,384 73,958 0.67 Hongkong Land Holdings Ltd. USD 24,324 100,458 0.91 Hufvudstaden AB ‘A’ SEK 932 15,438 0.14 Mitsubishi Estate Co. Ltd. JPY 4,723 75,885 0.69 Mitsui Fudosan Co. Ltd. JPY 3,344 69,790 0.64 New World Development Co. Ltd. HKD 1,867 8,692 0.08 Sumitomo Realty & Development Co. Ltd. JPY 638 19,675 0.18 Sun Hung Kai Properties Ltd. HKD 3,611 46,570 0.42 Swire Properties Ltd. HKD 20,641 60,029 0.55 UOL Group Ltd. SGD 747 4,361 0.04 Wharf Real Estate Investment Co. Ltd. HKD 5,729 29,813 0.27
530,361 4.83
Road & RailCanadian National Railway Co. CAD 100 10,928 0.10 Central Japan Railway Co. JPY 200 28,381 0.26 CSX Corp. USD 522 47,101 0.43 East Japan Railway Co. JPY 700 46,733 0.43 Norfolk Southern Corp. USD 95 22,405 0.20 Union Pacific Corp. USD 219 45,269 0.41
200,817 1.83
semiconductors & semiconductor EquipmentAdvanced Micro Devices, Inc. USD 199 18,157 0.17 ASML Holding NV EUR 61 29,754 0.27 QUALCOMM, Inc. USD 199 30,116 0.27 Texas Instruments, Inc. USD 99 16,083 0.15
94,110 0.86
softwareAdobe, Inc. USD 76 37,944 0.35 Microsoft Corp. USD 473 104,769 0.96 salesforce.com, Inc. USD 126 27,869 0.25 SAP SE EUR 125 16,292 0.15
186,874 1.71
specialty RetailHome Depot, Inc. (The) USD 87 23,025 0.21
23,025 0.21
Tech hardware, storage & PeripheralsApple, Inc. USD 1,090 145,450 1.33
145,450 1.33
schEDUlE of InVEsTmEnTsAs at 31 December 2020
Investments Currency
Quantity/ Nominal
Value
Market Value USD
% of Net Assets
Transferable securities and money market instruments admitted to official exchange listing or dealt in on another regulated market
Equities (continued)
Textiles, apparel & luxury GoodsCie Financiere Richemont SA CHF 294 26,382 0.24 LVMH Moet Hennessy Louis Vuitton SE EUR 50 31,342 0.29
57,724 0.53
Trading companies & DistributorsITOCHU Corp. JPY 1,037 29,753 0.28 Marubeni Corp. JPY 3,774 25,068 0.23 Mitsubishi Corp. JPY 985 24,269 0.22 Mitsui & Co. Ltd. JPY 1,397 25,581 0.23 Sumitomo Corp. JPY 1,688 22,358 0.20
127,029 1.16
Transportation InfrastructureAena SME SA, Reg. S EUR 195 34,022 0.31 Aeroports de Paris EUR 68 8,852 0.08 Atlantia SpA EUR 847 15,172 0.14 Atlas Arteria Ltd. AUD 5,433 27,301 0.25 Auckland International Airport Ltd. NZD 4,799 26,298 0.24 China Merchants Port Holdings Co. Ltd. HKD 8,129 9,949 0.09 Flughafen Zurich AG CHF 151 26,642 0.24 Getlink SE EUR 1,547 26,915 0.25 Grupo Aeroportuario del Pacifico SAB
de CV ‘B’ MXN 1,681 18,704 0.17 Grupo Aeroportuario del Sureste SAB
de CV ‘B’ MXN 1,335 21,601 0.20 Jiangsu Expressway Co. Ltd. ‘H’ HKD 29,981 33,523 0.31 Promotora y Operadora de Infraestructura
SAB de CV MXN 7,368 66,378 0.61 Sydney Airport AUD 4,792 23,746 0.22 Transurban Group AUD 6,438 67,985 0.61 Zhejiang Expressway Co. Ltd. ‘H’ HKD 12,000 10,137 0.09
417,225 3.81
Water UtilitiesAmerican Water Works Co., Inc. USD 263 39,948 0.36 Essential Utilities, Inc. USD 1,303 60,616 0.56 Pennon Group plc GBP 1,806 23,435 0.21 Severn Trent plc GBP 643 20,104 0.18
144,103 1.31
Total Equities 8,042,654 73.38
Total Transferable securities and money market instruments admitted to official exchange listing or dealt in on another regulated market 10,741,463 98.01
Total Investments 10,741,463 98.01
cash 339,200 3.09
other assets/(liabilities) (120,748) (1.10)
Total net assets 10,959,915 100.00

371 Morgan Stanley Investment Funds 31 December 2020
The accompanying notes are an integral part of these financial statements.
Real Assets Fund (continued)
forward currency Exchange contracts
currency Purchased
amount Purchased
currency sold
amount sold
maturity Date counterparty
Unrealised Gain/(loss)
UsD
% of net assets
USD 1,447 HKD 11,219 05/01/2021 J.P. Morgan 0 0.00CAD 2,547 USD 1,965 26/02/2021 Barclays 37 0.00EUR 10,811 USD 13,132 26/02/2021 J.P. Morgan 148 0.00GBP 17,800 USD 23,843 26/02/2021 UBS 479 0.01 GBP 9,000 USD 12,022 26/02/2021 Westpac Banking 275 0.00JPY 37,330 USD 359 26/02/2021 Bank of America 4 0.00JPY 100,272 USD 965 26/02/2021 Barclays 9 0.00SEK 9,510 USD 1,124 26/02/2021 State Street 41 0.00
Unrealised Gain on forward currency Exchange contracts – assets 993 0.01
Total Unrealised Gain on forward currency Exchange contracts – assets 993 0.01
USD 46,198 AUD 63,080 26/02/2021 Barclays (2,588) (0.03) USD 1,972 AUD 2,659 26/02/2021 RBC (84) 0.00USD 1,934 CAD 2,478 26/02/2021 RBC (14) 0.00USD 48,062 CAD 62,955 26/02/2021 UBS (1,422) (0.01) USD 7,192 EUR 6,000 26/02/2021 BNP Paribas (178) 0.00USD 503,781 EUR 424,182 26/02/2021 Goldman Sachs (17,281) (0.16) USD 370 EUR 305 26/02/2021 UBS (5) 0.00USD 6,530 GBP 4,882 26/02/2021 HSBC (141) 0.00USD 934,326 GBP 700,425 26/02/2021 J.P. Morgan (22,728) (0.21) USD 92,214 JPY 9,626,258 26/02/2021 Bank of America (1,256) (0.01) USD 25,890 NZD 37,104 26/02/2021 UBS (940) (0.01) USD 20,388 SEK 176,103 26/02/2021 J.P. Morgan (1,186) (0.01)
Unrealised loss on forward currency Exchange contracts – liabilities (47,823) (0.44)
Total Unrealised loss on forward currency Exchange contracts – liabilities (47,823) (0.44)
net Unrealised loss on forward currency Exchange contracts – liabilities (46,830) (0.43)
DERIVaTIVEs
Over-the-counter (OTC) and exchange traded derivatives as at 31 December 2020, expressed in US Dollars.

Morgan Stanley Investment Funds 31 December 2020 372
The accompanying notes are an integral part of these financial statements.
Please refer to the full prospectus for the Fund’s investment objective and policy.
InVEsTmEnT aIm
To provide an attractive level of total return, measured in US Dollars, primarily through investment in a global portfolio of financial instruments including equity securities and Fixed Income Securities of all types.
schEDUlE of InVEsTmEnTsAs at 31 December 2020
Investments Currency
Quantity/ Nominal
Value
Market Value USD
% of Net Assets
Transferable securities and money market instruments admitted to official exchange listing or dealt in on another regulated market
Equities
BrazilPagseguro Digital Ltd. ‘A’ USD 13,372 746,158 1.37
746,158 1.37
canadaRestaurant Brands International, Inc. USD 8,659 531,922 0.98
531,922 0.98
singaporeSea Ltd., ADR USD 2,849 555,868 1.02
555,868 1.02
United states of americaAcadia Healthcare Co., Inc. USD 18,439 919,737 1.69 AES Corp. (The) USD 16,096 370,691 0.68 Alphabet, Inc. ‘C’ USD 294 514,168 0.95 Amazon.com, Inc. USD 79 258,509 0.48 American Tower Corp., REIT USD 6,993 1,548,040 2.85 Aon plc ‘A’ USD 2,629 546,885 1.01 ASML Holding NV, NYRS USD 1,241 601,910 1.11 Blackstone Group, Inc. (The) ‘A’ USD 23,042 1,483,674 2.73 Boston Properties, Inc., REIT USD 6,142 572,250 1.05 Brink’s Co. (The) USD 9,276 660,544 1.22 CarMax, Inc. USD 5,350 499,369 0.92 Centene Corp. USD 8,847 523,654 0.96 Charter Communications, Inc. ‘A’ USD 4,343 2,868,552 5.29 Cheniere Energy, Inc. USD 13,565 829,907 1.53 Copart, Inc. USD 10,997 1,390,791 2.56 Corteva, Inc. USD 16,154 620,152 1.14 CoStar Group, Inc. USD 1,467 1,354,496 2.50 Danaher Corp. USD 1,467 324,310 0.60 Encompass Health Corp. USD 7,595 620,360 1.14 Evoqua Water Technologies Corp. USD 17,514 464,121 0.85 Exact Sciences Corp. USD 4,569 609,962 1.12 Fastenal Co. USD 13,470 658,952 1.21 Fidelity National Information Services, Inc. USD 7,394 1,042,258 1.92 GoDaddy, Inc. ‘A’ USD 9,620 790,379 1.46 Herbalife Nutrition Ltd. USD 19,991 954,170 1.76 IAC Corp. USD 12,778 2,417,214 4.45 IHS Markit Ltd. USD 6,039 537,229 0.99 IQVIA Holdings, Inc. USD 3,908 688,746 1.27 KKR & Co., Inc. ‘A’ USD 18,871 746,914 1.38 Lowe’s Cos., Inc. USD 7,939 1,269,526 2.34 Lululemon Athletica, Inc. USD 2,297 804,708 1.48 Match Group, Inc. USD 5,311 800,899 1.48 MGM Resorts International USD 64,907 2,011,468 3.71 Morningstar, Inc. USD 1,689 385,953 0.71 Nexstar Media Group, Inc. ‘A’ USD 4,404 482,502 0.89 NVR, Inc. USD 271 1,108,393 2.04 Okta, Inc. USD 2,736 709,007 1.31 PG&E Corp. USD 32,292 397,192 0.73 Procter & Gamble Co. (The) USD 3,029 418,335 0.77 Raytheon Technologies Corp. USD 8,548 609,472 1.12 RingCentral, Inc. ‘A’ USD 2,316 893,698 1.65 Roper Technologies, Inc. USD 1,577 667,828 1.23 salesforce.com, Inc. USD 3,310 732,106 1.35 Square, Inc. ‘A’ USD 2,629 568,521 1.05 SS&C Technologies Holdings, Inc. USD 7,667 551,334 1.02 Synopsys, Inc. USD 2,414 624,212 1.15
Liquid Alpha Capture Fund

373 Morgan Stanley Investment Funds 31 December 2020
The accompanying notes are an integral part of these financial statements.
Liquid Alpha Capture Fund (continued)
schEDUlE of InVEsTmEnTsAs at 31 December 2020
Investments Currency
Quantity/ Nominal
Value
Market Value USD
% of Net Assets
Transferable securities and money market instruments admitted to official exchange listing or dealt in on another regulated market
Equities (continued)
United states of america (continued)Sysco Corp. USD 18,276 1,332,686 2.46 Thermo Fisher Scientific, Inc. USD 4,546 2,098,434 3.87 T-Mobile US, Inc. USD 10,097 1,349,666 2.49 Vornado Realty Trust, REIT USD 15,093 542,593 1.00 Walt Disney Co. (The) USD 2,389 434,929 0.80
44,211,406 81.47
Total Equities 46,045,354 84.84
Total Transferable securities and money market instruments admitted to official exchange listing or dealt in on another regulated market 46,045,354 84.84
Units of authorised UCITS or other collective investment undertakings
collective Investment schemes – UcITs
luxembourgMorgan Stanley Liquidity Funds US Dollar
Liquidity Fund – MS Reserve† USD 4,846,294 4,846,294 8.93
4,846,294 8.93
Total collective Investment schemes – UcITs 4,846,294 8.93
Total Units of authorised UcITs or other collective investment undertakings 4,846,294 8.93
Total Investments 50,891,648 93.77
cash 3,187,904 5.87
other assets/(liabilities) 190,430 0.36
Total net assets 54,269,982 100.00
† Managed by an affiliate of the Investment Adviser.The country disclosed within the Schedule of Investments refers to the country of risk. The country of incorporation may differ.
financial futures contracts
security Descriptionnumber
of contracts currency
Global Exposure
UsD
Unrealised Gain/(loss)
UsD
% of net assets
S&P 500 Emini Index, 19/03/2021 (143) USD (26,610,513) (381,538) (0.70)
Total Unrealised loss on financial futures contracts (381,538) (0.70)
net Unrealised loss on financial futures contracts (381,538) (0.70)
forward currency Exchange contracts
currency Purchased
amount Purchased
currency sold
amount sold
maturity Date counterparty
Unrealised Gain/(loss)
UsD
% of net assets
EUR hedged share classUSD 122 EUR 99 05/01/2021 J.P. Morgan 0 0.00EUR 8,065,124 USD 9,814,020 08/01/2021 J.P. Morgan 82,195 0.15
Unrealised Gain on naV hedged share classes forward currency Exchange contracts – assets 82,195 0.15
Total Unrealised Gain on forward currency Exchange contracts – assets 82,195 0.15
EUR hedged share classUSD 244,888 EUR 199,615 04/01/2021 J.P. Morgan (28) 0.00EUR 99 USD 122 08/01/2021 J.P. Morgan 0 0.00USD 64,228 EUR 52,555 08/01/2021 J.P. Morgan (259) 0.00
Unrealised loss on naV hedged share classes forward currency Exchange contracts – liabilities (287) 0.00
Total Unrealised loss on forward currency Exchange contracts – liabilities (287) 0.00
net Unrealised Gain on forward currency Exchange contracts – assets 81,908 0.15
Collateral received and paid by the Fund in respect of financial derivative instruments:
Type of collateral counterparty currency amount received amount paid
liquid alpha capture fund
Cash Goldman Sachs USD 2,397,579 –
2,397,579 –
DERIVaTIVEs
Over-the-counter (OTC) and exchange traded derivatives as at 31 December 2020, expressed in US Dollars.

Morgan Stanley Investment Funds 31 December 2020 374
The accompanying notes are an integral part of these financial statements.
Asia Opportunity
Fund
Asian Property
Fund
ChinaA-shares
Fund
China Equity Fund
Counterpoint Global
Fund (1)
USD USD USD USD USD
AssetsInvestments in securities at cost 4,782,165,009 84,242,785 47,866,416 9,135,358 6,057,793Unrealised gain/(loss) 1,746,134,489 132,081 1,477,121 3,807,016 3,087,290
Investments in securities at market value 6,528,299,498 84,374,866 49,343,537 12,942,374 9,145,083
Cash at bank and at brokers 636,154,176 105,558 2,240,139 1,304,981 666,296Receivables on subscriptions 40,323,854 195,876 125,570 – –Receivables on investments sold – – 321,949 – 118,386Dividends receivable 1,533,781 323,262 – – 789Interest receivable – – – – –Options purchased contracts at fair value – – – – 4,054Unrealised gain on financial futures contracts – – – – –Unrealised gain on forward currency exchange contracts 8,025,062 – 68,780 – –Unrealised gain on interest rate swaps – – – – –Unrealised gain on inflation rate swaps – – – – –Unrealised gain on credit default swaps – – – – –Unrealised gain on total return swaps – – – – –Other assets 103,452 – 41 1 120
Total assets 7,214,439,823 84,999,562 52,100,016 14,247,356 9,934,728
LiabilitiesBank overdraft and due to broker – 6 – – –Payables on redemptions 17,254,282 34,067 28,142 – –Payables on investments purchased 28,184,378 – – – 102,050Interest payable – – – – 5Provision for foreign taxes 40,152,362 – – – –Management fees payable 5,374,005 80,158 55,932 420 6,678Options written contracts at fair value – – – – –Unrealised loss on financial futures contracts – – – – –Unrealised loss on forward currency exchange contracts 24,394 – 76 – –Unrealised loss on inflation rate swaps – – – – –Unrealised loss on credit default swaps – – – – –Unrealised loss on total return swaps – – – – –Other liabilities 1,519,007 16,413 14,286 11,171 1,274
Total liabilities 92,508,428 130,644 98,436 11,591 110,007
Total net assets 7,121,931,395 84,868,918 52,001,580 14,235,765 9,824,721
(1) Formerly known as Global Counterpoint Fund prior to 15 May 2020.
Statement of assets and liabilitiesAs at 31 December 2020
STATEMENTS AND NOTES

375 Morgan Stanley Investment Funds 31 December 2020
The accompanying notes are an integral part of these financial statements.
Statement of assets and liabilities (continued)As at 31 December 2020
Developing Opportunity
Fund
Emerging Europe,
Middle East andAfrica Equity
Fund
EmergingLeaders
EquityFund
EmergingMarkets
EquityFund
Emerging Markets
Small CapEquity Fund
USD EUR USD USD USD
AssetsInvestments in securities at cost 255,171,962 45,094,452 700,977,132 485,411,005 13,073,717Unrealised gain/(loss) 117,664,568 15,910,253 276,594,906 279,244,348 2,425,645
Investments in securities at market value 372,836,530 61,004,705 977,572,038 764,655,353 15,499,362
Cash at bank and at brokers 2,852,548 569,144 12,225,970 3,938,330 174,311Receivables on subscriptions 306,619 38,697 5,809,574 11,136 9,347Receivables on investments sold – – – 794,242 5,971Dividends receivable 98,728 133,415 182,189 953,111 18,496Interest receivable – – – – –Options purchased contracts at fair value – – – – –Unrealised gain on financial futures contracts – – – – –Unrealised gain on forward currency exchange contracts – 716 1,198,969 3,001 39,988Unrealised gain on interest rate swaps – – – – –Unrealised gain on inflation rate swaps – – – – –Unrealised gain on credit default swaps – – – – –Unrealised gain on total return swaps – – – – –Other assets 510 161,506 139,217 651,939 301
Total assets 376,094,935 61,908,183 997,127,957 771,007,112 15,747,776
LiabilitiesBank overdraft and due to broker – – – 1,016 –Payables on redemptions 12,114 77,476 1,062,086 459,764 70,681Payables on investments purchased – 323,819 10,375,391 2,399,290 –Interest payable – 292 18 – –Provision for foreign taxes 1,727,249 – 6,628,521 494,182 103,891Management fees payable 25,088 84,565 705,274 476,997 31,291Options written contracts at fair value – – – – –Unrealised loss on financial futures contracts – – – – –Unrealised loss on forward currency exchange contracts 5 257 3,745 2,374 3,379Unrealised loss on inflation rate swaps – – – – –Unrealised loss on credit default swaps – – – – –Unrealised loss on total return swaps – – – – –Other liabilities 188,950 16,940 182,091 138,542 6,396
Total liabilities 1,953,406 503,349 18,957,126 3,972,165 215,638
Total net assets 374,141,529 61,404,834 978,170,831 767,034,947 15,532,138
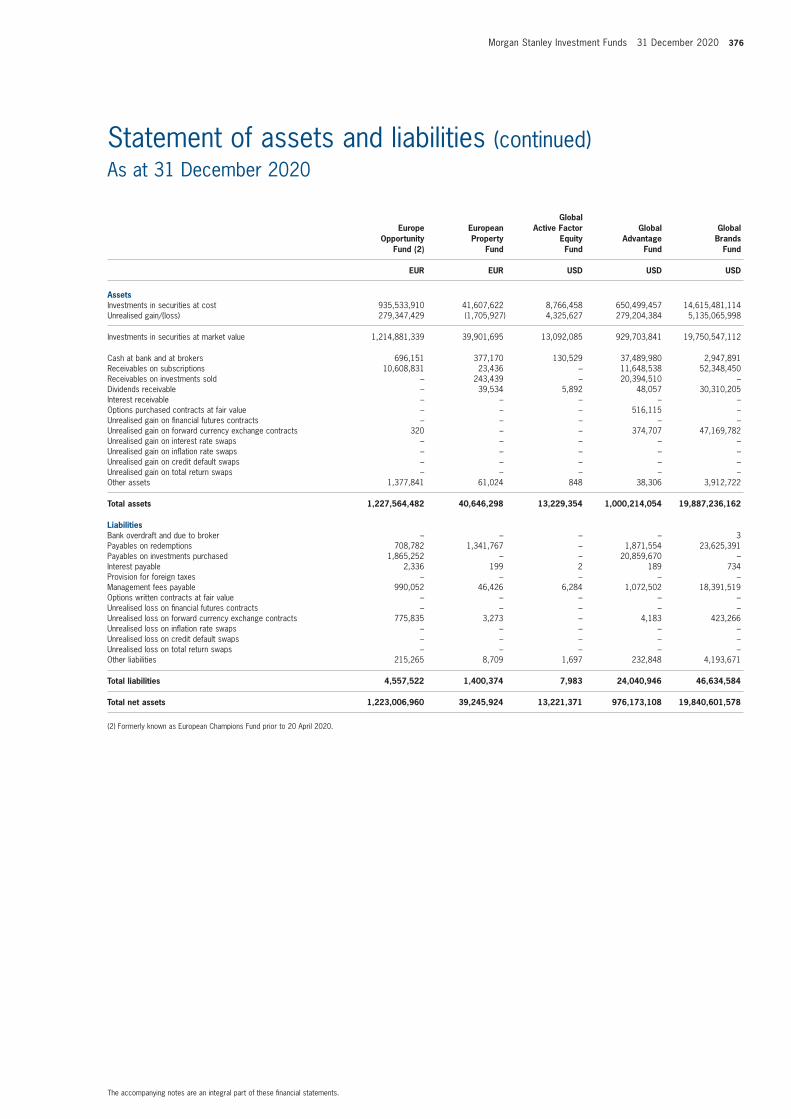
Morgan Stanley Investment Funds 31 December 2020 376
The accompanying notes are an integral part of these financial statements.
Statement of assets and liabilities (continued)As at 31 December 2020
Europe Opportunity
Fund (2)
EuropeanProperty
Fund
GlobalActive Factor
EquityFund
GlobalAdvantage
Fund
GlobalBrands
Fund
EUR EUR USD USD USD
AssetsInvestments in securities at cost 935,533,910 41,607,622 8,766,458 650,499,457 14,615,481,114Unrealised gain/(loss) 279,347,429 (1,705,927) 4,325,627 279,204,384 5,135,065,998
Investments in securities at market value 1,214,881,339 39,901,695 13,092,085 929,703,841 19,750,547,112
Cash at bank and at brokers 696,151 377,170 130,529 37,489,980 2,947,891Receivables on subscriptions 10,608,831 23,436 – 11,648,538 52,348,450Receivables on investments sold – 243,439 – 20,394,510 –Dividends receivable – 39,534 5,892 48,057 30,310,205Interest receivable – – – – –Options purchased contracts at fair value – – – 516,115 –Unrealised gain on financial futures contracts – – – – –Unrealised gain on forward currency exchange contracts 320 – – 374,707 47,169,782Unrealised gain on interest rate swaps – – – – –Unrealised gain on inflation rate swaps – – – – –Unrealised gain on credit default swaps – – – – –Unrealised gain on total return swaps – – – – –Other assets 1,377,841 61,024 848 38,306 3,912,722
Total assets 1,227,564,482 40,646,298 13,229,354 1,000,214,054 19,887,236,162
LiabilitiesBank overdraft and due to broker – – – – 3Payables on redemptions 708,782 1,341,767 – 1,871,554 23,625,391Payables on investments purchased 1,865,252 – – 20,859,670 –Interest payable 2,336 199 2 189 734Provision for foreign taxes – – – – –Management fees payable 990,052 46,426 6,284 1,072,502 18,391,519Options written contracts at fair value – – – – –Unrealised loss on financial futures contracts – – – – –Unrealised loss on forward currency exchange contracts 775,835 3,273 – 4,183 423,266Unrealised loss on inflation rate swaps – – – – –Unrealised loss on credit default swaps – – – – –Unrealised loss on total return swaps – – – – –Other liabilities 215,265 8,709 1,697 232,848 4,193,671
Total liabilities 4,557,522 1,400,374 7,983 24,040,946 46,634,584
Total net assets 1,223,006,960 39,245,924 13,221,371 976,173,108 19,840,601,578
(2) Formerly known as European Champions Fund prior to 20 April 2020.

377 Morgan Stanley Investment Funds 31 December 2020
The accompanying notes are an integral part of these financial statements.
Statement of assets and liabilities (continued)As at 31 December 2020
Global
BrandsEquity Income
Fund
Global Endurance
Fund
GlobalInfrastructure
Fund
Global
InfrastructureUnconstrained
Fund
GlobalOpportunity
Fund
USD USD USD USD USD
AssetsInvestments in securities at cost 395,855,919 16,728,815 790,576,703 5,036,088 12,884,777,391Unrealised gain/(loss) 75,465,920 6,257,984 82,992,631 562,565 8,220,405,281
Investments in securities at market value 471,321,839 22,986,799 873,569,334 5,598,653 21,105,182,672
Cash at bank and at brokers 316,636 107,650 790,329 109,303 42,580,871Receivables on subscriptions 711,062 119,688 2,960,041 – 73,199,187Receivables on investments sold – – 2,092,083 6,248 328,217,731Dividends receivable 699,869 1,317 1,932,367 7,016 157,989Interest receivable 1,934,676 – – – –Options purchased contracts at fair value – – – 14,580 –Unrealised gain on financial futures contracts – – – – –Unrealised gain on forward currency exchange contracts 1,417,544 2 1,936,137 587 30,635,972Unrealised gain on interest rate swaps – – – – –Unrealised gain on inflation rate swaps – – – – –Unrealised gain on credit default swaps – – – – –Unrealised gain on total return swaps – – – – –Other assets 45,485 473 86,331 415 606,980
Total assets 476,447,111 23,215,929 883,366,622 5,736,802 21,580,581,402
LiabilitiesBank overdraft and due to broker – – – 1 –Payables on redemptions 347,185 511,200 766,934 – 35,972,324Payables on investments purchased – 456,759 1,674,581 11,861 571,148,538Interest payable 24 1 54 – 3Provision for foreign taxes – – – – 44,527,956Management fees payable 550,449 2,638 852,070 3,681 20,749,693Options written contracts at fair value – – – – –Unrealised loss on financial futures contracts – – – – –Unrealised loss on forward currency exchange contracts 4,102 96 14,989 8,100 108,614Unrealised loss on inflation rate swaps – – – – –Unrealised loss on credit default swaps – – – – –Unrealised loss on total return swaps 2,113,470 – – – –Other liabilities 194,295 15,341 187,343 734 4,139,987
Total liabilities 3,209,525 986,035 3,495,971 24,377 676,647,115
Total net assets 473,237,586 22,229,894 879,870,651 5,712,425 20,903,934,287

Morgan Stanley Investment Funds 31 December 2020 378
The accompanying notes are an integral part of these financial statements.
Statement of assets and liabilities (continued)As at 31 December 2020
Global Permanence
Fund
GlobalProperty
Fund
GlobalProperty
UnconstrainedFund
GlobalQuality
Fund
GlobalSustain
Fund
USD USD USD USD USD
AssetsInvestments in securities at cost 6,399,400 591,530,650 4,818,346 1,471,514,039 937,110,905Unrealised gain/(loss) 1,377,397 19,634,556 (781,876) 553,955,599 124,259,398
Investments in securities at market value 7,776,797 611,165,206 4,036,470 2,025,469,638 1,061,370,303
Cash at bank and at brokers 177,782 7,912,807 145,845 444,550 312,773Receivables on subscriptions – 342,262 – 3,506,560 1,276,364Receivables on investments sold 161,064 446,338 – 14,110,226 –Dividends receivable 908 1,893,325 15,730 3,125,759 743,230Interest receivable – – – – –Options purchased contracts at fair value 4,811 – – – –Unrealised gain on financial futures contracts – – – – –Unrealised gain on forward currency exchange contracts – 649,362 – 2,835,887 2,634,621Unrealised gain on interest rate swaps – – – – –Unrealised gain on inflation rate swaps – – – – –Unrealised gain on credit default swaps – – – – –Unrealised gain on total return swaps – – – – –Other assets 139 356,723 122 781,218 133,607
Total assets 8,121,501 622,766,023 4,198,167 2,050,273,838 1,066,470,898
LiabilitiesBank overdraft and due to broker – 1 – 3 –Payables on redemptions – 221,656 – 10,834,271 569,242Payables on investments purchased 156,094 943,754 169,411 – –Interest payable 2 2,853 1 88 –Provision for foreign taxes – – – – –Management fees payable 346 517,525 2,613 1,754,263 664,901Options written contracts at fair value – – – – –Unrealised loss on financial futures contracts – – – – –Unrealised loss on forward currency exchange contracts – 212 – 9,985 6,336Unrealised loss on inflation rate swaps – – – – –Unrealised loss on credit default swaps – – – – –Unrealised loss on total return swaps – – – – –Other liabilities 6,196 92,280 521 401,245 174,873
Total liabilities 162,638 1,778,281 172,546 12,999,855 1,415,352
Total net assets 7,958,863 620,987,742 4,025,621 2,037,273,983 1,065,055,546

379 Morgan Stanley Investment Funds 31 December 2020
The accompanying notes are an integral part of these financial statements.
Statement of assets and liabilities (continued)As at 31 December 2020
IndianEquityFund
International
Equity(ex US)
Fund
JapaneseEquityFund
Latin
AmericanEquityFund
Sustainable Asian
Equity Fund (3)
USD USD JPY000’s USD USD
AssetsInvestments in securities at cost 69,479,737 92,311,149 8,774,102 187,974,684 26,222,359Unrealised gain/(loss) 15,643,360 16,891,444 919,388 43,547,041 11,014,749
Investments in securities at market value 85,123,097 109,202,593 9,693,490 231,521,725 37,237,108
Cash at bank and at brokers 1,981,675 156,899 266,191 594,794 161,670Receivables on subscriptions 89,501 305,092 7,605 79,888 77,462Receivables on investments sold 11,190 – 81,827 1,110,948 –Dividends receivable – 141,228 10,446 444,129 33,107Interest receivable – – – – –Options purchased contracts at fair value – – – – –Unrealised gain on financial futures contracts – – – – –Unrealised gain on forward currency exchange contracts 31 47 530 2 48Unrealised gain on interest rate swaps – – – – –Unrealised gain on inflation rate swaps – – – – –Unrealised gain on credit default swaps – – – – –Unrealised gain on total return swaps – – – – –Other assets 90,427 31,389 6 875 5,797
Total assets 87,295,921 109,837,248 10,060,095 233,752,361 37,515,192
LiabilitiesBank overdraft and due to broker – – – 16 2Payables on redemptions 224,092 22,716 3,544 137,046 94,921Payables on investments purchased – 243,568 87,812 1,291,378 –Interest payable – 69 62 33 –Provision for foreign taxes – – – – –Management fees payable 112,116 94,541 6,132 301,737 39,495Options written contracts at fair value – – – – –Unrealised loss on financial futures contracts – – – – –Unrealised loss on forward currency exchange contracts 25 13 167 1 15Unrealised loss on inflation rate swaps – – – – –Unrealised loss on credit default swaps – – – – –Unrealised loss on total return swaps – – – – –Other liabilities 30,316 18,446 1,387 55,534 10,769
Total liabilities 366,549 379,353 99,104 1,785,745 145,202
Total net assets 86,929,372 109,457,895 9,960,991 231,966,616 37,369,990
(3) Formerly known as Asian Equity Fund prior to 31 December 2020.

Morgan Stanley Investment Funds 31 December 2020 380
The accompanying notes are an integral part of these financial statements.
Statement of assets and liabilities (continued)As at 31 December 2020
USActive Factor
EquityFund
USAdvantage
Fund
USGrowth
Fund
USInsight
Fund
US Permanence
Fund (4)
USD USD USD USD USD
AssetsInvestments in securities at cost 33,671,433 9,925,920,932 4,235,774,628 91,161,867 5,069,883Unrealised gain/(loss) 14,680,693 5,594,639,470 2,520,801,336 19,443,840 596,500
Investments in securities at market value 48,352,126 15,520,560,402 6,756,575,964 110,605,707 5,666,383
Cash at bank and at brokers 211,060 3,020 2,529 760,624 55,399Receivables on subscriptions – 54,096,702 62,372,751 880,555 –Receivables on investments sold – 46,876,180 43,552,170 927,082 29,930Dividends receivable 18,774 609,740 – – 783Interest receivable – – – – –Options purchased contracts at fair value – 10,436,055 4,085,900 58,679 –Unrealised gain on financial futures contracts – – – – –Unrealised gain on forward currency exchange contracts – 22,914,236 11,388,394 126 –Unrealised gain on interest rate swaps – – – – –Unrealised gain on inflation rate swaps – – – – –Unrealised gain on credit default swaps – – – – –Unrealised gain on total return swaps – – – – –Other assets 445 34,024 24,854 107,043 –
Total assets 48,582,405 15,655,530,359 6,878,002,562 113,339,816 5,752,495
LiabilitiesBank overdraft and due to broker – 10,670,981 4,176,815 – –Payables on redemptions – 41,782,403 21,879,806 562,470 –Payables on investments purchased – 96,181,399 13,944,172 245,138 42,456Interest payable – 1 – – 14Provision for foreign taxes – – – – –Management fees payable 18,973 13,470,964 6,387,967 81,711 –Options written contracts at fair value – – – – –Unrealised loss on financial futures contracts – – – – –Unrealised loss on forward currency exchange contracts – 171,920 83,614 29 –Unrealised loss on inflation rate swaps – – – – –Unrealised loss on credit default swaps – – – – –Unrealised loss on total return swaps – – – – –Other liabilities 6,179 2,782,167 1,307,069 39,195 4,030
Total liabilities 25,152 165,059,835 47,779,443 928,543 46,500
Total net assets 48,557,253 15,490,470,524 6,830,223,119 112,411,273 5,705,995
(4) Fund commenced operations on 30 October 2020.

381 Morgan Stanley Investment Funds 31 December 2020
The accompanying notes are an integral part of these financial statements.
Statement of assets and liabilities (continued)As at 31 December 2020
USProperty
Fund
Emerging
MarketsCorporate Debt
Fund
EmergingMarkets
DebtFund
EmergingMarkets
Domestic DebtFund
Emerging MarketsFixed IncomeOpportunities
Fund
USD USD USD USD USD
AssetsInvestments in securities at cost 71,740,293 1,223,438,944 192,808,373 160,871,606 206,435,669Unrealised gain/(loss) 1,923,760 48,838,012 1,874,046 3,477,800 5,344,309
Investments in securities at market value 73,664,053 1,272,276,956 194,682,419 164,349,406 211,779,978
Cash at bank and at brokers 333,824 582,226 548,032 592,420 458,305Receivables on subscriptions 46,543 878,456 655,462 81,972 187,013Receivables on investments sold 17,612 – – – –Dividends receivable 344,493 – – – –Interest receivable – 16,396,775 2,621,356 2,563,585 3,189,899Options purchased contracts at fair value – – – – –Unrealised gain on financial futures contracts – – – – –Unrealised gain on forward currency exchange contracts 1 3,330,804 293,549 311,371 1,883,201Unrealised gain on interest rate swaps – – – – –Unrealised gain on inflation rate swaps – – – – –Unrealised gain on credit default swaps – – – – –Unrealised gain on total return swaps – – – – –Other assets 1,393,507 1,902 123 270,422 116,222
Total assets 75,800,033 1,293,467,119 198,800,941 168,169,176 217,614,618
LiabilitiesBank overdraft and due to broker – 49,773 – 9 1Payables on redemptions 33,969 1,753,079 93,853 33,302 224,911Payables on investments purchased – – – – –Interest payable 1 89 46 120 24Provision for foreign taxes – – – – –Management fees payable 74,153 923,875 206,921 138,120 121,657Options written contracts at fair value – – – – –Unrealised loss on financial futures contracts – – – – –Unrealised loss on forward currency exchange contracts 1 508,968 39,929 74,038 132,066Unrealised loss on inflation rate swaps – – – – –Unrealised loss on credit default swaps – – – – –Unrealised loss on total return swaps – – – – –Other liabilities 14,349 256,500 67,778 41,394 88,754
Total liabilities 122,473 3,492,284 408,527 286,983 567,413
Total net assets 75,677,560 1,289,974,835 198,392,414 167,882,193 217,047,205

Morgan Stanley Investment Funds 31 December 2020 382
The accompanying notes are an integral part of these financial statements.
Statement of assets and liabilities (continued)As at 31 December 2020
EuroBondFund
EuroCorporate
BondFund
Euro Corporate
Bond – Duration Hedged
Fund
EuroStrategic
BondFund
European Fixed Income Opportunities
Fund
EUR EUR EUR EUR EUR
AssetsInvestments in securities at cost 752,401,824 3,312,048,303 249,681,493 1,745,118,644 197,997,257Unrealised gain/(loss) 40,761,939 210,834,208 14,775,798 92,497,607 2,714,328
Investments in securities at market value 793,163,763 3,522,882,511 264,457,291 1,837,616,251 200,711,585
Cash at bank and at brokers 3,034,715 10,278,890 5,501,235 15,009,644 7,075,748Receivables on subscriptions 886,600 5,875,650 1,091,738 6,497,383 1,606,149Receivables on investments sold – – – – –Dividends receivable – – – – –Interest receivable 3,249,367 31,861,904 2,557,069 11,390,476 1,715,386Options purchased contracts at fair value – – – – –Unrealised gain on financial futures contracts 109,600 473,189 196,165 126,498 27,390Unrealised gain on forward currency exchange contracts – 2,443,361 228,151 3,802,584 1,128,456Unrealised gain on interest rate swaps – – – – –Unrealised gain on inflation rate swaps – – – – –Unrealised gain on credit default swaps – – – – –Unrealised gain on total return swaps – – – – –Other assets – 27,065 – 189,138 6,797
Total assets 800,444,045 3,573,842,570 274,031,649 1,874,631,974 212,271,511
LiabilitiesBank overdraft and due to broker 221,001 5,385,477 – 458,394 50,886Payables on redemptions 411,349 1,168,993 217,236 4,155,490 1,397,130Payables on investments purchased – – – – –Interest payable 474 1,959 376 2,953 733Provision for foreign taxes – – – – 3Management fees payable 221,183 1,168,674 117,209 969,099 154,135Options written contracts at fair value – – – – –Unrealised loss on financial futures contracts 45,488 199,071 19,292 106,860 5,662Unrealised loss on forward currency exchange contracts – 254,687 – 3,729,297 438,908Unrealised loss on inflation rate swaps – – – – –Unrealised loss on credit default swaps – – – 6,565,948 1,247,187Unrealised loss on total return swaps – – – – –Other liabilities 145,273 529,015 41,719 478,517 83,528
Total liabilities 1,044,768 8,707,876 395,832 16,466,558 3,378,172
Total net assets 799,399,277 3,565,134,694 273,635,817 1,858,165,416 208,893,339

383 Morgan Stanley Investment Funds 31 December 2020
The accompanying notes are an integral part of these financial statements.
Statement of assets and liabilities (continued)As at 31 December 2020
European
High Yield Bond Fund
GlobalAsset Backed
SecuritiesFund
GlobalBondFund
GlobalConvertible
BondFund
GlobalCreditFund
EUR USD USD USD USD
AssetsInvestments in securities at cost 794,131,265 1,228,042,810 1,731,539,394 393,993,200 124,640,426Unrealised gain/(loss) 17,044,767 30,999,466 111,867,162 52,028,945 10,267,083
Investments in securities at market value 811,176,032 1,259,042,276 1,843,406,556 446,022,145 134,907,509
Cash at bank and at brokers 13,660,859 6,520,590 96,582,898 3,258,804 1,410,261Receivables on subscriptions 356,144 799,795 2,354,207 1,440,518 588,978Receivables on investments sold – 53,835,235 17,944 – –Dividends receivable – – – – –Interest receivable 10,418,855 2,512,495 10,407,874 611,206 1,196,198Options purchased contracts at fair value – – – 11,469,647 –Unrealised gain on financial futures contracts – – 280,877 – 87,276Unrealised gain on forward currency exchange contracts 209,475 8,725,077 13,575,321 2,271,679 518,283Unrealised gain on interest rate swaps – – 44,898 – –Unrealised gain on inflation rate swaps – – – – –Unrealised gain on credit default swaps – – – – –Unrealised gain on total return swaps – – – – –Other assets 3,393 3,289 51,627 27,096 2,807
Total assets 835,824,758 1,331,438,757 1,966,722,202 465,101,095 138,711,312
LiabilitiesBank overdraft and due to broker 4,231,084 1,997,086 20,728 – –Payables on redemptions 270,683 338,894 1,166,610 237,130 65,527Payables on investments purchased – 128,041,988 152,004,810 – –Interest payable 477 1,380 2,345 1,101 23Provision for foreign taxes – – – – –Management fees payable 395,226 580,197 777,771 279,715 60,500Options written contracts at fair value – – – 4,244,123 –Unrealised loss on financial futures contracts – 833,961 29,306 – 105,316Unrealised loss on forward currency exchange contracts 488,487 14,809,702 9,182,703 3,052,517 260,729Unrealised loss on inflation rate swaps – – – – –Unrealised loss on credit default swaps – – – – 180,328Unrealised loss on total return swaps – – – – –Other liabilities 218,283 241,609 341,355 92,233 30,618
Total liabilities 5,604,240 146,844,817 163,525,628 7,906,819 703,041
Total net assets 830,220,518 1,184,593,940 1,803,196,574 457,194,276 138,008,271
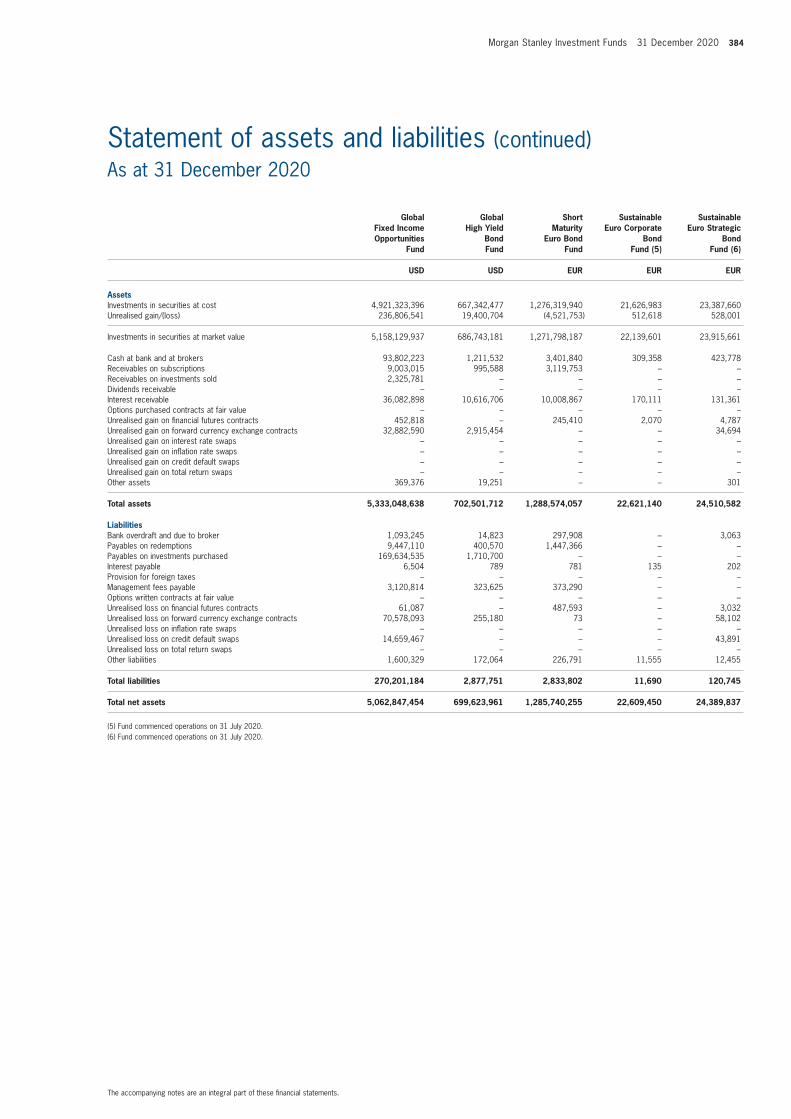
Morgan Stanley Investment Funds 31 December 2020 384
The accompanying notes are an integral part of these financial statements.
Statement of assets and liabilities (continued)As at 31 December 2020
GlobalFixed IncomeOpportunities
Fund
Global
High YieldBondFund
ShortMaturity
Euro BondFund
Sustainable Euro Corporate
Bond Fund (5)
Sustainable Euro Strategic
Bond Fund (6)
USD USD EUR EUR EUR
AssetsInvestments in securities at cost 4,921,323,396 667,342,477 1,276,319,940 21,626,983 23,387,660Unrealised gain/(loss) 236,806,541 19,400,704 (4,521,753) 512,618 528,001
Investments in securities at market value 5,158,129,937 686,743,181 1,271,798,187 22,139,601 23,915,661
Cash at bank and at brokers 93,802,223 1,211,532 3,401,840 309,358 423,778Receivables on subscriptions 9,003,015 995,588 3,119,753 – –Receivables on investments sold 2,325,781 – – – –Dividends receivable – – – – –Interest receivable 36,082,898 10,616,706 10,008,867 170,111 131,361Options purchased contracts at fair value – – – – –Unrealised gain on financial futures contracts 452,818 – 245,410 2,070 4,787Unrealised gain on forward currency exchange contracts 32,882,590 2,915,454 – – 34,694Unrealised gain on interest rate swaps – – – – –Unrealised gain on inflation rate swaps – – – – –Unrealised gain on credit default swaps – – – – –Unrealised gain on total return swaps – – – – –Other assets 369,376 19,251 – – 301
Total assets 5,333,048,638 702,501,712 1,288,574,057 22,621,140 24,510,582
LiabilitiesBank overdraft and due to broker 1,093,245 14,823 297,908 – 3,063Payables on redemptions 9,447,110 400,570 1,447,366 – –Payables on investments purchased 169,634,535 1,710,700 – – –Interest payable 6,504 789 781 135 202Provision for foreign taxes – – – – –Management fees payable 3,120,814 323,625 373,290 – –Options written contracts at fair value – – – – –Unrealised loss on financial futures contracts 61,087 – 487,593 – 3,032Unrealised loss on forward currency exchange contracts 70,578,093 255,180 73 – 58,102Unrealised loss on inflation rate swaps – – – – –Unrealised loss on credit default swaps 14,659,467 – – – 43,891Unrealised loss on total return swaps – – – – –Other liabilities 1,600,329 172,064 226,791 11,555 12,455
Total liabilities 270,201,184 2,877,751 2,833,802 11,690 120,745
Total net assets 5,062,847,454 699,623,961 1,285,740,255 22,609,450 24,389,837
(5) Fund commenced operations on 31 July 2020.(6) Fund commenced operations on 31 July 2020.

385 Morgan Stanley Investment Funds 31 December 2020
The accompanying notes are an integral part of these financial statements.
Statement of assets and liabilities (continued)As at 31 December 2020
US DollarCorporate
BondFund
US DollarHigh Yield
BondFund
US DollarShort Duration
BondFund
US Dollar
Short DurationHigh Yield Bond
Fund
GlobalBalancedDefensive
Fund
USD USD USD USD EUR
AssetsInvestments in securities at cost 311,520,485 436,672,622 307,006,362 141,001,153 54,459,654Unrealised gain/(loss) 6,758,007 14,720,304 1,994,377 3,356,574 1,567,788
Investments in securities at market value 318,278,492 451,392,926 309,000,739 144,357,727 56,027,442
Cash at bank and at brokers 8,023,593 4,539,847 626,536 1,815,884 2,748,461Receivables on subscriptions 736,441 1,831,018 346,797 301,925 124,952Receivables on investments sold – – – – –Dividends receivable – – – – 10,432Interest receivable 2,308,367 7,262,829 1,465,625 2,239,104 290,989Options purchased contracts at fair value – – – – 680,643Unrealised gain on financial futures contracts 410,645 – – – 33,435Unrealised gain on forward currency exchange contracts 266 1,297,013 – 85,370 272,010Unrealised gain on interest rate swaps – – – – –Unrealised gain on inflation rate swaps – – – – –Unrealised gain on credit default swaps – – – – 687,000Unrealised gain on total return swaps – – – – –Other assets 9 – – 4 15,069
Total assets 329,757,813 466,323,633 311,439,697 148,800,014 60,890,433
LiabilitiesBank overdraft and due to broker 14,193 12,566 – – 989,210Payables on redemptions – 16,110 467,442 67,255 61,824Payables on investments purchased – 1,157,175 – 1,250,000 –Interest payable 7 – – – 1,024Provision for foreign taxes – – – – –Management fees payable 102,849 179,671 74,562 76,759 53,755Options written contracts at fair value – – – – –Unrealised loss on financial futures contracts 300,293 – 58,936 – 107,041Unrealised loss on forward currency exchange contracts 31,118 1,626 – 1,522 11,681Unrealised loss on inflation rate swaps – – – – –Unrealised loss on credit default swaps 66,114 – – – 886Unrealised loss on total return swaps – – – – –Other liabilities 42,963 88,164 56,590 36,587 45,411
Total liabilities 557,537 1,455,312 657,530 1,432,123 1,270,832
Total net assets 329,200,276 464,868,321 310,782,167 147,367,891 59,619,601

Morgan Stanley Investment Funds 31 December 2020 386
The accompanying notes are an integral part of these financial statements.
Statement of assets and liabilities (continued)As at 31 December 2020
GlobalBalanced
Fund
GlobalBalanced
IncomeFund
Global
BalancedRisk Control
Fund of Funds
Global Balanced
Sustainable Fund (7)
Global
Multi-AssetIncome
Fund
EUR EUR EUR EUR EUR
AssetsInvestments in securities at cost 971,650,588 252,899,902 3,387,606,540 18,708,062 13,568,173Unrealised gain/(loss) 33,604,131 14,627,705 349,202,544 100,326 81,297
Investments in securities at market value 1,005,254,719 267,527,607 3,736,809,084 18,808,388 13,649,470
Cash at bank and at brokers 78,199,505 22,318,536 195,729,981 1,319,605 2,303,790Receivables on subscriptions 886,388 483,735 8,852,405 – –Receivables on investments sold – – – – 118,196Dividends receivable 266,865 87,192 – 3,439 5,530Interest receivable 3,768,361 818,389 – 78,622 39,590Options purchased contracts at fair value 19,604,549 – 69,849,643 – –Unrealised gain on financial futures contracts 1,358,448 363,574 4,266,573 24,453 47,530Unrealised gain on forward currency exchange contracts 4,792,569 1,071,813 11,738 132,794 111,224Unrealised gain on interest rate swaps – – – – 28,370Unrealised gain on inflation rate swaps – – – – 36,522Unrealised gain on credit default swaps 9,570,649 2,289,575 – 206,782 2,105Unrealised gain on total return swaps – – – – 122,647Other assets 162,118 188,640 3,611,696 – 386
Total assets 1,123,864,171 295,149,061 4,019,131,120 20,574,083 16,465,360
LiabilitiesBank overdraft and due to broker 13,788,531 4,521,767 2,170,478 71,877 256,526Payables on redemptions 991,332 643,818 8,235,593 – –Payables on investments purchased – – – – 598,148Interest payable 50,272 8,442 149,532 535 301Provision for foreign taxes – – – – –Management fees payable 560,808 358,381 5,539,022 – 8,542Options written contracts at fair value – 271,805 – – 47,579Unrealised loss on financial futures contracts 341,325 436,642 – – 15,931Unrealised loss on forward currency exchange contracts 121,568 272,755 2,391,811 16,217 43,213Unrealised loss on inflation rate swaps – – – – –Unrealised loss on credit default swaps 121,641 4,432 – 3,253 –Unrealised loss on total return swaps – – – – 35,084Other liabilities 142,048 144,273 1,108,799 13,328 2,788
Total liabilities 16,117,525 6,662,315 19,595,235 105,210 1,008,112
Total net assets 1,107,746,646 288,486,746 3,999,535,885 20,468,873 15,457,248
(7) Fund commenced operations on 30 June 2020.
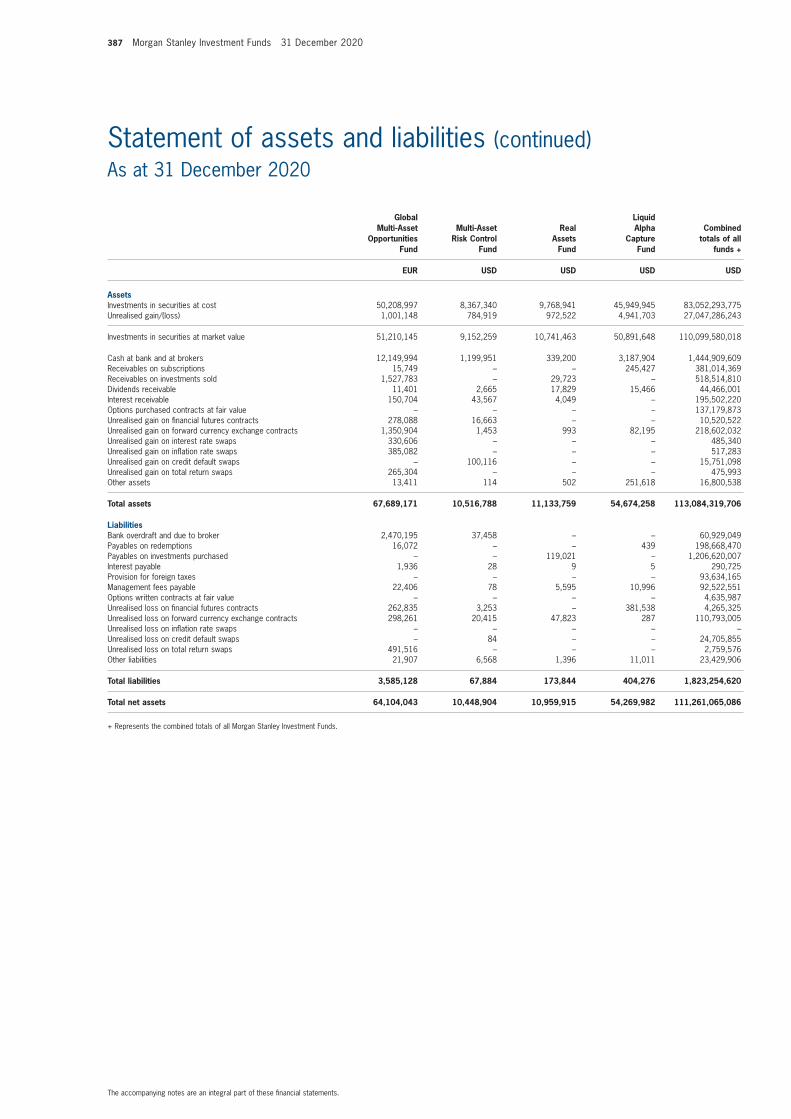
387 Morgan Stanley Investment Funds 31 December 2020
The accompanying notes are an integral part of these financial statements.
Statement of assets and liabilities (continued)As at 31 December 2020
GlobalMulti-Asset
OpportunitiesFund
Multi-Asset Risk Control
Fund
Real Assets
Fund
Liquid Alpha
Capture Fund
Combined totals of all
funds +
EUR USD USD USD USD
AssetsInvestments in securities at cost 50,208,997 8,367,340 9,768,941 45,949,945 83,052,293,775Unrealised gain/(loss) 1,001,148 784,919 972,522 4,941,703 27,047,286,243
Investments in securities at market value 51,210,145 9,152,259 10,741,463 50,891,648 110,099,580,018
Cash at bank and at brokers 12,149,994 1,199,951 339,200 3,187,904 1,444,909,609Receivables on subscriptions 15,749 – – 245,427 381,014,369Receivables on investments sold 1,527,783 – 29,723 – 518,514,810Dividends receivable 11,401 2,665 17,829 15,466 44,466,001Interest receivable 150,704 43,567 4,049 – 195,502,220Options purchased contracts at fair value – – – – 137,179,873Unrealised gain on financial futures contracts 278,088 16,663 – – 10,520,522Unrealised gain on forward currency exchange contracts 1,350,904 1,453 993 82,195 218,602,032Unrealised gain on interest rate swaps 330,606 – – – 485,340Unrealised gain on inflation rate swaps 385,082 – – – 517,283Unrealised gain on credit default swaps – 100,116 – – 15,751,098Unrealised gain on total return swaps 265,304 – – – 475,993Other assets 13,411 114 502 251,618 16,800,538
Total assets 67,689,171 10,516,788 11,133,759 54,674,258 113,084,319,706
LiabilitiesBank overdraft and due to broker 2,470,195 37,458 – – 60,929,049Payables on redemptions 16,072 – – 439 198,668,470Payables on investments purchased – – 119,021 – 1,206,620,007Interest payable 1,936 28 9 5 290,725Provision for foreign taxes – – – – 93,634,165Management fees payable 22,406 78 5,595 10,996 92,522,551Options written contracts at fair value – – – – 4,635,987Unrealised loss on financial futures contracts 262,835 3,253 – 381,538 4,265,325Unrealised loss on forward currency exchange contracts 298,261 20,415 47,823 287 110,793,005Unrealised loss on inflation rate swaps – – – – –Unrealised loss on credit default swaps – 84 – – 24,705,855Unrealised loss on total return swaps 491,516 – – – 2,759,576Other liabilities 21,907 6,568 1,396 11,011 23,429,906
Total liabilities 3,585,128 67,884 173,844 404,276 1,823,254,620
Total net assets 64,104,043 10,448,904 10,959,915 54,269,982 111,261,065,086
+ Represents the combined totals of all Morgan Stanley Investment Funds.

Morgan Stanley Investment Funds 31 December 2020 388
The accompanying notes are an integral part of these financial statements.
Statement of operations and changes in net assetsFor the year ended 31 December 2020
AsiaOpportunity
Fund
AsianProperty
Fund
BreakoutNations
Fund (1)
China A-shares
Fund
China Equity Fund
USD USD USD USD USD
Net assets at the beginning of the year 1,471,425,447 104,898,189 6,104,990 105,873,631 11,112,450
Income
Dividend income, net of withholding taxes 14,331,257 2,720,041 59,481 1,414,469 153,424Interest income from investments, net of withholding taxes – – – – –Interest on swap contracts – – – – –Securities lending income – – – – –Bank interest 254,341 568 1,049 5,374 2,067Other income – – – – –
Total income 14,585,598 2,720,609 60,530 1,419,843 155,491
Expenses
Management fees 30,483,401 962,103 37,879 797,641 92,851Administration charge 4,701,061 144,018 5,621 97,166 11,936Distribution fees 902,008 11,386 3,625 11,283 1,171Interest on swap contracts – – – – –Bank and other interest expenses 750 1 2 – 10Tax charge 40,152,361 – – – –Specific additional costs – – – – – Taxe d’abonnement 770,607 40,141 755 24,000 1,382 Emerging markets custody fees 1,647,044 – – 63,253 11,935 Hedging expenses 136,094 – 129 3,285 –
Total expenses 78,793,326 1,157,649 48,011 996,628 119,285
Plus: Fee waiver 33,345 – – – –
Net investment income/(loss) (64,174,383) 1,562,960 12,519 423,215 36,206
Net realised gain/(loss) on: Investments 171,032,368 (1,649,533) (320,075) 19,320 413,521 Options contracts (2,455,065) – – – – Financial futures contracts – – (47,677) – – Forward currency exchange contracts 30,968,094 24,078 2,290 534,028 7 Credit default swaps – – – – – Interest rate swaps – – – – – Inflation rate swaps – – – – – Total return swaps – – – – – Currency exchange 777,629 (23,151) 12,246 19,748 (400)
Net realised gain/(loss) for the year 200,323,026 (1,648,606) (353,216) 573,096 413,128
Net change in unrealised appreciation/(depreciation) on: Investments 1,513,595,001 (8,692,414) (395,038) 3,202,560 2,673,981 Options contracts 2,151,441 – – – – Financial futures contracts – – (2,525) – – Forward currency exchange contracts 6,539,147 (144) (6,047) 3,361 – Credit default swaps – – – – – Interest rate swaps – – – – – Inflation rate swaps – – – – – Total return swaps – – – – – Currency exchange 3,717,842 51 (2,590) (63) –
Net change in unrealised appreciation/(depreciation) for the year 1,526,003,431 (8,692,507) (406,200) 3,205,858 2,673,981
Increase/(decrease) in net assets as a result of operations 1,662,152,074 (8,778,153) (746,897) 4,202,169 3,123,315
Subscriptions 6,290,036,399 16,037,553 757,304 29,429,251 –Redemptions (2,301,682,525) (27,272,495) (6,115,397) (87,503,471) –
Increase/(decrease) in net assets as a result of movements in share capital 3,988,353,874 (11,234,942) (5,358,093) (58,074,220) –
Dividend distributions – (16,176) – – –Foreign currency translation difference – – – – –
Net assets at the end of the year 7,121,931,395 84,868,918 – 52,001,580 14,235,765
(1) Fund closed operations on 16 October 2020.
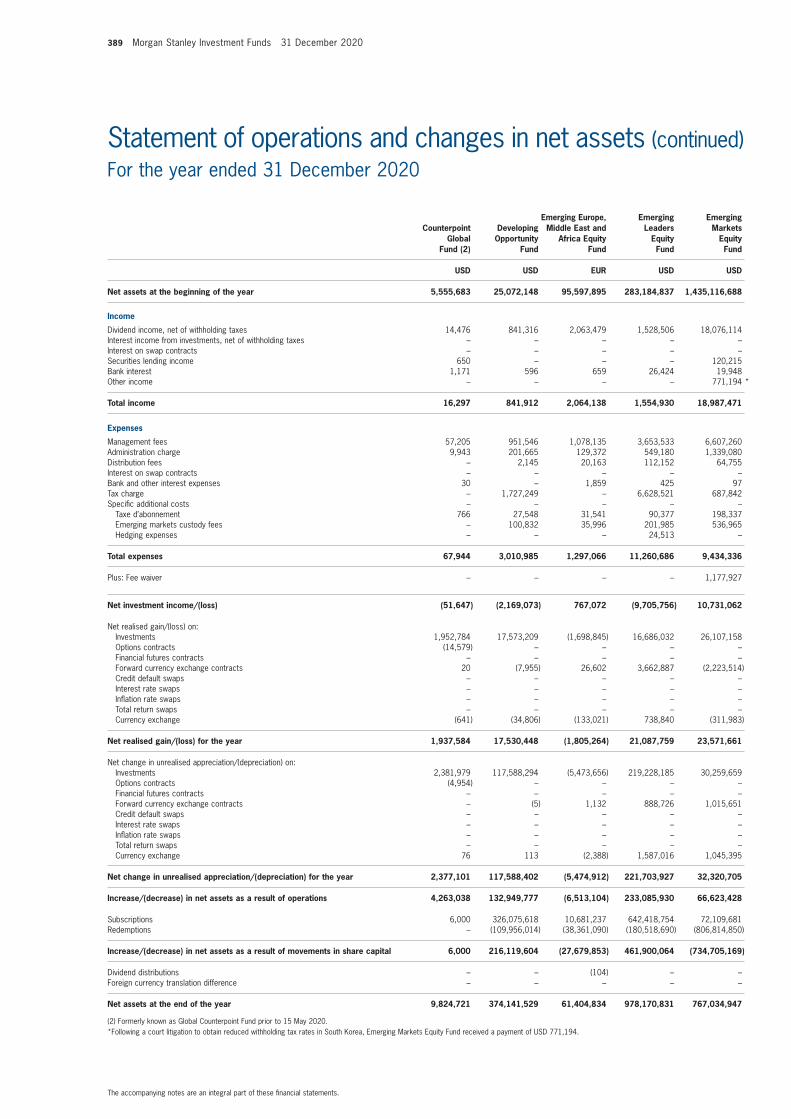
389 Morgan Stanley Investment Funds 31 December 2020
The accompanying notes are an integral part of these financial statements.
Statement of operations and changes in net assets (continued)For the year ended 31 December 2020
Counterpoint Global
Fund (2)
Developing Opportunity
Fund
Emerging Europe, Middle East and
Africa EquityFund
EmergingLeaders
EquityFund
Emerging
MarketsEquityFund
USD USD EUR USD USD
Net assets at the beginning of the year 5,555,683 25,072,148 95,597,895 283,184,837 1,435,116,688
Income
Dividend income, net of withholding taxes 14,476 841,316 2,063,479 1,528,506 18,076,114Interest income from investments, net of withholding taxes – – – – –Interest on swap contracts – – – – –Securities lending income 650 – – – 120,215Bank interest 1,171 596 659 26,424 19,948Other income – – – – 771,194 *
Total income 16,297 841,912 2,064,138 1,554,930 18,987,471
Expenses
Management fees 57,205 951,546 1,078,135 3,653,533 6,607,260Administration charge 9,943 201,665 129,372 549,180 1,339,080Distribution fees – 2,145 20,163 112,152 64,755Interest on swap contracts – – – – –Bank and other interest expenses 30 – 1,859 425 97Tax charge – 1,727,249 – 6,628,521 687,842Specific additional costs – – – – – Taxe d’abonnement 766 27,548 31,541 90,377 198,337 Emerging markets custody fees – 100,832 35,996 201,985 536,965 Hedging expenses – – – 24,513 –
Total expenses 67,944 3,010,985 1,297,066 11,260,686 9,434,336
Plus: Fee waiver – – – – 1,177,927
Net investment income/(loss) (51,647) (2,169,073) 767,072 (9,705,756) 10,731,062
Net realised gain/(loss) on: Investments 1,952,784 17,573,209 (1,698,845) 16,686,032 26,107,158 Options contracts (14,579) – – – – Financial futures contracts – – – – – Forward currency exchange contracts 20 (7,955) 26,602 3,662,887 (2,223,514) Credit default swaps – – – – – Interest rate swaps – – – – – Inflation rate swaps – – – – – Total return swaps – – – – – Currency exchange (641) (34,806) (133,021) 738,840 (311,983)
Net realised gain/(loss) for the year 1,937,584 17,530,448 (1,805,264) 21,087,759 23,571,661
Net change in unrealised appreciation/(depreciation) on: Investments 2,381,979 117,588,294 (5,473,656) 219,228,185 30,259,659 Options contracts (4,954) – – – – Financial futures contracts – – – – – Forward currency exchange contracts – (5) 1,132 888,726 1,015,651 Credit default swaps – – – – – Interest rate swaps – – – – – Inflation rate swaps – – – – – Total return swaps – – – – – Currency exchange 76 113 (2,388) 1,587,016 1,045,395
Net change in unrealised appreciation/(depreciation) for the year 2,377,101 117,588,402 (5,474,912) 221,703,927 32,320,705
Increase/(decrease) in net assets as a result of operations 4,263,038 132,949,777 (6,513,104) 233,085,930 66,623,428
Subscriptions 6,000 326,075,618 10,681,237 642,418,754 72,109,681Redemptions – (109,956,014) (38,361,090) (180,518,690) (806,814,850)
Increase/(decrease) in net assets as a result of movements in share capital 6,000 216,119,604 (27,679,853) 461,900,064 (734,705,169)
Dividend distributions – – (104) – –Foreign currency translation difference – – – – –
Net assets at the end of the year 9,824,721 374,141,529 61,404,834 978,170,831 767,034,947
(2) Formerly known as Global Counterpoint Fund prior to 15 May 2020.* Following a court litigation to obtain reduced withholding tax rates in South Korea, Emerging Markets Equity Fund received a payment of USD 771,194.

Morgan Stanley Investment Funds 31 December 2020 390
The accompanying notes are an integral part of these financial statements.
Statement of operations and changes in net assets (continued)For the year ended 31 December 2020
Emerging Markets
Small Cap Equity Fund
Europe Opportunity
Fund (3)
EuropeanProperty
Fund
Eurozone Equity Alpha
Fund (4)
Global Active Factor
EquityFund
USD EUR EUR EUR USD
Net assets at the beginning of the year 19,398,078 169,893,706 72,414,734 356,121,696 10,849,471
Income
Dividend income, net of withholding taxes 151,315 1,934,691 1,114,742 741,817 105,471Interest income from investments, net of withholding taxes – – – – –Interest on swap contracts – – – – –Securities lending income 5,656 – 22,015 15,131 –Bank interest 752 44 191 – 118Other income – – – – –
Total income 157,723 1,934,735 1,136,948 756,948 105,589
Expenses
Management fees 366,873 5,248,166 592,540 783,639 61,723Administration charge 25,015 766,470 81,988 134,357 15,359Distribution fees 31,386 212,666 6,159 29,006 –Interest on swap contracts – – – – –Bank and other interest expenses 56 3,643 2,186 7,628 9Tax charge 143,480 – – – –Specific additional costs – – – – – Taxe d’abonnement 7,522 152,093 21,029 15,534 1,363 Emerging markets custody fees 7,685 – – – – Hedging expenses 1,732 22,661 232 822 –
Total expenses 583,749 6,405,699 704,134 970,986 78,454
Plus: Fee waiver – – – – –
Net investment income/(loss) (426,026) (4,470,964) 432,814 (214,038) 27,135
Net realised gain/(loss) on: Investments (1,808,639) (7,195,976) (10,561,668) (49,298,414) (288,394) Options contracts – – – – – Financial futures contracts – – – – – Forward currency exchange contracts 205,011 (4,328,349) 8,429 253,881 – Credit default swaps – – – – – Interest rate swaps – – – – – Inflation rate swaps – – – – – Total return swaps – – – – – Currency exchange 162,273 (1,087,505) (44,215) (216,639) (129)
Net realised gain/(loss) for the year (1,441,355) (12,611,830) (10,597,454) (49,261,172) (288,523)
Net change in unrealised appreciation/(depreciation) on: Investments 2,013,953 272,392,083 (5,536,233) (31,414,971) 2,596,679 Options contracts – – – – – Financial futures contracts – – – – – Forward currency exchange contracts (7,427) (395,867) 8,458 70,399 – Credit default swaps – – – – – Interest rate swaps – – – – – Inflation rate swaps – – – – – Total return swaps – – – – – Currency exchange 96,924 (1,208) (3,072) 63,364 3
Net change in unrealised appreciation/(depreciation) for the year 2,103,450 271,995,008 (5,530,847) (31,281,208) 2,596,682
Increase/(decrease) in net assets as a result of operations 236,069 254,912,214 (15,695,487) (80,756,418) 2,335,294
Subscriptions 10,770,132 1,111,197,279 8,606,302 55,677,822 116,955Redemptions (14,872,141) (312,965,798) (26,072,952) (331,027,765) (80,349)
Increase/(decrease) in net assets as a result of movements in share capital (4,102,009) 798,231,481 (17,466,650) (275,349,943) 36,606
Dividend distributions – (30,441) (6,673) (15,335) –Foreign currency translation difference – – – – –
Net assets at the end of the year 15,532,138 1,223,006,960 39,245,924 – 13,221,371
(3) Formerly known as European Champions Fund prior to 20 April 2020.(4) Fund merged into Europe Opportunity Fund on 20 April 2020.

391 Morgan Stanley Investment Funds 31 December 2020
The accompanying notes are an integral part of these financial statements.
Statement of operations and changes in net assets (continued)For the year ended 31 December 2020
GlobalAdvantage
Fund
GlobalBrands
Fund
Global
Brands Equity Income
Fund
Global Endurance
Fund
GlobalInfrastructure
Fund
USD USD USD USD USD
Net assets at the beginning of the year 276,090,927 15,896,538,273 260,019,970 5,318,987 1,227,635,276
Income
Dividend income, net of withholding taxes 673,062 292,654,909 6,001,795 15,621 24,681,339Interest income from investments, net of withholding taxes – – – – –Interest on swap contracts – – 8,614,566 – –Securities lending income – – – – 372,951Bank interest 12 3,653 5,597 167 5,372Other income – – – – –
Total income 673,074 292,658,562 14,621,958 15,788 25,059,662
Expenses
Management fees 6,241,997 192,939,521 5,373,746 75,242 10,588,667Administration charge 802,331 25,775,406 517,384 8,339 1,457,364Distribution fees 349,401 7,321,501 990,967 1,364 443,215Interest on swap contracts – – – – –Bank and other interest expenses 2,063 7,423 204 2 3,127Tax charge – – – – –Specific additional costs – – – – – Taxe d’abonnement 174,482 6,190,099 129,618 1,280 252,885 Emerging markets custody fees 252 – – – – Hedging expenses 3,712 1,734,408 43,251 – 62,116
Total expenses 7,574,238 233,968,358 7,055,170 86,227 12,807,374
Plus: Fee waiver – – – – –
Net investment income/(loss) (6,901,164) 58,690,204 7,566,788 (70,439) 12,252,288
Net realised gain/(loss) on: Investments 87,502,833 828,201,785 9,628,292 917,390 (17,501,139) Options contracts (662,996) – – – – Financial futures contracts – – – – – Forward currency exchange contracts 838,799 247,905,943 8,580,216 12 10,941,735 Credit default swaps – – – – – Interest rate swaps – – – – – Inflation rate swaps – – – – – Total return swaps – – (10,800,276) – – Currency exchange (24,365) 86,866,460 1,632,803 882 2,463,326
Net realised gain/(loss) for the year 87,654,271 1,162,974,188 9,041,035 918,284 (4,096,078)
Net change in unrealised appreciation/(depreciation) on: Investments 255,525,053 1,130,464,550 35,128,501 5,947,029 (62,683,352) Options contracts (1,318,417) – – – – Financial futures contracts – – – – – Forward currency exchange contracts 367,011 14,781,252 720,241 (94) 572,031 Credit default swaps – – – – – Interest rate swaps – – – – – Inflation rate swaps – – – – – Total return swaps – – 31,621 – – Currency exchange 67,526 76,723 (3,282) 73 (6,607)
Net change in unrealised appreciation/(depreciation) for the year 254,641,173 1,145,322,525 35,877,081 5,947,008 (62,117,928)
Increase/(decrease) in net assets as a result of operations 335,394,280 2,366,986,917 52,484,904 6,794,853 (53,961,718)
Subscriptions 644,772,078 11,892,515,114 367,822,899 13,867,303 861,419,419Redemptions (280,084,177) (10,312,112,861) (196,284,143) (3,751,249) (1,153,325,986)
Increase/(decrease) in net assets as a result of movements in share capital 364,687,901 1,580,402,253 171,538,756 10,116,054 (291,906,567)
Dividend distributions – (3,325,865) (10,806,044) – (1,896,340)Foreign currency translation difference – – – – –
Net assets at the end of the year 976,173,108 19,840,601,578 473,237,586 22,229,894 879,870,651
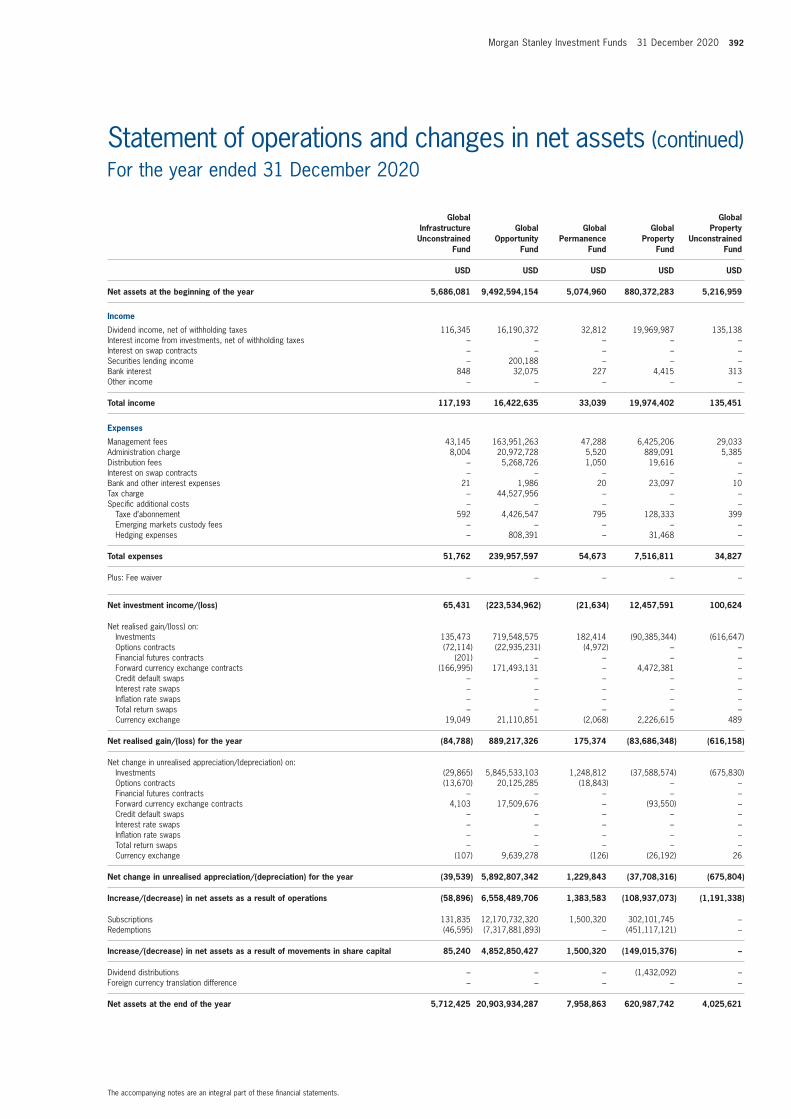
Morgan Stanley Investment Funds 31 December 2020 392
The accompanying notes are an integral part of these financial statements.
Statement of operations and changes in net assets (continued)For the year ended 31 December 2020
Global
InfrastructureUnconstrained
Fund
GlobalOpportunity
Fund
Global Permanence
Fund
GlobalProperty
Fund
Global
PropertyUnconstrained
Fund
USD USD USD USD USD
Net assets at the beginning of the year 5,686,081 9,492,594,154 5,074,960 880,372,283 5,216,959
Income
Dividend income, net of withholding taxes 116,345 16,190,372 32,812 19,969,987 135,138Interest income from investments, net of withholding taxes – – – – –Interest on swap contracts – – – – –Securities lending income – 200,188 – – –Bank interest 848 32,075 227 4,415 313Other income – – – – –
Total income 117,193 16,422,635 33,039 19,974,402 135,451
Expenses
Management fees 43,145 163,951,263 47,288 6,425,206 29,033Administration charge 8,004 20,972,728 5,520 889,091 5,385Distribution fees – 5,268,726 1,050 19,616 –Interest on swap contracts – – – – –Bank and other interest expenses 21 1,986 20 23,097 10Tax charge – 44,527,956 – – –Specific additional costs – – – – – Taxe d’abonnement 592 4,426,547 795 128,333 399 Emerging markets custody fees – – – – – Hedging expenses – 808,391 – 31,468 –
Total expenses 51,762 239,957,597 54,673 7,516,811 34,827
Plus: Fee waiver – – – – –
Net investment income/(loss) 65,431 (223,534,962) (21,634) 12,457,591 100,624
Net realised gain/(loss) on: Investments 135,473 719,548,575 182,414 (90,385,344) (616,647) Options contracts (72,114) (22,935,231) (4,972) – – Financial futures contracts (201) – – – – Forward currency exchange contracts (166,995) 171,493,131 – 4,472,381 – Credit default swaps – – – – – Interest rate swaps – – – – – Inflation rate swaps – – – – – Total return swaps – – – – – Currency exchange 19,049 21,110,851 (2,068) 2,226,615 489
Net realised gain/(loss) for the year (84,788) 889,217,326 175,374 (83,686,348) (616,158)
Net change in unrealised appreciation/(depreciation) on: Investments (29,865) 5,845,533,103 1,248,812 (37,588,574) (675,830) Options contracts (13,670) 20,125,285 (18,843) – – Financial futures contracts – – – – – Forward currency exchange contracts 4,103 17,509,676 – (93,550) – Credit default swaps – – – – – Interest rate swaps – – – – – Inflation rate swaps – – – – – Total return swaps – – – – – Currency exchange (107) 9,639,278 (126) (26,192) 26
Net change in unrealised appreciation/(depreciation) for the year (39,539) 5,892,807,342 1,229,843 (37,708,316) (675,804)
Increase/(decrease) in net assets as a result of operations (58,896) 6,558,489,706 1,383,583 (108,937,073) (1,191,338)
Subscriptions 131,835 12,170,732,320 1,500,320 302,101,745 –Redemptions (46,595) (7,317,881,893) – (451,117,121) –
Increase/(decrease) in net assets as a result of movements in share capital 85,240 4,852,850,427 1,500,320 (149,015,376) –
Dividend distributions – – – (1,432,092) –Foreign currency translation difference – – – – –
Net assets at the end of the year 5,712,425 20,903,934,287 7,958,863 620,987,742 4,025,621

393 Morgan Stanley Investment Funds 31 December 2020
The accompanying notes are an integral part of these financial statements.
Statement of operations and changes in net assets (continued)For the year ended 31 December 2020
GlobalQuality
Fund
GlobalSustain
Fund
IndianEquityFund
International
Equity (ex US)
Fund
Japanese Equity Fund
USD USD USD USD JPY000’s
Net assets at the beginning of the year 2,083,250,256 291,469,764 109,091,816 71,617,292 13,172,562
Income
Dividend income, net of withholding taxes 32,824,294 6,679,724 708,290 1,645,086 195,906Interest income from investments, net of withholding taxes – – – – –Interest on swap contracts – – – – –Securities lending income – – – – –Bank interest 1,845 322 81 356 –Other income – – – – –
Total income 32,826,139 6,680,046 708,371 1,645,442 195,906
Expenses
Management fees 20,628,325 3,706,954 1,210,815 830,680 71,341Administration charge 2,979,451 762,987 145,898 120,614 12,573Distribution fees 940,138 39,018 115,673 – 2,152Interest on swap contracts – – – – –Bank and other interest expenses 883 181 65 157 687Tax charge – – 162,000 – –Specific additional costs – – – – – Taxe d’abonnement 503,954 86,298 38,167 37,814 1,217 Emerging markets custody fees – – 38,985 – – Hedging expenses 119,836 31,267 – – 162
Total expenses 25,172,587 4,626,705 1,711,603 989,265 88,132
Plus: Fee waiver – – – – –
Net investment income/(loss) 7,653,552 2,053,341 (1,003,232) 656,177 107,774
Net realised gain/(loss) on: Investments 191,199,482 10,665,154 (7,377,538) (953,138) (1,567,381) Options contracts – – – – – Financial futures contracts – – – – – Forward currency exchange contracts 17,653,071 11,062,076 5,336 – (34,732) Credit default swaps – – – – – Interest rate swaps – – – – – Inflation rate swaps – – – – – Total return swaps – – – – – Currency exchange 6,501,538 (381,161) 191,518 (38,861) 12,857
Net realised gain/(loss) for the year 215,354,091 21,346,069 (7,180,684) (991,999) (1,589,256)
Net change in unrealised appreciation/(depreciation) on: Investments 67,868,083 95,062,224 13,164,427 11,794,462 398,096 Options contracts – – – – – Financial futures contracts – – – – – Forward currency exchange contracts (31,804) 2,599,364 (210) 34 (10,343) Credit default swaps – – – – – Interest rate swaps – – – – – Inflation rate swaps – – – – – Total return swaps – – – – – Currency exchange 1,732 13,537 (48,902) 2,788 (12)
Net change in unrealised appreciation/(depreciation) for the year 67,838,011 97,675,125 13,115,315 11,797,284 387,741
Increase/(decrease) in net assets as a result of operations 290,845,654 121,074,535 4,931,399 11,461,462 (1,093,741)
Subscriptions 912,991,064 814,940,947 18,646,547 57,211,762 8,518,423Redemptions (1,247,936,089) (162,413,933) (45,740,390) (30,832,621) (10,636,253)
Increase/(decrease) in net assets as a result of movements in share capital (334,945,025) 652,527,014 (27,093,843) 26,379,141 (2,117,830)
Dividend distributions (1,876,902) (15,767) – –Foreign currency translation difference – – – – –
Net assets at the end of the year 2,037,273,983 1,065,055,546 86,929,372 109,457,895 9,960,991

Morgan Stanley Investment Funds 31 December 2020 394
The accompanying notes are an integral part of these financial statements.
Statement of operations and changes in net assets (continued)For the year ended 31 December 2020
Latin American
Equity Fund
Sustainable Asian
Equity Fund (5)
US
Active Factor Equity Fund
US Advantage
Fund
US Growth
Fund
USD USD USD USD USD
Net assets at the beginning of the year 270,458,035 32,658,225 36,671,027 8,358,798,815 2,237,753,383
Income
Dividend income, net of withholding taxes 3,420,380 646,864 344,581 21,774,270 2,286,087Interest income from investments, net of withholding taxes – – – – –Interest on swap contracts – – – – –Securities lending income 3,502 5,348 – 2,619,586 189,989Bank interest 114,690 506 932 – 17,489Other income – 771,029 * – – –
Total income 3,538,572 1,423,747 345,513 24,393,856 2,493,565
Expenses
Management fees 3,089,571 377,131 177,077 113,397,359 43,376,757Administration charge 367,619 53,591 54,516 17,070,800 6,213,291Distribution fees 7,931 20,182 – 1,284,631 457,715Interest on swap contracts – – – – –Bank and other interest expenses 108,979 1 – 24,959 13,501Tax charge – 54,495 – – –Specific additional costs – – – – – Taxe d’abonnement 96,413 14,330 4,114 3,624,904 1,515,498 Emerging markets custody fees 97,623 14,933 – – – Hedging expenses – – – 697,449 297,714
Total expenses 3,768,136 534,663 235,707 136,100,102 51,874,476
Plus: Fee waiver – – – – –
Net investment income/(loss) (229,564) 889,084 109,806 (111,706,246) (49,380,911)
Net realised gain/(loss) on: Investments (30,839,481) 1,024,060 (478,448) 2,570,850,715 909,218,312 Options contracts – – – (23,905,562) (7,562,046) Financial futures contracts – – – – – Forward currency exchange contracts 1,208 (8,725) – 131,319,005 71,475,191 Credit default swaps – – – – – Interest rate swaps – – – – – Inflation rate swaps – – – – – Total return swaps – – – – – Currency exchange (303,492) 89,773 – 28,293,748 4,711,253
Net realised gain/(loss) for the year (31,141,765) 1,105,108 (478,448) 2,706,557,906 977,842,710
Net change in unrealised appreciation/(depreciation) on: Investments 2,572,995 4,693,376 9,784,665 4,027,846,568 2,194,797,239 Options contracts – – – (24,918,077) (9,223,572) Financial futures contracts – – – – – Forward currency exchange contracts (38) 189 – 10,226,208 7,364,163 Credit default swaps – – – – – Interest rate swaps – – – – – Inflation rate swaps – – – – – Total return swaps – – – – – Currency exchange (8,201) 22,892 – 6,198 5,796
Net change in unrealised appreciation/(depreciation) for the year 2,564,756 4,716,457 9,784,665 4,013,160,897 2,192,943,626
Increase/(decrease) in net assets as a result of operations (28,806,573) 6,710,649 9,416,023 6,608,012,557 3,121,405,425
Subscriptions 34,583,268 12,907,145 2,517,723 8,605,917,367 5,447,195,002Redemptions (44,268,114) (14,906,029) (47,520) (8,082,258,215) (3,976,130,691)
Increase/(decrease) in net assets as a result of movements in share capital (9,684,846) (1,998,884) 2,470,203 523,659,152 1,471,064,311
Dividend distributions – – – – –Foreign currency translation difference – – – – –
Net assets at the end of the year 231,966,616 37,369,990 48,557,253 15,490,470,524 6,830,223,119
(5) Formerly known as Asian Equity Fund prior to 31 December 2020.*Following a court litigation to obtain reduced withholding tax rates in South Korea, Sustainable Asian Equity Fund received a payment of USD 771,029.

395 Morgan Stanley Investment Funds 31 December 2020
The accompanying notes are an integral part of these financial statements.
Statement of operations and changes in net assets (continued)For the year ended 31 December 2020
US Insight
Fund
US Permanence
Fund (6)
US Property
Fund
Emerging
Markets Corporate Debt
Fund
Emerging Markets
Debt Fund
USD USD USD USD USD
Net assets at the beginning of the year 9,559,876 – 162,962,268 1,594,124,827 210,751,993
Income
Dividend income, net of withholding taxes 29,534 11,142 3,385,530 297,203 92,640Interest income from investments, net of withholding taxes – – – 72,282,524 9,665,594Interest on swap contracts – – – – –Securities lending income – – – 538,138 17,218Bank interest 266 – 471 5,378 6,001Other income – – – – –
Total income 29,800 11,142 3,386,001 73,123,243 9,781,453
Expenses
Management fees 426,604 6,864 1,084,040 11,496,851 2,393,645Administration charge 61,613 928 168,317 1,771,184 317,422Distribution fees – – 4,735 711,603 369,367Interest on swap contracts – – – – –Bank and other interest expenses 7 107 52 1,163 –Tax charge – – – – –Specific additional costs – – – – – Taxe d’abonnement 14,622 93 43,268 293,793 77,354 Emerging markets custody fees – – – – – Hedging expenses – – – 140,241 12,937
Total expenses 502,846 7,992 1,300,412 14,414,835 3,170,725
Plus: Fee waiver – – – – –
Net investment income/(loss) (473,046) 3,150 2,085,589 58,708,408 6,610,728
Net realised gain/(loss) on: Investments 6,794,801 106,279 (24,570,636) (32,538,093) (1,768,374) Options contracts (32,814) – – – – Financial futures contracts – – – – – Forward currency exchange contracts (12,365) – 14,310 14,132,683 1,352,769 Credit default swaps – – – (2,628) (2,627) Interest rate swaps – – – – – Inflation rate swaps – – – – – Total return swaps – – – – – Currency exchange 14,720 66 (13,094) 10,522,243 777,183
Net realised gain/(loss) for the year 6,764,342 106,345 (24,569,420) (7,885,795) 358,951
Net change in unrealised appreciation/(depreciation) on: Investments 19,234,127 596,500 (12,376,847) 15,197,546 209,915 Options contracts (114,752) – – – – Financial futures contracts – – – – – Forward currency exchange contracts 98 – (93) (1,517,024) (49,044) Credit default swaps – – – – – Interest rate swaps – – – – – Inflation rate swaps – – – – – Total return swaps – – – – – Currency exchange 340 – 129 (789) 5,252
Net change in unrealised appreciation/(depreciation) for the year 19,119,813 596,500 (12,376,811) 13,679,733 166,123
Increase/(decrease) in net assets as a result of operations 25,411,109 705,995 (34,860,642) 64,502,346 7,135,802
Subscriptions 97,520,984 5,000,000 18,085,197 1,285,962,808 140,560,899Redemptions (20,080,696) – (70,509,263) (1,647,672,174) (158,746,866)
Increase/(decrease) in net assets as a result of movements in share capital 77,440,288 5,000,000 (52,424,066) (361,709,366) (18,185,967)
Dividend distributions – – – (6,942,972) (1,309,414)Foreign currency translation difference – – – – –
Net assets at the end of the year 112,411,273 5,705,995 75,677,560 1,289,974,835 198,392,414
(6) Fund commenced operations on 30 October 2020.

Morgan Stanley Investment Funds 31 December 2020 396
The accompanying notes are an integral part of these financial statements.
Statement of operations and changes in net assets (continued)For the year ended 31 December 2020
Emerging Markets
Domestic Debt Fund
Emerging Markets Fixed
Income Opportunities
Fund
Euro Bond Fund
Euro Corporate
Bond Fund
Euro Corporate
Bond – Duration Hedged
Fund
USD USD EUR EUR EUR
Net assets at the beginning of the year 205,563,516 174,707,416 769,384,853 4,224,639,750 382,043,015
Income
Dividend income, net of withholding taxes 12,327 75,709 – 146,846 –Interest income from investments, net of withholding taxes 9,870,550 11,009,497 8,436,862 75,499,663 6,124,903Interest on swap contracts – – – 706,387 –Securities lending income – – 104,724 779,309 38,223Bank interest 3,469 984 1 2,379 3,053Other income – – – – –
Total income 9,886,346 11,086,190 8,541,587 77,134,584 6,166,179
Expenses
Management fees 1,593,993 1,452,305 3,580,130 17,131,795 1,432,822Administration charge 233,501 212,505 1,372,881 5,428,628 425,360Distribution fees 176,614 619,107 309,463 571,642 54,122Interest on swap contracts – – 59,097 1,922,290 –Bank and other interest expenses 8 283 33,690 130,576 44,431Tax charge – – – – –Specific additional costs – – – – – Taxe d’abonnement 48,738 57,830 155,449 715,861 47,568 Emerging markets custody fees – – – – – Hedging expenses 9,338 62,798 – 45,097 –
Total expenses 2,062,192 2,404,828 5,510,710 25,945,889 2,004,303
Plus: Fee waiver – – 1,108,203 1,934,604 –
Net investment income/(loss) 7,824,154 8,681,362 4,139,080 53,123,299 4,161,876
Net realised gain/(loss) on: Investments (11,441,496) (3,273,121) 25,555,568 41,581,958 6,878,852 Options contracts – – – – – Financial futures contracts – – (3,897,856) (8,350,393) (5,663,486) Forward currency exchange contracts 886,347 7,440,525 (322) 3,731,023 435,309 Credit default swaps (2,622) (2,622) (2,223) 567,941 (5,827) Interest rate swaps – – – (14,757,407) – Inflation rate swaps – – – – – Total return swaps – – – – – Currency exchange 364,908 3,739,025 (637) (3,617,262) (116,539)
Net realised gain/(loss) for the year (10,192,863) 7,903,807 21,654,530 19,155,860 1,528,309
Net change in unrealised appreciation/(depreciation) on: Investments (146,773) 2,549,980 17,412,808 1,731,009 (2,356,578) Options contracts – – – – – Financial futures contracts – – (708,760) (5,138,206) (1,616,637) Forward currency exchange contracts (176,411) 552,339 – 1,463,131 26,539 Credit default swaps – – – – – Interest rate swaps – – – 2,740,576 – Inflation rate swaps – – – – – Total return swaps – – – – – Currency exchange 32,197 33,178 20 (2,277) (37,178)
Net change in unrealised appreciation/(depreciation) for the year (290,987) 3,135,497 16,704,068 794,233 (3,983,854)
Increase/(decrease) in net assets as a result of operations (2,659,696) 19,720,666 42,497,678 73,073,392 1,706,331
Subscriptions 103,147,588 204,215,804 1,023,363,364 3,199,034,741 180,513,840Redemptions (137,087,119) (178,801,491) (1,035,793,371) (3,929,273,777) (290,580,843)
Increase/(decrease) in net assets as a result of movements in share capital (33,939,531) 25,414,313 (12,430,007) (730,239,036) (110,067,003)
Dividend distributions (1,082,096) (2,795,190) (53,247) (2,339,412) (46,526)Foreign currency translation difference – – – – –
Net assets at the end of the year 167,882,193 217,047,205 799,399,277 3,565,134,694 273,635,817
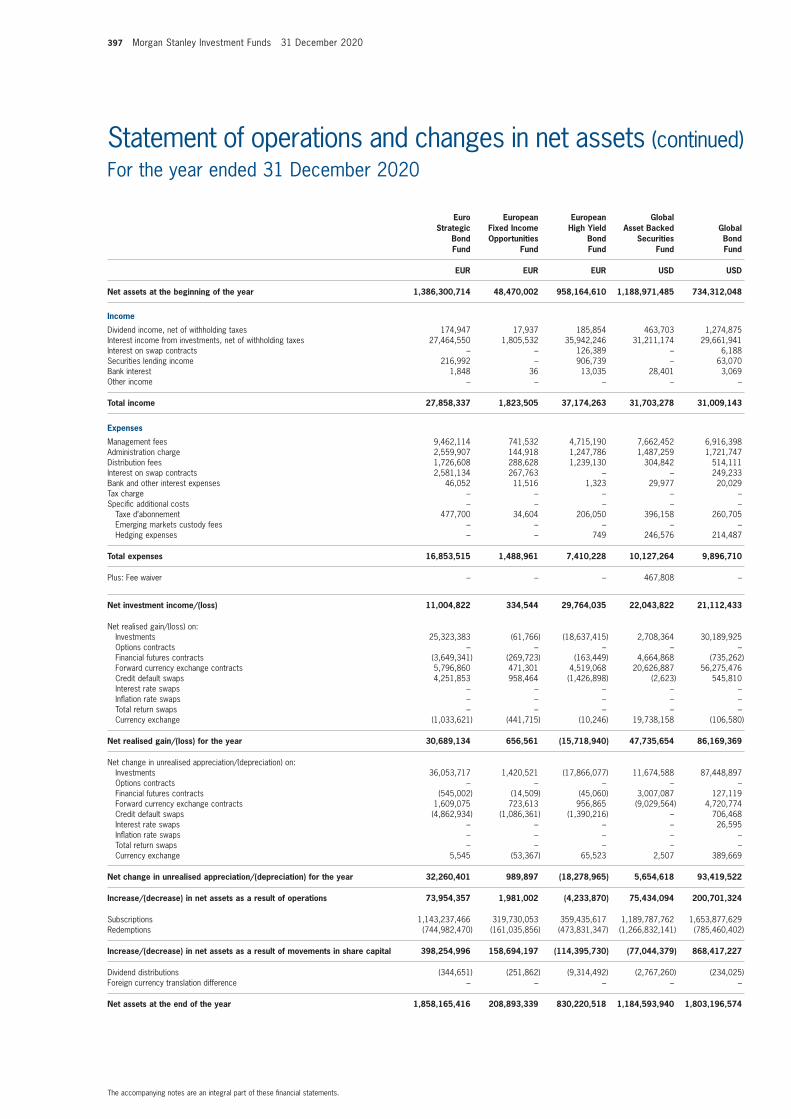
397 Morgan Stanley Investment Funds 31 December 2020
The accompanying notes are an integral part of these financial statements.
Statement of operations and changes in net assets (continued)For the year ended 31 December 2020
Euro Strategic
Bond Fund
European Fixed Income Opportunities
Fund
European
High Yield Bond Fund
Global
Asset Backed Securities
Fund
Global Bond Fund
EUR EUR EUR USD USD
Net assets at the beginning of the year 1,386,300,714 48,470,002 958,164,610 1,188,971,485 734,312,048
Income
Dividend income, net of withholding taxes 174,947 17,937 185,854 463,703 1,274,875Interest income from investments, net of withholding taxes 27,464,550 1,805,532 35,942,246 31,211,174 29,661,941Interest on swap contracts – – 126,389 – 6,188Securities lending income 216,992 – 906,739 – 63,070Bank interest 1,848 36 13,035 28,401 3,069Other income – – – – –
Total income 27,858,337 1,823,505 37,174,263 31,703,278 31,009,143
Expenses
Management fees 9,462,114 741,532 4,715,190 7,662,452 6,916,398Administration charge 2,559,907 144,918 1,247,786 1,487,259 1,721,747Distribution fees 1,726,608 288,628 1,239,130 304,842 514,111Interest on swap contracts 2,581,134 267,763 – – 249,233Bank and other interest expenses 46,052 11,516 1,323 29,977 20,029Tax charge – – – – –Specific additional costs – – – – – Taxe d’abonnement 477,700 34,604 206,050 396,158 260,705 Emerging markets custody fees – – – – – Hedging expenses – – 749 246,576 214,487
Total expenses 16,853,515 1,488,961 7,410,228 10,127,264 9,896,710
Plus: Fee waiver – – – 467,808 –
Net investment income/(loss) 11,004,822 334,544 29,764,035 22,043,822 21,112,433
Net realised gain/(loss) on: Investments 25,323,383 (61,766) (18,637,415) 2,708,364 30,189,925 Options contracts – – – – – Financial futures contracts (3,649,341) (269,723) (163,449) 4,664,868 (735,262) Forward currency exchange contracts 5,796,860 471,301 4,519,068 20,626,887 56,275,476 Credit default swaps 4,251,853 958,464 (1,426,898) (2,623) 545,810 Interest rate swaps – – – – – Inflation rate swaps – – – – – Total return swaps – – – – – Currency exchange (1,033,621) (441,715) (10,246) 19,738,158 (106,580)
Net realised gain/(loss) for the year 30,689,134 656,561 (15,718,940) 47,735,654 86,169,369
Net change in unrealised appreciation/(depreciation) on: Investments 36,053,717 1,420,521 (17,866,077) 11,674,588 87,448,897 Options contracts – – – – – Financial futures contracts (545,002) (14,509) (45,060) 3,007,087 127,119 Forward currency exchange contracts 1,609,075 723,613 956,865 (9,029,564) 4,720,774 Credit default swaps (4,862,934) (1,086,361) (1,390,216) – 706,468 Interest rate swaps – – – – 26,595 Inflation rate swaps – – – – – Total return swaps – – – – – Currency exchange 5,545 (53,367) 65,523 2,507 389,669
Net change in unrealised appreciation/(depreciation) for the year 32,260,401 989,897 (18,278,965) 5,654,618 93,419,522
Increase/(decrease) in net assets as a result of operations 73,954,357 1,981,002 (4,233,870) 75,434,094 200,701,324
Subscriptions 1,143,237,466 319,730,053 359,435,617 1,189,787,762 1,653,877,629Redemptions (744,982,470) (161,035,856) (473,831,347) (1,266,832,141) (785,460,402)
Increase/(decrease) in net assets as a result of movements in share capital 398,254,996 158,694,197 (114,395,730) (77,044,379) 868,417,227
Dividend distributions (344,651) (251,862) (9,314,492) (2,767,260) (234,025)Foreign currency translation difference – – – – –
Net assets at the end of the year 1,858,165,416 208,893,339 830,220,518 1,184,593,940 1,803,196,574

Morgan Stanley Investment Funds 31 December 2020 398
The accompanying notes are an integral part of these financial statements.
Statement of operations and changes in net assets (continued)For the year ended 31 December 2020
Global Buy and Hold
2020 Bond Fund (7)
Global
Convertible Bond Fund
Global Credit Fund
Global
Fixed Income Opportunities
Fund
Global
High Yield Bond Fund
EUR USD USD USD USD
Net assets at the beginning of the year 184,385,870 310,982,951 112,085,483 4,473,535,283 588,306,391
Income
Dividend income, net of withholding taxes 14,792 73,353 19,970 3,335,176 212,121Interest income from investments, net of withholding taxes 6,516,062 2,760,161 3,616,137 161,636,044 35,778,479Interest on swap contracts – – – – –Securities lending income – 128,038 – 385,086 –Bank interest 2,972 262 947 18,975 1Other income – – – – –
Total income 6,533,826 2,961,814 3,637,054 165,375,281 35,990,601
Expenses
Management fees 660,298 2,699,556 622,513 35,358,329 3,622,427Administration charge 254,407 464,489 174,538 6,485,723 790,167Distribution fees 1,096,720 108,962 87,796 7,835,328 947,091Interest on swap contracts – – 122,179 9,804,233 –Bank and other interest expenses 11,065 3,531 5,968 135,982 5,524Tax charge – – – – –Specific additional costs – – – – – Taxe d’abonnement 63,651 95,144 24,298 1,579,242 137,668 Emerging markets custody fees – – – – – Hedging expenses – 78,255 3,791 844,851 27,949
Total expenses 2,086,141 3,449,937 1,041,083 62,043,688 5,530,826
Plus: Fee waiver – – – – –
Net investment income/(loss) 4,447,685 (488,123) 2,595,971 103,331,593 30,459,775
Net realised gain/(loss) on: Investments (11,860,864) 45,023,050 3,802,724 11,875,915 (23,257,654) Options contracts – 1,667,417 – – – Financial futures contracts – (12,168) 52,872 (10,571,428) – Forward currency exchange contracts 3,460,429 9,116,755 (194,385) 80,395,715 4,705,216 Credit default swaps – – 44,157 11,123,889 (9,641) Interest rate swaps – – (831,807) – – Inflation rate swaps – – – – – Total return swaps – – – – – Currency exchange (348,575) 4,277,093 290,784 49,822,324 1,814,558
Net realised gain/(loss) for the year (8,749,010) 60,072,147 3,164,345 142,646,415 (16,747,521)
Net change in unrealised appreciation/(depreciation) on: Investments 4,198,352 34,521,763 6,073,360 125,124,806 23,785,558 Options contracts – 1,706,234 – – – Financial futures contracts – – 34,692 (2,792,285) – Forward currency exchange contracts (945,426) (1,927,456) 306,257 (35,767,070) 1,761,738 Credit default swaps – – 19,428 (10,347,574) – Interest rate swaps – – 260,530 – – Inflation rate swaps – – – – – Total return swaps – – – – – Currency exchange (514,655) 10,232 23,336 111,134 25,581
Net change in unrealised appreciation/(depreciation) for the year 2,738,271 34,310,773 6,717,603 76,329,011 25,572,877
Increase/(decrease) in net assets as a result of operations (1,563,054) 93,894,797 12,477,919 322,307,019 39,285,131
Subscriptions 535,289 366,953,946 56,402,473 4,799,661,960 521,347,790Redemptions (182,759,930) (314,544,122) (42,957,604) (4,516,324,897) (443,712,196)
Increase/(decrease) in net assets as a result of movements in share capital (182,224,641) 52,409,824 13,444,869 283,337,063 77,635,594
Dividend distributions (598,175) (93,296) – (16,331,911) (5,603,155)Foreign currency translation difference – – – – –
Net assets at the end of the year – 457,194,276 138,008,271 5,062,847,454 699,623,961
(7) Fund merged into European Fixed Income Opportunities Fund on 9 November 2020.

399 Morgan Stanley Investment Funds 31 December 2020
The accompanying notes are an integral part of these financial statements.
Statement of operations and changes in net assets (continued)For the year ended 31 December 2020
Short Maturity
Euro Bond Fund
Sustainable Euro
Corporate Bond
Fund (8)
Sustainable Euro
Strategic Bond
Fund (9)
US Dollar Corporate
Bond Fund
US Dollar High Yield
Bond Fund
EUR EUR EUR USD USD
Net assets at the beginning of the year 2,259,110,399 – – 19,554,093 392,805,741
Income
Dividend income, net of withholding taxes – – – – –Interest income from investments, net of withholding taxes 17,962,730 140,326 134,792 3,052,569 26,601,053Interest on swap contracts 36,653 – – – –Securities lending income 119,379 – – – –Bank interest 397 – – 852 19,510Other income – – – – –
Total income 18,119,159 140,326 134,792 3,053,421 26,620,563
Expenses
Management fees 7,601,388 45,594 47,125 409,855 2,166,567Administration charge 2,215,870 9,596 9,905 154,228 503,171Distribution fees 421,395 – – – 1,342Interest on swap contracts 79,653 – 4,424 29,776 –Bank and other interest expenses 36,281 2,814 4,125 322 –Tax charge – – – – –Specific additional costs – – – – – Taxe d’abonnement 295,437 964 995 15,824 56,167 Emerging markets custody fees – – – – – Hedging expenses 4 – – 4 57,150
Total expenses 10,650,028 58,968 66,574 610,009 2,784,397
Plus: Fee waiver 2,943,756 – – – –
Net investment income/(loss) 10,412,887 81,358 68,218 2,443,412 23,836,166
Net realised gain/(loss) on: Investments (6,024,586) 25,605 92,748 1,811,746 (9,944,220) Options contracts – – – – – Financial futures contracts (8,399,327) (12,201) (19,061) 98,029 – Forward currency exchange contracts (38,836) – (19,222) (417,774) 6,772,546 Credit default swaps 149,204 – 29,105 21,990 1,925,235 Interest rate swaps – – – (153,471) – Inflation rate swaps – – – – – Total return swaps – – – – – Currency exchange 31,748 – 932 358,976 3,775,433
Net realised gain/(loss) for the year (14,281,797) 13,404 84,502 1,719,496 2,528,994
Net change in unrealised appreciation/(depreciation) on: Investments 1,264,609 512,618 528,001 6,036,342 12,592,479 Options contracts – – – – – Financial futures contracts (1,456,785) 2,070 1,756 133,108 – Forward currency exchange contracts 12 – (23,408) (28,960) 109,370 Credit default swaps – – (43,891) (46,624) (1,948,878) Interest rate swaps – – – 48,068 – Inflation rate swaps – – – – – Total return swaps – – – – – Currency exchange (990) – 5,544 (791) (851)
Net change in unrealised appreciation/(depreciation) for the year (193,154) 514,688 468,002 6,141,143 10,752,120
Increase/(decrease) in net assets as a result of operations (4,062,064) 609,450 620,722 10,304,051 37,117,280
Subscriptions 1,247,532,815 22,000,000 23,769,115 326,733,496 309,007,216Redemptions (2,216,840,895) – – (27,391,364) (266,303,241)
Increase/(decrease) in net assets as a result of movements in share capital (969,308,080) 22,000,000 23,769,115 299,342,132 42,703,975
Dividend distributions – – – – (7,758,675)Foreign currency translation difference – – – – –
Net assets at the end of the year 1,285,740,255 22,609,450 24,389,837 329,200,276 464,868,321
(8) Fund commenced operations on 31 July 2020.(9) Fund commenced operations on 31 July 2020.

Morgan Stanley Investment Funds 31 December 2020 400
The accompanying notes are an integral part of these financial statements.
Statement of operations and changes in net assets (continued)For the year ended 31 December 2020
US Dollar Short Duration
Bond Fund
US Dollar
Short Duration High Yield Bond
Fund
Global
Balanced Defensive
Fund
Global Balanced
Fund
Global Balanced
Income Fund
USD USD EUR EUR EUR
Net assets at the beginning of the year 280,923,648 102,093,193 65,071,057 795,725,383 439,701,599
Income
Dividend income, net of withholding taxes 293 – 372,299 6,904,095 2,747,428Interest income from investments, net of withholding taxes 5,990,141 6,910,390 838,770 7,629,686 12,745,091Interest on swap contracts – – 332,655 3,545,134 1,278,337Securities lending income – – – – –Bank interest 10,304 5,398 553 876 2,489Other income – – 2,659 66,984 33,596
Total income 6,000,738 6,915,788 1,546,936 18,146,775 16,806,941
Expenses
Management fees 1,015,487 851,356 708,401 5,215,448 5,108,517Administration charge 445,634 170,261 122,767 1,203,662 617,312Distribution fees – 25,783 408,543 29,176 1,433,566Interest on swap contracts – – – 3,264 –Bank and other interest expenses – 8 14,822 300,340 217,764Tax charge – – – – 18Specific additional costs – – – – – Taxe d’abonnement 122,122 45,066 31,942 88,282 166,857 Emerging markets custody fees – – – – – Hedging expenses – 2,802 – – 14,824
Total expenses 1,583,243 1,095,276 1,286,475 6,840,172 7,558,858
Plus: Fee waiver 259,103 – – – –
Net investment income/(loss) 4,676,598 5,820,512 260,461 11,306,603 9,248,083
Net realised gain/(loss) on: Investments (441,141) (5,795,287) (613,970) (23,262,715) (4,266,118) Options contracts – – 78,507 2,534,395 (14,823,463) Financial futures contracts (454,702) – (1,463,690) (21,140,743) (6,815,729) Forward currency exchange contracts 2,146 452,239 521,838 3,751,406 564,242 Credit default swaps – (2,625) (600,511) (10,782,755) (2,950,213) Interest rate swaps – – – – – Inflation rate swaps – – – – – Total return swaps – – – – – Currency exchange (1,216) 159,884 25,774 (57,904) (1,856,135)
Net realised gain/(loss) for the year (894,913) (5,185,789) (2,052,052) (48,958,316) (30,147,416)
Net change in unrealised appreciation/(depreciation) on: Investments 512,911 4,497,688 (51,955) 2,083,549 (5,925,747) Options contracts – – 253,917 6,185,079 470,601 Financial futures contracts (61,397) – (75,238) 1,127,604 (32,845) Forward currency exchange contracts – 34,118 175,524 3,965,112 735,613 Credit default swaps – – 258,199 5,815,612 530,482 Interest rate swaps – – – – – Inflation rate swaps – – – – – Total return swaps – – – – – Currency exchange (196,648) 235 10,700 195,638 98,147
Net change in unrealised appreciation/(depreciation) for the year 254,866 4,532,041 571,147 19,372,594 (4,123,749)
Increase/(decrease) in net assets as a result of operations 4,036,551 5,166,764 (1,220,444) (18,279,119) (25,023,082)
Subscriptions 323,729,518 114,327,653 29,162,314 616,026,074 136,051,476Redemptions (297,907,550) (72,699,713) (33,393,326) (285,725,692) (247,908,084)
Increase/(decrease) in net assets as a result of movements in share capital 25,821,968 41,627,940 (4,231,012) 330,300,382 (111,856,608)
Dividend distributions – (1,520,006) – – (14,335,163)Foreign currency translation difference – – – – –
Net assets at the end of the year 310,782,167 147,367,891 59,619,601 1,107,746,646 288,486,746

401 Morgan Stanley Investment Funds 31 December 2020
The accompanying notes are an integral part of these financial statements.
Statement of operations and changes in net assets (continued)For the year ended 31 December 2020
Global Balanced
Risk Control Fund of Funds
Global Balanced
Sustainable Fund (10)
Global Multi-Asset
Income Fund
Global
Multi-Asset Opportunities
Fund
Multi-Asset Risk
Control Fund
EUR EUR EUR EUR USD
Net assets at the beginning of the year 4,751,593,874 – 15,731,824 55,893,025 10,260,921
Income
Dividend income, net of withholding taxes 15,813,586 31,493 150,644 256,160 73,861Interest income from investments, net of withholding taxes – 131,724 718,701 186,365 126,337Interest on swap contracts – 64,739 9,354 52,764 51,639Securities lending income – – – – –Bank interest 61,333 11 2,976 2,700 1,345Other income 3,028,479 – 15,385 – –
Total income 18,903,398 227,967 897,060 497,989 253,182
Expenses
Management fees 73,500,602 64,792 112,173 396,453 64,258Administration charge 7,248,613 11,723 20,905 53,351 9,894Distribution fees 6,947,422 503 – 12,045 –Interest on swap contracts – – 21,800 42,717 –Bank and other interest expenses 1,508,280 4,817 9,421 45,837 700Tax charge – – – – –Specific additional costs – – – – – Taxe d’abonnement – 1,094 1,501 6,663 1,069 Emerging markets custody fees – – – – – Hedging expenses 109,039 – 4 16,925 –
Total expenses 89,313,956 82,929 165,804 573,991 75,921
Plus: Fee waiver – – – 166,587 –
Net investment income/(loss) (70,410,558) 145,038 731,256 90,585 177,261
Net realised gain/(loss) on: Investments 315,391,818 (121,818) 111,371 (4,818,359) (62,528) Options contracts 13,193,218 – (860,734) – – Financial futures contracts (145,113,037) (78,458) 46,573 (3,895,077) (412,420) Forward currency exchange contracts (14,353,526) 115,159 247,065 (1,724,956) (8,728) Credit default swaps – (27,547) (5,338) 38,060 (88,216) Interest rate swaps – – 24 228 – Inflation rate swaps – – (1,555) (22,613) – Total return swaps – – 102,473 2,772,799 – Currency exchange (8,509,196) (7,533) (88,358) (467,541) (13,499)
Net realised gain/(loss) for the year 160,609,277 (120,197) (448,479) (8,117,459) (585,391)
Net change in unrealised appreciation/(depreciation) on: Investments 72,362,705 100,326 (686,437) (302,488) 592,745 Options contracts 24,250,269 – (15,571) – – Financial futures contracts 4,056,268 24,453 10,660 471 16,452 Forward currency exchange contracts 195,253 116,577 66,232 1,402,388 (18,962) Credit default swaps – 203,529 (3,195) (10,624) 6,187 Interest rate swaps – – 28,370 330,606 – Inflation rate swaps – – 29,860 310,717 – Total return swaps – – 19,516 96,594 – Currency exchange 2,806,065 (853) 16,481 (84,438) (309)
Net change in unrealised appreciation/(depreciation) for the year 103,670,560 444,032 (534,084) 1,743,226 596,113
Increase/(decrease) in net assets as a result of operations 193,869,279 468,873 (251,307) (6,283,648) 187,983
Subscriptions 1,179,581,489 20,000,000 9,879 73,532,388 –Redemptions (2,125,508,757) – (31,554) (59,037,684) –
Increase/(decrease) in net assets as a result of movements in share capital (945,927,268) 20,000,000 (21,675) 14,494,704 –
Dividend distributions – – (1,594) (38) –Foreign currency translation difference – – – – –
Net assets at the end of the year 3,999,535,885 20,468,873 15,457,248 64,104,043 10,448,904
(10) Fund commenced operations on 30 June 2020.
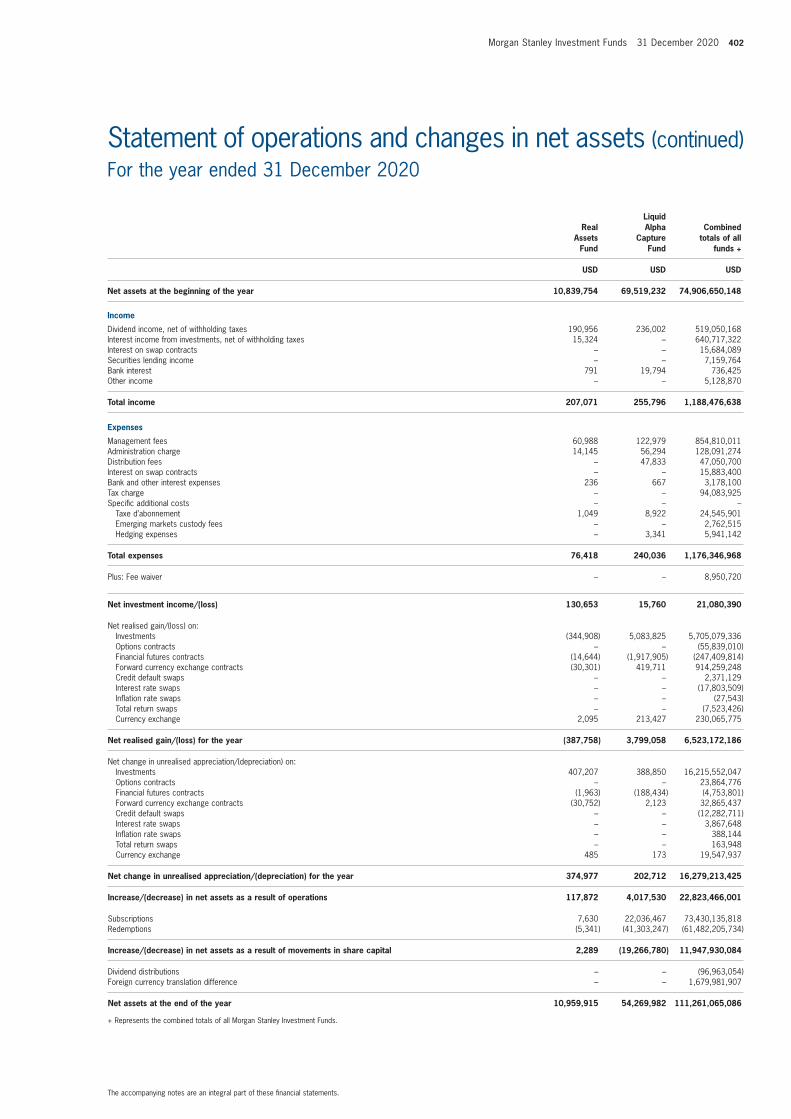
Morgan Stanley Investment Funds 31 December 2020 402
The accompanying notes are an integral part of these financial statements.
Statement of operations and changes in net assets (continued)For the year ended 31 December 2020
Real Assets
Fund
Liquid Alpha
Capture Fund
Combined totals of all
funds +
USD USD USD
Net assets at the beginning of the year 10,839,754 69,519,232 74,906,650,148
Income
Dividend income, net of withholding taxes 190,956 236,002 519,050,168Interest income from investments, net of withholding taxes 15,324 – 640,717,322Interest on swap contracts – – 15,684,089Securities lending income – – 7,159,764Bank interest 791 19,794 736,425Other income – – 5,128,870
Total income 207,071 255,796 1,188,476,638
Expenses
Management fees 60,988 122,979 854,810,011Administration charge 14,145 56,294 128,091,274Distribution fees – 47,833 47,050,700Interest on swap contracts – – 15,883,400Bank and other interest expenses 236 667 3,178,100Tax charge – – 94,083,925Specific additional costs – – – Taxe d’abonnement 1,049 8,922 24,545,901 Emerging markets custody fees – – 2,762,515 Hedging expenses – 3,341 5,941,142
Total expenses 76,418 240,036 1,176,346,968
Plus: Fee waiver – – 8,950,720
Net investment income/(loss) 130,653 15,760 21,080,390
Net realised gain/(loss) on: Investments (344,908) 5,083,825 5,705,079,336 Options contracts – – (55,839,010) Financial futures contracts (14,644) (1,917,905) (247,409,814) Forward currency exchange contracts (30,301) 419,711 914,259,248 Credit default swaps – – 2,371,129 Interest rate swaps – – (17,803,509) Inflation rate swaps – – (27,543) Total return swaps – – (7,523,426) Currency exchange 2,095 213,427 230,065,775
Net realised gain/(loss) for the year (387,758) 3,799,058 6,523,172,186
Net change in unrealised appreciation/(depreciation) on: Investments 407,207 388,850 16,215,552,047 Options contracts – – 23,864,776 Financial futures contracts (1,963) (188,434) (4,753,801) Forward currency exchange contracts (30,752) 2,123 32,865,437 Credit default swaps – – (12,282,711) Interest rate swaps – – 3,867,648 Inflation rate swaps – – 388,144 Total return swaps – – 163,948 Currency exchange 485 173 19,547,937
Net change in unrealised appreciation/(depreciation) for the year 374,977 202,712 16,279,213,425
Increase/(decrease) in net assets as a result of operations 117,872 4,017,530 22,823,466,001
Subscriptions 7,630 22,036,467 73,430,135,818Redemptions (5,341) (41,303,247) (61,482,205,734)
Increase/(decrease) in net assets as a result of movements in share capital 2,289 (19,266,780) 11,947,930,084
Dividend distributions – – (96,963,054)Foreign currency translation difference – – 1,679,981,907
Net assets at the end of the year 10,959,915 54,269,982 111,261,065,086
+ Represents the combined totals of all Morgan Stanley Investment Funds.

403 Morgan Stanley Investment Funds 31 December 2020
Statement of share and net assets statistics (continued)For the year ended 31 December 2020Statement of share and net assets statisticsFor the year ended 31 December 2020
Shares outstanding as at Nav per share as at
31 December 2020 31 December 2020 31 December 2019 31 December 2018
Morgan Stanley Investment Funds – Asia Opportunity Fund
Share Class A 19,415,281 77.34 51.43 36.64Share Class AH (EUR) 5,870,485 68.93 46.82 34.36Share Class B 1,741,678 73.75 49.54 35.65Share Class BH (EUR) 532,180 65.74 45.10 33.43Share Class C 1,801,403 42.70 28.62 20.55Share Class CH (EUR) 618,080 39.70 27.18 20.10Share Class F 692,610 80.53 53.10 37.51Share Class I 7,394,855 80.73 53.20 37.56Share Class IH (EUR) 762,997 38.89 26.17 –Share Class IH (GBP) 93,297 41.20 27.78 –Share Class J 17,332,459 48.13 31.67 22.33Share Class J (GBP)* 89,740 28.69 – –Share Class JH (GBP)* 55,549 33.66 – –Share Class N 8,578,987 44.16 28.86 –Share Class S* 2,333,319 37.19 – –Share Class Z 30,941,224 80.88 53.28 37.61Share Class ZH (EUR) 3,139,285 72.08 48.51 35.27Share Class ZH (GBP) 639,447 74.28 50.07 36.05
Total net assets in USD 7,121,931,395 1,471,425,447 710,807,026
Morgan Stanley Investment Funds – Asian Property Fund
Share Class A 2,279,423 20.86 22.76 20.11Share Class B 67,841 17.31 19.08 17.03Share Class C 3,570 24.55 27.01 24.06Share Class F 26,727 31.25 33.87 29.73Share Class I 1,179,115 24.50 26.54 23.29Share Class IX 38,024 19.04 21.09 18.93Share Class Z 148,040 37.93 41.07 36.02
Total net assets in USD 84,868,918 104,898,189 111,726,998
Morgan Stanley Investment Funds – Breakout Nations Fund (1)
Share Class A – – 24.83 22.41Share Class AH (EUR) – – 22.43 20.89Share Class B – – 23.75 21.66Share Class BH (EUR) – – 21.46 20.19Share Class C – – 24.07 21.88Share Class CH (EUR) – – 21.75 20.40Share Class Z – – 25.77 23.07
Total net assets in USD – 6,104,990 5,615,588
Morgan Stanley Investment Funds – China A-shares Fund
Share Class A 589,262 27.44 24.37 20.63Share Class AH (EUR) 103,553 24.70 22.31 19.47Share Class B 25,824 26.62 23.88 20.42Share Class BH (EUR) 17,248 23.98 21.88 19.28Share Class C 81,662 26.86 24.02 20.48Share Class CH (EUR) 147,403 24.20 22.01 19.34Share Class I 458,845 28.32 24.88 20.85Share Class Z 421,049 28.34 24.90 20.85
Total net assets in USD 52,001,580 105,873,631 60,516,549
Morgan Stanley Investment Funds – China Equity Fund
Share Class A 4,000 35.07 27.66 –Share Class B 4,000 34.58 27.55 –Share Class C 4,000 34.72 27.58 –Share Class I 4,000 35.59 27.78 –Share Class Z 384,000 35.61 27.79 –
Total net assets in USD 14,235,765 11,112,450 –
(1) Fund closed operations on 16 October 2020.* Share Class was launched during the year.

Morgan Stanley Investment Funds 31 December 2020 404
Statement of share and net assets statistics (continued)For the year ended 31 December 2020
Shares outstanding as at Nav per share as at
31 December 2020 31 December 2020 31 December 2019 31 December 2018
Morgan Stanley Investment Funds – Counterpoint Global Fund (2)
Share Class A 2,140 48.09 27.45 20.83Share Class I 2,137 49.02 27.75 20.87Share Class Z 196,000 49.07 27.76 20.87
Total net assets in USD 9,824,721 5,555,683 4,174,667
Morgan Stanley Investment Funds – Developing Opportunity Fund
Share Class A 567,113 39.44 25.06 –Share Class B 14,760 39.03 25.06 –Share Class C 113,278 39.18 25.06 –Share Class I 1,127,034 39.96 25.07 –Share Class J* 2,904,135 38.50 – –Share Class N* 3,412,558 41.41 – –Share Class Z 1,216,563 39.96 25.07 –
Total net assets in USD 374,141,529 25,072,148 –
Morgan Stanley Investment Funds – Emerging Europe, Middle East and Africa Equity Fund
Share Class A 681,352 81.22 86.48 69.98Share Class AX 1,027 72.88 77.71 64.09Share Class B 24,058 68.83 74.02 60.50Share Class C 2,330 24.77 26.59 21.69Share Class I 37,738 91.14 96.51 77.67Share Class Z 28,058 29.81 31.56 25.38
Total net assets in EUR 61,404,834 95,597,895 93,108,794
Morgan Stanley Investment Funds – Emerging Leaders Equity Fund
Share Class A 3,825,448 53.10 33.84 27.16Share Class AH (EUR) 637,757 46.72 30.40 25.15Share Class B 261,271 48.83 31.42 25.47Share Class BH (EUR) 86,478 42.95 28.23 23.60Share Class C 387,172 49.87 32.00 25.87Share Class CH (EUR) 92,934 44.16 28.93 24.11Share Class I 950,883 55.02 34.64 27.47Share Class IH (EUR) 172,399 53.84 34.62 28.31Share Class N 3,611,144 45.93 28.68 –Share Class Z 6,681,090 58.42 36.77 29.15Share Class ZH (EUR) 1,020,629 47.41 30.47 24.90Share Class ZH (GBP) 234,465 54.82 35.42 28.65Share Class ZH3 (BRL)* 1,600 33.62 **** – –
Total net assets in USD 978,170,831 283,184,837 318,736,715
Morgan Stanley Investment Funds – Emerging Markets Equity Fund
Share Class A 1,598,909 50.91 44.81 37.95Share Class B 157,907 40.94 36.39 31.13Share Class C 39,147 30.69 27.23 23.24Share Class I 2,443,332 58.25 50.99 42.95Share Class N 2,081,856 78.11 67.56 56.23Share Class Z 10,930,036 34.13 29.76 24.96
Total net assets in USD 767,034,947 1,435,116,688 1,230,737,278
Morgan Stanley Investment Funds – Emerging Markets Small Cap Equity Fund
Share Class A 249,917 28.70 27.67 25.55Share Class AH (EUR) 91,049 25.30 24.88 23.69Share Class AX 2,207 19.87 19.15 17.83Share Class B 62,155 26.56 25.86 24.12Share Class BH (EUR) 40,501 23.41 23.25 22.37Share Class C 40,387 27.40 26.57 24.68Share Class CH (EUR) 11,839 24.15 23.88 22.89Share Class I 25,429 31.64 30.12 27.46Share Class Z 12,987 31.75 30.21 27.54
Total net assets in USD 15,532,138 19,398,078 29,826,054
(2) Formerly known as Global Counterpoint Fund prior to 15 May 2020.* Share Class was launched during the year.**** Official Net Asset Value per Share is in USD.

405 Morgan Stanley Investment Funds 31 December 2020
Statement of share and net assets statistics (continued)For the year ended 31 December 2020
Shares outstanding as at Nav per share as at
31 December 2020 31 December 2020 31 December 2019 31 December 2018
Morgan Stanley Investment Funds – Europe Opportunity Fund (3)
Share Class A 7,084,720 47.77 34.14 26.46Share Class AH (USD) 403,051 52.74 37.06 27.90Share Class AR 43,869 39.29 28.37 –Share Class B 993,240 44.97 32.46 25.41Share Class BR 65,517 38.59 28.15 –Share Class C 1,493,067 45.61 32.82 25.62Share Class CR 33,252 38.79 28.21 –Share Class I 1,138,977 49.61 35.17 27.05Share Class IH (USD) 2,332,524 42.33 29.52 –Share Class N* 1,544,703 27.29 – –Share Class Z 11,459,530 49.73 35.24 27.09
Total net assets in EUR 1,223,006,960 169,893,706 31,059,615
Morgan Stanley Investment Funds – European Property Fund
Share Class A 1,070,054 32.10 40.82 31.72Share Class AH (USD) 12,492 24.48 30.56 23.06Share Class AX 7,708 29.09 37.62 29.93Share Class B 14,202 25.63 32.93 25.85Share Class C 1,295 22.04 28.26 22.14Share Class I 53,252 37.62 47.51 36.66Share Class Z 48,365 42.02 53.04 40.92
Total net assets in EUR 39,245,924 72,414,734 71,233,975
Morgan Stanley Investment Funds – Eurozone Equity Alpha Fund (4)
Share Class A – – 14.06 10.98Share Class AH (USD) – – 44.85 34.02Share Class AR – – 27.99 22.53Share Class B – – 11.55 9.11Share Class BR – – 26.40 21.47Share Class C – – 27.26 21.46Share Class CR – – 26.71 21.67Share Class I – – 16.02 12.42Share Class IH (USD) – – 37.45 28.21Share Class Z – – 50.66 39.28
Total net assets in EUR – 356,121,696 919,597,700
Morgan Stanley Investment Funds – Global Active Factor Equity Fund
Share Class A 8,267 40.01 33.19 25.56Share Class I 13,244 41.56 34.18 26.10Share Class Z 296,346 41.64 34.23 26.13
Total net assets in USD 13,221,371 10,849,471 6,465,862
Morgan Stanley Investment Funds – Global Advantage Fund
Share Class A 4,478,463 102.22 53.21 41.05Share Class AH (EUR) 470,958 50.10 26.61 –Share Class B 665,362 94.45 49.66 38.69Share Class BH (EUR) 20,478 49.24 26.41 –Share Class C 975,443 95.96 50.35 39.15Share Class CH (EUR) 115,154 49.37 26.45 –Share Class I 840,661 109.67 56.58 43.25Share Class Z 1,993,983 110.02 56.74 43.36Share Class ZH (EUR) 224,863 47.76 25.13 –
Total net assets in USD 976,173,108 276,090,927 110,008,960
(3) Formerly known as European Champions Fund prior to 20 April 2020.(4) Fund merged into Europe Opportunity Fund on 20 April 2020.* Share Class was launched during the year.

Morgan Stanley Investment Funds 31 December 2020 406
Statement of share and net assets statistics (continued)For the year ended 31 December 2020
Shares outstanding as at Nav per share as at
31 December 2020 31 December 2020 31 December 2019 31 December 2018
Morgan Stanley Investment Funds – Global Brands Fund
Share Class A 34,912,966 179.56 160.45 125.00Share Class AH (CHF) 632,946 57.71 52.71 42.45Share Class AH (EUR) 19,811,772 99.40 90.70 72.86Share Class AHX (EUR) 1,568,977 60.41 55.14 44.40Share Class AX 2,705,180 69.50 62.14 48.54Share Class B 3,706,184 146.89 132.57 104.32Share Class BH (EUR) 1,422,705 83.40 76.86 62.36Share Class BHX (EUR) 289,765 57.13 52.65 42.71Share Class BX 619,997 65.79 59.38 46.73Share Class C 8,055,563 75.83 68.30 53.64Share Class CH (EUR) 2,464,295 58.59 53.89 43.63Share Class F 5,396,132 46.31 41.11 31.82Share Class FH (CHF) 1,201,000 40.50 36.75 29.40Share Class FH (EUR) 536,608 41.15 37.31 29.77Share Class FHX (EUR) 92,374 39.44 35.97 28.96Share Class FX 494,733 44.33 39.61 30.94Share Class I 10,434,380 206.50 183.23 141.75Share Class IH (CHF)* 400 27.43 – –Share Class IH (EUR) 3,065,248 44.32 40.16 32.03Share Class IHX (EUR)*** 23,240 24.85 – –Share Class IX* 2,250 27.65 – –Share Class N 12,671,143 28.84 25.38 –Share Class S 1,438,338 56.71 50.28 38.87Share Class Z 42,847,669 88.87 78.82 60.95Share Class ZH (EUR) 14,283,273 95.53 86.52 68.99Share Class ZH (GBP) 3,357,093 67.16 61.00 48.13Share Class ZH3 (BRL)* 791,955 28.35 **** – –Share Class ZHR (GBP) 1,532,249 38.14 35.19 28.32Share Class ZX 2,077,166 120.64 107.80 84.20
Total net assets in USD 19,840,601,578 15,896,538,273 10,224,154,643
Morgan Stanley Investment Funds – Global Brands Equity Income Fund
Share Class A 74,364 40.18 36.24 29.15Share Class AHR (EUR) 920,613 29.73 28.55 24.75Share Class AR 2,060,044 33.34 31.36 26.37Share Class BHR (EUR) 1,250,534 28.37 27.51 24.10Share Class BR 2,210,346 31.81 30.22 25.66Share Class CHR (EUR) 856,246 28.70 27.77 24.26Share Class CR 843,188 32.18 30.50 25.84Share Class IR 601,739 34.86 32.49 27.05Share Class Z 1,768,746 42.21 37.69 30.02Share Class ZH (GBP) 15,891 35.45 32.40 26.32Share Class ZHR (CHF)* 611,768 28.78 – –Share Class ZHR (EUR) 1,924,413 27.93 26.56 –Share Class ZHR (GBP)* 401 27.47 – –Share Class ZR 414,092 35.03 32.63 27.16
Total net assets in USD 473,237,586 260,019,970 137,929,294
Morgan Stanley Investment Funds – Global Endurance Fund
Share Class A 68,919 54.44 26.52 –Share Class B 4,000 53.71 26.43 –Share Class C 4,000 53.86 26.45 –Share Class I 25,380 55.09 26.60 –Share Class Z 302,047 55.12 26.60 –
Total net assets in USD 22,229,894 5,318,987 –
* Share Class was launched during the year.*** Share Class was reactivated during the year.**** Official Net Asset Value per Share is in USD.

407 Morgan Stanley Investment Funds 31 December 2020
Statement of share and net assets statistics (continued)For the year ended 31 December 2020
Shares outstanding as at Nav per share as at
31 December 2020 31 December 2020 31 December 2019 31 December 2018
Morgan Stanley Investment Funds – Global Infrastructure Fund
Share Class A 4,362,702 63.57 65.26 51.75Share Class AH (EUR) 937,073 54.72 57.38 46.97Share Class B 523,573 57.20 59.31 47.50Share Class BH (EUR) 136,096 49.29 52.20 43.16Share Class C 360,608 58.42 60.45 48.32Share Class CH (EUR) 166,863 35.58 37.61 31.03Share Class I 694,130 43.26 44.10 34.72Share Class IH (EUR) 52,578 28.73 29.92 24.32Share Class IHR (EUR) 13,375 25.86 27.61 23.21Share Class N 938,023 26.62 26.89 –Share Class Z 2,673,297 68.94 70.25 55.29Share Class ZH (EUR) 2,321,789 50.30 52.35 42.54Share Class ZX 2,979,236 29.62 30.62 24.67
Total net assets in USD 879,870,651 1,227,635,276 711,277,816
Morgan Stanley Investment Funds – Global Infrastructure Unconstrained Fund
Share Class A 2,000 27.33 27.87 24.72Share Class Z 202,012 28.01 28.32 24.91
Total net assets in USD 5,712,425 5,686,081 5,039,981
Morgan Stanley Investment Funds – Global Opportunity Fund
Share Class A 55,520,361 132.97 86.34 64.04Share Class AH (EUR) 14,500,921 115.28 76.47 58.46Share Class B 4,447,033 120.22 78.85 59.06Share Class BH (EUR) 1,223,941 104.23 69.83 53.92Share Class C 5,416,212 122.67 80.29 60.03Share Class CH (EUR) 1,132,003 41.04 27.44 21.15Share Class I 9,120,169 135.95 87.49 64.30Share Class IH (EUR)* 803,858 34.22 – –Share Class IH1 (AUD)* 144,430 33.42 – –Share Class N 2,243,435 94.42 60.26 43.92Share Class Z 50,554,311 145.64 93.68 68.83Share Class ZH (EUR) 13,832,664 66.21 43.50 32.95Share Class ZH (SEK) 1,009,696 663.22 438.40 331.69
Total net assets in USD 20,903,934,287 9,492,594,154 6,527,017,621
Morgan Stanley Investment Funds – Global Permanence Fund
Share Class A 4,000 31.52 25.30 –Share Class B 4,000 31.10 25.22 –Share Class C 4,000 31.19 25.23 –Share Class I 53,598 31.91 25.38 –Share Class Z 184,000 31.92 25.38 –
Total net assets in USD 7,958,863 5,074,960 –
Morgan Stanley Investment Funds – Global Property Fund
Share Class A 2,633,763 28.44 32.79 27.94Share Class AH (EUR) 1,944,252 28.06 33.14 29.13Share Class B 27,751 24.65 28.71 24.71Share Class BH (EUR) 29,538 25.36 30.27 26.87Share Class C 74,095 30.56 35.51 30.50Share Class CH (EUR) 11,925 25.84 30.77 27.27Share Class I 192,247 31.45 36.01 30.47Share Class IX 25,819 24.53 28.70 24.82Share Class Z 10,568,963 37.40 42.80 36.19Share Class ZH (EUR) 291,794 22.61 26.49 23.12Share Class ZX 2,620,855 24.76 28.97 25.05
Total net assets in USD 620,987,742 880,372,283 865,244,894
Morgan Stanley Investment Funds – Global Property Unconstrained Fund
Share Class A 2,000 19.61 25.63 22.82Share Class Z 198,000 20.13 26.09 23.03
Total net assets in USD 4,025,621 5,216,959 4,605,878
* Share Class was launched during the year.

Morgan Stanley Investment Funds 31 December 2020 408
Statement of share and net assets statistics (continued)For the year ended 31 December 2020
Shares outstanding as at Nav per share as at
31 December 2020 31 December 2020 31 December 2019 31 December 2018
Morgan Stanley Investment Funds – Global Quality Fund
Share Class A 6,691,596 50.97 45.01 35.15Share Class AH (CHF) 3,528 41.11 37.12 29.96Share Class AH (EUR) 1,365,154 45.17 40.74 32.81Share Class AH (SGD) 77,815 46.76 41.79 32.89Share Class AX 213,161 49.74 43.93 34.38Share Class B 1,682,414 47.33 42.22 33.30Share Class BH (EUR) 308,374 41.97 38.23 31.10Share Class C 1,426,487 48.03 42.76 33.66Share Class CH (EUR) 159,474 42.56 38.70 31.41Share Class I 4,045,280 54.53 47.73 36.94Share Class Z 12,809,898 54.72 47.87 37.04Share Class ZH (CHF) 46,133 43.89 39.26 31.39Share Class ZH (EUR) 4,243,208 45.69 40.82 32.57Share Class ZX 5,759,939 47.41 41.78 32.63
Total net assets in USD 2,037,273,983 2,083,250,256 1,601,649,031
Morgan Stanley Investment Funds – Global Sustain Fund
Share Class A 801,358 34.89 30.41 23.67Share Class AH (EUR) 4,800,631 33.22 29.55 23.70Share Class B 88,086 32.59 28.70 –Share Class BH (EUR) 96,800 31.22 28.05 –Share Class C 109,736 32.70 28.74 –Share Class CH (EUR) 42,418 31.33 28.10 –Share Class I 1,096,145 35.69 30.83 23.78Share Class IH (EUR)* 9,107 31.30 – –Share Class IH (GBP) 5,795 29.85 26.42 –Share Class J 12,629,592 37.69 32.50 25.01Share Class JH (GBP) 181,530 33.29 29.38 –Share Class Z 5,636,297 35.72 30.85 23.78Share Class ZH (CHF)* 442,430 29.59 – –Share Class ZH (EUR)* 1,950,917 34.24 – –Share Class ZH (GBP)* 44,805 29.67 – –Share Class ZX 156,101 36.19 31.40 –
Total net assets in USD 1,065,055,546 291,469,764 22,187,886
Morgan Stanley Investment Funds – Indian Equity Fund
Share Class A 1,663,561 42.60 39.52 39.12Share Class B 316,016 36.99 34.65 34.65Share Class C 19,389 22.87 21.38 21.34Share Class I 43,965 47.76 43.90 43.08Share Class N** – – 43.19 42.02Share Class Z 36,913 49.34 45.34 44.46
Total net assets in USD 86,929,372 109,091,816 195,104,340
Morgan Stanley Investment Funds – International Equity (ex US) Fund
Share Class A 1,135,180 32.12 29.07 24.39Share Class C 57,363 30.59 27.91 23.60Share Class I 2,097,089 33.96 30.46 25.33Share Class Z 977 34.03 30.51 25.36
Total net assets in USD 109,457,895 71,617,292 69,304,098
Morgan Stanley Investment Funds – Japanese Equity Fund
Share Class A 79,609 4,371.41 4,368.33 3,785.52Share Class AH (USD) 8,098 31.98 31.87 27.01Share Class B 48,814 4,273.50 4,313.29 3,775.38Share Class C 9,133 4,358.94 4,390.77 3,835.52Share Class I 33,808 5,011.06 4,972.70 4,279.21Share Class Z 1,911,381 4,734.59 4,696.46 4,039.88Share Class ZH (EUR) 21,379 43.89 44.12 38.21
Total net assets in JPY 9,960,991 ****** 13,172,562 ****** 13,590,223
* Share Class was launched during the year.** Share Class was closed during the year.****** JPY000’s.

409 Morgan Stanley Investment Funds 31 December 2020
Statement of share and net assets statistics (continued)For the year ended 31 December 2020
Shares outstanding as at Nav per share as at
31 December 2020 31 December 2020 31 December 2019 31 December 2018
Morgan Stanley Investment Funds – Latin American Equity Fund
Share Class A 4,081,600 53.63 60.08 50.38Share Class B 20,455 42.18 47.73 40.42Share Class C 40,121 17.05 19.26 16.28Share Class I 25,026 62.45 69.52 57.92Share Class Z 222,348 44.87 49.92 41.57
Total net assets in USD 231,966,616 270,458,035 284,519,961
Morgan Stanley Investment Funds – Sustainable Asian Equity Fund (5)
Share Class A 433,118 66.69 53.21 45.21Share Class B 50,868 52.65 42.43 36.41Share Class I 50,259 78.42 62.12 52.41Share Class Z 39,588 47.09 37.29 31.45
Total net assets in USD 37,369,990 32,658,225 77,137,007
Morgan Stanley Investment Funds – US Active Factor Equity Fund
Share Class A 33,190 45.31 36.99 27.49Share Class I 7,460 46.77 37.91 27.98Share Class Z 996,656 46.86 37.97 28.01
Total net assets in USD 48,557,253 36,671,027 5,285,463
Morgan Stanley Investment Funds – US Advantage Fund
Share Class A 34,021,286 174.53 99.38 79.17Share Class AH (EUR) 6,972,466 113.03 65.66 53.93Share Class B 918,903 150.16 86.36 69.49Share Class BH (EUR) 119,290 176.89 103.80 86.12Share Class C 2,735,162 158.47 90.96 73.04Share Class CH (EUR) 147,939 48.23 28.24 23.38Share Class I 9,295,280 195.51 110.50 87.36Share Class IH (EUR) 1,047,739 79.01 45.55 37.14Share Class IH (GBP) 552,671 44.33 25.62 –Share Class N 400 43.72 24.52 –Share Class NH (EUR) 5,928,783 42.36 24.24 –Share Class S 1,450,000 63.51 35.87 28.34Share Class Z 21,172,201 185.94 105.05 83.02Share Class ZH (EUR) 4,431,698 194.08 111.86 91.16Share Class ZH (GBP) 841,381 75.93 43.87 35.34Share Class ZH3 (BRL)* 44,928 28.47 **** – –Share Class ZHX (GBP) 400 43.31 25.02 –Share Class ZX 3,444,355 158.68 89.65 70.85
Total net assets in USD 15,490,470,524 8,358,798,815 6,680,591,088
Morgan Stanley Investment Funds – US Growth Fund
Share Class A 11,163,953 263.69 122.35 100.78Share Class AH (EUR) 3,485,108 163.46 77.37 65.78Share Class AX 239,709 263.69 122.35 100.77Share Class B 288,344 208.81 97.86 81.41Share Class BH (EUR) 91,329 148.50 70.99 60.97Share Class C 1,235,124 176.66 82.63 68.60Share Class CH (EUR) 190,021 144.51 68.95 59.09Share Class F 450,421 115.16 53.06 43.40Share Class I 2,890,455 312.35 143.85 117.60Share Class IH (EUR) 622,454 49.75 23.35 –Share Class IX 52,285 311.82 143.61 117.40Share Class N 400 51.69 23.62 –Share Class NH (EUR) 2,613,531 50.09 23.35 –Share Class Z 5,802,381 201.85 92.92 75.93Share Class ZH (EUR) 1,417,113 176.93 83.10 70.10Share Class ZHX (EUR) 97,235 61.07 28.68 24.19Share Class ZHX (GBP) 265,431 62.18 29.27 24.41Share Class ZX 1,230,334 95.29 43.87 35.85
Total net assets in USD 6,830,223,119 2,237,753,383 2,114,115,548
(5) Formerly known as Asian Equity Fund prior to 31 December 2020. * Share Class was launched during the year.**** Official Net Asset Value per Share is in USD.

Morgan Stanley Investment Funds 31 December 2020 410
Statement of share and net assets statistics (continued)For the year ended 31 December 2020
Shares outstanding as at Nav per share as at
31 December 2020 31 December 2020 31 December 2019 31 December 2018
Morgan Stanley Investment Funds – US Insight Fund
Share Class A 658,453 82.51 38.02 32.90Share Class I* 1,201,626 27.97 – –Share Class Z 280,963 87.13 39.79 34.13
Total net assets in USD 112,411,273 9,559,876 9,772,975
Morgan Stanley Investment Funds – US Permanence Fund (6)
Share Class Z* 200,000 28.53 – –
Total net assets in USD 5,705,995 – –
Morgan Stanley Investment Funds – US Property Fund
Share Class A 757,426 61.27 75.74 65.41Share Class B 6,614 48.24 60.24 52.54Share Class C 3,565 22.35 27.86 24.26Share Class F 2,039 24.48 30.07 25.80Share Class I 341,517 71.71 88.04 75.50Share Class Z 83,074 52.16 64.01 54.87
Total net assets in USD 75,677,560 162,962,268 184,955,108
Morgan Stanley Investment Funds – Emerging Markets Corporate Debt Fund
Share Class A 3,363,757 40.63 38.99 34.72Share Class AH (EUR) 897,403 36.11 35.19 32.30Share Class AHX (EUR) 707,602 25.24 25.59 24.51Share Class AR 164,008 23.33 23.72 22.42Share Class AX 1,528,271 28.40 28.37 26.36Share Class B 400,435 36.82 35.70 32.10Share Class BH (EUR) 433,071 32.71 32.19 29.85Share Class BHX (EUR) 611,584 25.19 25.53 24.46Share Class BX 649,415 28.32 28.29 26.28Share Class C 726,127 37.87 36.60 32.81Share Class CH (EUR) 159,591 29.22 28.67 26.50Share Class CHX (EUR) 8,778 23.74 24.06 23.05Share Class CX 8,836 25.35 25.32 23.52Share Class I 1,613,790 34.88 33.22 29.36Share Class IH (EUR) 1,404,861 31.46 30.43 27.73Share Class N 6,621,064 27.62 26.09 –Share Class SHX (EUR) 340 25.03 25.40 24.33Share Class Z 10,870,267 43.43 41.36 36.53Share Class ZH (EUR) 3,241,577 32.63 31.54 28.73Share Class ZHX (EUR) 1,625,606 23.05 23.37 22.39
Total net assets in USD 1,289,974,835 1,594,124,827 1,203,723,178
Morgan Stanley Investment Funds – Emerging Markets Debt Fund
Share Class A 635,693 99.55 93.86 82.53Share Class AH (EUR) 205,926 65.13 62.51 56.66Share Class AHX (EUR) 145,767 21.55 21.42 20.32Share Class ARM 876,712 19.99 19.82 18.50Share Class AX 154,628 52.02 50.82 46.77Share Class B 205,482 78.78 75.02 66.62Share Class BH (EUR) 217,755 29.56 28.65 26.23Share Class BHX (EUR) 148,666 21.52 21.38 20.29Share Class BX 313,777 24.28 23.72 21.82Share Class C 117,682 41.30 39.22 34.72Share Class CH (EUR) 16,456 26.24 25.36 23.15Share Class CHX (EUR) 9,243 24.11 23.95 22.73Share Class CX 6,770 25.82 25.22 23.21Share Class I 26,927 115.32 107.86 94.08Share Class IH (EUR)*** 400 30.30 – –Share Class Z 884,017 49.31 46.10 40.20Share Class ZH (EUR) 21,420 39.65 37.73 33.92
Total net assets in USD 198,392,414 210,751,993 160,277,742
(6) Fund commenced operations on 30 October 2020.* Share Class was launched during the year.*** Share Class was reactivated during the year.
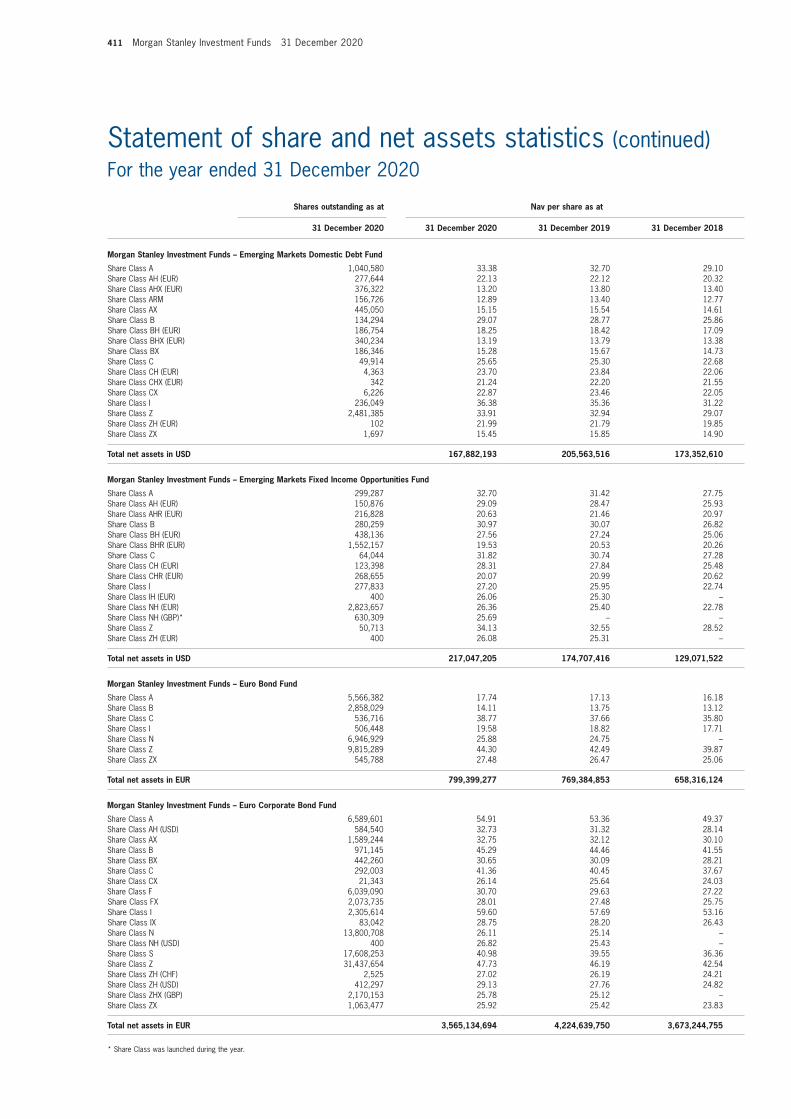
411 Morgan Stanley Investment Funds 31 December 2020
Statement of share and net assets statistics (continued)For the year ended 31 December 2020
Shares outstanding as at Nav per share as at
31 December 2020 31 December 2020 31 December 2019 31 December 2018
Morgan Stanley Investment Funds – Emerging Markets Domestic Debt Fund
Share Class A 1,040,580 33.38 32.70 29.10Share Class AH (EUR) 277,644 22.13 22.12 20.32Share Class AHX (EUR) 376,322 13.20 13.80 13.40Share Class ARM 156,726 12.89 13.40 12.77Share Class AX 445,050 15.15 15.54 14.61Share Class B 134,294 29.07 28.77 25.86Share Class BH (EUR) 186,754 18.25 18.42 17.09Share Class BHX (EUR) 340,234 13.19 13.79 13.38Share Class BX 186,346 15.28 15.67 14.73Share Class C 49,914 25.65 25.30 22.68Share Class CH (EUR) 4,363 23.70 23.84 22.06Share Class CHX (EUR) 342 21.24 22.20 21.55Share Class CX 6,226 22.87 23.46 22.05Share Class I 236,049 36.38 35.36 31.22Share Class Z 2,481,385 33.91 32.94 29.07Share Class ZH (EUR) 102 21.99 21.79 19.85Share Class ZX 1,697 15.45 15.85 14.90
Total net assets in USD 167,882,193 205,563,516 173,352,610
Morgan Stanley Investment Funds – Emerging Markets Fixed Income Opportunities Fund
Share Class A 299,287 32.70 31.42 27.75Share Class AH (EUR) 150,876 29.09 28.47 25.93Share Class AHR (EUR) 216,828 20.63 21.46 20.97Share Class B 280,259 30.97 30.07 26.82Share Class BH (EUR) 438,136 27.56 27.24 25.06Share Class BHR (EUR) 1,552,157 19.53 20.53 20.26Share Class C 64,044 31.82 30.74 27.28Share Class CH (EUR) 123,398 28.31 27.84 25.48Share Class CHR (EUR) 268,655 20.07 20.99 20.62Share Class I 277,833 27.20 25.95 22.74Share Class IH (EUR) 400 26.06 25.30 –Share Class NH (EUR) 2,823,657 26.36 25.40 22.78Share Class NH (GBP)* 630,309 25.69 – –Share Class Z 50,713 34.13 32.55 28.52Share Class ZH (EUR) 400 26.08 25.31 –
Total net assets in USD 217,047,205 174,707,416 129,071,522
Morgan Stanley Investment Funds – Euro Bond Fund
Share Class A 5,566,382 17.74 17.13 16.18Share Class B 2,858,029 14.11 13.75 13.12Share Class C 536,716 38.77 37.66 35.80Share Class I 506,448 19.58 18.82 17.71Share Class N 6,946,929 25.88 24.75 –Share Class Z 9,815,289 44.30 42.49 39.87Share Class ZX 545,788 27.48 26.47 25.06
Total net assets in EUR 799,399,277 769,384,853 658,316,124
Morgan Stanley Investment Funds – Euro Corporate Bond Fund
Share Class A 6,589,601 54.91 53.36 49.37Share Class AH (USD) 584,540 32.73 31.32 28.14Share Class AX 1,589,244 32.75 32.12 30.10Share Class B 971,145 45.29 44.46 41.55Share Class BX 442,260 30.65 30.09 28.21Share Class C 292,003 41.36 40.45 37.67Share Class CX 21,343 26.14 25.64 24.03Share Class F 6,039,090 30.70 29.63 27.22Share Class FX 2,073,735 28.01 27.48 25.75Share Class I 2,305,614 59.60 57.69 53.16Share Class IX 83,042 28.75 28.20 26.43Share Class N 13,800,708 26.11 25.14 –Share Class NH (USD) 400 26.82 25.43 –Share Class S 17,608,253 40.98 39.55 36.36Share Class Z 31,437,654 47.73 46.19 42.54Share Class ZH (CHF) 2,525 27.02 26.19 24.21Share Class ZH (USD) 412,297 29.13 27.76 24.82Share Class ZHX (GBP) 2,170,153 25.78 25.12 –Share Class ZX 1,063,477 25.92 25.42 23.83
Total net assets in EUR 3,565,134,694 4,224,639,750 3,673,244,755
* Share Class was launched during the year.

Morgan Stanley Investment Funds 31 December 2020 412
Statement of share and net assets statistics (continued)For the year ended 31 December 2020
Shares outstanding as at Nav per share as at
31 December 2020 31 December 2020 31 December 2019 31 December 2018
Morgan Stanley Investment Funds – Euro Corporate Bond – Duration Hedged Fund
Share Class A 1,302,841 29.91 29.32 27.35Share Class AX 193,582 24.26 24.04 22.74Share Class B 106,932 27.01 26.74 25.19Share Class BX 56,405 24.20 23.98 22.69Share Class C 2,318 27.75 27.38 25.70Share Class I 137,228 29.04 28.35 26.34Share Class N 400 26.25 25.50 –Share Class Z 7,069,449 31.35 30.60 28.42
Total net assets in EUR 273,635,817 382,043,015 375,195,716
Morgan Stanley Investment Funds – Euro Strategic Bond Fund
Share Class A 12,508,604 51.93 49.67 45.92Share Class AX 2,341,793 31.54 30.36 28.41Share Class B 4,522,351 41.13 39.74 37.10Share Class BX 803,273 31.33 30.26 28.32Share Class C 2,245,523 35.23 33.92 31.56Share Class CX 67,628 27.01 26.02 24.35Share Class I 240,917 57.39 54.67 50.33Share Class N 6,768,870 26.35 24.98 –Share Class Z 13,694,707 47.49 45.22 41.62
Total net assets in EUR 1,858,165,416 1,386,300,714 1,157,441,036
Morgan Stanley Investment Funds – European Fixed Income Opportunities Fund
Share Class A 1,131,574 27.01 26.36 25.24Share Class AR 4,746,403 22.84 22.76 22.34Share Class B 596,863 25.31 24.94 24.13Share Class BR 516,758 21.47 21.61 21.43Share Class C 229,678 26.18 25.66 24.69Share Class CR 47,158 22.21 22.23 21.93Share Class I 36,682 25.86 25.08 –Share Class IR 409 25.28 25.04 –Share Class J* 992,084 25.63 – –Share Class N* 95,933 25.72 – –Share Class Z 277,147 28.13 27.27 25.95Share Class ZR 409 25.30 25.04 –
Total net assets in EUR 208,893,339 48,470,002 54,954,524
Morgan Stanley Investment Funds – European High Yield Bond Fund
Share Class A 3,931,419 26.41 25.96 23.59Share Class AH (USD) 48,739 35.41 34.21 30.17Share Class AX 1,796,161 29.39 29.91 28.15Share Class B 1,503,049 21.06 20.90 19.19Share Class BX 2,704,877 29.32 29.84 28.08Share Class C 183,983 53.32 52.73 48.23Share Class CX 5,678 24.44 24.87 23.41Share Class I 523,033 29.17 28.54 25.83Share Class IH (USD) 3,201 36.40 35.04 30.78Share Class N 3,817,651 26.40 25.68 –Share Class Z 4,771,317 61.24 59.91 54.20Share Class ZH (USD)* 400 27.29 – –Share Class ZHX (GBP) 401 25.57 26.00 –Share Class ZX 5,669,026 25.21 25.67 24.16
Total net assets in EUR 830,220,518 958,164,610 1,006,949,487
* Share Class was launched during the year.

413 Morgan Stanley Investment Funds 31 December 2020
Statement of share and net assets statistics (continued)For the year ended 31 December 2020
Shares outstanding as at Nav per share as at
31 December 2020 31 December 2020 31 December 2019 31 December 2018
Morgan Stanley Investment Funds – Global Asset Backed Securities Fund
Share Class A 3,010,992 33.93 33.25 31.29Share Class AH (EUR) 1,212,934 30.16 29.99 29.09Share Class AH (GBP) 69,443 26.68 26.32 25.21Share Class AH (SEK) 13,793 259.15 256.50 248.11Share Class AHR (EUR) 48,265 24.03 24.59 24.61Share Class AHX (EUR) 63,503 24.79 25.04 24.75Share Class AR 652,049 25.26 25.48 24.73Share Class B 361,417 31.26 30.94 29.41Share Class BH (EUR) 257,057 27.82 27.94 27.37Share Class BHR (EUR) 253,577 21.32 22.04 22.28Share Class BHX (EUR) 69,343 25.71 25.97 25.66Share Class C 865,372 32.31 31.86 30.16Share Class CH (EUR) 274,627 28.74 28.75 28.05Share Class CHR (EUR) 9,279 23.68 24.38 24.55Share Class CHX (EUR) 60,911 25.75 26.01 25.69Share Class CX 54,203 28.70 28.59 27.40Share Class FH (EUR) 6,421,332 26.15 25.84 24.90Share Class FHX (EUR) 2,271,526 24.81 25.07 24.77Share Class I 3,377,321 35.50 34.60 32.38Share Class IH (EUR) 796,777 30.67 30.33 29.26Share Class IHX (EUR) 245,588 25.12 25.38 25.08Share Class N 450,400 26.38 25.56 –Share Class Z 7,206,796 35.59 34.68 32.44Share Class ZH (EUR) 1,493,502 26.48 26.18 25.25Share Class ZH (SEK) 5,656,063 266.55 262.30 252.23Share Class ZHX (EUR)* 400 25.12 – –Share Class ZHX (GBP) 205,169 25.53 25.59 24.96Share Class ZX*** 125,400 25.14 – –
Total net assets in USD 1,184,593,940 1,188,971,485 812,560,451
Morgan Stanley Investment Funds – Global Bond Fund
Share Class A 4,368,264 49.07 44.59 41.16Share Class AH (EUR) 498,527 27.86 25.77 24.54Share Class AHX (EUR) 150,548 23.10 21.68 21.08Share Class AX 346,532 35.18 32.47 30.60Share Class B 1,273,935 38.68 35.50 33.10Share Class BH (EUR) 231,944 25.26 23.59 22.69Share Class BHX (EUR) 162,091 23.06 21.65 21.04Share Class BX 301,159 26.50 24.45 23.05Share Class C 462,217 35.98 32.90 30.57Share Class I 1,057,895 54.29 49.14 45.17Share Class N* 400 26.21 – –Share Class NH (EUR)* 400 26.08 – –Share Class NH1 (JPY) 1,115,239 2,756.31 2,621.31 –Share Class Z 13,632,999 41.17 37.25 34.23Share Class ZH (EUR) 12,833,228 28.96 26.66 25.27Share Class ZH1 (EUR) 10,762,990 27.65 26.43 24.71
Total net assets in USD 1,803,196,574 734,312,048 579,185,873
Morgan Stanley Investment Funds – Global Buy and Hold 2020 Bond Fund (7)
Share Class A – – 25.89 24.85Share Class AR – – 22.87 23.11Share Class AX – – 24.74 24.12Share Class B – – 25.08 24.32Share Class BR – – 22.81 23.05Share Class BX – – 24.63 24.01Share Class I – – 26.09 24.98Share Class Z – – 26.13 25.01
Total net assets in EUR – 184,385,870 201,982,384
(7) Fund merged into European Fixed Income Opportunities Fund on 9 November 2020.* Share Class was launched during the year.*** Share Class was reactivated during the year.

Morgan Stanley Investment Funds 31 December 2020 414
Statement of share and net assets statistics (continued)For the year ended 31 December 2020
Shares outstanding as at Nav per share as at
31 December 2020 31 December 2020 31 December 2019 31 December 2018
Morgan Stanley Investment Funds – Global Convertible Bond Fund
Share Class A 1,627,428 60.15 49.43 43.26Share Class AH (CHF) 43,004 36.95 30.94 27.99Share Class AH (EUR) 777,835 46.01 38.46 34.70Share Class B 259,910 50.03 41.53 36.71Share Class BH (EUR) 95,163 38.24 32.28 29.42Share Class CH (EUR) 75,016 34.95 29.39 26.67Share Class I 78,433 65.51 53.59 46.70Share Class IH (EUR) 511,893 50.10 41.68 37.43Share Class N 400 32.50 26.40 –Share Class NH (CHF) 360 33.01 27.32 24.43Share Class Z 1,898,061 47.94 39.20 34.14Share Class ZH (EUR) 229,028 53.24 44.28 39.77Share Class ZH (GBP) 66,760 33.04 27.44 24.35Share Class ZHX (EUR) 2,540,192 47.26 39.34 35.37Share Class ZX** – – 32.13 28.03
Total net assets in USD 457,194,276 310,982,951 498,135,007
Morgan Stanley Investment Funds – Global Credit Fund
Share Class A 392,148 34.58 31.27 27.57Share Class B 399,133 31.88 29.13 25.93Share Class C 51,721 32.81 29.87 26.50Share Class I 381,158 35.75 32.20 28.28Share Class Z 2,340,756 35.88 32.30 28.35Share Class ZH (GBP) 305,122 29.80 27.24 24.34
Total net assets in USD 138,008,271 112,085,483 92,264,459
Morgan Stanley Investment Funds – Global Fixed Income Opportunities Fund
Share Class A 21,400,452 38.31 36.84 33.71Share Class AH (AUD)* 400 25.64 – –Share Class AH (CHF) 108,923 26.65 26.09 24.71Share Class AH (EUR) 10,826,286 32.30 31.56 29.77Share Class AHR (EUR) 445,768 21.54 21.78 21.43Share Class AHX (EUR) 3,478,484 26.02 25.97 25.22Share Class AR 736,634 25.45 25.33 24.16Share Class ARM 1,457,602 23.61 23.47 22.36Share Class AX 7,127,573 29.33 28.84 27.16Share Class B 6,273,700 34.98 33.98 31.41Share Class BH (EUR) 4,712,390 29.61 29.22 27.84Share Class BHR (EUR) 1,521,901 20.11 20.54 20.41Share Class BHX (EUR) 8,103,786 25.97 25.92 25.16Share Class BX 3,710,905 29.27 28.77 27.10Share Class C 4,882,396 32.72 31.61 29.05Share Class CH (EUR) 2,102,092 29.04 28.50 27.00Share Class CHR (EUR) 568,387 20.88 21.21 20.96Share Class CHX (EUR) 794,171 23.70 23.66 22.97Share Class CX 59,936 26.32 25.87 24.37Share Class I 9,414,180 31.64 30.24 27.51Share Class IH (EUR) 2,039,920 26.80 26.02 24.40Share Class IR 5,218 25.95 25.67 24.34Share Class IX 1,593,305 25.69 25.26 23.79Share Class N 8,480,270 27.08 25.75 –Share Class NH (GBP)* 444,184 25.84 – –Share Class NH (SGD) 8,000,000 27.04 25.83 –Share Class Z 13,884,201 40.70 38.89 35.36Share Class ZH (CHF) 239,815 27.63 26.87 25.29Share Class ZH (EUR) 23,077,852 30.88 29.99 28.11Share Class ZH3 (BRL) 1,255,488 22.18 **** 27.20 **** 25.06Share Class ZHR (GBP) 293,127 24.73 24.72 23.85Share Class ZX 2,164,304 26.32 25.87 24.37
Total net assets in USD 5,062,847,454 4,473,535,283 2,973,584,114
* Share Class was launched during the year.** Share Class was closed during the year.**** Official Net Asset Value per Share is in USD.

415 Morgan Stanley Investment Funds 31 December 2020
Statement of share and net assets statistics (continued)For the year ended 31 December 2020
Shares outstanding as at Nav per share as at
31 December 2020 31 December 2020 31 December 2019 31 December 2018
Morgan Stanley Investment Funds – Global High Yield Bond Fund
Share Class A 974,381 44.96 42.94 38.09Share Class AH (EUR) 366,735 35.95 34.98 32.01Share Class AHRM (ZAR) 1,057 525.48 515.03 –Share Class AHX (EUR) 589,207 23.63 24.28 23.47Share Class AR 1,260 23.24 23.75 22.52Share Class ARM 18,281 25.18 25.66 –Share Class AX 1,389,227 26.92 27.16 25.44Share Class B 496,219 41.05 39.60 35.48Share Class BH (EUR) 224,862 32.95 32.38 29.93Share Class BHX (EUR) 844,512 23.59 24.23 23.42Share Class BX 1,149,453 26.88 27.11 25.40Share Class C 122,681 36.03 34.62 30.89Share Class CH (EUR) 68,171 31.69 31.02 28.55Share Class CHX (EUR) 2,174 22.64 23.26 22.48Share Class CX 19,143 24.30 24.52 22.97Share Class I 13,819 31.90 30.33 26.78Share Class IX 44,933 21.38 21.57 20.21Share Class N 7,096,041 27.69 26.15 –Share Class Z 6,093,387 47.06 44.73 39.48Share Class ZH (EUR) 213,614 28.78 27.86 25.37
Total net assets in USD 699,623,961 588,306,391 619,126,499
Morgan Stanley Investment Funds – Short Maturity Euro Bond Fund
Share Class A 14,276,030 20.03 20.18 20.05Share Class B 2,620,749 16.07 16.35 16.41Share Class C 152,625 24.97 25.32 25.32Share Class I 1,135,710 22.19 22.26 22.03Share Class N 400 25.06 25.01 –Share Class NH (USD) 400 25.83 25.44 –Share Class Z 30,101,774 30.85 30.85 30.44
Total net assets in EUR 1,285,740,255 2,259,110,399 2,571,556,010
Morgan Stanley Investment Funds – Sustainable Euro Corporate Bond Fund (8)
Share Class A* 4,000 25.61 – –Share Class I* 4,000 25.69 – –Share Class Z* 872,000 25.69 – –
Total net assets in EUR 22,609,450 – –
Morgan Stanley Investment Funds – Sustainable Euro Strategic Bond Fund (9)
Share Class A* 4,000 25.60 – –Share Class I* 4,000 25.68 – –Share Class Z* 941,743 25.68 – –
Total net assets in EUR 24,389,837 – –
Morgan Stanley Investment Funds – US Dollar Corporate Bond Fund
Share Class A 539,747 32.47 29.47 25.37Share Class I 287,092 33.23 30.02 25.72Share Class N* 400 26.25 – –Share Class NH (EUR)* 400 26.11 – –Share Class Z 9,074,640 33.29 30.06 25.74Share Class ZH (EUR)* 400 26.06 – –
Total net assets in USD 329,200,276 19,554,093 27,130,879
(8) Fund commenced operations on 31 July 2020.(9) Fund commenced operations on 31 July 2020.* Share Class was launched during the year.

Morgan Stanley Investment Funds 31 December 2020 416
Statement of share and net assets statistics (continued)For the year ended 31 December 2020
Shares outstanding as at Nav per share as at
31 December 2020 31 December 2020 31 December 2019 31 December 2018
Morgan Stanley Investment Funds – US Dollar High Yield Bond Fund
Share Class A 217,795 34.87 33.41 29.21Share Class AH (EUR) 11,949 27.12 26.44 23.83Share Class AR 161,804 23.69 24.28 22.77Share Class AX 354,795 25.40 25.64 23.67Share Class BH (EUR) 5,778 26.16 25.76 23.44Share Class C 416,565 33.93 32.66 28.68Share Class CH (EUR) 5,210 26.69 26.13 23.66Share Class CX*** 102,124 26.39 – –Share Class I 410,877 36.63 34.81 30.19Share Class J 3,634,984 27.24 25.81 –Share Class JH (EUR) 157,644 26.69 25.74 –Share Class N 400 27.79 26.26 –Share Class Z 4,479,017 36.96 35.12 30.38Share Class ZH (EUR) 16,311 28.20 27.26 24.31Share Class ZHX (EUR) 4,813,000 23.96 24.60 23.45
Total net assets in USD 464,868,321 392,805,741 203,622,630
Morgan Stanley Investment Funds – US Dollar Short Duration Bond Fund
Share Class A 7,155,269 27.21 26.64 25.75Share Class I 3,745,607 27.67 26.99 26.00Share Class N 400 26.10 25.42 –Share Class Z 447,466 27.75 27.06 26.04
Total net assets in USD 310,782,167 280,923,648 207,103,938
Morgan Stanley Investment Funds – US Dollar Short Duration High Yield Bond Fund
Share Class A 900,516 33.79 32.61 29.68Share Class AH (EUR) 203,201 26.92 26.44 24.81Share Class AR 455,872 23.60 24.40 23.77Share Class AX 360,145 24.29 24.79 23.84Share Class BH (EUR) 86,655 25.96 25.75 24.41Share Class C 259,080 33.17 32.10 29.31Share Class CH (EUR) 9,711 26.62 26.23 24.69Share Class CX 36,908 24.27 24.77 23.82Share Class I 720,959 35.16 33.71 30.48Share Class N 400 27.06 25.82 –Share Class Z 666,498 35.25 33.78 30.53Share Class ZM* 1,116,309 26.25 – –
Total net assets in USD 147,367,891 102,093,193 79,367,000
Morgan Stanley Investment Funds – Global Balanced Defensive Fund
Share Class A 476,379 25.55 25.83 24.62Share Class B 1,611,092 24.46 24.98 24.05Share Class C 274,391 24.78 25.23 24.22Share Class Z 46,990 26.33 26.43 25.03
Total net assets in EUR 59,619,601 65,071,057 51,156,564
Morgan Stanley Investment Funds – Global Balanced Fund
Share Class A 64,785 25.58 26.51 24.71Share Class B 129,225 24.49 25.63 24.13Share Class C 106,267 24.57 25.64 24.07Share Class Z 40,806,515 26.96 27.67 25.48
Total net assets in EUR 1,107,746,646 795,725,383 321,432,281
* Share Class was launched during the year.*** Share Class was reactivated during the year.

417 Morgan Stanley Investment Funds 31 December 2020
Statement of share and net assets statistics (continued)For the year ended 31 December 2020
Shares outstanding as at Nav per share as at
31 December 2020 31 December 2020 31 December 2019 31 December 2018
Morgan Stanley Investment Funds – Global Balanced Income Fund
Share Class A 78,457 27.42 28.65 26.56Share Class AHR (USD) 516,874 20.92 22.82 21.83Share Class AHRM (AUD) 14,061 23.16 25.25 24.26Share Class AHRM (USD) 932,682 23.33 25.44 24.32Share Class AR 5,538,870 19.86 21.60 20.90Share Class BR 5,344,566 18.52 20.34 19.88Share Class CHR (USD) 65,090 20.53 22.55 21.73Share Class CR 1,122,170 18.85 20.65 20.12Share Class I 49,671 27.75 28.71 26.31Share Class IHR (USD) 135,366 22.71 24.54 23.20Share Class IR 563,309 21.45 23.11 22.10Share Class Z 412,365 29.70 30.72 28.13Share Class ZH (USD) 400 27.93 28.49 25.35Share Class ZHR (GBP) 5,009 20.94 22.64 21.60Share Class ZR 367 21.89 23.57 22.53
Total net assets in EUR 288,486,746 439,701,599 501,711,493
Morgan Stanley Investment Funds – Global Balanced Risk Control Fund of Funds
Share Class A 44,992,838 40.68 38.42 35.76Share Class AH (USD) 4,383,327 35.04 32.64 29.51Share Class B 15,758,256 37.15 35.44 33.32Share Class C 11,970,264 35.09 33.38 31.28Share Class CH (USD) 1,243,558 31.63 29.67 27.01Share Class I 465,416 28.43 26.52 24.38Share Class IH (USD) 2,673,725 33.20 30.54 27.27Share Class Z 20,619,631 43.73 40.79 37.49Share Class ZH (GBP) 19,930 28.73 26.70 24.26Share Class ZH3 (BRL) 864,118 21.20 ***** 27.29 ***** 24.24Share Class ZH3 (COP) 21,590 28.72 **** 27.22 **** 24.25
Total net assets in EUR 3,999,535,885 4,751,593,874 4,997,778,326
Morgan Stanley Investment Funds – Global Balanced Sustainable Fund (10)
Share Class A* 4,000 25.46 – –Share Class B* 4,000 25.33 – –Share Class C* 4,000 25.40 – –Share Class I* 4,000 25.58 – –Share Class Z* 784,000 25.59 – –
Total net assets in EUR 20,468,873 – –
Morgan Stanley Investment Funds – Global Multi-Asset Income Fund
Share Class AHR (USD) 402 25.29 27.09 24.52Share Class AR 402 24.13 26.24 24.48Share Class IR 402 24.66 26.54 24.49Share Class Z 516,000 29.90 30.38 26.68
Total net assets in EUR 15,457,248 15,731,824 13,814,050
Morgan Stanley Investment Funds – Global Multi-Asset Opportunities Fund
Share Class A 167,803 18.85 20.19 20.60Share Class AH (USD) 852 21.10 22.25 22.05Share Class B 39,057 17.63 19.07 19.66Share Class C 17,081 17.93 19.34 19.89Share Class I 411 20.17 21.38 21.61Share Class Z 29,360 20.22 21.43 21.64Share Class ZH (CHF) 400 22.81 24.19 24.54Share Class ZH (GBP) 2,269,773 22.83 24.12 24.09Share Class ZH (USD) 81,834 24.46 25.52 –Share Class ZHX (GBP) 336 22.36 23.73 23.91
Total net assets in EUR 64,104,043 55,893,025 72,477,821
Morgan Stanley Investment Funds – Multi-Asset Risk Control Fund
Share Class A 4,000 25.80 25.59 –Share Class I 4,000 26.11 25.65 –Share Class Z 392,000 26.13 25.65 –
Total net assets in USD 10,448,904 10,260,921 –
(10) Fund commenced operations on 30 June 2020.* Share Class was launched during the year.**** Official Net Asset Value per Share is in USD.***** Official Net Asset Value per Share is in EUR.

Morgan Stanley Investment Funds 31 December 2020 418
Statement of share and net assets statistics (continued)For the year ended 31 December 2020
Shares outstanding as at Nav per share as at
31 December 2020 31 December 2020 31 December 2019 31 December 2018
Morgan Stanley Investment Funds – Real Assets Fund
Share Class A 2,061 26.91 26.88 –Share Class I 2,000 27.38 27.09 –Share Class Z 396,000 27.40 27.10 –
Total net assets in USD 10,959,915 10,839,754 –
Morgan Stanley Investment Funds – Liquid Alpha Capture Fund
Share Class A 400 26.87 24.73 22.73Share Class AH (EUR) 108,011 27.75 25.98 24.63Share Class BH (EUR) 176,183 25.95 24.54 23.49Share Class CH (EUR) 19,498 26.76 25.18 23.98Share Class I 400 27.45 25.05 22.83Share Class N 1,311,413 33.75 30.61 27.72
Total net assets in USD 54,269,982 69,519,232 61,917,352

419 Morgan Stanley Investment Funds 31 December 2020
1 ThE ComPany
Morgan Stanley Investment Funds (“The Company”) was incorporated on 21 November 1988 under the laws of the Grand Duchy of Luxembourg as a “Société d’Investissement à Capital Variable” (“SICAV”) and is registered as an undertaking for collective investment pursuant to Part 1 of the Law of 17 December 2010, as amended. The 2010 Law transposes the UCITS Directives (Directive 2009/65/EC as amended by Directive 2014/91/EU) into Luxembourg legislation.
The exclusive purpose of the Company is to invest the funds available to it in transferable securities and other assets permitted by law, with the purpose of spreading investment risks and affording its shareholders the results of the management of its assets. The Company is presently structured to provide both institutional and individual investors with a variety of Equity, Bond, Liquidity, Alternative and Asset Allocation Funds.
At the date of this report sixty-nine funds are open for subscription.
Fund name Date of launch
Asia Opportunity Fund 31 March 2016Asian Property Fund 1 July 1997China A-shares Fund 29 December 2017China Equity Fund 1 August 2019Counterpoint Global Fund 28 September 2018Developing Opportunity Fund 20 December 2019Emerging Europe, Middle East and Africa Equity Fund 16 October 2000Emerging Leaders Equity Fund 17 August 2012Emerging Markets Equity Fund 1 July 1993 Emerging Markets Small Cap Equity Fund 28 March 2013Europe Opportunity Fund 8 April 2016European Property Fund 1 September 1997Global Active Factor Equity Fund 12 July 2016Global Advantage Fund 31 January 2013Global Brands Fund 30 October 2000Global Brands Equity Income Fund 29 April 2016Global Endurance Fund 30 August 2019Global Infrastructure Fund 14 June 2010Global Infrastructure Unconstrained Fund 26 January 2018Global Opportunity Fund 30 November 2010Global Permanence Fund 30 August 2019Global Property Fund 31 October 2006Global Property Unconstrained Fund 17 November 2017Global Quality Fund 1 August 2013Global Sustain Fund 29 June 2018Indian Equity Fund 30 November 2006International Equity (ex US) Fund 18 November 2014Japanese Equity Fund 14 June 2010Latin American Equity Fund 2 August 1994Sustainable Asian Equity Fund 1 October 1991US Active Factor Equity Fund 5 July 2016US Advantage Fund 1 December 2005US Growth Fund 1 August 1992US Insight Fund 28 November 2014US Permanence Fund 30 October 2020US Property Fund 9 January 1996Emerging Markets Corporate Debt Fund 7 March 2011Emerging Markets Debt Fund 1 April 1995Emerging Markets Domestic Debt Fund 28 February 2007Emerging Markets Fixed Income Opportunities Fund 3 August 2015Euro Bond Fund 1 December 1998Euro Corporate Bond Fund 4 September 2001Euro Corporate Bond – Duration Hedged Fund 6 July 2018
Fund name Date of launch
Euro Strategic Bond Fund 1 February 1991European Fixed Income Opportunities Fund 30 September 2014European High Yield Bond Fund 1 December 1998Global Asset Backed Securities Fund 3 December 2012Global Bond Fund 1 November 1989Global Convertible Bond Fund 17 July 2002Global Credit Fund 14 November 2012Global Fixed Income Opportunities Fund 7 November 2011Global High Yield Bond Fund 18 November 2011Short Maturity Euro Bond Fund 1 August 1994Sustainable Euro Corporate Bond Fund 31 July 2020Sustainable Euro Strategic Bond Fund 31 July 2020US Dollar Corporate Bond Fund 20 May 2016US Dollar High Yield Bond Fund 2 December 2014US Dollar Short Duration Bond Fund 22 April 2016US Dollar Short Duration High Yield Bond Fund 4 December 2014Global Balanced Defensive Fund 23 August 2016Global Balanced Fund 16 August 2016Global Balanced Income Fund 31 July 2014Global Balanced Risk Control Fund of Funds 2 November 2011Global Balanced Sustainable Fund 30 June 2020Global Multi-Asset Income Fund 1 October 2015Global Multi-Asset Opportunities Fund 22 April 2014Multi-Asset Risk Control Fund 30 September 2019Real Assets Fund 1 March 2019Liquid Alpha Capture Fund 31 March 2014
The following significant changes were made in the year ended 31 December 2020:
Launched Classes
Fund name Share Class Date
Global Fixed Income Opportunities Fund NH (GBP) 23 January 2020Emerging Markets Fixed Income Opportunities Fund NH (GBP) 4 February 2020Asia Opportunity Fund S 7 February 2020Developing Opportunity Fund J 7 February 2020European Fixed Income Opportunities Fund N 12 February 2020Global Sustain Fund ZH (EUR) 12 March 2020Global Sustain Fund IH (EUR) 9 April 2020Emerging Markets Debt Fund IH (EUR) 24 April 2020Developing Opportunity Fund N 29 April 2020Global Sustain Fund ZH (CHF) 20 May 2020Global Sustain Fund ZH (GBP) 20 May 2020Global Brands Equity Income Fund ZHR (CHF) 22 May 2020Global Brands Equity Income Fund ZHR (GBP) 5 June 2020Global Opportunity Fund IH (EUR) 9 June 2020Global Brands Fund IHX (EUR) 11 June 2020European High Yield Bond Fund ZH (USD) 16 June 2020Global Opportunity Fund IH1 (AUD) 17 June 2020US Dollar Corporate Bond Fund N 18 June 2020US Dollar Corporate Bond Fund NH (EUR) 18 June 2020US Dollar Corporate Bond Fund ZH (EUR) 18 June 2020Asia Opportunity Fund JH (GBP) 24 June 2020Global Balanced Sustainable Fund A (EUR) 30 June 2020Global Balanced Sustainable Fund B (EUR) 30 June 2020Global Balanced Sustainable Fund C (EUR) 30 June 2020Global Balanced Sustainable Fund I (EUR) 30 June 2020Global Balanced Sustainable Fund Z (EUR) 30 June 2020Global Brands Fund IH (CHF) 3 July 2020Global Brands Fund IX 3 July 2020Global Brands Fund ZH3 (BRL) 6 July 2020US Dollar Short Duration High Yield Bond Fund ZM 31 July 2020Sustainable Euro Corporate Bond Fund A 31 July 2020Sustainable Euro Corporate Bond Fund I 31 July 2020Sustainable Euro Corporate Bond Fund Z 31 July 2020Sustainable Euro Strategic Bond Fund A 31 July 2020Sustainable Euro Strategic Bond Fund I 31 July 2020Sustainable Euro Strategic Bond Fund Z 31 July 2020
Notes to the financial statementsAs at 31 December 2020

Morgan Stanley Investment Funds 31 December 2020 420
Notes to the financial statements (continued)As at 31 December 2020
Fund name Share Class Date
Global Bond Fund N 3 August 2020Global Bond Fund NH (EUR) 3 August 2020Asia Opportunity Fund J (GBP) 4 August 2020Global Fixed Income Opportunities Fund AH (AUD) 26 August 2020European Fixed Income Opportunities Fund J 27 August 2020US Insight Fund I 1 September 2020US Advantage Fund ZH3 (BRL) 3 September 2020US Dollar High Yield Bond Fund CX 23 September 2020Emerging Leaders Equity Fund ZH3 (BRL) 30 September 2020US Permanence Fund Z 30 October 2020Europe Opportunity Fund N 23 November 2020Global Asset Backed Securities Fund ZHX (EUR) 2 December 2020Global Asset Backed Securities Fund ZX 3 December 2020
Closed Classes
Fund name Share Class Date
Eurozone Equity Alpha Fund A 20 April 2020Eurozone Equity Alpha Fund AH (USD) 20 April 2020Eurozone Equity Alpha Fund AR 20 April 2020Eurozone Equity Alpha Fund B 20 April 2020Eurozone Equity Alpha Fund BR 20 April 2020Eurozone Equity Alpha Fund C 20 April 2020Eurozone Equity Alpha Fund CR 20 April 2020Eurozone Equity Alpha Fund I 20 April 2020Eurozone Equity Alpha Fund IH (USD) 20 April 2020Eurozone Equity Alpha Fund Z 20 April 2020Global Convertible Bond Fund ZX 28 August 2020Indian Equity Fund N 9 October 2020Breakout Nations Fund A 16 October 2020Breakout Nations Fund AH (EUR) 16 October 2020Breakout Nations Fund B 16 October 2020Breakout Nations Fund BH (EUR) 16 October 2020Breakout Nations Fund C 16 October 2020Breakout Nations Fund CH (EUR) 16 October 2020Breakout Nations Fund Z 16 October 2020Global Buy and Hold 2020 Bond Fund A 9 November 2020Global Buy and Hold 2020 Bond Fund AR 9 November 2020Global Buy and Hold 2020 Bond Fund AX 9 November 2020Global Buy and Hold 2020 Bond Fund B 9 November 2020Global Buy and Hold 2020 Bond Fund BR 9 November 2020Global Buy and Hold 2020 Bond Fund BX 9 November 2020Global Buy and Hold 2020 Bond Fund I 9 November 2020Global Buy and Hold 2020 Bond Fund Z 9 November 2020
Launched Funds
• On30June2020,MorganStanleyInvestmentFunds–GlobalBalanced Sustainable Fund commenced operations.
• On 31 July 2020, Morgan Stanley Investment Funds –Sustainable Euro Corporate Bond Fund commenced operations.
• On 31 July 2020, Morgan Stanley Investment Funds –Sustainable Euro Strategic Bond Fund commenced operations.
• On 30 October 2020, Morgan Stanley Investment Funds –US Permanence Fund commenced operations.
Closed Funds
• On 16 October 2020, Morgan Stanley Investment Funds –Breakout Nations Fund closed. Outstanding cash balanceat custody at year end amounted to USD 4,870.
name Change
• On 20 April 2020, theMorgan Stanley Investment Funds –European Champions Fund changed its name to Morgan StanleyInvestmentFunds–EuropeOpportunityFund.
• On 15 May 2020, the Morgan Stanley Investment Funds –Global Counterpoint Fund changed its name to Morgan Stanley InvestmentFunds–CounterpointGlobalFund.
• On 31 December 2020, Morgan Stanley Investment Funds –Asian Equity Fund changed its name to Morgan Stanley InvestmentFunds–SustainableAsianEquityFund.
merger of Funds
• On 20 April 2020, Morgan Stanley Investment Funds –Eurozone Equity Alpha Fund merged into Morgan Stanley Investment Funds – European Champions Fund (renamed EuropeOpportunityFund).
merging Fund – Eurozone Equity
alpha Fund Share Class
merging Fund – Eurozone Equity
alpha Fund net asset value per share
Receiving Fund – Europe
opportunity Fund Share Class merger Ratio
A 10.85 A 0.348100329AH (USD) 34.91 AH (USD) 1.023198777
AR 21.50 AR 0.833523649B 8.89 B 0.300790762
BR 20.23 BR 0.792686448C 20.99 C 0.702025018
CR 20.48 CR 0.799831162I 12.39 I 0.384837813
IH (USD) 29.21 IH (USD) 1.072676920Z 39.19 Z 1.215041443
• On 9 November 2020, Morgan Stanley Investment Funds –Global Buy and Hold 2020 Bond Fund merged into Morgan Stanley Investment Funds – European Fixed IncomeOpportunitiesFund.
merging Fund – Global Buy
and hold 2020 Bond Fund
Share Class
merging Fund – Global Buy
and hold 2020 Bond Fund
net asset value per share
Receiving Fund – European Fixed Income
opportunities Fund Share Class merger Ratio
A 25.92 A 0.964848748 AR 21.94 AR 0.965647950 AX 24.42 AR 1.075147803 B 24.90 B 0.987662255
BR 21.91 BR 1.024565059 BX 24.35 BR 1.138684181
I 26.18 I 1.018570051 Z 26.23 Z 0.938251543
Significant event
• The global Coronavirus (COVID-19) pandemic continuesto create unprecedented economic and social uncertainty throughout the world. During the period, global financial markets exhibited high levels of volatility which gave rise to steep and fast declines in global asset values (from 21st February through 23rd March 2020). Following

421 Morgan Stanley Investment Funds 31 December 2020
Notes to the financial statements (continued)As at 31 December 2020
unprecedented commitments to fiscal and monetary stimulus by governments and central banks globally we witnessed a strong recovery in asset values in the months following. The emergence of second and third waves as well as new variants of the virus added further to market volatility through the remainder of the year. News of the development and roll out of vaccines towards the end of the year gave rise to further volatility and a rotation towards those sectors which had been worst affected in the March sell off. Whilst the ultimate impact of the pandemic is difficult to predict, we have experienced increased market volatility and economic uncertainties, which may materially affect the valuation of portfolio investments and in turn, the net asset values of the Funds. The long-term impact of this is currently unpredictable.
2 SIGnIFICanT aCCoUnTInG PoLICIES
The financial statements are presented in accordance with generally accepted accounting principles applicable to UCITS investment funds in Luxembourg and require management to make estimates and assumptions that affect the amounts reported in the financial statements and accompanying notes. Actual results could differ from those estimates.
a) Valuation of securities
Securities listed on a recognised stock exchange or dealt in on any other regulated market are valued at their last available prices at the valuation point, or, in the event that there should be several such markets, on the basis of their last available prices on the main market for the relevant security.
In normal market conditions, fixed income securities (including mortgage and asset backed securities) are valued at mid market price at the valuation point, based on data provided by pricing vendors.
In the event that the last available price or mid market price (fixed income) does not truly reflect the fair market value of the relevant securities, the value of such securities will be based on the reasonably foreseeable sales price determined prudently and in good faith pursuant to procedures established by the Board of Directors of the Company.
Securities not listed or traded on a stock exchange or not dealt on another regulated market are valued on the basis of the reasonably foreseeable sales price determined prudently and in good faith pursuant to procedures established by the Board of Directors of the Company.
Investments in other Undertakings for Collective Investments (“UCIs”) are valued at the last available net asset value for the UCI in question, excluding redemption fees if any.
Events may occur between the determination of an investment’s last available price and the determination of the Fund’s Net Asset Value per Share at the valuation point that may, in the
opinion of the Board of Directors of the Company, mean that the last available price does not reflect the fair market value of the investment. In such circumstances the price of such investment shall be adjusted in accordance with the procedures adopted from time to time by the Board of Directors of the Company in their discretion. As at the date of this annual report, certain securities may be fair valued in accordance with these procedures.
If since the time of determination of the net asset value there has been a material change in the quotations in the markets on which a substantial portion of the investments attributable to an available Fund are dealt in or quoted, the Company may, in order to safeguard the interests of the shareholders and the Company, cancel the first valuation and carry out further valuations as appropriate.
b) Valuation of Interest rate swaps
An Interest Rate Swap (“IRS”) is a bilateral agreement in which each of the parties agree to exchange a series of interest payments (usually fixed/floating) based on a notional amount that serves as a computation basis and that is usually not exchanged.
IRS contracts are valued by reference to service data providers, market data and algorithms.
The unrealised gain/loss as at year end is recorded under “Unrealised gain/loss on interest rate swap contracts” in the Statement of assets and liabilities. The changes in such amounts are recorded under “Net change in unrealised appreciation/(depreciation) on interest rate swaps” and the realised gain/loss under “Net realised gain/(loss) on interest rate swaps” in the Statement of operations and changes in net assets.
c) Inflation rate swaps
An inflation rate swap is a bilateral agreement in which each of the parties agree to exchange fixed rate payments for floating, inflation index linked payments based on a notional amount that serves as a computation basis.
The unrealised gain/loss as at year end is recorded under “Unrealised gain/loss on inflation rate swap contracts” in the Statement of assets and liabilities. The changes in such amounts are recorded under “Net change in unrealised appreciation/(depreciation) on inflation rate swaps” and the realised gain/loss under “Net realised gain/(loss) on inflation rate swaps” in the Statement of operations and changes in net assets.
d) Valuation of Credit default swaps
A Credit Default Swap (“CDS”) is a transaction in which two parties enter into an agreement, whereby the buyer pays the seller a periodic payment for the specified life of the agreement. The seller makes no payments unless a credit event, relating to a predetermined reference asset, occurs. If such an event does occur, the seller will then make a payment to the buyer, and the swap contract will terminate.

Morgan Stanley Investment Funds 31 December 2020 422
Notes to the financial statements (continued)As at 31 December 2020
CDS contracts are valued by reference to service data providers, market data and algorithms.
The unrealised gain/loss as at year end is recorded under “Unrealised gain/loss on credit default swap contracts” in the Statement of assets and liabilities. The changes in such amounts are recorded under “Net change in unrealised appreciation/(depreciation) on credit default swaps” and the realised gain/loss under “Net realised gain/(loss) on credit default swaps” in the Statement of operations and changes in net assets.
The notional amount represents the highest potential liability of a contract and is not shown in the Statement of assets and liabilities.
e) Valuation of Total return swaps
A Total Return Swap (“TRS”) is a transaction in which the buyer receives the performance of an underlying asset and in return the buyer pays funding costs and generally, an arrangement fee. The underlying asset may be, but not limited to, a specific security, basket of securities, other instruments or an index.
TRS contracts are valued by reference to the mark to market value based on the market value of the underlying asset.
The unrealised gain/loss as at year end is recorded under “Unrealised gain/loss on total return swap contracts” in the Statement of assets and liabilities. The changes in such amounts are recorded under “Net change in unrealised appreciation/(depreciation) on total return swaps” and the realised gain/loss under “Net realised gain/(loss) on total return swaps” in the Statement of operations and changes in net assets.
f ) Valuation of options
Optionsarecontractualagreementsthatconveytheright,butnot the obligation, for the purchaser either to buy or sell a specific amount of a financial instrument at a fixed price, either at a fixed future date or at any time within a specified period.
Optionsarevaluedbyreferencetotheexpectedfuturecashflowbased on the market implied performance, spot level and the volatility of the underlying asset(s).
In determining the accounting treatment for options, consideration is given to the nature of the instrument itself and the Fund’s Investment objective. When the underlying is acquired or delivered upon exercise of an option, the acquisition cost or sale proceeds are adjusted by the amount of the premium paid. When an option is closed, the difference between the premium and the cost to close the position is recorded under “Net realised gain/(loss) on options contracts” in the Statement of operations and changes in net assets. When an option expires, the premium is accounted for as a realised gain for options written or as a realised loss for options purchased.
For the Global Balanced Income Fund, Global Conservative Bond Fund and Global Multi-Asset Income Fund, the premium received on written listed and OTC options is recordedas income. When an option is closed, the cost to close the position is recorded under “Net realised gain/(loss) on options contracts” in the Statement of operations and changes in net assets.
The market value of options purchased at market value / options written at market value is recorded in the Statement of assets and liabilities. The changes in unrealised gain/(loss) on options are recorded under “Net change in unrealised appreciation/(depreciation) on options contracts” in the Statement of operations and changes in net assets.
g) Valuation of Forward currency exchange contracts
A forward currency exchange contract is an agreement between two parties to exchange one currency for another at a specific price and date in the future.
All currency exchange contracts with maturity date greater than 2 business days from their trade dates are classified as Forward currency exchange contract in line with MIFID II classification rule.
Open forward contracts are valued by reference to the lastavailable currency rates prevailing at the relevant valuation point.
The unrealised gain/loss as at year end is recorded under “Unrealised gain/loss on forward currency exchange contracts” in the Statement of assets and liabilities. The changes in such amounts are recorded under “Net change in unrealised appreciation/(depreciation) on forward currency exchange contracts” and the realised gain/loss under “Net realised gain/(loss) on forward currency exchange contracts” in the Statement of operations and changes in net assets.
h) Valuation of Financial futures contracts
A financial futures contract is a contractual agreement, to buy or sell a particular commodity or financial instrument at a pre-determined price in the future. Financial futures contracts detail the quality and quantity of the underlying asset and they are standardised to facilitate trading on a futures exchange.
Futures contracts are valued at the last available prices, on the exchanges for which the contracts are traded on, as at the valuation point.
The unrealised gain/loss as at year end is recorded under “Unrealised gain/loss on financial futures contracts” in the Statement of assets and liabilities. The changes in such amounts are recorded under “Net change in unrealised appreciation/(depreciation) on financial futures contracts” and the realised gain/loss under “Net realised gain/(loss) on financial futures contracts” in the Statement of operations and changes in net assets.

423 Morgan Stanley Investment Funds 31 December 2020
Notes to the financial statements (continued)As at 31 December 2020
At the time the Fund enters into a financial futures contract the Fund deposits and maintains with the broker as collateral an initial margin as required by the exchange on which the transaction is affected. Cash collateral paid/received to the broker as of 31 December 2020 is recorded as part of “Cash at bank and at brokers” and “Bank overdraft and due to broker” in the Statement of assets and liabilities. Pursuant to the contract, the Fund agrees to receive from or pay to the broker an amount of cash equal to the daily fluctuation in the value of the contract. Such receipts or payments are known as the variation margin and are recorded by the Fund as unrealised appreciation/(depreciation) on financial futures contracts. When the contract is closed, the Fund records a “Net realised gain/(loss) on financial futures contracts” equal to the difference between the value of the contract at the time it was opened and the time it is closed.
i) Income and securities transactions
Dividend income is recorded on the ex-dividend date. Interest income is accrued daily. For short term money market instruments the discount/premium is accreted/amortised on a daily basis until maturity or the sale of the instrument. Income from securities lending is recorded on a cash receipts basis. Income is recorded net of withholding tax.
Securities transactions are accounted for on a trade date basis, on the date the securities are purchased or sold. Realised gains or losses on the sale of securities are determined on the basis of the average cost method and are recorded under “Net realised gain/(loss) on sales of investments” in the Statement of operations and changes in net assets.
For the Global Asset Backed Securities Fund realised gains and losses on the sale of interest only mortgaged-backed securities are determined on a First In First Out (FIFO) basis of costmethod and are recorded under “Net realised gain/(loss) on sales of investments” in the Statement of operations and changes in net assets.
j) Valuation of Repurchase agreements
Under a repurchase agreement, the Company purchases securities and agrees to re-sell them at a mutually agreed upon date and price. A repurchase agreement is collateralised by securities. Repurchase agreements are valued at cost with interest accrued from the date of purchase.
Repurchase agreements outstanding as at year end, if any, are included in the Statement of assets and liabilities. Net repurchase agreements income is included under “Bank interest” in the Statement of operations and changes in net assets.
k) Translation of foreign currencies
Transactions in foreign currencies are translated into the currency of each Fund at the last available rate of exchange prevailing in a recognised market at the date of the transactions.
Assets and liabilities denominated in foreign currencies are translated into the currency of each Fund at the last available rate of exchange prevailing in a recognised market at the date of the Statement of assets and liabilities.
The Combined statement of assets and liabilities is presented in US Dollars at the last available rate of exchange prevailing in a recognised market at the date of the Statement of assets and liabilities, while the combined Statement of operations and changes in net assets is presented in US Dollars at the average exchange rates ruling during the year.
The difference between opening net assets stated at exchange rates at the beginning of the year and their value at the end of the year is shown as “Translation difference” in the Statement of operations and changes in net assets.
The impact of translating the Statement of operations and changes in net assets at average exchange rates is included within the “Translation difference” in the Statement of operations and changes in net assets.
3 SECURITIES LEnDInG
Certain Funds may lend securities to qualified financial institutions, such as broker-dealers, to earn additional income. Any increase or decrease in the fair value of the securities loaned that might occur and any interest earned or dividends declared on those securities during the term of the loan would remain in the Fund. Funds that lend securities, receive securities as collateral in an amount equal to or exceeding 100% of the current fair value of the loaned securities. The collateral is marked to market daily, by the securities lending agent, to ensure that a minimum of 100% collateral coverage is maintained throughout the term of the loan. Securities lending income is generated as a result of securities on loan less compensation to the administrative agent. Net securities lending income is included in the Statement of operations and changes in net assets. See note 4(c) for related party disclosure on securities lending transactions, and “Appendix 8: Securities Financing Transactions” for further information on securities lending transactions.
The value of loaned securities, related collateral outstanding, identity of the counterparties, security lending income and associated operational costs and fees for the year ended 31 December 2020 are as follows:
FundFund
currency Counterparty
market value of securities
on loan in Fund currency
non cash collateral
in Fund currency
Total collateral
in Fund currency
Asian Property Fund USD Citigroup 1,134,448 1,198,141 1,198,141Asian Property Fund USD Credit Suisse Securities (Europe) 185,346 195,879 195,879Asian Property Fund USD Goldman Sachs 426,597 449,557 449,557Asian Property Fund USD Merrill Lynch 3,688,982 3,887,995 3,887,995Asian Property Fund USD UBS 4,270,663 4,520,050 4,520,050Counterpoint Global Fund USD Citigroup 22,584 23,860 23,860Counterpoint Global Fund USD Hoop 166,726 175,774 175,774

Morgan Stanley Investment Funds 31 December 2020 424
Notes to the financial statements (continued)As at 31 December 2020
FundFund
currency Counterparty
market value of securities
on loan in Fund currency
non cash collateral
in Fund currency
Total collateral
in Fund currency
Counterpoint Global Fund USD Macquarie 93 98 98Counterpoint Global Fund USD Merrill Lynch 21,256 22,401 22,401Counterpoint Global Fund USD UBS 151,371 160,226 160,226Emerging Markets Equity Fund USD HSBC 309,327 325,746 325,746Emerging Markets Equity Fund USD J.P. Morgan 796,234 844,550 844,550Emerging Markets Equity Fund USD Merrill Lynch 984,879 1,038,012 1,038,012Emerging Markets Equity Fund USD UBS 10,896,775 11,612,458 11,612,458Emerging Markets Small Cap Equity Fund USD Citigroup 141,084 149,050 149,050Emerging Markets Small Cap Equity Fund USD UBS 271,228 287,067 287,067European Property Fund EUR Credit Suisse Securities (Europe) 13,604 14,378 14,378European Property Fund EUR J.P. Morgan 10,027 10,635 10,635European Property Fund EUR Merrill Lynch 1,779,275 1,875,264 1,875,264European Property Fund EUR Morgan Stanley & Co. International 1,033,436 1,092,475 1,092,475European Property Fund EUR UBS 87,269 93,155 93,155Global Infrastructure Fund USD Citigroup 130,443 137,453 137,453Global Infrastructure Fund USD Credit Suisse Securities (Europe) 6,392,565 6,754,263 6,754,263Global Infrastructure Fund USD Deutsche Bank 5,553,493 5,937,970 5,937,970Global Infrastructure Fund USD UBS 10,720,186 11,346,195 11,346,195Global Opportunity Fund USD Credit Suisse Securities (Europe) 925,277 974,476 974,476Global Opportunity Fund USD Hoop 4,345,146 4,580,933 4,580,933Global Opportunity Fund USD Morgan Stanley & Co. International 1,092,531 1,154,947 1,154,947Global Property Fund USD Citigroup 894,192 942,241 942,241Global Property Fund USD Credit Suisse Securities (Europe) 7,527,774 7,955,607 7,955,607Global Property Fund USD Deutsche Bank 192,293 203,653 203,653Global Property Fund USD Goldman Sachs 10,525,088 11,091,557 11,091,557Global Property Fund USD Merrill Lynch 9,602,241 10,120,263 10,120,263Global Property Fund USD UBS 10,042,222 10,628,642 10,628,642Sustainable Asian Equity Fund USD HSBC 139,055 146,437 146,437Sustainable Asian Equity Fund USD J.P. Morgan 189,943 201,468 201,468Sustainable Asian Equity Fund USD UBS 139,054 147,175 147,175US Advantage Fund USD Credit Suisse Securities (Europe) 49,840,926 52,491,048 52,491,048US Advantage Fund USD UBS 40,070,394 42,410,321 42,410,321US Growth Fund USD Credit Suisse Securities (Europe) 143,799,954 151,435,629 151,435,629US Growth Fund USD Hoop 9,839,864 10,373,821 10,373,821US Growth Fund USD UBS 74,557,159 79,393,726 79,393,726US Insight Fund USD Hoop 7,010 7,390 7,390US Insight Fund USD UBS 3,688,317 3,903,698 3,903,698Emerging Markets Corporate Debt Fund USD Barclays 153,310,731 164,558,155 164,558,155Emerging Markets Debt Fund USD Barclays 44,023,121 46,924,398 46,924,398Emerging Markets Domestic Debt Fund USD Barclays 16,529,798 18,224,876 18,224,876Euro Bond Fund EUR Barclays 53,774,391 55,725,133 55,725,133Euro Corporate Bond Fund EUR Barclays 489,459,331 507,215,166 507,215,166Euro Strategic Bond Fund EUR Barclays 37,457,221 38,609,914 38,609,914Euro Strategic Bond Fund EUR Citigroup 52,710,441 53,738,744 53,738,744Euro Strategic Bond Fund EUR Credit Suisse Securities (Europe) 668,040 690,004 690,004Euro Strategic Bond Fund EUR HSBC 13,516,733 13,799,997 13,799,997Euro Strategic Bond Fund EUR J.P. Morgan 45,583,194 47,835,623 47,835,623Euro Strategic Bond Fund EUR Merrill Lynch 5,895,431 6,095,616 6,095,616European High Yield Bond Fund EUR Barclays 186,722,972 193,743,271 193,743,271Global Bond Fund USD Barclays 55,546,449 58,746,710 58,746,710Global Convertible Bond Fund USD Credit Suisse Securities (Europe) 7,812,887 8,144,004 8,144,004Global Convertible Bond Fund USD Goldman Sachs 6,890,994 7,261,873 7,261,873Global Convertible Bond Fund USD J.P. Morgan 14,648,561 15,537,436 15,537,436Global Convertible Bond Fund USD Nomura 302,234 310,435 310,435Global Fixed Income Opportunities Fund USD Barclays 143,515,885 151,884,558 151,884,558Short Maturity Euro Bond Fund EUR Barclays 58,331,058 60,447,101 60,447,101
FundFund
currency
Lending income (gross)
in Fund currency
Lending agent fees
in Fund currency
Lending income (net)
in Fund currency
Counterpoint Global Fund USD 765 115 650Emerging Markets Equity Fund USD 141,429 21,214 120,215Emerging Markets Small Cap Equity Fund USD 6,654 998 5,656European Property Fund EUR 25,900 3,885 22,015Eurozone Equity Alpha Fund EUR 17,801 2,670 15,131Global Infrastructure Fund USD 438,766 65,815 372,951Global Opportunity Fund USD 235,515 35,327 200,188
FundFund
currency
Lending income (gross)
in Fund currency
Lending agent fees
in Fund currency
Lending income (net)
in Fund currency
Latin American Equity Fund USD 4,120 618 3,502Sustainable Asian Equity Fund USD 6,292 944 5,348US Advantage Fund USD 3,081,866 462,280 2,619,586US Growth Fund USD 223,516 33,527 189,989Emerging Markets Corporate Debt Fund USD 633,104 94,966 538,138Emerging Markets Debt Fund USD 20,256 3,038 17,218Euro Bond Fund EUR 123,205 18,481 104,724Euro Corporate Bond Fund EUR 916,834 137,525 779,309Euro Corporate Bond – Duration Hedged Fund EUR 44,968 6,745 38,223Euro Strategic Bond Fund EUR 255,285 38,293 216,992European High Yield Bond Fund EUR 1,066,752 160,013 906,739Global Bond Fund USD 74,200 11,130 63,070Global Convertible Bond Fund USD 150,633 22,595 128,038Global Fixed Income Opportunities Fund USD 453,042 67,956 385,086Short Maturity Euro Bond Fund EUR 140,446 21,067 119,379
4 RELaTED PaRTy TRanSaCTIonS anD aFFILIaTIonS
The Company has delegated to the Management Company MSIM Fund Management (Ireland) Limited under the overall supervision and control of the Board of Directors of the Company, its investment management services, central administration, registrar and transfer agency services as well as marketing, principal distribution and sales services, as more specifically detailed in the management company services agreement as well as in the prospectus of the Company.
MSIM Fund Management (Ireland) Limited is regulated by the Central Bank of Ireland to provide these services. The Management Company may delegate some of its tasks to other parties, as detailed below, subject to approval by the Company. The Management Company’s liability to the Company for the performance of collective portfolio management and other delegated services has not been affected by such delegation.
The Management Company in turn delegates the investment management functions to Morgan Stanley Investment Management Limited known as the “Investment Adviser”.
Under the terms of an investment advisory agreement, Morgan Stanley Investment Management Limited has been appointed as Investment Adviser with responsibility for providing discretionary asset management and investment advisory services to the Management company, such services to be provided in relation to all Funds. The Investment Adviser may delegate any of its responsibilities to any other party subject to approval by the Board of Directors of the Company and the CSSF but the Investment Adviser shall remain responsible for the proper performance by such party of those responsibilities. A full list of sub-advisers can be found on pages 447 to 448.
Under the terms of the Management Company Services Agreement the Management Company is entitled to receive a Management Fee at the annual rates set out below. Under the Investment Advisory Agreements the Investment Advisers are entitled to receive a fee for their discretionary investment management and investment advisory services. Under the

425 Morgan Stanley Investment Funds 31 December 2020
Notes to the financial statements (continued)As at 31 December 2020
Fund name
Share Class Indicators:
a and B
Share Class Indicator:
C
Share Class Indicators: F, I and Z
Share Class Indicator:
J
Share Class Indicator:
S
US Dollar Short Duration Bond Fund 13 0.50% 0.70% 0.20% N/A 0.20%US Dollar Short Duration High Yield Bond Fund 1.00% 1.30% 0.40% 0.20% 0.40%Global Balanced Defensive Fund 1.00% 1.70% 0.40% N/A 0.40%Global Balanced Fund 1.50% 2.20% 0.60% N/A 0.60%Global Balanced Income Fund 1.50% 2.20% 0.60% N/A 0.60%Global Balanced Risk Control Fund of Funds 2.00% 2.70% 0.80% N/A 0.80%Global Balanced Sustainable Fund 14 1.50% 2.00% 0.60% 0.35% 0.60%Global Multi-Asset Income Fund 1.75% 2.45% 0.75% N/A 0.75%Global Multi-Asset Opportunities Fund 15 1.65% 2.40% 0.70% N/A 0.70%Multi-Asset Risk Control Fund 1.50% 2.00% 0.60% 0.35% 0.60%Real Assets Fund 1.50% 2.00% 0.60% N/A 0.60%Liquid Alpha Capture Fund 1.35% 1.85% 0.55% 0.35% 0.55%
1 Asia Opportunity Fund Class S has reduced its Management Fee to 0.69%. 2 Formerly known as Global Counterpoint Fund prior to 15 May 2020. 3 Emerging Markets Equity Fund Class Z has reduced its Management Fee to 0.75%. 4 Formerly known as European Champions Fund prior to 20 April 2020. 5 Formerly known as Asian Equity Fund prior to 31 December 2020. 6 Fund commenced operations on 30 October 2020. US Permanence Fund Class A and B has reduced their Management Fee to 1.40%,
Class C reduced their Management Fee to 2.20%, Class F, I, Z and S reduced their Management Fee to 0.70%. 7 Euro Bond Fund Class Z and ZX has reduced their Management Fee to 0.25%. 8 Euro Corporate Bond Fund Class F has reduced its Management Fee to 0.10% and Class S has reduced its Management Fee to 0.23%. 9 Global Asset Backed Securities Fund Class F has reduced its Management Fee to 0.35%.10 Short Maturity Euro Bond Fund Class Z has reduced its Management Fee to 0.17%.11 Fund commenced operations on 31 July 2020.12 Fund commenced operations on 31 July 2020.13 US Dollar Short Duration Bond Fund Class A has reduced its Management Fee to 0.40% and Class I, S and Z has reduced their Management
Fee to 0.10%.14 Fund commenced operations on 30 June 2020.15 Global Multi Asset Opportunities Fund Class A and B has reduced their Management Fee to 1.30%, Class C has reduced its Management Fee
to 2.05% and Class I and Z has reduced to 0.35%.
No Management Fee is payable in respect of Share Class Indicator N Shares.
In the case of any individual Fund or Class, the Management Company, the Investment Adviser(s) or/and Distributors may choose to waive or rebate all of their fees and charges or any portion thereof at their absolute discretion for an indefinite period, in order to reduce the impact such fee may have on the performance of the Fund or Class for instance where the net assets of the Fund or Class are of insufficient size.
Where the Funds invest into underlying investment funds that are managed by the Investment Adviser or its affiliates, the fees and charges of the underlying investment funds are rebated to the Funds to avoid duplicated Management Fees otherwise known as“doubledipping”,withtherebatebeingincludedwithinOtherincome in the Statement of operations and changes in net assets.
The Funds are subject to the following:
i) Management Fee at the levels described above. The Management Fee covers the fees of the principal distributor and the Investment Adviser.
ii) A monthly Administration Charge payable to the Management Company at a maximum annual rate of 0.25% of the Funds’ aggregate average daily Net Asset Value attributable to all Classes of Shares of the Funds. The current fees are as follows:
Share Class Indicator administration Charge
A, B, C and F 0.19%I, J and Z 0.14%S 0.10%N 0.10%
Distribution Agreement the Distributor is entitled to receive a fee for its distribution services. The fees of the Investment Adviser and the Distributor will be paid out of the Management Fee (except for distribution fees paid on class B as described in sub-section iv on page 426).
The annual Management Fee rates being charged as of 31 December 2020 are as follows and are as disclosed within the prospectus of the Company unless footnoted otherwise:
Fund name
Share Class Indicators:
a and B
Share Class Indicator:
C
Share Class Indicators: F, I and Z
Share Class Indicator:
J
Share Class Indicator:
S
Asia Opportunity Fund 1 1.60% 2.40% 0.75% 0.65% 0.75%Asian Property Fund 1.40% 2.20% 0.75% N/A 0.75%China A-shares Fund 1.70% 2.40% 0.70% 0.55% 0.70%China Equity Fund 1.70% 2.40% 0.70% 0.50% 0.70%Counterpoint Global Fund 2 1.60% 2.40% 0.80% 0.60% 0.80%Developing Opportunity Fund 2.00% 2.65% 0.80% 0.60% 0.80%Emerging Europe, Middle East and Africa Equity Fund 1.60% 2.40% 1.10% N/A 1.10%Emerging Leaders Equity Fund 1.90% 2.60% 0.75% N/A 0.75%Emerging Markets Equity Fund 3 1.60% 2.40% 1.10% N/A 1.10%Emerging Markets Small Cap Equity Fund 2.40% 3.00% 1.20% N/A 1.20%Europe Opportunity Fund 4 1.50% 2.20% 0.75% 0.40% 0.75%European Property Fund 1.40% 2.20% 0.75% N/A 0.75%Global Active Factor Equity Fund 1.35% 1.80% 0.55% N/A 0.55%Global Advantage Fund 1.60% 2.40% 0.75% N/A 0.75%Global Brands Fund 1.40% 2.20% 0.75% N/A 0.75%Global Brands Equity Income Fund 1.75% 2.50% 0.85% 0.55% 0.85%Global Endurance Fund 1.60% 2.40% 0.75% N/A N/AGlobal Infrastructure Fund 1.50% 2.30% 0.85% N/A 0.85%Global Infrastructure Unconstrained Fund 1.50% 2.30% 0.75% 0.50% 0.75%Global Opportunity Fund 1.60% 2.40% 0.75% N/A 0.75%Global Permanence Fund 1.60% 2.40% 0.75% N/A N/AGlobal Property Fund 1.50% 2.30% 0.85% N/A 0.85%Global Property Unconstrained Fund 1.50% 2.30% 0.75% N/A 0.75%Global Quality Fund 1.60% 2.40% 0.75% N/A 0.75%Global Sustain Fund 1.50% 2.30% 0.65% 0.50% 0.65%Indian Equity Fund 1.60% 2.40% 0.75% N/A 0.75%International Equity (ex US) Fund 1.60% 2.40% 0.75% N/A 0.75%Japanese Equity Fund 1.40% 2.20% 0.75% N/A 0.75%Latin American Equity Fund 1.60% 2.40% 1.00% 0.35% 1.00%Sustainable Asian Equity Fund 5 1.40% 2.20% 0.75% N/A 0.75%US Active Factor Equity Fund 1.10% 1.50% 0.45% N/A 0.45%US Advantage Fund 1.40% 2.20% 0.70% N/A 0.70%US Growth Fund 1.40% 2.20% 0.70% N/A 0.70%US Insight Fund 1.50% 2.20% 0.70% N/A 0.70%US Permanence Fund 6 1.40% 2.20% 0.70% N/A N/AUS Property Fund 1.40% 2.20% 0.75% N/A 0.75%Emerging Markets Corporate Debt Fund 1.45% 2.15% 0.75% N/A 0.75%Emerging Markets Debt Fund 1.40% 2.10% 0.65% N/A 0.60%Emerging Markets Domestic Debt Fund 1.40% 2.10% 0.65% N/A 0.65%Emerging Markets Fixed Income Opportunities Fund 1.40% 1.90% 0.70% 0.35% 0.70%Euro Bond Fund 7 0.80% 1.45% 0.45% N/A 0.45%Euro Corporate Bond Fund 8 0.80% 1.45% 0.45% N/A 0.40%Euro Corporate Bond – Duration Hedged Fund 0.80% 1.45% 0.45% N/A 0.40%Euro Strategic Bond Fund 0.80% 1.45% 0.45% N/A 0.40%European Fixed Income Opportunities Fund 1.00% 1.45% 0.45% 0.25% 0.45%European High Yield Bond Fund 0.85% 1.50% 0.50% N/A 0.50%Global Asset Backed Securities Fund 9 1.00% 1.60% 0.50% N/A 0.50%Global Bond Fund 0.80% 1.45% 0.45% N/A 0.45%Global Convertible Bond Fund 1.00% 1.60% 0.60% N/A 0.55%Global Credit Fund 0.80% 1.45% 0.45% N/A 0.45%Global Fixed Income Opportunities Fund 1.00% 1.45% 0.45% N/A 0.45%Global High Yield Bond Fund 1.00% 1.60% 0.60% N/A 0.60%Short Maturity Euro Bond Fund 10 0.80% 1.45% 0.45% N/A 0.45%Sustainable Euro Corporate Bond Fund 11 1.15% 1.50% 0.45% 0.20% 0.45%Sustainable Euro Strategic Bond Fund 12 1.15% 1.50% 0.45% 0.20% 0.45%US Dollar Corporate Bond Fund 0.80% 1.35% 0.35% 0.20% 0.35%US Dollar High Yield Bond Fund 1.25% 1.70% 0.50% 0.25% 0.50%
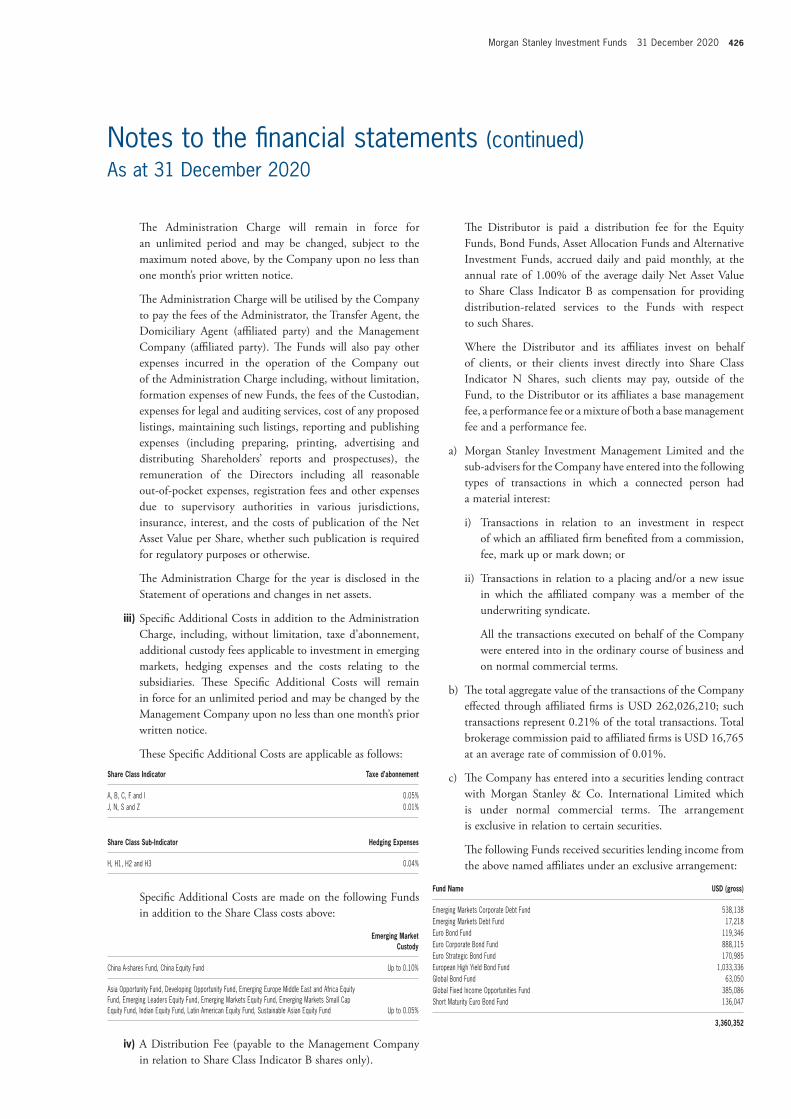
Morgan Stanley Investment Funds 31 December 2020 426
Notes to the financial statements (continued)As at 31 December 2020
The Distributor is paid a distribution fee for the Equity Funds, Bond Funds, Asset Allocation Funds and Alternative Investment Funds, accrued daily and paid monthly, at the annual rate of 1.00% of the average daily Net Asset Value to Share Class Indicator B as compensation for providing distribution-related services to the Funds with respect to such Shares.
Where the Distributor and its affiliates invest on behalf of clients, or their clients invest directly into Share Class Indicator N Shares, such clients may pay, outside of the Fund, to the Distributor or its affiliates a base management fee, a performance fee or a mixture of both a base management fee and a performance fee.
a) Morgan Stanley Investment Management Limited and the sub-advisers for the Company have entered into the following types of transactions in which a connected person had a material interest:
i) Transactions in relation to an investment in respect of which an affiliated firm benefited from a commission, fee, mark up or mark down; or
ii) Transactions in relation to a placing and/or a new issue in which the affiliated company was a member of the underwriting syndicate.
All the transactions executed on behalf of the Company were entered into in the ordinary course of business and on normal commercial terms.
b) The total aggregate value of the transactions of the Company effected through affiliated firms is USD 262,026,210; such transactions represent 0.21% of the total transactions. Total brokerage commission paid to affiliated firms is USD 16,765 at an average rate of commission of 0.01%.
c) The Company has entered into a securities lending contract with Morgan Stanley & Co. International Limited which is under normal commercial terms. The arrangement is exclusive in relation to certain securities.
The following Funds received securities lending income from the above named affiliates under an exclusive arrangement:
Fund name USD (gross)
Emerging Markets Corporate Debt Fund 538,138Emerging Markets Debt Fund 17,218Euro Bond Fund 119,346Euro Corporate Bond Fund 888,115Euro Strategic Bond Fund 170,985European High Yield Bond Fund 1,033,336Global Bond Fund 63,050Global Fixed Income Opportunities Fund 385,086Short Maturity Euro Bond Fund 136,047
3,360,352
The Administration Charge will remain in force for an unlimited period and may be changed, subject to the maximum noted above, by the Company upon no less than one month’s prior written notice.
The Administration Charge will be utilised by the Company to pay the fees of the Administrator, the Transfer Agent, the Domiciliary Agent (affiliated party) and the Management Company (affiliated party). The Funds will also pay other expenses incurred in the operation of the Company out of the Administration Charge including, without limitation, formation expenses of new Funds, the fees of the Custodian, expenses for legal and auditing services, cost of any proposed listings, maintaining such listings, reporting and publishing expenses (including preparing, printing, advertising and distributing Shareholders’ reports and prospectuses), the remuneration of the Directors including all reasonable out-of-pocket expenses, registration fees and other expenses due to supervisory authorities in various jurisdictions, insurance, interest, and the costs of publication of the Net Asset Value per Share, whether such publication is required for regulatory purposes or otherwise.
The Administration Charge for the year is disclosed in the Statement of operations and changes in net assets.
iii) Specific Additional Costs in addition to the Administration Charge, including, without limitation, taxe d’abonnement, additional custody fees applicable to investment in emerging markets, hedging expenses and the costs relating to the subsidiaries. These Specific Additional Costs will remain in force for an unlimited period and may be changed by the Management Company upon no less than one month’s prior written notice.
These Specific Additional Costs are applicable as follows:
Share Class Indicator Taxe d’abonnement
A, B, C, F and I 0.05%J, N, S and Z 0.01%
Share Class Sub-Indicator hedging Expenses
H, H1, H2 and H3 0.04%
Specific Additional Costs are made on the following Funds in addition to the Share Class costs above:
Emerging market
Custody
China A-shares Fund, China Equity Fund Up to 0.10%
Asia Opportunity Fund, Developing Opportunity Fund, Emerging Europe Middle East and Africa Equity Fund, Emerging Leaders Equity Fund, Emerging Markets Equity Fund, Emerging Markets Small Cap Equity Fund, Indian Equity Fund, Latin American Equity Fund, Sustainable Asian Equity Fund Up to 0.05%
iv) A Distribution Fee (payable to the Management Company in relation to Share Class Indicator B shares only).

427 Morgan Stanley Investment Funds 31 December 2020
Notes to the financial statements (continued)As at 31 December 2020
For Global Brands Equity Income Fund, net investment income is considered to include income earned through receipt of premiums by taking exposure via one or more swaps to written options on equity securities and /or to indices for the purpose of the dividend policy.
Discretionary Distributing Share Classes (Share Class Sub‑Indicators “R” and “RM”)
For the Discretionary Distributing Share Classes of the Bond Funds, Equity Funds, Asset Allocation Funds and Alternative Investment Funds, the Company intends to declare dividends which will be set at the discretion of the Board of Directors of the Company. The Discretionary Distributing Share Class may pay distributions from capital or may charge all or part of the Fund’s fees and expenses to the capital of the Fund. Dividends paid out of capital amount to a return or withdrawal of part of a Shareholder’s original investment or from any capital gains attributable to that original investment. Such dividends may result in an immediate decrease of the Net Asset Value per Share. Where part or all of the fees and expenses of a Share Class are charged to the capital of that Share Class the result will be a reduction of the capital that the Share Class has available for investment in the future and capital may be eroded.
Further details on the Discretionary Distributing Share Classes will be included in the relevant key investor information document of the applicable Fund.
Frequency of Dividends
Equity Funds and Alternative Investment Funds – semi‑annual dividend (Share Class Sub‑Indicators “X” and “R”)
Both the Distributing Share Classes (Share Class Sub-Indicator “X”) and Discretionary Distributing Share Classes (Share Class Sub-Indicator “R”) aim to declare semi-annual dividends for Equity Funds (other than the Global Brands Equity Income Fund) and Alternative Investment Funds. Such dividends, if any, will be accrued on the last DealingDayofJuneandDecemberanddeclaredonthenextDealing Day. The dividend declaration will be made public at the registered office of the Company and made available at the offices of the Transfer Agent on the first Dealing Day ofJulyandJanuary.
Bond Funds, Asset Allocation Funds and the Global Brands Equity Income Fund – quarterly dividend (Share Class Sub‑Indicators “X” and “R”)
Both the Distributing Share Classes (Share Class Sub-Indicator “X”) and Discretionary Distributing Share Classes (Share Class Sub-Indicator “R”) aim to declare quarterly dividends for Bond Funds, Asset Allocation Funds and the Global Brands Equity Income Fund.
d) The affiliations of the Board of Directors of the Company are as follows:
All the Directors of the Company, except Zoe Parish, are also Directors of the Morgan Stanley Liquidity Funds.
Diane Hosie and Andrew Mack, Directors of the Company, are also Directors of the Management Company MSIM Fund Management (Ireland) Limited. In addition Elaine Keenan, Chief Executive Officer and Director of the ManagementCompany, Diane Hosie and Zoe Parish are Managing Directors of Morgan Stanley Investment Management.
As at 31 December 2020, cross holdings in funds advised by the Investment advisers or an affiliate are as detailed in note 14 on pages 434 and 435. Holdings in Morgan Stanley Liquidity funds are disclosed in the Statement of Investments.
As at 31 December 2020, the following Funds invested in the following investments, which are affiliates of the Investment Adviser:
Fund name Investments affiliated to the Investment adviser
Global Asset Backed Securities Fund MORGAN STANLEY RESECURITIZATION TRUST 2015-R4Global Asset Backed Securities Fund MORGAN STANLEY ABS CAPITAL I INC TRUST 2004-HE3Global Asset Backed Securities Fund MORGAN STANLEY ABS CAPITAL I INC TRUST 2004-HE8Global Asset Backed Securities Fund MORGAN STANLEY MORTGAGE LOAN TRUST 2004-7ARGlobal Fixed Income Opportunities Fund MORGAN STANLEY RESECURITIZATION TRUST 2015-R4
The Company has entered into OTC swaps transactions towhich Morgan Stanley acts as counterparty.
5 DIVIDEnD PoLICy
The Company offers Accumulating Share Classes, Distributing Share Classes and Discretionary Distributing Share Classes. The Company intends to declare dividends for the Distributing Share Classes and Discretionary Distributing Share Classes.
approach to declaring dividends
Distributing Share Classes (Share Class Sub‑Indicators “X” and “M”)
For the Distributing Share Classes of the Bond Funds, Equity Funds, Asset Allocation Funds and Alternative Investment Funds, the Company intends to declare dividends which will be equal to the net investment income attributable to such Classes (i.e. 100% of the net investment income).
For the Global Asset Backed Securities Fund, net investment income is considered to include net realised gains and losses from prepaid principal on mortgaged-backed and asset-backed securities for the purpose of the dividend policy.
For the Global Balanced Income Fund and Global Multi-Asset Income Fund, net investment income is considered to include the premium received as a result of the Funds writing listed and OTCoptionsforthepurposeofthedividendpolicy.
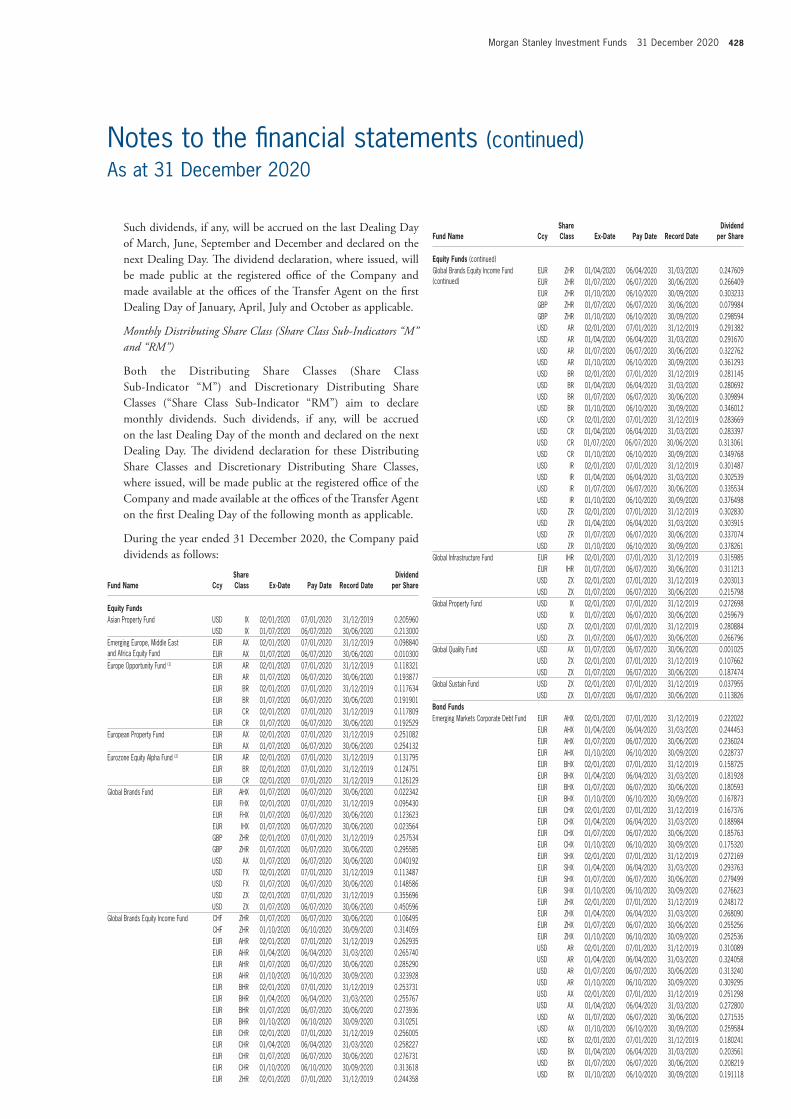
Morgan Stanley Investment Funds 31 December 2020 428
Notes to the financial statements (continued)As at 31 December 2020
Fund name CcyShare Class Ex-Date Pay Date Record Date
Dividend per Share
Equity Funds (continued)Global Brands Equity Income Fund(continued)
EUR ZHR 01/04/2020 06/04/2020 31/03/2020 0.247609EUR ZHR 01/07/2020 06/07/2020 30/06/2020 0.266409EUR ZHR 01/10/2020 06/10/2020 30/09/2020 0.303233GBP ZHR 01/07/2020 06/07/2020 30/06/2020 0.079984GBP ZHR 01/10/2020 06/10/2020 30/09/2020 0.298594USD AR 02/01/2020 07/01/2020 31/12/2019 0.291382USD AR 01/04/2020 06/04/2020 31/03/2020 0.291670USD AR 01/07/2020 06/07/2020 30/06/2020 0.322762USD AR 01/10/2020 06/10/2020 30/09/2020 0.361293USD BR 02/01/2020 07/01/2020 31/12/2019 0.281145USD BR 01/04/2020 06/04/2020 31/03/2020 0.280692USD BR 01/07/2020 06/07/2020 30/06/2020 0.309894USD BR 01/10/2020 06/10/2020 30/09/2020 0.346012USD CR 02/01/2020 07/01/2020 31/12/2019 0.283669USD CR 01/04/2020 06/04/2020 31/03/2020 0.283397USD CR 01/07/2020 06/07/2020 30/06/2020 0.313061USD CR 01/10/2020 06/10/2020 30/09/2020 0.349768USD IR 02/01/2020 07/01/2020 31/12/2019 0.301487USD IR 01/04/2020 06/04/2020 31/03/2020 0.302539USD IR 01/07/2020 06/07/2020 30/06/2020 0.335534USD IR 01/10/2020 06/10/2020 30/09/2020 0.376498USD ZR 02/01/2020 07/01/2020 31/12/2019 0.302830USD ZR 01/04/2020 06/04/2020 31/03/2020 0.303915USD ZR 01/07/2020 06/07/2020 30/06/2020 0.337074USD ZR 01/10/2020 06/10/2020 30/09/2020 0.378261
Global Infrastructure Fund EUR IHR 02/01/2020 07/01/2020 31/12/2019 0.315985EUR IHR 01/07/2020 06/07/2020 30/06/2020 0.311213USD ZX 02/01/2020 07/01/2020 31/12/2019 0.203013USD ZX 01/07/2020 06/07/2020 30/06/2020 0.215798
Global Property Fund USD IX 02/01/2020 07/01/2020 31/12/2019 0.272698USD IX 01/07/2020 06/07/2020 30/06/2020 0.259679USD ZX 02/01/2020 07/01/2020 31/12/2019 0.280884USD ZX 01/07/2020 06/07/2020 30/06/2020 0.266796
Global Quality Fund USD AX 01/07/2020 06/07/2020 30/06/2020 0.001025USD ZX 02/01/2020 07/01/2020 31/12/2019 0.107662USD ZX 01/07/2020 06/07/2020 30/06/2020 0.187474
Global Sustain Fund USD ZX 02/01/2020 07/01/2020 31/12/2019 0.037955USD ZX 01/07/2020 06/07/2020 30/06/2020 0.113826
Bond FundsEmerging Markets Corporate Debt Fund EUR AHX 02/01/2020 07/01/2020 31/12/2019 0.222022
EUR AHX 01/04/2020 06/04/2020 31/03/2020 0.244453EUR AHX 01/07/2020 06/07/2020 30/06/2020 0.236024EUR AHX 01/10/2020 06/10/2020 30/09/2020 0.228737EUR BHX 02/01/2020 07/01/2020 31/12/2019 0.158725EUR BHX 01/04/2020 06/04/2020 31/03/2020 0.181928EUR BHX 01/07/2020 06/07/2020 30/06/2020 0.180593EUR BHX 01/10/2020 06/10/2020 30/09/2020 0.167873EUR CHX 02/01/2020 07/01/2020 31/12/2019 0.167376EUR CHX 01/04/2020 06/04/2020 31/03/2020 0.188984EUR CHX 01/07/2020 06/07/2020 30/06/2020 0.185763EUR CHX 01/10/2020 06/10/2020 30/09/2020 0.175320EUR SHX 02/01/2020 07/01/2020 31/12/2019 0.272169EUR SHX 01/04/2020 06/04/2020 31/03/2020 0.293763EUR SHX 01/07/2020 06/07/2020 30/06/2020 0.279499EUR SHX 01/10/2020 06/10/2020 30/09/2020 0.276623EUR ZHX 02/01/2020 07/01/2020 31/12/2019 0.248172EUR ZHX 01/04/2020 06/04/2020 31/03/2020 0.268090EUR ZHX 01/07/2020 06/07/2020 30/06/2020 0.255256EUR ZHX 01/10/2020 06/10/2020 30/09/2020 0.252536USD AR 02/01/2020 07/01/2020 31/12/2019 0.310089USD AR 01/04/2020 06/04/2020 31/03/2020 0.324058USD AR 01/07/2020 06/07/2020 30/06/2020 0.313240USD AR 01/10/2020 06/10/2020 30/09/2020 0.309295USD AX 02/01/2020 07/01/2020 31/12/2019 0.251298USD AX 01/04/2020 06/04/2020 31/03/2020 0.272800USD AX 01/07/2020 06/07/2020 30/06/2020 0.271535USD AX 01/10/2020 06/10/2020 30/09/2020 0.259584USD BX 02/01/2020 07/01/2020 31/12/2019 0.180241USD BX 01/04/2020 06/04/2020 31/03/2020 0.203561USD BX 01/07/2020 06/07/2020 30/06/2020 0.208219USD BX 01/10/2020 06/10/2020 30/09/2020 0.191118
Such dividends, if any, will be accrued on the last Dealing Day ofMarch,June,SeptemberandDecemberanddeclaredonthenext Dealing Day. The dividend declaration, where issued, will be made public at the registered office of the Company and made available at the offices of the Transfer Agent on the first DealingDayofJanuary,April,JulyandOctoberasapplicable.
Monthly Distributing Share Class (Share Class Sub‑Indicators “M” and “RM”)
Both the Distributing Share Classes (Share Class Sub-Indicator “M”) and Discretionary Distributing Share Classes (“Share Class Sub-Indicator “RM”) aim to declare monthly dividends. Such dividends, if any, will be accrued on the last Dealing Day of the month and declared on the next Dealing Day. The dividend declaration for these Distributing Share Classes and Discretionary Distributing Share Classes, where issued, will be made public at the registered office of the Company and made available at the offices of the Transfer Agent on the first Dealing Day of the following month as applicable.
During the year ended 31 December 2020, the Company paid dividends as follows:
Fund name CcyShare Class Ex-Date Pay Date Record Date
Dividend per Share
Equity FundsAsian Property Fund USD IX 02/01/2020 07/01/2020 31/12/2019 0.205960
USD IX 01/07/2020 06/07/2020 30/06/2020 0.213000Emerging Europe, Middle East and Africa Equity Fund
EUR AX 02/01/2020 07/01/2020 31/12/2019 0.098840EUR AX 01/07/2020 06/07/2020 30/06/2020 0.010300
Europe Opportunity Fund (1) EUR AR 02/01/2020 07/01/2020 31/12/2019 0.118321EUR AR 01/07/2020 06/07/2020 30/06/2020 0.193877EUR BR 02/01/2020 07/01/2020 31/12/2019 0.117634EUR BR 01/07/2020 06/07/2020 30/06/2020 0.191901EUR CR 02/01/2020 07/01/2020 31/12/2019 0.117809EUR CR 01/07/2020 06/07/2020 30/06/2020 0.192529
European Property Fund EUR AX 02/01/2020 07/01/2020 31/12/2019 0.251082EUR AX 01/07/2020 06/07/2020 30/06/2020 0.254132
Eurozone Equity Alpha Fund (2) EUR AR 02/01/2020 07/01/2020 31/12/2019 0.131795EUR BR 02/01/2020 07/01/2020 31/12/2019 0.124751EUR CR 02/01/2020 07/01/2020 31/12/2019 0.126129
Global Brands Fund EUR AHX 01/07/2020 06/07/2020 30/06/2020 0.022342EUR FHX 02/01/2020 07/01/2020 31/12/2019 0.095430EUR FHX 01/07/2020 06/07/2020 30/06/2020 0.123623EUR IHX 01/07/2020 06/07/2020 30/06/2020 0.023564GBP ZHR 02/01/2020 07/01/2020 31/12/2019 0.257534GBP ZHR 01/07/2020 06/07/2020 30/06/2020 0.295585USD AX 01/07/2020 06/07/2020 30/06/2020 0.040192USD FX 02/01/2020 07/01/2020 31/12/2019 0.113487USD FX 01/07/2020 06/07/2020 30/06/2020 0.148586USD ZX 02/01/2020 07/01/2020 31/12/2019 0.355696USD ZX 01/07/2020 06/07/2020 30/06/2020 0.450596
Global Brands Equity Income Fund CHF ZHR 01/07/2020 06/07/2020 30/06/2020 0.106495CHF ZHR 01/10/2020 06/10/2020 30/09/2020 0.314059EUR AHR 02/01/2020 07/01/2020 31/12/2019 0.262935EUR AHR 01/04/2020 06/04/2020 31/03/2020 0.265740EUR AHR 01/07/2020 06/07/2020 30/06/2020 0.285290EUR AHR 01/10/2020 06/10/2020 30/09/2020 0.323928EUR BHR 02/01/2020 07/01/2020 31/12/2019 0.253731EUR BHR 01/04/2020 06/04/2020 31/03/2020 0.255767EUR BHR 01/07/2020 06/07/2020 30/06/2020 0.273936EUR BHR 01/10/2020 06/10/2020 30/09/2020 0.310251EUR CHR 02/01/2020 07/01/2020 31/12/2019 0.256005EUR CHR 01/04/2020 06/04/2020 31/03/2020 0.258227EUR CHR 01/07/2020 06/07/2020 30/06/2020 0.276731EUR CHR 01/10/2020 06/10/2020 30/09/2020 0.313618EUR ZHR 02/01/2020 07/01/2020 31/12/2019 0.244358

429 Morgan Stanley Investment Funds 31 December 2020
Notes to the financial statements (continued)As at 31 December 2020
Fund name CcyShare Class Ex-Date Pay Date Record Date
Dividend per Share
Bond Funds (continued)Emerging Markets Domestic Debt Fund(continued)
USD BX 01/07/2020 06/07/2020 30/06/2020 0.079434USD BX 01/10/2020 06/10/2020 30/09/2020 0.135435USD CX 02/01/2020 07/01/2020 31/12/2019 0.172906USD CX 01/04/2020 06/04/2020 31/03/2020 0.279109USD CX 01/07/2020 06/07/2020 30/06/2020 0.134054USD CX 01/10/2020 06/10/2020 30/09/2020 0.218795USD ZX 02/01/2020 07/01/2020 31/12/2019 0.176416USD ZX 01/04/2020 06/04/2020 31/03/2020 0.245642USD ZX 01/07/2020 06/07/2020 30/06/2020 0.142778USD ZX 01/10/2020 06/10/2020 30/09/2020 0.203047
Emerging Markets Fixed Income Opportunities Fund
EUR AHR 02/01/2020 07/01/2020 31/12/2019 0.306090EUR AHR 01/04/2020 06/04/2020 31/03/2020 0.346515EUR AHR 01/07/2020 06/07/2020 30/06/2020 0.252486EUR AHR 01/10/2020 06/10/2020 30/09/2020 0.275420EUR BHR 02/01/2020 07/01/2020 31/12/2019 0.293117EUR BHR 01/04/2020 06/04/2020 31/03/2020 0.331064EUR BHR 01/07/2020 06/07/2020 30/06/2020 0.240572EUR BHR 01/10/2020 06/10/2020 30/09/2020 0.261799EUR CHR 02/01/2020 07/01/2020 31/12/2019 0.299535EUR CHR 01/04/2020 06/04/2020 31/03/2020 0.338707EUR CHR 01/07/2020 06/07/2020 30/06/2020 0.246464EUR CHR 01/10/2020 06/10/2020 30/09/2020 0.268532
Euro Bond Fund EUR ZX 02/01/2020 07/01/2020 31/12/2019 0.039721EUR ZX 01/04/2020 06/04/2020 31/03/2020 0.027284EUR ZX 01/07/2020 06/07/2020 30/06/2020 0.028788EUR ZX 01/10/2020 06/10/2020 30/09/2020 0.026862
Euro Corporate Bond Fund EUR AX 02/01/2020 07/01/2020 31/12/2019 0.087495EUR AX 01/04/2020 06/04/2020 31/03/2020 0.058123EUR AX 01/07/2020 06/07/2020 30/06/2020 0.071564EUR AX 01/10/2020 06/10/2020 30/09/2020 0.065932EUR BX 02/01/2020 07/01/2020 31/12/2019 0.002871EUR CX 02/01/2020 07/01/2020 31/12/2019 0.027978EUR CX 01/04/2020 06/04/2020 31/03/2020 0.005705EUR CX 01/07/2020 06/07/2020 30/06/2020 0.017588EUR CX 01/10/2020 06/10/2020 30/09/2020 0.011132EUR FX 02/01/2020 07/01/2020 31/12/2019 0.123093EUR FX 01/04/2020 06/04/2020 31/03/2020 0.096591EUR FX 01/07/2020 06/07/2020 30/06/2020 0.106757EUR FX 01/10/2020 06/10/2020 30/09/2020 0.104177EUR IX 02/01/2020 07/01/2020 31/12/2019 0.105134EUR IX 01/04/2020 06/04/2020 31/03/2020 0.078539EUR IX 01/07/2020 06/07/2020 30/06/2020 0.089563EUR IX 01/10/2020 06/10/2020 30/09/2020 0.085930EUR ZX 02/01/2020 07/01/2020 31/12/2019 0.097324EUR ZX 01/04/2020 06/04/2020 31/03/2020 0.073277EUR ZX 01/07/2020 06/07/2020 30/06/2020 0.083142EUR ZX 01/10/2020 06/10/2020 30/09/2020 0.079985GBP ZHX 02/01/2020 07/01/2020 31/12/2019 0.093509GBP ZHX 01/04/2020 06/04/2020 31/03/2020 0.071746GBP ZHX 01/07/2020 06/07/2020 30/06/2020 0.082216GBP ZHX 01/10/2020 06/10/2020 30/09/2020 0.077250
Euro Corporate Bond – Duration Hedged Fund
EUR AX 02/01/2020 07/01/2020 31/12/2019 0.058110EUR AX 01/04/2020 06/04/2020 31/03/2020 0.059841EUR AX 01/07/2020 06/07/2020 30/06/2020 0.068434EUR AX 01/10/2020 06/10/2020 30/09/2020 0.063341EUR BX 01/04/2020 06/04/2020 31/03/2020 0.001588EUR BX 01/07/2020 06/07/2020 30/06/2020 0.012019EUR BX 01/10/2020 06/10/2020 30/09/2020 0.004023
Euro Strategic Bond Fund EUR AX 02/01/2020 07/01/2020 31/12/2019 0.062148EUR AX 01/04/2020 06/04/2020 31/03/2020 0.056608EUR AX 01/07/2020 06/07/2020 30/06/2020 0.041808EUR AX 01/10/2020 06/10/2020 30/09/2020 0.033145EUR CX 02/01/2020 07/01/2020 31/12/2019 0.010357EUR CX 01/04/2020 06/04/2020 31/03/2020 0.006564
European Fixed Income Opportunities Fund
EUR AR 02/01/2020 07/01/2020 31/12/2019 0.131857EUR AR 01/04/2020 06/04/2020 31/03/2020 0.116228EUR AR 01/07/2020 06/07/2020 30/06/2020 0.112781EUR AR 01/10/2020 06/10/2020 30/09/2020 0.104746EUR BR 02/01/2020 07/01/2020 31/12/2019 0.125378EUR BR 01/04/2020 06/04/2020 31/03/2020 0.110255
Fund name CcyShare Class Ex-Date Pay Date Record Date
Dividend per Share
Bond Funds (continued)Emerging Markets Corporate Debt Fund(continued)
USD CX 02/01/2020 07/01/2020 31/12/2019 0.180254USD CX 01/04/2020 06/04/2020 31/03/2020 0.200609USD CX 01/07/2020 06/07/2020 30/06/2020 0.203207USD CX 01/10/2020 06/10/2020 30/09/2020 0.189276
Emerging Markets Debt Fund EUR AHX 02/01/2020 07/01/2020 31/12/2019 0.193599EUR AHX 01/04/2020 06/04/2020 31/03/2020 0.180770EUR AHX 01/07/2020 06/07/2020 30/06/2020 0.163058EUR AHX 01/10/2020 06/10/2020 30/09/2020 0.157217EUR BHX 02/01/2020 07/01/2020 31/12/2019 0.140869EUR BHX 01/04/2020 06/04/2020 31/03/2020 0.128838EUR BHX 01/07/2020 06/07/2020 30/06/2020 0.116570EUR BHX 01/10/2020 06/10/2020 30/09/2020 0.105214EUR CHX 02/01/2020 07/01/2020 31/12/2019 0.175456EUR CHX 01/04/2020 06/04/2020 31/03/2020 0.161706EUR CHX 01/07/2020 06/07/2020 30/06/2020 0.146110EUR CHX 01/10/2020 06/10/2020 30/09/2020 0.135241USD ARM 02/01/2020 07/01/2020 31/12/2019 0.091352USD ARM 03/02/2020 06/02/2020 31/01/2020 0.086083USD ARM 02/03/2020 05/03/2020 28/02/2020 0.117054USD ARM 01/04/2020 06/04/2020 31/03/2020 0.044060USD ARM 04/05/2020 07/05/2020 30/04/2020 0.068943USD ARM 02/06/2020 05/06/2020 29/05/2020 0.076037USD ARM 01/07/2020 06/07/2020 30/06/2020 0.084119USD ARM 03/08/2020 06/08/2020 31/07/2020 0.070470USD ARM 01/09/2020 04/09/2020 31/08/2020 0.080889USD ARM 01/10/2020 06/10/2020 30/09/2020 0.076468USD ARM 02/11/2020 05/11/2020 30/10/2020 0.081206USD ARM 01/12/2020 04/12/2020 30/11/2020 0.081343USD AX 02/01/2020 07/01/2020 31/12/2019 0.468159USD AX 01/04/2020 06/04/2020 31/03/2020 0.432543USD AX 01/07/2020 06/07/2020 30/06/2020 0.402536USD AX 01/10/2020 06/10/2020 30/09/2020 0.382576USD BX 02/01/2020 07/01/2020 31/12/2019 0.159752USD BX 01/04/2020 06/04/2020 31/03/2020 0.144810USD BX 01/07/2020 06/07/2020 30/06/2020 0.135121USD BX 01/10/2020 06/10/2020 30/09/2020 0.120347USD CX 02/01/2020 07/01/2020 31/12/2019 0.188611USD CX 01/04/2020 06/04/2020 31/03/2020 0.172139USD CX 01/07/2020 06/07/2020 30/06/2020 0.160495USD CX 01/10/2020 06/10/2020 30/09/2020 0.146520
Emerging Markets Domestic Debt Fund EUR AHX 02/01/2020 07/01/2020 31/12/2019 0.122997EUR AHX 01/04/2020 06/04/2020 31/03/2020 0.187582EUR AHX 01/07/2020 06/07/2020 30/06/2020 0.095536EUR AHX 01/10/2020 06/10/2020 30/09/2020 0.145466EUR BHX 02/01/2020 07/01/2020 31/12/2019 0.089491EUR BHX 01/04/2020 06/04/2020 31/03/2020 0.154987EUR BHX 01/07/2020 06/07/2020 30/06/2020 0.066626EUR BHX 01/10/2020 06/10/2020 30/09/2020 0.114281EUR CHX 02/01/2020 07/01/2020 31/12/2019 0.160681EUR CHX 01/04/2020 06/04/2020 31/03/2020 0.264914EUR CHX 01/07/2020 06/07/2020 30/06/2020 0.120265EUR CHX 01/10/2020 06/10/2020 30/09/2020 0.199924USD ARM 02/01/2020 07/01/2020 31/12/2019 0.061347USD ARM 03/02/2020 06/02/2020 31/01/2020 0.121105USD ARM 02/03/2020 05/03/2020 28/02/2020 0.079500USD ARM 01/04/2020 06/04/2020 31/03/2020 0.031846USD ARM 04/05/2020 07/05/2020 30/04/2020 0.047288USD ARM 02/06/2020 05/06/2020 29/05/2020 0.047241USD ARM 01/07/2020 06/07/2020 30/06/2020 0.049471USD ARM 03/08/2020 06/08/2020 31/07/2020 0.092848USD ARM 01/09/2020 04/09/2020 31/08/2020 0.047799USD ARM 01/10/2020 06/10/2020 30/09/2020 0.054747USD ARM 02/11/2020 05/11/2020 30/10/2020 0.048739USD ARM 01/12/2020 04/12/2020 30/11/2020 0.049025USD AX 02/01/2020 07/01/2020 31/12/2019 0.141109USD AX 01/04/2020 06/04/2020 31/03/2020 0.210331USD AX 01/07/2020 06/07/2020 30/06/2020 0.112173USD AX 01/10/2020 06/10/2020 30/09/2020 0.169783USD BX 02/01/2020 07/01/2020 31/12/2019 0.104006USD BX 01/04/2020 06/04/2020 31/03/2020 0.175448

Morgan Stanley Investment Funds 31 December 2020 430
Notes to the financial statements (continued)As at 31 December 2020
Fund name CcyShare Class Ex-Date Pay Date Record Date
Dividend per Share
Bond Funds (continued)European Fixed Income Opportunities Fund (continued)
EUR BR 01/07/2020 06/07/2020 30/06/2020 0.106708EUR BR 01/10/2020 06/10/2020 30/09/2020 0.098869EUR CR 02/01/2020 07/01/2020 31/12/2019 0.128900EUR CR 01/04/2020 06/04/2020 31/03/2020 0.113501EUR CR 01/07/2020 06/07/2020 30/06/2020 0.110009EUR CR 01/10/2020 06/10/2020 30/09/2020 0.102061EUR IR 02/01/2020 07/01/2020 31/12/2019 0.144766EUR IR 01/04/2020 06/04/2020 31/03/2020 0.128765EUR IR 01/07/2020 06/07/2020 30/06/2020 0.125118EUR IR 01/10/2020 06/10/2020 30/09/2020 0.116449EUR ZR 02/01/2020 07/01/2020 31/12/2019 0.144766EUR ZR 01/04/2020 06/04/2020 31/03/2020 0.128765EUR ZR 01/07/2020 06/07/2020 30/06/2020 0.125118EUR ZR 01/10/2020 06/10/2020 30/09/2020 0.116474
European High Yield Bond Fund EUR AX 02/01/2020 07/01/2020 31/12/2019 0.231969EUR AX 01/04/2020 06/04/2020 31/03/2020 0.244357EUR AX 01/07/2020 06/07/2020 30/06/2020 0.247989EUR AX 01/10/2020 06/10/2020 30/09/2020 0.233408EUR BX 02/01/2020 07/01/2020 31/12/2019 0.157415EUR BX 01/04/2020 06/04/2020 31/03/2020 0.173580EUR BX 01/07/2020 06/07/2020 30/06/2020 0.182626EUR BX 01/10/2020 06/10/2020 30/09/2020 0.163158EUR CX 02/01/2020 07/01/2020 31/12/2019 0.152767EUR CX 01/04/2020 06/04/2020 31/03/2020 0.165119EUR CX 01/07/2020 06/07/2020 30/06/2020 0.171154EUR CX 01/10/2020 06/10/2020 30/09/2020 0.156363EUR ZX 02/01/2020 07/01/2020 31/12/2019 0.227046EUR ZX 01/04/2020 06/04/2020 31/03/2020 0.236238EUR ZX 01/07/2020 06/07/2020 30/06/2020 0.237258EUR ZX 01/10/2020 06/10/2020 30/09/2020 0.226609GBP ZHX 02/01/2020 07/01/2020 31/12/2019 0.226501GBP ZHX 01/04/2020 06/04/2020 31/03/2020 0.244706GBP ZHX 01/07/2020 06/07/2020 30/06/2020 0.245156GBP ZHX 01/10/2020 06/10/2020 30/09/2020 0.228912
Global Asset Backed Securities Fund EUR AHR 02/01/2020 07/01/2020 31/12/2019 0.198279EUR AHR 01/04/2020 06/04/2020 31/03/2020 0.145539EUR AHR 01/07/2020 06/07/2020 30/06/2020 0.169182EUR AHR 01/10/2020 06/10/2020 30/09/2020 0.169457EUR AHX 02/01/2020 07/01/2020 31/12/2019 0.121908EUR AHX 01/04/2020 06/04/2020 31/03/2020 0.068991EUR AHX 01/07/2020 06/07/2020 30/06/2020 0.100061EUR AHX 01/10/2020 06/10/2020 30/09/2020 0.094811EUR BHR 02/01/2020 07/01/2020 31/12/2019 0.177662EUR BHR 01/04/2020 06/04/2020 31/03/2020 0.130253EUR BHR 01/07/2020 06/07/2020 30/06/2020 0.151865EUR BHR 01/10/2020 06/10/2020 30/09/2020 0.150276EUR BHX 02/01/2020 07/01/2020 31/12/2019 0.062002EUR BHX 01/04/2020 06/04/2020 31/03/2020 0.006928EUR BHX 01/07/2020 06/07/2020 30/06/2020 0.043781EUR BHX 01/10/2020 06/10/2020 30/09/2020 0.034639EUR CHR 02/01/2020 07/01/2020 31/12/2019 0.196507EUR CHR 01/04/2020 06/04/2020 31/03/2020 0.144177EUR CHR 01/07/2020 06/07/2020 30/06/2020 0.168195EUR CHR 01/10/2020 06/10/2020 30/09/2020 0.166792EUR CHX 02/01/2020 07/01/2020 31/12/2019 0.087838EUR CHX 01/04/2020 06/04/2020 31/03/2020 0.032867EUR CHX 01/07/2020 06/07/2020 30/06/2020 0.067865EUR CHX 01/10/2020 06/10/2020 30/09/2020 0.060240EUR FHX 02/01/2020 07/01/2020 31/12/2019 0.162445EUR FHX 01/04/2020 06/04/2020 31/03/2020 0.109470EUR FHX 01/07/2020 06/07/2020 30/06/2020 0.137730EUR FHX 01/10/2020 06/10/2020 30/09/2020 0.135305EUR IHX 02/01/2020 07/01/2020 31/12/2019 0.158135EUR IHX 01/04/2020 06/04/2020 31/03/2020 0.104572EUR IHX 01/07/2020 06/07/2020 30/06/2020 0.133575EUR IHX 01/10/2020 06/10/2020 30/09/2020 0.130244GBP ZHX 02/01/2020 07/01/2020 31/12/2019 0.158956GBP ZHX 01/04/2020 06/04/2020 31/03/2020 0.111067GBP ZHX 01/07/2020 06/07/2020 30/06/2020 0.141863GBP ZHX 01/10/2020 06/10/2020 30/09/2020 0.134927
Fund name CcyShare Class Ex-Date Pay Date Record Date
Dividend per Share
Bond Funds (continued)Global Asset Backed Securities Fund(continued)
USD AR 02/01/2020 07/01/2020 31/12/2019 0.207480USD AR 01/04/2020 06/04/2020 31/03/2020 0.150329USD AR 01/07/2020 06/07/2020 30/06/2020 0.181282USD AR 01/10/2020 06/10/2020 30/09/2020 0.177312USD CX 02/01/2020 07/01/2020 31/12/2019 0.100628USD CX 01/04/2020 06/04/2020 31/03/2020 0.038893USD CX 01/07/2020 06/07/2020 30/06/2020 0.079761USD CX 01/10/2020 06/10/2020 30/09/2020 0.070300
Global Bond Fund EUR AHX 02/01/2020 07/01/2020 31/12/2019 0.090674EUR AHX 01/04/2020 06/04/2020 31/03/2020 0.091901EUR AHX 01/07/2020 06/07/2020 30/06/2020 0.072201EUR AHX 01/10/2020 06/10/2020 30/09/2020 0.065757EUR BHX 02/01/2020 07/01/2020 31/12/2019 0.036816EUR BHX 01/04/2020 06/04/2020 31/03/2020 0.038100EUR BHX 01/07/2020 06/07/2020 30/06/2020 0.020418EUR BHX 01/10/2020 06/10/2020 30/09/2020 0.009934USD AX 02/01/2020 07/01/2020 31/12/2019 0.140243USD AX 01/04/2020 06/04/2020 31/03/2020 0.139839USD AX 01/07/2020 06/07/2020 30/06/2020 0.114479USD AX 01/10/2020 06/10/2020 30/09/2020 0.103310USD BX 02/01/2020 07/01/2020 31/12/2019 0.044360USD BX 01/04/2020 06/04/2020 31/03/2020 0.044946USD BX 01/07/2020 06/07/2020 30/06/2020 0.026197USD BX 01/10/2020 06/10/2020 30/09/2020 0.014009
Global Buy and Hold 2020 Bond Fund (3) EUR AR 02/01/2020 07/01/2020 31/12/2019 0.264875EUR AR 01/04/2020 06/04/2020 31/03/2020 0.251500EUR AR 01/07/2020 06/07/2020 30/06/2020 0.229450EUR AR 01/10/2020 06/10/2020 30/09/2020 0.195325EUR AX 02/01/2020 07/01/2020 31/12/2019 0.087304EUR AX 01/04/2020 06/04/2020 31/03/2020 0.080408EUR AX 01/07/2020 06/07/2020 30/06/2020 0.083789EUR AX 01/10/2020 06/10/2020 30/09/2020 0.085927EUR BR 02/01/2020 07/01/2020 31/12/2019 0.204734EUR BR 01/04/2020 06/04/2020 31/03/2020 0.192931EUR BR 01/07/2020 06/07/2020 30/06/2020 0.175454EUR BR 01/10/2020 06/10/2020 30/09/2020 0.138029EUR BX 02/01/2020 07/01/2020 31/12/2019 0.024836EUR BX 01/04/2020 06/04/2020 31/03/2020 0.022875EUR BX 01/07/2020 06/07/2020 30/06/2020 0.023837EUR BX 01/10/2020 06/10/2020 30/09/2020 0.024445
Global Convertible Bond Fund EUR ZHX 02/01/2020 07/01/2020 31/12/2019 0.016205EUR ZHX 01/04/2020 06/04/2020 31/03/2020 0.008361EUR ZHX 01/07/2020 06/07/2020 30/06/2020 0.002822EUR ZHX 01/10/2020 06/10/2020 30/09/2020 0.005116USD ZX 02/01/2020 07/01/2020 31/12/2019 0.016462USD ZX 01/04/2020 06/04/2020 31/03/2020 0.010004USD ZX 01/07/2020 06/07/2020 30/06/2020 0.005526
Global Fixed Income Opportunities Fund EUR AHR 02/01/2020 07/01/2020 31/12/2019 0.192469EUR AHR 01/04/2020 06/04/2020 31/03/2020 0.204743EUR AHR 01/07/2020 06/07/2020 30/06/2020 0.158802EUR AHR 01/10/2020 06/10/2020 30/09/2020 0.160011EUR AHX 02/01/2020 07/01/2020 31/12/2019 0.147053EUR AHX 01/04/2020 06/04/2020 31/03/2020 0.163096EUR AHX 01/07/2020 06/07/2020 30/06/2020 0.114248EUR AHX 01/10/2020 06/10/2020 30/09/2020 0.110742EUR BHR 02/01/2020 07/01/2020 31/12/2019 0.181710EUR BHR 01/04/2020 06/04/2020 31/03/2020 0.192840EUR BHR 01/07/2020 06/07/2020 30/06/2020 0.149187EUR BHR 01/10/2020 06/10/2020 30/09/2020 0.149967EUR BHX 02/01/2020 07/01/2020 31/12/2019 0.082556EUR BHX 01/04/2020 06/04/2020 31/03/2020 0.099095EUR BHX 01/07/2020 06/07/2020 30/06/2020 0.054530EUR BHX 01/10/2020 06/10/2020 30/09/2020 0.046692EUR CHR 02/01/2020 07/01/2020 31/12/2019 0.187579EUR CHR 01/04/2020 06/04/2020 31/03/2020 0.199332EUR CHR 01/07/2020 06/07/2020 30/06/2020 0.154428EUR CHR 01/10/2020 06/10/2020 30/09/2020 0.155445EUR CHX 02/01/2020 07/01/2020 31/12/2019 0.107590EUR CHX 01/04/2020 06/04/2020 31/03/2020 0.122419EUR CHX 01/07/2020 06/07/2020 30/06/2020 0.079648

431 Morgan Stanley Investment Funds 31 December 2020
Notes to the financial statements (continued)As at 31 December 2020
Fund name CcyShare Class Ex-Date Pay Date Record Date
Dividend per Share
Bond Funds (continued)Global Fixed Income Opportunities Fund(continued)
EUR CHX 01/10/2020 06/10/2020 30/09/2020 0.074672GBP ZHR 02/01/2020 07/01/2020 31/12/2019 0.214883GBP ZHR 01/04/2020 06/04/2020 31/03/2020 0.239816GBP ZHR 01/07/2020 06/07/2020 30/06/2020 0.186224GBP ZHR 01/10/2020 06/10/2020 30/09/2020 0.183962USD AR 02/01/2020 07/01/2020 31/12/2019 0.225970USD AR 01/04/2020 06/04/2020 31/03/2020 0.236587USD AR 01/07/2020 06/07/2020 30/06/2020 0.190195USD AR 01/10/2020 06/10/2020 30/09/2020 0.188945USD ARM 02/01/2020 07/01/2020 31/12/2019 0.069104USD ARM 03/02/2020 06/02/2020 31/01/2020 0.092444USD ARM 02/03/2020 05/03/2020 28/02/2020 0.093326USD ARM 01/04/2020 06/04/2020 31/03/2020 0.033916USD ARM 04/05/2020 07/05/2020 30/04/2020 0.061636USD ARM 02/06/2020 05/06/2020 29/05/2020 0.063077USD ARM 01/07/2020 06/07/2020 30/06/2020 0.052238USD ARM 03/08/2020 06/08/2020 31/07/2020 0.070073USD ARM 01/09/2020 04/09/2020 31/08/2020 0.061102USD ARM 01/10/2020 06/10/2020 30/09/2020 0.044579USD ARM 02/11/2020 05/11/2020 30/10/2020 0.061798USD ARM 01/12/2020 04/12/2020 30/11/2020 0.062425USD AX 02/01/2020 07/01/2020 31/12/2019 0.167633USD AX 01/04/2020 06/04/2020 31/03/2020 0.182445USD AX 01/07/2020 06/07/2020 30/06/2020 0.133438USD AX 01/10/2020 06/10/2020 30/09/2020 0.127841USD BX 02/01/2020 07/01/2020 31/12/2019 0.095293USD BX 01/04/2020 06/04/2020 31/03/2020 0.111644USD BX 01/07/2020 06/07/2020 30/06/2020 0.065293USD BX 01/10/2020 06/10/2020 30/09/2020 0.055829USD CX 02/01/2020 07/01/2020 31/12/2019 0.121300USD CX 01/04/2020 06/04/2020 31/03/2020 0.135230USD CX 01/07/2020 06/07/2020 30/06/2020 0.092297USD CX 01/10/2020 06/10/2020 30/09/2020 0.085701USD IR 02/01/2020 07/01/2020 31/12/2019 0.228516USD IR 01/04/2020 06/04/2020 31/03/2020 0.239725USD IR 01/07/2020 06/07/2020 30/06/2020 0.194016USD IR 01/10/2020 06/10/2020 30/09/2020 0.191890USD IX 02/01/2020 07/01/2020 31/12/2019 0.184674USD IX 01/04/2020 06/04/2020 31/03/2020 0.196822USD IX 01/07/2020 06/07/2020 30/06/2020 0.152548USD IX 01/10/2020 06/10/2020 30/09/2020 0.149690USD ZX 02/01/2020 07/01/2020 31/12/2019 0.191734USD ZX 01/04/2020 06/04/2020 31/03/2020 0.204120USD ZX 01/07/2020 06/07/2020 30/06/2020 0.158683USD ZX 01/10/2020 06/10/2020 30/09/2020 0.155896
Global High Yield Bond Fund EUR AHX 02/01/2020 07/01/2020 31/12/2019 0.313046EUR AHX 01/04/2020 06/04/2020 31/03/2020 0.318437EUR AHX 01/07/2020 06/07/2020 30/06/2020 0.274423EUR AHX 01/10/2020 06/10/2020 30/09/2020 0.273205EUR BHX 02/01/2020 07/01/2020 31/12/2019 0.253784EUR BHX 01/04/2020 06/04/2020 31/03/2020 0.260734EUR BHX 01/07/2020 06/07/2020 30/06/2020 0.224564EUR BHX 01/10/2020 06/10/2020 30/09/2020 0.217296EUR CHX 02/01/2020 07/01/2020 31/12/2019 0.266356EUR CHX 01/04/2020 06/04/2020 31/03/2020 0.272342EUR CHX 01/07/2020 06/07/2020 30/06/2020 0.234535EUR CHX 01/10/2020 06/10/2020 30/09/2020 0.229923USD AR 02/01/2020 07/01/2020 31/12/2019 0.383725USD AR 01/04/2020 06/04/2020 31/03/2020 0.381100USD AR 01/07/2020 06/07/2020 30/06/2020 0.338850USD AR 01/10/2020 06/10/2020 30/09/2020 0.338925USD ARM 02/01/2020 07/01/2020 31/12/2019 0.145200USD ARM 03/02/2020 06/02/2020 31/01/2020 0.137294USD ARM 02/03/2020 05/03/2020 28/02/2020 0.184028USD ARM 01/04/2020 06/04/2020 31/03/2020 0.092429USD ARM 04/05/2020 07/05/2020 30/04/2020 0.124245USD ARM 02/06/2020 05/06/2020 29/05/2020 0.123715USD ARM 01/07/2020 06/07/2020 30/06/2020 0.121108USD ARM 03/08/2020 06/08/2020 31/07/2020 0.122152USD ARM 01/09/2020 04/09/2020 31/08/2020 0.115527
Fund name CcyShare Class Ex-Date Pay Date Record Date
Dividend per Share
Bond Funds (continued)Global High Yield Bond Fund(continued)
USD ARM 01/10/2020 06/10/2020 30/09/2020 0.131755USD ARM 02/11/2020 05/11/2020 30/10/2020 0.123511USD ARM 01/12/2020 04/12/2020 30/11/2020 0.122810USD AX 02/01/2020 07/01/2020 31/12/2019 0.355998USD AX 01/04/2020 06/04/2020 31/03/2020 0.357676USD AX 01/07/2020 06/07/2020 30/06/2020 0.318929USD AX 01/10/2020 06/10/2020 30/09/2020 0.312862USD BX 02/01/2020 07/01/2020 31/12/2019 0.289058USD BX 01/04/2020 06/04/2020 31/03/2020 0.293390USD BX 01/07/2020 06/07/2020 30/06/2020 0.261514USD BX 01/10/2020 06/10/2020 30/09/2020 0.249392USD CX 02/01/2020 07/01/2020 31/12/2019 0.285403USD CX 01/04/2020 06/04/2020 31/03/2020 0.288351USD CX 01/07/2020 06/07/2020 30/06/2020 0.257071USD CX 01/10/2020 06/10/2020 30/09/2020 0.248307USD IX 02/01/2020 07/01/2020 31/12/2019 0.306494USD IX 01/04/2020 06/04/2020 31/03/2020 0.306879USD IX 01/07/2020 06/07/2020 30/06/2020 0.273658USD IX 01/10/2020 06/10/2020 30/09/2020 0.271008ZAR AHRM 02/01/2020 07/01/2020 31/12/2019 2.825734ZAR AHRM 03/02/2020 06/02/2020 31/01/2020 2.874433ZAR AHRM 02/03/2020 05/03/2020 28/02/2020 3.882042ZAR AHRM 01/04/2020 06/04/2020 31/03/2020 1.889107ZAR AHRM 04/05/2020 07/05/2020 30/04/2020 2.489508ZAR AHRM 02/06/2020 05/06/2020 29/05/2020 2.427126ZAR AHRM 01/07/2020 06/07/2020 30/06/2020 2.508085ZAR AHRM 03/08/2020 06/08/2020 31/07/2020 2.528030ZAR AHRM 01/09/2020 04/09/2020 31/08/2020 2.322621ZAR AHRM 01/10/2020 06/10/2020 30/09/2020 2.733498ZAR AHRM 02/11/2020 05/11/2020 30/10/2020 2.535565ZAR AHRM 01/12/2020 04/12/2020 30/11/2020 2.510576
US Dollar High Yield Bond Fund EUR ZHX 02/01/2020 07/01/2020 31/12/2019 0.358442EUR ZHX 01/04/2020 06/04/2020 31/03/2020 0.347075EUR ZHX 01/07/2020 06/07/2020 30/06/2020 0.312785EUR ZHX 01/10/2020 06/10/2020 30/09/2020 0.320105USD AR 02/01/2020 07/01/2020 31/12/2019 0.399115USD AR 01/04/2020 06/04/2020 31/03/2020 0.380389USD AR 01/07/2020 06/07/2020 30/06/2020 0.351890USD AR 01/10/2020 06/10/2020 30/09/2020 0.356261USD AX 02/01/2020 07/01/2020 31/12/2019 0.326981USD AX 01/04/2020 06/04/2020 31/03/2020 0.312100USD AX 01/07/2020 06/07/2020 30/06/2020 0.291455USD AX 01/10/2020 06/10/2020 30/09/2020 0.290331
asset allocation FundsUS Dollar Short Duration High Yield Bond Fund
USD AR 02/01/2020 07/01/2020 31/12/2019 0.405954USD AR 01/04/2020 06/04/2020 31/03/2020 0.397274USD AR 01/07/2020 06/07/2020 30/06/2020 0.370987USD AR 01/10/2020 06/10/2020 30/09/2020 0.360260USD AX 02/01/2020 07/01/2020 31/12/2019 0.336147USD AX 01/04/2020 06/04/2020 31/03/2020 0.331357USD AX 01/07/2020 06/07/2020 30/06/2020 0.313122USD AX 01/10/2020 06/10/2020 30/09/2020 0.297809USD CX 02/01/2020 07/01/2020 31/12/2019 0.317565USD CX 01/04/2020 06/04/2020 31/03/2020 0.313444USD CX 01/07/2020 06/07/2020 30/06/2020 0.296995USD CX 01/10/2020 06/10/2020 30/09/2020 0.280350USD ZM 01/09/2020 04/09/2020 31/08/2020 0.113834USD ZM 01/10/2020 06/10/2020 30/09/2020 0.122431USD ZM 02/11/2020 05/11/2020 30/10/2020 0.125421USD ZM 01/12/2020 04/12/2020 30/11/2020 0.125770
Global Balanced Income Fund AUD AHRM 02/01/2020 07/01/2020 31/12/2019 0.121760AUD AHRM 03/02/2020 06/02/2020 31/01/2020 0.096638AUD AHRM 02/03/2020 05/03/2020 28/02/2020 0.082097AUD AHRM 01/04/2020 06/04/2020 31/03/2020 0.087900AUD AHRM 04/05/2020 07/05/2020 30/04/2020 0.084931AUD AHRM 02/06/2020 05/06/2020 29/05/2020 0.081318AUD AHRM 01/07/2020 06/07/2020 30/06/2020 0.089787AUD AHRM 03/08/2020 06/08/2020 31/07/2020 0.086223AUD AHRM 01/09/2020 04/09/2020 31/08/2020 0.086849AUD AHRM 01/10/2020 06/10/2020 30/09/2020 0.083848

Morgan Stanley Investment Funds 31 December 2020 432
Notes to the financial statements (continued)As at 31 December 2020
6 TaXaTIon
Under current law and practice, the Company is not liable to any Luxembourg income tax, or any Luxembourg capital gains tax on the realised capital appreciation of the assets of the Company nor are dividends paid by the Company liable to any Luxembourg withholding tax. The Company is, however, liable to annual subscription tax in Luxembourg (“taxe d’abonnement”) calculated at the rate of 0.05% of the Net Asset Value of the funds. Furthermore, the Company has sought the benefit of a reduced annual tax rate of 0.01% for Share Classes where the whole of the Share Class is held by institutional investors as provided by Article 174 of the 2010 Law, likely those Shares with Share Class Indicators J,N, S or Z.This tax is payablequarterly on the basis of the net assets of the relevant Funds, calculated at the end of the quarter to which the tax relates. No stamp or other tax will be payable in Luxembourg in connection with the issue of Shares of the Company, except a once and for all tax of EUR 1,239.47 which was paid upon incorporation.
Pursuant to Article 175 of the 2010 Law, subscription tax is not payable on the value of the assets of the Funds represented by investments in other Luxembourg undertakings for collective investment which are themselves subject to the subscription tax.
Subscription tax is calculated by reference to the net assets of the relevant Fund or Share Class at the end of each quarter. Subscription tax will be paid from the tax d’abonnement Specific Additional Cost described in the prospectus. Any difference between the Specific Additional Costs collected and the tax payable will be paid by or credited to the Management Company.
Dividends, interest and capital gains on securities held by the Company may be subject to non-recoverable withholding tax or capital gains tax in the country of origin.
The below Funds had a provision for Indian Capital Gains Tax net of any refunds as at the year end, the amounts are included within the “Provision for foreign tax” on the Statement of Assets and Liabilities;
Fund name Fund currency
Provision at 31 December 2020
(in fund currency)
Asia Opportunity Fund USD 40,152,362Developing Opportunity Fund USD 1,727,249Emerging Leaders Equity Fund USD 6,628,521Emerging Markets Equity Fund USD 494,182Emerging Markets Small Cap Equity Fund USD 103,891Global Opportunity Fund USD 44,527,956
Please refer to the Company’s prospectus for further information on taxation.
Fund name CcyShare Class Ex-Date Pay Date Record Date
Dividend per Share
asset allocation Funds (continued)Global Balanced Income Fund(continued)
AUD AHRM 02/11/2020 05/11/2020 30/10/2020 0.083317AUD AHRM 01/12/2020 04/12/2020 30/11/2020 0.087898EUR AR 02/01/2020 07/01/2020 31/12/2019 0.217815EUR AR 01/04/2020 06/04/2020 31/03/2020 0.190524EUR AR 01/07/2020 06/07/2020 30/06/2020 0.194640EUR AR 01/10/2020 06/10/2020 30/09/2020 0.196056EUR BR 02/01/2020 07/01/2020 31/12/2019 0.205074EUR BR 01/04/2020 06/04/2020 31/03/2020 0.178933EUR BR 01/07/2020 06/07/2020 30/06/2020 0.182344EUR BR 01/10/2020 06/10/2020 30/09/2020 0.183210EUR CR 02/01/2020 07/01/2020 31/12/2019 0.208201EUR CR 01/04/2020 06/04/2020 31/03/2020 0.181797EUR CR 01/07/2020 06/07/2020 30/06/2020 0.185402EUR CR 01/10/2020 06/10/2020 30/09/2020 0.186421EUR IR 02/01/2020 07/01/2020 31/12/2019 0.232963EUR IR 01/04/2020 06/04/2020 31/03/2020 0.204257EUR IR 01/07/2020 06/07/2020 30/06/2020 0.209163EUR IR 01/10/2020 06/10/2020 30/09/2020 0.211187EUR ZR 02/01/2020 07/01/2020 31/12/2019 0.237648EUR ZR 01/04/2020 06/04/2020 31/03/2020 0.208385EUR ZR 01/07/2020 06/07/2020 30/06/2020 0.213412EUR ZR 01/10/2020 06/10/2020 30/09/2020 0.215499GBP ZHR 02/01/2020 07/01/2020 31/12/2019 0.285268GBP ZHR 01/04/2020 06/04/2020 31/03/2020 0.224288GBP ZHR 01/07/2020 06/07/2020 30/06/2020 0.229734GBP ZHR 01/10/2020 06/10/2020 30/09/2020 0.232004USD AHR 02/01/2020 07/01/2020 31/12/2019 0.345131USD AHR 01/04/2020 06/04/2020 31/03/2020 0.277235USD AHR 01/07/2020 06/07/2020 30/06/2020 0.282941USD AHR 01/10/2020 06/10/2020 30/09/2020 0.284373USD AHRM 02/01/2020 07/01/2020 31/12/2019 0.133809USD AHRM 03/02/2020 06/02/2020 31/01/2020 0.118975USD AHRM 02/03/2020 05/03/2020 28/02/2020 0.101098USD AHRM 01/04/2020 06/04/2020 31/03/2020 0.108756USD AHRM 04/05/2020 07/05/2020 30/04/2020 0.105121USD AHRM 02/06/2020 05/06/2020 29/05/2020 0.100567USD AHRM 01/07/2020 06/07/2020 30/06/2020 0.110981USD AHRM 03/08/2020 06/08/2020 31/07/2020 0.106500USD AHRM 01/09/2020 04/09/2020 31/08/2020 0.107188USD AHRM 01/10/2020 06/10/2020 30/09/2020 0.103399USD AHRM 02/11/2020 05/11/2020 30/10/2020 0.102653USD AHRM 01/12/2020 04/12/2020 30/11/2020 0.108244USD CHR 02/01/2020 07/01/2020 31/12/2019 0.341019USD CHR 01/04/2020 06/04/2020 31/03/2020 0.273474USD CHR 01/07/2020 06/07/2020 30/06/2020 0.278620USD CHR 01/10/2020 06/10/2020 30/09/2020 0.279539USD IHR 02/01/2020 07/01/2020 31/12/2019 0.371108USD IHR 01/04/2020 06/04/2020 31/03/2020 0.298786USD IHR 01/07/2020 06/07/2020 30/06/2020 0.305656USD IHR 01/10/2020 06/10/2020 30/09/2020 0.307941
Global Multi-Asset Income Fund EUR AR 02/01/2020 07/01/2020 31/12/2019 0.298614EUR AR 01/04/2020 06/04/2020 31/03/2020 0.370341EUR AR 01/07/2020 06/07/2020 30/06/2020 0.353929EUR AR 01/10/2020 06/10/2020 30/09/2020 0.324665EUR IR 02/01/2020 07/01/2020 31/12/2019 0.301329EUR IR 01/04/2020 06/04/2020 31/03/2020 0.374925EUR IR 01/07/2020 06/07/2020 30/06/2020 0.359434EUR IR 01/10/2020 06/10/2020 30/09/2020 0.330419USD AHR 02/01/2020 07/01/2020 31/12/2019 0.311831USD AHR 01/04/2020 06/04/2020 31/03/2020 0.384087USD AHR 01/07/2020 06/07/2020 30/06/2020 0.376569USD AHR 01/10/2020 06/10/2020 30/09/2020 0.340688
alternative Investment FundsGlobal Multi-Asset Opportunities Fund GBP ZHX 02/01/2020 07/01/2020 31/12/2019 0.041763
GBP ZHX 01/04/2020 06/04/2020 31/03/2020 0.036999GBP ZHX 01/07/2020 06/07/2020 30/06/2020 0.001140GBP ZHX 01/10/2020 06/10/2020 30/09/2020 0.020490
(1) Formerly known as European Champions Fund prior to 20 April 2020.(2) Fund merged into Europe Opportunity Fund on 20 April 2020.(3) Fund merged into European Fixed Income Opportunities Fund on 9 November 2020.

433 Morgan Stanley Investment Funds 31 December 2020
Notes to the financial statements (continued)As at 31 December 2020
7 RaTES oF EXChanGE
The rates of exchange used for translation into US Dollars of Statement of assets and liabilities and Statement of operations and changes in net assets, including securities and foreign currency holdings, as of 31 December 2020 were:
Currency
AED 3.6732 = $1.00ARS 84.0770 = $1.00AUD 1.2935 = $1.00BDT 84.8000 = $1.00BRL 5.1932 = $1.00CAD 1.2724 = $1.00CHF 0.8805 = $1.00CLP 710.9500 = $1.00CNH 6.5014 = $1.00CNY 6.5319 = $1.00COP 3,414.0000 = $1.00CZK 21.3838 = $1.00DKK 6.0645 = $1.00DOP 58.2600 = $1.00EGP 15.7278 = $1.00EUR 0.8150 = $1.00GBP 0.7321 = $1.00HKD 7.7539 = $1.00HUF 296.4000 = $1.00IDR 14,105.0000 = $1.00ILS 3.2173 = $1.00INR 72.9994 = $1.00ITL 1,578.4400 = $1.00JPY 103.0485 = $1.00KES 109.3000 = $1.00KRW 1,088.6600 = $1.00LKR 185.8610 = $1.00MXN 19.8636 = $1.00MYR 4.0225 = $1.00NOK 8.5326 = $1.00NZD 1.3833 = $1.00OMR 0.3851 = $1.00PEN 3.6265 = $1.00PHP 48.0400 = $1.00PKR 160.2100 = $1.00PLN 3.7170 = $1.00QAR 3.6405 = $1.00RON 3.9678 = $1.00RUB 74.0798 = $1.00SAR 3.7515 = $1.00SEK 8.1671 = $1.00SGD 1.3207 = $1.00THB 29.9660 = $1.00TRY 7.4238 = $1.00TWD 28.1200 = $1.00VND 23,221.0000 = $1.00ZAR 14.6520 = $1.00EUR* 0.8774 = $1.00GBP* 0.7797 = $1.00JPY* 106.7535 = $1.00
* Rates of exchange used to translate the Statement of operations and changes in net assets into US Dollars.
8 SoFT CommISSIon aRRanGEmEnTS
To ensure compliance with the MiFID II requirements, from 1January2018theCompanyceasedtopayforresearchservicesusing the soft dollars programme. These costs are instead borne by the Investment Adviser and paid for separately from transaction costs. Transaction costs will therefore be charged on an execution only basis. The only exception to this is the Morgan Stanley Investment Funds – Japanese Equity Fund,where the “unbundling” of research and dealing commissions
isnotpossibleduetothelocalJapaneseregulatoryrequirementsnot allowing for separate payment of research costs.
9 STaTEmEnTS oF PoRTFoLIo ChanGES
A statement giving the changes in the portfolio of investments for the year ended 31 December 2020 is available to shareholders, free of charge, on request from the Company’s registered office, and also from the Paying Agents in countries where the company is registered to sell its Shares.
Please see list of Paying Agents on page 440.
10 oVERDRaFT FaCILITy
The Company has access to a short-term credit extension facility withJ.P.MorganBankLuxembourgS.A.,primarilytofacilitatethe clearance of securities and foreign exchange transactions and in connection with abnormal redemption activity. Should such credit be extended, the Custodian shall be entitled to charge the Funds at rates to be agreed upon from time to time. In addition to any other remedies available, the Custodian shall be entitled to a right of set-off against the property of the Company to satisfy the repayment of, or reimbursement for accrued interest thereon.
There is no cross liability between the funds of the Company therefore the Custodian only has a right of set-off of the pool of assets of the fund that is relative to the overdraft.
11 LIaBILITy oF ThE ComPany
The Board of Directors of the Company shall maintain for each Fund a separate pool of assets. As between Shareholders, each pool of assets is invested for the exclusive benefit of the relevant Fund.
The assets of the Company have been segregated on a Fund by Fund basis with third party creditors only having recourse to the assets of the relevant Fund.
12 BRokER aCCoUnTS
All derivative instruments and time deposits, as listed within the Statements of Investments, on pages 7 to 373, are transacted through third party brokers.
In addition these brokers hold the collateral described in the above mentioned statements as applicable. The Funds are exposed to counter-party risk in respect of all amounts including collateral due to them from such brokers.
Payments of income and settlement proceeds are at the risk of the Funds.
The collateral and margin accounts received and paid by the Fund is listed within the Statements of Investments, on pages 7 to 373.
Margin accounts transactions with brokers are added or deducted from the Net Assets Value.

Morgan Stanley Investment Funds 31 December 2020 434
Notes to the financial statements (continued)As at 31 December 2020
13 TRanSaCTIon CoSTS
For the year ended 31 December 2020, the Fund incurred transaction costs namely, commission and taxes relating to purchases or sales of transferable securities, money market instruments, exchange traded derivatives or other eligible assets They can include the bid-ask spread, fees and commissions paid to agents, advisers, brokers and dealers, transaction related taxes and other market charges.
Fund name Currency
Total Transaction
Costs
% of average
naV
Asia Opportunity Fund USD 4,615,486 0.14Asian Property Fund USD 102,491 0.12Breakout Nations Fund 1 USD 8,918 0.18China A-shares Fund USD 392,892 0.62China Equity Fund USD 9,803 0.08Counterpoint Global Fund 2 USD 4,298 0.06Developing Opportunity Fund USD 252,511 0.12Emerging Europe, Middle East and Africa Equity Fund EUR 123,229 0.17Emerging Leaders Equity Fund USD 666,507 0.16Emerging Markets Equity Fund USD 2,493,158 0.23Emerging Markets Small Cap Equity Fund USD 89,189 0.58Europe Opportunity Fund 3 EUR 715,808 0.14European Property Fund EUR 78,093 0.17Eurozone Equity Alpha Fund 4 EUR 297,186 0.10Global Active Factor Equity Fund USD 1,252 0.01Global Advantage Fund USD 249,305 0.05Global Brands Fund USD 5,114,418 0.03Global Brands Equity Income Fund USD 249,490 0.07Global Endurance Fund USD 9,039 0.11Global Infrastructure Fund USD 979,659 0.10Global Infrastructure Unconstrained Fund USD 5,683 0.10Global Opportunity Fund USD 2,837,616 0.02Global Permanence Fund USD 4,571 0.08Global Property Fund USD 841,132 0.13Global Property Unconstrained Fund USD 2,291 0.06Global Quality Fund USD 382,848 0.02Global Sustain Fund USD 592,358 0.11Indian Equity Fund USD 152,269 0.20International Equity (ex US) Fund USD 119,947 0.16Japanese Equity Fund JPY 18,476,718 0.21Latin American Equity Fund USD 173,492 0.09Sustainable Asian Equity Fund 5 USD 58,119 0.19US Active Factor Equity Fund USD 2,549 0.01US Advantage Fund USD 2,230,941 0.02US Growth Fund USD 678,855 0.02US Insight Fund USD 12,046 0.03US Permanence Fund 6 USD 309 0.01US Property Fund USD 46,617 0.05Emerging Markets Corporate Debt Fund USD – 0.00Emerging Markets Debt Fund USD – 0.00Emerging Markets Domestic Debt Fund USD – 0.00Emerging Markets Fixed Income Opportunities Fund USD – 0.00Euro Bond Fund EUR 27,834 0.00Euro Corporate Bond Fund EUR 111,889 0.00Euro Corporate Bond – Duration Hedged Fund EUR 24,541 0.01Euro Strategic Bond Fund EUR 22,705 0.00European Fixed Income Opportunities Fund EUR 2,500 0.00European High Yield Bond Fund EUR 1,909 0.00Global Asset Backed Securities Fund USD 85,669 0.01Global Bond Fund USD 15,090 0.00Global Buy and Hold 2020 Bond Fund 7 EUR – 0.00Global Convertible Bond Fund USD 12,168 0.00Global Credit Fund USD 6,515 0.01Global Fixed Income Opportunities Fund USD 88,230 0.00Global High Yield Bond Fund USD – 0.00Short Maturity Euro Bond Fund EUR 103,272 0.01Sustainable Euro Corporate Bond Fund 8 EUR 133 0.00
Fund name Currency
Total Transaction
Costs
% of average
naV
Sustainable Euro Strategic Bond Fund 9 EUR 213 0.00US Dollar Corporate Bond Fund USD 9,573 0.01US Dollar High Yield Bond Fund USD – 0.00US Dollar Short Duration Bond Fund USD 3,903 0.00US Dollar Short Duration High Yield Bond Fund USD – 0.00Global Balanced Defensive Fund EUR 30,515 0.05Global Balanced Fund EUR 679,552 0.08Global Balanced Income Fund EUR 312,280 0.09Global Balanced Risk Control Fund of Funds EUR 372,445 0.01Global Balanced Sustainable Fund 10 EUR 6,430 0.03Global Multi-Asset Income Fund EUR 5,597 0.04Global Multi-Asset Opportunities Fund EUR 58,590 0.12Multi-Asset Risk Control Fund USD 5,827 0.06Real Assets Fund USD 7,841 0.08Liquid Alpha Capture Fund USD 24,631 0.04
1 Fund closed operations on 16 October 2020. 2 Formerly known as Global Counterpoint Fund prior to 15 May 2020. 3 Formerly known as European Champions Fund prior to 20 April 2020. 4 Fund merged into Europe Opportunity Fund on 20 April 2020. 5 Formerly known as Asian Equity Fund prior to 31 December 2020. 6 Fund commenced operations on 30 October 2020. 7 Fund merged into European Fixed Income Opportunities Fund on 9 November 2020. 8 Fund commenced operations on 31 July 2020. 9 Fund commenced operations on 31 July 2020.10 Fund commenced operations on 30 June 2020.
There are no brokerage fees charged separately for transactions on fixed income instruments and derivatives (except for futures). The transaction costs are included in the transaction price, which is known as “marked up”.
14 CRoSS-InVESTmEnT BETWEEn SUB-FUnDS
The Company is permitted to engage in cross investment between Funds within the umbrella structure. The following information pertains to the cross-investment between Funds within the Company during the year.
As at 31 December 2020, the following named Sub-Funds held shares of other Funds of the Company:
Investmentmarket Value
(in USD)% of
net assets
European Fixed Income opportunities FundMorgan Stanley Investment Funds – Global Asset Backed Securities Fund 11,871,000 4.63
11,871,000 4.63
US Dollar Corporate Bond FundMorgan Stanley Investment Funds – Emerging Markets Corporate Debt Fund 220,998 0.07
220,998 0.07
Global Balanced Defensive FundMorgan Stanley Investment Funds – Emerging Markets Corporate Debt Fund 1,821,104 2.49Morgan Stanley Investment Funds – Global Infrastructure Fund 363,147 0.50
2,184,251 2.99
Global Balanced FundMorgan Stanley Investment Funds – Emerging Markets Corporate Debt Fund 26,456,013 1.94Morgan Stanley Investment Funds – Global Infrastructure Fund 6,235,594 0.46
32,691,607 2.40
Global Balanced Income FundMorgan Stanley Investment Funds – Emerging Markets Corporate Debt Fund 7,091,326 2.00Morgan Stanley Investment Funds – Global Infrastructure Fund 1,786,115 0.50
8,877,441 2.50

435 Morgan Stanley Investment Funds 31 December 2020
Notes to the financial statements (continued)As at 31 December 2020
Investmentmarket Value
(in USD)% of
net assets
Global Balanced Risk Control Fund of FundsMorgan Stanley Investment Funds – Asia Opportunity Fund 74,737,805 1.52Morgan Stanley Investment Funds – Emerging Leaders Equity Fund 50,386,123 1.03Morgan Stanley Investment Funds – Emerging Markets Corporate Debt Fund 147,304,872 3.00Morgan Stanley Investment Funds – Euro Bond Fund 220,550,708 4.49Morgan Stanley Investment Funds – Euro Corporate Bond Fund 441,279,328 8.99Morgan Stanley Investment Funds – Euro Strategic Bond Fund 218,836,136 4.46Morgan Stanley Investment Funds – Europe Opportunity Fund 51,708,181 1.05Morgan Stanley Investment Funds – European High Yield Bond Fund 123,625,246 2.52Morgan Stanley Investment Funds – Global Bond Fund 443,895,047 9.05Morgan Stanley Investment Funds – Global Fixed Income Opportunities Fund 220,071,175 4.48Morgan Stanley Investment Funds – Global High Yield Bond Fund 196,497,775 4.00Morgan Stanley Investment Funds – Global Infrastructure Fund 24,960,100 0.51Morgan Stanley Investment Funds – US Advantage Fund 308,116,906 6.28Morgan Stanley Investment Funds – US Dollar Corporate Bond Fund 196,072,939 4.00Morgan Stanley Investment Funds – US Growth Fund 160,596,303 3.27
2,878,638,644 58.65
Global multi-asset Income FundMorgan Stanley Investment Funds – Emerging Markets Debt Fund 899,700 4.74Morgan Stanley Investment Funds – Global High Yield Bond Fund 872,818 4.60
1,772,518 9.34
15 SWInG PRICInG
To the extent that the Management Company consider that it is in the best interests of Shareholders, taking into account factors including the prevailing market conditions, the level of subscriptions and redemptions in a particular Fund and the size of the Fund, the Management Company may decide to adjust the Net Asset Value of a Fund to reflect the estimated dealing spreads, costs and charges (“Swing Factor”) to be incurred by the Fund in liquidating or purchasing investments to satisfy the net transactions received in respect of a particular day.
This Swing factor process is applicable to all active Funds during the year except for the Global Balanced Risk Control Fund of Funds.
Under normal market circumstances, the Swing Factor shall not exceed 2% of the Net Asset Value of the relevant Fund on the relevant day. However, the Directors may decide to temporarily increase this limit in exceptional circumstances (e.g. stressed or dislocated markets resulting in increased trading costs beyond the 2% cap) to protect Shareholders’ interests, it is not possible to accurately predict whether it will occur at any future point in time and consequently how frequently it will need to be made. When net subscriptions in a Fund exceed a certain threshold on a given day, the Net Asset Value is adjusted upwards by the Swing Factor. Similarly, when net redemptions in a Fund exceed a certain threshold on a given day, the Net Asset Value of the Fund is adjusted downwards by the Swing Factor.
As at 31 December 2020, the net asset value of the Liquid Alpha Capture Fund was swung due to net investor outflows exceeding the swing pricing threshold.
All funds were swung during the year with the exception of the following sub-funds Breakout Nations Fund, China Equity Fund, Counterpoint Global Fund, Eurozone Equity Alpha
Fund, Global Infrastructure Unconstrained Fund, Global Property Unconstrained Fund, US Permanence Fund, Global Buy and Hold 2020 Bond Fund, Sustainable Euro Corporate Bond Fund, Global Balanced Risk Control Fund of Funds, Global Balanced Sustainable Fund and Multi-Asset Risk Control Fund.
The official Net Asset Value per Share as at year-end, disclosed in the Statement of share and net assets statistics, therefore includes a Swing Pricing adjustment, which is not recognised in the Statement of assets and liabilities and the Statement of operations and changes in net assets.
16 InDEmnIFICaTIonS
The Company has arrangements in place for the indemnification of the members of its Board of Directors, and of its service providers (the “Indemnified Parties”) in certain circumstances, which exclude the Indemnified Parties’ own negligence, wilful default, or fraud. The Company’s service providers include the Management Company, the Investment Advisers, the Sub-Investment Advisers, the Custodian, the Administrator and Paying Agent, the Distributor and the Registrar and Transfer Agent.
17 DIRECToRS’ REmUnERaTIon
The Directors of the Company are entitled to remuneration at an annual rate of EUR 65,000 per director. In addition the appointed Chairman receives EUR 10,000 per annum.
The Administration charge is utilised to pay the remuneration of the Directors including reasonable out-of-pocket expenses. Directors fees remain ultimately subject to approval by the Company’s shareholders.
18 EPIDEmICS/PanDEmICS/oUTBREakS RISk
The performance of the Shares depends on the performance of the investments of the Funds, which could also be adversely affected by the effects of epidemics, pandemics or outbreaks of communicable diseases. In response to intensifying efforts to contain epidemics, pandemics or outbreaks of communicable diseases, governments around the world may take a number of actions, such as prohibiting residents’ freedom of movement, encouraging or ordering employees to work remotely from home, and banning public activities and events, among others. Any prolonged disruption of businesses could negatively impact financial conditions. The performance of the Shares could be adversely affected to the extent that any of these epidemics, pandemics or outbreaks harms the economy in general.
19 SUBSEqUEnT EVEnTS
• With effect 24 March 2021, Morgan Stanley Investment Funds–SaudiEquityFundwaslaunched.

Morgan Stanley Investment Funds 31 December 2020 436
Independent Auditor’s Report (continued)As at 31 December 2020Independent Auditor’s Report
OTHER INFORMATION
To the Shareholders of Morgan Stanley Investment Funds 6B, route de Trèves L-2633 Senningerberg Luxembourg
Opinion
We have audited the financial statements of Morgan Stanley Investment Funds (the “SICAV”) and of each of its Funds, which comprise the statement of assets and liabilities and the schedule of investments as at 31 December 2020, and the statement of operations and changes in net assets for the year then ended, and the notes to the financial statements, including a summary of significant accounting policies.
In our opinion, the accompanying financial statements give a true and fair view of the financial position of the SICAV and of each of its Funds as at 31 December 2020, and of the results of their operations and changes in their net assets for the year then ended in accordance with Luxembourg legal and regulatory requirements relating to the preparation and presentation of the financial statements.
Basis for Opinion
WeconductedourauditinaccordancewiththeLawof23July2016on the audit profession (the “Law of 23 July 2016”) and withInternational Standards on Auditing (“ISAs”) as adopted for Luxembourg by the “Commission de Surveillance du Secteur Financier” (“CSSF”).OurresponsibilitiesundertheLawof23July2016andISAsas adopted for Luxembourg by the CSSF are further described in the “responsibilities of the “réviseur d’entreprises agréé” for the audit of the financial statements” section of our report. We are also independent of the SICAV in accordance with the International Code of Ethics for Professional Accountants, including International Independence Standards, issued by the International Ethics Standards Board for Accountants (“IESBA Code”) as adopted for Luxembourg by the CSSF together with the ethical requirements that are relevant to our audit of the financial statements, and have fulfilled our other ethical responsibilities under those ethical requirements. We believe that the audit evidence we have obtained is sufficient and appropriate to provide a basis for our opinion.
Other information
The Board of Directors of the SICAV is responsible for the other information. The other information comprises the information included in the annual report but does not include the financial statements and our report of the “réviseur d’entreprises agréé” thereon.
Our opinion on the financial statements does not cover the otherinformation and we do not express any form of assurance conclusion thereon.
In connection with our audit of the financial statements, our responsibility is to read the other information and, in doing so, consider whether the other information is materially inconsistent with the financial statements or our knowledge obtained in the audit or otherwise appears to be materially misstated. If, based on the work we have performed, we conclude that there is a material misstatement of this other information, we are required to report this fact. We have nothing to report in this regard.
Responsibilities of the Board of Directors of the SICAV for the financial statements
The Board of Directors of the SICAV is responsible for the preparation and fair presentation of these financial statements in accordance with Luxembourg legal and regulatory requirements relating to the preparation and presentation of the financial statements, and for such internal control as the Board of Directors of the SICAV determines is necessary to enable the preparation of financial statements that are free from material misstatement, whether due to fraud or error.
In preparing the financial statements, the Board of Directors of the SICAV is responsible for assessing the SICAV and each of its Funds’ ability to continue as a going concern, disclosing, as applicable, matters related to going concern and using the going concern basis of accounting unless the Board of Directors of the SICAV either intends to liquidate the SICAV or any of its Funds’ or to cease operations, or has no realistic alternative but to do so.
Responsibilities of the “réviseur d’entreprises agréé” for the audit of the financial statements
Ourobjectivesaretoobtainreasonableassuranceaboutwhetherthefinancial statements as a whole are free from material misstatement, whether due to fraud or error, and to issue a report of the “réviseur d’entreprises agréé” that includes our opinion. Reasonable assurance is a high level of assurance, but is not a guarantee that an audit conductedinaccordancewiththeLawof23July2016andwithISAsas adopted for Luxembourg by the CSSF will always detect a material misstatement when it exists. Misstatements can arise from fraud or error and are considered material if, individually or in the aggregate, they could reasonably be expected to influence the economic decisions of users taken on the basis of these financial statements.
AspartofanauditinaccordancewiththeLawof23July2016andwith ISAs as adopted for Luxembourg by the CSSF, we exercise professional judgment and maintain professional skepticism throughout the audit. We also:
• Identify and assess the risks of material misstatement of thefinancial statements, whether due to fraud or error, design and perform audit procedures responsive to those risks, and obtain audit evidence that is sufficient and appropriate to provide a basis for our opinion. The risk of not detecting a material misstatement resulting from fraud is higher than for one

437 Morgan Stanley Investment Funds 31 December 2020
Independent Auditor’s Report (continued)As at 31 December 2020
resulting from error, as fraud may involve collusion, forgery, intentional omissions, misrepresentations, or the override of internal control.
• Obtain an understanding of internal control relevant to theaudit in order to design audit procedures that are appropriatein the circumstances, but not for the purpose of expressingan opinion on the effectiveness of the SICAV’s internal control.
• Evaluatetheappropriatenessofaccountingpoliciesusedandthereasonableness of accounting estimates and related disclosuresmade by the Board of Directors of the SICAV.
• Conclude on the appropriateness of Board ofDirectors of theSICAV’s use of the going concern basis of accounting and, basedon the audit evidence obtained, whether a material uncertaintyexists related to events or conditions that may cast significantdoubt on the SICAV or any of its Funds’ ability to continueas a going concern. If we conclude that a material uncertaintyexists, we are required to draw attention in our report of the“réviseur d’entreprises agréé” to the related disclosures in thefinancial statements or, if such disclosures are inadequate,tomodifyouropinion.Ourconclusionsarebasedontheauditevidence obtained up to the date of our report of the “réviseurd’entreprises agréé”. However, future events or conditions maycause the SICAV or any of its Funds to cease to continueas a going concern.
• Evaluate theoverallpresentation, structure andcontentof thefinancial statements, including the disclosures, and whether thefinancial statements represent the underlying transactions andevents in a manner that achieves fair presentation.
We communicate with those charged with governance regarding, among other matters, the planned scope and timing of the audit and significant audit findings, including any significant deficiencies in internal control that we identify during our audit.
ERNST&YOUNG Société anonyme Cabinet de révision agréé
Kerry Nichol
Luxembourg, 7 April 2021

Morgan Stanley Investment Funds 31 December 2020 438
Directors and service providers (continued)As at 31 December 2020
DIRECToRS
Carine FeipelIndependent Non-executive DirectorLuxembourg
William JonesIndependent Non-executive DirectorLuxembourg
henry kellyIndependent Non-executive DirectorLuxembourg
andrew mackNon-executive DirectorUnited Kingdom
Diane hosieManaging DirectorMorgan Stanley InvestmentManagement LimitedUnited Kingdom
Susanne Van DootinghIndependent Non-executive DirectorBelgium
Zoe Parish*Managing DirectorMorgan Stanley Investment Management LimitedUnited Kingdom
manaGEmEnT ComPanymSIm Fund management (Ireland) LimitedTheObservatory 7-11SirJohnRogerson’sQuayDublin 2D02 VC42 Ireland
DIRECToRS oF ThE manaGEmEnT ComPany
andrew mackNon-executive Director United Kingdom
Elaine keenanManaging Director Morgan Stanley InvestmentManagement LimitedIreland
Liam miley**Non-executive DirectorIreland
Liam manahan***Non-executive DirectorIreland
Diane hosieManaging DirectorMorgan Stanley InvestmentManagement LimitedUnited Kingdom
Eimear CowheyNon-executive DirectorIreland
Ruairi o’healai****Managing DirectorMorgan Stanley Investment Management LimitedUnited Kingdom
Directors and service providers
* Appointed on 27 March 2020.** Appointed on 10 August 2020.*** Resigned on 12 August 2020.**** Appointed on 11 December 2020.
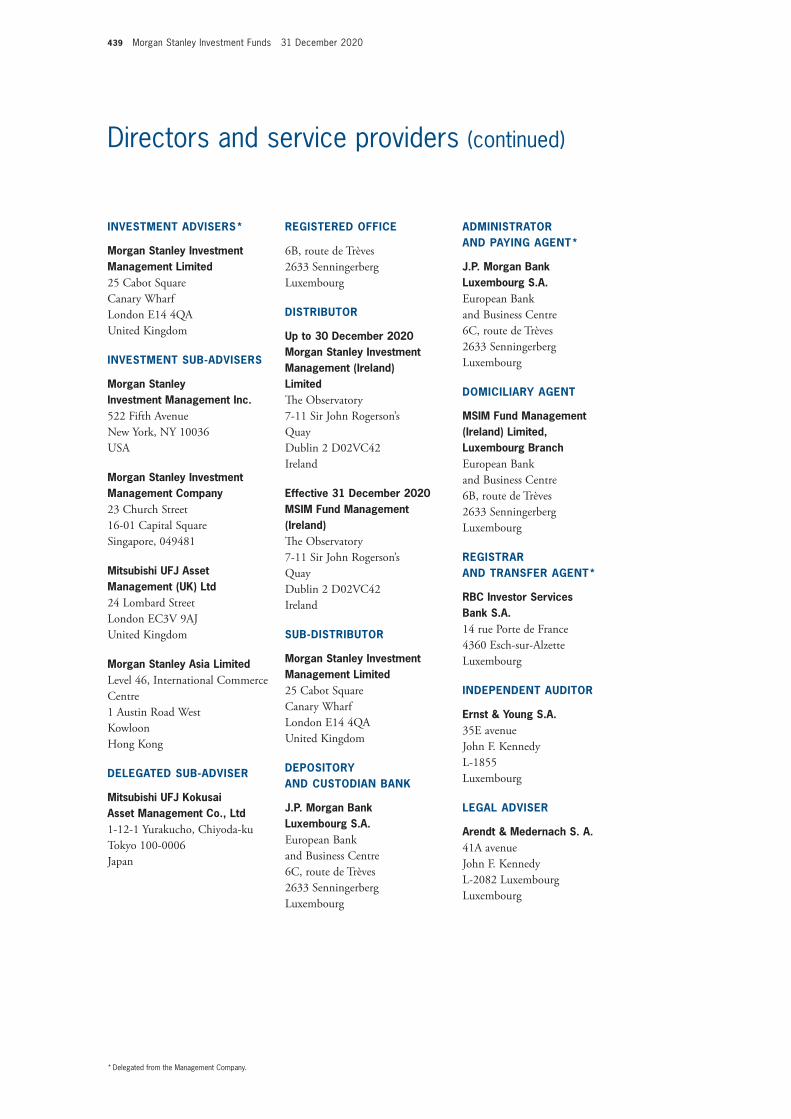
439 Morgan Stanley Investment Funds 31 December 2020
Directors and service providers (continued)As at 31 December 2020
InVESTmEnT aDVISERS*
morgan Stanley Investmentmanagement Limited25 Cabot SquareCanary WharfLondonE144QAUnited Kingdom
InVESTmEnT SUB-aDVISERS
morgan StanleyInvestment management Inc.522 Fifth AvenueNew York, NY 10036USA
morgan Stanley Investmentmanagement Company23 Church Street16-01 Capital SquareSingapore, 049481
mitsubishi UFJ asset management (Uk) Ltd24 Lombard StreetLondonEC3V9AJUnited Kingdom
morgan Stanley asia LimitedLevel 46, International Commerce Centre1 Austin Road WestKowloonHong Kong
DELEGaTED SUB-aDVISER
mitsubishi UFJ kokusai asset management Co., Ltd1-12-1 Yurakucho, Chiyoda-ku Tokyo 100-0006Japan
REGISTERED oFFICE
6B, route de Trèves2633 SenningerbergLuxembourg
DISTRIBUToR
Up to 30 December 2020morgan Stanley Investmentmanagement (Ireland)LimitedTheObservatory7-11SirJohnRogerson’s QuayDublin 2 D02VC42Ireland
Effective 31 December 2020mSIm Fund management (Ireland)TheObservatory7-11SirJohnRogerson’s QuayDublin 2 D02VC42Ireland
SUB-DISTRIBUToR
morgan Stanley Investment management Limited25 Cabot SquareCanary WharfLondonE144QAUnited Kingdom
DEPoSIToRy anD CUSToDIan Bank
J.P. morgan BankLuxembourg S.a.European Bankand Business Centre6C, route de Trèves2633 SenningerbergLuxembourg
aDmInISTRaToR anD PayInG aGEnT*
J.P. morgan BankLuxembourg S.a.European Bankand Business Centre6C, route de Trèves2633 SenningerbergLuxembourg
DomICILIaRy aGEnT
mSIm Fund management (Ireland) Limited, Luxembourg BranchEuropean Bank and Business Centre6B, route de Trèves2633 SenningerbergLuxembourg
REGISTRaR anD TRanSFER aGEnT*
RBC Investor ServicesBank S.a.14 rue Porte de France4360 Esch-sur-AlzetteLuxembourg
InDEPEnDEnT aUDIToR
Ernst & young S.a.35E avenueJohnF.KennedyL-1855Luxembourg
LEGaL aDVISER
arendt & medernach S. a.41A avenue JohnF.KennedyL-2082 Luxembourg Luxembourg
* Delegated from the Management Company.
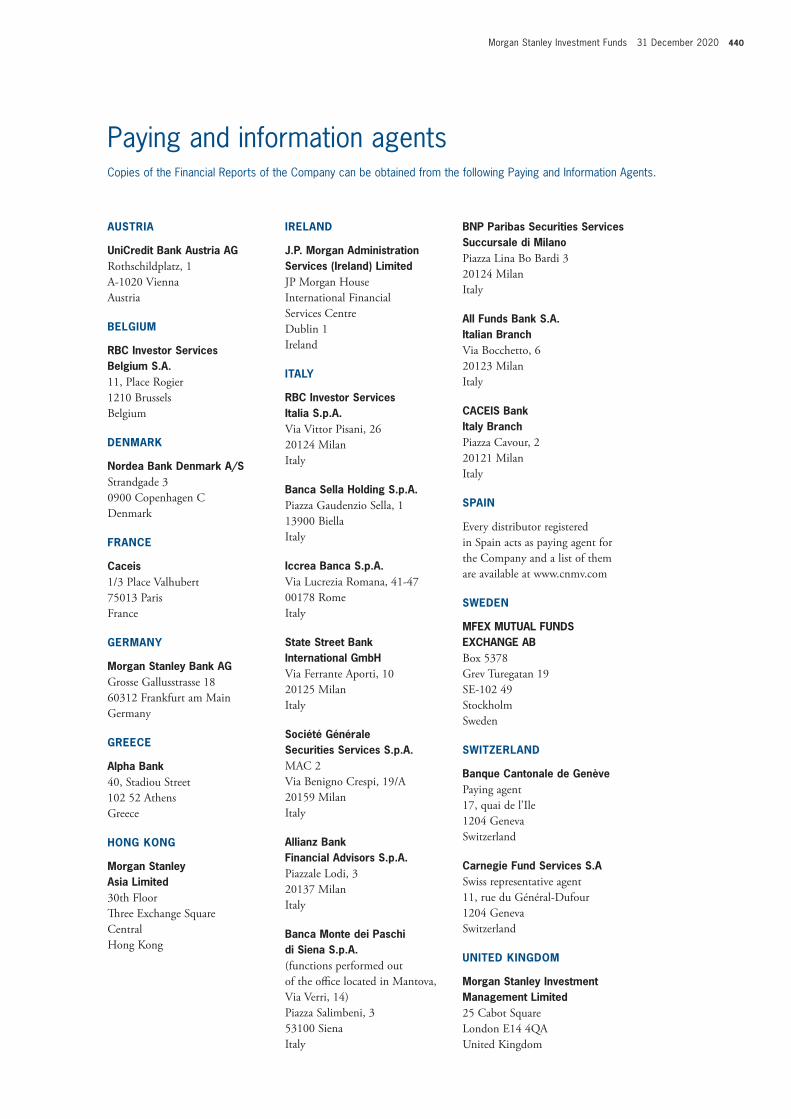
Morgan Stanley Investment Funds 31 December 2020 440
Paying and information agents (continued)As at 31 December 2020
aUSTRIa
UniCredit Bank austria aGRothschildplatz, 1A-1020 ViennaAustria
BELGIUm
RBC Investor Services Belgium S.a.11, Place Rogier1210 BrusselsBelgium
DEnmaRk
nordea Bank Denmark a/SStrandgade 30900 Copenhagen CDenmark
FRanCE
Caceis1/3 Place Valhubert75013 ParisFrance
GERmany
morgan Stanley Bank aGGrosse Gallusstrasse 1860312 Frankfurt am MainGermany
GREECE
alpha Bank40, Stadiou Street102 52 AthensGreece
honG konG
morgan Stanley asia Limited30th FloorThree Exchange SquareCentralHong Kong
IRELanD
J.P. morgan administration Services (Ireland) LimitedJPMorganHouseInternational Financial Services CentreDublin 1Ireland
ITaLy
RBC Investor Services Italia S.p.a.Via Vittor Pisani, 2620124 MilanItaly
Banca Sella holding S.p.a.Piazza Gaudenzio Sella, 113900 BiellaItaly
Iccrea Banca S.p.a.Via Lucrezia Romana, 41-4700178 RomeItaly
State Street Bank International GmbhVia Ferrante Aporti, 1020125 MilanItaly
Société Générale Securities Services S.p.a.MAC 2Via Benigno Crespi, 19/A20159 MilanItaly
allianz BankFinancial advisors S.p.a.Piazzale Lodi, 320137 MilanItaly
Banca monte dei Paschi di Siena S.p.a.(functions performed out of the office located in Mantova, Via Verri, 14) Piazza Salimbeni, 3 53100 Siena Italy
BnP Paribas Securities Services Succursale di milanoPiazza Lina Bo Bardi 3 20124 MilanItaly
all Funds Bank S.a. Italian Branch Via Bocchetto, 6 20123 MilanItaly
CaCEIS Bank Italy BranchPiazza Cavour, 220121 MilanItaly
SPaIn
Every distributor registered in Spain acts as paying agent for the Company and a list of them are available at www.cnmv.com
SWEDEn
mFEX mUTUaL FUnDS EXChanGE aBBox 5378Grev Turegatan 19SE-102 49StockholmSweden
SWITZERLanD
Banque Cantonale de GenèvePaying agent17, quai de l’Ile1204 GenevaSwitzerland
Carnegie Fund Services S.aSwiss representative agent11, rue du Général-Dufour1204 GenevaSwitzerland
UnITED kInGDom
morgan Stanley Investment management Limited25 Cabot SquareLondonE144QAUnited Kingdom
Paying and information agentsCopies of the Financial Reports of the Company can be obtained from the following Paying and Information Agents.

441 Morgan Stanley Investment Funds 31 December 2020
Total Expense Ratio (%)
Fund Name
31 December 2020
31 December 2019
Emerging Leaders Equity Fund CH – EUR 2.93 2.93Emerging Leaders Equity Fund I – USD 0.99 0.99Emerging Leaders Equity Fund IH – EUR 1.03 1.03Emerging Leaders Equity Fund N – USD 0.16 0.161
Emerging Leaders Equity Fund Z – USD 0.95 0.95Emerging Leaders Equity Fund ZH – EUR 0.99 0.99Emerging Leaders Equity Fund ZH – GBP 0.99 0.99Emerging Leaders Equity Fund ZH3 BRL 0.991 –Emerging Markets Equity Fund A – USD 1.89 1.89Emerging Markets Equity Fund B – USD 2.89 2.89Emerging Markets Equity Fund C – USD 2.69 2.69Emerging Markets Equity Fund I – USD 1.34 1.34Emerging Markets Equity Fund N – USD 0.16 0.16Emerging Markets Equity Fund Z – USD 0.95 0.95Emerging Markets Small Cap Equity Fund A – USD 2.69 2.69Emerging Markets Small Cap Equity Fund AH – EUR 2.73 2.73Emerging Markets Small Cap Equity Fund AX – USD 2.69 2.69Emerging Markets Small Cap Equity Fund B – USD 3.69 3.69Emerging Markets Small Cap Equity Fund BH – EUR 3.73 3.73Emerging Markets Small Cap Equity Fund C – USD 3.29 3.29Emerging Markets Small Cap Equity Fund CH – EUR 3.33 3.33Emerging Markets Small Cap Equity Fund I – USD 1.44 1.44Emerging Markets Small Cap Equity Fund Z – USD 1.40 1.40Europe Opportunity Fund A – EUR4 1.74 1.74Europe Opportunity Fund AH – USD4 1.78 1.78Europe Opportunity Fund AR – EUR4 1.74 1.741
Europe Opportunity Fund B – EUR4 2.74 2.74Europe Opportunity Fund BR – EUR4 2.74 2.741
Europe Opportunity Fund C – EUR4 2.44 2.44Europe Opportunity Fund CR – EUR4 2.44 2.441
Europe Opportunity Fund I – EUR4 0.94 0.94Europe Opportunity Fund IH – USD4 0.98 0.981
Europe Opportunity Fund N – EUR4 0.111 –Europe Opportunity Fund Z – EUR4 0.90 0.90European Property Fund A – EUR 1.64 1.64European Property Fund AH – USD 1.68 1.68European Property Fund AX – EUR 1.64 1.64European Property Fund B – EUR 2.64 2.64European Property Fund C – EUR 2.44 2.44European Property Fund I – EUR 0.94 0.94European Property Fund Z – EUR 0.90 0.90Eurozone Equity Alpha Fund A – EUR5 – 1.64Eurozone Equity Alpha Fund AH – USD5 – 1.68Eurozone Equity Alpha Fund AR – EUR5 – 1.64Eurozone Equity Alpha Fund B – EUR5 – 2.64Eurozone Equity Alpha Fund BR – EUR5 – 2.64Eurozone Equity Alpha Fund C – EUR5 – 2.42Eurozone Equity Alpha Fund CR – EUR5 – 2.44Eurozone Equity Alpha Fund I – EUR5 – 0.94Eurozone Equity Alpha Fund IH – USD5 – 0.98Eurozone Equity Alpha Fund Z – EUR5 – 0.90Global Active Factor Equity Fund A – USD 1.59 1.59Global Active Factor Equity Fund I – USD 0.74 0.74Global Active Factor Equity Fund Z – USD 0.70 0.70Global Advantage Fund A – USD 1.84 1.84Global Advantage Fund AH – EUR 1.88 1.881
Global Advantage Fund B – USD 2.84 2.84Global Advantage Fund BH – EUR 2.88 2.881
Global Advantage Fund C – USD 2.64 2.64Global Advantage Fund CH – EUR 2.68 2.671
Global Advantage Fund I – USD 0.94 0.94Global Advantage Fund Z – USD 0.90 0.90Global Advantage Fund ZH – EUR 0.94 0.941
Global Brands Fund A – USD 1.64 1.64Global Brands Fund AH – CHF 1.68 1.68Global Brands Fund AH – EUR 1.68 1.68
Total Expense Ratio (%)
Fund Name
31 December 2020
31 December 2019
Asia Opportunity Fund A – USD 1.89 1.89Asia Opportunity Fund AH – EUR 1.93 1.93Asia Opportunity Fund B – USD 2.89 2.89Asia Opportunity Fund BH – EUR 2.93 2.93Asia Opportunity Fund C – USD 2.69 2.69Asia Opportunity Fund CH – EUR 2.73 2.73Asia Opportunity Fund F – USD 1.04 1.04Asia Opportunity Fund I – USD 0.99 0.99Asia Opportunity Fund IH – EUR 1.03 1.051
Asia Opportunity Fund IH – GBP 1.03 1.031
Asia Opportunity Fund J – USD 0.85 0.85Asia Opportunity Fund J – GBP 0.851 –Asia Opportunity Fund JH – GBP 0.891 –Asia Opportunity Fund N – USD 0.16 0.151
Asia Opportunity Fund S – USD 0.851 –Asia Opportunity Fund Z – USD 0.95 0.95Asia Opportunity Fund ZH – EUR 0.99 0.99Asia Opportunity Fund ZH – GBP 0.99 0.99Asian Property Fund A – USD 1.64 1.64Asian Property Fund B – USD 2.64 2.64Asian Property Fund C – USD 2.44 2.44Asian Property Fund F – USD 0.99 0.99Asian Property Fund I – USD 0.94 0.94Asian Property Fund IX – USD 0.94 0.94Asian Property Fund Z – USD 0.90 0.90Breakout Nations Fund A – USD2 – 1.76*Breakout Nations Fund AH – EUR2 – 1.80*Breakout Nations Fund B – USD2 – 2.76*Breakout Nations Fund BH – EUR2 – 2.80*Breakout Nations Fund C – USD2 – 2.46*Breakout Nations Fund CH – EUR2 – 2.50*Breakout Nations Fund Z – USD2 – 0.91*China A-shares Fund A – USD 2.04 2.04China A-shares Fund AH – EUR 2.08 2.08China A-shares Fund B – USD 3.04 3.04China A-shares Fund BH – EUR 3.08 3.08China A-shares Fund C – USD 2.74 2.74China A-shares Fund CH – EUR 2.78 2.78China A-shares Fund I – USD 0.99 0.99China A-shares Fund Z – USD 0.95 0.95China Equity Fund A – USD 2.04 2.041
China Equity Fund B – USD 3.04 3.041
China Equity Fund C – USD 2.74 2.741
China Equity Fund I – USD 0.99 0.991
China Equity Fund Z – USD 0.95 0.951
Counterpoint Global Fund A – USD3 1.84 1.84Counterpoint Global Fund I – USD3 0.99 0.99Counterpoint Global Fund Z – USD3 0.95 0.95Developing Opportunity Fund A – USD 2.29 2.291
Developing Opportunity Fund B – USD 3.29 3.291
Developing Opportunity Fund C – USD 2.94 2.941
Developing Opportunity Fund I – USD 1.04 1.041
Developing Opportunity Fund J – USD 0.801 –Developing Opportunity Fund N – USD 0.161 –Developing Opportunity Fund Z – USD 1.00 1.001
Emerging Europe, Middle East and Africa Equity Fund A – EUR 1.89 1.89Emerging Europe, Middle East and Africa Equity Fund AX – EUR 1.89 1.88Emerging Europe, Middle East and Africa Equity Fund B – EUR 2.89 2.89Emerging Europe, Middle East and Africa Equity Fund C – EUR 2.69 2.69Emerging Europe, Middle East and Africa Equity Fund I – EUR 1.34 1.34Emerging Europe, Middle East and Africa Equity Fund Z – EUR 1.30 1.30Emerging Leaders Equity Fund A – USD 2.19 2.19Emerging Leaders Equity Fund AH – EUR 2.23 2.23Emerging Leaders Equity Fund B – USD 3.19 3.19Emerging Leaders Equity Fund BH – EUR 3.23 3.23Emerging Leaders Equity Fund C – USD 2.89 2.89
The following figures show the total expenses charged to each Class of each Fund open as at 31 December 2020, calculated net of any fee waivers and expressed as a percentage of average net assets for the year. For further information in relation to the expenses charged to the Funds, please refer to pages 388 to 402. For details of changes to the Management Fee during the year, please refer to note 4. Reported expense ratios may differ from the on-going charges figures due to accounting adjustments and/or significant movement in the total net assets for each Share Class within the year.
Teksty do App zdecydowane z Zuzią, że ida z długimi tekstami. :-) // 07.03.2017
Appendix 1: Fund expense ratios (unaudited)As at 31 December 2020

Morgan Stanley Investment Funds 31 December 2020 442
Teksty do App zdecydowane z Zuzią, że ida z długimi tekstami. :-) // 07.03.2017
Appendix 1: Fund expense ratios (unaudited) (continued)As at 31 December 2020
Total Expense Ratio (%)
Fund Name
31 December 2020
31 December 2019
Global Permanence Fund I – USD 0.94 0.941
Global Permanence Fund Z – USD 0.90 0.901
Global Property Fund A – USD 1.74 1.74Global Property Fund AH – EUR 1.78 1.78Global Property Fund B – USD 2.74 2.74Global Property Fund BH – EUR 2.78 2.78Global Property Fund C – USD 2.54 2.54Global Property Fund CH – EUR 2.58 2.58Global Property Fund I – USD 1.04 1.04Global Property Fund IX – USD 1.04 1.04Global Property Fund Z – USD 1.00 1.00Global Property Fund ZH – EUR 1.04 1.04Global Property Fund ZX – USD 1.00 1.00Global Property Unconstrained Fund A – USD 1.74 1.73Global Property Unconstrained Fund Z – USD 0.90 0.90Global Quality Fund A – USD 1.84 1.84Global Quality Fund AH – CHF 1.88 1.88Global Quality Fund AH – EUR 1.88 1.88Global Quality Fund AH – SGD 1.88 1.88Global Quality Fund AX – USD 1.84 1.84Global Quality Fund B – USD 2.84 2.84Global Quality Fund BH – EUR 2.88 2.88Global Quality Fund C – USD 2.64 2.64Global Quality Fund CH – EUR 2.68 2.68Global Quality Fund I – USD 0.94 0.94Global Quality Fund Z – USD 0.90 0.90Global Quality Fund ZH – CHF 0.94 0.94Global Quality Fund ZH – EUR 0.94 0.94Global Quality Fund ZX – USD 0.90 0.90Global Sustain Fund A – USD 1.74 1.74Global Sustain Fund AH – EUR 1.78 1.78Global Sustain Fund B – USD 2.74 2.741
Global Sustain Fund BH – EUR 2.78 2.781
Global Sustain Fund C – USD 2.54 2.531
Global Sustain Fund CH – EUR 2.58 2.571
Global Sustain Fund I – USD 0.84 0.84Global Sustain Fund IH – EUR 0.881 –Global Sustain Fund IH – GBP 0.88 0.881
Global Sustain Fund J – USD 0.65 0.65Global Sustain Fund JH – GBP 0.69 0.691
Global Sustain Fund Z – USD 0.80 0.80Global Sustain Fund ZH – CHF 0.841 –Global Sustain Fund ZH – EUR 0.841 –Global Sustain Fund ZH – GBP 0.841 –Global Sustain Fund ZX – USD 0.80 0.791
Indian Equity Fund A – USD 1.89 1.89Indian Equity Fund B – USD 2.89 2.89Indian Equity Fund C – USD 2.69 2.69Indian Equity Fund I – USD 0.99 0.99Indian Equity Fund N – USD –+ 0.16Indian Equity Fund Z – USD 0.95 0.95International Equity ex US Fund A – USD 1.84 1.84International Equity ex US Fund C – USD 2.64 2.64International Equity ex US Fund I – USD 0.94 0.94International Equity ex US Fund Z – USD 0.90 0.90Japanese Equity Fund A – JPY 1.64 1.64Japanese Equity Fund AH – USD 1.68 1.68Japanese Equity Fund B – JPY 2.64 2.64Japanese Equity Fund C – JPY 2.44 2.44Japanese Equity Fund I – JPY 0.94 0.94Japanese Equity Fund Z – JPY 0.90 0.90Japanese Equity Fund ZH – EUR 0.94 0.94Latin American Equity Fund A – USD 1.89 1.89Latin American Equity Fund B – USD 2.89 2.89Latin American Equity Fund C – USD 2.69 2.69Latin American Equity Fund I – USD 1.24 1.24Latin American Equity Fund Z – USD 1.20 1.20Sustainable Asian Equity Fund A – USD6 1.69 1.69Sustainable Asian Equity Fund B – USD6 2.69 2.69Sustainable Asian Equity Fund I – USD6 0.99 0.99Sustainable Asian Equity Fund Z – USD6 0.95 0.95US Active Factor Equity Fund A – USD 1.34 1.34US Active Factor Equity Fund I – USD 0.64 0.64US Active Factor Equity Fund Z – USD 0.60 0.60US Advantage Fund A – USD 1.64 1.64US Advantage Fund AH – EUR 1.68 1.68
Total Expense Ratio (%)
Fund Name
31 December 2020
31 December 2019
Global Brands Fund AHX – EUR 1.68 1.68Global Brands Fund AX – USD 1.64 1.64Global Brands Fund B – USD 2.64 2.65Global Brands Fund BH – EUR 2.68 2.68Global Brands Fund BHX – EUR 2.68 2.68Global Brands Fund BX – USD 2.64 2.65Global Brands Fund C – USD 2.44 2.44Global Brands Fund CH – EUR 2.48 2.48Global Brands Fund F – USD 0.99 0.99Global Brands Fund FH – CHF 1.03 1.03Global Brands Fund FH – EUR 1.03 1.03Global Brands Fund FHX – EUR 1.03 1.03Global Brands Fund FX – USD 0.99 0.99Global Brands Fund I – USD 0.94 0.94Global Brands Fund IH – CHF 0.971 –Global Brands Fund IH – EUR 0.981 0.98Global Brands Fund IHX – EUR 0.981 –Global Brands Fund IX – USD 0.931 –Global Brands Fund N – USD 0.11 0.111
Global Brands Fund S – USD 0.86 0.86Global Brands Fund Z – USD 0.90 0.90Global Brands Fund ZH – EUR 0.94 0.94Global Brands Fund ZH – GBP 0.94 0.94Global Brands Fund ZH3 – BRL 0.941 –Global Brands Fund ZHR – GBP 0.94 0.94Global Brands Fund ZX – USD 0.90 0.90Global Brands Equity Income Fund A – USD 1.99 1.99Global Brands Equity Income Fund AHR – EUR 2.03 2.03Global Brands Equity Income Fund AR – USD 1.99 1.99Global Brands Equity Income Fund BHR – EUR 3.03 3.03Global Brands Equity Income Fund BR – USD 2.99 2.99Global Brands Equity Income Fund CHR – EUR 2.78 2.78Global Brands Equity Income Fund CR – USD 2.74 2.74Global Brands Equity Income Fund IR – USD 1.04 1.04Global Brands Equity Income Fund Z – USD 1.00 1.00Global Brands Equity Income Fund ZH – GBP 1.04 1.04Global Brands Equity Income Fund ZHR – CHF 1.041 –Global Brands Equity Income Fund ZHR – EUR 1.04 1.041
Global Brands Equity Income Fund ZHR – GBP 1.041 –Global Brands Equity Income Fund ZR – USD 1.00 1.00Global Endurance Fund A – USD 1.84 1.841
Global Endurance Fund B – USD 2.84 2.841
Global Endurance Fund C – USD 2.64 2.641
Global Endurance Fund I – USD 0.94 0.941
Global Endurance Fund Z – USD 0.90 0.901
Global Infrastructure Fund A – USD 1.74 1.74Global Infrastructure Fund AH – EUR 1.78 1.78Global Infrastructure Fund B – USD 2.74 2.74Global Infrastructure Fund BH – EUR 2.78 2.78Global Infrastructure Fund C – USD 2.54 2.54Global Infrastructure Fund CH – EUR 2.58 2.58Global Infrastructure Fund I – USD 1.04 1.04Global Infrastructure Fund IH – EUR 1.08 1.08Global Infrastructure Fund IHR – EUR 1.08 1.07Global Infrastructure Fund N – USD 0.11 0.111
Global Infrastructure Fund Z – USD 1.00 1.00Global Infrastructure Fund ZH – EUR 1.04 1.04Global Infrastructure Fund ZX – USD 1.00 1.00Global Infrastructure Unconstrained Fund A – USD 1.74 1.72Global Infrastructure Unconstrained Fund Z – USD 0.90 0.90Global Opportunity Fund A – USD 1.84 1.84Global Opportunity Fund AH – EUR 1.88 1.88Global Opportunity Fund B – USD 2.84 2.84Global Opportunity Fund BH – EUR 2.88 2.88Global Opportunity Fund C – USD 2.64 2.64Global Opportunity Fund CH – EUR 2.68 2.68Global Opportunity Fund I – USD 0.94 0.94Global Opportunity Fund IH – EUR 0.981 –Global Opportunity Fund IH1 – AUD 0.981 –Global Opportunity Fund N – USD 0.11 0.11Global Opportunity Fund Z – USD 0.90 0.90Global Opportunity Fund ZH – EUR 0.94 0.94Global Opportunity Fund ZH – SEK 0.94 0.94Global Permanence Fund A – USD 1.84 1.841
Global Permanence Fund B – USD 2.84 2.841
Global Permanence Fund C – USD 2.64 2.641

443 Morgan Stanley Investment Funds 31 December 2020
Appendix 1: Fund expense ratios (unaudited) (continued)As at 31 December 2020
Total Expense Ratio (%)
Fund Name
31 December 2020
31 December 2019
Emerging Markets Debt Fund CX – USD 2.34 2.34Emerging Markets Debt Fund I – USD 0.84 0.84Emerging Markets Debt Fund IH EUR 0.881 –Emerging Markets Debt Fund Z – USD 0.80 0.80Emerging Markets Debt Fund ZH – EUR 0.84 0.84Emerging Markets Domestic Debt Fund A – USD 1.64 1.64Emerging Markets Domestic Debt Fund AH – EUR 1.68 1.68Emerging Markets Domestic Debt Fund AHX – EUR 1.68 1.68Emerging Markets Domestic Debt Fund ARM – USD 1.64 1.64Emerging Markets Domestic Debt Fund AX – USD 1.64 1.64Emerging Markets Domestic Debt Fund B – USD 2.64 2.64Emerging Markets Domestic Debt Fund BH – EUR 2.68 2.68Emerging Markets Domestic Debt Fund BHX – EUR 2.68 2.68Emerging Markets Domestic Debt Fund BX – USD 2.64 2.64Emerging Markets Domestic Debt Fund C – USD 2.34 2.34Emerging Markets Domestic Debt Fund CH – EUR 2.38 2.38Emerging Markets Domestic Debt Fund CHX – EUR 2.38 2.34Emerging Markets Domestic Debt Fund CX – USD 2.34 2.34Emerging Markets Domestic Debt Fund I – USD 0.84 0.84Emerging Markets Domestic Debt Fund Z – USD 0.80 0.80Emerging Markets Domestic Debt Fund ZH – EUR 0.83 0.84Emerging Markets Domestic Debt Fund ZX – USD 0.80 0.80Emerging Markets Fixed Income Opportunities Fund A – USD 1.64 1.64Emerging Markets Fixed Income Opportunities Fund AH – EUR 1.68 1.68Emerging Markets Fixed Income Opportunities Fund AHR – EUR 1.68 1.68Emerging Markets Fixed Income Opportunities Fund B – USD 2.64 2.64Emerging Markets Fixed Income Opportunities Fund BH – EUR 2.68 2.68Emerging Markets Fixed Income Opportunities Fund BHR – EUR 2.68 2.68Emerging Markets Fixed Income Opportunities Fund C – USD 2.14 2.14Emerging Markets Fixed Income Opportunities Fund CH – EUR 2.18 2.18Emerging Markets Fixed Income Opportunities Fund CHR – EUR 2.18 2.18Emerging Markets Fixed Income Opportunities Fund I – USD 0.89 0.89Emerging Markets Fixed Income Opportunities Fund IH – EUR 0.92 0.911
Emerging Markets Fixed Income Opportunities Fund NH – EUR 0.15 0.15Emerging Markets Fixed Income Opportunities Fund NH – GBP 0.151 –Emerging Markets Fixed Income Opportunities Fund Z – USD 0.85 0.85Emerging Markets Fixed Income Opportunities Fund ZH – EUR 0.87 0.861
Euro Bond Fund A – EUR 1.04 1.04Euro Bond Fund B – EUR 2.04 2.04Euro Bond Fund C – EUR 1.69 1.69Euro Bond Fund I – EUR 0.64 0.64Euro Bond Fund N – EUR 0.11 0.111
Euro Bond Fund Z – EUR 0.40 0.40Euro Bond Fund ZX – EUR 0.40 0.40Euro Corporate Bond Fund A – EUR 1.04 1.04Euro Corporate Bond Fund AH – USD 1.08 1.08Euro Corporate Bond Fund AX – EUR 1.04 1.04Euro Corporate Bond Fund B – EUR 2.04 2.04Euro Corporate Bond Fund BX – EUR 2.04 2.04Euro Corporate Bond Fund C – EUR 1.69 1.69Euro Corporate Bond Fund CX – EUR 1.69 1.69Euro Corporate Bond Fund F – EUR 0.34 0.34Euro Corporate Bond Fund FX – EUR 0.34 0.34Euro Corporate Bond Fund I – EUR 0.64 0.64Euro Corporate Bond Fund IX – EUR 0.64 0.64Euro Corporate Bond Fund N – EUR 0.11 0.111
Euro Corporate Bond Fund NH – USD 0.13 0.131
Euro Corporate Bond Fund S – EUR 0.34 0.40Euro Corporate Bond Fund Z – EUR 0.60 0.60Euro Corporate Bond Fund ZH – CHF 0.64 0.64Euro Corporate Bond Fund ZH – USD 0.64 0.64Euro Corporate Bond Fund ZHX – GBP 0.64 0.641
Euro Corporate Bond Fund ZX – EUR 0.60 0.60Euro Corporate Bond – Duration Hedged Fund A – EUR 1.04 1.04Euro Corporate Bond – Duration Hedged Fund AX – EUR 1.04 1.04Euro Corporate Bond – Duration Hedged Fund B – EUR 2.04 2.04Euro Corporate Bond – Duration Hedged Fund BX – EUR 2.04 2.04Euro Corporate Bond – Duration Hedged Fund C – EUR 1.69 1.69Euro Corporate Bond – Duration Hedged Fund I – EUR 0.64 0.64Euro Corporate Bond – Duration Hedged Fund N – EUR 0.11 0.111
Euro Corporate Bond – Duration Hedged Fund Z – EUR 0.60 0.60Euro Strategic Bond Fund A – EUR 1.04 1.04Euro Strategic Bond Fund AX – EUR 1.04 1.04Euro Strategic Bond Fund B – EUR 2.04 2.04Euro Strategic Bond Fund BX – EUR 2.04 2.04Euro Strategic Bond Fund C – EUR 1.69 1.69
Total Expense Ratio (%)
Fund Name
31 December 2020
31 December 2019
US Advantage Fund B – USD 2.64 2.64US Advantage Fund BH – EUR 2.68 2.68US Advantage Fund C – USD 2.44 2.44US Advantage Fund CH – EUR 2.48 2.48US Advantage Fund I – USD 0.89 0.89US Advantage Fund IH – EUR 0.93 0.93US Advantage Fund IH – GBP 0.93 0.911
US Advantage Fund N – USD 0.10 0.111
US Advantage Fund NH – EUR 0.15 0.141
US Advantage Fund S – USD 0.81 0.81US Advantage Fund Z – USD 0.85 0.85US Advantage Fund ZH – EUR 0.89 0.89US Advantage Fund ZH – GBP 0.89 0.89US Advantage Fund ZH3 – BRL 0.891 –US Advantage Fund ZHX – GBP 0.89 0.851
US Advantage Fund ZX – USD 0.85 0.85US Growth Fund A – USD 1.64 1.64US Growth Fund AH – EUR 1.68 1.68US Growth Fund AX – USD 1.64 1.64US Growth Fund B – USD 2.64 2.64US Growth Fund BH – EUR 2.68 2.68US Growth Fund C – USD 2.44 2.44US Growth Fund CH – EUR 2.48 2.48US Growth Fund F – USD 0.94 0.94US Growth Fund I – USD 0.89 0.89US Growth Fund IH – EUR 0.93 0.911
US Growth Fund IX – USD 0.89 0.89US Growth Fund N – USD 0.11 0.101
US Growth Fund NH – EUR 0.15 0.141
US Growth Fund Z – USD 0.85 0.85US Growth Fund ZH – EUR 0.89 0.89US Growth Fund ZHX – EUR 0.89 0.89US Growth Fund ZHX – GBP 0.89 0.89US Growth Fund ZX – USD 0.85 0.85US Insight Fund A – USD 1.74 1.74US Insight Fund I – USD 0.891 –US Insight Fund Z – USD 0.85 0.85US Permanence Fund Z – USD7 0.851 –US Property Fund A – USD 1.64 1.64US Property Fund B – USD 2.64 2.64US Property Fund C – USD 2.44 2.43US Property Fund F – USD 0.99 0.99US Property Fund I – USD 0.94 0.94US Property Fund Z – USD 0.90 0.90Emerging Markets Corporate Debt Fund A – USD 1.69 1.69Emerging Markets Corporate Debt Fund AH – EUR 1.73 1.73Emerging Markets Corporate Debt Fund AHX – EUR 1.73 1.73Emerging Markets Corporate Debt Fund AR – USD 1.69 1.69Emerging Markets Corporate Debt Fund AX – USD 1.69 1.69Emerging Markets Corporate Debt Fund B – USD 2.69 2.69Emerging Markets Corporate Debt Fund BH – EUR 2.73 2.73Emerging Markets Corporate Debt Fund BHX – EUR 2.73 2.73Emerging Markets Corporate Debt Fund BX – USD 2.69 2.69Emerging Markets Corporate Debt Fund C – USD 2.39 2.39Emerging Markets Corporate Debt Fund CH – EUR 2.43 2.43Emerging Markets Corporate Debt Fund CHX – EUR 2.43 2.43Emerging Markets Corporate Debt Fund CX – USD 2.39 2.39Emerging Markets Corporate Debt Fund I – USD 0.94 0.94Emerging Markets Corporate Debt Fund IH – EUR 0.98 0.98Emerging Markets Corporate Debt Fund N – USD 0.11 0.111
Emerging Markets Corporate Debt Fund SHX – EUR 0.90 0.90Emerging Markets Corporate Debt Fund Z – USD 0.90 0.90Emerging Markets Corporate Debt Fund ZH – EUR 0.94 0.94Emerging Markets Corporate Debt Fund ZHX – EUR 0.94 0.94Emerging Markets Debt Fund A – USD 1.64 1.64Emerging Markets Debt Fund AH – EUR 1.68 1.68Emerging Markets Debt Fund AHX – EUR 1.68 1.68Emerging Markets Debt Fund ARM – USD 1.64 1.64Emerging Markets Debt Fund AX – USD 1.64 1.64Emerging Markets Debt Fund B – USD 2.64 2.64Emerging Markets Debt Fund BH – EUR 2.68 2.68Emerging Markets Debt Fund BHX – EUR 2.68 2.68Emerging Markets Debt Fund BX – USD 2.64 2.64Emerging Markets Debt Fund C – USD 2.34 2.34Emerging Markets Debt Fund CH – EUR 2.38 2.38Emerging Markets Debt Fund CHX – EUR 2.38 2.38

Morgan Stanley Investment Funds 31 December 2020 444
Appendix 1: Fund expense ratios (unaudited) (continued)As at 31 December 2020
Total Expense Ratio (%)
Fund Name
31 December 2020
31 December 2019
Global Buy and Hold 2020 Bond Fund AX – EUR8 – 0.74Global Buy and Hold 2020 Bond Fund B – EUR8 – 1.74Global Buy and Hold 2020 Bond Fund BR – EUR8 – 1.71Global Buy and Hold 2020 Bond Fund BX – EUR8 – 1.74Global Buy and Hold 2020 Bond Fund I – EUR8 – 0.49Global Buy and Hold 2020 Bond Fund Z – EUR8 – 0.45Global Convertible Bond Fund A – USD 1.24 1.24Global Convertible Bond Fund AH – CHF 1.28 1.28Global Convertible Bond Fund AH – EUR 1.28 1.28Global Convertible Bond Fund B – USD 2.24 2.24Global Convertible Bond Fund BH – EUR 2.28 2.28Global Convertible Bond Fund CH – EUR 1.88 1.88Global Convertible Bond Fund I – USD 0.79 0.79Global Convertible Bond Fund IH – EUR 0.83 0.83Global Convertible Bond Fund N – USD 0.10 0.111
Global Convertible Bond Fund NH – CHF 0.13 0.15Global Convertible Bond Fund Z – USD 0.75 0.75Global Convertible Bond Fund ZH – EUR 0.79 0.79Global Convertible Bond Fund ZH – GBP 0.79 0.79Global Convertible Bond Fund ZHX – EUR 0.79 0.79Global Convertible Bond Fund ZX – USD –+ 0.75Global Credit Fund A – USD 1.04 1.04Global Credit Fund B – USD 2.04 2.04Global Credit Fund C – USD 1.69 1.69Global Credit Fund I – USD 0.64 0.64Global Credit Fund Z – USD 0.60 0.60Global Credit Fund ZH – GBP 0.64 0.64Global Fixed Income Opportunities Fund A – USD 1.24 1.24Global Fixed Income Opportunities Fund AH – AUD 1.311 –Global Fixed Income Opportunities Fund AH – CHF 1.28 1.28Global Fixed Income Opportunities Fund AH – EUR 1.28 1.28Global Fixed Income Opportunities Fund AHR – EUR 1.28 1.28Global Fixed Income Opportunities Fund AHX – EUR 1.28 1.28Global Fixed Income Opportunities Fund AR – USD 1.24 1.24Global Fixed Income Opportunities Fund ARM – USD 1.24 1.24Global Fixed Income Opportunities Fund AX – USD 1.24 1.24Global Fixed Income Opportunities Fund B – USD 2.24 2.24Global Fixed Income Opportunities Fund BH – EUR 2.28 2.28Global Fixed Income Opportunities Fund BHR – EUR 2.28 2.28Global Fixed Income Opportunities Fund BHX – EUR 2.28 2.28Global Fixed Income Opportunities Fund BX – USD 2.24 2.24Global Fixed Income Opportunities Fund C – USD 1.69 1.69Global Fixed Income Opportunities Fund CH – EUR 1.73 1.73Global Fixed Income Opportunities Fund CHR – EUR 1.73 1.73Global Fixed Income Opportunities Fund CHX – EUR 1.73 1.73Global Fixed Income Opportunities Fund CX – USD 1.69 1.69Global Fixed Income Opportunities Fund I – USD 0.64 0.64Global Fixed Income Opportunities Fund IH – EUR 0.68 0.68Global Fixed Income Opportunities Fund IR – USD 0.63 0.61Global Fixed Income Opportunities Fund IX – USD 0.64 0.64Global Fixed Income Opportunities Fund N – USD 0.11 0.111
Global Fixed Income Opportunities Fund NH – GBP 0.151 –Global Fixed Income Opportunities Fund NH – SGD 0.15 0.151
Global Fixed Income Opportunities Fund Z – USD 0.60 0.60Global Fixed Income Opportunities Fund ZH – CHF 0.64 0.64Global Fixed Income Opportunities Fund ZH – EUR 0.64 0.64Global Fixed Income Opportunities Fund ZH3 – BRL 0.64 0.64Global Fixed Income Opportunities Fund ZHR – GBP 0.64 0.64Global Fixed Income Opportunities Fund ZX – USD 0.60 0.60Global High Yield Bond Fund A – USD 1.24 1.24Global High Yield Bond Fund AH – EUR 1.28 1.28Global High Yield Bond Fund AHRM – ZAR 1.28 1.281
Global High Yield Bond Fund AHX – EUR 1.28 1.28Global High Yield Bond Fund AR – USD 1.22 1.20Global High Yield Bond Fund ARM – USD 1.24 1.241
Global High Yield Bond Fund AX – USD 1.24 1.24Global High Yield Bond Fund B – USD 2.24 2.24Global High Yield Bond Fund BH – EUR 2.28 2.28Global High Yield Bond Fund BHX – EUR 2.28 2.28Global High Yield Bond Fund BX – USD 2.24 2.24Global High Yield Bond Fund C – USD 1.84 1.84Global High Yield Bond Fund CH – EUR 1.88 1.88Global High Yield Bond Fund CHX – EUR 1.88 1.88Global High Yield Bond Fund CX – USD 1.84 1.84Global High Yield Bond Fund I – USD 0.79 0.79Global High Yield Bond Fund IX – USD 0.79 0.79
Total Expense Ratio (%)
Fund Name
31 December 2020
31 December 2019
Euro Strategic Bond Fund CX – EUR 1.69 1.69Euro Strategic Bond Fund I – EUR 0.64 0.64Euro Strategic Bond Fund N – EUR 0.11 0.111
Euro Strategic Bond Fund Z – EUR 0.60 0.60European Fixed Income Opportunities Fund A – EUR 1.24 1.24European Fixed Income Opportunities Fund AR – EUR 1.24 1.24European Fixed Income Opportunities Fund B – EUR 2.24 2.24European Fixed Income Opportunities Fund BR – EUR 2.24 2.24European Fixed Income Opportunities Fund C – EUR 1.69 1.69European Fixed Income Opportunities Fund CR – EUR 1.69 1.69European Fixed Income Opportunities Fund I – EUR 0.64 0.621
European Fixed Income Opportunities Fund IR – EUR 0.63 0.621
European Fixed Income Opportunities Fund J – EUR 0.401 –European Fixed Income Opportunities Fund N – EUR 0.111 –European Fixed Income Opportunities Fund Z – EUR 0.60 0.60European Fixed Income Opportunities Fund ZR – EUR 0.59 0.581
European High Yield Bond Fund A – EUR 1.09 1.09European High Yield Bond Fund AH – USD 1.13 1.13European High Yield Bond Fund AX – EUR 1.09 1.09European High Yield Bond Fund B – EUR 2.09 2.09European High Yield Bond Fund BX – EUR 2.09 2.09European High Yield Bond Fund C – EUR 1.74 1.74European High Yield Bond Fund CX – EUR 1.74 1.74European High Yield Bond Fund I – EUR 0.69 0.69European High Yield Bond Fund IH – USD 0.73 0.73European High Yield Bond Fund N – EUR 0.11 0.111
European High Yield Bond Fund Z – EUR 0.65 0.65European High Yield Bond Fund ZH – USD 0.661 –European High Yield Bond Fund ZHX – GBP 0.67 0.661
European High Yield Bond Fund ZX – EUR 0.65 0.65Global Asset Backed Securities Fund A – USD 1.24 1.24Global Asset Backed Securities Fund AH – EUR 1.28 1.28Global Asset Backed Securities Fund AH – GBP 1.28 1.28Global Asset Backed Securities Fund AH – SEK 1.28 1.28Global Asset Backed Securities Fund AHR – EUR 1.28 1.28Global Asset Backed Securities Fund AHX – EUR 1.28 1.28Global Asset Backed Securities Fund AR – USD 1.24 1.24Global Asset Backed Securities Fund B – USD 2.24 2.24Global Asset Backed Securities Fund BH – EUR 2.28 2.28Global Asset Backed Securities Fund BHR – EUR 2.28 2.28Global Asset Backed Securities Fund BHX – EUR 2.28 2.28Global Asset Backed Securities Fund C – USD 1.84 1.84Global Asset Backed Securities Fund CH – EUR 1.88 1.88Global Asset Backed Securities Fund CHR – EUR 1.88 1.87Global Asset Backed Securities Fund CHX – EUR 1.88 1.88Global Asset Backed Securities Fund CX – USD 1.84 1.84Global Asset Backed Securities Fund FH – EUR 0.63 0.63Global Asset Backed Securities Fund FHX – EUR 0.63 0.63Global Asset Backed Securities Fund I – USD 0.69 0.69Global Asset Backed Securities Fund IH – EUR 0.73 0.73Global Asset Backed Securities Fund IHX – EUR 0.73 0.73Global Asset Backed Securities Fund N – USD 0.11 0.111
Global Asset Backed Securities Fund Z – USD 0.65 0.65Global Asset Backed Securities Fund ZH – EUR 0.69 0.69Global Asset Backed Securities Fund ZH – SEK 0.69 0.69Global Asset Backed Securities Fund ZHX – EUR 0.661 –Global Asset Backed Securities Fund ZHX – GBP 0.69 0.69Global Asset Backed Securities Fund ZX – USD 0.651 –Global Bond Fund A – USD 1.04 1.04Global Bond Fund AH – EUR 1.08 1.08Global Bond Fund AHX – EUR 1.08 1.08Global Bond Fund AX – USD 1.04 1.04Global Bond Fund B – USD 2.04 2.04Global Bond Fund BH – EUR 2.08 2.08Global Bond Fund BHX – EUR 2.08 2.08Global Bond Fund BX – USD 2.04 2.04Global Bond Fund C – USD 1.69 1.69Global Bond Fund I – USD 0.64 0.64Global Bond Fund N – USD 0.111 –Global Bond Fund NH – EUR 0.121 –Global Bond Fund NH1 – JPY 0.15 0.151
Global Bond Fund Z – USD 0.60 0.60Global Bond Fund ZH – EUR 0.64 0.64Global Bond Fund ZH1 – EUR 0.64 0.64Global Buy and Hold 2020 Bond Fund A – EUR8 – 0.74Global Buy and Hold 2020 Bond Fund AR – EUR8 – 0.72

445 Morgan Stanley Investment Funds 31 December 2020
Appendix 1: Fund expense ratios (unaudited) (continued)As at 31 December 2020
Total Expense Ratio (%)
Fund Name
31 December 2020
31 December 2019
Global High Yield Bond Fund N – USD 0.11 0.111
Global High Yield Bond Fund Z – USD 0.75 0.75Global High Yield Bond Fund ZH – EUR 0.79 0.79Short Maturity Euro Bond Fund A – EUR 1.04 1.04Short Maturity Euro Bond Fund B – EUR 2.04 2.04Short Maturity Euro Bond Fund C – EUR 1.69 1.69Short Maturity Euro Bond Fund I – EUR 0.64 0.64Short Maturity Euro Bond Fund N – EUR 0.11 0.111
Short Maturity Euro Bond Fund NH – USD 0.14 0.141
Short Maturity Euro Bond Fund Z – EUR 0.32 0.32Sustainable Euro Corporate Bond Fund A – EUR9 1.391 –Sustainable Euro Corporate Bond Fund I – EUR9 0.641 –Sustainable Euro Corporate Bond Fund Z – EUR9 0.601 –Sustainable Euro Strategic Bond Fund A – EUR10 1.391 –Sustainable Euro Strategic Bond Fund I – EUR10 0.641 –Sustainable Euro Strategic Bond Fund Z – EUR10 0.601 –US Dollar Corporate Bond Fund A – USD 1.04 1.04US Dollar Corporate Bond Fund I – USD 0.54 0.54US Dollar Corporate Bond Fund N – USD 0.111 –US Dollar Corporate Bond Fund NH – EUR 0.121 –US Dollar Corporate Bond Fund Z – USD 0.50 0.50US Dollar Corporate Bond Fund ZH – EUR 0.501 –US Dollar High Yield Bond Fund A – USD 1.49 1.49US Dollar High Yield Bond Fund AH – EUR 1.53 1.53US Dollar High Yield Bond Fund AR – USD 1.49 1.49US Dollar High Yield Bond Fund AX – USD 1.49 1.49US Dollar High Yield Bond Fund BH – EUR 2.53 2.53US Dollar High Yield Bond Fund C – USD 1.94 1.94US Dollar High Yield Bond Fund CH – EUR 1.98 1.98US Dollar High Yield Bond Fund CX – USD 1.941 –US Dollar High Yield Bond Fund I – USD 0.69 0.69US Dollar High Yield Bond Fund J – USD 0.40 0.401
US Dollar High Yield Bond Fund JH – EUR 0.44 0.431
US Dollar High Yield Bond Fund N – USD 0.10 0.111
US Dollar High Yield Bond Fund Z – USD 0.65 0.47US Dollar High Yield Bond Fund ZH – EUR 0.69 0.45US Dollar High Yield Bond Fund ZHX – EUR 0.69 0.52US Dollar Short Duration Bond Fund A – USD 0.64 0.64US Dollar Short Duration Bond Fund I – USD 0.29 0.29US Dollar Short Duration Bond Fund N – USD 0.11 0.111
US Dollar Short Duration Bond Fund Z – USD 0.25 0.25US Dollar Short Duration High Yield Bond Fund A – USD 1.24 1.24US Dollar Short Duration High Yield Bond Fund AH – EUR 1.28 1.28US Dollar Short Duration High Yield Bond Fund AR – USD 1.24 1.24US Dollar Short Duration High Yield Bond Fund AX – USD 1.24 1.24US Dollar Short Duration High Yield Bond Fund BH – EUR 2.28 2.28US Dollar Short Duration High Yield Bond Fund C – USD 1.54 1.54US Dollar Short Duration High Yield Bond Fund CH – EUR 1.58 1.58US Dollar Short Duration High Yield Bond Fund CX – USD 1.54 1.54US Dollar Short Duration High Yield Bond Fund I – USD 0.59 0.59US Dollar Short Duration High Yield Bond Fund N – USD 0.10 0.111
US Dollar Short Duration High Yield Bond Fund Z – USD 0.55 0.55US Dollar Short Duration High Yield Bond Fund ZM – USD 0.551 –Global Balanced Defensive Fund A – EUR 1.28* 1.28*Global Balanced Defensive Fund B – EUR 2.28* 2.28*Global Balanced Defensive Fund C – EUR 1.98* 1.98*Global Balanced Defensive Fund Z – EUR 0.59* 0.59*Global Balanced Fund A – EUR 1.78* 2.09*Global Balanced Fund B – EUR 2.78* 3.14*
Total Expense Ratio (%)
Fund Name
31 December 2020
31 December 2019
Global Balanced Fund C – EUR 2.48* 2.80*Global Balanced Fund Z – EUR 0.79* 0.91*Global Balanced Income Fund A – EUR 1.78* 2.10*Global Balanced Income Fund AHR – USD 1.82* 2.16*Global Balanced Income Fund AHRM – AUD 1.82* 2.00*Global Balanced Income Fund AHRM – USD 1.82* 2.04*Global Balanced Income Fund AR – EUR 1.78* 2.14*Global Balanced Income Fund BR – EUR 2.78* 3.17*Global Balanced Income Fund CHR – USD 2.52* 2.90*Global Balanced Income Fund CR – EUR 2.48* 2.86*Global Balanced Income Fund I – EUR 0.83* 0.98*Global Balanced Income Fund IHR – USD 0.87* 1.01*Global Balanced Income Fund IR – EUR 0.83* 0.98*Global Balanced Income Fund Z – EUR 0.79* 0.93*Global Balanced Income Fund ZH – USD 0.83* 0.97*Global Balanced Income Fund ZHR – GBP 0.83* 0.98*Global Balanced Income Fund ZR – EUR 0.79* 0.93*Global Balanced Risk Control Fund of Funds A – EUR 2.40* 2.42*Global Balanced Risk Control Fund of Funds AH – USD 2.44* 2.45*Global Balanced Risk Control Fund of Funds B – EUR 3.40* 3.41*Global Balanced Risk Control Fund of Funds C – EUR 3.10* 3.11*Global Balanced Risk Control Fund of Funds CH – USD 3.14* 3.15*Global Balanced Risk Control Fund of Funds I – EUR 1.15* 1.16*Global Balanced Risk Control Fund of Funds IH – USD 1.19* 1.20*Global Balanced Risk Control Fund of Funds Z – EUR 1.15* 1.16*Global Balanced Risk Control Fund of Funds ZH – GBP 1.19* 1.20*Global Balanced Risk Control Fund of Funds ZH3 – BRL 1.19* 1.20*Global Balanced Risk Control Fund of Funds ZH3 – COP 1.19* 1.20*Global Balanced Sustainable Fund A – EUR11 1.741 –Global Balanced Sustainable Fund B – EUR11 2.741 –Global Balanced Sustainable Fund C – EUR11 2.241 –Global Balanced Sustainable Fund I – EUR11 0.791 –Global Balanced Sustainable Fund Z – EUR11 0.751 –Global Multi-Asset Income Fund AHR – USD 2.01 2.00*Global Multi-Asset Income Fund AR – EUR 1.98 1.99*Global Multi-Asset Income Fund IR – EUR 0.94 0.92*Global Multi-Asset Income Fund Z – EUR 0.90 0.92*Global Multi-Asset Opportunities Fund A – EUR 1.54 1.54Global Multi-Asset Opportunities Fund AH – USD 1.59 1.58Global Multi-Asset Opportunities Fund B – EUR 2.54 2.54Global Multi-Asset Opportunities Fund C – EUR 2.29 2.29Global Multi-Asset Opportunities Fund I – EUR 0.54 0.54Global Multi-Asset Opportunities Fund Z – EUR 0.50 0.50Global Multi-Asset Opportunities Fund ZH – CHF 0.52 0.54Global Multi-Asset Opportunities Fund ZH – GBP 0.54 0.54Global Multi-Asset Opportunities Fund ZH – USD 0.54 0.541
Global Multi-Asset Opportunities Fund ZHX – GBP 0.52 0.54Multi-Asset Risk Control Fund A – USD 1.79* 1.78* 1
Multi-Asset Risk Control Fund I – USD 0.84* 0.83* 1
Multi-Asset Risk Control Fund Z – USD 0.80* 0.79* 1
Real Assets Fund A – USD 1.74 1.741
Real Assets Fund I – USD 0.79 0.791
Real Assets Fund Z – USD 0.75 0.751
Liquid Alpha Capture Fund A – USD 1.58 1.56Liquid Alpha Capture Fund AH – EUR 1.63 1.63Liquid Alpha Capture Fund BH – EUR 2.63 2.63Liquid Alpha Capture Fund CH – EUR 2.13 2.13Liquid Alpha Capture Fund I – USD 0.73 0.73Liquid Alpha Capture Fund N – USD 0.11 0.11
1 Annualised Total Expense Ratio from date of launch to December year-end for launched Share Class or from the date of re-activation to December year-end date for Share Class closed and re-opened during the year. See note 1 for further details regarding the launch date of the Share Class.
2 Fund closed operations on 16 October 2020. 3 Formerly known as Global Counterpoint Fund prior to 15 May 2020. 4 Formerly known as European Champions Fund prior to 20 April 2020. 5 Fund merged into Europe Opportunity Fund on 20 April 2020. 6 Formerly known as Asian Equity Fund prior to 31 December 2020. 7 Fund commenced operations on 30 October 2020. 8 Fund merged into European Fixed Income Opportunities Fund on 9 November 2020. 9 Fund commenced operations on 31 July 2020.10 Fund commenced operations on 31 July 2020.11 Fund commenced operations on 30 June 2020. * Synthetic TER. + Share class was closed during the year.
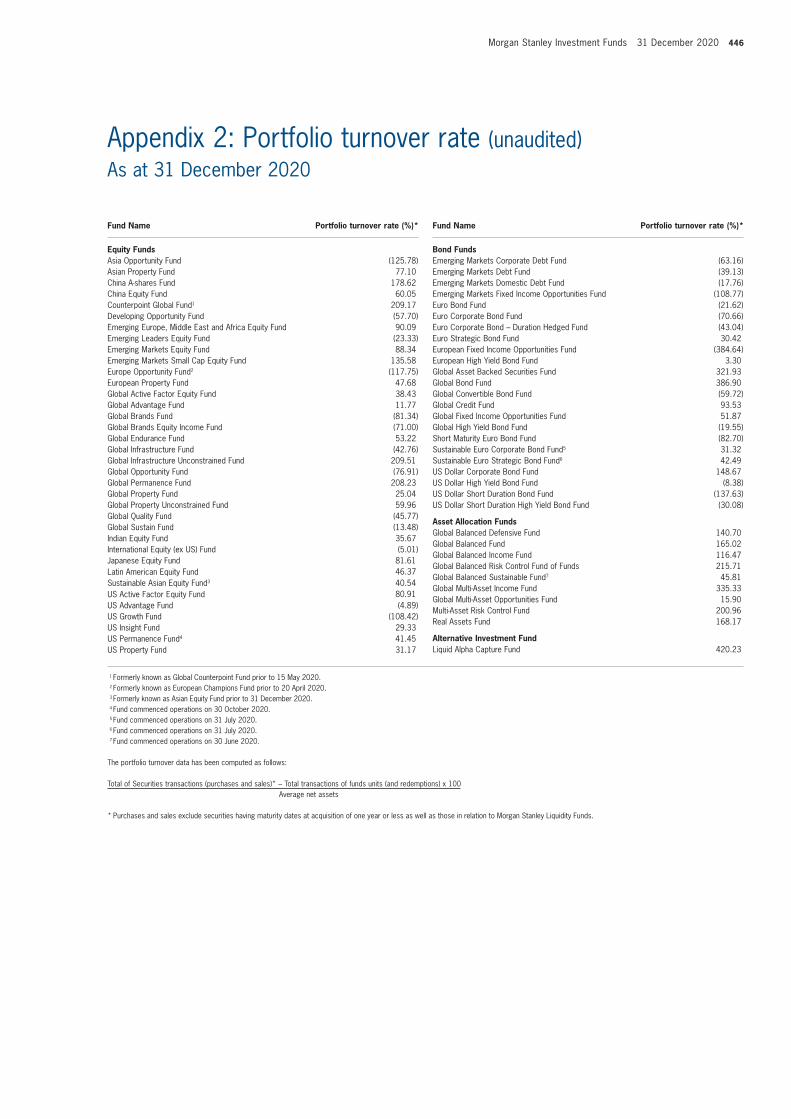
Morgan Stanley Investment Funds 31 December 2020 446
Appendix 2: Portfolio turnover rate (unaudited)As at 31 December 2020
Fund Name Portfolio turnover rate (%)*
Equity FundsAsia Opportunity Fund (125.78)Asian Property Fund 77.10China A-shares Fund 178.62China Equity Fund 60.05Counterpoint Global Fund1 209.17Developing Opportunity Fund (57.70)Emerging Europe, Middle East and Africa Equity Fund 90.09Emerging Leaders Equity Fund (23.33)Emerging Markets Equity Fund 88.34Emerging Markets Small Cap Equity Fund 135.58Europe Opportunity Fund2 (117.75)European Property Fund 47.68Global Active Factor Equity Fund 38.43Global Advantage Fund 11.77Global Brands Fund (81.34)Global Brands Equity Income Fund (71.00)Global Endurance Fund 53.22Global Infrastructure Fund (42.76)Global Infrastructure Unconstrained Fund 209.51Global Opportunity Fund (76.91)Global Permanence Fund 208.23Global Property Fund 25.04Global Property Unconstrained Fund 59.96Global Quality Fund (45.77)Global Sustain Fund (13.48)Indian Equity Fund 35.67International Equity (ex US) Fund (5.01)Japanese Equity Fund 81.61Latin American Equity Fund 46.37Sustainable Asian Equity Fund3 40.54US Active Factor Equity Fund 80.91US Advantage Fund (4.89)US Growth Fund (108.42)US Insight Fund 29.33US Permanence Fund4 41.45US Property Fund 31.17
Fund Name Portfolio turnover rate (%)*
Bond FundsEmerging Markets Corporate Debt Fund (63.16)Emerging Markets Debt Fund (39.13)Emerging Markets Domestic Debt Fund (17.76)Emerging Markets Fixed Income Opportunities Fund (108.77)Euro Bond Fund (21.62)Euro Corporate Bond Fund (70.66)Euro Corporate Bond – Duration Hedged Fund (43.04)Euro Strategic Bond Fund 30.42European Fixed Income Opportunities Fund (384.64)European High Yield Bond Fund 3.30Global Asset Backed Securities Fund 321.93Global Bond Fund 386.90Global Convertible Bond Fund (59.72)Global Credit Fund 93.53Global Fixed Income Opportunities Fund 51.87Global High Yield Bond Fund (19.55)Short Maturity Euro Bond Fund (82.70)Sustainable Euro Corporate Bond Fund5 31.32Sustainable Euro Strategic Bond Fund6 42.49US Dollar Corporate Bond Fund 148.67US Dollar High Yield Bond Fund (8.38)US Dollar Short Duration Bond Fund (137.63)US Dollar Short Duration High Yield Bond Fund (30.08)
Asset Allocation FundsGlobal Balanced Defensive Fund 140.70Global Balanced Fund 165.02Global Balanced Income Fund 116.47Global Balanced Risk Control Fund of Funds 215.71Global Balanced Sustainable Fund7 45.81Global Multi-Asset Income Fund 335.33Global Multi-Asset Opportunities Fund 15.90Multi-Asset Risk Control Fund 200.96Real Assets Fund 168.17
Alternative Investment FundLiquid Alpha Capture Fund 420.23
1 Formerly known as Global Counterpoint Fund prior to 15 May 2020. 2 Formerly known as European Champions Fund prior to 20 April 2020. 3 Formerly known as Asian Equity Fund prior to 31 December 2020. 4 Fund commenced operations on 30 October 2020. 5 Fund commenced operations on 31 July 2020. 6 Fund commenced operations on 31 July 2020. 7 Fund commenced operations on 30 June 2020.
The portfolio turnover data has been computed as follows:
Total of Securities transactions (purchases and sales)* – Total transactions of funds units (and redemptions) x 100 Average net assets
* Purchases and sales exclude securities having maturity dates at acquisition of one year or less as well as those in relation to Morgan Stanley Liquidity Funds.

447 Morgan Stanley Investment Funds 31 December 2020
Fund Name Sub-Adviser
Equity FundsMorgan Stanley Investment Funds Asia Opportunity Fund Morgan Stanley Asia LimitedMorgan Stanley Investment Funds Asian Property Fund Morgan Stanley Investment Management CompanyMorgan Stanley Investment Funds China A-shares Fund Morgan Stanley Asia LimitedMorgan Stanley Investment Funds China Equity Fund Morgan Stanley Investment Management CompanyMorgan Stanley Investment Funds Counterpoint Global Fund1 Morgan Stanley Investment Management Company & Morgan Stanley Asia LimitedMorgan Stanley Investment Funds Developing Opportunity Fund Morgan Stanley Asia LimitedMorgan Stanley Investment Funds Emerging Europe, Middle East and Africa Equity Fund Morgan Stanley Investment Management Inc.Morgan Stanley Investment Funds Emerging Leaders Equity Fund Morgan Stanley Investment Management CompanyMorgan Stanley Investment Funds Emerging Markets Equity Fund Morgan Stanley Investment Management Company,
Morgan Stanley Investment Management Inc. & Morgan Stanley Asia LimitedMorgan Stanley Investment Funds Emerging Markets Small Cap Equity Fund Morgan Stanley Investment Management Inc.Morgan Stanley Investment Funds Europe Opportunity Fund2 Morgan Stanley Asia LimitedMorgan Stanley Investment Funds European Property Fund Morgan Stanley Investment Management Inc.Morgan Stanley Investment Funds Global Active Factor Equity Fund Morgan Stanley Investment Management Inc.Morgan Stanley Investment Funds Global Advantage Fund Morgan Stanley Investment Management Inc.Morgan Stanley Investment Funds Global Brands Fund NoneMorgan Stanley Investment Funds Global Brands Equity Income Fund Morgan Stanley Investment Management Inc.Morgan Stanley Investment Funds Global Endurance Fund Morgan Stanley Investment Management Inc.Morgan Stanley Investment Funds Global Infrastructure Fund Morgan Stanley Investment Management Inc.Morgan Stanley Investment Funds Global Infrastructure Unconstrained Fund Morgan Stanley Investment Management Inc.Morgan Stanley Investment Funds Global Opportunity Fund Morgan Stanley Asia LimitedMorgan Stanley Investment Funds Global Permanence Fund Morgan Stanley Investment Management Inc.Morgan Stanley Investment Funds Global Property Fund Morgan Stanley Investment Management Inc.Morgan Stanley Investment Funds Global Property Unconstrained Fund Morgan Stanley Investment Management Inc.Morgan Stanley Investment Funds Global Quality Fund NoneMorgan Stanley Investment Funds Global Sustain Fund NoneMorgan Stanley Investment Funds Indian Equity Fund Morgan Stanley Investment Management Company & Morgan Stanley Investment Management Inc.Morgan Stanley Investment Funds International Equity (ex US) Fund NoneMorgan Stanley Investment Funds Japanese Equity Fund Mitsubishi UFJ Asset Management (UK) Limited as Sub-Adviser which delegated its powers
to Mitsubishi UFJ Kokusai Asset Management Co., Ltd (Japan)Morgan Stanley Investment Funds Latin American Equity Fund Morgan Stanley Investment Management Inc.Morgan Stanley Investment Funds Sustainable Asian Equity Fund3 Morgan Stanley Investment Management CompanyMorgan Stanley Investment Funds Saudi Equity Fund Not open for subscriptionMorgan Stanley Investment Funds US Active Factor Equity Fund Morgan Stanley Investment Management Inc.Morgan Stanley Investment Funds US Advantage Fund Morgan Stanley Investment Management Inc.Morgan Stanley Investment Funds US Growth Fund Morgan Stanley Investment Management Inc.Morgan Stanley Investment Funds US Insight Fund Morgan Stanley Investment Management Inc.Morgan Stanley Investment Funds US Permanence Fund4 Morgan Stanley Investment Management Inc.Morgan Stanley Investment Funds US Property Fund Morgan Stanley Investment Management Inc.
Bond FundsMorgan Stanley Investment Funds Emerging Markets Corporate Debt Fund Morgan Stanley Investment Management Inc. & Morgan Stanley Investment Management CompanyMorgan Stanley Investment Funds Emerging Markets Debt Fund Morgan Stanley Investment Management Inc.Morgan Stanley Investment Funds Emerging Markets Domestic Debt Fund Morgan Stanley Investment Management Inc.Morgan Stanley Investment Funds Emerging Markets Fixed Income Opportunities Fund Morgan Stanley Investment Management Inc. & Morgan Stanley Investment Management CompanyMorgan Stanley Investment Funds Euro Bond Fund NoneMorgan Stanley Investment Funds Euro Corporate Bond Fund NoneMorgan Stanley Investment Funds Euro Corporate Bond – Duration Hedged Fund NoneMorgan Stanley Investment Funds Euro Strategic Bond Fund Morgan Stanley Investment Management Inc.Morgan Stanley Investment Funds European Fixed Income Opportunities Fund Morgan Stanley Investment Management Inc.Morgan Stanley Investment Funds European High Yield Bond Fund NoneMorgan Stanley Investment Funds Global Asset Backed Securities Fund Morgan Stanley Investment Management Inc.Morgan Stanley Investment Funds Global Bond Fund Morgan Stanley Investment Management Inc.Morgan Stanley Investment Funds Global Convertible Bond Fund Morgan Stanley Investment Management Inc.Morgan Stanley Investment Funds Global Credit Fund Morgan Stanley Investment Management Inc.Morgan Stanley Investment Funds Global Fixed Income Opportunities Fund Morgan Stanley Investment Management Inc.Morgan Stanley Investment Funds Global High Yield Bond Fund Morgan Stanley Investment Management Inc.Morgan Stanley Investment Funds Short Maturity Euro Bond Fund NoneMorgan Stanley Investment Funds Sustainable Euro Corporate Bond Fund5 NoneMorgan Stanley Investment Funds Sustainable Euro Strategic Bond Fund6 Morgan Stanley Investment Management Inc.Morgan Stanley Investment Funds US Dollar Corporate Bond Fund Morgan Stanley Investment Management Inc.
List of Sub-Advisers (to be read in conjunction with the prospectus dated October 2020). Morgan Stanley Investment Management Limited acts as Investment Adviser for the Funds. Where the Investment Adviser has delegated any of its responsibilities, the Funds are advised by the following Sub-Advisers.
Appendix 3: Sub-Advisers (unaudited)As at 31 December 2020

Morgan Stanley Investment Funds 31 December 2020 448
Fund Name Sub-Adviser
Bond Funds (continued)Morgan Stanley Investment Funds US Dollar High Yield Bond Fund Morgan Stanley Investment Management Inc.Morgan Stanley Investment Funds US Dollar Short Duration Bond Fund Morgan Stanley Investment Management Inc.Morgan Stanley Investment Funds US Dollar Short Duration High Yield Bond Fund Morgan Stanley Investment Management Inc.
Asset Allocation FundsMorgan Stanley Investment Funds Global Balanced Defensive Fund Morgan Stanley Investment Management CompanyMorgan Stanley Investment Funds Global Balanced Fund Morgan Stanley Investment Management CompanyMorgan Stanley Investment Funds Global Balanced Income Fund Morgan Stanley Investment Management CompanyMorgan Stanley Investment Funds Global Balanced Risk Control Fund of Funds Morgan Stanley Investment Management CompanyMorgan Stanley Investment Funds Global Balanced Sustainable Fund7 Morgan Stanley Investment Management CompanyMorgan Stanley Investment Funds Global Multi-Asset Income Fund Morgan Stanley Investment Management Inc.Morgan Stanley Investment Funds Global Multi-Asset Opportunities Fund Morgan Stanley Investment Management Inc.Morgan Stanley Investment Funds Multi-Asset Risk Control Fund Morgan Stanley Investment Management CompanyMorgan Stanley Investment Funds Real Assets Fund Morgan Stanley Investment Management Inc.
Alternative FundsMorgan Stanley Investment Funds Liquid Alpha Capture Fund Morgan Stanley Investment Management Inc.
1 Formerly known as Global Counterpoint Fund prior to 15 May 2020. 2 Formerly known as European Champions Fund prior to 20 April 2020. 3 Formerly known as Asian Equity Fund prior to 31 December 2020. 4 Fund commenced operations on 30 October 2020. 5 Fund commenced operations on 31 July 2020. 6 Fund commenced operations on 31 July 2020. 7 Fund commenced operations on 30 June 2020.
Appendix 3: Sub-Advisers (unaudited) (continued)As at 31 December 2020

449 Morgan Stanley Investment Funds 31 December 2020
Fund Name Hedged Share Class(es) Hedging Strategy
Asia Opportunity Fund AH (EUR), BH (EUR), CH (EUR), IH (EUR), IH (GBP), JH (GBP), ZH (EUR), ZH (GBP) NAV Currency Hedged Share ClassesChina A-shares Fund AH (EUR), BH (EUR), CH (EUR) NAV Currency Hedged Share ClassesEmerging Leaders Equity Fund AH (EUR), BH (EUR), CH (EUR), IH (EUR), ZH (EUR), ZH (GBP), ZH3 (BRL) NAV Currency Hedged and
Non-deliverable Currency Hedged Share ClassesEmerging Markets Small Cap Equity Fund AH (EUR), BH (EUR), CH (EUR) NAV Currency Hedged Share ClassesEurope Opportunity Fund1 AH (USD), IH (USD) NAV Currency Hedged Share ClassesEuropean Property Fund AH (USD) NAV Currency Hedged Share ClassesGlobal Advantage Fund AH (EUR), BH (EUR), CH (EUR), ZH (EUR) NAV Currency Hedged Share ClassesGlobal Brands Fund AH (CHF), AH (EUR), AHX (EUR), BH (EUR), BHX (EUR), CH (EUR), FH (CHF), FH (EUR),
FHX (EUR), IH (CHF), IH (EUR), IHX (EUR), ZH (EUR), ZH (GBP), ZHR (GBP), ZH3 (BRL)NAV Currency Hedged and
Non-deliverable Currency Hedged Share ClassesGlobal Brands Equity Income Fund AHR (EUR), BHR (EUR), CHR (EUR), ZH (GBP), ZHR (CHF), ZHR (EUR), ZHR (GBP) NAV Currency Hedged Share ClassesGlobal Infrastructure Fund AH (EUR), BH (EUR), CH (EUR), IH (EUR), IHR (EUR), ZH (EUR) NAV Currency Hedged Share ClassesGlobal Opportunity Fund AH (EUR), BH (EUR), CH (EUR), IH (EUR), IH1 (AUD), ZH (EUR), ZH (SEK) NAV Currency Hedged and Portfolio
Currency Hedged Share ClassesGlobal Property Fund AH (EUR), BH (EUR), CH (EUR), ZH (EUR) NAV Currency Hedged Share ClassesGlobal Quality Fund AH (CHF), AH (EUR), AH (SGD), BH (EUR), CH (EUR), ZH (CHF), ZH (EUR) NAV Currency Hedged Share ClassesGlobal Sustain Fund AH (EUR), BH (EUR), CH (EUR), IH (EUR), IH (GBP), JH (GBP), ZH (CHF), ZH (EUR), ZH (GBP) NAV Currency Hedged Share ClassesJapanese Equity Fund AH (USD), ZH (EUR) NAV Currency Hedged Share ClassesUS Advantage Fund AH (EUR), BH (EUR), CH (EUR), IH (EUR), IH (GBP), NH (EUR), ZH (EUR), ZH (GBP),
ZHX (GBP), ZH3 (BRL)NAV Currency Hedged and
Non-deliverable Currency Hedged Share ClassesUS Growth Fund AH (EUR), BH (EUR), CH (EUR), IH (EUR), NH (EUR), ZH (EUR), ZHX (EUR), ZHX (GBP) NAV Currency Hedged Share ClassesEmerging Markets Corporate Debt Fund AH (EUR), AHX (EUR), BH (EUR), BHX (EUR), CH (EUR), CHX (EUR), IH (EUR), SHX (EUR),
ZH (EUR), ZHX (EUR) NAV Currency Hedged Share ClassesEmerging Markets Debt Fund AH (EUR), AHX (EUR), BH (EUR), BHX (EUR), CH (EUR), CHX (EUR), IH (EUR), ZH (EUR) NAV Currency Hedged Share ClassesEmerging Markets Domestic Debt Fund AH (EUR), AHX (EUR), BH (EUR), BHX (EUR), CH (EUR), CHX (EUR), ZH (EUR) NAV Currency Hedged Share ClassesEmerging Markets Fixed Income Opportunities Fund AH (EUR), AHR (EUR), BH (EUR), BHR (EUR), CH (EUR), CHR (EUR), IH (EUR), NH (EUR),
NH (GBP), ZH (EUR) NAV Currency Hedged Share ClassesEuro Corporate Bond Fund AH (USD), NH (USD), ZH (CHF), ZH (USD), ZHX (GBP) NAV Currency Hedged Share ClassesEuropean High Yield Bond Fund AH (USD), IH (USD), ZH (USD), ZHX (GBP) NAV Currency Hedged Share ClassesGlobal Asset Backed Securities Fund AH (EUR), AH (GBP), AH (SEK), AHR (EUR), AHX (EUR), BH (EUR), BHR (EUR), BHX (EUR),
CH (EUR), CHR (EUR), CHX (EUR), FH (EUR), FHX (EUR), IH (EUR), IHX (EUR), ZH (EUR), ZH (SEK), ZHX (EUR), ZHX (GBP) NAV Currency Hedged Share Classes
Global Bond Fund AH (EUR), AHX (EUR), BH (EUR), BHX (EUR), NH (EUR), NH1 (JPY), ZH (EUR), ZH1 (EUR) NAV Currency Hedged and Portfolio Currency Hedged Share Classes
The Board of Directors of the Company may decide from time to time for some or all of the Funds to issue Currency Hedged Share Classes.
Currency Hedged Share Classes seek to reduce the currency exposure of the Shareholder to currencies other than the currency in which the Currency Hedged Share Class is denominated (the “Hedged Share Class Currency”). The hedging process will vary depending on the type of fund for which the Currency Hedged Share Class is issued and the hedging strategy adopted for all the Currency Hedged Share Classes in that particular Fund, as defined by the prospectus. The types of Currency Hedged Share Class are as follows:
NAV Hedged Share Classes (Share Class Sub-Indicator “H”) seek to reduce exposure to currency movements between the Hedged Share Class Currency and the Fund’s Reference Currency. This involves hedging the Fund’s Reference Currency back to the Hedged Share Class Currency without reference to its Investment Currencies.
Portfolio Hedged Share Classes (Share Class Sub-Indicator “H1”) seek to reduce exposure to currency movements between the Hedged Share Class Currency and the Fund’s Investment Currencies. This involves hedging the Fund’s Investment Currencies back to the Hedged Share Class Currency without reference to its Reference Currency.
NAV Hedged (Non-deliverable Currency) Share Classes (Share Class Sub-Indicator “H3”) seek to reduce exposure to currency movements between a non-deliverable Hedged Share Class Currency and the Fund’s Reference Currency. This involves hedging the Fund’s Reference Currency back to the Hedged Share Class Currency without reference to its Investment Currencies. As the Hedged Share Class Currency is non-deliverable the Share Class will be denominated in a currency other than the Hedged Share Class Currency for the purposes of subscription and redemption.
There is no segregation of liabilities between the different share classes of the same Fund. As such, under certain conditions, there is a remote risk that transactions specific to a Hedged Share Class could result in liabilities which may exceed the assets of that Hedged Share Class. In such a scenario, any excess liabilities could adversely impact the Net Asset Value of other share classes within the same Fund, as the assets of other share classes would be exposed to the excess liabilities of the Hedged Share Class. The Management Company has put in place a number of measures and controls as part of its risk management framework in order to prevent such an event, hence the risk of such ‘cross contamination’ is considered by the Management Company to be extremely low.
The hedging strategies adopted at the year end are as follows:
Appendix 4: Hedged Share Classes (unaudited)As at 31 December 2020

Morgan Stanley Investment Funds 31 December 2020 450
Fund Name Hedged Share Class(es) Hedging Strategy
Global Convertible Bond Fund AH (CHF), AH (EUR), BH (EUR), CH (EUR), IH (EUR), NH (CHF), ZH (EUR), ZH (GBP), ZHX (EUR) NAV Currency Hedged Share ClassesGlobal Credit Fund ZH (GBP) NAV Currency Hedged Share ClassesGlobal Fixed Income Opportunities Fund AH (AUD), AH (CHF), AH (EUR), AHR (EUR), AHX (EUR), BH (EUR), BHR (EUR), BHX (EUR),
CH (EUR), CHR (EUR), CHX (EUR), IH (EUR), NH (GBP), NH (SGD), ZH (CHF), ZH (EUR), ZHR (GBP), ZH3 (BRL)
NAV Currency Hedged and Non-deliverable Currency Hedged Share Classes
Global High Yield Bond Fund AH (EUR), AHRM (ZAR), AHX (EUR), BH (EUR), BHX (EUR), CH (EUR), CHX (EUR), ZH (EUR) NAV Currency Hedged Share ClassesShort Maturity Euro Bond Fund NH (USD) NAV Currency Hedged Share ClassesUS Dollar Corporate Bond Fund NH (EUR), ZH (EUR) NAV Currency Hedged Share ClassesUS Dollar High Yield Bond Fund AH (EUR), BH (EUR), CH (EUR), JH (EUR), ZH (EUR), ZHX (EUR) NAV Currency Hedged Share ClassesUS Dollar Short Duration High Yield Bond Fund AH (EUR), BH (EUR), CH (EUR) NAV Currency Hedged Share ClassesGlobal Balanced Income Fund AHR (USD), AHRM (AUD), AHRM (USD), CHR (USD), IHR (USD), ZH (USD), ZHR (GBP) NAV Currency Hedged Share ClassesGlobal Balanced Risk Control Fund of Funds AH (USD), CH (USD), IH (USD), ZH (GBP), ZH3 (BRL), ZH3 (COP) NAV Currency Hedged and
Non-deliverable Currency Hedged Share ClassesGlobal Multi-Asset Income Fund AHR (USD) NAV Currency Hedged Share ClassesGlobal Multi-Asset Opportunities Fund AH (USD), ZH (CHF), ZH (GBP), ZH (USD), ZHX (GBP) NAV Currency Hedged Share ClassesLiquid Alpha Capture Fund AH (EUR), BH (EUR), CH (EUR) NAV Currency Hedged Share Classes
1 Formerly known as European Champions Fund prior to 20 April 2020.
Appendix 4: Hedged Share Classes (unaudited) (continued)As at 31 December 2020

451 Morgan Stanley Investment Funds 31 December 2020
Appendix 5: Performance Summary^ (unaudited)As at 31 December 2020
Share Class
31 Dec 2020Year to Date %
31 Dec 2019Year to Date %
31 Dec 2018Year to Date %
Asia Opportunity Fund A 50.38 40.37 (15.50)AH (EUR) 47.22 36.26 (17.90)
B 48.87 38.96 (16.33)BH (EUR) 45.76 34.91 (18.72)
C 49.20 39.27 (17.80)CH (EUR) 46.06 35.22 (19.60)
F 51.66 41.56 (14.75)I 51.75 41.64 (14.73)
IH (EUR) 48.61 4.68 n/aIH (GBP) 48.31 11.12 n/a
J 51.97 41.83 (14.58)J (GBP)* 14.76 n/a n/a
JH (GBP)* 34.64 n/a n/aN 53.01 15.44 n/aS* 48.76 n/a n/aZ 51.80 41.66 (14.68)
ZH (EUR) 48.59 37.54 (17.13)ZH (GBP) 48.35 38.89 (16.43)
Asian Property Fund A (8.35) 13.18 (2.33)B (9.28) 12.04 (3.35)C (9.11) 12.26 (3.76)F (7.74) 13.93 (1.69)I (7.69) 13.95 (1.65)
IX (7.68) 13.95 (1.62)Z (7.65) 14.02 (1.61)
Breakout Nations Fund1 A** n/a 10.80 (18.18)AH (EUR)** n/a 7.37 (20.72)
B** n/a 9.65 (19.00)BH (EUR)** n/a 6.29 (21.53)
C** n/a 10.01 (18.75)CH (EUR)** n/a 6.62 (21.27)
Z** n/a 11.70 (17.49)China A-shares Fund A 12.60 18.13 (17.48)
AH (EUR) 10.71 14.59 (22.12)B 11.47 16.94 (18.32)
BH (EUR) 9.60 13.49 (22.88)C 11.82 17.29 (18.08)
CH (EUR) 9.95 13.81 (22.64)I 13.83 19.33 (16.60)
Z 13.82 19.42 (16.60)China Equity Fund A 26.79 10.64 n/a
B 25.52 10.20 n/aC 25.89 10.32 n/aI 28.11 11.12 n/a
Z 28.14 11.16 n/aCounterpoint Global Fund2 A 75.19 31.78 (16.68)
I 76.65 32.97 (16.52)Z 76.77 33.01 (16.52)
Developing Opportunity Fund
A 57.38 0.24 n/aB 55.75 0.24 n/aC 56.34 0.24 n/aI 59.39 0.28 n/aJ* 54.00 n/a n/aN* 65.64 n/a n/aZ 59.39 0.28 n/a
Emerging Europe, Middle East and Africa Equity Fund
A (6.08) 23.58 (15.33)AX (6.08) 23.57 (15.33)B (7.01) 22.35 (16.16)C (6.84) 22.59 (13.24)I (5.56) 24.26 (14.85)
Z (5.54) 24.35 (14.83)Emerging Leaders Equity Fund
A 56.91 24.59 (13.86)AH (EUR) 53.68 20.87 (16.45)
B 55.41 23.36 (14.73)BH (EUR) 52.14 19.62 (17.28)
C 55.84 23.70 (14.45)CH (EUR) 52.64 19.99 (17.03)
I 58.83 26.10 (12.82)IH (EUR) 55.52 22.29 (15.42)
N 60.15 14.72 n/aZ 58.88 26.14 (12.78)
ZH (EUR) 55.60 22.37 (15.39)ZH (GBP) 54.77 23.63 (14.53)
ZH3 (BRL)* 34.48 n/a n/a
Share Class
31 Dec 2020Year to Date %
31 Dec 2019Year to Date %
31 Dec 2018Year to Date %
Emerging Markets Equity Fund
A 13.61 18.08 (17.52)B 12.50 16.90 (18.36)C 12.71 17.17 (18.20)I 14.24 18.72 (17.05)
N 15.62 20.15 (16.09)Z 14.68 19.23 (16.97)
Emerging Markets Small Cap Equity Fund
A 3.72 8.30 (23.59)AH (EUR) 1.69 5.02 (25.97)
AX 3.76 8.29 (23.59)B 2.71 7.21 (24.37)
BH (EUR) 0.69 3.93 (26.68)C 3.12 7.66 (24.06)
CH (EUR) 1.13 4.33 (26.38)I 5.05 9.69 (22.65)
Z 5.10 9.69 (22.60)Europe Opportunity Fund3 A 39.92 29.02 (10.03)
AH (USD) 42.31 32.83 (7.80)AR 39.94 14.69 n/aB 38.54 27.74 (10.94)
BR 38.52 13.80 n/aC 38.97 28.10 (10.64)
CR 38.94 14.04 n/aI 41.06 30.02 (9.29)
IH (USD) 43.39 18.08 n/aN* 9.16 n/a n/aZ 41.12 30.08 (9.25)
European Property Fund A (21.36) 28.69 (12.90)AH (USD) (19.90) 32.52 (10.69)
AX (21.39) 28.71 (12.92)B (22.17) 27.39 (13.78)C (22.01) 27.64 (11.44)I (20.82) 29.60 (12.28)
Z (20.78) 29.62 (12.25)Eurozone Equity Alpha Fund4
A** n/a 28.05 (15.93)AH (USD)** n/a 31.83 (13.74)
AR** n/a 28.03 (15.92)B** n/a 26.78 (16.80)
BR** n/a 26.72 (16.76)C** n/a 27.03 (14.16)
CR** n/a 27.02 (16.61)I** n/a 28.99 (15.34)
IH (USD)** n/a 32.75 (13.15)Z** n/a 28.97 (15.29)
Global Active Factor Equity Fund
A 20.55 29.85 (17.12)I 21.59 30.96 (16.40)
Z 21.65 31.00 (16.36)Global Advantage Fund A 92.11 29.62 (7.75)
AH (EUR) 88.28 6.44 n/aB 90.19 28.35 (8.69)
BH (EUR) 86.44 5.64 n/aC 90.59 28.61 (8.51)
CH (EUR) 86.65 5.80 n/aI 93.83 30.82 (6.93)
Z 93.90 30.86 (6.89)ZH (EUR) 90.05 0.52 n/a
Global Brands Fund A 11.91 28.36 (2.72)AH (CHF) 9.49 24.17 (5.73)AH (EUR) 9.59 24.49 (5.46)
AHX (EUR) 9.60 24.47 (5.46)AX 11.92 28.35 (2.73)B 10.80 27.08 (3.69)
BH (EUR) 8.51 23.25 (6.41)BHX (EUR) 8.51 23.27 (6.42)
BX 10.79 27.07 (3.69)C 11.02 27.33 (3.51)
CH (EUR) 8.72 23.52 (6.23)F 12.65 29.20 (2.09)
FH (CHF) 10.20 25.00 (5.13)FH (EUR) 10.29 25.33 (4.86)
FHX (EUR) 10.32 25.29 (4.87)FX 12.66 29.19 (2.11)
I 12.70 29.26 (2.04)IH (CHF)* 9.72 n/a n/aIH (EUR) 10.36 25.38 (4.81)

Morgan Stanley Investment Funds 31 December 2020 452
Appendix 5: Performance Summary^ (unaudited) (continued)As at 31 December 2020
Share Class
31 Dec 2020Year to Date %
31 Dec 2019Year to Date %
31 Dec 2018Year to Date %
Global Brands Fund IHX (EUR)*** (0.51) n/a n/a(continued) IX* 10.60 n/a n/a
N 13.63 1.52 n/aS 12.79 29.35 (1.94)Z 12.75 29.32 (2.01)
ZH (EUR) 10.41 25.41 (4.76)ZH (GBP) 10.10 26.74 (3.87)
ZH3 (BRL)* 13.40 n/a n/aZHR (GBP) 10.12 26.69 (3.86)
ZX 12.75 29.31 (2.00)Global Brands Equity Income Fund
A 10.87 24.32 (4.05)AHR (EUR) 8.61 20.59 (6.72)
AR 10.90 24.28 (4.02)BHR (EUR) 7.56 19.34 (7.66)
BR 9.80 23.09 (5.01)CHR (EUR) 7.79 19.68 (7.42)
CR 10.06 23.36 (4.75)IR 11.91 25.52 (3.10)Z 11.99 25.55 (3.07)
ZH (GBP) 9.41 23.10 (4.91)ZHR (CHF)* 16.90 n/a n/aZHR (EUR) 9.67 8.74 n/aZHR (GBP)* 11.48 n/a n/a
ZR 11.98 25.55 (3.08)Global Endurance Fund A 105.28 6.08 n/a
B 103.22 5.72 n/aC 103.63 5.80 n/aI 107.11 6.40 n/a
Z 107.22 6.40 n/aGlobal Infrastructure Fund A (2.59) 26.11 (8.70)
AH (EUR) (4.64) 22.16 (11.33)B (3.56) 24.86 (9.61)
BH (EUR) (5.57) 20.95 (12.22)C (3.36) 25.10 (9.43)
CH (EUR) (5.40) 21.21 (12.05)I (1.90) 27.02 (8.05)
IH (EUR) (3.98) 23.03 (10.72)IHR (EUR) (4.01) 23.01 (10.69)
N (1.00) 7.56 n/aZ (1.86) 27.06 (8.02)
ZH (EUR) (3.92) 23.06 (10.67)ZX (1.84) 27.04 (8.02)
Global Infrastructure Unconstrained Fund
A (1.94) 12.74 (1.12)Z (1.09) 13.69 (0.36)
Global Opportunity Fund A 54.01 34.82 (7.36)AH (EUR) 50.75 30.81 (9.96)
B 52.47 33.51 (8.29)BH (EUR) 49.26 29.51 (10.88)
C 52.78 33.75 (8.10)CH (EUR) 49.56 29.74 (15.40)
I 55.39 36.07 (6.53)IH (EUR)* 36.88 n/a n/a
IH1 (AUD)* 33.68 n/a n/aN 56.69 37.20 (5.75)Z 55.47 36.10 (6.48)
ZH (EUR) 52.21 32.02 (9.10)ZH (SEK) 51.28 32.17 (9.45)
Global Permanence Fund A 24.58 1.20 n/aB 23.31 0.88 n/aC 23.62 0.92 n/aI 25.73 1.52 n/a
Z 25.77 1.52 n/aGlobal Property Fund A (13.27) 17.36 (9.78)
AH (EUR) (15.33) 13.77 (12.31)B (14.14) 16.19 (10.67)
BH (EUR) (16.22) 12.65 (13.18)C (13.94) 16.43 (10.50)
CH (EUR) (16.02) 12.83 (12.99)I (12.66) 18.18 (9.15)
IX (12.65) 18.19 (9.15)Z (12.62) 18.26 (9.14)
ZH (EUR) (14.65) 14.58 (11.62)ZX (12.62) 18.25 (9.12)
Share Class
31 Dec 2020Year to Date %
31 Dec 2019Year to Date %
31 Dec 2018Year to Date %
Global Property Unconstrained Fund
A (23.49) 12.31 (11.41)Z (22.84) 13.29 (10.70)
Global Quality Fund A 13.24 28.05 (3.11)AH (CHF) 10.75 23.90 (6.08)AH (EUR) 10.87 24.17 (5.83)AH (SGD) 11.89 27.06 (4.03)
AX 13.23 28.03 (3.09)B 12.10 26.79 (4.09)
BH (EUR) 9.78 22.93 (6.77)C 12.32 27.04 (3.88)
CH (EUR) 9.97 23.21 (6.60)I 14.25 29.21 (2.20)
Z 14.31 29.24 (2.17)ZH (CHF) 11.79 25.07 (5.19)ZH (EUR) 11.93 25.33 (4.93)
ZX 14.28 29.26 (2.16)Global Sustain Fund A 14.73 28.47 (5.32)
AH (EUR) 12.42 24.68 (5.20)B 13.55 14.80 n/a
BH (EUR) 11.30 12.20 n/aC 13.78 14.96 n/a
CH (EUR) 11.49 12.40 n/aI 15.76 29.65 (4.88)
IH (EUR)* 25.20 n/a n/aIH (GBP) 12.98 5.68 n/a
J 15.97 29.95 0.04JH (GBP) 13.31 17.52 n/a
Z 15.79 29.73 (4.88)ZH (CHF)* 18.36 n/a n/aZH (EUR)* 36.96 n/a n/aZH (GBP)* 18.68 n/a n/a
ZX 15.81 26.29 n/aIndian Equity Fund A 7.79 1.02 (20.97)
B 6.75 – (21.77)C 6.97 0.19 (14.64)I 8.79 1.90 (20.24)
N** n/a 2.78 (19.58)Z 8.82 1.98 (20.22)
International Equity (ex US) Fund
A 10.49 19.19 (15.02)C 9.60 18.26 (15.71)I 11.49 20.25 (14.22)
Z 11.54 20.31 (14.24)Japanese Equity Fund A 0.07 15.40 (21.31)
AH (USD) 0.35 17.99 (19.99)B (0.92) 14.25 (22.10)C (0.72) 14.48 (21.94)I 0.77 16.21 (20.75)
Z 0.81 16.25 (20.72)ZH (EUR) (0.52) 15.47 (21.59)
Latin American Equity Fund A (10.74) 19.25 (8.17)B (11.63) 18.09 (9.13)C (11.47) 18.30 (8.90)I (10.17) 20.03 (7.55)
Z (10.12) 20.09 (7.54)Sustainable Asian Equity Fund5
A 25.33 17.70 (18.82)B 24.09 16.53 (19.62)I 26.24 18.53 (18.25)
Z 26.28 18.57 (18.21)US Active Factor Equity Fund
A 22.49 34.56 (12.79)I 23.37 35.49 (12.18)
Z 23.41 35.56 (12.14)US Advantage Fund A 75.62 25.53 0.96
AH (EUR) 72.14 21.75 (1.78)B 73.88 24.28 (0.06)
BH (EUR) 70.41 20.53 (2.76)C 74.22 24.53 0.14
CH (EUR) 70.79 20.79 (6.48)I 76.93 26.49 1.71
IH (EUR) 73.46 22.64 (1.04)IH (GBP) 73.03 2.48 n/a
N 78.30 (1.92) n/aNH (EUR) 74.75 (3.04) n/a
S 77.06 26.57 1.80Z 77.00 26.54 1.75

453 Morgan Stanley Investment Funds 31 December 2020
Appendix 5: Performance Summary^ (unaudited) (continued)As at 31 December 2020
Share Class
31 Dec 2020Year to Date %
31 Dec 2019Year to Date %
31 Dec 2018Year to Date %
US Advantage Fund ZH (EUR) 73.50 22.71 (1.00)(continued) ZH (GBP) 73.08 24.14 (0.06)
ZH3 (BRL)* 13.88 n/a n/aZHX (GBP) 73.10 0.08 n/a
ZX 77.00 26.53 1.77US Growth Fund A 115.52 21.40 4.78
AH (EUR) 111.27 17.62 1.98AX 115.52 21.42 4.78B 113.38 20.21 3.73
BH (EUR) 109.18 16.43 0.98C 113.80 20.45 3.94
CH (EUR) 109.59 16.69 1.16F 117.04 22.26 5.52I 117.14 22.32 5.58
IH (EUR) 113.06 (6.60) n/aIX 117.13 22.33 5.58N 118.84 (5.52) n/a
NH (EUR) 114.52 (6.60) n/aZ 117.23 22.38 5.62
ZH (EUR) 112.91 18.54 2.77ZHX (EUR) 112.94 18.56 (3.24)ZHX (GBP) 112.44 19.91 (2.36)
ZX 117.21 22.37 5.63US Insight Fund A 117.02 15.56 (10.67)
I* 11.88 n/a n/aZ 118.97 16.58 (9.85)
US Permanence Fund6 Z* 14.12 n/a n/aUS Property Fund A (19.10) 15.79 (10.82)
B (19.92) 14.66 (11.71)C (19.78) 14.84 (2.96)F (18.59) 16.55 (10.23)I (18.55) 16.61 (10.19)
Z (18.51) 16.66 (10.15)Emerging Markets Corporate Debt Fund
A 4.21 12.30 (5.24)AH (EUR) 2.61 8.95 (7.82)
AHX (EUR) 2.62 8.95 (7.82)AR 4.19 12.29 (5.21)AX 4.21 12.30 (5.26)B 3.14 11.21 (6.22)
BH (EUR) 1.62 7.84 (8.74)BHX (EUR) 1.61 7.82 (8.74)
BX 3.14 11.21 (6.20)C 3.47 11.55 (5.93)
CH (EUR) 1.92 8.19 (8.49)CHX (EUR) 1.92 8.16 (6.17)
CX 3.47 11.55 (4.27)I 5.00 13.15 (4.55)
IH (EUR) 3.38 9.74 (7.10)N 5.86 4.36 n/a
SHX (EUR) 3.40 9.85 (1.28)Z 5.00 13.22 (4.52)
ZH (EUR) 3.46 9.78 (7.08)ZHX (EUR) 3.45 9.78 (7.17)
Emerging Markets Debt Fund
A 6.06 13.73 (7.59)AH (EUR) 4.19 10.32 (10.15)
AHX (EUR) 4.19 10.33 (10.15)ARM 6.07 13.74 (7.62)
AX 6.06 13.72 (7.59)B 5.01 12.61 (8.51)
BH (EUR) 3.18 9.23 (11.02)BHX (EUR) 3.18 9.18 (11.04)
BX 4.98 12.64 (8.55)C 5.30 12.96 (8.25)
CH (EUR) 3.47 9.55 (7.40)CHX (EUR) 3.51 9.52 (7.40)
CX 5.32 12.93 (5.46)I 6.92 14.65 (6.83)
IH (EUR)*** 21.20 n/a n/aZ 6.96 14.68 (6.79)
ZH (EUR) 5.09 11.23 (9.38)Emerging Markets Domestic Debt Fund
A 2.08 12.37 (8.26)AH (EUR) 0.05 8.86 (11.07)
AHX (EUR) 0.10 8.82 (11.08)
Share Class
31 Dec 2020Year to Date %
31 Dec 2019Year to Date %
31 Dec 2018Year to Date %
Emerging Markets Domestic Debt Fund
ARM 2.07 12.38 (8.23)AX 2.07 12.34 (8.17)
(continued) B 1.04 11.25 (9.17)BH (EUR) (0.92) 7.78 (11.95)
BHX (EUR) (0.92) 7.81 (12.01)BX 1.05 11.24 (9.16)C 1.38 11.55 (8.88)
CH (EUR) (0.59) 8.07 (11.76)CHX (EUR) (0.59) 8.10 (11.78)
CX 1.33 11.60 (9.74)I 2.88 13.26 (7.47)
Z 2.94 13.31 (7.45)ZH (EUR) 0.92 9.77 (10.30)
ZX 2.94 13.30 (7.41)Emerging Markets Fixed Income Opportunities Fund
A 4.07 13.23 (7.96)AH (EUR) 2.18 9.80 (10.62)
AHR (EUR) 2.25 9.78 (10.65)B 2.99 12.12 (8.87)
BH (EUR) 1.17 8.70 (11.48)BHR (EUR) 1.19 8.72 (11.52)
C 3.51 12.68 (8.43)CH (EUR) 1.69 9.26 (11.06)
CHR (EUR) 1.70 9.21 (11.04)I 4.82 14.12 (9.04)
IH (EUR) 3.00 1.20 n/aNH (EUR) 3.78 11.50 (8.88)NH (GBP)* 2.76 n/a n/a
Z 4.85 14.13 (7.22)ZH (EUR) 3.04 1.24 n/a
Euro Bond Fund A 3.56 5.87 (0.80)B 2.62 4.80 (1.87)C 2.95 5.20 (1.49)I 4.04 6.27 (0.45)
N 4.57 (1.00) n/aZ 4.26 6.57 (0.30)
ZX 4.30 6.53 0.27Euro Corporate Bond Fund A 2.90 8.08 (3.69)
AH (USD) 4.50 11.30 (1.12)AX 2.89 8.12 (3.68)B 1.87 7.00 (4.64)
BX 1.87 7.01 (4.63)C 2.25 7.38 (4.32)
CX 2.20 7.40 (3.60)F 3.61 8.85 (2.99)
FX 3.59 8.88 (3.01)I 3.31 8.52 (3.29)
IH (USD) n/a n/a (0.69)IX 3.29 8.53 (3.29)N 3.86 0.56 n/a
NH (USD) 5.47 1.72 n/aS 3.62 8.77 (3.17)Z 3.33 8.58 (3.25)
ZH (CHF) 3.17 8.18 (3.16)ZH (USD) 4.94 11.85 (0.72)
ZHX (GBP) 4.00 0.63 n/aZX 3.35 8.55 (3.22)
Euro Corporate Bond – Duration Hedged Fund
A 2.01 7.20 (2.77)AX 2.01 7.21 (2.79)B 1.01 6.15 (3.26)
BX 0.99 6.11 (3.23)C 1.35 6.54 (3.09)I 2.43 7.63 (2.59)
N 2.94 2.00 n/aZ 2.45 7.67 (2.57)
Euro Strategic Bond Fund A 4.55 8.17 (1.35)AX 4.56 8.17 (1.34)B 3.50 7.12 (2.34)
BX 3.54 7.09 (2.33)C 3.86 7.48 (1.99)
CX 3.87 7.47 (2.22)I 4.98 8.62 (0.96)
N 5.48 (0.08) n/aZ 5.02 8.65 (0.93)

Morgan Stanley Investment Funds 31 December 2020 454
Appendix 5: Performance Summary^ (unaudited) (continued)As at 31 December 2020
Share Class
31 Dec 2020Year to Date %
31 Dec 2019Year to Date %
31 Dec 2018Year to Date %
European Fixed Income Opportunities Fund
A 2.47 4.44 (4.25)AR 2.49 4.42 (4.24)B 1.48 3.36 (5.19)
BR 1.47 3.36 (5.22)C 2.03 3.93 (4.67)
CR 2.04 3.90 (4.65)I 3.11 0.32 n/a
IR 3.11 0.30 n/aJ* 2.52 n/a n/aN* 2.88 n/a n/aZ 3.15 5.09 (3.64)
ZR 3.20 0.30 n/aEuropean High Yield Bond Fund
A 1.73 10.05 (4.88)AH (USD) 3.51 13.39 (2.33)
AX 1.78 10.06 (4.89)B 0.77 8.91 (5.79)
BX 0.74 8.98 (5.86)C 1.12 9.33 (5.51)
CX 1.12 9.33 (5.12)I 2.21 10.49 (4.47)
IH (USD) 3.88 13.84 (1.94)N 2.80 2.72 n/aZ 2.22 10.54 (4.46)
ZH (USD)* 9.16 n/a n/aZHX (GBP) 2.37 5.19 n/a
ZX 2.19 10.55 (4.48)Global Asset Backed Securities Fund
A 2.05 6.26 1.56AH (EUR) 0.57 3.09 (1.19)AH (GBP) 1.37 4.40 0.04AH (SEK) 1.03 3.38 (1.26)
AHR (EUR) 0.57 3.10 (0.27)AHX (EUR) 0.58 3.06 (0.22)
AR 2.04 6.28 1.53B 1.03 5.20 0.55
BH (EUR) (0.43) 2.08 (2.15)BHR (EUR) (0.45) 2.08 (2.19)BHX (EUR) (0.43) 2.06 (2.17)
C 1.41 5.64 0.97CH (EUR) (0.03) 2.50 (1.79)
CHR (EUR) (0.04) 2.47 (0.44)CHX (EUR) (0.03) 2.51 (1.77)
CX 1.42 5.67 0.91FH (EUR) 1.20 3.78 (0.40)
FHX (EUR) 1.20 3.77 (0.40)I 2.60 6.86 2.11
IH (EUR) 1.12 3.66 (0.65)IHX (EUR) 1.11 3.65 (0.63)
N 3.21 2.24 n/aZ 2.62 6.91 2.14
ZH (EUR) 1.15 3.68 (0.59)ZH (SEK) 1.62 3.99 (0.66)
ZHX (EUR)* 0.48 n/a n/aZHX (GBP) 1.97 5.05 0.89
ZX*** 0.56 n/a n/aGlobal Bond Fund A 10.05 8.33 (2.99)
AH (EUR) 8.11 5.01 (5.80)AHX (EUR) 8.15 5.02 (5.85)
AX 10.02 8.37 (3.00)B 8.96 7.25 (3.97)
BH (EUR) 7.08 3.97 (6.78)BHX (EUR) 7.04 4.03 (6.81)
BX 8.96 7.26 (3.98)C 9.36 7.62 (3.63)I 10.48 8.79 (2.63)
N* 4.84 n/a n/aNH (EUR)* 4.32 n/a n/a
NH1 (JPY) 5.15 4.85 n/aZ 10.52 8.82 (2.56)
ZH (EUR) 8.63 5.50 (5.39)ZH1 (EUR) 4.62 6.96 (2.29)
Global Buy and Hold 2020 Bond Fund7
A** n/a 4.19 (3.04)AR** n/a 4.19 (3.02)AX** n/a 4.17 (3.03)
Share Class
31 Dec 2020Year to Date %
31 Dec 2019Year to Date %
31 Dec 2018Year to Date %
Global Buy and Hold 2020 Bond Fund7 (continued)
B** n/a 3.12 (3.99)BR** n/a 3.15 (4.01)BX** n/a 3.14 (4.01)
I** n/a 4.44 (2.80)Z** n/a 4.48 (2.72)
Global Convertible Bond Fund
A 21.69 14.26 (4.14)AH (CHF) 19.42 10.54 (7.04)AH (EUR) 19.63 10.84 (6.72)
B 20.47 13.13 (5.12)BH (EUR) 18.46 9.72 (7.66)CH (EUR) 18.92 10.20 (7.30)
I 22.24 14.75 (3.69)IH (EUR) 20.20 11.35 (6.33)
N 23.11 5.60 n/aNH (CHF) 20.83 11.83 (6.00)
Z 22.30 14.82 (3.67)ZH (EUR) 20.23 11.34 (6.27)ZH (GBP) 20.41 12.69 (5.25)
ZHX (EUR) 20.23 11.38 (6.28)ZX** n/a 14.83 (3.65)
Global Credit Fund A 10.59 13.42 (5.55)B 9.44 12.34 (6.52)C 9.84 12.72 (6.19)I 11.02 13.86 (5.16)
Z 11.08 13.93 (5.15)ZH (GBP) 9.40 11.91 (2.64)
Global Fixed Income Opportunities Fund
A 3.99 9.29 (0.44)AH (AUD)* 2.56 n/a n/aAH (CHF) 2.15 5.58 (3.44)AH (EUR) 2.34 6.01 (3.09)
AHR (EUR) 2.35 5.98 (3.11)AHX (EUR) 2.36 5.99 (3.11)
AR 3.99 9.28 (0.44)ARM 3.99 9.30 (0.40)
AX 3.95 9.31 (0.43)B 2.94 8.18 (1.41)
BH (EUR) 1.33 4.96 (4.07)BHR (EUR) 1.33 4.95 (4.06)BHX (EUR) 1.34 4.98 (4.10)
BX 2.94 8.20 (1.43)C 3.51 8.81 (0.89)
CH (EUR) 1.89 5.56 (3.54)CHR (EUR) 1.89 5.52 (3.56)CHX (EUR) 1.87 5.54 (3.55)
CX 3.52 8.80 (1.40)I 4.63 9.92 0.18
IH (EUR) 3.00 6.64 (2.52)IR 4.63 9.93 0.18IX 4.58 9.96 0.15N 5.17 3.00 n/a
NH (GBP)* 3.36 n/a n/aNH (SGD) 4.68 3.32 n/a
Z 4.65 9.98 0.23ZH (CHF) 2.83 6.25 (2.84)ZH (EUR) 2.97 6.69 (2.46)
ZH3 (BRL) (18.46) 8.54 0.24ZHR (GBP) 3.58 8.07 (1.36)
ZX 4.66 9.98 0.23Global High Yield Bond Fund
A 4.70 12.73 (5.06)AH (EUR) 2.77 9.28 (7.73)
AHRM (ZAR) 8.88 3.01 n/aAHX (EUR) 2.77 9.27 (7.72)
AR 4.73 12.80 (5.07)ARM 4.72 2.64 n/a
AX 4.72 12.75 (5.10)B 3.66 11.61 (6.01)
BH (EUR) 1.76 8.19 (8.64)BHX (EUR) 1.76 8.17 (8.63)
BX 3.69 11.58 (6.03)C 4.07 12.08 (5.65)
CH (EUR) 2.16 8.65 (8.29)CHX (EUR) 2.15 8.62 (8.11)
CX 4.07 12.05 (6.11)

455 Morgan Stanley Investment Funds 31 December 2020
Appendix 5: Performance Summary^ (unaudited) (continued)As at 31 December 2020
Share Class
31 Dec 2020Year to Date %
31 Dec 2019Year to Date %
31 Dec 2018Year to Date %
Global High Yield Bond Fund (continued)
I 5.18 13.26 (4.66)IX 5.21 13.23 (4.66)N 5.89 4.60 n/aZ 5.21 13.30 (4.61)
ZH (EUR) 3.30 9.81 (7.24)Short Maturity Euro Bond Fund
A (0.74) 0.65 (1.81)B (1.71) (0.37) (2.78)C (1.38) – (2.43)I (0.31) 1.04 (1.39)
N 0.20 0.04 n/aNH (USD) 1.53 1.76 n/a
Z – 1.35 (1.27)Sustainable Euro Corporate Bond Fund8
A* 2.44 n/a n/aI* 2.76 n/a n/a
Z* 2.76 n/a n/aSustainable Euro Strategic Bond Fund9
A* 2.40 n/a n/aI* 2.72 n/a n/a
Z* 2.72 n/a n/aUS Dollar Corporate Bond Fund
A 10.18 16.16 (4.19)AH (EUR) n/a n/a (6.72)
I 10.69 16.72 (3.67)N* 5.00 n/a n/a
NH (EUR)* 4.44 n/a n/aZ 10.75 16.78 (3.63)
ZH (EUR)* 4.24 n/a n/aUS Dollar High Yield Bond Fund
A 4.37 14.38 (3.57)AH (EUR) 2.57 10.95 (6.11)
AR 4.37 14.37 (3.57)AX 4.35 14.43 (3.59)
BH (EUR) 1.55 9.90 (7.09)C 3.89 13.88 (4.02)
CH (EUR) 2.14 10.44 (6.52)CX*** 5.56 n/a n/a
I 5.23 15.30 (2.80)J 5.54 3.24 n/a
JH (EUR) 3.69 2.96 n/aN 5.83 5.04 n/aZ 5.24 15.60 (2.53)
ZH (EUR) 3.45 12.13 (5.11)ZHX (EUR) 3.42 12.07 (5.00)
US Dollar Short Duration Bond Fund
A 2.14 3.46 1.54I 2.52 3.81 1.88
N 2.68 1.68 n/aZ 2.55 3.92 1.92
US Dollar Short Duration High Yield Bond Fund
A 3.62 9.87 0.37AH (EUR) 1.82 6.57 (2.36)
AR 3.63 9.83 0.41AX 3.65 9.86 0.35
BH (EUR) 0.82 5.49 (3.33)C 3.33 9.52 0.07
CH (EUR) 1.49 6.24 (2.64)CX 3.33 9.53 0.05
I 4.30 10.60 1.03N 4.80 3.28 n/aZ 4.35 10.65 1.06
ZM* 7.03 n/a n/aGlobal Balanced Defensive Fund
A (1.08) 4.91 (2.96)B (2.08) 3.87 (3.92)C (1.78) 4.17 (3.62)Z (0.38) 5.59 (2.26)
Global Balanced Fund A (3.51) 7.28 (5.65)B (4.45) 6.22 (6.58)C (4.17) 6.52 (3.68)Z (2.57) 8.59 (4.43)
Global Balanced Income Fund
A (4.29) 7.87 (7.46)AHR (USD) (2.97) 11.07 (5.14)
AHRM (AUD) (3.92) 10.00 (2.29)AHRM (USD) (3.03) 11.06 (2.05)
AR (4.27) 7.88 (7.47)BR (5.20) 6.80 (8.37)
CHR (USD) (3.64) 10.26 (5.81)CR (4.96) 7.13 (8.10)
Share Class
31 Dec 2020Year to Date %
31 Dec 2019Year to Date %
31 Dec 2018Year to Date %
Global Balanced Income Fund (continued)
I (3.34) 9.12 (6.27)IHR (USD) (2.05) 12.39 (3.94)
IR (3.37) 9.16 (6.25)Z (3.32) 9.21 (6.23)
ZH (USD) (1.97) 12.39 (3.90)ZHR (GBP) (3.10) 10.53 (5.32)
ZR (3.31) 9.20 (6.25)Global Balanced Risk Control Fund of Funds
A 5.88 7.44 (5.70)AH (USD) 7.35 10.61 (3.31)
B 4.83 6.36 (6.64)C 5.12 6.71 (6.38)
CH (USD) 6.61 9.85 (4.02)I 7.20 8.78 (4.50)
IH (USD) 8.71 11.99 (2.08)Z 7.21 8.80 (4.51)
ZH (GBP) 7.60 10.06 (3.54)ZH3 (BRL) (22.32) 12.58 (3.04)ZH3 (COP) 5.51 12.25 (10.09)
Global Balanced Sustainable Fund10
A* 1.84 n/a n/aB* 1.32 n/a n/aC* 1.60 n/a n/aI* 2.32 n/a n/a
Z* 2.36 n/a n/aGlobal Multi-Asset Income Fund
AHR (USD) (1.11) 16.03 (1.92)AR (2.63) 12.61 (2.08)IR (1.63) 13.84 (2.04)Z (1.58) 13.87 0.04
Global Multi-Asset Opportunities Fund
A (6.64) (1.99) (3.60)AH (USD) (5.17) 0.91 (1.03)
B (7.55) (3.00) (4.52)C (7.29) (2.77) (4.28)I (5.66) (1.06) (2.61)
Z (5.65) (0.97) (2.57)ZH (CHF) (5.70) (1.43) (2.89)ZH (GBP) (5.35) 0.12 (1.47)ZH (USD) (4.15) 2.08 n/a
ZHX (GBP) (5.34) 0.12 (1.44)Multi-Asset Risk Control Fund
A 0.82 2.36 n/aI 1.79 2.60 n/a
Z 1.87 2.60 n/aReal Assets Fund A 0.11 7.52 n/a
I 1.07 8.36 n/aZ 1.11 8.40 n/a
Liquid Alpha Capture Fund A 8.65 8.80 (9.08)AH (EUR) 6.81 5.48 (7.55)BH (EUR) 5.75 4.47 (8.49)CH (EUR) 6.27 5.00 (8.05)
I 9.58 9.72 (8.68)N 10.26 10.43 (3.62)
1 Fund closed operations on 16 October 2020. 2 Formerly known as Global Counterpoint Fund prior to 15 May 2020. 3 Formerly known as European Champions Fund prior to 20 April 2020. 4 Fund merged into Europe Opportunity Fund on 20 April 2020. 5 Formerly known as Asian Equity Fund prior to 31 December 2020. 6 Fund commenced operations on 30 October 2020. 7 Fund merged into European Fixed Income Opportunities Fund on 9 November 2020. 8 Fund commenced operations on 31 July 2020. 9 Fund commenced operations on 31 July 2020. 10 Fund commenced operations on 30 June 2020. ^ Returns are with dividends consideration. * Share Class was launched during the year. ** Share class was closed during the year.*** Share class was reactivated during the year.
Past performance is no guarantee of future returns. In particular, any return illustrated in the Performance Summary will not necessarily continue at the levels shown.

Morgan Stanley Investment Funds 31 December 2020 456
Appendix 6: Risk Measurement and Global Exposure (unaudited)As at 31 December 2020As per ESMA/10-788 “Guidelines on Risk Measurement and the Calculation of Global Exposure and Counterparty Risk for UCITS” on annual report disclosure requirements, the Global Exposure table below outlines the following information:
• Each Fund’s approach to measuring global exposure.
• Where the Fund is using relative VaR to measure global exposure the reference portfolio is provided.
• Lowest, average and highest relative VaR or absolute VaR for each Fund measuring global exposure on the VaR approach (note these numbers are actual VaR and relative VaR numbers and do not represent utilisation levels of the regulatory limit).
• Relevant regulatory limit for the Funds global exposure approach for Funds using VaR approach.
• Average leverage is given at the Fund level where the Fund uses the VaR approach to measure global exposure.
• Leverage is calculated using the sum of the notionals approach and the commitment approach.
Fund Name Asset Class
Global Exposure
Expected Gross
Leverage
Average Leverage
(Sum of Notionals)
Global Exposure
Methodology Reference PortfolioRegulatory
Limit Lowest Average Highest
Absolute Return Fixed Income Fund Fixed Income Absolute VaR – 20% 0.9% 2.7% 6.6% 160% 66%Emerging Markets Corporate Debt Fund Fixed Income Relative VaR JP Morgan Corporate Emerging Markets
Bond Index – Broad Diversified 200% 103.3% 123.0% 133.0% 100% 0%Emerging Markets Debt Fund Fixed Income Relative VaR JP Morgan Emerging Markets Bond Index Global 200% 98.0% 108.9% 119.5% 100% 2%Emerging Markets Domestic Debt Fund Fixed Income Relative VaR JP Morgan Government Bond Index – Emerging Markets
Global Diversified Index 200% 100.6% 104.7% 107.6% 100% 12%Emerging Markets Fixed Income Opportunities Fund
Fixed Income Relative VaR Even blend of: (1) JP Morgan GBI-EM Global Diversified Index; (2) JP Morgan Emerging Markets Bond Index Global;
and (3) JP Morgan Corporate Emerging Markets Bond Index – Broad Diversified 200% 112.3% 125.1% 142.5% 100% 9%
Euro Bond Fund Fixed Income Relative VaR Barclays Euro-Aggregate A – or Better Index 200% 90.9% 101.8% 114.8% 100% 25%Euro Corporate Bond – Duration Hedged Fund Fixed Income Absolute VaR – 20% 1.2% 3.6% 8.5% 150% 99%Euro Corporate Bond Fund Fixed Income Relative VaR Barclays Euro-Aggregate Corporates Index 200% 91.2% 113.3% 131.6% 100% 32%Euro Strategic Bond – Duration Hedged Fund Fixed Income Absolute VaR – 20% 0.1% 1.0% 1.5% 150% 0%Euro Strategic Bond Fund Fixed Income Relative VaR Barclays Euro-Aggregate Index 200% 89.1% 116.5% 142.8% 130% 33%European High Yield Bond Fund Fixed Income Relative VaR BofA ML European Currency High Yield 3% Constrained Ex-Sub
Financials Index 200% 90.5% 112.5% 126.5% 100% 21%Global Asset Backed Securities Fund Fixed Income Absolute VaR – 20% 0.5% 1.6% 3.4% 160% 90%Global Balanced Defensive Fund Asset Allocation Absolute VaR – 20% 1.6% 3.2% 4.3% 100% 62%Global Balanced Fund Asset Allocation Absolute VaR – 20% 2.3% 4.9% 7.0% 100% 56%Global Balanced Income Fund Asset Allocation Absolute VaR – 20% 2.3% 5.1% 7.5% 100% 57%Global Balanced Risk Control Fund of Funds Asset Allocation Absolute VaR – 20% 2.5% 5.6% 7.5% 50% 14%Global Bond Fund Fixed Income Relative VaR Barclays Global Aggregate Index 200% 91.8% 114.6% 133.7% 200% 52%Global Brands Equity Income Fund Equity Relative VaR MSCI World Index 200% 83.5% 88.6% 98.5% 200% 190%Global Convertible Bond Fund Fixed Income Relative VaR Thomson Reuters Global Convertible Index Global Focus Hedged USD 200% 84.6% 96.6% 119.5% 100% 87%Global Credit Fund Fixed Income Relative VaR Barclays Global Aggregate Corporate Index 200% 93.5% 109.6% 137.8% 160% 51%Global Fixed Income Opportunities Fund Fixed Income Absolute VaR – 20% 1.0% 2.9% 7.3% 160% 65%Global High Yield Bond Fund Fixed Income Relative VaR Barclays Global High Yield – Corporate Index 200% 94.3% 109.6% 126.8% 100% 15%Global Infrastructure Unconstrained Fund Equity Absolute VaR – 20% 4.4% 14.4% 18.8% 185% 82%Global Multi-Asset Income Fund Asset Allocation Relative VaR 50% MSCI All-Country World Index and 50% Barclays Capital Global
Aggregate Bond Index 200% 68.7% 119.7% 145.5% 220% 184%Global Multi-Asset Opportunities Fund Asset Allocation Absolute VaR – 20% 2.2% 10.2% 16.8% 500% 304%Multi-Asset Risk Control Fund Asset Allocation Absolute VaR – 20% 2.2% 5.7% 8.2% 100% 40%Global Balanced Sustainable Fund Asset Allocation Absolute VaR – 20% 3.2% 4.9% 6.5% 100% 29%Liquid Alpha Capture Fund Alternatives Absolute VaR – 20% 3.9% 8.4% 14.7% 300% 43%US Dollar Corporate Bond Fund Fixed Income Relative VaR Barclays US Corporate Index 200% 95.2% 106.0% 128.4% 100% 50%US Dollar High Yield Bond Fund Fixed Income Relative VaR Barclays US Corporate High Yield Index 200% 88.2% 101.4% 119.0% 100% 0%US Dollar Short Duration High Yield Bond Fund Fixed Income Relative VaR Barclays US High Yield 1-5 Year Cash Pay 2% Issuer Capped Index 200% 89.7% 103.2% 118.2% 100% 0%

457 Morgan Stanley Investment Funds 31 December 2020
Appendix 6: Risk Measurement and Global Exposure (unaudited) (continued)As at 31 December 2020The Risk Criteria table below indicates the risk model type and inputs for the VaR calculation based on asset class, which is also displayed in the Global Exposure table above:
Asset Class Calculation Model Confidence Interval Holding Period Length of Data History
Alternatives / Asset Allocation Parametric 99% 20 days Weekly observations exponentially weighted with a 26-week (6 months) half-life using 2 years of data
Equity Parametric 99% 20 days The MSCI Barra model uses daily observations with two different half-lives – 252 for volatilities and 504 for correlations
Fixed Income Parametric 99% 20 days Weekly observations exponentially weighted with a 26-week (6 months) half-life using 2 years of data until May of 2020. Starting in May, monthly observations equally weighted using 5 years of data.

Morgan Stanley Investment Funds 31 December 2020 458
Appendix 7: Remuneration Policy of the Management Company (unaudited)As at 31 December 2020UCITS 2020 Remuneration Disclosure by MSIM Fund Management (Ireland) Limited to Morgan Stanley Investment Funds
1. Legal background
This remuneration disclosure has been prepared as required by, and in accordance with, the guidance provided in (1) EU Commission Recommendation on remuneration policies in the financial services sector (2009/384 EC) dated 30 April 2004 (“the Recommendation”); (2) EU Directive 2009/65/EC (as amended by Directive 2014/91/EU) (“the UCITS Directive”); and (3) the European Securities and Markets Authority’s “Guidelines on sound remuneration policies under the UCITS Directive”, (ESMA/2016/575) dated 14 October 2016 (“the Guidelines”) and in particular with section 14.1 (headed “External Disclosure”).
The data used in the analysis for this disclosure relates to the financial year ending December 31, 2020 of Morgan Stanley (“the Firm”) and to the remuneration of staff of MSIM Fund Management (Ireland) Limited (“the UCITS Management Company”) and its senior management team and other members of its staff whose actions have a material impact on the risk profile of the UCITS it manages or on the UCITS Management Company itself.
2. The “Identified Staff” for the purposes of this disclosure
The Guidelines define “Identified Staff” as follows:
a) “categories of staff, including senior management, risk takers, control functions, staff responsible for heading the investment management, administration, marketing, and any employee receiving total remuneration that falls into the remuneration bracket of senior management and risk takers, whose professional activities have a material impact on the management company’s risk profile or the risk profiles of UCITS that it manages” (“Group A”); and
b) “categories of staff of the entity(ies) to which investment management activities have been delegated by the management company and whose professional activities have a material impact on the UCITS’s risk profile or the risk profiles of UCITS that the UCITS management company manages” (“Group B”).
References in this disclosure letter to “Identified Staff” or to staff in Group A or Group B, should be construed accordingly.
No Identified Staff are employed or paid by the UCITS Management Company itself (as it has no employees). All of the Identified Staff are employees of other Morgan Stanley entities whose professional activities are considered to have a material impact on the risk profile of the UCITS managed by the UCITS Management Company, taking into consideration the internal organisation, nature, scope and complexity of the UCITS Management Company and the UCITS it manages.
The Identified Staff within Group A are staff who have been seconded to the UCITS Management Company and who are therefore subject to the Guidelines as adopted by the Central Bank of Ireland (CBI).
The Identified Staff in Group B are staff of one of the Morgan Stanley group entities to which the portfolio management of one or more of the UCITS Management Company’s Funds has been delegated pursuant to Article 13 of the UCITS Directive. They are not seconded to, or performing a function of, the UCITS Management Company. Accordingly they are not staff of the UCITS Management Company. Where appropriate they are subject to UCITS rules on remuneration.
3. Process for determining remuneration policies and principles
The UCITS Management Company, as an affiliate of Morgan Stanley, benefits from the resources available within the Firm and is subject to the remuneration policies and practices that are applied to all regulated entities of the Firm.
In determining, maintaining and implementing remuneration policies and practices applicable to the UCITS Management Company, including Identified Staff, the UCITS Management Company is subject to the remuneration policies and practices that apply to all Morgan Stanley International Limited (MSI) group entities as well as those applying to Morgan Stanley globally and may consult, or receive guidance from, the Firm’s control functions and relevant remuneration committees to ensure consistency. Remuneration policy is designed to satisfy four key Firm-wide remuneration objectives: (i) deliver pay for sustainable performance, (ii) align remuneration with shareholders’ interests, (iii) attract and retain top talent, and (iv) mitigate excessive risk-taking.
In support of these objectives, annual compensation (i.e. remuneration) for the majority of the Firm’s employees, including Identified Staff, is comprised of two key elements: fixed remuneration and variable remuneration (variable incentive remuneration) that is discretionary based on, among other factors, Firm performance measured against risk-adjusted metrics and individual and business segment performance.
The committee that manages remuneration for the Firm is the Compensation, Management Development and Succession Committee (CMDS Committee) of the Morgan Stanley Board of Directors. As of 31 December 2020, it consisted of five directors, all of whom are

459 Morgan Stanley Investment Funds 31 December 2020
independent under the New York Stock Exchange listing standards. Each year, the CMDS Committee’s mandate is to review the Firm-wide aggregate variable remuneration pool for variable incentive remuneration and to review and approve the design and structure of Morgan Stanley’s Firm-wide deferred incentive remuneration programs, including the form of deferred incentive remuneration awards to be granted, the portion of variable incentive remuneration to be deferred, and the vesting, payment, cancellation and clawback provisions of deferred incentive remuneration awards. The CMDS Committee has adopted the Global Incentive Compensation Discretion Policy, which applies to all Firm entities worldwide and sets forth guidance for managers on the use of discretion and considerations for assessing risk management and outcomes when making variable incentive remuneration decisions, and considerations for assessing risk management and outcomes. It has also approved the Global Compensation Policy which covers compensation philosophy and objectives, framework and governance.
In addition, the Board of the UCITS Management Company has adopted a remuneration policy (the “MSIM Fund Management (Ireland) Limited Remuneration Policy”) in compliance with UCITS and the Guidelines as adopted by the CBI.
The policy is also appropriate to the UCITS Management Company’s size, internal organization and the nature, scope and complexity of its activities. As well as complying with all of the UCITS management company’s legal obligations, the principles of the MSIM Fund Management (Ireland) Limited Remuneration Policy support the business strategy, objectives, values and long-term interests of its clients, including the Fund. In particular, the MSIM Fund Management (Ireland) Limited Remuneration Policy is designed to ensure that remuneration is consistent with and promotes sound and effective risk management and does not encourage risk taking that is inconsistent with the risk profile of the UCITS managed by the UCITS Management Company.
When determining its own remuneration decisions or influencing the decisions made by other Morgan Stanley entities, the UCITS Management Company takes fully into account and complies with (1) Irish, UK and EU legislation; (2) the MSIM Fund Management (Ireland) Limited Remuneration Policy and CBI requirements; and (3) the requirements of other remuneration policies set by the Firm. In doing so, it applies consistent principles with the objective of aligning the incentivisation of Identified Staff with business objectives, supporting the delivery of the UCITS Management Company’s business plans and corporate values, avoiding conflicts of interest and enabling the right calibre of staff to be recruited. The UCITS Management Company always seeks to ensure, therefore, that the remuneration principles applied by it and the Firm are consistent with and promote sound and effective risk management and do not encourage risk-taking that is inconsistent with the risk profiles, rules or instruments of incorporation of the UCITS managed by the UCITS Management Company.
The following considerations are taken into account in the design, implementation and oversight of the UCITS Management Company’s remuneration policies and practices:
• Overallcorporategovernanceprinciplesandstructuresaswellastheirinteractionswiththeremunerationsystem;
• Theinputsprovidedbyallcontrolfunctions(i.e.humanresources,riskmanagement,compliance,internalaudit,etc.),whichwillbe properly involved in the design of the Remuneration Policy, as further described below; and
• Thecleardistinctionbetweenoperatingandcontrolfunctions,thesafeguardsforpreventingconflictsofinterestsandtheinternalreporting system.
4. Involvement of control functions in risk management and the remuneration of those control functions
The control functions of the Firm assist the UCITS Management Company in implementing its overall remuneration strategy, having regard to operational, liquidity, market and counterparty risks.
In particular:
a. The Risk Management function helps to ensure that the structure and design of remuneration arrangements does not encourage risk taking that is inconsistent with the risk profile of the UCITS managed by the UCITS Management Company;
b. The Human Resources and Compliance functions analyse how the remuneration structure affects the UCITS Management Company’s compliance with legislation, regulations and internal policies;
c. The Internal Audit function periodically carries out an independent audit of the design, implementation and effects of Morgan Stanley’s remuneration policies;
d. The EMEA Remuneration Oversight Committee (EROC) provides formal oversight of EMEA remuneration matters to ensure remuneration practices in EMEA are compliant with relevant UK and EU legislation and follow good practice standards. The membership of the EROC is made up of the EMEA control function heads as well as the EMEA Chief Executive Officer.
Appendix 7: Remuneration Policy of the Management Company (unaudited) (continued)As at 31 December 2020

Morgan Stanley Investment Funds 31 December 2020 460
Appendix 7: Remuneration Policy of the Management Company (unaudited) (continued)As at 31 December 2020
The EROC reviews activities of the UCITS Management Company that may lead to individual or collective adjustments of remuneration for its employees; and
e. The MSI Remuneration Committee was established with effect from 1 January 2017. It is appointed by the Board of Directors of MSI to assist in discharging its obligations in relation to remuneration matters of MSI and its subsidiaries (the MSI Group) and identified material risk takers. Its remit includes reviewing the remuneration policies and practices of the UCITS Management Company in accordance with the Remuneration Code.
The Control Functions, including Risk Management, Compliance, Finance, Internal Audit, and Human Resources, along with Legal, are independent from the businesses they monitor. Those engaged in control functions are remunerated in accordance with objectives linked to their functions. Their objectives are independent of the financial performance of the UCITS of the UCITS Management Company. Potential conflicts that may arise in relation to individual compensation decisions are mitigated by the independent role of Human Resources in the year end compensation process.
5. Design and structure of remuneration
Remuneration paid to Identified Staff is awarded in accordance with Morgan Stanley principles relating to remuneration. Annual compensation is comprised of two key elements: fixed remuneration and variable remuneration. Staff eligibility for annual incentive compensation (variable remuneration) is discretionary and subject to a multi-dimensional performance measurement, which considers, as applicable, the performance of the individual, the UCITS Management Company, the business segment and the Firm.
Identified Staff receive a total annual remuneration package consisting of fixed pay that is comprised of base salary and, in certain circumstances, one or more allowances that are reviewed at least annually; and variable remuneration1, payable partially as a cash bonus and partially in the form of deferred incentive remuneration awards. The amount of variable incentive remuneration is discretionary and is determined on the basis of, but not limited to, a variety of factors, including performance measured against risk-adjusted metrics and individual performance. It is possible that an individual could be awarded no variable incentive remuneration. Deferred incentive remuneration awards are typically subject to vesting over a multi-year period and are subject to cancellation until the payment date for competition, cause (i.e., any act or omission that constitutes a breach of obligation to the Company, including failure to comply with internal compliance, ethics or risk management standards, and failure or refusal to perform duties satisfactorily, including supervisory and management duties), disclosure of proprietary information, and solicitation of employees or clients. Awards are also subject to malus until the payment date if an employee’s act or omission (including with respect to direct supervisory responsibilities) causes a restatement of the Firm’s consolidated financial results, constitutes a violation of the Firm’s global risk management principles, policies and standards, or causes a loss of revenue associated with a position on which the employee was paid and the employee operated outside of internal control policies.
The UCITS Management Company competes for access to talent globally with investment management firms, private equity firms, hedge funds, investment banks, brokerage firms and other companies offering financial services, and the UCITS Management Company’s ability to sustain or improve its position in this highly competitive environment depends substantially on its ability to continue to attract and retain the most qualified individuals. In support of the UCITS Management Company’s recruitment and retention objectives, the Firm continually monitors competitive pay levels and structures its incentive awards to include, among other things, vesting, deferred payment and cancellation provisions that protect the UCITS Management Company’s interests and align the interests of Identified Staff with those of the UCITS’ investors.
The Firm’s Global Incentive Compensation Discretion Policy requires compensation managers to consider only legitimate, business related factors when exercising discretion in determining variable incentive compensation, including adherence to Morgan Stanley’s core values, conduct, disciplinary actions in the current performance year, risk management and risk outcomes. The policy specifically provides that all managers must consider whether or not an individual managed risk appropriately and effectively managed and supervised the risk control practices of his or her reports during the performance year. Compensation managers are trained on the Global Incentive Compensation Discretion Policy and are required to certify that they have followed the requirements of that policy and have escalated situations potentially requiring attention.
Other performance criteria that may be taken into account in deciding whether to award, and the amount of any variable incentive remuneration to award, includes (but is not limited to):
• businessandmarketconditions;
• individualconduct,includingbutnotlimitedto,adherencetoMorganStanley’scodeofconductandpolicies;
1 The Firm does not award variable remuneration to a non-executive director for their non-executive director role.

461 Morgan Stanley Investment Funds 31 December 2020
Appendix 7: Remuneration Policy of the Management Company (unaudited) (continued)As at 31 December 2020
• contributiontotheperformanceandprofitabilityofthebusinessunit,theUCITSManagementCompanyandtheFirm;
• contributiontothestrategicobjectivesoftheUCITSManagementCompany,businessunit,theFirmandtheteam;
• revenueandprofitabilityoffundsmanagedbyaportfoliomanager;
• assetsmanagedbyaportfoliomanager;and
• contributiontoclientobjectives.
6. Quantitative remuneration disclosure2: scope of disclosure
We are required to disclose and include in this report certain aggregate remuneration details for (1) the entire staff of the UCITS Management Company 3, (2) the UCITS Management Company’s senior management team and other members of its staff whose actions have a material impact on the risk profile of the UCITS the UCITS Management Company manages or on the UCITS Management Company itself 4, and (3) the staff of the delegate of the UCITS Management Company to whom investment management functions (including risk management) have been delegated.
As explained above, however, the UCITS Management Company has no employees. Its staff are all secondees.
7. Quantitative remuneration disclosure: financial information
The requisite remuneration information in respect of the 2020 financial year ending December 31, 2020, was as follows:
a. The total fixed remuneration paid to all staff of the UCITS Management Company’s was USD 1,202,831.
b. The total variable remuneration (variable incentive compensation) paid to all staff of the UCITS Management Company was USD 3,836,526.
c. The number of individuals included as UCITS Management Company’s staff was 139.
d. The total remuneration (fixed and variable combined) paid to senior management and other members of staff whose actions have a material impact on the risk profile of the UCITS or on the UCITS Management Company itself was USD 3,328,562.
8. Quantitative remuneration disclosure: rationale for apportionment
In calculating the “remuneration paid” to the staff in a) to d) above, we have, in accordance with the UCITS Directive and the Guidelines, adopted a proportionate approach and included a relevant proportion of staff’s total remuneration. The apportionment method takes in to account a number of factors including, but not limited to; number of accounts managed by investment managers, number of accounts of the contracting entity, headcount of the Investment Management business as a proportion of the Institutional Securities Group and Investment Management Group overall headcount.
MSIM Fund Management (Ireland) Limited
7 April 2021
2 Identified Staff and their associated remuneration are not allocated to individual UCITS so a breakdown by UCITS Fund does not exist and is not readily available.3 Article 69 (3) (a) of the UCITS Directive.4 Article 69 (3) (b) of the UCITS Directive and section 14 of the Guidelines.

Morgan Stanley Investment Funds 31 December 2020 462
Appendix 8: Securities Financing Transactions (unaudited)As at 31 December 2020The Company engages in Securities Financing Transactions (as defined in Article 3 of Regulation (EU) 2015/2365, securities financing transactions include repurchase transactions, securities or commodities lending and securities or commodities borrowing, buy-sell back transactions or sell-buy back transactions and margin lending transactions). In accordance with Article 13 of the Regulation, the Company’s only involvement in and exposures related to securities financing transactions is its engagement on securities lending activities and Total Return Swaps for the year ended 31 December 2020 as detailed below:
SECURITIES LENDING
Global Data
Amount of securities on loan and amount of assets engaged in securities lending transactions
The following table represents the total value of assets engaged in securities lending as at year end. The total value of securities on loan as a proportion of the Funds’ total lendable assets as at year end is also detailed below. Total lendable assets represents the aggregate value of asset types forming part of the Funds’ securities lending programme.
Fund Name Fund Currency
Market value of loaned securities
in Fund Currency% of Total
Lendable Assets*% Total
Net Asset Value
Asian Property Fund USD 9,706,036 11.55 11.44Counterpoint Global Fund USD 362,030 3.96 3.68Emerging Markets Equity Fund USD 12,987,215 1.72 1.69Emerging Markets Small Cap Equity Fund USD 412,312 2.66 2.65European Property Fund EUR 2,923,611 7.61 7.45Global Infrastructure Fund USD 22,796,687 2.69 2.59Global Opportunity Fund USD 6,362,954 0.03 0.03Global Property Fund USD 38,783,810 6.43 6.25Sustainable Asian Equity Fund USD 468,052 1.31 1.25US Advantage Fund USD 89,911,320 0.62 0.58US Growth Fund USD 228,196,977 3.70 3.34US Insight Fund USD 3,695,327 3.68 3.29Emerging Markets Corporate Debt Fund USD 153,310,731 12.55 11.88Emerging Markets Debt Fund USD 44,023,121 23.14 22.19Emerging Markets Domestic Debt Fund USD 16,529,798 10.21 9.85Euro Bond Fund EUR 53,774,391 6.90 6.73Euro Corporate Bond Fund EUR 489,459,331 14.04 13.73Euro Strategic Bond Fund EUR 155,831,060 8.86 8.39European High Yield Bond Fund EUR 186,722,972 23.71 22.49Global Bond Fund USD 55,546,449 3.32 3.08Global Convertible Bond Fund USD 29,654,676 6.99 6.49Global Fixed Income Opportunities Fund USD 143,515,885 3.02 2.83Short Maturity Euro Bond Fund EUR 58,331,058 4.77 4.54
* Total lendable assets excludes cash and cash equivalents. It also excludes other monetary amounts such as net debtors and creditors which are not deemed “lendable assets”.
Concentration Data
Ten largest collateral issuers
The following table lists the ten largest issuers by value of non-cash collateral received by the Funds across securities lending transactions as at year end:
COLLATERAL MARKET VALUE (in Fund Currency)
Asian Property
Fund
Counterpoint Global
Fund
Emerging Markets
Equity Fund
Emerging Markets
Small Cap Equity Fund
European Property
Fund
Global Infrastructure
Fund
Global Opportunity
Fund
Global Property
Fund
Issuer USD USD USD USD EUR USD USD USD
Austrian Government 916,251 25,919 350,100 52,915 11,401 6,580,249 – 7,958,466Belgian Government 1,803,663 53,348 766,011 108,703 131,124 4,154,019 – 3,996,918Dutch Government 330,074 2,555 77,739 5,477 140,442 225,979 – 769,430Finnish Government 2,349 53 – 331 – – – –French Government 3,523,748 49,456 1,606,750 84,369 1,280,896 3,598,192 110,049 8,516,542German Government 1,178,541 13,778 352,248 25,997 433,629 1,922,735 – 2,823,291UK Government 1,857,761 47,632 1,267,401 89,109 946,588 4,617,979 1,968,404 15,885,870US Government 639,235 189,618 9,400,517 69,216 141,827 3,076,728 4,631,903 991,446

463 Morgan Stanley Investment Funds 31 December 2020
Appendix 8: Securities Financing Transactions (unaudited) (continued)As at 31 December 2020
COLLATERAL MARKET VALUE (in Fund Currency)
Sustainable Asian
Equity Fund
US Advantage
Fund
US Growth
Fund
US Insight
Fund
Emerging Markets
Corporate Debt Fund
Emerging Markets
Debt Fund
Emerging Markets
Domestic Debt Fund
Euro Bond Fund
Issuer USD USD USD USD USD USD USD EUR
Austrian Government 22,843 6,582,433 3,488,168 605,886 4,926,860 1,733,726 – 2,058,888Belgian Government 45,709 12,987,601 6,882,400 1,195,456 18,638,040 4,398,203 3,585,077 5,223,092Dutch Government – – – – 20,463,208 7,200,853 – 8,551,382Finnish Government – – – – 60,049 15,132 9,955 17,970French Government 150,298 8,510,443 4,509,861 783,352 26,727,646 9,060,137 572,721 10,759,379German Government 11,762 1,632,901 865,308 150,302 93,742,352 24,516,347 14,057,123 29,114,422UK Government 255,304 65,050,255 98,229,160 1,156,024 – – – –US Government 9,164 137,736 127,228,279 20,068 – – – –
Euro Corporate
Bond Fund
Euro Strategic
Bond Fund
European High Yield
Bond Fund
Global Bond Fund
Global Convertible
Bond Fund
Global Fixed
Income Opportunities
Fund
Short Maturity
Euro Bond Fund
Issuer EUR EUR EUR USD USD USD EUR
Austrian Government 18,740,188 19,717,597 7,158,274 1,777,267 300,877 4,632,905 2,233,352Belgian Government 47,541,050 7,750,045 18,159,470 6,602,448 905,372 16,964,321 5,665,680Dutch Government 77,835,450 10,455,043 29,731,159 7,381,694 2,882 19,242,296 9,275,999Finnish Government 163,566 2,258,564 62,478 21,326 19 54,907 19,493French Government 97,932,829 88,920,505 37,407,846 9,622,158 16,551,317 25,043,241 11,671,093German Government 265,002,083 19,762,150 101,224,044 33,341,817 526,754 85,946,888 31,581,484UK Government – 10,507,827 – – 12,296,607 – –US Government – 1,398,167 – – 669,920 – –
Top ten counterparties
The following table provides details of the top ten counterparties (based on gross volume of outstanding transactions) in respect of securities lending transactions as at year end. The Company is protected from borrower default by an indemnification provided by the lending agent, JPMorgan Chase Bank NA London Branch. If a borrower defaults, the lending agent would sell the collateral and use the proceeds to purchase the security that was not returned in the market. If the proceeds from the sale of the collateral are not enough to purchase the security the lending agent is liable for the difference. Therefore it is the lending agent (JPMorgan Chase Bank NA London Branch) who has the liability.
Fund Name Fund Currency Counterparty (Lending Agent) Incorporation Country
Market value of loaned securities
in Fund Currency
Asian Property Fund USD JPMorgan Chase Bank NA London Branch United Kingdom 9,706,036Counterpoint Global Fund USD JPMorgan Chase Bank NA London Branch United Kingdom 362,030Emerging Markets Equity Fund USD JPMorgan Chase Bank NA London Branch United Kingdom 12,987,215Emerging Markets Small Cap Equity Fund USD JPMorgan Chase Bank NA London Branch United Kingdom 412,312European Property Fund EUR JPMorgan Chase Bank NA London Branch United Kingdom 2,923,611Global Infrastructure Fund USD JPMorgan Chase Bank NA London Branch United Kingdom 22,796,687Global Opportunity Fund USD JPMorgan Chase Bank NA London Branch United Kingdom 6,362,954Global Property Fund USD JPMorgan Chase Bank NA London Branch United Kingdom 38,783,810Sustainable Asian Equity Fund USD JPMorgan Chase Bank NA London Branch United Kingdom 468,052US Advantage Fund USD JPMorgan Chase Bank NA London Branch United Kingdom 89,911,320US Growth Fund USD JPMorgan Chase Bank NA London Branch United Kingdom 228,196,977US Insight Fund USD JPMorgan Chase Bank NA London Branch United Kingdom 3,695,327Emerging Markets Corporate Debt Fund USD JPMorgan Chase Bank NA London Branch United Kingdom 153,310,731Emerging Markets Debt Fund USD JPMorgan Chase Bank NA London Branch United Kingdom 44,023,121Emerging Markets Domestic Debt Fund USD JPMorgan Chase Bank NA London Branch United Kingdom 16,529,798Euro Bond Fund EUR JPMorgan Chase Bank NA London Branch United Kingdom 53,774,391Euro Corporate Bond Fund EUR JPMorgan Chase Bank NA London Branch United Kingdom 489,459,331Euro Strategic Bond Fund EUR JPMorgan Chase Bank NA London Branch United Kingdom 155,831,060European High Yield Bond Fund EUR JPMorgan Chase Bank NA London Branch United Kingdom 186,722,972Global Bond Fund USD JPMorgan Chase Bank NA London Branch United Kingdom 55,546,449Global Convertible Bond Fund USD JPMorgan Chase Bank NA London Branch United Kingdom 29,654,676Global Fixed Income Opportunities Fund USD JPMorgan Chase Bank NA London Branch United Kingdom 143,515,885Short Maturity Euro Bond Fund EUR JPMorgan Chase Bank NA London Branch United Kingdom 58,331,058

Morgan Stanley Investment Funds 31 December 2020 464
Appendix 8: Securities Financing Transactions (unaudited) (continued)As at 31 December 2020Aggregate transaction data
Type and quality of collateral
Non-cash collateral received by each Fund in respect of securities lending transactions as at year end is in the form of government bonds issued by the following countries: Austria, Belgium, Germany, Finland, France, UK, Netherlands and USA.
All of the Funds’ securities collateral have a credit rating of investment grade. Quality of collateral has been interpreted as pertaining to bond instruments, which have been assessed and reported in accordance with whether they are considered investment grade, below investment grade or not-rated. These designations are derived from the credit rating issued to the security or its issuer by at least one globally recognised credit rating agency, such as Standard & Poor’s and Moody’s. Bond instruments with a credit rating between ‘AAA’ and ‘BBB’ are deemed as investment grade. Credit ratings for bonds below these designations are considered below investment grade.
COLLATERAL MARKET VALUE (in Fund Currency)
Fund Name Fund Currency Quality Total
Asian Property Fund USD Investment grade 10,251,622Counterpoint Global Fund USD Investment grade 382,359Emerging Markets Equity Fund USD Investment grade 13,820,766Emerging Markets Small Cap Equity Fund USD Investment grade 436,117European Property Fund EUR Investment grade 3,085,907Global Infrastructure Fund USD Investment grade 24,175,881Global Opportunity Fund USD Investment grade 6,710,356Global Property Fund USD Investment grade 40,941,963Sustainable Asian Equity Fund USD Investment grade 495,080US Advantage Fund USD Investment grade 94,901,369US Growth Fund USD Investment grade 241,203,176US Insight Fund USD Investment grade 3,911,088Emerging Markets Corporate Debt Fund USD Investment grade 164,558,155Emerging Markets Debt Fund USD Investment grade 46,924,398Emerging Markets Domestic Debt Fund USD Investment grade 18,224,876Euro Bond Fund EUR Investment grade 55,725,133Euro Corporate Bond Fund EUR Investment grade 507,215,166Euro Strategic Bond Fund EUR Investment grade 160,769,898European High Yield Bond Fund EUR Investment grade 193,743,271Global Bond Fund USD Investment grade 58,746,710Global Convertible Bond Fund USD Investment grade 31,253,748Global Fixed Income Opportunities Fund USD Investment grade 151,884,558Short Maturity Euro Bond Fund EUR Investment grade 60,447,101
Maturity tenor of collateral
The following table provides an analysis of the maturity tenor of collateral received in relation to the securities lending transactions as at year end:
COLLATERAL MARKET VALUE (in Fund Currency)
Fund NameFund Currency 1 day
2 to 6 days
1 to 4 weeks
1 to 3 months
3 to 12 months
more than 1 year
open maturity
Asian Property Fund USD – – – 1,770 2,432 10,247,420 –Counterpoint Global Fund USD – – 164 102 183 381,910 –Emerging Markets Equity Fund USD – – 828,821 314,231 504,421 12,173,293 –Emerging Markets Small Cap Equity Fund USD – – – 249 343 435,525 –European Property Fund EUR – – 8,252 3,128 5,022 3,069,505 –Global Infrastructure Fund USD – – – 334,271 142,285 23,699,325 –Global Opportunity Fund USD – – – – – 6,710,356 –Global Property Fund USD – – – – – 40,941,963 –Sustainable Asian Equity Fund USD – – – – – 495,080 –US Advantage Fund USD – – – – – 94,901,369 –US Growth Fund USD – – 14,390,585 8,728,666 8,124,665 209,959,260 –US Insight Fund USD – – – – – 3,911,088 –Emerging Markets Corporate Debt Fund USD – – – – – 164,558,155 –Emerging Markets Debt Fund USD – – – – – 46,924,398 –Emerging Markets Domestic Debt Fund USD – – – – – 18,224,876 –Euro Bond Fund EUR – – – – – 55,725,133 –Euro Corporate Bond Fund EUR – – – – – 507,215,166 –Euro Strategic Bond Fund EUR – 706 598,793 7,900,878 9,326,706 142,942,815 –European High Yield Bond Fund EUR – – – – – 193,743,271 –Global Bond Fund USD – – – – – 58,746,710 –Global Convertible Bond Fund USD – 31 464 16,141 344,746 30,892,366 –Global Fixed Income Opportunities Fund USD – – – – – 151,884,558 –Short Maturity Euro Bond Fund EUR – – – – – 60,447,101 –

465 Morgan Stanley Investment Funds 31 December 2020
Currency of collateral
The following table provides an analysis of the currency profile of collateral received in relation to the securities lending transactions as at year end:
COLLATERAL MARKET VALUE (in Fund Currency)
Fund Name Fund Currency EUR GBP USD
Asian Property Fund USD 7,754,626 1,408,204 1,088,792Counterpoint Global Fund USD 145,109 47,632 189,618Emerging Markets Equity Fund USD 3,152,848 1,267,401 9,400,517Emerging Markets Small Cap Equity Fund USD 277,791 89,110 69,216European Property Fund EUR 1,997,492 946,588 141,827Global Infrastructure Fund USD 16,481,175 4,617,978 3,076,728Global Opportunity Fund USD 110,049 1,968,404 4,631,903Global Property Fund USD 24,064,647 4,794,313 12,083,003Sustainable Asian Equity Fund USD 230,611 255,304 9,165US Advantage Fund USD 29,713,378 65,050,255 137,736US Growth Fund USD 15,745,737 98,229,160 127,228,279US Insight Fund USD 2,734,996 1,156,024 20,068Emerging Markets Corporate Debt Fund USD 164,558,155 – –Emerging Markets Debt Fund USD 46,924,398 – –Emerging Markets Domestic Debt Fund USD 18,224,876 – –Euro Bond Fund EUR 55,725,133 – –Euro Corporate Bond Fund EUR 507,215,166 – –Euro Strategic Bond Fund EUR 148,863,904 10,507,827 1,398,167European High Yield Bond Fund EUR 193,743,271 – –Global Bond Fund USD 58,746,710 – –Global Convertible Bond Fund USD 18,287,221 5,034,734 7,931,793Global Fixed Income Opportunities Fund USD 151,884,558 – –Short Maturity Euro Bond Fund EUR 60,447,101 – –
Maturity tenor of securities lending transactions
All securities on loan can be recalled at any point and therefore have a maturity tenor of one day.
Country in which counterparties are established
The country in which counterparties are established is disclosed under the section “Top ten counterparties” on page 463.
Settlement and clearing
The Company’s securities lending transactions, including related collateral, are settled and cleared on a tri-party basis.
Re-use of collateral
Non-cash collateral received by a Fund may not be sold, re-invested or pledged. As the collateral in receipt for securities lending is entirely in the form of securities, there is no reuse of securities lending collateral.
Safekeeping of collateral
Collateral received
JPMorgan Chase Bank NA London Branch, as securities lending agent of the Funds, is responsible for the safekeeping of the collateral received in respect of securities lending transactions as at year end. The Custodian J.P. Morgan Bank Luxembourg S.A. is ultimately liable for any loss of instruments held in custody or by a third party to whom custody had been delegated (the sub-custody).
Collateral granted
No collateral is granted by the Company as part of their securities lending activities.
Return and cost
The total income earned from securities lending transactions is split between the relevant Funds and the securities lending agent. Details of this split are disclosed in note 3 to the financial statements on pages 423 to 424. Income earned during the year by the Funds from securities lending transactions is disclosed in the statement of operations and changes in net assets on pages 388 to 402.
Appendix 8: Securities Financing Transactions (unaudited) (continued)As at 31 December 2020

Morgan Stanley Investment Funds 31 December 2020 466
Appendix 8: Securities Financing Transactions (unaudited) (continued)As at 31 December 2020TOTAL RETURN SwAPS
Global Data
Amount of assets engaged in Total Return Swaps
The following table represents the total value engaged in Total Return Swaps as at year end:
Fund Name Fund Currency
Unrealised Gain and Loss in Fund Currency
(in absolute value)% of Total
Net Asset Value
Global Brands Equity Income Fund USD 2,113,470 0.45Global Multi-Asset Income Fund EUR 157,731 1.02Global Multi-Asset Opportunities Fund EUR 756,820 1.18
Concentration Data
Ten largest collateral issuers
There are no collaterals received in respect of total return swap contracts. Therefore the ten largest collateral issuers disclosure is not applicable.
Top ten counterparties
The following table provides details of the top ten counterparties (based on gross volume of outstanding transactions) in respect of the total return swaps as at year end. It also includes all counterparties in respect of the total return swaps at the year end.
Unrealised Gain and Loss in Fund Currency (in absolute value)
Global Brands
Equity Income Fund
Global Multi-Asset
Income Fund
Global Multi-Asset
Opportunities Fund
Counterparties Incorporation Country USD EUR EUR
Barclays Bank PLC United Kingdom – 54,290 –BNP Paribas France – 103,441 101,096JPMorgan Chase Bank N.A. United States of America – – 655,724Morgan Stanley & Co. International PLC United States of America 2,113,470 – –
Aggregate transaction data
Type and quality of collateral and currency of collateral
This disclosure is required for collateral received only where there is a counterparty risk.
At the time of writing, it is not possible to identify the value of cash collateral specific to the different types of OTC derivatives where multiple types of OTC derivatives are traded with the same counterparty. This is a consequence of counterparties calculating and recording cash collateral based on the aggregated position of all OTC derivatives traded between the counterparty and its client. This calculation methodology is compliant with the International Swaps and Derivatives Associations, Inc. Master Agreement (“ISDA Master Agreement”) in place and is considered standard market practice within the industry. As a result, it is not practically possible to disclose cash collateral values specific to individual positions held by the Funds in total return swaps. Any cash collateral disclosures provided below are in respect of all OTC derivative transactions entered into by the Funds under the ISDA Master Agreement, not just total return swaps.

467 Morgan Stanley Investment Funds 31 December 2020
Appendix 8: Securities Financing Transactions (unaudited) (continued)As at 31 December 2020Maturity tenor of total return swaps transactions
The following table provides an analysis of the maturity tenor in respect of the total return swaps as at year end:
Unrealised Gain and Loss in Fund Currency (in absolute value)
Global Brands
Equity Income Fund
Global Multi-Asset
Income Fund
Global Multi-Asset
Opportunities Fund
Maturity USD EUR EUR
1 day – – –2 to 6 days – – –1 to 4 weeks – 83,584 –1 to 3 months – 31,413 –3 to 12 months 2,113,470 42,734 756,820more than 1 year – – –open maturity – – –
The above maturity tenor analysis has been based on the contractual maturity date.
Country in which counterparties are established
The country in which counterparties are established is disclosed under the section “Top ten counterparties” on page 466.
Settlement and clearing
OTC derivative transactions are entered into by the Funds under an ISDA Master Agreement, a bilateral agreement between the Funds and a counterparty that governs OTC derivative transactions (including total return swaps) entered into by the parties.
Re-use of collateral
Cash collateral received in respect of OTC derivative transactions was invested from time to time for certain Funds as foreseen with the Company’s prospectus. The performance returns from the re-use of cash collateral are not available.
The returns below for Morgan Stanley Liquidity Funds, a UCITS advised by an affiliate of the Investment Adviser, represent a reasonable estimate of returns received from the re-investment of cash collateral for the year ended 31 December 2020:
Morgan Stanley Liquidity Funds (MSLF) Sub-Fund Net Return
US Dollar Liquidity Fund 0.67%US Dollar Treasury Liquidity Fund 0.48%Euro Liquidity Fund (0.49%)
Safekeeping of collateral
Collateral received
J.P. Morgan Bank Luxembourg S.A. is responsible for the safekeeping of the collaterals received in respect of total return swaps as at year end. The Custodian J.P. Morgan Bank Luxembourg S.A. is ultimately liable for any loss of instruments held in custody or by a third party to whom custody had been delegated (the sub-custody).
COLLATERAL VALUE (in Fund Currency)
Global Brands
Equity Income Fund
Global Multi-Asset
Income Fund
Global Multi-Asset
Opportunities Fund
Safekeeping of collateral Type USD EUR EUR
Segregated Cash – – 420,000*
* Collateral received in respect of total return swaps, inflation rate swaps, credit default swaps and OTC forward currency exchange contracts. Please refer to the derivative instruments and collateral received and paid listed within the Statements of Investments on pages 7 to 373 for further details.

Morgan Stanley Investment Funds 31 December 2020 468
Appendix 8: Securities Financing Transactions (unaudited) (continued)As at 31 December 2020Collateral granted
The following table provides an analysis of the amount held in segregated account in relation to collateral granted by the Global Brands Equity Income Fund, Global Multi-Asset Income Fund and Global Multi-Asset Opportunities Fund in respect of OTC derivative transactions (including total return swaps, interest rate swaps, inflation rate swaps, credit default swaps and OTC forward currency exchange contracts), as at year end.
COLLATERAL VALUE (in Fund Currency)
Global Brands
Equity Income Fund
Global Multi-Asset
Income Fund
Global Multi-Asset
Opportunities Fund
Safekeeping of collateral Type USD EUR EUR
Segregated Cash 140,000* – –
* Collateral granted in respect of total return swaps, inflation rate swaps, credit default swaps and OTC forward currency exchange contracts. Please refer to the derivative instruments and collateral received and paid listed within the Statements of Investments on pages 7 to 373 for further details.
Return and cost
All returns from OTC derivative transactions will accrue to the Funds and are not subject to any returns sharing arrangements with the Fund’s Manager or any other third parties. Returns from those instruments are disclosed in the statement of operations and changes in net assets on pages 388 to 402.
The following table provides an analysis of return and cost in respect of the total return swaps as at year end:
GlobalBrands Equity
IncomeFund
GlobalMulti-Asset
IncomeFund
Global Multi-Asset
Opportunities Fund
USD EUR EUR
ReturnInterest received on total return swap transactions 8,614,566 4,860 34,765Net realised gain/(loss) on total return swap contracts (10,800,276) 102,473 2,772,799Net change in unrealised appreciation/(depreciation) on total return swap contracts 31,621 19,516 96,594
(2,154,089) 126,849 2,904,158
CostInterest paid on total return swap transactions – (21,543) (41,204)
– (21,543) (41,204)
Net Return (2,154,089) 105,306 2,862,954


www.morganstanleyinvestmentfunds.com CN A
R SI
CAV
20