Embed Size (px)
Citation preview

Socio-economic status or class
ALLMARK, Peter <http://orcid.org/0000-0002-3314-8947> and GRIMSLEY, Mike
Available from Sheffield Hallam University Research Archive (SHURA) at:
http://shura.shu.ac.uk/3931/
This document is the author deposited version. You are advised to consult the publisher's version if you wish to cite from it.
Published version
ALLMARK, Peter and GRIMSLEY, Mike (2010). Socio-economic status or class. In: ALLMARK, Peter, SALWAY, Sarah and PIERCY, Hilary, (eds.) Life and health: an evidence review and synthesis for the Equality and Human Rights Commission's triennial review. Sheffield, Equality and Human Rights Commission.
Copyright and re-use policy
See http://shura.shu.ac.uk/information.html
Sheffield Hallam University Research Archivehttp://shura.shu.ac.uk

Equality and Human Rights Commission: Evidence analysis for the triennial review: Lot 1 - Life and Health Key messages: 4. Socio-economic status or class
1
Chapter 4: Socio-economic status or
class
Peter Allmark1 and Mike Grimsley2
Acknowledgement: Ben Anderson made helpful comments on an earlier draft.
1 Centre for Health and Social Care Research, Sheffield Hallam University
2 Sheffield Hallam University

Equality and Human Rights Commission: Evidence analysis for the triennial review: Lot 1 - Life and Health Key messages: 4. Socio-economic status or class
2
CONTENTS
Tables ....................................................................................................................................... 5
Figures .................................................................................................................................... 11
Chapter 4: Socio-economic status or class ...................................................................... 13
4.1 Key messages ................................................................................................................ 13
4.2 SES Evidence ................................................................................................................. 22
4.3 Life: main indicators - commentary ............................................................................. 24
4.3.1 Period life expectancy at birth, ages 20, 65 and 80 .......................................... 24
ENGLAND ...................................................................................................................... 24
SCOTLAND ................................................................................................................... 31
4.3.2 Cardiovascular disease mortality ......................................................................... 33
ENGLAND ...................................................................................................................... 33
WALES ........................................................................................................................... 38
SCOTLAND ................................................................................................................... 39
4.3.3 Cancer mortality ...................................................................................................... 44
ENGLAND ...................................................................................................................... 44
WALES ........................................................................................................................... 47
SCOTLAND ................................................................................................................... 48
4.3.4 Suicide rates/risk ..................................................................................................... 51
ENGLAND ...................................................................................................................... 51
WALES ........................................................................................................................... 53
SCOTLAND ................................................................................................................... 54
4.3.5 Accident mortality rate............................................................................................ 56
ENGLAND ...................................................................................................................... 56
WALES ........................................................................................................................... 58
SCOTLAND ................................................................................................................... 59
4.3.6 Deaths from non-natural causes for people resident in health or social care
establishments .................................................................................................................. 61
4.3 Health: Main indicators .................................................................................................. 62
4.3.7 [2.1] Self-report poor current [physical] health ................................................... 62
ENGLAND ...................................................................................................................... 62
4.3.7a Healthy life expectancy ........................................................................................ 63
WALES ........................................................................................................................... 65

Equality and Human Rights Commission: Evidence analysis for the triennial review: Lot 1 - Life and Health Key messages: 4. Socio-economic status or class
3
SCOTLAND ................................................................................................................... 66
4.3.7a Healthy Life Expectancy ...................................................................................... 67
4.3.8 [1.1] Longstanding health problem or disability (E W) and longstanding illness
(S) ........................................................................................................................................ 68
ENGLAND ...................................................................................................................... 68
WALES ........................................................................................................................... 70
SCOTLAND ................................................................................................................... 72
4.3.9 [1.2] Poor mental health or wellbeing .................................................................. 74
ENGLAND ...................................................................................................................... 74
WALES ........................................................................................................................... 78
SCOTLAND ................................................................................................................... 79
4.3.10 [3.1] Low perception of treatment with dignity .................................................. 82
ENGLAND .......................................................................................................................... 82
WALES ............................................................................................................................... 82
SCOTLAND ....................................................................................................................... 82
4.3.11 [5.1] A&E attendance/accidents ......................................................................... 83
ENGLAND ...................................................................................................................... 83
WALES ........................................................................................................................... 84
SCOTLAND ................................................................................................................... 85
4.3.12 [3.2] Lack of support for individual nutritional needs during hospital stays . 86
4.3.13 [4.1] Healthy lifestyle ............................................................................................ 87
ENGLAND ...................................................................................................................... 87
SMOKING ...................................................................................................................... 87
ALCOHOL ...................................................................................................................... 89
EXERCISE ..................................................................................................................... 93
DIET .............................................................................................................................. 100
OBESITY ...................................................................................................................... 102
WALES ......................................................................................................................... 106
SMOKING .................................................................................................................... 106
ALCOHOL .................................................................................................................... 109
EXERCISE ................................................................................................................... 111
DIET .............................................................................................................................. 112
OBESITY ...................................................................................................................... 114
SCOTLAND ................................................................................................................. 116
Equality and Human Rights Commission: Evidence analysis for the triennial review: Lot 1 - Life and Health Key messages: 4. Socio-economic status or class
4
SMOKING .................................................................................................................... 116
ALCOHOL .................................................................................................................... 123
EXERCISE ................................................................................................................... 132
DIET .............................................................................................................................. 135
OBESITY ...................................................................................................................... 138
4.4 Cross-over themes ................................................................................................... 142
4.5 Health and life: Discussion ..................................................................................... 144
REFERENCES .................................................................................................................... 145

Equality and Human Rights Commission: Evidence analysis for the triennial review: Lot 1 - Life and Health Key messages: 4. Socio-economic status or class
5
Tables
Table 1 Life Expectancy at birth and at age 65 by social class, men and
women, England & Wales 2002-2005 ..................................................... 24
Table 2 Change in life expectancy at birth and at age 65 by social class, men,
England & Wales ......................................................................................... 25
Table 3 Change in life expectancy at birth and at age 65 by social class,
women, England & Wales.......................................................................... 26
Table 4 Male Life Expectancy at birth by area .................................................... 31
Table 5 Female Life Expectancy at birth by area ............................................... 32
Table 6 Trends in mortality from ischaemic heart disease by social class
1986-1999, males aged 35-64, directly age-standardised death rates
(DSR) per 100,000 person years, with 95% confidence intervals (CI)
....................................................................................................................... 34
Table 7 Trends in mortality from cerebrovascular disease by social class
1986-1999, males aged 35-64, directly age-standardised death rates
(DSR) per 100,000 person years, with 95% confidence intervals (CI).
....................................................................................................................... 35
Table 8 Indicators of poverty and life expectancy (ischaemic heart disease
and cerebrovascular disease) by region in England ............................. 36
Table 9 Coronary Heart Disease and Deprivation; mortality crude rates and
standardised mortality ratios (SMR) by age group and SIMD decile;
2004-2008 .................................................................................................... 39
Table 10 Cerebrovascular disease and Deprivation; mortality crude rates and
standardised mortality ratios (SMR) by age group and SIMD decile;
2004-2008 .................................................................................................... 41
Table 11 Mortality from cancer by social class 1997-1999, males aged 35-64,
directly age-standardised death rates (DSR) per 100,000 person
years, with 95% confidence intervals (CI) ............................................... 44
Table 12 Mortality from cancer by social class 1997-1999, females aged 35-
64, directly age-standardised death rates (DSR) per 100,000 person
years, with 95% confidence intervals (CI) ............................................... 45
Table 13 Indicators of poverty and life expectancy (heart disease and stroke)
by region in England ................................................................................... 46
Equality and Human Rights Commission: Evidence analysis for the triennial review: Lot 1 - Life and Health Key messages: 4. Socio-economic status or class
6
Table 14 Cancer mortality under 75 years, both sexes, rate per 100,000, age-
standardised to the European population. .............................................. 48
Table 15 Cancer of trachea, bronchus and lung, Scotland, mortality rates .... 49
Table 16 Breast cancer - women only, Scotland mortality rates ...................... 50
Table 17 Age-standardised suicide rates by deprivation twentieth and sex,
people aged 15 and over, 1993-2003 ...................................................... 51
Table 18 Age-standardised suicide rates by deprivation twentieth and sex,
people aged 15 and over, England & Wales, 1999-2003 ..................... 52
Table 19 Deaths caused by intentional self harm and events of undetermined
intent by Scottish Index of Multiple Deprivation (SIMD) ....................... 55
Table 20 Road injury and death rate by local health profile data on
deprivation, England ................................................................................... 56
Table 21 Deaths as a result of an unintentional injury, adults aged 15 and
over by deprivation quintile, number and standardised mortality ratio,
year ending 31 December, 2004-08 ........................................................ 59
Table 22 Healthy life expectancy (HLE) at birth by deprivation decile and sex,
1994-9, England .......................................................................................... 63
Table 23 SF-36 Physical component summary score, Wales ............................ 65
Table 24 Estimated odds ratio for bad/very bad general health by income and
deprivation .................................................................................................... 66
Table 25 Scottish life expectancy and healthy life expectancy by sex and
deprivation .................................................................................................... 67
Table 26 Prevalence of reported longstanding illness by sex, age and socio-
economic classification of household reference person ....................... 68
Table 27 LLTI by socio-economic classification of household reference
person, Wales, 2008 ................................................................................... 70
Table 28 Percentage of adults aged 16 and over with a long-standing illness,
disability or health problem by Scottish Index of Multiple Deprivation
quintile, 2007/08 .......................................................................................... 72
Table 29 Risk of developing a mental illness by manual, non-manual status 74
Table 30 Risk of developing a mental illness by level of income ..................... 75
Table 31 Incapacity benefit for mental illness by deprivation of region in
England ......................................................................................................... 77
Equality and Human Rights Commission: Evidence analysis for the triennial review: Lot 1 - Life and Health Key messages: 4. Socio-economic status or class
7
Table 32 Mental illness by socio-economic classification of household
reference person, Wales ............................................................................ 78
Table 33 WEMWBS mean scores by NS-SEC of household reference person
and sex ......................................................................................................... 79
Table 34 WEMWBS means score by equivalised household quintile and sex
....................................................................................................................... 80
Table 35 Anxiety and depression (1), Patients in Scotland consulting a GP or
Practice Nurse at least once in the year: rates per 1,000 population
(2), (3), and 95% confidence intervals for financial year 2007/08; by
gender and deprivation quintile ................................................................. 81
Table 36 Treatment with respect when using health services by social class,
ENGLAND .................................................................................................... 82
Table 37 Adults who reported attending hospital in the past three months, by
NS-SEC classification of the household reference person .................. 84
Table 38 Cigarette smoking status (age-standardised) by equivalised
household income and sex, England ....................................................... 87
Table 39 Smoking and smoking in pregnancy by regional indicators of
deprivation in England ................................................................................ 88
Table 40 Maximum alcohol consumption on any day in the last week (age-
standardised), by equivalised household income, men, England ....... 89
Table 41 Maximum alcohol consumption on any day in the last week (age-
standardised), by equivalised household income, women, England .. 90
Table 42 Number of days on which drank alcohol in the last week (age-
standardised), by equivalised household income, male, England ...... 91
Table 43 Number of days on which drank alcohol in the last week (age-
standardised), by equivalised household income, female, England ... 92
Table 44 Physical fitness levels (age-standardised), by Spearhead status and
male, England .............................................................................................. 96
Table 45 Physical fitness levels (age-standardised), by Spearhead status and
female, England .......................................................................................... 97
Table 46 Physical fitness levels (age-standardised), by equivalised
household income and sex ........................................................................ 99
Table 47 Daily fruit and vegetable consumption (age-standardised), by
equivalised household income and men ............................................... 100

Equality and Human Rights Commission: Evidence analysis for the triennial review: Lot 1 - Life and Health Key messages: 4. Socio-economic status or class
8
Table 48 Daily fruit and vegetable consumption (age-standardised), by
equivalised household income and women .......................................... 101
Table 49 Body Mass Index (BMI), overweight and obesity prevalence (age-
standardised), by equivalised household income and male .............. 102
Table 50 Body Mass Index (BMI), overweight and obesity prevalence (age-
standardised), by equivalised household income and female ........... 103
Table 51 Waist circumference (age-standardised), by equivalised household
income and sex ......................................................................................... 104
Table 52 Smoker by socio-economic classification of household reference
person, Wales ............................................................................................ 106
Table 53 Smoker by Welsh index of multiple deprivation quintile .................. 107
Table 54 Consumption of alcohol, including binge drinking by socio-economic
classification of household reference person, Wales .......................... 109
Table 55 Consumption of alcohol above guidelines and binge drinking by
Welsh index of multiple deprivation quintile .......................................... 110
Table 56 Exercise and physical activity by socio-economic classification of
household reference person, Wales ...................................................... 111
Table 57 Consumption of fruit and vegetables by socio-economic
classification of household reference person, Wales .......................... 112
Table 58 Consumption of fruit and vegetables by Welsh index of multiple
deprivation quintile, Wales ....................................................................... 113
Table 59 Obesity by socio-economic classification of household reference
person, Wales ............................................................................................ 114
Table 60 Obesity by Welsh index of multiple deprivation quintile, Wales ..... 115
Table 61 Self-reported cigarette smoking status (observed and age-
standardised), by NS-SEC of household reference person, male,
Scotland ...................................................................................................... 116
Table 62 Self-reported cigarette smoking status (observed and age-
standardised), by NS-SEC of household reference person, female,
Scotland ...................................................................................................... 117
Table 63 Current cigarette smoking (age-standardised), by equivalised
household income quintile and male, Scotland .................................... 119
Table 64 Current cigarette smoking (age-standardised), by Scottish Index of
Multiple Deprivation quintile and sex ..................................................... 121
Equality and Human Rights Commission: Evidence analysis for the triennial review: Lot 1 - Life and Health Key messages: 4. Socio-economic status or class
9
Table 65 Estimated usual weekly alcohol consumption level (age-
standardised), by NS-SEC of household reference person and sex,
Scotland ...................................................................................................... 123
Table 66 Estimated usual weekly alcohol consumption level (age-
standardised), by equivalised household income quintile and sex,
Scotland ...................................................................................................... 124
Table 67 Estimated usual weekly alcohol consumption level (age-
standardised), by Scottish Index of Multiple Deprivation and sex,
Scotland ...................................................................................................... 126
Table 68 Estimated alcohol consumption level on heaviest drinking day in
past week (age-standardised), by NS-SEC of household reference
person and sex, Scotland ........................................................................ 128
Table 69 Estimated alcohol consumption level on heaviest drinking day in
past week (observed and age-standardised), by equivalised
household income quintile and sex, Scotland ...................................... 129
Table 70 Estimated alcohol consumption on heaviest drinking day in past
week (age-standardised), by Scottish Index of Multiple Deprivation
and sex, Scotland...................................................................................... 130
Table 71 Proportion meeting the current physical activity recommendations
by NS-SEC of household reference person and sex, Scotland ......... 132
Table 72 Proportion meeting the current physical activity recommendations
by equivalised household income quintile and sex, Scotland ............ 133
Table 73 Proportion meeting the current physical activity recommendations
by Scottish Index of Multiple Deprivation and sex ............................... 134
Table 74 Fruit and vegetable consumption (age-standardised), by NS-SEC of
household reference person and sex, Scotland ................................... 135
Table 75 Fruit and vegetable consumption (age-standardised), by equivalised
household income quintile and sex, Scotland ...................................... 136
Table 76 Fruit and vegetable consumption (age-standardised), by Scottish
Index of Multiple Deprivation and sex .................................................... 137
Table 77 Overweight and obesity prevalence and mean BMI (age-
standardised), by NS-SEC of household reference person and sex 138
Table 78 Overweight and obesity prevalence and mean BMI (age-
standardised), by equivalised household income quintile and sex ... 139
Equality and Human Rights Commission: Evidence analysis for the triennial review: Lot 1 - Life and Health Key messages: 4. Socio-economic status or class
10
Table 79 Overweight and obesity prevalence and mean BMI (age-
standardised), by Scottish Index of Multiple Deprivation and sex ..... 140

Equality and Human Rights Commission: Evidence analysis for the triennial review: Lot 1 - Life and Health Key messages: 4. Socio-economic status or class
11
Figures
Figure 1 Age-specific mortality rate by five year age group and NS-SEC: men
aged 25-64, 2001-03: death registrations ............................................... 27
Figure 2 Indicators of poverty and life expectancy by region in England ......... 28
Figure 3 Life expectancy at birth by social class, a) males and b) females,
England & Wales, 1972-2005 ................................................................... 29
Figure 4 Absolute gap in death rates from ischaemic heart disease,
cerebrovascular disease and all other diseases of the circulatory
system, between the Spearhead group and the population as a whole,
people aged under 75, 1993 to 2007, England, with inequalities target
....................................................................................................................... 37
Figure 5 Coronary Heart Disease Standardised Mortality Ratios by age group
and SIMD decile; 2004-2008 ..................................................................... 40
Figure 6 Cerebrovascular Disease Standardised Mortality Ratios by age
group and SIMD decile; 2004-2008 ......................................................... 41
Figure 7 Cerebrovascular disease for ages under 75 age-standardised
(European Standard Population) Mortality rate per 100,000 by
deprivation quintile ...................................................................................... 43
Figure 8 European age-standardised rates per 100,000 population: deaths
caused by intentional self harm and events of undetermined intent, by
deprivation decile (SIMD), Scotland, 2004-08 ........................................ 54
Figure 9 Mortality from unintentional injury, adults aged 15 years and over by
deprivation quintile, year ending 31 December, 2004-2008 ................ 60
Figure 10 Limited longstanding illness LLTI by occupational group, adults
aged 45-64, Great Britain .......................................................................... 69
Figure 11 Percentage who reported having a LLTI by household NS-SEC .... 71
Figure 12 Percentage of adults aged 16 and over with a long-standing illness,
disability or health problem by Scottish Index of Multiple Deprivation
quintile, 2007/08 .......................................................................................... 73
Figure 13 Risk of developing a mental illness by manual, non-manual status
....................................................................................................................... 74
Figure 14 Risk of developing a mental illness by level of income .................... 76
Equality and Human Rights Commission: Evidence analysis for the triennial review: Lot 1 - Life and Health Key messages: 4. Socio-economic status or class
12
Figure 15 Perception of own physical activity levels, by equivalised
household income, male ............................................................................ 93
Figure 16 Perception of own physical activity levels, by equivalised
household income, female ......................................................................... 94
Figure 17 Relationship between obesity and income, England ...................... 105
Figure 18 Smoker by Welsh index of multiple deprivation quintile ................. 108
Figure 19 Current cigarette smoking (age-standardised), by NSSEC of
household reference person and sex, Scotland ................................... 118
Figure 20 Current cigarette smoking (age-standardised), by equivalised
household income quintile and sex, Scotland ...................................... 120
Figure 21 Current cigarette smoking (age-standardised), by Scottish Index of
Multiple Deprivation quintile and sex ..................................................... 122
Figure 22 Proportion exceeding government guidelines on weekly alcohol
consumption (age-standardised), by equivalised household income
quintile and sex, Scotland ........................................................................ 125

Equality and Human Rights Commission: Evidence analysis for the triennial review: Lot 1 - Life and Health Key messages: 4. Socio-economic status or class
13
Chapter 4: Socio-economic status or class
4.1 Key messages
What are the inequalities? How persistent and how worrying are they?
Class is well established as an indicator of inequality in both Health and Life
indicators. In general, lower social class is related to lower life expectancy
and poor health outcomes. The most recent Government report that outlines
this is the Marmot Review. Similar patterns of inequality exist in England,
Wales and Scotland.
LIFE
Life expectancy for all classes and both sexes has improved since 1972 in
England, Wales and Scotland. Throughout this period, however, the gap in
life expectancy has increased. Whilst men and women in England & Wales in
social class I had improvements in life expectancy at birth of 8.1 and 6.1 years
respectively, the equivalent figures for social class V are 6.2 and 3.9 years.3
There are variations within this, for example, men in social class IIIn (non-
manual) fared very well. The general picture is one of improving life
expectancy for all but an increasing gap between the richest and the poorest.
In the most recent period of change measured on the longitudinal study (from
1997-2001 to 2002-05) the increase in life expectancy was only 0.1 years for
social class V; for social class I it was 2.5 years. In Scotland, data is available
only on the basis of region. They show a pattern of mortality being clearly
linked to an area's deprivation level.
Inequality along social class lines is found for cardiovascular disease
mortality. In the period 1997-99, a man from social class V was 1.86 times
more likely to die of the disease than a man from social class I. Women in
general were less likely to die of cardiovascular disease but women in social
class V were 2.27 times more likely to do so than women in social class I.
3 These categories are explained in the main text.

Equality and Human Rights Commission: Evidence analysis for the triennial review: Lot 1 - Life and Health Key messages: 4. Socio-economic status or class
14
For cerebrovascular disease, however, there is no statistically significant link
in mortality rates by class although the data in men show a trend towards a
social gradient. More recent data from England suggest that the gap in
mortality rate due to circulatory disorders in general, a large part of which is
made up of cardiovascular and cerebrovascular disorders, is declining.
Cancer mortality overall is only slightly related to class overall but there are
some patterns of inequality. Lung cancer mortality in men and women, and
cervical cancer mortality in women are both higher in lower social classes.
The risk of suicide is strongly related to gender; men are more likely to commit
suicide. However, there is also correlation with deprivation. The suicide rate
in the most deprived areas of Scotland, Wales and England is significantly
higher for both sexes.
Data on the accident mortality rate for England & Wales have not been
disaggregated by deprivation or class. There are other proxy indicators but
these do not suggest a particularly strong relationship between the rate and
deprivation. There is more information available from Scotland. This shows a
clear and statistically significant relationship between deprivation and accident
mortality. Those in the most deprived areas of Scotland have an accident
mortality rate approximately double that of the least deprived.
HEALTH
Outcome
Self-reporting of poor current physical health is correlated to deprivation or to
class in England, Wales and Scotland. In Scotland, the odds of those in the
lowest quintile of deprivation (by area) self-reporting poor current health was
eight times higher for men and 2.5 times higher for women. There is also a
relationship between class or deprivation and healthy life expectancy. In
England in the period 1994-9 the difference in healthy life expectancy
between the highest and lowest deciles of deprivation was around 16 years
for both men and women. The Office for National Statistics is currently
Equality and Human Rights Commission: Evidence analysis for the triennial review: Lot 1 - Life and Health Key messages: 4. Socio-economic status or class
15
collecting this data on an experimental basis at a local level so more up-to-
date figures should be available soon. In 2007-8, healthy life expectancy for
men in Scotland was 57.5 years in the most deprived areas and 68.0 years in
Scotland overall. The equivalent figures for women are 61.9 years and 70.5
years.
The proportion of people who report: poor current health; longstanding health
problem or disability (England & Wales) and longstanding illness (Scotland)
[LLTI] is strongly associated with socioeconomic status. Figures for Great
Britain overall show that LLTI is associated with social class; those in routine
or manual backgrounds and those who are long-term unemployed are more
likely to have an LLTI.
Poor mental health is associated strongly with socioeconomic status; manual
workers are slightly more likely to have mental illness than non-manual; those
with lowest income are much more likely to have mental illness than those
with the highest income. The route of causation here is unclear; living on a
low income may increase the likelihood of developing mental illness, but
mental illness may also reduce the likelihood of being able to progress to and
work in high-earning posts. However, it remains a serious inequality whether
it is the result of those with mental illness becoming poor or those in poverty
becoming mentally ill.
Process
The data available suggest there is no class-based inequality shown in the
perception of treatment with dignity.
No class-based inequality is shown in the limited (Wales only) data on A&E
attendance - this finding is at odds with the finding on accident mortality.
No class-based data are available on support for nutritional needs in hospital.
Autonomy

Equality and Human Rights Commission: Evidence analysis for the triennial review: Lot 1 - Life and Health Key messages: 4. Socio-economic status or class
16
Low social class is directly related to several but not all markers of unhealthy
lifestyle: cigarette smoking, exercise and diet but not overweight and obesity.
Smoking: there are clear social gradients in smoking prevalence in England,
Wales and Scotland. In England, the percentages of men and women in the
highest quintile earners reporting ‘current’ smoking status are 15% and 13%;
in the lowest quintile, the respective figures are 40% and 32%. The data
relating to area deprivation and smoking are slightly less clear in England but
the pattern is clear in Scotland and Wales. For example, in Wales, 15% of
managerial and professional households report a smoker against 40% in the
long-term unemployed and those who've never worked. In Scotland smoking
patterns vary by NS-SEC. Levels are highest in men and women in semi-
routine and routine households and lowest among those in managerial and
professional households. For example, amongst men, 36% of the former are
current smokers against 17% of the latter; the equivalent figures for women
are 38% versus 16%. Similar patterns are seen in relation to household
income quintile and Scottish Index of Multiple Deprivation; for example,
smoking levels in the most deprived areas are more than double those in the
least deprived for both men and women.
Alcohol: In England, there is a slight social gradient in those drinking more
than four units and more than eight units on the heaviest drinking day in the
past week. The gradient is in inverse relation to household income quintile;
those in the highest income quintile have more heavy drinkers than those in
the lowest.
In women this pattern is lost entirely. In terms of the number of days on which
people drank alcohol in the last week, men in the highest quintile drank more
regularly than those in the lowest (3.2 days versus 1.7 days). Those in the
lowest quintile were far more likely to have a week without drink (46%) than
those in the highest (15%). In women, a similar gradient is present; the
richest drink more than twice as often as the poorest. The gradient is less
steep then in men, however.

Equality and Human Rights Commission: Evidence analysis for the triennial review: Lot 1 - Life and Health Key messages: 4. Socio-economic status or class
17
In Wales, drinking above guideline levels is highest in the managerial and
professional classes; binge drinking is highest in the same class and in
routine and manual classes. There is no clear gradient in relation to binge
drinking however; drinking above guidelines is most common in the least
deprived areas and least common in the most deprived areas. Binge drinking
is fairly level through all areas.
In Scotland, among women, levels of weekly consumption are associated with
socioeconomic classification, household income and area deprivation. Levels
of consumption are highest amongst the managerial and professional, highest
income and least deprived group. Among men, there was no clear
association apart from that men in the most deprived areas are more likely to
drink above 50 units a week.
In terms of daily drink levels in Scotland, there is no clear relationship
between those drinking above recommended limits or binge drinking (over
double the daily recommended limit) by SN-SEC in men or women. However,
in terms of household income, for men, daily consumption is directly related to
household income such that the poorest drink least. The pattern for binge
drinking is similar. Mean units drunk were also highest among those with
higher incomes (6.8 units in the highest income group compared to 5.5 units
in the lowest). A similar pattern is seen in women, with the highest income
quintile more likely to drink above three units than the lowest; however, binge
drinking (above six units) has no such pattern. Area deprivation was
significantly associated with daily drinking patterns for women (the most
deprived least likely to drink above three units) but not for men.
Exercise: In England & Wales there is little or no association between physical
fitness and measures of class, or between self-perceived levels of activity and
class.
In Scotland there are differences in the proportion meeting activity
recommendations by NS-SEC for both men and women. The pattern is not
one of a straightforward gradient, however. The relationship by household

Equality and Human Rights Commission: Evidence analysis for the triennial review: Lot 1 - Life and Health Key messages: 4. Socio-economic status or class
18
income is clear and linear. 50% of men and 40% of women in the highest
income quintile households met the recommendations compared to 35% and
28% in the lowest. Men and women in the most deprived quintile of areas of
Scotland were least likely to have met the activity recommendations. For
men, though, the pattern is not linear as those in the third quintile were most
likely to have met them. For women, the gradient can be seen between
across all deprivation quintiles.
Diet: In England, for both men and women there is a social gradient in terms
of the mean number of portions of fruit and vegetables eaten daily aggregated
by equivalised household income. For men the figures are 4.1 portions for the
highest quintile and 3.0 for the lowest; for women, the equivalent figures are
4.2 and 3.4. The differences are statistically significant.
For Wales, there is a social gradient in relation to consumption of fruit and
vegetables; managerial and professional classes are more likely to meet the
guidelines than routine and manual workers (40% versus 32%). Also, those
in the most deprived areas are least likely to eat five portions or more of fruit
and vegetables daily (30%); those in the second least deprived quintile of
areas are the most likely to eat the recommended amount (40%) with those in
the least deprived areas closely behind (39%).
In Scotland, a clear gradient in the proportion of the population eating five or
more portions of fruit and vegetables a day is shown by all the measures of
class in Scotland: NS-SEC, household income and deprivation of area. The
relationship is one of the poorest being least likely to eat five or more portions.
The inverse relationship exists for likelihood of eating no fruit and vegetables.
The relationship exists for both sexes. For example, 25% of men in the least
deprived quintile consumed the five portions or more; 9% of men in the least
deprived quintile. The corresponding figures for women are 31% and 16%.
BMI and obesity: In England, income quintile is significantly related to the
odds of being in the most-at-risk categories (obese or seriously underweight).
However, the pattern works in opposite directions in men and women.
Equality and Human Rights Commission: Evidence analysis for the triennial review: Lot 1 - Life and Health Key messages: 4. Socio-economic status or class
19
Women in the lower income quintiles are more likely to be in the at-risk
categories than women in the highest income quintile; men in the lower
income quintiles are significantly less likely to be in the at-risk categories
compared with men in the highest income quintile. However, men in the
fourth lowest income quintile were the most likely to be obese. The same
pattern can be seen in relation to waist measurement. In men, the fourth
lowest quintile (i.e. second poorest) have the highest percentage with raised
waist circumference; the fifth lowest quintile (i.e. poorest) have the lowest. In
women, the social gradient between the richest, who have the lowest chance
of raised waist circumference, and the poorest, who have the highest, is
straight.
The Welsh Health Survey disaggregates obesity figures by class and by sex
but not by both together. As such, it is not possible to see whether a pattern
similar to that in England exists. The Welsh data show that adults in routine
manual work are more likely to be obese than those in professional and
managerial work. There is also a clear social gradient in relation to obesity
and index of multiple deprivation. Those in the most deprived areas of Wales
are far more likely to be obese (27%) than those in the least deprived areas
(16%).
In Scotland, there is little relationship between class and obesity. For men
only, household NS-SEC is associated with being overweight or obese.
Those living in small employer and own account household and those in semi-
routine or routine households are more likely to be overweight than those in
managerial and professional household. The pattern is statistically significant
but not that striking. For women, being overweight or obese was associated
with SIMD quintile. Women living in the most deprived quintiles had a
significantly increased risk of being overweight or obese. The social gradient
is steeper in relation to obesity and morbid obesity. 36.9% of women in the
most deprived quintile were obese or morbidly obese; the equivalent figure for
the least deprived quintile is 21.9%.
Are there any emerging trends?

Equality and Human Rights Commission: Evidence analysis for the triennial review: Lot 1 - Life and Health Key messages: 4. Socio-economic status or class
20
The general trend is of improvement in life expectancy and health; the social
gradient however remains the same or is slightly increasing.
What are the causes?
The main information available in this document relates to lifestyle. The
clearest differences here are in levels of smoking and consumption of fruit and
vegetables: poorer people smoke more and eat less fruit and vegetables. The
differences follow a social gradient. There is a slight inverse gradient in
relation to drinking. These differences might be sufficient to explain the
inequalities in smoking-related disease, such as lung cancer and
cerebrovascular disease. Lifestyle choice is a less plausible candidate to
explain suicide and mental health problems. Neither do the data explain the
difference in lifestyle choice.
Social inequality itself has been hypothesized as a cause of ill-health
physically and mentally by, for example, Wilkinson (Wilkinson and Pickett
2009).
How might change be measured?
Most of the indicators identified by the Equality and Human Rights
Commission are useful; arguable exceptions are 3.6 Non-natural death in
institutions and 3.2 Nutritional needs in hospital.
Additional useful indicators are: Healthy life expectancy; access to healthcare
(e.g. key preventive services).
Data quality and quantity
Most of the key indicators of Life and Health can be disaggregated and are
meaningful by socio-economic status, or class. Death certificates include
occupation of the deceased, making it possible to disaggregate some of the
Life indicators. The Census used the NS-SEC measure of class; as such,
many of the Health indicators can be disaggregated by class although the
pattern is variable. Geographical area is often used as a proxy for
individual/household class in analyses of health inequalities.
Equality and Human Rights Commission: Evidence analysis for the triennial review: Lot 1 - Life and Health Key messages: 4. Socio-economic status or class
21
The measure of class used in official statistics changed in 2001. This creates
some problems in interpretation of longitudinal data collected before and after
that date. As a result, the Census Longitudinal Study continues to use the
previous measure (RGSC) as this aids historical comparison.

Equality and Human Rights Commission: Evidence analysis for the triennial review: Lot 1 - Life and Health Key messages: 4. Socio-economic status or class
22
4.2 SES Evidence
The evidence is readily available in the main as class has been monitored
against health and life indicators for some time. The most important recent
review of evidence is the Marmot Review (Marmot Review 2010).
The chief method for measurement of social class has undergone an
important change recently. From 1911 to 2001 the method used was the
Registrar General's Social Class (RGSC) derived from the individual's current
or former occupation. This method grades classes in categories I-V with
professional at the top and unskilled at the bottom.
Source: (White, van Galen and Chow 2003)
This was replaced in 2001 by the National Statistics Socio-economic
Classification (NS-SEC) based on a combination of occupation, ownership
and control. It can be presented at different levels of aggregation (Walby,
Armstrong and Humphreys 2008) p.34:
The eight class version is:
1 Higher managerial and professional occupations
1.1 Large employers and higher managerial occupations
1.2 Higher professional occupations

Equality and Human Rights Commission: Evidence analysis for the triennial review: Lot 1 - Life and Health Key messages: 4. Socio-economic status or class
23
2 Lower managerial and professional occupations
3 Intermediate occupations
4 Small employers and own account workers
5 Lower supervisory and technical occupations
6 Semi-routine occupations
7 Routine occupations
8 Never worked and long-term unemployed.
An alternative method is the Standard Occupational Classification 2000
(SOC2000) which consists of a list of occupational groups that can be further
sub-divided.
At present, the NS-SEC is the approach adopted by Office for National
Statistics in relation to health data. However, it uses other schema for other
data; for example, the SOC2000 is used for employment data. Furthermore,
the Census Longitudinal Study uses the older RGSC in order to ensure
continuity of data.
There is at least one other measure commonly used. Poverty is often centred
in particular areas of the country. These areas can be identified and
outcomes compared with other areas of the country. This gives a measure of
inequality in, for example, health outcomes. There is good quality information
collected in the three nations on this basis; where relevant, we have included
it.

Equality and Human Rights Commission: Evidence analysis for the triennial review: Lot 1 - Life and Health Key messages: 4. Socio-economic status or class
24
4.3 Life: main indicators - commentary
4.3.1 Period life expectancy at birth, ages 20, 65 and 80
ENGLAND
These data are collected in General Register Office Census Longitudinal
Study (for England & Wales).
Table 1 Life Expectancy at birth and at age 65 by social class, men and
women, England & Wales 2002-2005
Source: Office for National Statistics: Longitudinal Survey
Years Years
2002-2005 MEN 2002-2005 WOMEN
Social
Class
Life exp. 95% CI
(+/-)
Social
Class
Life exp. 95% CI
(+/-)
At birth At birth
I 80.0 1.0 I 85.1 1.1
II 79.4 0.5 II 83.2 0.5
IIIN 78.4 0.7 IIIN 82.4 0.5
IIIM 76.5 0.4 IIIM 80.5 0.5
IV 75.7 0.6 IV 79.9 0.6
V 72.7 1.1 V 78.1 1.2
unclassified 73.8 1.1 unclassified 77.9 0.9
All men 77.0 0.2 All women 81.1 0.2
Non-manua 79.2 0.4 Non-manua 82.9 0.3
Manual 75.9 0.3 Manual 80.0 0.3
Difference 3.3 0.5 Difference 2.9 0.5
At age 65 At age 65
I 18.3 0.6 I 22.0 0.9
II 18.0 0.3 II 21.0 0.3
IIIN 17.4 0.5 IIIN 19.9 0.3
IIIM 16.3 0.3 IIIM 18.7 0.4
IV 15.7 0.4 IV 18.9 0.3
V 14.1 0.7 V 17.7 0.6
unclassified 15.1 0.8 unclassified 17.6 0.5
All men 16.6 0.2 All women 19.4 0.2
Non-manua 17.9 0.3 Non-manua 20.5 0.2
Manual 15.9 0.2 Manual 18.6 0.2
Difference 2.0 0.3 Difference 1.9 0.3
Source: ONS Longitudinal Study Source: ONS Longitudinal Study
CI Confidence interval CI Confidence interval

Equality and Human Rights Commission: Evidence analysis for the triennial review: Lot 1 - Life and Health Key messages: 4. Socio-economic status or class
25
The table above indicates that life expectancy at birth and age 65 differs by
class for men and women. This difference follows a gradient such that social
class I have the highest and social class V (plus the unclassified) have the
lowest life expectancy. In the latest period, 2002-5, life expectancy at birth for
men was 80 years for social class I and 72.7 years for social class V. The
equivalent figures for women are 85.1 and 78.1. At age 65 the life expectancy
for the same two social classes for men was 18.3 and 14.1 years and for
women, 22 and 17.7. The confidence intervals for these results indicate that
the differences by social class are statistically significant.
Table 2 Change in life expectancy at birth and at age 65 by social class, men,
England & Wales
Source: Office for National Statistics: Longitudinal Survey
Equality and Human Rights Commission: Evidence analysis for the triennial review: Lot 1 - Life and Health Key messages: 4. Socio-economic status or class
26
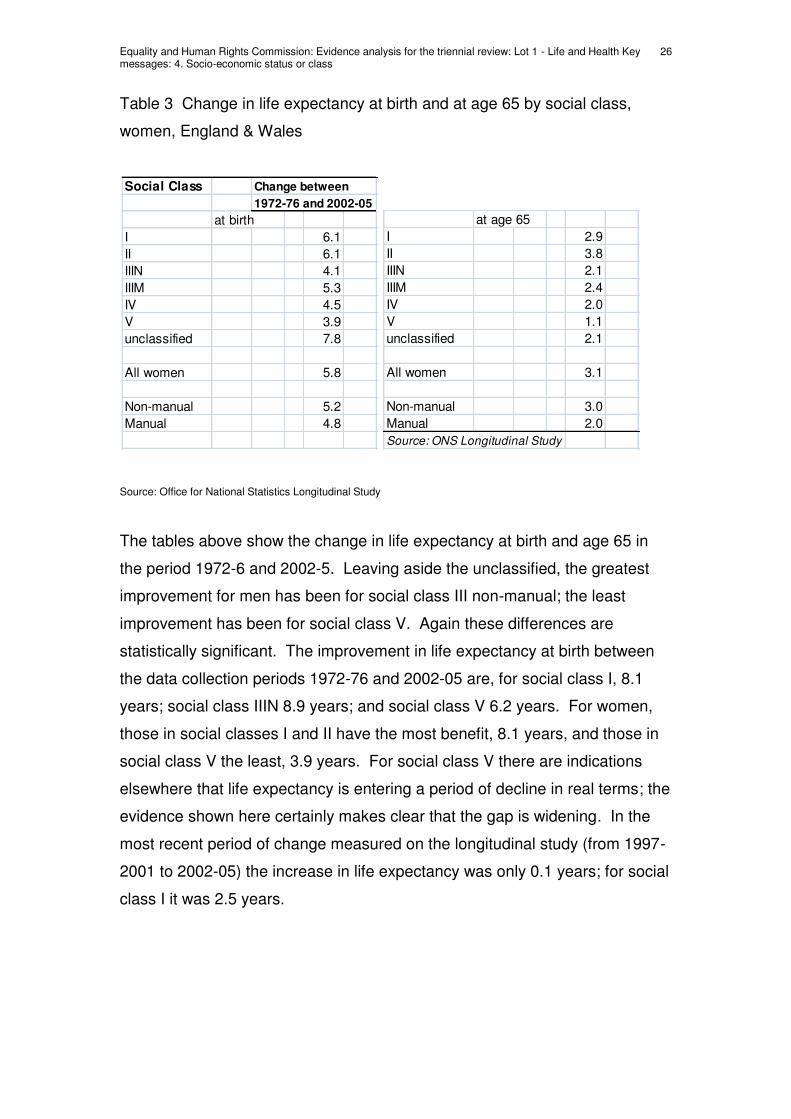
Table 3 Change in life expectancy at birth and at age 65 by social class,
women, England & Wales
Source: Office for National Statistics Longitudinal Study
The tables above show the change in life expectancy at birth and age 65 in
the period 1972-6 and 2002-5. Leaving aside the unclassified, the greatest
improvement for men has been for social class III non-manual; the least
improvement has been for social class V. Again these differences are
statistically significant. The improvement in life expectancy at birth between
the data collection periods 1972-76 and 2002-05 are, for social class I, 8.1
years; social class IIIN 8.9 years; and social class V 6.2 years. For women,
those in social classes I and II have the most benefit, 8.1 years, and those in
social class V the least, 3.9 years. For social class V there are indications
elsewhere that life expectancy is entering a period of decline in real terms; the
evidence shown here certainly makes clear that the gap is widening. In the
most recent period of change measured on the longitudinal study (from 1997-
2001 to 2002-05) the increase in life expectancy was only 0.1 years; for social
class I it was 2.5 years.
Social Class Change between
1972-76 and 2002-05
at birth
I 6.1
II 6.1
IIIN 4.1
IIIM 5.3
IV 4.5
V 3.9
unclassified 7.8
All women 5.8
Non-manual 5.2
Manual 4.8
at age 65
I 2.9
II 3.8
IIIN 2.1
IIIM 2.4
IV 2.0
V 1.1
unclassified 2.1
All women 3.1
Non-manual 3.0
Manual 2.0
Source: ONS Longitudinal Study

Equality and Human Rights Commission: Evidence analysis for the triennial review: Lot 1 - Life and Health Key messages: 4. Socio-economic status or class
27
Figure 1 Age-specific mortality rate by five year age group and NS-SEC: men
aged 25-64, 2001-03: death registrations
Source: White et al (2007) HSQ: 36
White et al (White et al. 2007) take data from four sources: the 2001 Census,
the mid-year population estimates for 2001-2003, deaths of men aged 26-64
occurring in 2001-2003, and the Longitudinal Study. They produce the graph
above, which illustrates the same trend using the RGSC criteria.

Equality and Human Rights Commission: Evidence analysis for the triennial review: Lot 1 - Life and Health Key messages: 4. Socio-economic status or class
28
Figure 2 Indicators of poverty and life expectancy by region in England
Source: Health Profile of England 2008
Inequality in life expectancy by class can also be illustrated by region. The
table above shows that indicators of inequality tend to cluster in regions. For
example, the North East has high levels of deprivation and children in poverty
alongside low male and female life expectancy.
The relationship between life expectancy and class is one that has been
examined extensively. For example, in England, data have been collected
that compare life expectancy between England as a whole and that in the so-
called Spearhead Group of most deprived quintile of Local Authority areas.
These data are published by the Department of Health at
http://www.dh.gov.uk/en/Publicationsandstatistics/Publications/PublicationsSt
atistics/DH_107609. There are also many reports that set out Office for
National Statistics data in new forms.
Equality and Human Rights Commission: Evidence analysis for the triennial review: Lot 1 - Life and Health Key messages: 4. Socio-economic status or class
29
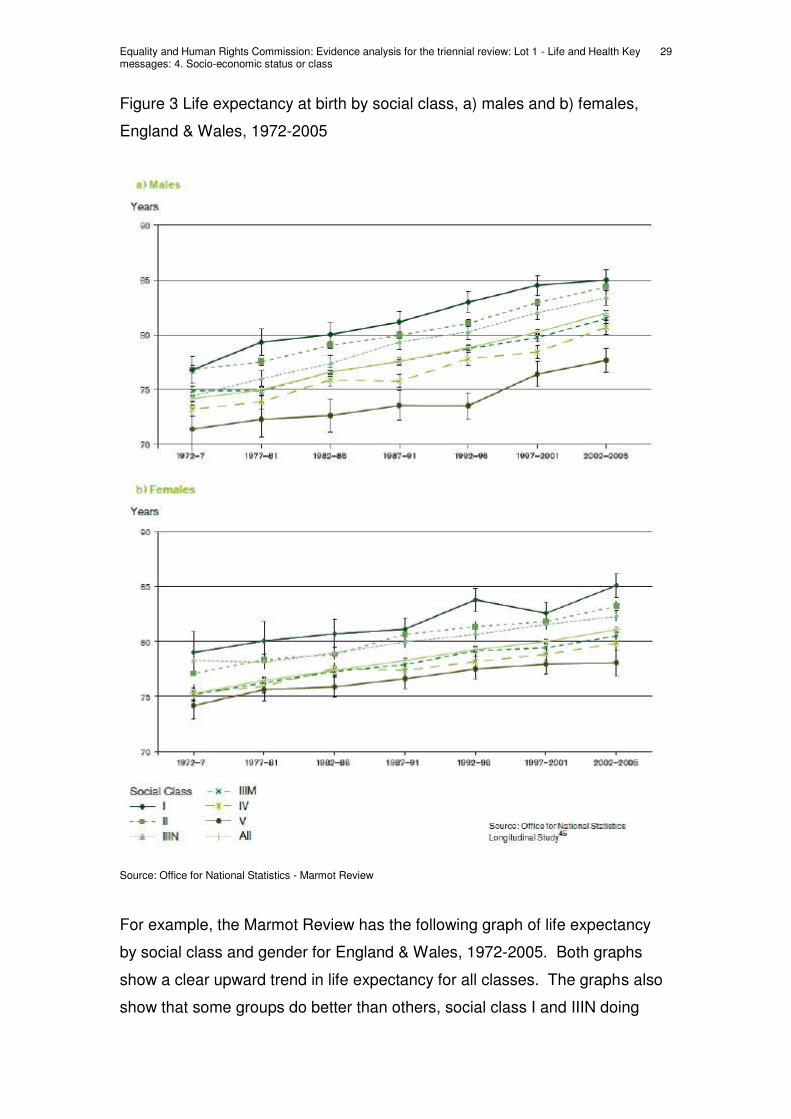
Figure 3 Life expectancy at birth by social class, a) males and b) females,
England & Wales, 1972-2005
Source: Office for National Statistics - Marmot Review
For example, the Marmot Review has the following graph of life expectancy
by social class and gender for England & Wales, 1972-2005. Both graphs
show a clear upward trend in life expectancy for all classes. The graphs also
show that some groups do better than others, social class I and IIIN doing

Equality and Human Rights Commission: Evidence analysis for the triennial review: Lot 1 - Life and Health Key messages: 4. Socio-economic status or class
30
well, social class V relatively badly, with the gap between the highest and
lowest social classes widening slightly over the period for both men and
women.
Thomas et al (BMJ forthcoming) looked at changes in area-based inequality in
life expectancy over the period since 1921. They found geographical
inequality in mortality has increased and continues to do so. Assuming this
geographical inequality reflects socio-economic difference, the implication is
that class-based inequality in mortality has increased and still does so.

Equality and Human Rights Commission: Evidence analysis for the triennial review: Lot 1 - Life and Health Key messages: 4. Socio-economic status or class
31
4.3.1 Period life expectancy at birth, ages 20, 65 and 80
SCOTLAND
The Scotland Overview Report gives the following figures for male life
expectancy in Scotland with comparisons within areas and across nations.
Table 4 Male Life Expectancy at birth by area
Source: Scotland Overview Report
The range is striking, with Scotland comparing badly with other UK countries
and Ireland; and within Scotland, various markers of region show large
differences in life expectancy, with the worst intermediate zone having a life
expectancy of 59.6 against the best having 87.0 years. The intermediate
zones are small, containing between 2,500 to 6,000 people; and life
expectancy data are not available for all. It is probably more meaningful,
therefore, to look at the 90% values where, nonetheless, large differences
remain. The equivalent figures for women are as follow:

Equality and Human Rights Commission: Evidence analysis for the triennial review: Lot 1 - Life and Health Key messages: 4. Socio-economic status or class
32
Table 5 Female Life Expectancy at birth by area
Source: Scotland Overview Report
Women's life expectancy in Scotland is higher than that of men. However,
Scottish women fare worse than women in the rest of the UK and Ireland.
There is a social gradient, as for men, but it is slightly less steep.

Equality and Human Rights Commission: Evidence analysis for the triennial review: Lot 1 - Life and Health Key messages: 4. Socio-economic status or class
33
4.3.2 Cardiovascular disease mortality
ENGLAND
These data are not collected in the General Register Office Census
Longitudinal Study (for England & Wales). However, White et al (White, van
Galen and Chow 2003) have taken data from the study and combined them
with information on occupation taken from death certificates. They have then
calculated directly age-standardised mortality rates (DSRs) due to various
diseases per 100,000 person years at risk, using the WHO European
Standard Population as the reference. The DSR allows us to compare the
mortality rate between the various classes making allowance for any
differences in the age profiles of each grouping. This gives us the following
table for ischaemic heart disease:

Equality and Human Rights Commission: Evidence analysis for the triennial review: Lot 1 - Life and Health Key messages: 4. Socio-economic status or class
34
Table 6 Trends in mortality from ischaemic heart disease by social class
1986-1999, males aged 35-64, directly age-standardised death rates (DSR)
per 100,000 person years, with 95% confidence intervals (CI)
MALE
FEMALE
Source: White et al 2003 HSQ
The table shows a) that in this period men had far higher mortality rates from
Ischaemic Heart Disease than women and b) that there is a social gradient in
mortality rate, with lower social classes having higher rates. In men the DSR
in 1997-9 was 90 for social class I and II, and 167 for social class IV and V.
The findings are statistically significant. Women in general were less likely to
die of cardiovascular disease but women in social class IV and V were 2.27
times more likely to do so than women in social class I and II.
The data presented highlights the fact that despite reductions in the DSR
across all class groupings over the period 1986 -1999, that the social gradient
has persisted, and for men the gap between social classes I and II and social
classes IV and V has widened slightly.

Equality and Human Rights Commission: Evidence analysis for the triennial review: Lot 1 - Life and Health Key messages: 4. Socio-economic status or class
35
In relation to cerebrovascular disease, White et al (2003) have the following
figures:
Table 7 Trends in mortality from cerebrovascular disease by social class
1986-1999, males aged 35-64, directly age-standardised death rates (DSR)
per 100,000 person years, with 95% confidence intervals (CI).
MALE
FEMALE
Source: White et al 2003 HSQ
The table shows a slight social gradient in men but not in women; and in both
cases, the 95% confidence intervals are such that the findings are not
statistically significant.
The Health Profile of England uses more recent data to examine death rates
by area.

Equality and Human Rights Commission: Evidence analysis for the triennial review: Lot 1 - Life and Health Key messages: 4. Socio-economic status or class
36
Table 8 Indicators of poverty and life expectancy (ischaemic heart disease
and cerebrovascular disease) by region in England
Source: Health Profile of England 2008
The table reproduced above shows that early death rates due to heart
disease and stroke are significantly higher in areas with significant levels of
deprivation. As the figures for cerebrovascular disease and heart disease are
conflated, they do not show whether the pattern noted in White et al's (2003)
work is repeated; that is, we cannot tell whether heart disease mortality is
related to class whilst cerebrovascular disease is not. However, the data here
add evidence to the claim that cardiovascular disease mortality is class
biased.
Similar evidence can be obtained from data comparing deaths due to
circulatory disease in the most deprived 'Spearhead' areas of England and the
non-Spearhead group. This is illustrated in the following graph.
Equality and Human Rights Commission: Evidence analysis for the triennial review: Lot 1 - Life and Health Key messages: 4. Socio-economic status or class
37
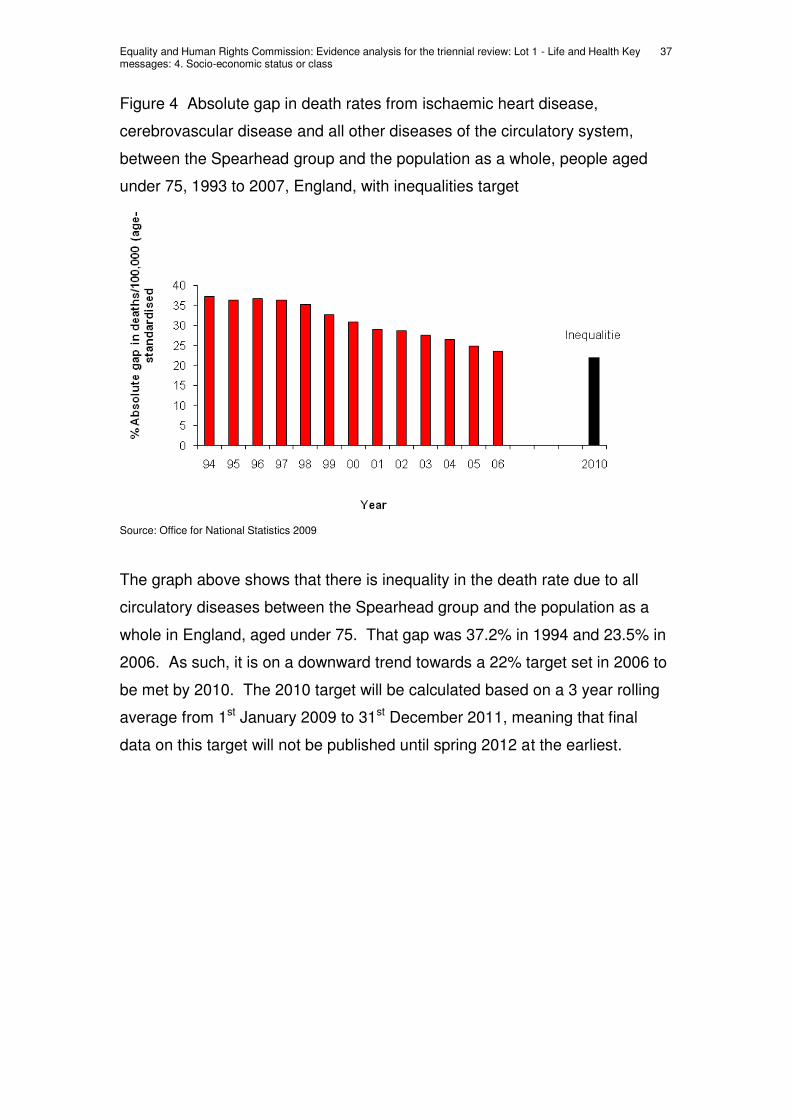
Figure 4 Absolute gap in death rates from ischaemic heart disease,
cerebrovascular disease and all other diseases of the circulatory system,
between the Spearhead group and the population as a whole, people aged
under 75, 1993 to 2007, England, with inequalities target
Source: Office for National Statistics 2009
The graph above shows that there is inequality in the death rate due to all
circulatory diseases between the Spearhead group and the population as a
whole in England, aged under 75. That gap was 37.2% in 1994 and 23.5% in
2006. As such, it is on a downward trend towards a 22% target set in 2006 to
be met by 2010. The 2010 target will be calculated based on a 3 year rolling
average from 1st January 2009 to 31st December 2011, meaning that final
data on this target will not be published until spring 2012 at the earliest.

Equality and Human Rights Commission: Evidence analysis for the triennial review: Lot 1 - Life and Health Key messages: 4. Socio-economic status or class
38
4.3.2 Cardiovascular disease mortality
WALES
There are no separate figures for Wales.
Equality and Human Rights Commission: Evidence analysis for the triennial review: Lot 1 - Life and Health Key messages: 4. Socio-economic status or class
39
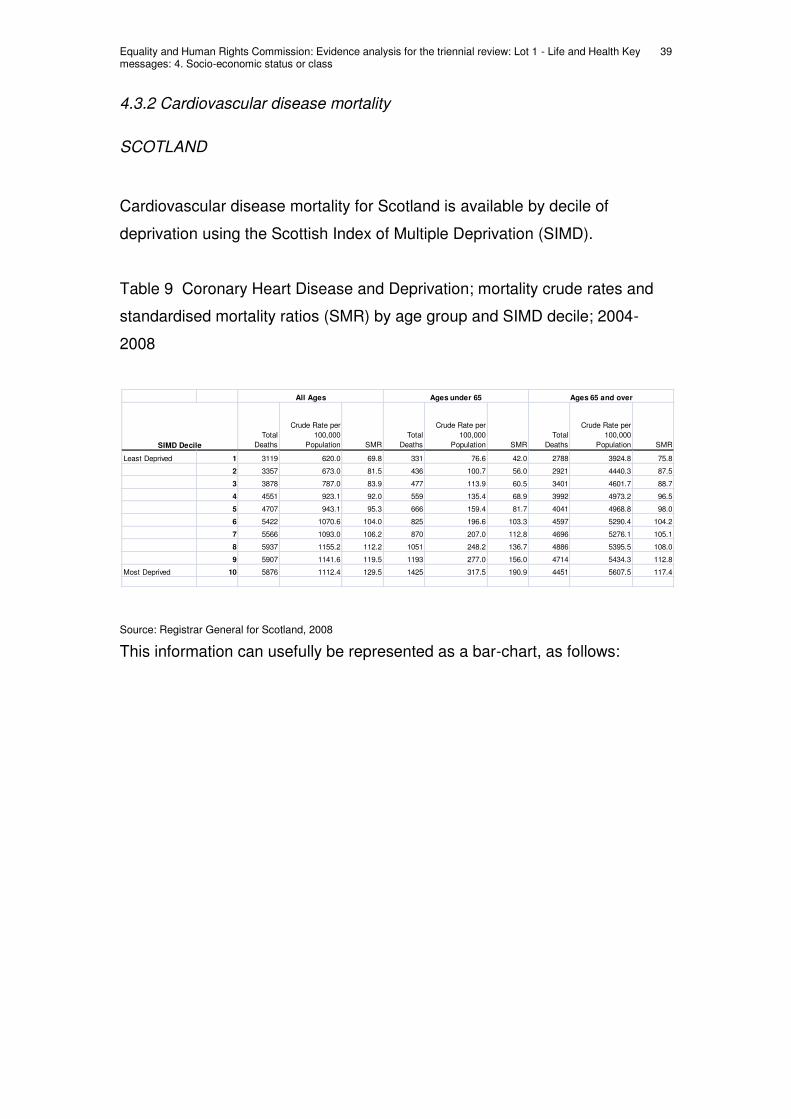
4.3.2 Cardiovascular disease mortality
SCOTLAND
Cardiovascular disease mortality for Scotland is available by decile of
deprivation using the Scottish Index of Multiple Deprivation (SIMD).
Table 9 Coronary Heart Disease and Deprivation; mortality crude rates and
standardised mortality ratios (SMR) by age group and SIMD decile; 2004-
2008
Source: Registrar General for Scotland, 2008
This information can usefully be represented as a bar-chart, as follows:
Total
Deaths
Crude Rate per
100,000
Population SMR
Total
Deaths
Crude Rate per
100,000
Population SMR
Total
Deaths
Crude Rate per
100,000
Population SMR
Least Deprived 1 3119 620.0 69.8 331 76.6 42.0 2788 3924.8 75.8
2 3357 673.0 81.5 436 100.7 56.0 2921 4440.3 87.5
3 3878 787.0 83.9 477 113.9 60.5 3401 4601.7 88.7
4 4551 923.1 92.0 559 135.4 68.9 3992 4973.2 96.5
5 4707 943.1 95.3 666 159.4 81.7 4041 4968.8 98.0
6 5422 1070.6 104.0 825 196.6 103.3 4597 5290.4 104.2
7 5566 1093.0 106.2 870 207.0 112.8 4696 5276.1 105.1
8 5937 1155.2 112.2 1051 248.2 136.7 4886 5395.5 108.0
9 5907 1141.6 119.5 1193 277.0 156.0 4714 5434.3 112.8
Most Deprived 10 5876 1112.4 129.5 1425 317.5 190.9 4451 5607.5 117.4
SIMD Decile
All Ages Ages under 65 Ages 65 and over
Equality and Human Rights Commission: Evidence analysis for the triennial review: Lot 1 - Life and Health Key messages: 4. Socio-economic status or class
40
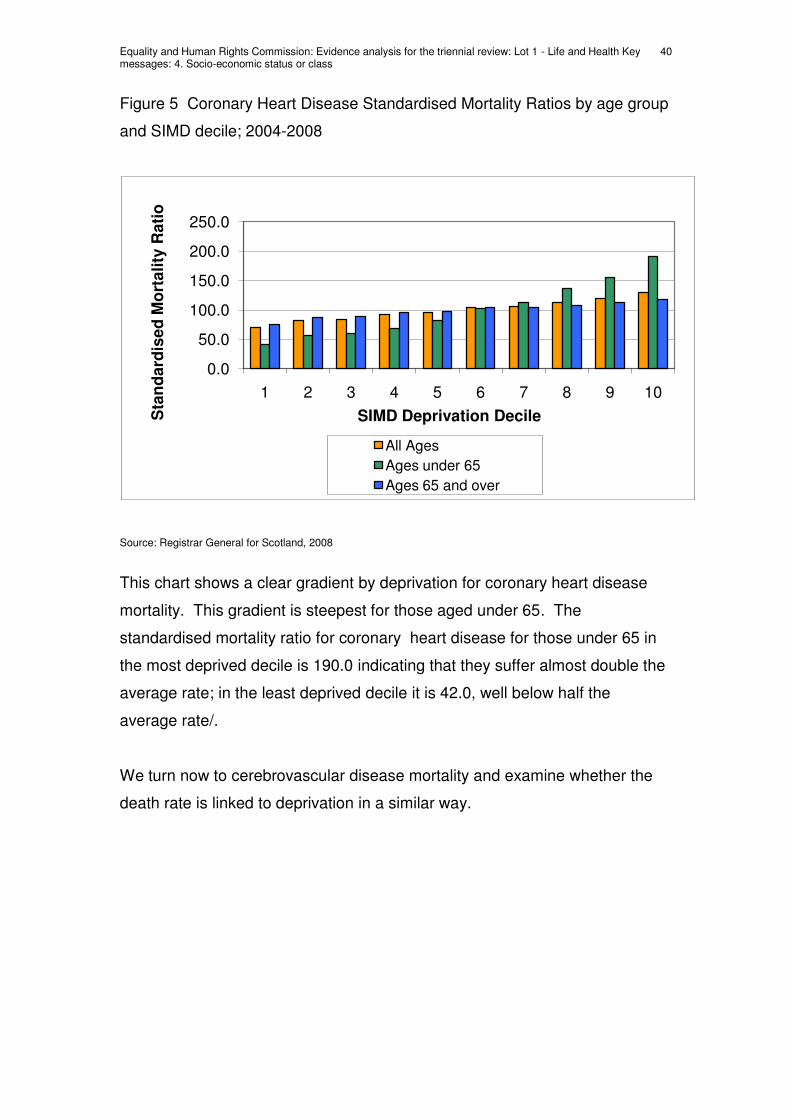
Figure 5 Coronary Heart Disease Standardised Mortality Ratios by age group
and SIMD decile; 2004-2008
Source: Registrar General for Scotland, 2008
This chart shows a clear gradient by deprivation for coronary heart disease
mortality. This gradient is steepest for those aged under 65. The
standardised mortality ratio for coronary heart disease for those under 65 in
the most deprived decile is 190.0 indicating that they suffer almost double the
average rate; in the least deprived decile it is 42.0, well below half the
average rate/.
We turn now to cerebrovascular disease mortality and examine whether the
death rate is linked to deprivation in a similar way.
0.0
50.0
100.0
150.0
200.0
250.0
1 2 3 4 5 6 7 8 9 10
Sta
nd
ard
ise
d M
ort
ali
ty R
ati
o
SIMD Deprivation Decile
All Ages
Ages under 65
Ages 65 and over

Equality and Human Rights Commission: Evidence analysis for the triennial review: Lot 1 - Life and Health Key messages: 4. Socio-economic status or class
41
Table 10 Cerebrovascular disease and Deprivation; mortality crude rates and
standardised mortality ratios (SMR) by age group and SIMD decile; 2004-
2008
Source: Registrar General for Scotland, 2008
This information can be represented as a bar chart, as follows:
Figure 6 Cerebrovascular Disease Standardised Mortality Ratios by age
group and SIMD decile; 2004-2008
Source: Registrar General for Scotland, 2008
Total
Deaths
Crude Rate per
100,000
Population SMR
Total
Deaths
Crude Rate per
100,000
Population SMR
Total
Deaths
Crude Rate per
100,000
Population SMR
Least Deprived 1 2233 443.9 86.1 104 24.1 44.8 2129 2997.1 90.1
2 2323 465.7 98.9 142 32.8 62.1 2181 3315.4 102.9
3 2695 546.9 100.3 188 44.9 81.5 2507 3392.1 102.1
4 2889 586.0 100.7 185 44.8 78.3 2704 3368.6 102.7
5 2982 597.5 104.8 184 44.0 77.4 2798 3440.4 107.3
6 3104 612.9 102.1 239 57.0 102.0 2865 3297.1 102.1
7 2872 564.0 93.6 256 60.9 112.6 2616 2939.2 92.1
8 3067 596.8 98.7 260 61.4 114.5 2807 3099.7 97.5
9 2935 567.2 103.3 344 79.9 152.5 2591 2986.9 99.1
Most Deprived 10 2901 549.2 111.5 398 88.7 180.5 2503 3153.3 105.1
SIMD Decile
All Ages Ages under 65 Ages 65 and over
0.020.040.060.080.0
100.0120.0140.0160.0180.0200.0
1 2 3 4 5 6 7 8 9 10
Sta
nd
ard
ised
Mo
rtality
R
ati
o
SIMD Deprivation Decile
All Ages Ages under 65 Ages 65 and over

Equality and Human Rights Commission: Evidence analysis for the triennial review: Lot 1 - Life and Health Key messages: 4. Socio-economic status or class
42
The table and graph show that in general there is no strong link between
deprivation and cerebrovascular mortality. However, for those under 65, there
is a marked increase at the 9th and 10th decile of deprivation showing that
these groups suffer greater levels of premature mortality from cerebrovascular
disease. The SMR for those in the first decile and aged under 65 is 44.8; for
the 9th and 10th decile it is 152.5 and 180.5 respectively.
Equality and Human Rights Commission: Evidence analysis for the triennial review: Lot 1 - Life and Health Key messages: 4. Socio-economic status or class
43
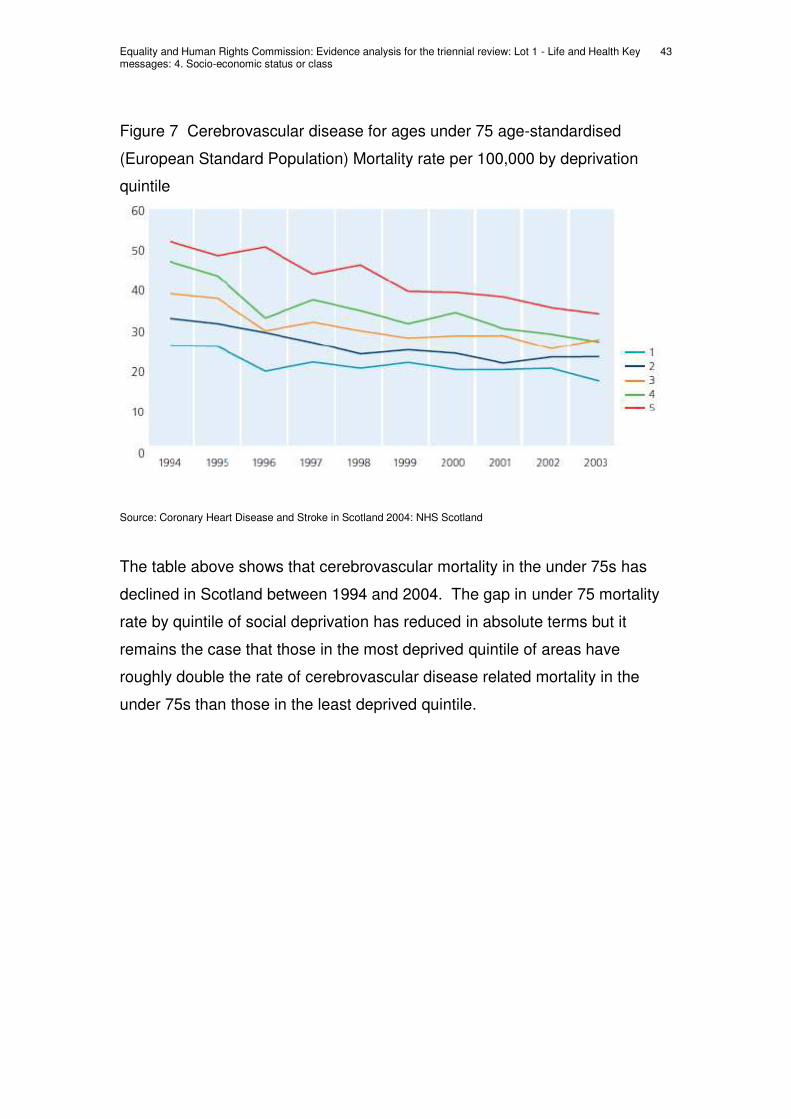
Figure 7 Cerebrovascular disease for ages under 75 age-standardised
(European Standard Population) Mortality rate per 100,000 by deprivation
quintile
Source: Coronary Heart Disease and Stroke in Scotland 2004: NHS Scotland
The table above shows that cerebrovascular mortality in the under 75s has
declined in Scotland between 1994 and 2004. The gap in under 75 mortality
rate by quintile of social deprivation has reduced in absolute terms but it
remains the case that those in the most deprived quintile of areas have
roughly double the rate of cerebrovascular disease related mortality in the
under 75s than those in the least deprived quintile.

Equality and Human Rights Commission: Evidence analysis for the triennial review: Lot 1 - Life and Health Key messages: 4. Socio-economic status or class
44
4.3.3 Cancer mortality
ENGLAND
As with cardiovascular disease, the data have been collated from two sources
by White et al, 2003 (see above).
Table 11 Mortality from cancer by social class 1997-1999, males aged 35-64,
directly age-standardised death rates (DSR) per 100,000 person years, with
95% confidence intervals (CI)
Source: White et al 2003.
The table above shows no statistically significant relationship between social
class and mortality due to stomach, colorectal and prostate cancer. There is
a significant relationship between lung cancer and social class. Someone in
social classes IV or V is around three times more likely to die of lung cancer
than someone in social classes I or II. There is also a statistically significant
difference in the lung cancer mortality rate for non-manual workers (22) and
manual workers (54).
Equality and Human Rights Commission: Evidence analysis for the triennial review: Lot 1 - Life and Health Key messages: 4. Socio-economic status or class
45
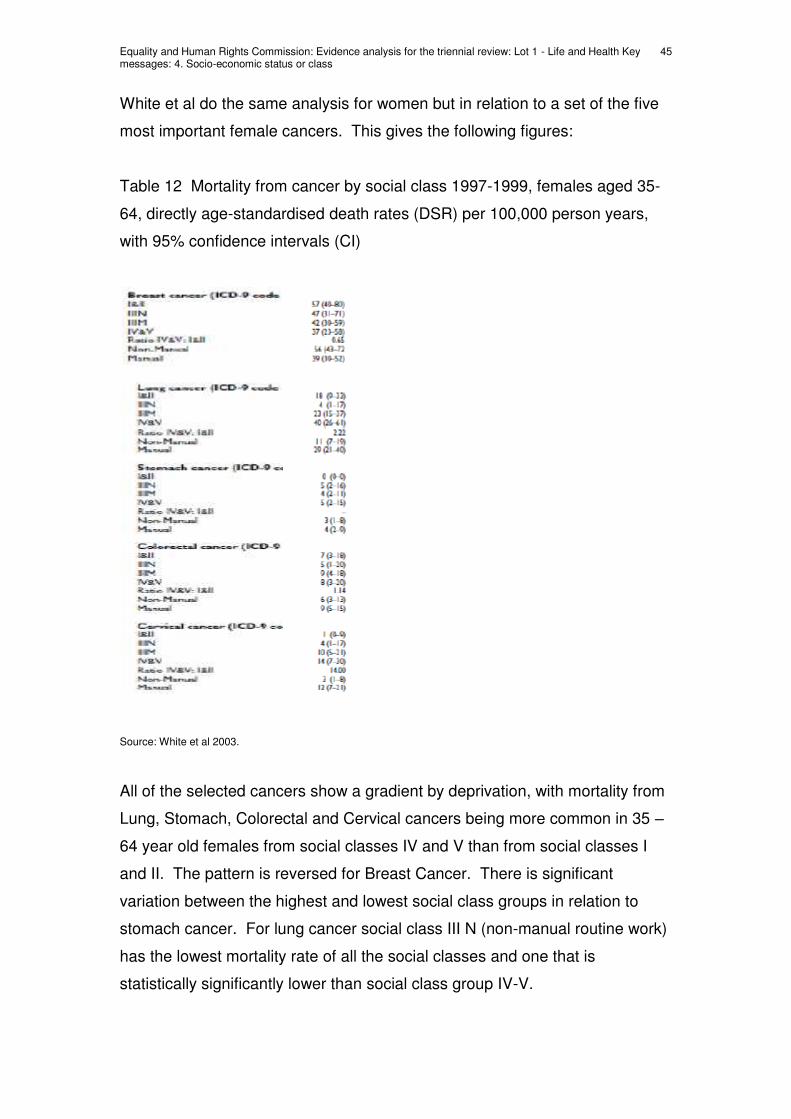
White et al do the same analysis for women but in relation to a set of the five
most important female cancers. This gives the following figures:
Table 12 Mortality from cancer by social class 1997-1999, females aged 35-
64, directly age-standardised death rates (DSR) per 100,000 person years,
with 95% confidence intervals (CI)
Source: White et al 2003.
All of the selected cancers show a gradient by deprivation, with mortality from
Lung, Stomach, Colorectal and Cervical cancers being more common in 35 –
64 year old females from social classes IV and V than from social classes I
and II. The pattern is reversed for Breast Cancer. There is significant
variation between the highest and lowest social class groups in relation to
stomach cancer. For lung cancer social class III N (non-manual routine work)
has the lowest mortality rate of all the social classes and one that is
statistically significantly lower than social class group IV-V.
Equality and Human Rights Commission: Evidence analysis for the triennial review: Lot 1 - Life and Health Key messages: 4. Socio-economic status or class
46
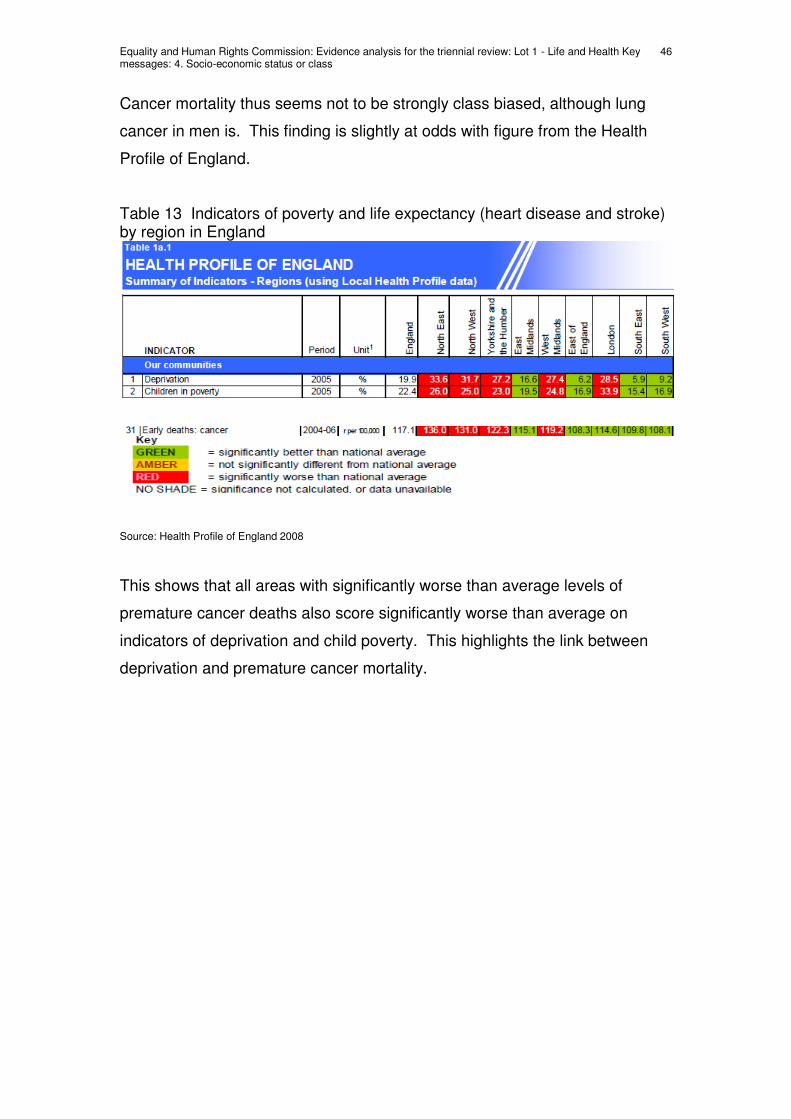
Cancer mortality thus seems not to be strongly class biased, although lung
cancer in men is. This finding is slightly at odds with figure from the Health
Profile of England.
Table 13 Indicators of poverty and life expectancy (heart disease and stroke) by region in England
Source: Health Profile of England 2008
This shows that all areas with significantly worse than average levels of
premature cancer deaths also score significantly worse than average on
indicators of deprivation and child poverty. This highlights the link between
deprivation and premature cancer mortality.

Equality and Human Rights Commission: Evidence analysis for the triennial review: Lot 1 - Life and Health Key messages: 4. Socio-economic status or class
47
4.3.3 Cancer mortality
WALES
There are no separate data for Wales

Equality and Human Rights Commission: Evidence analysis for the triennial review: Lot 1 - Life and Health Key messages: 4. Socio-economic status or class
48
4.3.3 Cancer mortality
SCOTLAND
Table 14 Cancer mortality under 75 years, both sexes, rate per 100,000, age-
standardised to the European population.
Source: Registrar General for Scotland, 2008
The table above shows that the most deprived areas of Scotland have
mortality rates far higher than the Scottish average.
There is some variation by type of cancer; those most directly associated with
smoking tend to be strongly correlated with deprivation. Cervical cancer is
correlated with deprivation. Breast and prostate cancer are negatively
associated with deprivation. The following tables give the figures:
2000 2001 2002 2003 2004 2005 2006 2007 2008
Scotland overall EASR 149.7 151.9 149.6 144.6 142.5 140.9 137.0 136.5 133.6
Most deprived 15% (SIMD) EASR 204.7 209.0 205.4 205.9 208.0 195.5 200.0 206.4 200.3
Most deprived 15% (SIMD) N 1678 1684 1645 1625 1633 1516 1542 1571 1521
Scotland overall N 8219 8321 8292 8119 8104 8050 7894 7971 7924
% deaths in 15% SIMD MD % 20.4% 20.2% 19.8% 20.0% 20.2% 18.8% 19.5% 19.7% 19.2%
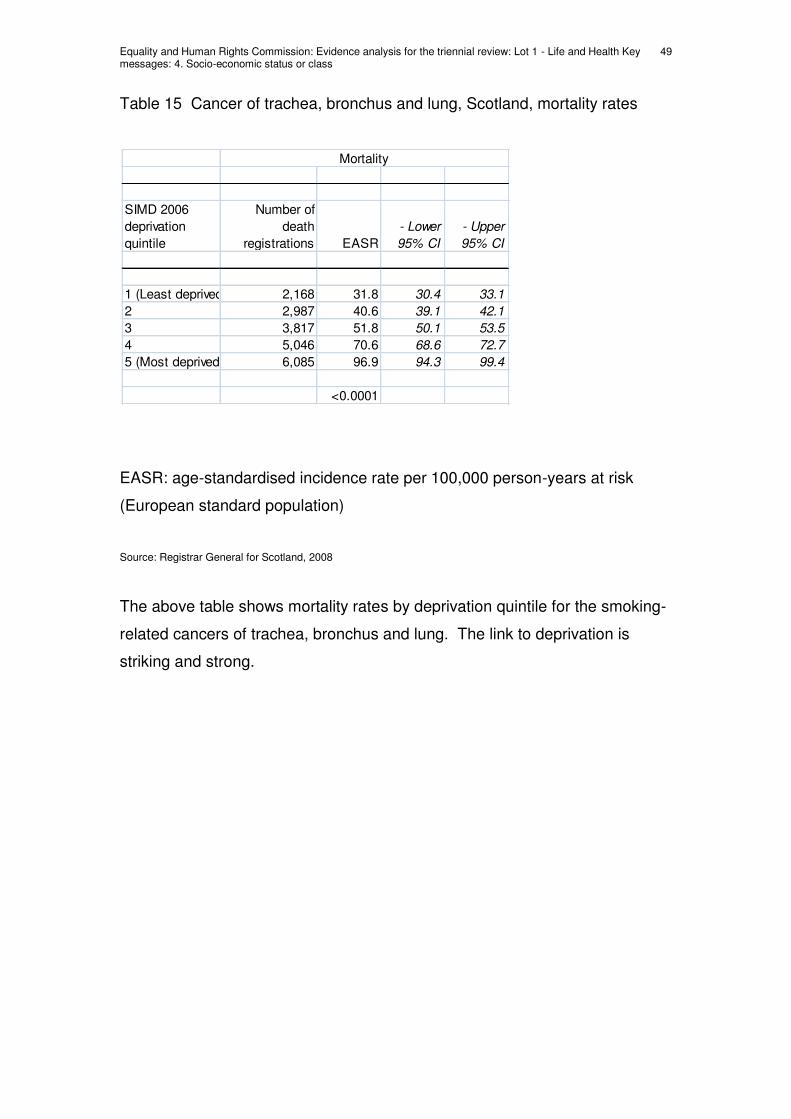
Equality and Human Rights Commission: Evidence analysis for the triennial review: Lot 1 - Life and Health Key messages: 4. Socio-economic status or class
49
Table 15 Cancer of trachea, bronchus and lung, Scotland, mortality rates
EASR: age-standardised incidence rate per 100,000 person-years at risk
(European standard population)
Source: Registrar General for Scotland, 2008
The above table shows mortality rates by deprivation quintile for the smoking-
related cancers of trachea, bronchus and lung. The link to deprivation is
striking and strong.
SIMD 2006
deprivation
quintile
Number of
death
registrations EASR
- Lower
95% CI
- Upper
95% CI
1 (Least deprived 2,168 31.8 30.4 33.1
2 2,987 40.6 39.1 42.1
3 3,817 51.8 50.1 53.5
4 5,046 70.6 68.6 72.7
5 (Most deprived) 6,085 96.9 94.3 99.4
<0.0001
Mortality

Equality and Human Rights Commission: Evidence analysis for the triennial review: Lot 1 - Life and Health Key messages: 4. Socio-economic status or class
50
Table 16 Breast cancer - women only, Scotland mortality rates
Source: Registrar General for Scotland, 2008
By contrast, the table above shows no statistically significant correlation
between deprivation and breast cancer mortality rate. Breast cancer
incidence (not shown here) is negatively correlated with deprivation. The
differences in incidence and mortality figures highlight that differences in
outcomes for breast cancer sufferers do exist with those from more deprived
areas having worse outcomes.
Data are also available on colorectal and prostate cancer, neither of which
shows a correlation between death rate and deprivation.
Females
SIMD 2006
deprivation quintile
Number of death
registrations EASR - Lower 95% CI - Upper 95% CI
1 (Least deprived) 978 26.2 24.5 28.0
2 1,070 26.7 25.0 28.4
3 1,139 28.3 26.5 30.0
4 1,155 28.8 27.0 30.6
5 (Most deprived) 1,069 29.5 27.6 31.4
Test for trend
(Poisson regression) 0.0587
Mortality
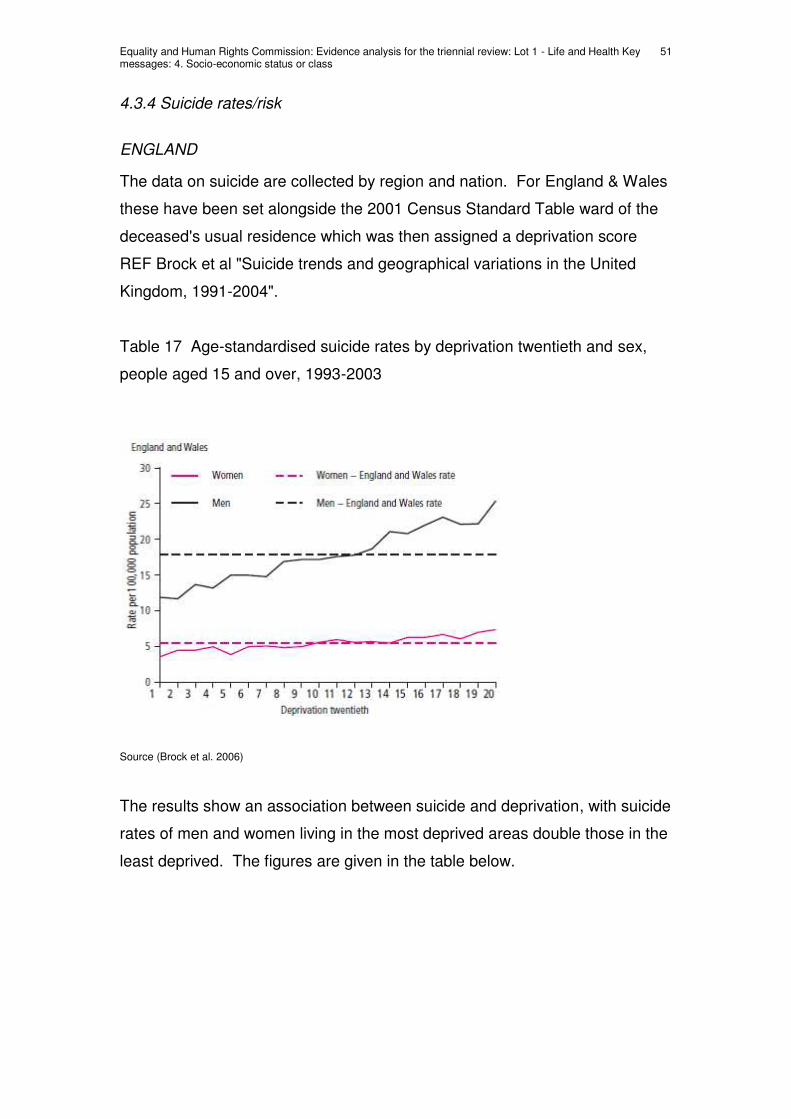
Equality and Human Rights Commission: Evidence analysis for the triennial review: Lot 1 - Life and Health Key messages: 4. Socio-economic status or class
51
4.3.4 Suicide rates/risk
ENGLAND
The data on suicide are collected by region and nation. For England & Wales
these have been set alongside the 2001 Census Standard Table ward of the
deceased's usual residence which was then assigned a deprivation score
REF Brock et al "Suicide trends and geographical variations in the United
Kingdom, 1991-2004".
Table 17 Age-standardised suicide rates by deprivation twentieth and sex,
people aged 15 and over, 1993-2003
Source (Brock et al. 2006)
The results show an association between suicide and deprivation, with suicide
rates of men and women living in the most deprived areas double those in the
least deprived. The figures are given in the table below.

Equality and Human Rights Commission: Evidence analysis for the triennial review: Lot 1 - Life and Health Key messages: 4. Socio-economic status or class
52
Table 18 Age-standardised suicide rates by deprivation twentieth and sex,
people aged 15 and over, England & Wales, 1999-2003
Source (Brock et al. 2006)
The table and graph show that suicide rates in the most deprived areas were
double those in the least deprived for men and women. These differences are
statistically significant.
Deprivation twentieth1 Men Women
Rate per
100,000
population*
Rate per
100,000
population*
1 11.9 3.6
2 11.7 4.5
3 13.7 4.5
4 13.2 5.0
5 15.0 3.9
6 15.0 5.0
7 14.8 5.1
8 16.9 4.9
9 17.2 5.0
10 17.2 5.6
11 17.6 6.0
12 17.8 5.6
13 18.7 5.7
14 21.1 5.5
15 20.8 6.3
16 22.0 6.3
17 23.1 6.7
18 22.1 6.1
19 22.2 7.0
20 25.4 7.4
England & Wales rate 17.9 5.5

Equality and Human Rights Commission: Evidence analysis for the triennial review: Lot 1 - Life and Health Key messages: 4. Socio-economic status or class
53
4.3.4 Suicide rates/risk
WALES
There are no separate data for Wales.

Equality and Human Rights Commission: Evidence analysis for the triennial review: Lot 1 - Life and Health Key messages: 4. Socio-economic status or class
54
4.3.4 Suicide rates/risk
SCOTLAND
These data are available on the basis of the most deprived areas.
Figure 8 European age-standardised rates per 100,000 population: deaths
caused by intentional self harm and events of undetermined intent, by
deprivation decile (SIMD), Scotland, 2004-08
Source: General Register Office for Scotland: Data extracted Jan 2010 by Scottish PHO
The graph above shows there is a direct and statistically significant link
between an area's deprivation score and the mortality rate due to suicide and
self-harm.

Equality and Human Rights Commission: Evidence analysis for the triennial review: Lot 1 - Life and Health Key messages: 4. Socio-economic status or class
55
Table 19 Deaths caused by intentional self harm and events of undetermined
intent by Scottish Index of Multiple Deprivation (SIMD)
Source: Registrar General for Scotland, 2008
The table above gives the figures from which the graph is derived. Both show
that the difference between the most deprived and least deprived area of
Scotland is statistically significant, as is the difference between both the most
and least deprived, and Scotland overall.
1999-03 2004-08 1999-03 2004-08 1999-03 2004-08
Males
1 (most affluent) 146 135 11.7 10.7 11.5 (9.7-13.5) 10.5 (8.8-12.4)
2 159 180 12.8 14.1 12.4 (10.6-14.5) 13.4 (11.5-15.6)
3 186 207 15.2 16.2 14.9 (12.8-17.3) 15.4 (13.3-17.6)
4 238 239 19.5 18.8 19.4 (17-22.1) 18.2 (15.9-20.7)
5 281 253 22.7 19.9 22.3 (19.7-25) 19.1 (16.8-21.7)
6 296 312 23.9 24.8 23.1 (20.6-25.9) 23.8 (21.3-26.7)
7 355 298 28.7 24.1 28.1 (25.3-31.2) 23.3 (20.7-26.1)
8 398 373 32.2 30.4 31.8 (28.8-35.1) 29.7 (26.8-32.9)
9 454 421 36.7 34.6 37.1 (33.7-40.7) 34.3 (31.1-37.8)
10 (most deprived) 625 550 49.7 45.4 51.2 (47.2-55.4) 46 (42.2-50)
Unknown 98 32 - - - -
Scotland 3,236 3,000 26.6 24.3 25.8 (24.9-26.7) 23.4 (22.6-24.2)
Numbers
European age-standardised rates
(EASRs) (95% confidence intervals)Crude rates
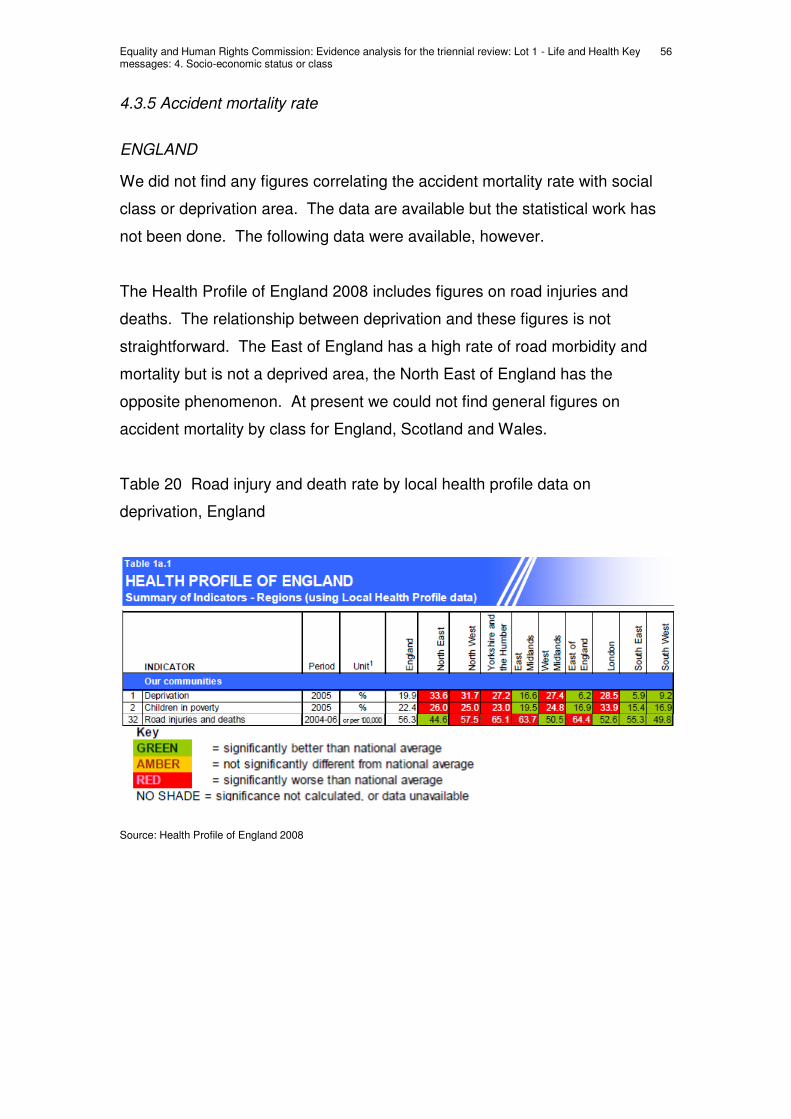
Equality and Human Rights Commission: Evidence analysis for the triennial review: Lot 1 - Life and Health Key messages: 4. Socio-economic status or class
56
4.3.5 Accident mortality rate
ENGLAND
We did not find any figures correlating the accident mortality rate with social
class or deprivation area. The data are available but the statistical work has
not been done. The following data were available, however.
The Health Profile of England 2008 includes figures on road injuries and
deaths. The relationship between deprivation and these figures is not
straightforward. The East of England has a high rate of road morbidity and
mortality but is not a deprived area, the North East of England has the
opposite phenomenon. At present we could not find general figures on
accident mortality by class for England, Scotland and Wales.
Table 20 Road injury and death rate by local health profile data on
deprivation, England
Source: Health Profile of England 2008
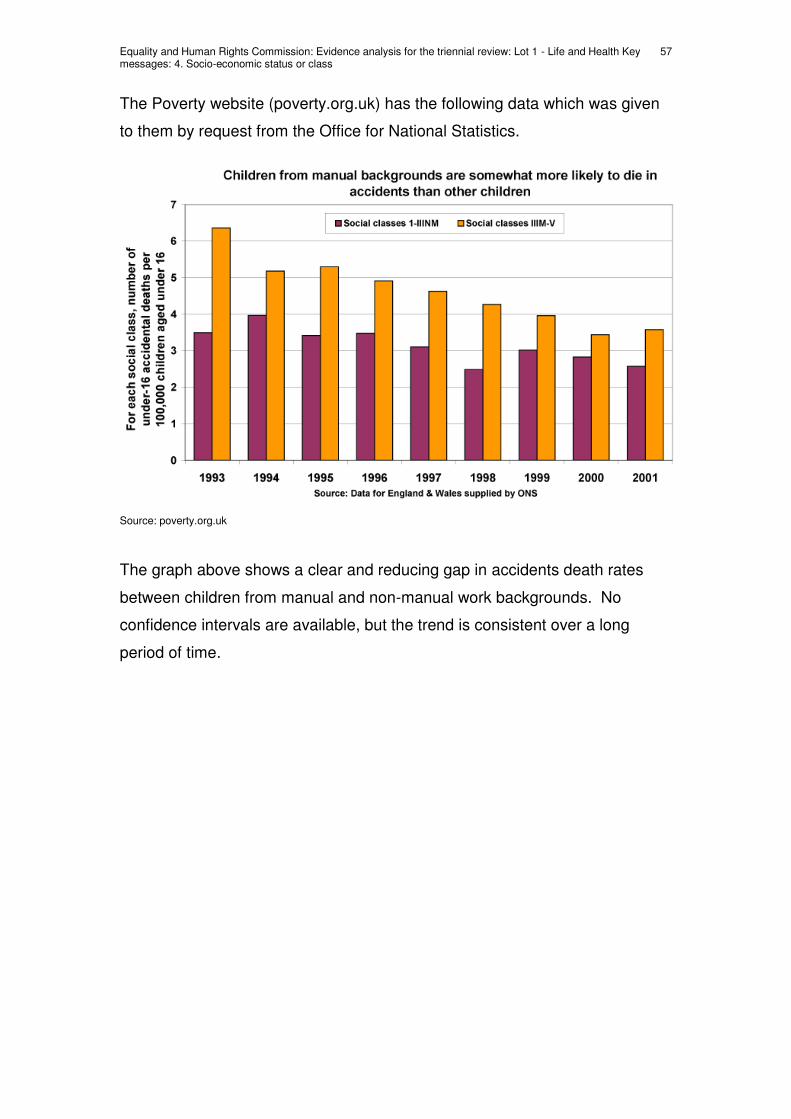
Equality and Human Rights Commission: Evidence analysis for the triennial review: Lot 1 - Life and Health Key messages: 4. Socio-economic status or class
57
The Poverty website (poverty.org.uk) has the following data which was given
to them by request from the Office for National Statistics.
Source: poverty.org.uk
The graph above shows a clear and reducing gap in accidents death rates
between children from manual and non-manual work backgrounds. No
confidence intervals are available, but the trend is consistent over a long
period of time.

Equality and Human Rights Commission: Evidence analysis for the triennial review: Lot 1 - Life and Health Key messages: 4. Socio-economic status or class
58
WALES
These data are not collected in the General Register Office Census
Longitudinal Study (for England & Wales).

Equality and Human Rights Commission: Evidence analysis for the triennial review: Lot 1 - Life and Health Key messages: 4. Socio-economic status or class
59
4.3.5 Accident mortality rate
SCOTLAND
Table 21 Deaths as a result of an unintentional injury, adults aged 15 and
over by deprivation quintile, number and standardised mortality ratio, year
ending 31 December, 2004-08
Source: Registrar General for Scotland, 2008
Deprivation quintile
1 2 3 4 5 Total
Number of deaths 813 1,175 1,335 1,361 1,473 6,157
Standardised mortality ratio 65.9 89.9 101.3 103.4 123.0 100.0
Lower 95% confidence interval 61.4 84.8 95.9 97.9 116.7
Upper 95% confidence interval 70.5 95.0 106.8 108.9 129.3
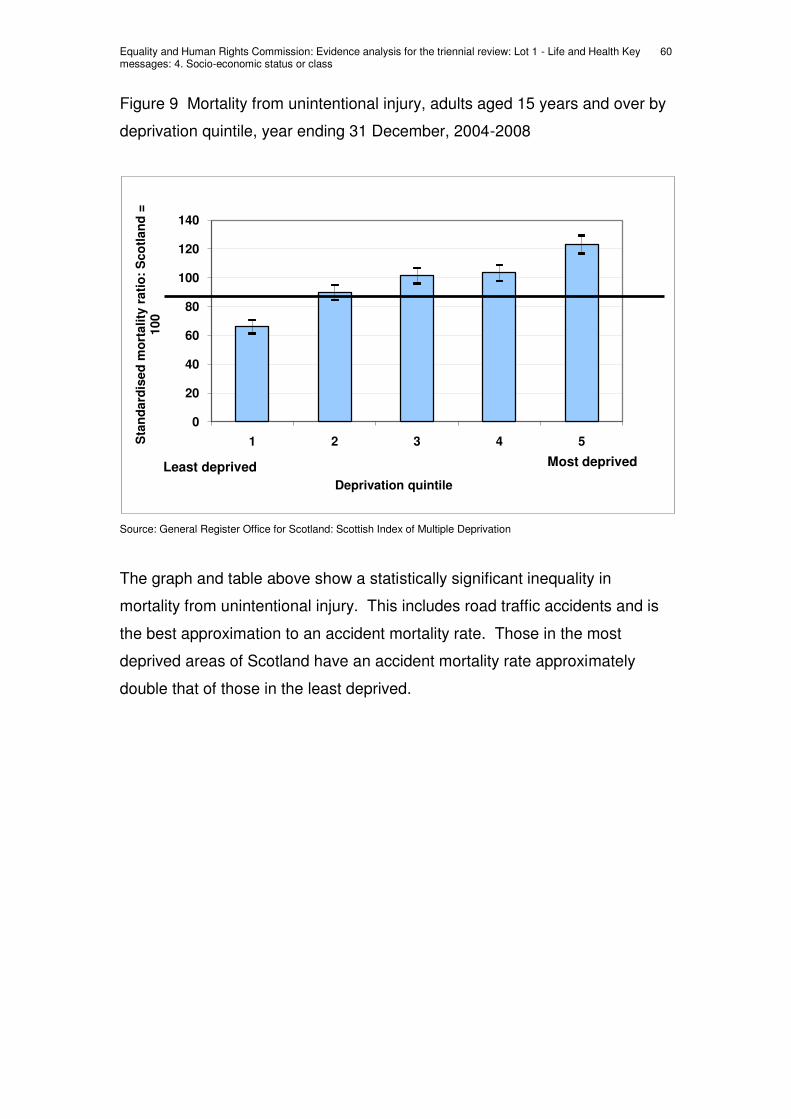
Equality and Human Rights Commission: Evidence analysis for the triennial review: Lot 1 - Life and Health Key messages: 4. Socio-economic status or class
60
Figure 9 Mortality from unintentional injury, adults aged 15 years and over by
deprivation quintile, year ending 31 December, 2004-2008
Source: General Register Office for Scotland: Scottish Index of Multiple Deprivation
The graph and table above show a statistically significant inequality in
mortality from unintentional injury. This includes road traffic accidents and is
the best approximation to an accident mortality rate. Those in the most
deprived areas of Scotland have an accident mortality rate approximately
double that of those in the least deprived.
0
20
40
60
80
100
120
140
1 2 3 4 5Sta
nd
ard
ised
mo
rtality
rati
o:
Sco
tlan
d =
1
00
Deprivation quintile
Least deprived Most deprived

Equality and Human Rights Commission: Evidence analysis for the triennial review: Lot 1 - Life and Health Key messages: 4. Socio-economic status or class
61
4.3.6 Deaths from non-natural causes for people resident in health or social
care establishments
These data are not collected by Socio-economic status in the General
Register Office for Scotland or the General Register Office Census
Longitudinal Study (for England & Wales). We found nothing elsewhere.
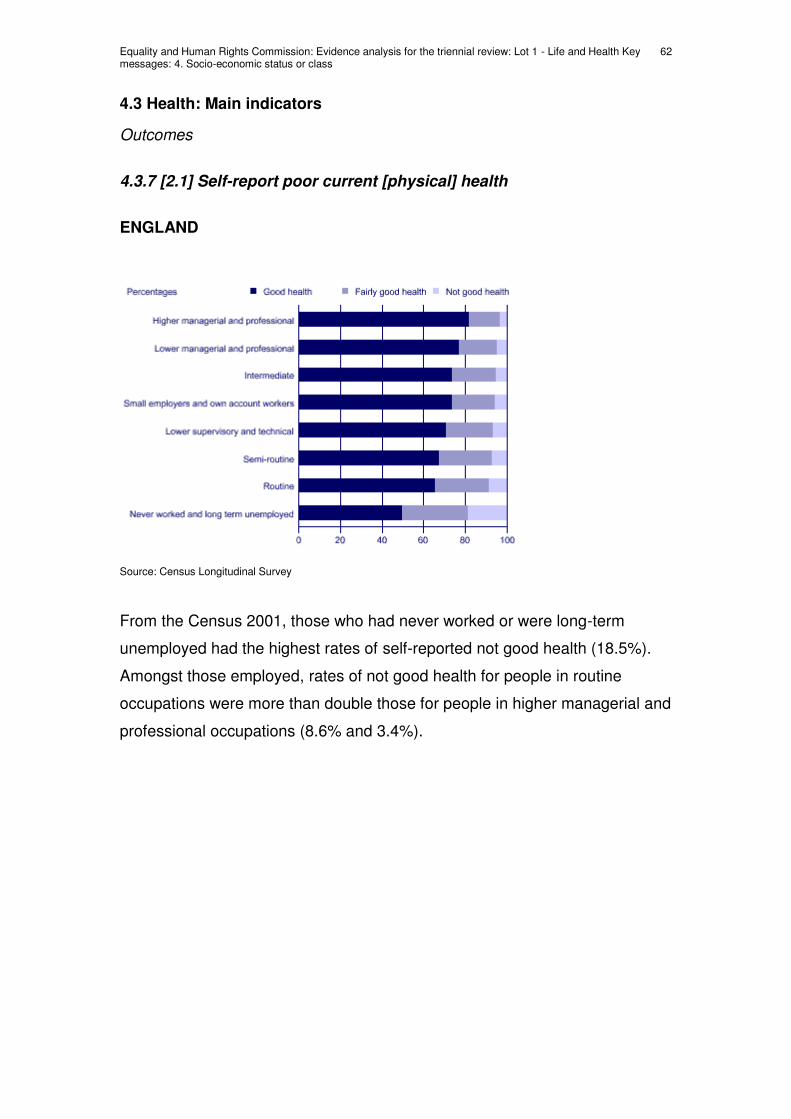
Equality and Human Rights Commission: Evidence analysis for the triennial review: Lot 1 - Life and Health Key messages: 4. Socio-economic status or class
62
4.3 Health: Main indicators
Outcomes
4.3.7 [2.1] Self-report poor current [physical] health
ENGLAND
Source: Census Longitudinal Survey
From the Census 2001, those who had never worked or were long-term
unemployed had the highest rates of self-reported not good health (18.5%).
Amongst those employed, rates of not good health for people in routine
occupations were more than double those for people in higher managerial and
professional occupations (8.6% and 3.4%).
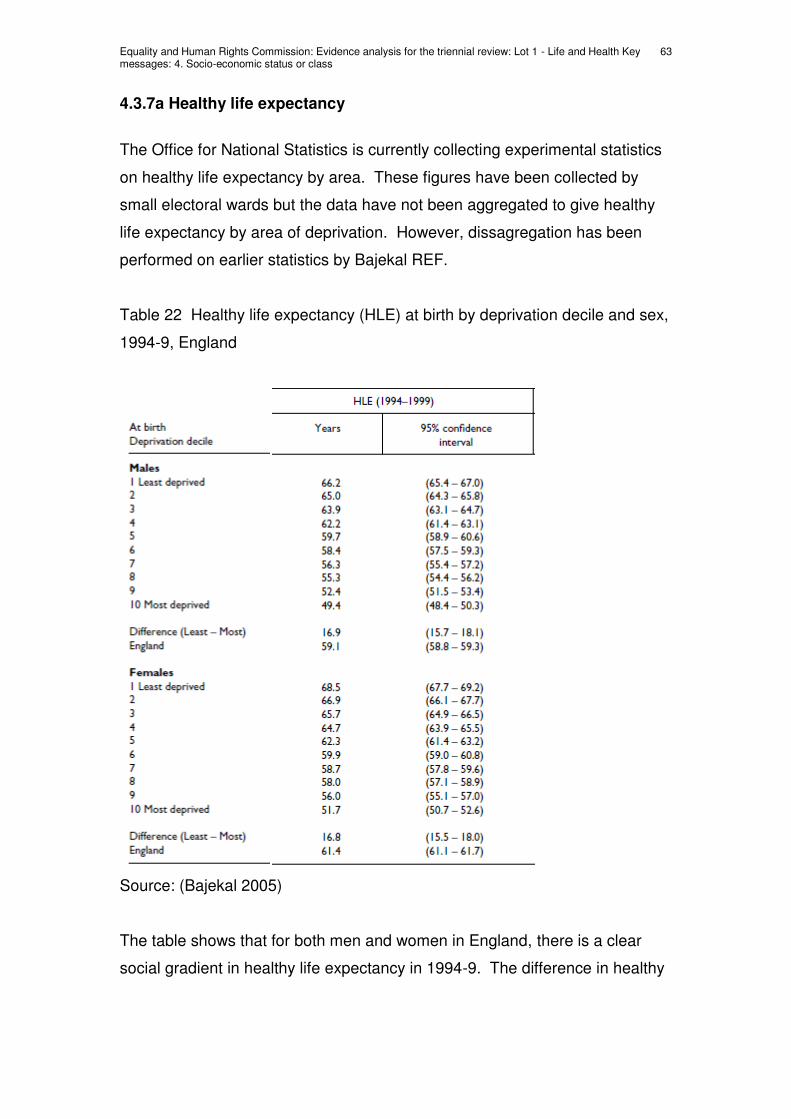
Equality and Human Rights Commission: Evidence analysis for the triennial review: Lot 1 - Life and Health Key messages: 4. Socio-economic status or class
63
4.3.7a Healthy life expectancy
The Office for National Statistics is currently collecting experimental statistics
on healthy life expectancy by area. These figures have been collected by
small electoral wards but the data have not been aggregated to give healthy
life expectancy by area of deprivation. However, dissagregation has been
performed on earlier statistics by Bajekal REF.
Table 22 Healthy life expectancy (HLE) at birth by deprivation decile and sex,
1994-9, England
Source: (Bajekal 2005)
The table shows that for both men and women in England, there is a clear
social gradient in healthy life expectancy in 1994-9. The difference in healthy

Equality and Human Rights Commission: Evidence analysis for the triennial review: Lot 1 - Life and Health Key messages: 4. Socio-economic status or class
64
life expectancy between the most and least deprived deciles for both men and
women is almost 17 years.
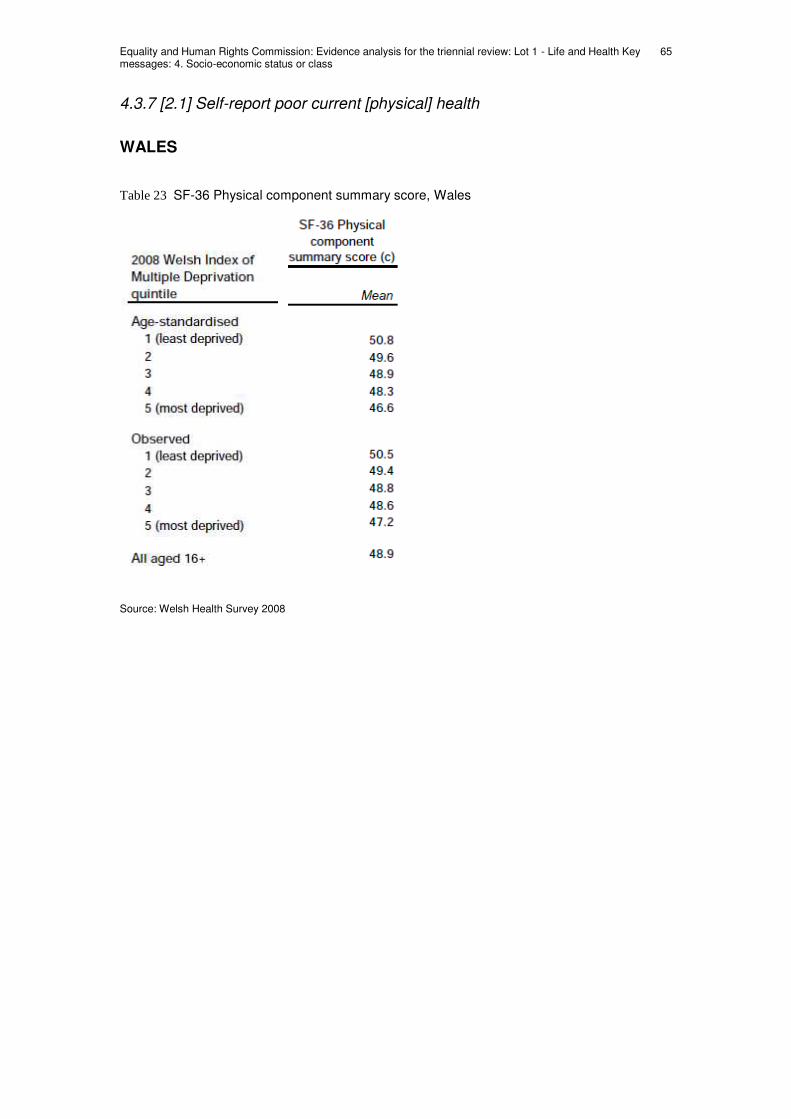
Equality and Human Rights Commission: Evidence analysis for the triennial review: Lot 1 - Life and Health Key messages: 4. Socio-economic status or class
65
4.3.7 [2.1] Self-report poor current [physical] health
WALES
Table 23 SF-36 Physical component summary score, Wales
Source: Welsh Health Survey 2008

Equality and Human Rights Commission: Evidence analysis for the triennial review: Lot 1 - Life and Health Key messages: 4. Socio-economic status or class
66
4.3.7 [2.1] Self-report poor current [physical] health
SCOTLAND
Table 24 Estimated odds ratio for bad/very bad general health by income and
deprivation
Source: Scottish Health Survey, 2008
Household income was significantly associated with poor self-assessed health
for both men and women. When compared with the highest household income
quintile, the odds of reporting poor health were significantly higher among
men in the 3rd, 4th and 5th income quintiles, and among women in the 4th and
5th. The odds of those in the lowest income quintile having poor self-assessed
health were 8.03 times higher for men and 2.50 times higher for women
(Scottish Health Survey).
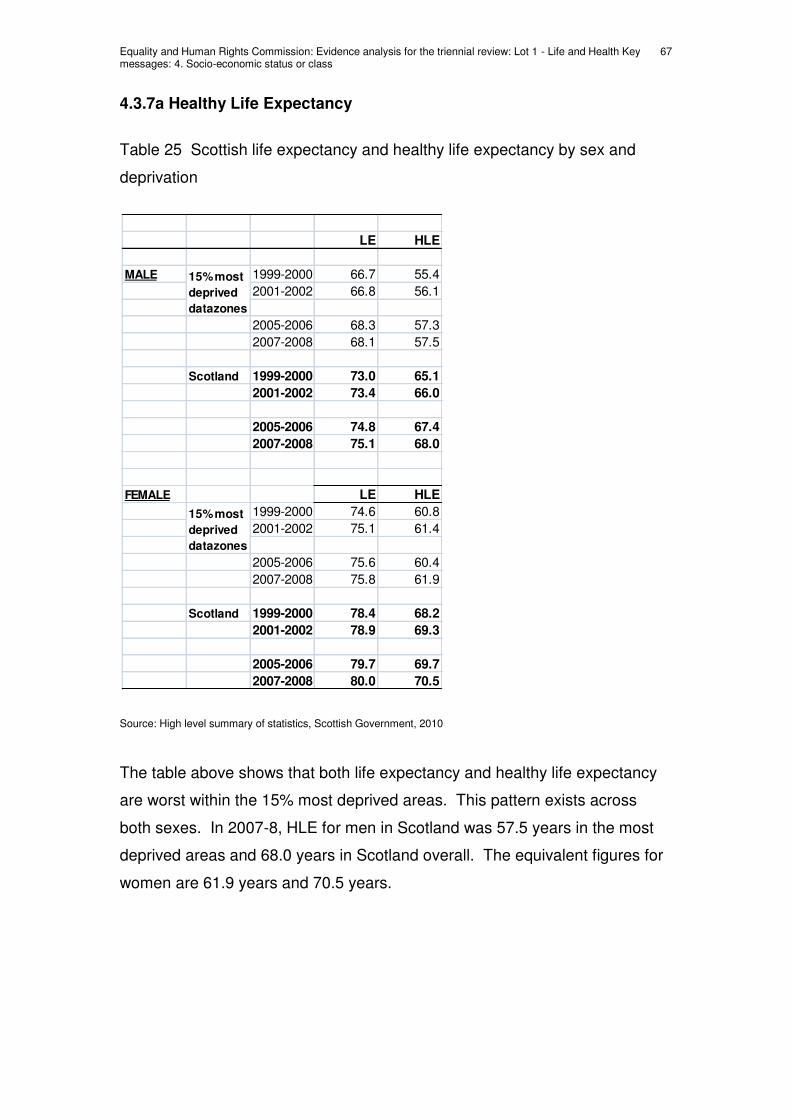
Equality and Human Rights Commission: Evidence analysis for the triennial review: Lot 1 - Life and Health Key messages: 4. Socio-economic status or class
67
4.3.7a Healthy Life Expectancy
Table 25 Scottish life expectancy and healthy life expectancy by sex and
deprivation
Source: High level summary of statistics, Scottish Government, 2010
The table above shows that both life expectancy and healthy life expectancy
are worst within the 15% most deprived areas. This pattern exists across
both sexes. In 2007-8, HLE for men in Scotland was 57.5 years in the most
deprived areas and 68.0 years in Scotland overall. The equivalent figures for
women are 61.9 years and 70.5 years.
LE HLE
MALE 1999-2000 66.7 55.4
2001-2002 66.8 56.1
2005-2006 68.3 57.3
2007-2008 68.1 57.5
Scotland 1999-2000 73.0 65.1
2001-2002 73.4 66.0
2005-2006 74.8 67.4
2007-2008 75.1 68.0
FEMALE LE HLE
1999-2000 74.6 60.8
2001-2002 75.1 61.4
2005-2006 75.6 60.4
2007-2008 75.8 61.9
Scotland 1999-2000 78.4 68.2
2001-2002 78.9 69.3
2005-2006 79.7 69.7
2007-2008 80.0 70.5
15% most
deprived
datazones
15% most
deprived
datazones
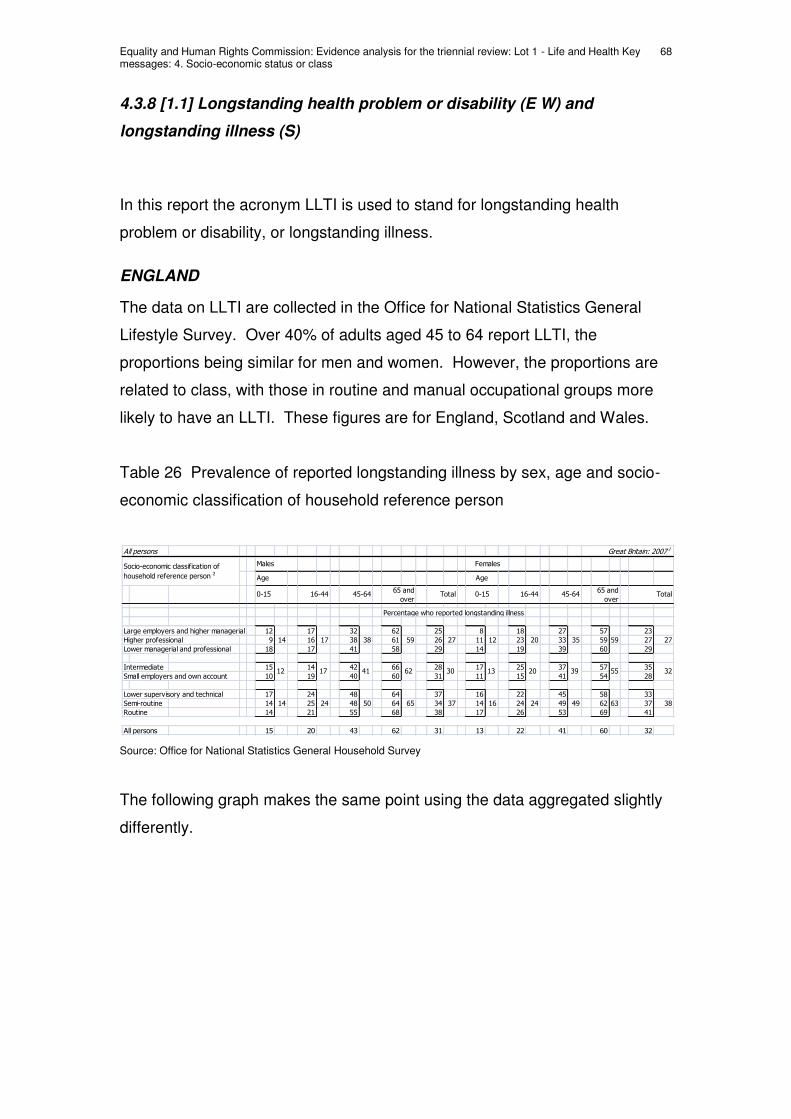
Equality and Human Rights Commission: Evidence analysis for the triennial review: Lot 1 - Life and Health Key messages: 4. Socio-economic status or class
68
4.3.8 [1.1] Longstanding health problem or disability (E W) and
longstanding illness (S)
In this report the acronym LLTI is used to stand for longstanding health
problem or disability, or longstanding illness.
ENGLAND
The data on LLTI are collected in the Office for National Statistics General
Lifestyle Survey. Over 40% of adults aged 45 to 64 report LLTI, the
proportions being similar for men and women. However, the proportions are
related to class, with those in routine and manual occupational groups more
likely to have an LLTI. These figures are for England, Scotland and Wales.
Table 26 Prevalence of reported longstanding illness by sex, age and socio-
economic classification of household reference person
Source: Office for National Statistics General Household Survey
The following graph makes the same point using the data aggregated slightly
differently.
Percentage who reported longstanding illness
Large employers and higher managerial 12 17 32 62 25 8 18 27 57 23
Higher professional 9 14 16 17 38 38 61 59 26 27 11 12 23 20 33 35 59 59 27 27
Lower managerial and professional 18 17 41 58 29 14 19 39 60 29
Intermediate 15 14 42 66 28 17 25 37 57 35
Small employers and own account 10 19 40 60 31 11 15 41 54 28
Lower supervisory and technical 17 24 48 64 37 16 22 45 58 33
Semi-routine 14 14 25 24 48 50 64 65 34 37 14 16 24 24 49 49 62 63 37 38
Routine 14 21 55 68 38 17 26 53 69 41
All persons Great Britain: 2007 1
Socio-economic classification of
household reference person 2
Males Females
Age Age
Total 0-15 16-44 45-640-15 16-44 45-6465 and
over
65 and
overTotal
12 17 41 62 30 13 20 39 55 32
All persons 15 20 43 62 31 13 22 41 60 32

Equality and Human Rights Commission: Evidence analysis for the triennial review: Lot 1 - Life and Health Key messages: 4. Socio-economic status or class
69
Figure 10 Limited longstanding illness LLTI by occupational group, adults
aged 45-64, Great Britain
Source: The Poverty Site
In Great Britain, therefore, LLTI is associated with social class; those in
routine or manual backgrounds and those who are long-term unemployed are
more likely to have an LLTI.
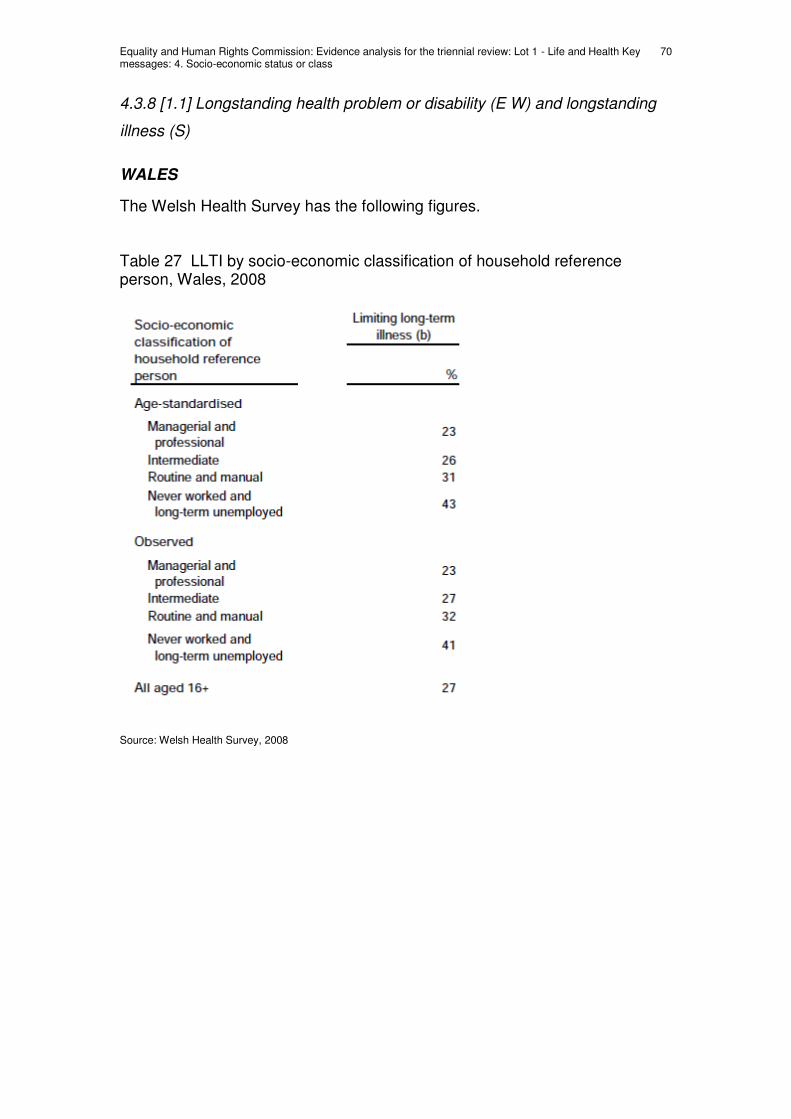
Equality and Human Rights Commission: Evidence analysis for the triennial review: Lot 1 - Life and Health Key messages: 4. Socio-economic status or class
70
4.3.8 [1.1] Longstanding health problem or disability (E W) and longstanding
illness (S)
WALES
The Welsh Health Survey has the following figures.
Table 27 LLTI by socio-economic classification of household reference person, Wales, 2008
Source: Welsh Health Survey, 2008
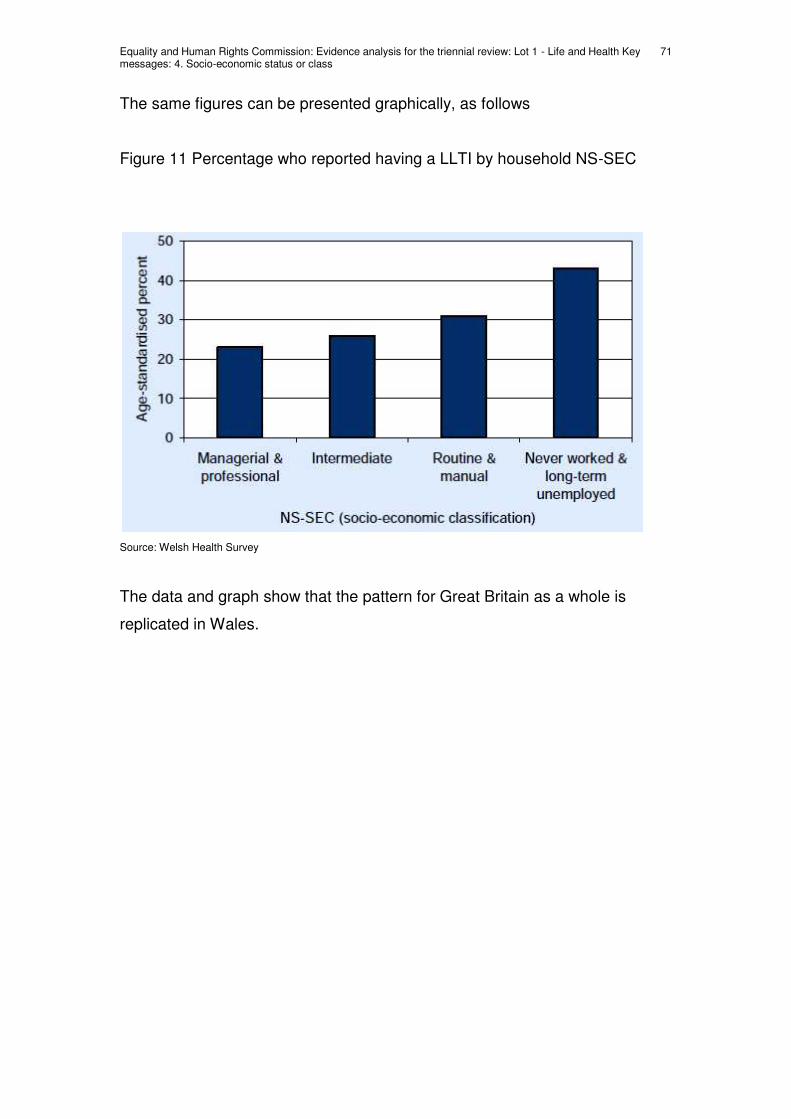
Equality and Human Rights Commission: Evidence analysis for the triennial review: Lot 1 - Life and Health Key messages: 4. Socio-economic status or class
71
The same figures can be presented graphically, as follows
Figure 11 Percentage who reported having a LLTI by household NS-SEC
Source: Welsh Health Survey
The data and graph show that the pattern for Great Britain as a whole is
replicated in Wales.

Equality and Human Rights Commission: Evidence analysis for the triennial review: Lot 1 - Life and Health Key messages: 4. Socio-economic status or class
72
4.3.8 [1.1] Longstanding health problem or disability (E W) and longstanding
illness (S)
SCOTLAND
These data are available through the Scottish Household Survey, 2005-6.
Table 28 Percentage of adults aged 16 and over with a long-standing illness,
disability or health problem by Scottish Index of Multiple Deprivation quintile,
2007/08
Source: Scottish Household Survey 2005-06
The same data represented graphically:
SIMD quintile Percentage
1 (least deprived) 14
2 18
3 21
4 27
5 (most deprived) 32
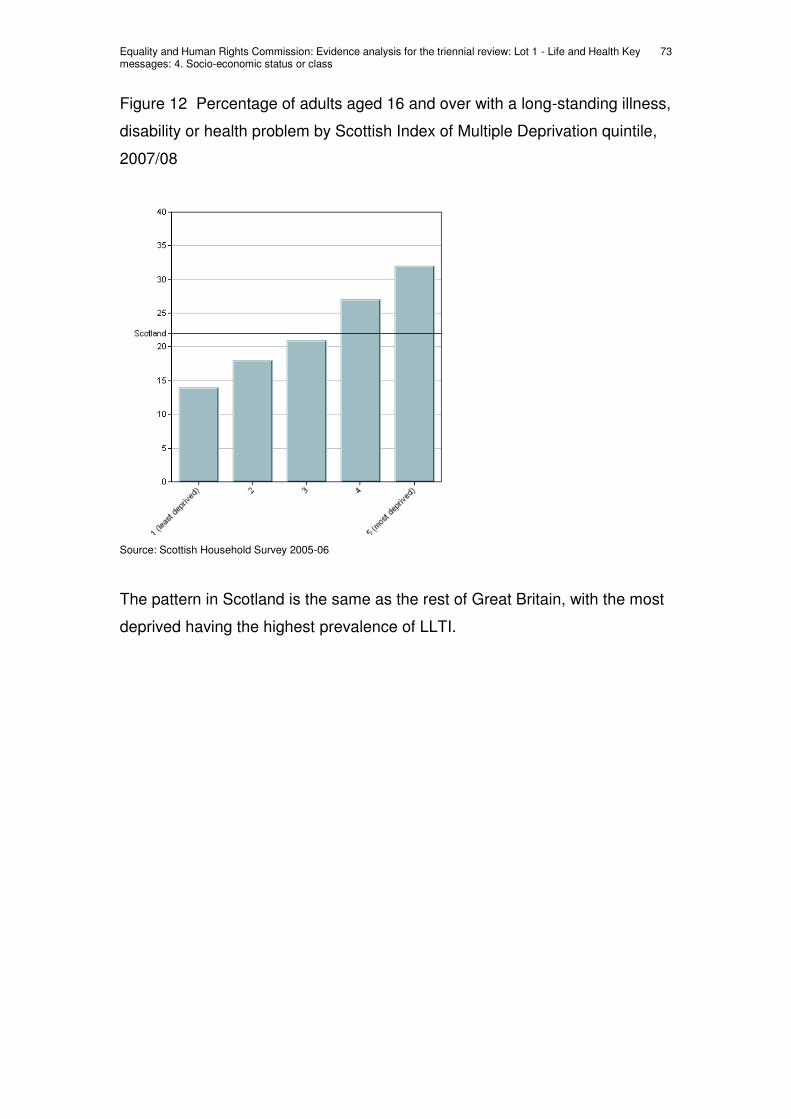
Equality and Human Rights Commission: Evidence analysis for the triennial review: Lot 1 - Life and Health Key messages: 4. Socio-economic status or class
73
Figure 12 Percentage of adults aged 16 and over with a long-standing illness,
disability or health problem by Scottish Index of Multiple Deprivation quintile,
2007/08
Source: Scottish Household Survey 2005-06
The pattern in Scotland is the same as the rest of Great Britain, with the most
deprived having the highest prevalence of LLTI.
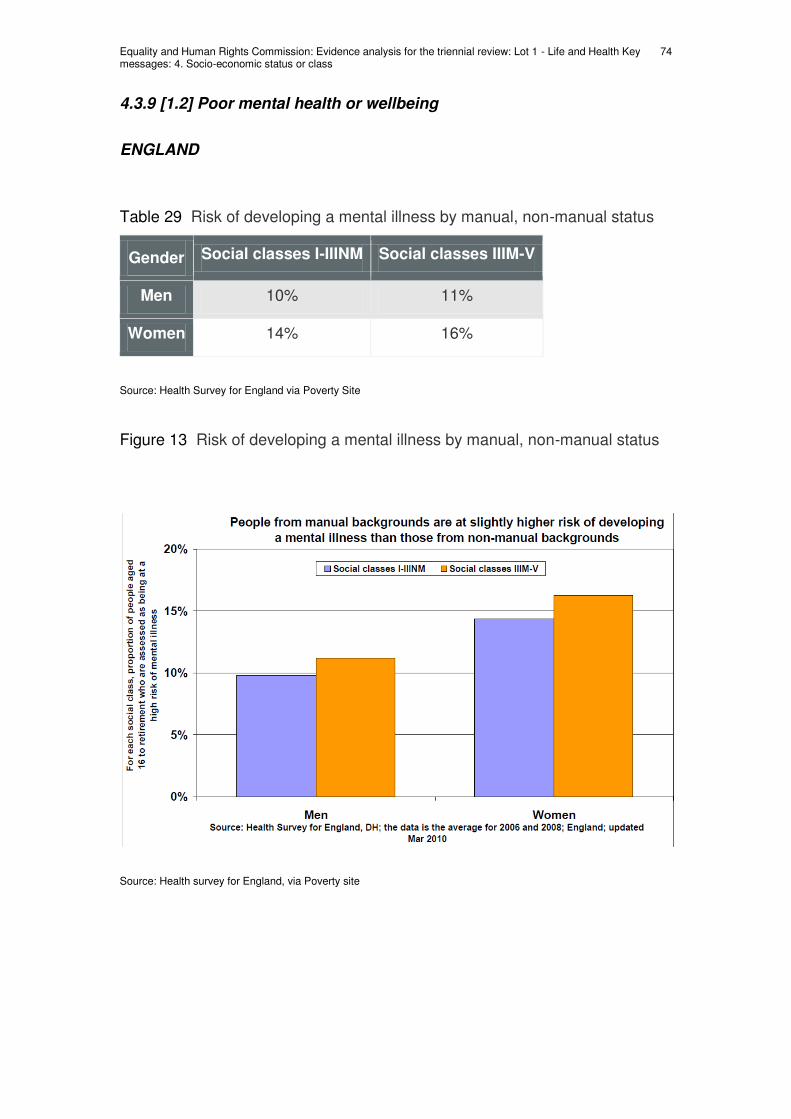
Equality and Human Rights Commission: Evidence analysis for the triennial review: Lot 1 - Life and Health Key messages: 4. Socio-economic status or class
74
4.3.9 [1.2] Poor mental health or wellbeing
ENGLAND
Table 29 Risk of developing a mental illness by manual, non-manual status
Gender Social classes I-IIINM Social classes IIIM-V
Men 10% 11%
Women 14% 16%
Source: Health Survey for England via Poverty Site
Figure 13 Risk of developing a mental illness by manual, non-manual status
Source: Health survey for England, via Poverty site
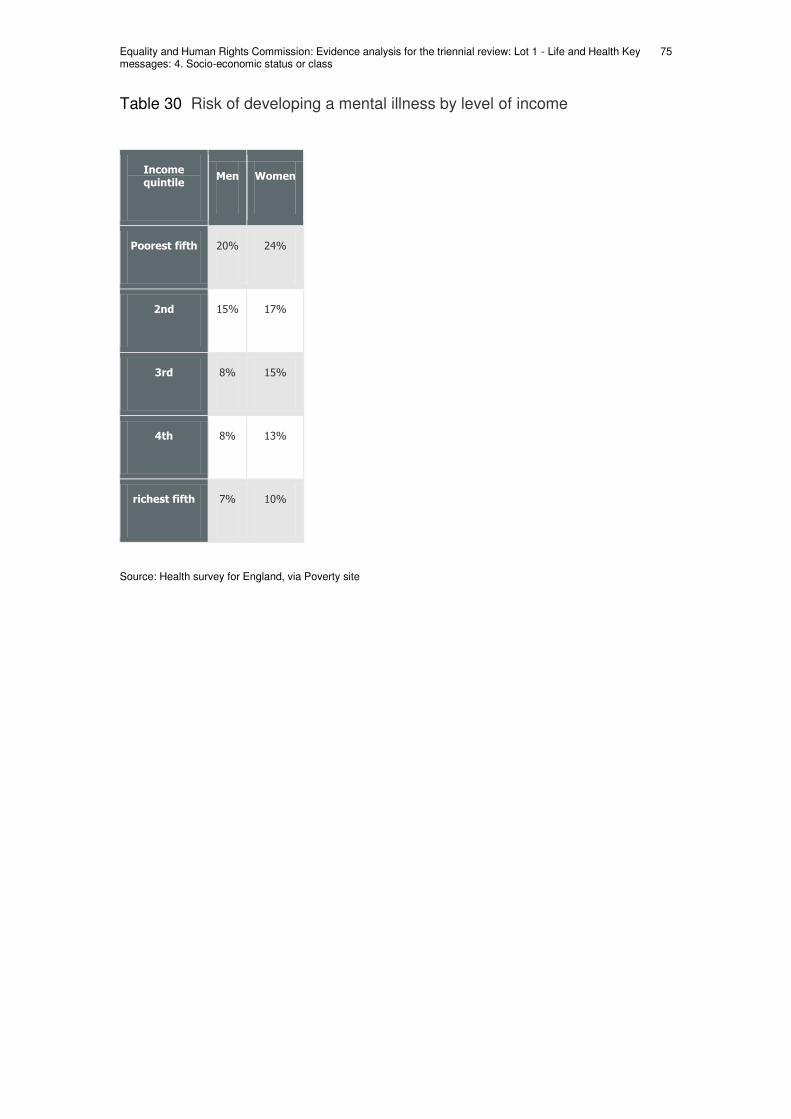
Equality and Human Rights Commission: Evidence analysis for the triennial review: Lot 1 - Life and Health Key messages: 4. Socio-economic status or class
75
Table 30 Risk of developing a mental illness by level of income
Income
quintile Men Women
Poorest fifth 20% 24%
2nd 15% 17%
3rd 8% 15%
4th 8% 13%
richest fifth 7% 10%
Source: Health survey for England, via Poverty site

Equality and Human Rights Commission: Evidence analysis for the triennial review: Lot 1 - Life and Health Key messages: 4. Socio-economic status or class
76
Figure 14 Risk of developing a mental illness by level of income
Source: Health survey for England, via Poverty site

Equality and Human Rights Commission: Evidence analysis for the triennial review: Lot 1 - Life and Health Key messages: 4. Socio-economic status or class
77
Table 31 Incapacity benefit for mental illness by deprivation of region in
England
Source: Health Profile of England 2008
The figures and graphs above show a general picture in which poverty and
deprivation are associated with mental illness. Adults in the poorest fifth are
at more than twice as much risk of developing a mental illness than those on
average incomes. People in deprived areas are significantly more likely to
claim incapacity benefits for mental illness than those in affluent areas. The
route of causation here is unclear; living on a low income may increase the
likelihood of developing mental illness, but mental illness may also reduce the
likelihood of being able to progress to and work in high-earning posts.
However, it remains a serious inequality whether it is the result of those with
mental illness becoming poor or those in poverty becoming mentally ill.

Equality and Human Rights Commission: Evidence analysis for the triennial review: Lot 1 - Life and Health Key messages: 4. Socio-economic status or class
78
4.3.9 [1.2] Poor mental health or wellbeing
WALES
Table 32 Mental illness by socio-economic classification of household
reference person, Wales
(b) = Adults who reported being treated for depression, anxiety or any
other mental illness
(c) = SF36 is a 36 point questionnaire which includes questions about
mental health and wellbeing; a higher score is better.
Source Welsh Health Survey
The data in Wales indicate a social gradient; those most at risk of mental
illness are those who are unemployed or who have never worked; but those
working in routine and manual jobs are about 33% more likely to have a
mental illness than managerial and professional workers. There is a similar
gradient in relation to mental wellbeing.

Equality and Human Rights Commission: Evidence analysis for the triennial review: Lot 1 - Life and Health Key messages: 4. Socio-economic status or class
79
4.3.9 [1.2] Poor mental health or wellbeing
SCOTLAND
The data in Scotland show a similar picture to England & Wales. In the
Scottish Health Survey, the measurement device used is the Warwick-
Edinburgh Mental Wellbeing Scale. This is a score of mental wellbeing rather
than mental illness. The minimum score is 14 and the highest is 70. The
Scottish mean score is around 50. It is a relatively new tool but has been
validated against other tools and assessed as robust in focus groups. The
data for Scotland were collected and published in the 2008 Scottish Health
Survey. They are set out in the two tables below.
Table 33 WEMWBS mean scores by NS-SEC of household reference person
and sex
Source: Scottish Health Survey 2008

Equality and Human Rights Commission: Evidence analysis for the triennial review: Lot 1 - Life and Health Key messages: 4. Socio-economic status or class
80
Table 34 WEMWBS means score by equivalised household quintile and sex
Scottish Health Survey 2008
The table shows a social gradient in WEMWBS scores, but the figures are not
statistically significant.. It is difficult to get the importance of this inequality until
the tool has been in use longer.

Equality and Human Rights Commission: Evidence analysis for the triennial review: Lot 1 - Life and Health Key messages: 4. Socio-economic status or class
81
Table 35 Anxiety and depression (1), Patients in Scotland consulting a GP or
Practice Nurse at least once in the year: rates per 1,000 population (2), (3),
and 95% confidence intervals for financial year 2007/08; by gender and
deprivation quintile
Source: Information Services Division Practice Team Information
The table above shows the rate of consultations for anxiety and depression on
the basis of deprivation quintile. This shows large and statistically significant
differences between the most and least deprived in relation to both anxiety
and depression for both sexes. The point about causation made above
applies here also, but whichever is the case it is an important inequality.
Anxiety Depression
95% confidence
intervals
95% confidence
intervals
Sex Quintile Rates
per 1000 Lower Upper
Rates
per 1000 Lower Upper
Males 1- most
deprived 42.6 36.0 49.1 24.8 20.2 29.3
2 30.2 25.7 34.6 20.6 16.7 24.5
3 28.2 24.1 32.2 19.1 16.0 22.1
4 21.6 18.2 25.0 16.9 14.5 19.4
5 - least
deprived 18.2 13.5 23.0 13.1 10.8 15.4
All
categories 29.9 25.4 34.5 20.5 17.6 23.5
Females 1 - most
deprived 86.8 73.7 99.9 49.9 41.7 58.1
2 68.2 58.3 78.0 40.2 33.4 47.0
3 62.0 54.5 69.5 43.7 37.7 49.8
4 51.7 43.4 60.0 38.2 33.3 43.1
5 - least
deprived 40.5 33.3 47.7 29.1 23.2 35.0
All
categories 63.2 53.7 72.7 41.3 34.6 47.9
Persons ALL 46.6 39.8 53.5 31.0 26.4 35.6

Equality and Human Rights Commission: Evidence analysis for the triennial review: Lot 1 - Life and Health Key messages: 4. Socio-economic status or class
82
Process
4.3.10 [3.1] Low perception of treatment with dignity
ENGLAND
Table 36 Treatment with respect when using health services by social class,
ENGLAND
Source: Citizenship Survey
The Table above shows that there is no clear social gradient for feeling that
you are treated with respect when using health services. However the data
do indicate that those who have never worked, or are long term unemployed
perceive differences in their treatment from those who are employed.
WALES
The Living in Wales Survey amalgamated three measures into an overall
"Satisfaction with Service User Interaction" score: these three are "Treated
with dignity and respect"; "Staff were helpful" and "Involved in decisions about
treatment. The report states that dissatisfaction is not associated with socio-
economic status. The survey no longer exists; it is to be replaced by the
National Survey for Wales.
SCOTLAND
Data not yet available on Better Together Survey
In general, would you say that you are treated with respect when using health services by social class
All the time or most of the time Some of the time or less N
Higher/lower managerial and professions 91.38 8.62 4861
Intermediate occupations/small employers 90.44 9.56 2687
Lower supervisory & technical/Semi-routine 90.97 9.03 3620
Routine occupations 93.07 6.93 1615
Never worked/ long-term unemployed 87.71 12.29 667
(Chi-Square, 19.18; df, 4; p= <.05)
Equality and Human Rights Commission: Evidence analysis for the triennial review: Lot 1 - Life and Health Key messages: 4. Socio-economic status or class
83
4.3.11 [5.1] A&E attendance/accidents
ENGLAND
Data not available disaggregated by class.

Equality and Human Rights Commission: Evidence analysis for the triennial review: Lot 1 - Life and Health Key messages: 4. Socio-economic status or class
84
4.3.11 [5.1] A&E attendance/accidents
WALES
Table 37 Adults who reported attending hospital in the past three months, by NS-SEC classification of the household reference person
Source: Welsh Health Survey
In the table above, the number surveyed is 13,313. Only small numbers had
attended hospital because of an accident in the previous three months. There
is no pattern emerging on the basis of class.

Equality and Human Rights Commission: Evidence analysis for the triennial review: Lot 1 - Life and Health Key messages: 4. Socio-economic status or class
85
4.3.11 [5.1] A&E attendance/accidents
SCOTLAND
Data not available disaggregated by class.
Equality and Human Rights Commission: Evidence analysis for the triennial review: Lot 1 - Life and Health Key messages: 4. Socio-economic status or class
86
4.3.12 [3.2] Lack of support for individual nutritional needs during
hospital stays
No data are available disaggregated by class

Equality and Human Rights Commission: Evidence analysis for the triennial review: Lot 1 - Life and Health Key messages: 4. Socio-economic status or class
87
Autonomy
4.3.13 [4.1] Healthy lifestyle
ENGLAND
SMOKING
Table 38 Cigarette smoking status (age-standardised) by equivalised
household income and sex, England
Source: Health Survey for England, 2007
The table above shows a clear social gradient in smoking by household
income quintile. Men and women in the highest quintile have current smoking
status at 15% and 13%; in the lowest, the respective figures are 40% and
32%.

Equality and Human Rights Commission: Evidence analysis for the triennial review: Lot 1 - Life and Health Key messages: 4. Socio-economic status or class
88
Table 39 Smoking and smoking in pregnancy by regional indicators of
deprivation in England
Source: Health Profile of England 2008
The table above shows some degree of association between poverty and
deprivation and adults who smoke. In the most deprived area of England, the
North East, smoking prevalence is significantly worse than the national
average. But in the other deprived areas, there is no significant difference.
The association is stronger for smoking in pregnancy. This is significantly
worse than the national average in three out of five of the most deprived
areas; it is also worse in the South West, which has lower than average
deprivation.

Equality and Human Rights Commission: Evidence analysis for the triennial review: Lot 1 - Life and Health Key messages: 4. Socio-economic status or class
89
ENGLAND
ALCOHOL
In England, Wales and Scotland the class-related pattern on alcohol is
comple4. There are class differences but not always of a straightforward one-
class-drinks-more variety. The following set of tables is from the Health
Survey for England.
Table 40 Maximum alcohol consumption on any day in the last week (age-
standardised), by equivalised household income, men, England
Source: Health Survey for England, 2008
The table above shows that there is a social gradient in men drinking more
than 4 units and more than 8 units on the heaviest drinking day in the past
week. The gradient is in relation to household income quintile; the highest
income quintile has the highest proportion of heavy drinkers.

Equality and Human Rights Commission: Evidence analysis for the triennial review: Lot 1 - Life and Health Key messages: 4. Socio-economic status or class
90
Table 41 Maximum alcohol consumption on any day in the last week (age-
standardised), by equivalised household income, women, England
Source: Health Survey for England, 2008
For women there is a slight social gradient in those drinking more than 3 units
on any day in the last week. Here the 3 highest income quintiles are roughly
even, but the lowest income quintiles maintain the lowest prevalence of
drinking more than 2 units. There is no observed social gradient in drinking
more than 6 units on any day in the past week.

Equality and Human Rights Commission: Evidence analysis for the triennial review: Lot 1 - Life and Health Key messages: 4. Socio-economic status or class
91
Table 42 Number of days on which drank alcohol in the last week (age-
standardised), by equivalised household income, male, England
Source: Health Survey for England, 2008
Again a clear social gradient is observed amongst men for the number of days
on which people drank alcohol in the last week. Men in the highest quintile
drank more regularly than those in the lowest (3.2 days versus 1.7 days).
Those in the lowest quintile were far more likely to have a week without drink
(46%) than those in the highest (15%).
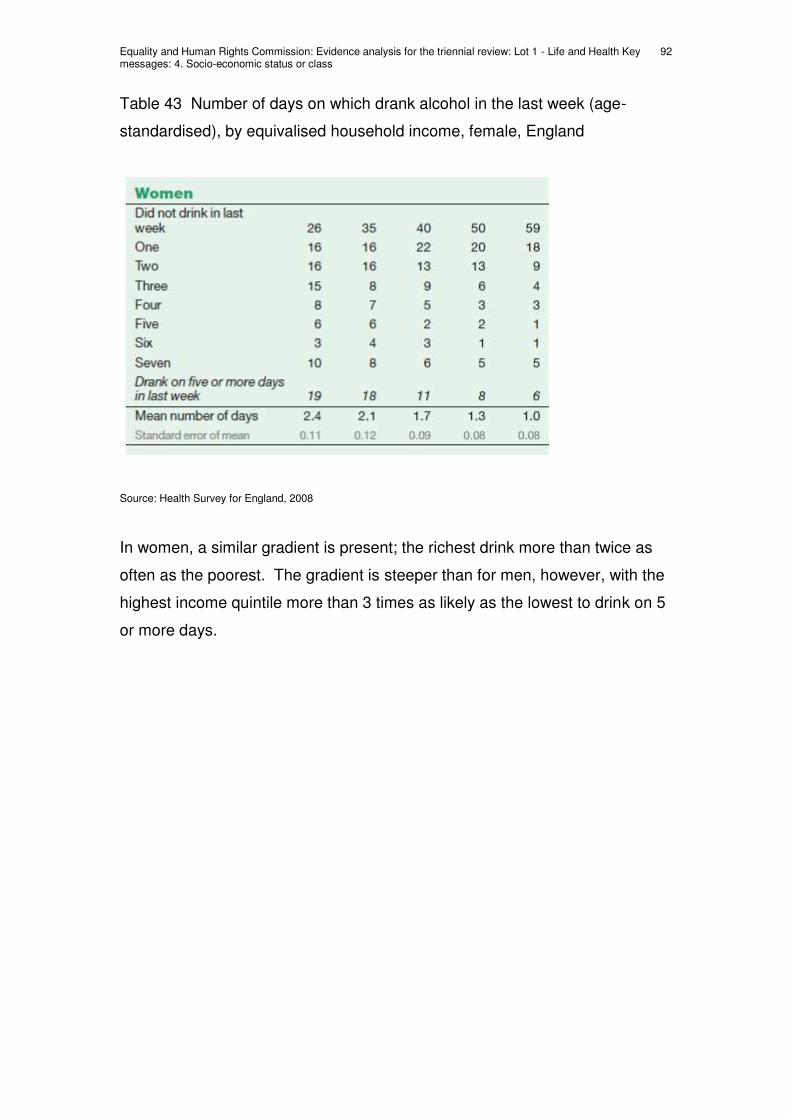
Equality and Human Rights Commission: Evidence analysis for the triennial review: Lot 1 - Life and Health Key messages: 4. Socio-economic status or class
92
Table 43 Number of days on which drank alcohol in the last week (age-
standardised), by equivalised household income, female, England
Source: Health Survey for England, 2008
In women, a similar gradient is present; the richest drink more than twice as
often as the poorest. The gradient is steeper than for men, however, with the
highest income quintile more than 3 times as likely as the lowest to drink on 5
or more days.

Equality and Human Rights Commission: Evidence analysis for the triennial review: Lot 1 - Life and Health Key messages: 4. Socio-economic status or class
93
ENGLAND
EXERCISE
Figure 15 Perception of own physical activity levels, by equivalised
household income, male
Source: Health Survey for England, 2008
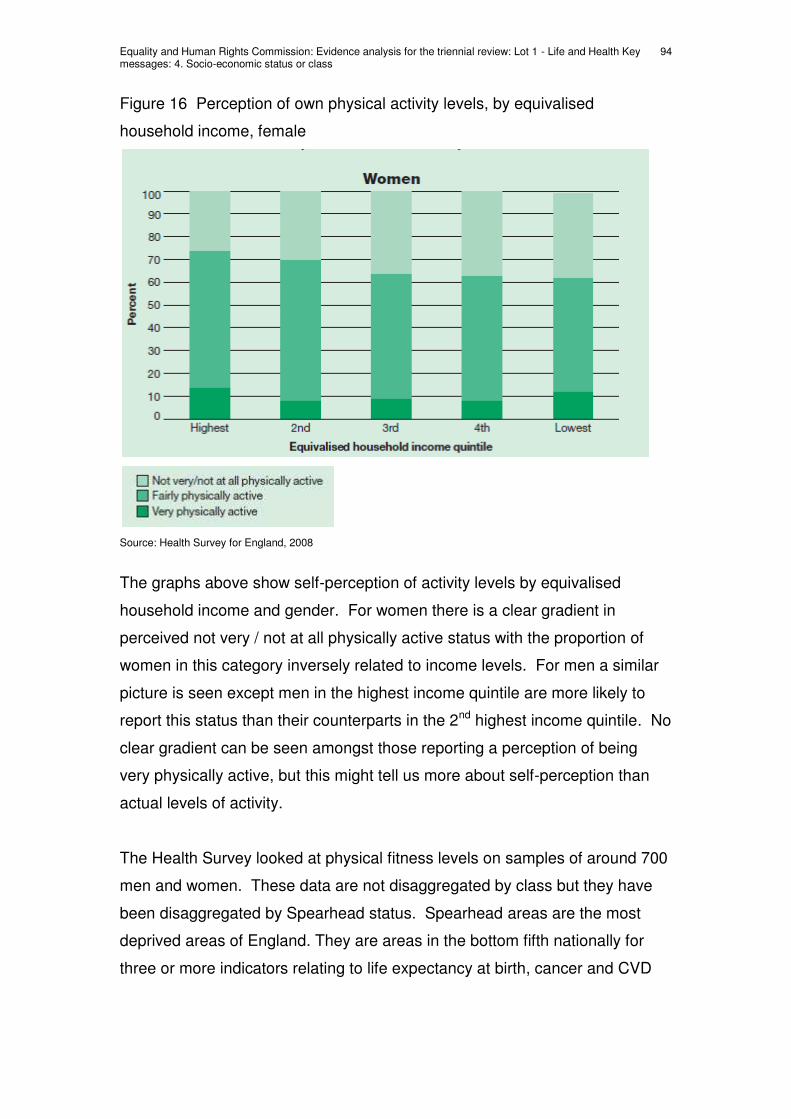
Equality and Human Rights Commission: Evidence analysis for the triennial review: Lot 1 - Life and Health Key messages: 4. Socio-economic status or class
94
Figure 16 Perception of own physical activity levels, by equivalised
household income, female
Source: Health Survey for England, 2008
The graphs above show self-perception of activity levels by equivalised
household income and gender. For women there is a clear gradient in
perceived not very / not at all physically active status with the proportion of
women in this category inversely related to income levels. For men a similar
picture is seen except men in the highest income quintile are more likely to
report this status than their counterparts in the 2nd highest income quintile. No
clear gradient can be seen amongst those reporting a perception of being
very physically active, but this might tell us more about self-perception than
actual levels of activity.
The Health Survey looked at physical fitness levels on samples of around 700
men and women. These data are not disaggregated by class but they have
been disaggregated by Spearhead status. Spearhead areas are the most
deprived areas of England. They are areas in the bottom fifth nationally for
three or more indicators relating to life expectancy at birth, cancer and CVD

Equality and Human Rights Commission: Evidence analysis for the triennial review: Lot 1 - Life and Health Key messages: 4. Socio-economic status or class
95
mortality and the index of multiple deprivation. As such, the following figures
give are a useful proxy for physical activity by social class.
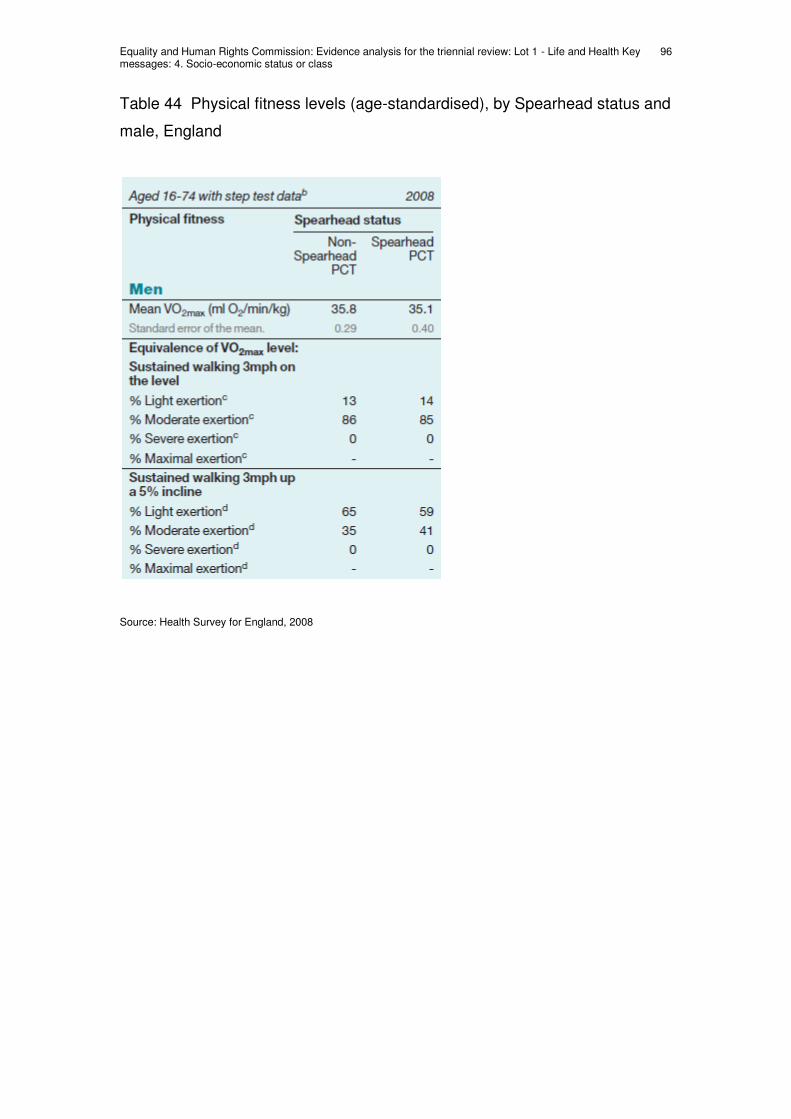
Equality and Human Rights Commission: Evidence analysis for the triennial review: Lot 1 - Life and Health Key messages: 4. Socio-economic status or class
96
Table 44 Physical fitness levels (age-standardised), by Spearhead status and
male, England
Source: Health Survey for England, 2008
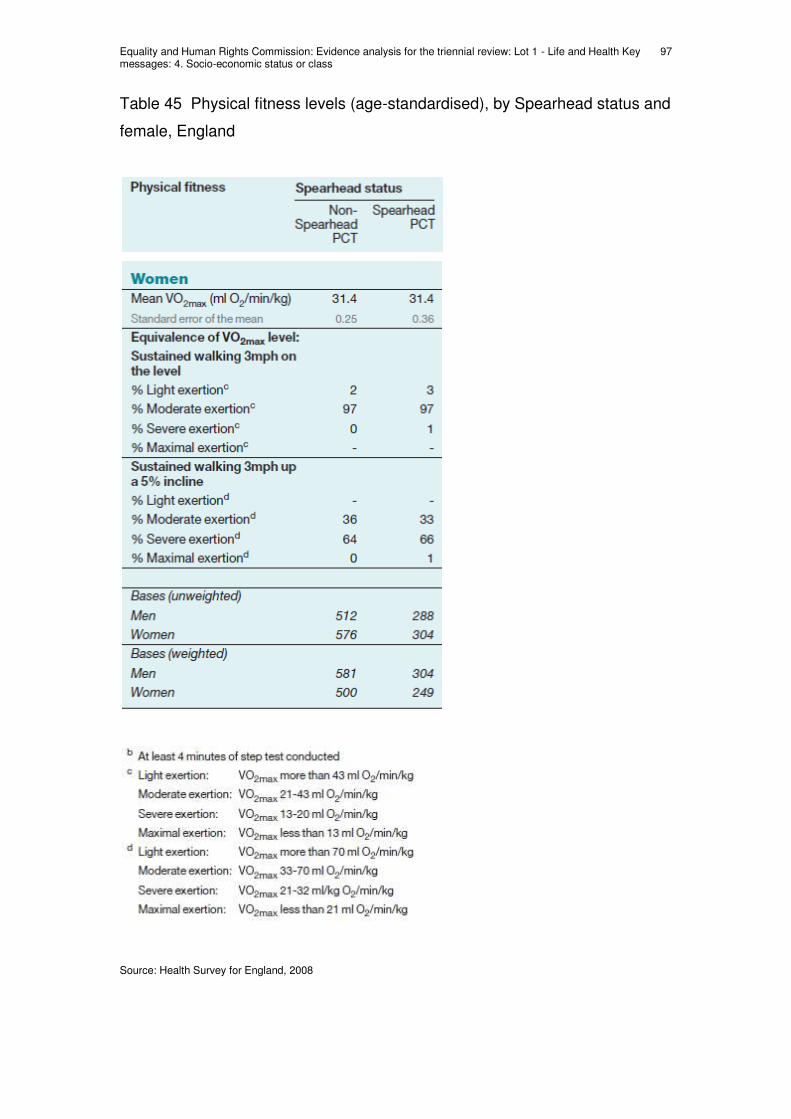
Equality and Human Rights Commission: Evidence analysis for the triennial review: Lot 1 - Life and Health Key messages: 4. Socio-economic status or class
97
Table 45 Physical fitness levels (age-standardised), by Spearhead status and
female, England
Source: Health Survey for England, 2008

Equality and Human Rights Commission: Evidence analysis for the triennial review: Lot 1 - Life and Health Key messages: 4. Socio-economic status or class
98
The tables show that for both sexes a higher proportion of those from
Spearhead status areas found walking at 3mph on a 5% incline to be severe
exertion (6% more men and 2% more women), indicating a lower level of
fitness.
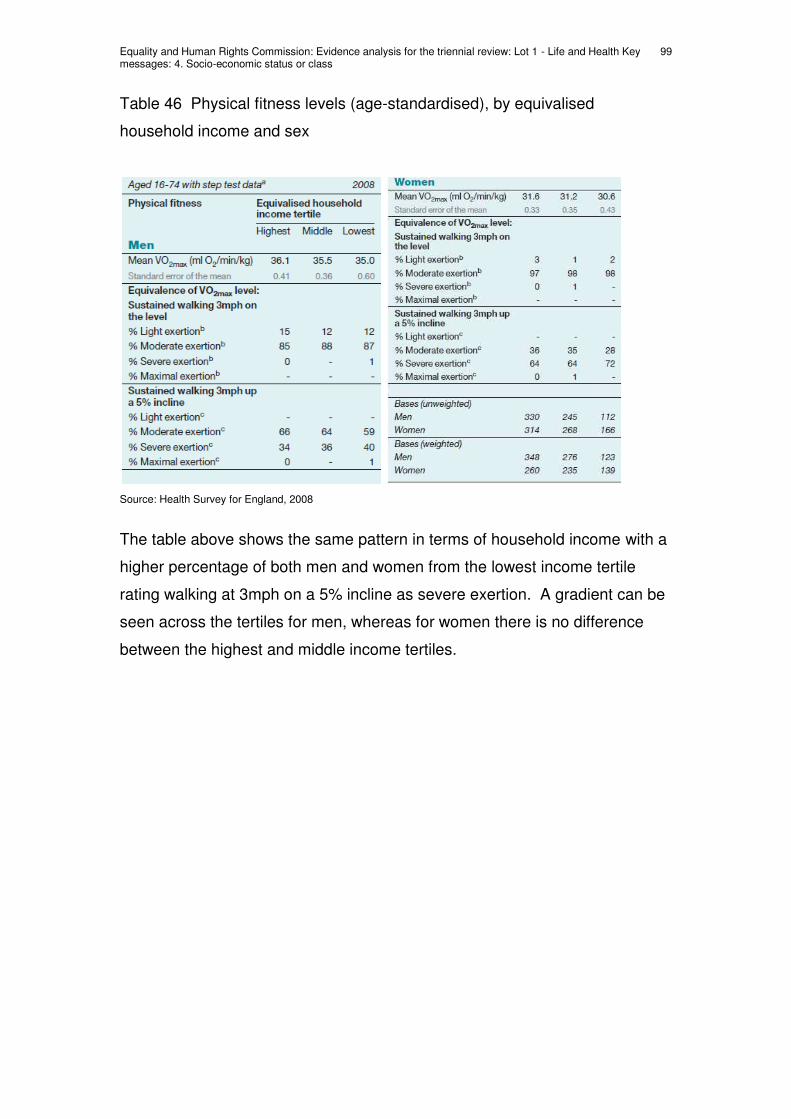
Equality and Human Rights Commission: Evidence analysis for the triennial review: Lot 1 - Life and Health Key messages: 4. Socio-economic status or class
99
Table 46 Physical fitness levels (age-standardised), by equivalised
household income and sex
Source: Health Survey for England, 2008
The table above shows the same pattern in terms of household income with a
higher percentage of both men and women from the lowest income tertile
rating walking at 3mph on a 5% incline as severe exertion. A gradient can be
seen across the tertiles for men, whereas for women there is no difference
between the highest and middle income tertiles.

Equality and Human Rights Commission: Evidence analysis for the triennial review: Lot 1 - Life and Health Key messages: 4. Socio-economic status or class
100
ENGLAND
DIET
Table 47 Daily fruit and vegetable consumption (age-standardised), by
equivalised household income and men
Source: Health Survey for England, 2008

Equality and Human Rights Commission: Evidence analysis for the triennial review: Lot 1 - Life and Health Key messages: 4. Socio-economic status or class
101
Table 48 Daily fruit and vegetable consumption (age-standardised), by
equivalised household income and women
Source: Health Survey for England, 2008
The two tables above show portions of fruit and vegetables eaten daily
aggregated by equivalised household income. For both men and women
there is a social gradient in terms of the mean number of portions eaten. For
men the figures are 4.1 portions for the highest quintile and 3.0 for the lowest;
for women, the equivalent figures are 4.2 and 3.4. The differences are
statistically significant.

Equality and Human Rights Commission: Evidence analysis for the triennial review: Lot 1 - Life and Health Key messages: 4. Socio-economic status or class
102
ENGLAND
OBESITY
Table 49 Body Mass Index (BMI), overweight and obesity prevalence (age-
standardised), by equivalised household income and male
Source: Health Survey for England, 2008

Equality and Human Rights Commission: Evidence analysis for the triennial review: Lot 1 - Life and Health Key messages: 4. Socio-economic status or class
103
Table 50 Body Mass Index (BMI), overweight and obesity prevalence (age-
standardised), by equivalised household income and female
Source: Health Survey for England, 2008
The two tables above show Body Mass Index (BMI), overweight and obesity
prevalence (age-standardised), by equivalised household income and gender.
The picture is a curious one. For women a clear social gradient by income
quintile is observed witht he prevalence of overweight and obesity combined
being inversely related to income. For men there is no clear gradient, but the
highest prevalence of overweight and obesity falls in the highest income
quintile, the opposite position to females.

Equality and Human Rights Commission: Evidence analysis for the triennial review: Lot 1 - Life and Health Key messages: 4. Socio-economic status or class
104
Table 51 Waist circumference (age-standardised), by equivalised household
income and sex
Source: Health Survey for England, 2008
In the table above, the same pattern can be seen in relation to waist
measurement. In men, the fourth income quintile has the highest percentage
with raised waist circumference; the lowest quintile have the lowest. In
women, the social gradient between the richest, who have the lowest
prevalence of raised waist circumference, and the poorest, who have the
highest, is a smooth one.
Overall, the picture is fairly hard to interpret. The conclusion put forward by
the Poverty Site is that there is no obvious relationship between obesity and
social class. Having said that, there are interesting patterns relating to class.
The graph below used at the Poverty Site is helpful in summarising this.
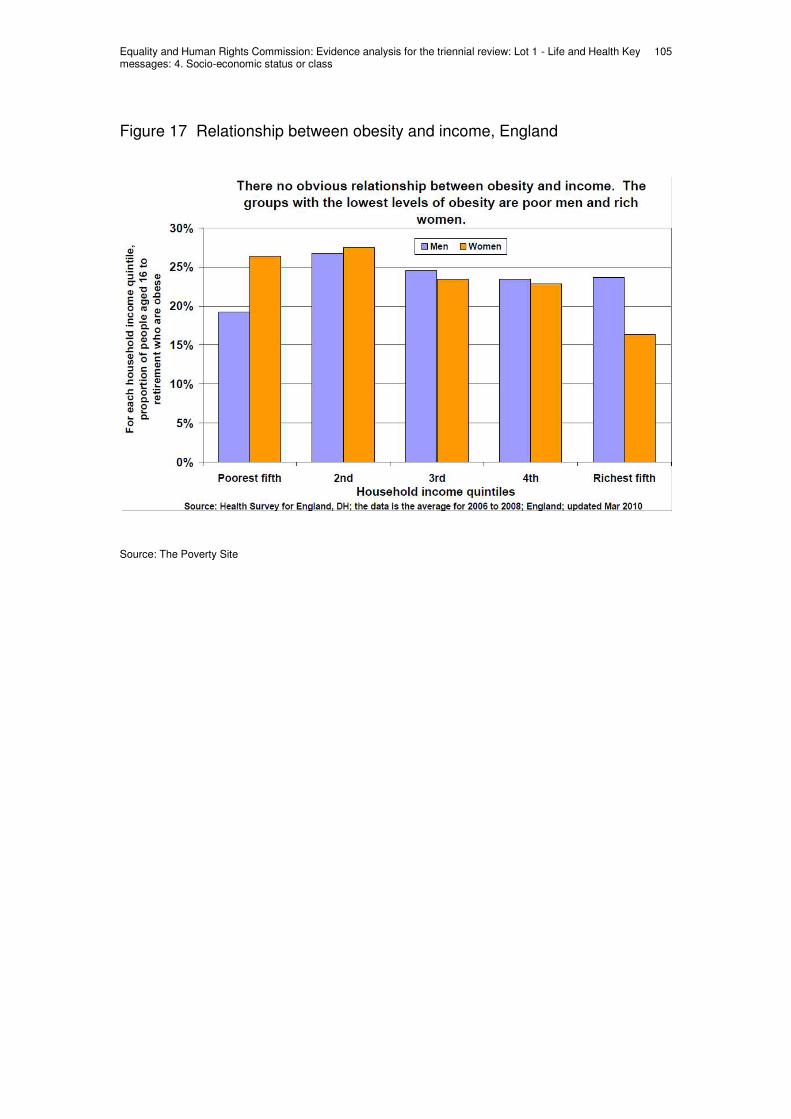
Equality and Human Rights Commission: Evidence analysis for the triennial review: Lot 1 - Life and Health Key messages: 4. Socio-economic status or class
105
Figure 17 Relationship between obesity and income, England
Source: The Poverty Site
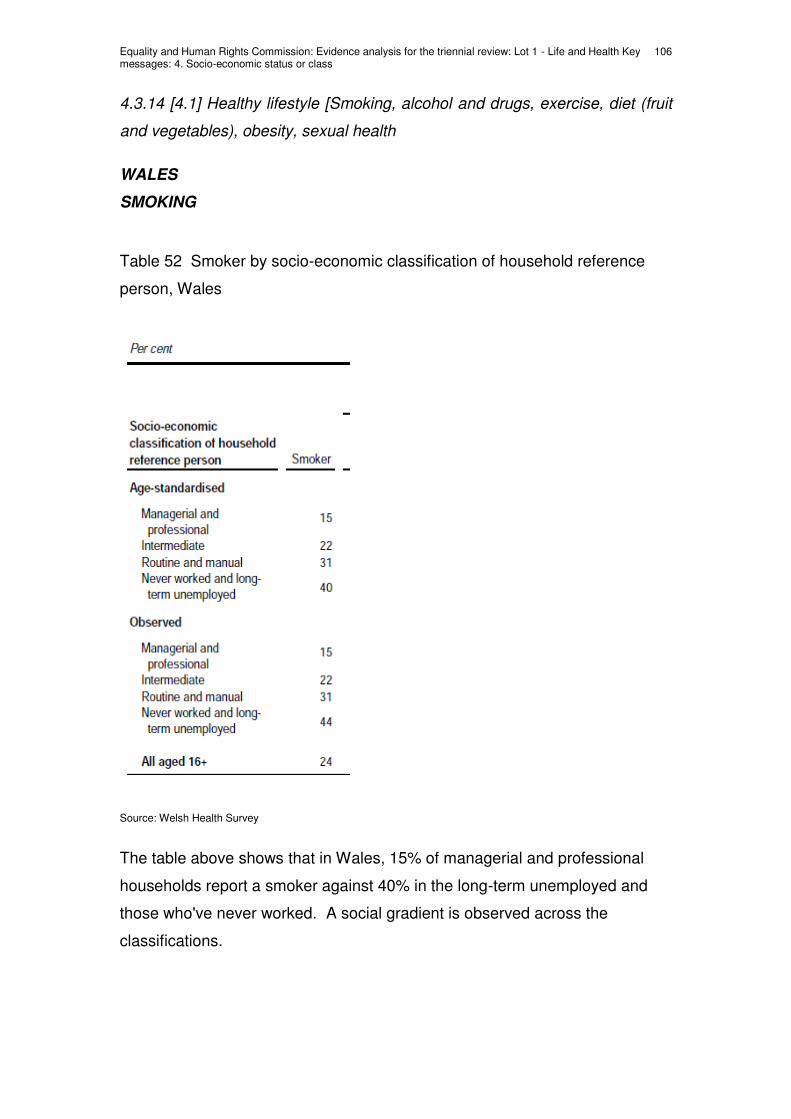
Equality and Human Rights Commission: Evidence analysis for the triennial review: Lot 1 - Life and Health Key messages: 4. Socio-economic status or class
106
4.3.14 [4.1] Healthy lifestyle [Smoking, alcohol and drugs, exercise, diet (fruit
and vegetables), obesity, sexual health
WALES
SMOKING
Table 52 Smoker by socio-economic classification of household reference
person, Wales
Source: Welsh Health Survey
The table above shows that in Wales, 15% of managerial and professional
households report a smoker against 40% in the long-term unemployed and
those who've never worked. A social gradient is observed across the
classifications.

Equality and Human Rights Commission: Evidence analysis for the triennial review: Lot 1 - Life and Health Key messages: 4. Socio-economic status or class
107
Table 53 Smoker by Welsh index of multiple deprivation quintile
Source: Welsh Health Survey 2008

Equality and Human Rights Commission: Evidence analysis for the triennial review: Lot 1 - Life and Health Key messages: 4. Socio-economic status or class
108
Figure 18 Smoker by Welsh index of multiple deprivation quintile
Source: Welsh Health Survey
The table and graph above show the link between an area's deprivation level
and smoking in Wales. There is a clear social gradient; 14% smoke in the
least deprived quintile; 36% in the most deprived.

Equality and Human Rights Commission: Evidence analysis for the triennial review: Lot 1 - Life and Health Key messages: 4. Socio-economic status or class
109
WALES
ALCOHOL
Table 54 Consumption of alcohol, including binge drinking by socio-economic
classification of household reference person, Wales
(b) Above guidelines is defined as drinking more than 4 and up to 8 units for men, more than
3 and up to 6 for women, in one day; binge drinking is defined as more than 8 units in a day
for men, more than 6 for women.
Source: Welsh Health Survey 2008
In Wales, drinking above guidelines is heaviest in the managerial and
professional classes; binge drinking is highest in the same class and in
routine and manual classes. There is no clear gradient in relation to binge
drinking however.

Equality and Human Rights Commission: Evidence analysis for the triennial review: Lot 1 - Life and Health Key messages: 4. Socio-economic status or class
110
Table 55 Consumption of alcohol above guidelines and binge drinking by
Welsh index of multiple deprivation quintile
Source: Welsh Health Survey 2008
The table above shows that in Wales, drinking above guidelines is most
common in the least deprived areas and least common in the most deprived
areas. Binge drinking is fairly level through all areas.

Equality and Human Rights Commission: Evidence analysis for the triennial review: Lot 1 - Life and Health Key messages: 4. Socio-economic status or class
111
WALES
EXERCISE
Table 56 Exercise and physical activity by socio-economic classification of
household reference person, Wales
(d) The guidelines on physical activity are that adults do at least 30 minutes of at least
moderate intensity physical activity on five or more days a week.
Source: Welsh Health Survey 2008
The table above shows there is no clear relationship between class and
likelihood of meeting Government physical activity recommendations.

Equality and Human Rights Commission: Evidence analysis for the triennial review: Lot 1 - Life and Health Key messages: 4. Socio-economic status or class
112
WALES
DIET
Table 57 Consumption of fruit and vegetables by socio-economic
classification of household reference person, Wales
(c) The guidelines state that adults should eat five or more portions of fruit and vegetables
daily
Source: Welsh Health Survey 2008
In Wales there is a social gradient in relation to consumption of fruit and
vegetables; managerial and professional classes are more likely to meet the
guidelines than routine and manual workers (40% versus 32%).

Equality and Human Rights Commission: Evidence analysis for the triennial review: Lot 1 - Life and Health Key messages: 4. Socio-economic status or class
113
Table 58 Consumption of fruit and vegetables by Welsh index of multiple
deprivation quintile, Wales
Source: Welsh Health Survey 2008
There is also a social gradient in relation to the Welsh index of multiple
deprivation. Those in the most deprived areas are least likely to eat five
portions or more of fruit and vegetables daily (30%); those in the second least
deprived area are the most likely to eat the recommended amount (40%) with
those in the least deprived area closely behind (39%)

Equality and Human Rights Commission: Evidence analysis for the triennial review: Lot 1 - Life and Health Key messages: 4. Socio-economic status or class
114
WALES
OBESITY
The Welsh Health Survey disaggregates obesity figures by class and by sex
but not by both together. As such, it is not possible to see whether a pattern
similar to that in England exists.
Table 59 Obesity by socio-economic classification of household reference
person, Wales
Source: Welsh Health Survey 2008
The Welsh data show that adults in routine manual work are more likely to be
obese than those in professional and managerial work (25% versus 18%).
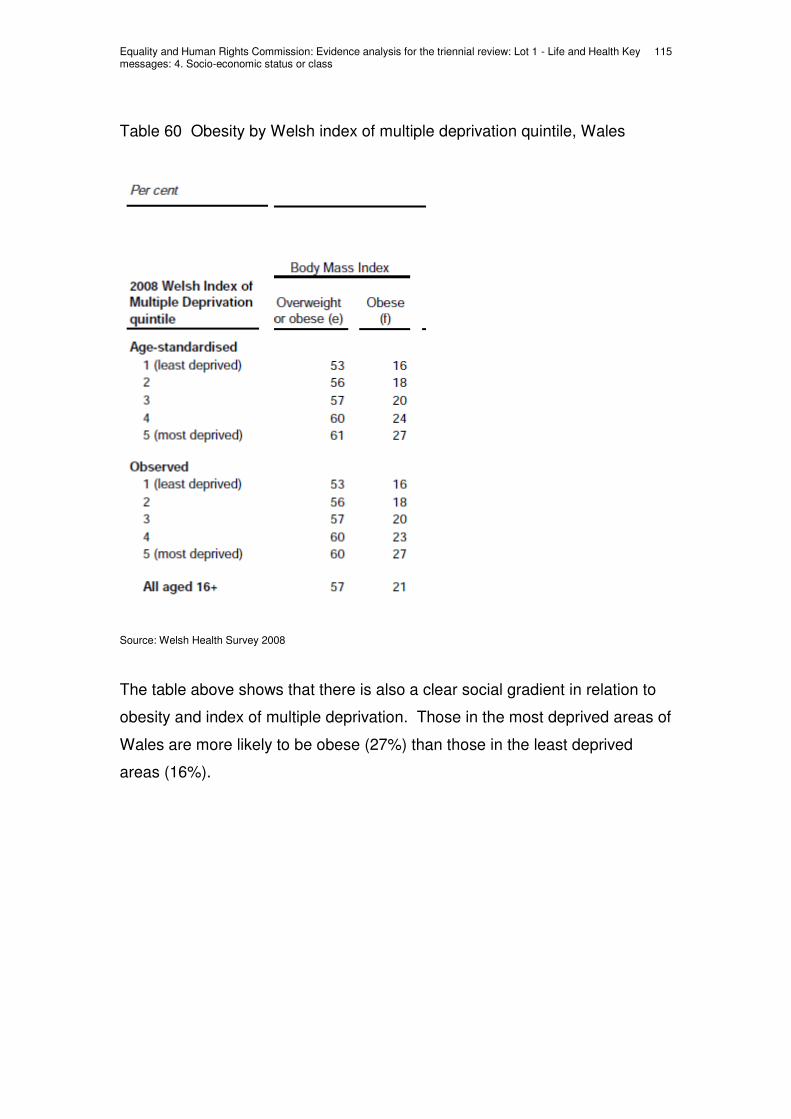
Equality and Human Rights Commission: Evidence analysis for the triennial review: Lot 1 - Life and Health Key messages: 4. Socio-economic status or class
115
Table 60 Obesity by Welsh index of multiple deprivation quintile, Wales
Source: Welsh Health Survey 2008
The table above shows that there is also a clear social gradient in relation to
obesity and index of multiple deprivation. Those in the most deprived areas of
Wales are more likely to be obese (27%) than those in the least deprived
areas (16%).

Equality and Human Rights Commission: Evidence analysis for the triennial review: Lot 1 - Life and Health Key messages: 4. Socio-economic status or class
116
4.3.14 [4.1] Healthy lifestyle [Smoking, alcohol and drugs, exercise, diet (fruit
and vegetables), obesity, sexual health
SCOTLAND
SMOKING
Table 61 Self-reported cigarette smoking status (observed and age-
standardised), by NS-SEC of household reference person, male, Scotland
Source: Scottish Health Survey, 2008

Equality and Human Rights Commission: Evidence analysis for the triennial review: Lot 1 - Life and Health Key messages: 4. Socio-economic status or class
117
Table 62 Self-reported cigarette smoking status (observed and age-
standardised), by NS-SEC of household reference person, female, Scotland
Source: Scottish Health Survey, 2008

Equality and Human Rights Commission: Evidence analysis for the triennial review: Lot 1 - Life and Health Key messages: 4. Socio-economic status or class
118
Figure 19 Current cigarette smoking (age-standardised), by NSSEC of
household reference person and sex, Scotland
Source: Scottish Health Survey, 2008
The two tables and the graph above show that, in Scotland, smoking patterns
exhibit a clear social gradient by NS-SEC. Levels are highest in men and
women in semi-routine and routine households and lowest among those in
managerial and professional households. For example, amongst men, 36%
of the former are current smokers against 17% of the latter; the equivalent
figures for women are 38% versus 16%.

Equality and Human Rights Commission: Evidence analysis for the triennial review: Lot 1 - Life and Health Key messages: 4. Socio-economic status or class
119
Table 63 Current cigarette smoking (age-standardised), by equivalised
household income quintile and male, Scotland
Source: Scottish Health Survey, 2008

Equality and Human Rights Commission: Evidence analysis for the triennial review: Lot 1 - Life and Health Key messages: 4. Socio-economic status or class
120
Figure 20 Current cigarette smoking (age-standardised), by equivalised
household income quintile and sex, Scotland
Source: Scottish Health Survey, 2008
A similar social gradient is seen in relation to household income quintiles, as
we see in the table and graph above, with smoking prevalence inversely
related to household income. 18% of men are current smokers in the highest
quintile against 44% in the lowest; the equivalent figures for women are 16%
and 39%.

Equality and Human Rights Commission: Evidence analysis for the triennial review: Lot 1 - Life and Health Key messages: 4. Socio-economic status or class
121
Table 64 Current cigarette smoking (age-standardised), by Scottish Index of
Multiple Deprivation quintile and sex
Source: Scottish Health Survey, 2008
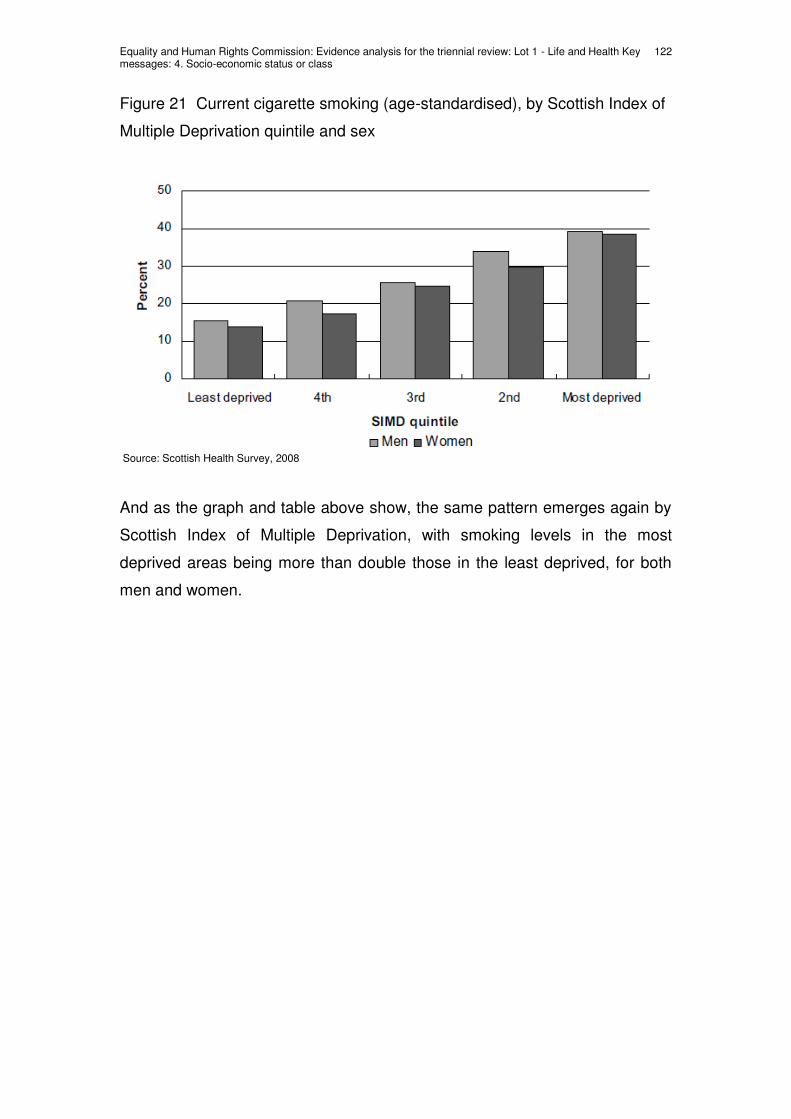
Equality and Human Rights Commission: Evidence analysis for the triennial review: Lot 1 - Life and Health Key messages: 4. Socio-economic status or class
122
Figure 21 Current cigarette smoking (age-standardised), by Scottish Index of
Multiple Deprivation quintile and sex
Source: Scottish Health Survey, 2008
And as the graph and table above show, the same pattern emerges again by
Scottish Index of Multiple Deprivation, with smoking levels in the most
deprived areas being more than double those in the least deprived, for both
men and women.

Equality and Human Rights Commission: Evidence analysis for the triennial review: Lot 1 - Life and Health Key messages: 4. Socio-economic status or class
123
SCOTLAND
ALCOHOL
Table 65 Estimated usual weekly alcohol consumption level (age-
standardised), by NS-SEC of household reference person and sex, Scotland
Source: Scottish Health Survey, 2008
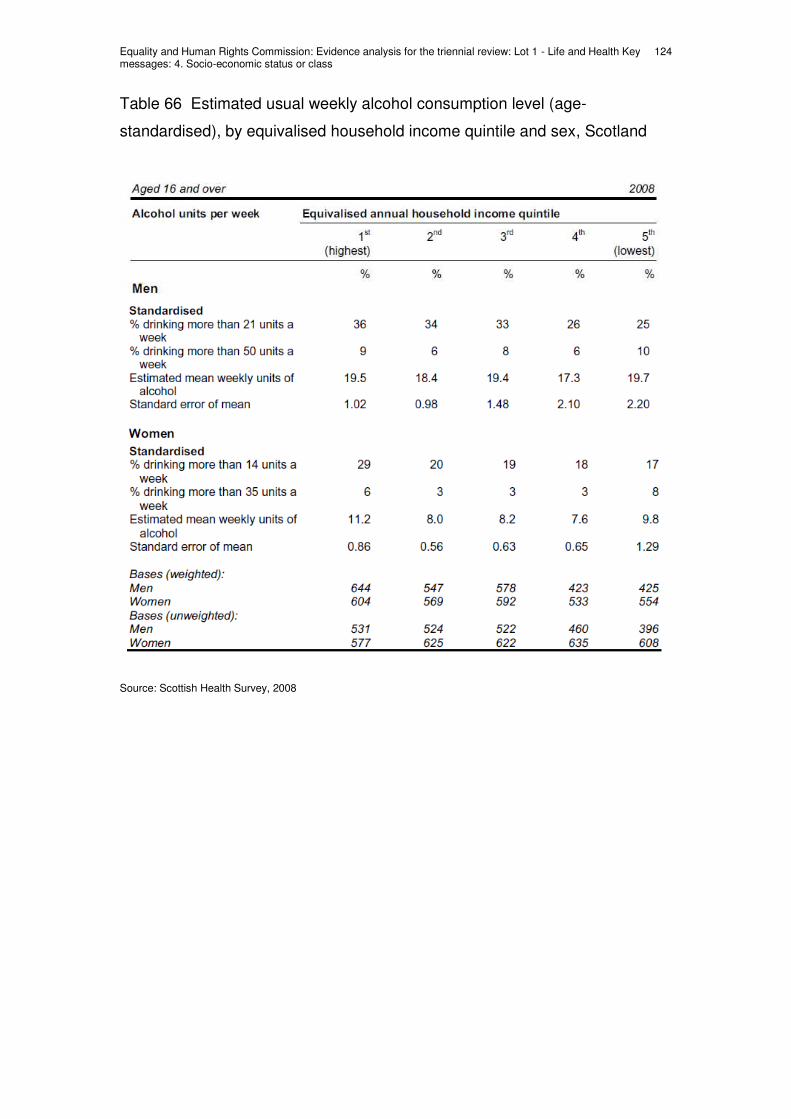
Equality and Human Rights Commission: Evidence analysis for the triennial review: Lot 1 - Life and Health Key messages: 4. Socio-economic status or class
124
Table 66 Estimated usual weekly alcohol consumption level (age-
standardised), by equivalised household income quintile and sex, Scotland
Source: Scottish Health Survey, 2008

Equality and Human Rights Commission: Evidence analysis for the triennial review: Lot 1 - Life and Health Key messages: 4. Socio-economic status or class
125
Figure 22 Proportion exceeding government guidelines on weekly alcohol
consumption (age-standardised), by equivalised household income quintile
and sex, Scotland
Source: Scottish Health Survey, 2008

Equality and Human Rights Commission: Evidence analysis for the triennial review: Lot 1 - Life and Health Key messages: 4. Socio-economic status or class
126
Table 67 Estimated usual weekly alcohol consumption level (age-
standardised), by Scottish Index of Multiple Deprivation and sex, Scotland
Source: Scottish Health Survey, 2008
The tables and graphs above paint a complex picture of alcohol intake and
relation to socioeconomic factors. Among women, levels of weekly
consumption are associated with socioeconomic classification, household
income and area deprivation. Levels of consumption are highest amongst the
managerial and professional, highest income and least deprived group.
Among men, there is a clear social gradient in the proportion of men with
alcohol consumption above government guidelines by income quintile, with
the highest proportion exceeding government guidelines being from the

Equality and Human Rights Commission: Evidence analysis for the triennial review: Lot 1 - Life and Health Key messages: 4. Socio-economic status or class
127
highest income quintile. However, men in the most deprived areas are more
likely to drink above 50 units a week.

Equality and Human Rights Commission: Evidence analysis for the triennial review: Lot 1 - Life and Health Key messages: 4. Socio-economic status or class
128
Table 68 Estimated alcohol consumption level on heaviest drinking day in
past week (age-standardised), by NS-SEC of household reference person
and sex, Scotland
Source: Scottish Health Survey, 2008

Equality and Human Rights Commission: Evidence analysis for the triennial review: Lot 1 - Life and Health Key messages: 4. Socio-economic status or class
129
Table 69 Estimated alcohol consumption level on heaviest drinking day in
past week (observed and age-standardised), by equivalised household
income quintile and sex, Scotland
Source: Scottish Health Survey, 2008

Equality and Human Rights Commission: Evidence analysis for the triennial review: Lot 1 - Life and Health Key messages: 4. Socio-economic status or class
130
Table 70 Estimated alcohol consumption on heaviest drinking day in past
week (age-standardised), by Scottish Index of Multiple Deprivation and sex,
Scotland
Source: Scottish Health Survey, 2008
The tables above show that in terms of daily drink levels, there is no clear
relationship between those drinking above recommended limits or binge
drinking (over double the daily recommended limit) by NS-SEC in men or
women. However, in terms of household income, for men, daily consumption
is directly related to household income such that the poorest drink least. The
pattern for binge drinking is similar. Mean units drunk were also highest
among those with higher incomes (6.8 units in the highest income group
compared to 5.5 units in the lowest). A similar pattern is seen in women, with
the highest income quintile more likely to drink above three units than the
lowest; however, binge drinking (above six units) has no such pattern.

Equality and Human Rights Commission: Evidence analysis for the triennial review: Lot 1 - Life and Health Key messages: 4. Socio-economic status or class
131
Area deprivation was significantly associated with daily drinking patterns for
women (the most deprived least likely to drink above three units) but not for
men.

Equality and Human Rights Commission: Evidence analysis for the triennial review: Lot 1 - Life and Health Key messages: 4. Socio-economic status or class
132
SCOTLAND
EXERCISE
Table 71 Proportion meeting the current physical activity recommendations
by NS-SEC of household reference person and sex, Scotland
Source: Scottish Health Survey, 2008
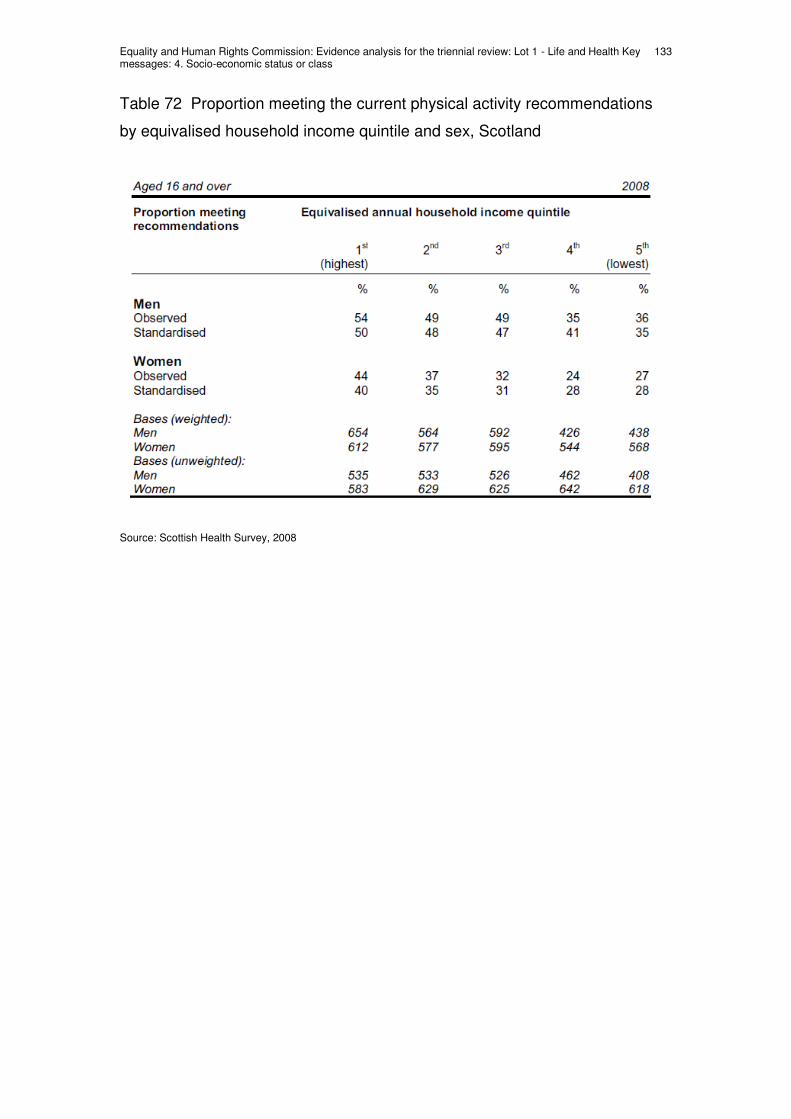
Equality and Human Rights Commission: Evidence analysis for the triennial review: Lot 1 - Life and Health Key messages: 4. Socio-economic status or class
133
Table 72 Proportion meeting the current physical activity recommendations
by equivalised household income quintile and sex, Scotland
Source: Scottish Health Survey, 2008

Equality and Human Rights Commission: Evidence analysis for the triennial review: Lot 1 - Life and Health Key messages: 4. Socio-economic status or class
134
Table 73 Proportion meeting the current physical activity recommendations
by Scottish Index of Multiple Deprivation and sex
Source: Scottish Health Survey, 2008
In Scotland there are differences in the proportion meeting activity
recommendations by NS-SEC for both men and women. The pattern is not
one of a straightforward gradient, however. The relationship by household
income does show a clear social gradient, with Standardised data indicating
that 50% of men and 40% of women in the highest income quintile
households met the recommendations compared to 35% and 28% in the
lowest. When viewed by area level deprivation using SIMD score the data
show that men and women in the most deprived quintile of Scottish areas
were least likely to have met the activity recommendations. For men though,
the pattern is not linear as those in the third quintile were most likely to have
met them. For women the relationship is more linear by deprivation.

Equality and Human Rights Commission: Evidence analysis for the triennial review: Lot 1 - Life and Health Key messages: 4. Socio-economic status or class
135
SCOTLAND
DIET
Table 74 Fruit and vegetable consumption (age-standardised), by NS-SEC of
household reference person and sex, Scotland
Source: Scottish Health Survey, 2008
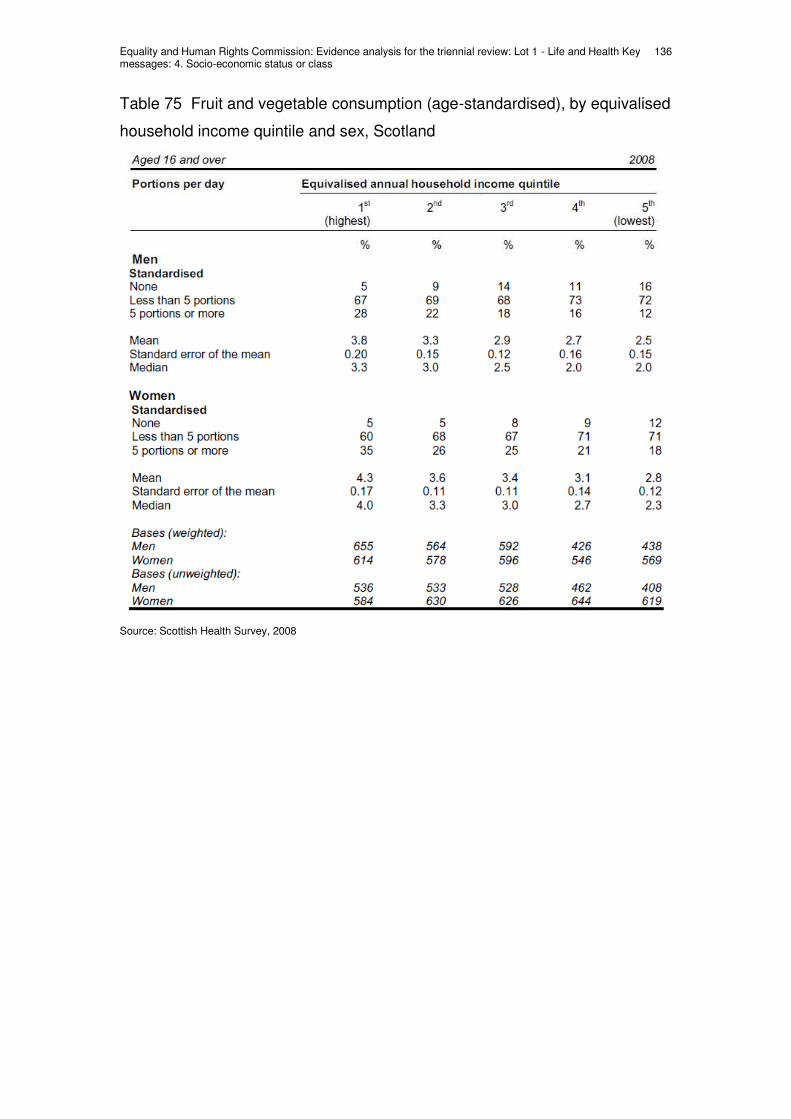
Equality and Human Rights Commission: Evidence analysis for the triennial review: Lot 1 - Life and Health Key messages: 4. Socio-economic status or class
136
Table 75 Fruit and vegetable consumption (age-standardised), by equivalised
household income quintile and sex, Scotland
Source: Scottish Health Survey, 2008
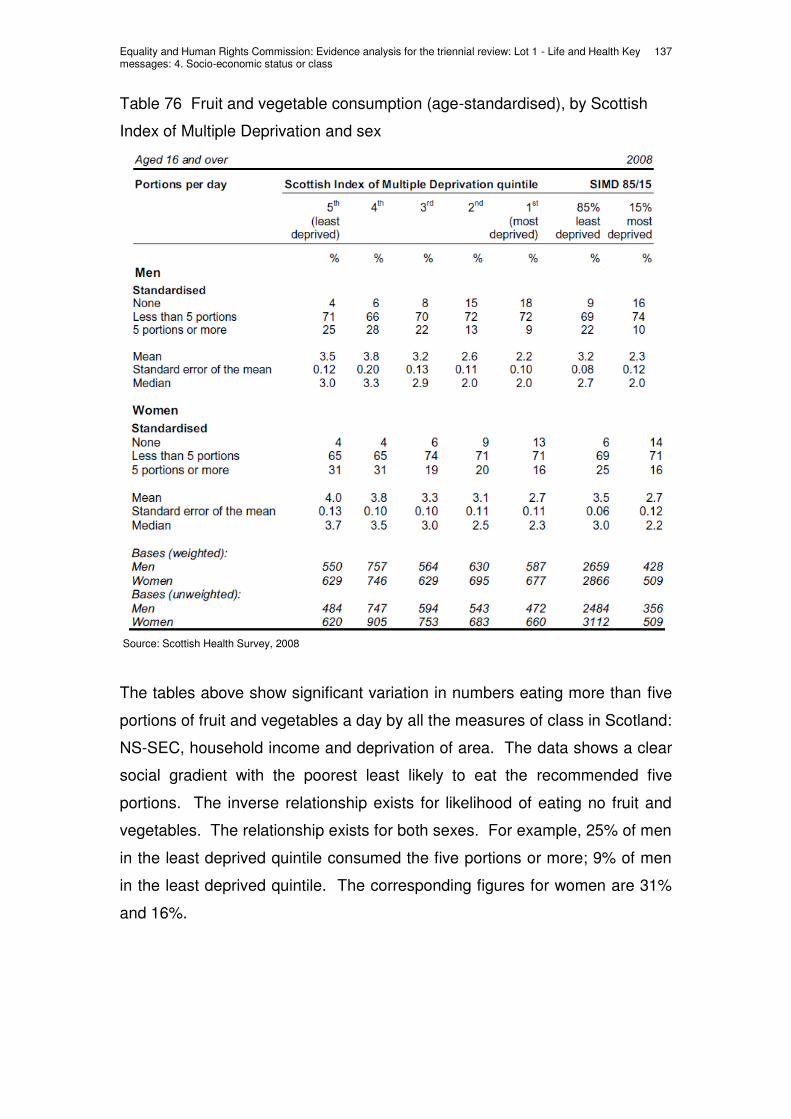
Equality and Human Rights Commission: Evidence analysis for the triennial review: Lot 1 - Life and Health Key messages: 4. Socio-economic status or class
137
Table 76 Fruit and vegetable consumption (age-standardised), by Scottish
Index of Multiple Deprivation and sex
Source: Scottish Health Survey, 2008
The tables above show significant variation in numbers eating more than five
portions of fruit and vegetables a day by all the measures of class in Scotland:
NS-SEC, household income and deprivation of area. The data shows a clear
social gradient with the poorest least likely to eat the recommended five
portions. The inverse relationship exists for likelihood of eating no fruit and
vegetables. The relationship exists for both sexes. For example, 25% of men
in the least deprived quintile consumed the five portions or more; 9% of men
in the least deprived quintile. The corresponding figures for women are 31%
and 16%.
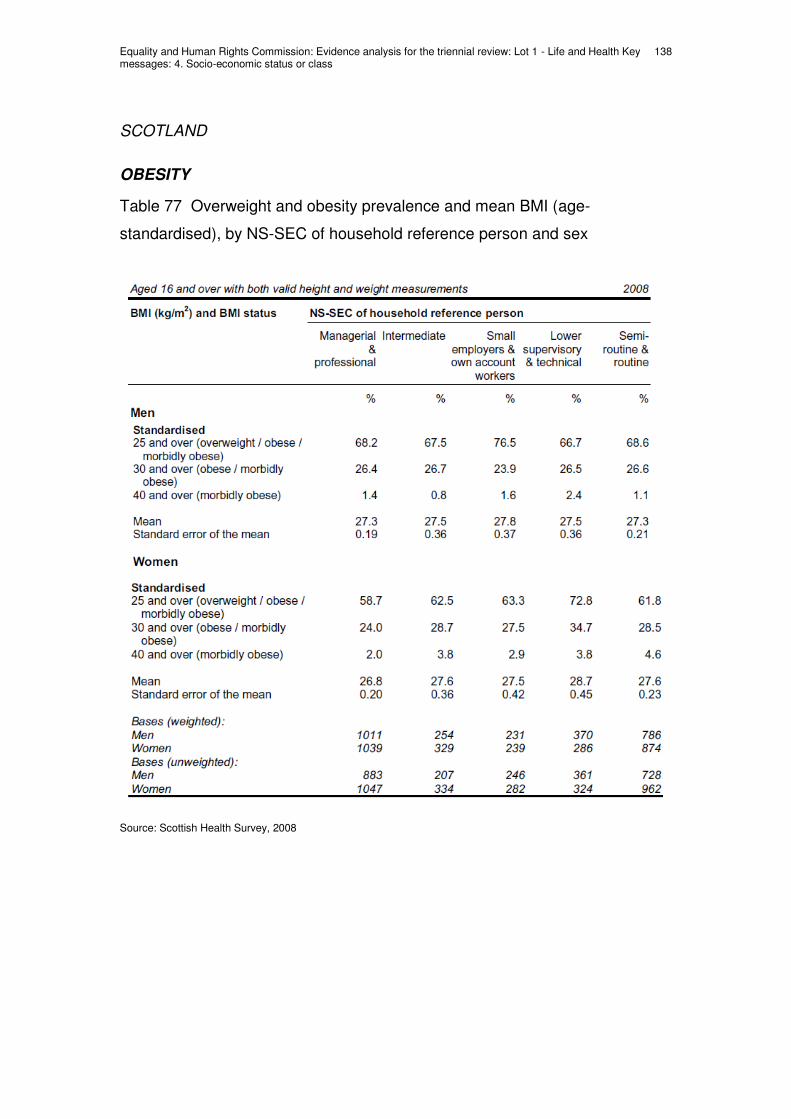
Equality and Human Rights Commission: Evidence analysis for the triennial review: Lot 1 - Life and Health Key messages: 4. Socio-economic status or class
138
SCOTLAND
OBESITY
Table 77 Overweight and obesity prevalence and mean BMI (age-
standardised), by NS-SEC of household reference person and sex
Source: Scottish Health Survey, 2008
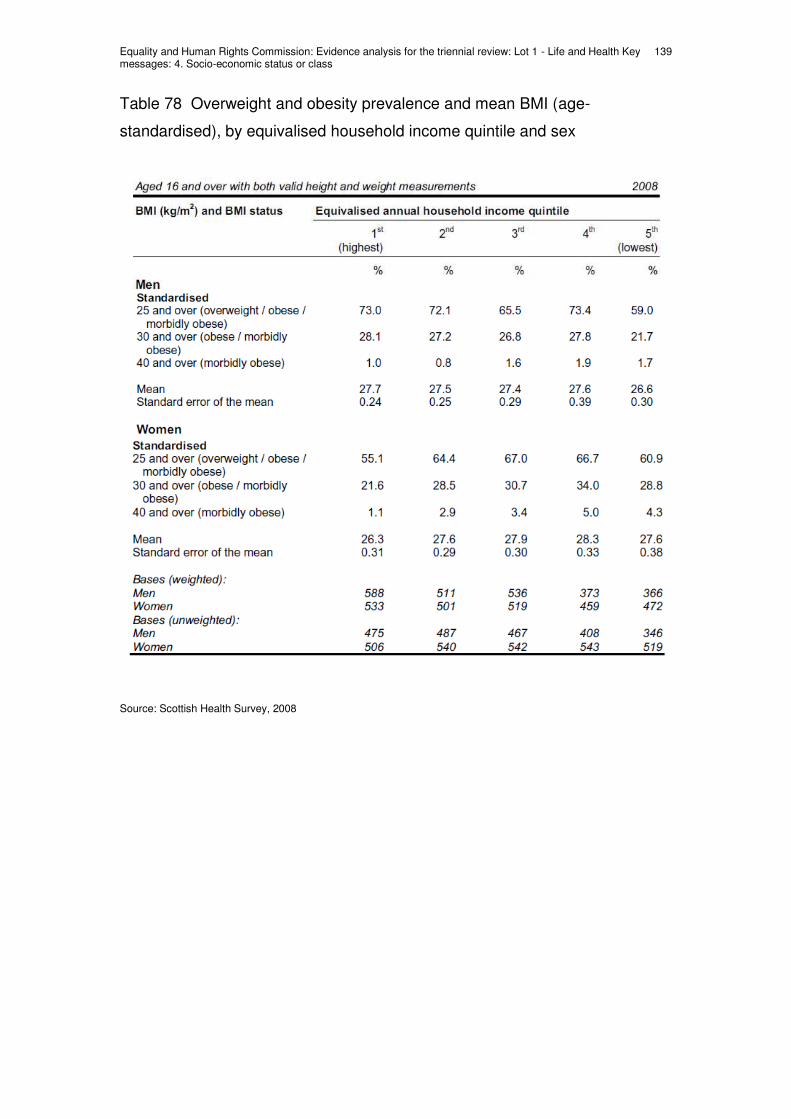
Equality and Human Rights Commission: Evidence analysis for the triennial review: Lot 1 - Life and Health Key messages: 4. Socio-economic status or class
139
Table 78 Overweight and obesity prevalence and mean BMI (age-
standardised), by equivalised household income quintile and sex
Source: Scottish Health Survey, 2008

Equality and Human Rights Commission: Evidence analysis for the triennial review: Lot 1 - Life and Health Key messages: 4. Socio-economic status or class
140
Table 79 Overweight and obesity prevalence and mean BMI (age-
standardised), by Scottish Index of Multiple Deprivation and sex
Source: Scottish Health Survey, 2008
The tables above show little relationship between NS-SEC class and obesity.
For men only, household NS-SEC is associated with being overweight or
obese. Those living in small employer and own account household and those
in semi-routine or routine households are more likely to be overweight than
those in managerial and professional household. The pattern is statistically
significant but not that striking. For women, being overweight or obese was
associated with equivalised household income and SIMD quintile. The social
gradient in 30+ and 40+ BMI by equivalised household income for women
shows that the highest income quintile have the lowest rates, and that
Equality and Human Rights Commission: Evidence analysis for the triennial review: Lot 1 - Life and Health Key messages: 4. Socio-economic status or class
141
prevalence rises up to the fourth quintile, before reducing slightly for the fifth
quintile. The data for overweight and obesity by SIMD scores shows the
same social gradient covering all quintiles. Women living in the most deprived
quintiles had significantly increased risk of being overweight or obese. The
pattern is stronger in relation to obesity and morbid obesity. 36.9% of women
in the most deprived quintile were obese or morbidly obese; the equivalent
figure for the least deprived quintile is 21.9%.

Equality and Human Rights Commission: Evidence analysis for the triennial review: Lot 1 - Life and Health Key messages: 4. Socio-economic status or class
142
4.4 Cross-over themes
Socio-economic class is closely linked to inequalities in several of the strands.
In general, these are discussed in the strand-specific chapters. However, the
following points are relevant.
Age
The inequalities of age are generally worse for those of lower socio-economic
status. The relationship is one-way in that age seems to have no causal
relationship with lower socio-economic status; those who start life poor
generally end it poor.
Disability
The inequalities of disability are generally worse for those of lower socio-
economic status. However, the relationship is two-way. Poor disabled people
do worse than those wealthier for some indicators. But disability itself seems
to affect economic prospects such that disabled people are more likely to be
poor than the able-bodied, as we show in the disability chapter.
Ethnicity [including refugees, asylum seekers, travellers]
The inequalities of ethnicity are generally worse for those of lower socio-
economic status. However, the relationship is complex. Some BME groups
are overwhelmingly situated within particular socio-economic groups. For
example, those of Bangladeshi origin are mainly poor. The result is that the
life and health inequalities suffered by Bangladeshi's can sometimes
apparently be explained purely in class terms; this occurs when figures are
adjusted to take account of socio-economic status. The problem with doing
this is that it can give the impression that ethnicity is unimportant in
understanding health and life inequalities, that inequality is all about class.
This is a false conclusion.
In the first place, there is sometimes an ethnic penalty on top of differences
due to class. But more importantly, where a statistical adjustment has to be
made for ethnicity it shows that ethnic groups are disproportionately

Equality and Human Rights Commission: Evidence analysis for the triennial review: Lot 1 - Life and Health Key messages: 4. Socio-economic status or class
143
represented within certain classes. The inequalities of class are manifested
through ethnicity and vice versa. Tackling inequalities that are linked to class
and ethnicity will require different strategies to tackling those linked to class
alone or ethnicity alone.
Gender
See the strand-specific chapters
LBG & Trans
See the strand-specific chapters
Equality and Human Rights Commission: Evidence analysis for the triennial review: Lot 1 - Life and Health Key messages: 4. Socio-economic status or class
144
4.5 Health and life: Discussion
‘We can’t escape the fact that today many of our most severe health problems
are caused, in part, by the wrong personal choices. Obesity, binge-drinking,
smoking and drug addiction are putting millions of lives at risk and costing our
health services billions a year. So getting to grips with them requires an
altogether different approach to the one we’ve seen before. We need to
promote more responsible behaviour and encourage people to make the right
choices about what they eat, drink and do in their leisure time.’ (David
Cameron, foreword, A Healthier Nation, Policy Green Paper No.12,
Conservative Party 2010 p. 4-5.)
Socio-economic status (or class) is not one of the Equalities and Human
Rights Commission's inequality strands. However, class-based inequalities in
indicators of life and health are well documented and striking.
The inequalities interact with inequalities in the inequality strands in complex
ways. Some inequality strands are associated with low socio-economic
status, for example, learning disability or some minority ethnic groups. Both
are associated with poor life and health outcomes. This leads to difficult
issues of interpretation, as our discussion of cross-over themes in the section
above shows. One lesson from that discussion is that we should be cautious
in explaining inequality that crosses strands (e.g. class and ethnicity) in terms
of one or the other even if the inequality disappears when statistical
adjustment is made.
This chapter provides the data on life and health inequality in relation to social
class. It should be read as the backdrop against which to understand
inequality across the protected strands.

Equality and Human Rights Commission: Evidence analysis for the triennial review: Lot 1 - Life and Health Key messages: 4. Socio-economic status or class
145
REFERENCES
BAJEKAL, M. (2005). Healthy life expectancy by area deprivation: Magnitude and trends in england, 1994–1999. Final Atkinson review report published, 1329 , 18.
BROCK, A., et al. (2006). Suicide trends and geographical variations in the united kingdom, 1991–2004. Health statistics quarterly, 31 , 6-22.
Marmot Review (2010). Marmot review. [online]. Last accessed June/23 2010 at: http://www.marmot-review.org.uk/.
THOMAS, B., DORLING, D., DAVEY-SMITH, G., (Forthcoming). Inequalities in premature mortality in Britain: observational study from 1921 to 2007. BMJ Forthcoming.
WALBY, S., ARMSTRONG, J. and HUMPHREYS, L. (2008). Review of equality statistics. [online]. EHRC. EHRC Research Report Series. Last accessed 23 June 2010 at: http://www.equalityhumanrights.com/uploaded_files/research/1__review_of_equality_statistics_241008.pdf.
WHITE, C., VAN GALEN, F. and CHOW, Y. (2003). Trends in social class differences in mortality by cause, 1986 to 2000. Health statistics quarterly, 25-37.
WHITE, C., et al. (2007). Social inequalities in adult male mortality by the national statistics socio-economic classification, England & Wales, 2001-03. Health statistics quarterly, 36 , 6-23.
WILKINSON, R. and PICKETT, K. (2009). The spirit level. Harmondsworth, Allen Lane/The Penguin Press.