Embed Size (px)
Citation preview

TRIENNIAL EVALUATION OF SERVICES
2009 - 2012
725 W Park Avenue, Chippewa Falls WI 54729
(715) 723-0341|
www.cesa10.k12.wi.us

Triennial Evaluation of Services
Page 1
Triennial Evaluation of Services
INTRODUCTION
This triennial review of CESA #10 services offers a detailed look at each of the services our agency offers
to its 29 member districts as well as services we provide throughout the state. The data includes financial
information, satisfaction surveys and other indicators of success.
REPORT FORMAT
The report begins with a satisfaction survey of superintendents and principals who participate in their own
scheduled activities as well as observe and evaluate the training received by their staff.
The heart of the report is a summary of the trainings and activities done by each department. This data is
analyzed and interpreted as we continue to refine our services and plan for the future.
SERVICE OVERVIEW
CESA 10 serves 29 districts in north central Wisconsin – one less than our 2009 evaluation due to
Weyerhaeuser consolidating with the Chetek School District. Most of our 191 employees are housed at our
Chippewa Falls facility, although we have a satellite office in Madison that serves a portion of our
Facilities Management Department. An increasing number of employees maintain home offices.
The agency’s operating revenues have remained constant over the last three years although districts have
reduced their service contracts. This decrease has been offset by new revenue sources.
Service Contracts
with Member Districts Grants and Other Revenue Sources
Total Operating Revenue
2009-2010 $28,683,079 $7,159,658 $35,842,737
2010-2011 $26,729,707 $6,168,474 $32,898,181
2011-2012 $25,249,992
$10,660,242 $35,910,234
Our services are accessed by all levels of professional educators, as well as students. Although revenue
sources have changed, CESA 10 has maintained its high level of support to teachers and administrators.
Triennial Evaluation of Services
Page 2
48.0%
41.0%
6.0%
5.0% Average of Responses for all CESA 10
Departments
Exceed Expectations
Meet Expectat ions
Below Expectat ions
N/A (My distr ict doesn’t purchase services from this department)
Certified
Staff Administrative
Staff Paraprofessional
Staff
Direct Student Contact Total Served
2009-2010 118 8 29 44 199
2010-2011 114 8 28 44 194
2011-2012 112 8 28 43 191
Our services are adjusted annually to meet the evolving needs of districts as well as their ability to
purchase these services. New state and federal requirements account for several services that CESAs are
required to roll out in the districts. The newly formed CESA Statewide Network (CSN) has greatly
facilitated coordination of these broad state initiatives.
The model for CESA services evolving in the state is for individual CESAs to take the lead in specific
initiatives. CESA 6’s Teacher Effectiveness Project and CESA 7’s work with the Core Curriculum are
examples of this trend. CESA 10 actually led the way in this model through its Facilities Management
Department which has assisted schools in safety and environment concerns throughout the state since 2000.
SUPERINTENDENTS GENERAL SATISFACTION QUESTIONNAIRE
The clients most likely to understand the value of CESA services are superintendents. They work with their
School Boards to select which services to purchase, they oversee the budgets that deliver these services and
they attend monthly meetings that analyze and explore new initiatives. We therefore put considerable
stake in what superintendents think. Our satisfaction survey breaks out by department, but when
summarized they rated us very favorably. Twenty of the 29 superintendents responded to the survey.
Triennial Evaluation of Services
Page 3
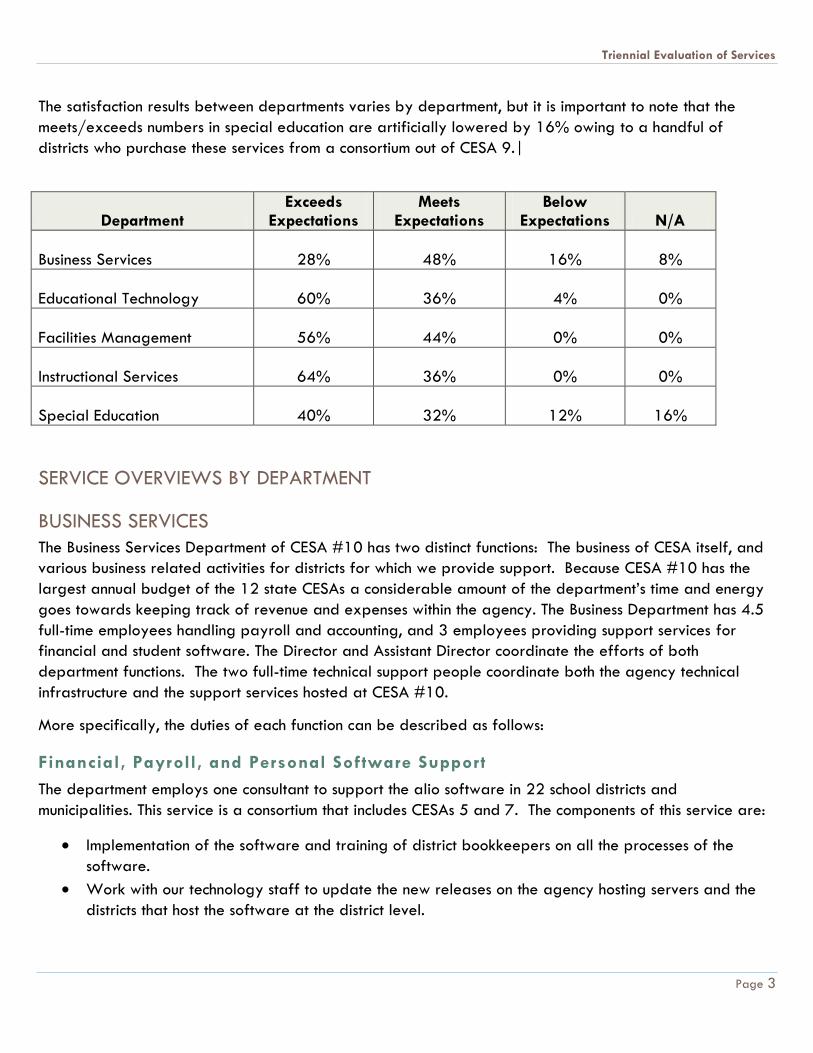
The satisfaction results between departments varies by department, but it is important to note that the
meets/exceeds numbers in special education are artificially lowered by 16% owing to a handful of
districts who purchase these services from a consortium out of CESA 9.|
Department Exceeds
Expectations Meets
Expectations Below
Expectations N/A
Business Services 28% 48% 16% 8%
Educational Technology 60% 36% 4% 0%
Facilities Management 56% 44% 0% 0%
Instructional Services 64% 36% 0% 0%
Special Education 40% 32% 12% 16%
SERVICE OVERVIEWS BY DEPARTMENT
BUSINESS SERVICES
The Business Services Department of CESA #10 has two distinct functions: The business of CESA itself, and
various business related activities for districts for which we provide support. Because CESA #10 has the
largest annual budget of the 12 state CESAs a considerable amount of the department’s time and energy
goes towards keeping track of revenue and expenses within the agency. The Business Department has 4.5
full-time employees handling payroll and accounting, and 3 employees providing support services for
financial and student software. The Director and Assistant Director coordinate the efforts of both
department functions. The two full-time technical support people coordinate both the agency technical
infrastructure and the support services hosted at CESA #10.
More specifically, the duties of each function can be described as follows:
Financial, Payroll, and Personal Software Support
The department employs one consultant to support the alio software in 22 school districts and
municipalities. This service is a consortium that includes CESAs 5 and 7. The components of this service are:
Implementation of the software and training of district bookkeepers on all the processes of the
software.
Work with our technology staff to update the new releases on the agency hosting servers and the
districts that host the software at the district level.

Triennial Evaluation of Services
Page 4
Telephone support for district bookkeepers.
Student Information System Software Support
The department employs two consultants to support the STI and Lunch System Software in our school
districts:
Implementation of the software and training district office staff on processes of student software.
Implementation of the software and training of district lunch staff on the cafeteria software.
Telephone support to districts for both software programs.
Technology Support
The department employs two technology staff to support our agency needs:
Support agency infrastructure – deploy, support, and upgrade network communications and other
interactive media.
Support agency employees at workstation level – training on emerging technology, upgrading and
support for workstation hardware and software.
Support all agency hosting services – plan, implement, upgrade, and backup hosting for internal use
and external clients.
Business Services
The department has 4.5 employees supporting all aspects of the business services of the agency:
Work with the departments to monitor their budgets.
File the majority of Federal and State claims.
New employee benefit orientations.
General payroll/human resources/accounts payable and accounts receivable processing.
Prepare the general ledger for the audit.
Cooperative purchasing.
Delivery van services.
School Information Services
The school district participation has noticeably changed over the year, reducing from 27 districts to 23
districts. The revenue has not changed much as districts are transitional from STI Windows based to STI
Web based. They are now waiting for the State to decide on the vendors for the new state software.
Triennial Evaluation of Services
Page 5
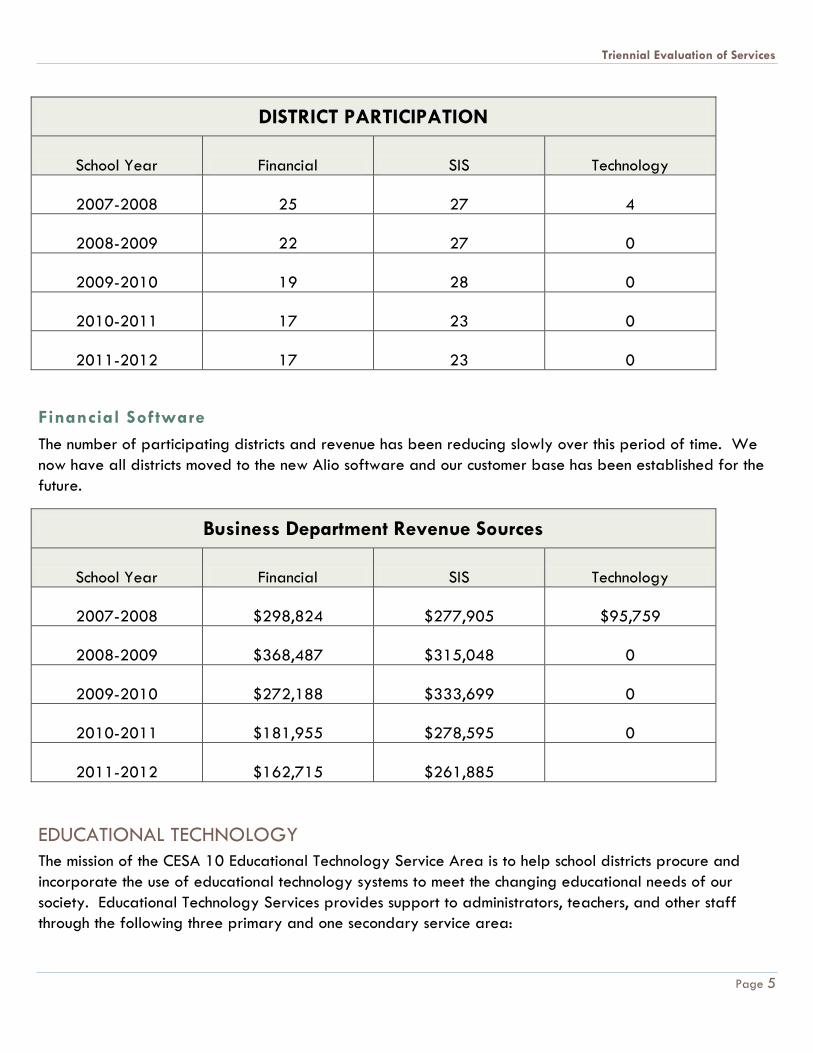
DISTRICT PARTICIPATION
School Year Financial SIS Technology
2007-2008 25 27 4
2008-2009 22 27 0
2009-2010 19 28 0
2010-2011 17 23 0
2011-2012 17 23 0
Financial Software
The number of participating districts and revenue has been reducing slowly over this period of time. We
now have all districts moved to the new Alio software and our customer base has been established for the
future.
Business Department Revenue Sources
School Year Financial SIS Technology
2007-2008 $298,824 $277,905 $95,759
2008-2009 $368,487 $315,048 0
2009-2010 $272,188 $333,699 0
2010-2011 $181,955 $278,595 0
2011-2012 $162,715 $261,885
EDUCATIONAL TECHNOLOGY
The mission of the CESA 10 Educational Technology Service Area is to help school districts procure and
incorporate the use of educational technology systems to meet the changing educational needs of our
society. Educational Technology Services provides support to administrators, teachers, and other staff
through the following three primary and one secondary service area:
Triennial Evaluation of Services
Page 6
Educational Technology Leadership Service
Consulting and Staff Development (CSD)
Distance Learning Services
Educational Technology Leadership Service
The primary responsibility of the Educational Technology Leadership Service is to assist CESA 10 districts as
they strive to meet the educational needs of the students through the use of telecommunications and other
technology-based learning systems. The following specific services are provided:
Represent and advocate for CESA 10 schools regarding federal programs including the Universal Service E-rate. Provide direct technical E-rate assistance.
Represent and advocate for CESA 10 schools regarding state programs and initiatives including BadgerNet, CINC, WiscNet, and WADEN Networks.
Assist CESA 10 schools in acquiring high bandwidth Internet connectivity at an affordable cost.
Serve as liaison to institutional partners (University of Wisconsin, Technical Colleges, Educational Communication Board, Department of Public Instruction, and WiscNet).
Serve as liaison to business and industry partners in cooperative efforts including hardware and software vendors, telecommunications providers, and other related educational technology businesses.
Consulting and Staff Development (CSD)
Consulting and Staff Development provides leadership, consulting, staff development, and purchasing
guidance in support of the use of technology to help school districts meet the learning needs of the students
they serve.
In general, CSD has the following goals:
Promote and facilitate effective use of educational technologies for the improvement of instruction and student achievement (learning management systems – Moodle, Google Apps, screencasting, interactive whiteboards, tablet computers, etc.).
Provide leadership for the ongoing exchange of ideas, techniques, materials, and procedures, that model effective use of instructional technology.
Maintain regular contact with media specialists, technology leaders, and staff members, and provide timely information through messaging, phone calls, on-line resources, and personal visits.
Provide consulting and technical assistance to districts in designing, planning, and implementing a wide range of technology applications in education, including their Information (Library Media) and Technology Plans.
Coordinate and support major on-going staff development initiatives through agency and consortia grants such as ESEA EETT Title II-D/ARRA and other funding opportunities. These initiatives are supported in a sustained, research-based, relevant environment.
Triennial Evaluation of Services
Page 7
Collaborate with other CESA projects (Media Technology Initiative, Response to Intervention [RtI], Title I, Assistive Technology Initiative, Distance Learning, Online Learning, and the IMC) in the integration of technologies into the curriculum and the maintenance of such hardware and programs where appropriate.
Collaborate with higher education institutions in the implementation of technology integration activities for pre-service educators and continuing education programs.
Distance Learning Services
This service provides video and online distance learning courses for students in thirty-nine (39) school
districts. The participating, blended (hybrid) schools and agencies are organized through four distance
learning networks as follows:
CADENC: Augusta, Bloomer, Chippewa Falls, Durand, Elk Mound, Fall Creek, Gilmanton, McDonell Area Catholic Schools, Mondovi, and Regis Catholic Schools
CWETN: Abbotsford, Athens, Colby, Edgar, Granton, Greenwood, Loyal, Marathon City, Marathon County – Special Education, Neillsville, Owen-Withee, Spencer, and Stratford
Project CIRCUIT: Alma Center-Humbird-Merrillan, Arcadia, Blair-Taylor, Eleva-Strum, Galesville-Ettrick-Trempealeau, Independence, Osseo-Fairchild, and Whitehall
WIN: Bruce, Cadott, Cornell, Flambeau, Lake Holcombe, New Auburn, Stanley-Boyd, and Thorp
The following services for online and video-based distance learning are available to member districts:
Assist with student course development.
Serve as a liaison with regional higher education institutions and state agencies.
Assist with staff training as it relates to both distance learning technology and course software.
Assist with the development of network policies and procedures.
Write grants and apply for funding opportunities.
Serve as a fiscal agent.
Coordinate technical support and maintenance.
Within the CESA 10 Agency building, distance learning staff supports the videoconferencing for agency
meetings, large group conferences, and student courses.
Current partners in providing student video courses are UW-Barron County, UW-Eau Claire, UW-
Marshfield Wood County, Chippewa Valley Technical College, Mid-State Technical College, Northcentral
Technical College, Western Technical College, and Wisconsin Indianhead Technical College.

Triennial Evaluation of Services
Page 8
CESA 10 Educational Technology Services
Leadership - - E-rate Assistance for Years 2006-2011
Educational Technology Services Leadership's ongoing support has helped districts capture
$4,433,737.28 over the past 6 years.
DISTRICT 2006 2007 2008 2009 2010 2011 TOTALS
Abbotsford $20,221.75 $13,737.96 $13,629.51 $30,754.02 $126,699.17 $40,674.98 $ 245,717.39
AC-H-M $23,336.25 $20,764.80 $29,765.97 $29,765.97 $26,405.98 $26,629.34 $ 156,668.31
Altoona $14,694.31 $15,789.86 $15,717.77 $23,386.67 $26,827.60 $25,583.98 $ 122,000.19
Augusta $11,991.27 $11,875.78 $11,574.78 $11,770.75 $17,597.02 $13,574.58 $ 78,384.18
Birchwood $ 8,899.20 $17,524.80 $ 9,120.00 $ 8,892.00 $11,894.40 $24,305.32 $ 80,635.72
Bloomer $16,628.52 $16,665.90 $14,737.85 $17,087.96 $20,294.48 $20,092.77 $ 105,507.48
Bruce $10,103.59 $10,044.04 $10,039.41 $10,881.79 $11,189.59 $11,513.30 $ 63,771.72
Cadott $ 8,366.63 $ 9,804.99 $ 9,593.92 $17,196.71 $18,273.07 $16,666.18 $ 79,901.50
MACS $ 8,005.35 $ 7,549.39 $ 6,518.60 $ 6,271.98 $ 7,194.46 $11,850.20 $ 47,389.98
Chippewa Falls $ - $47,223.40 $47,400.65 $54,728.90 $43,965.85 $45,898.05 $ 239,216.85
Colby $12,623.72 $12,824.47 $12,982.43 $20,167.14 $24,914.30 $21,801.20 $ 105,313.26
Cornell $12,337.25 $12,659.72 $10,515.74 $ 8,960.68 $15,845.60 $13,123.94 $ 73,442.93
Eau Claire $118,688.90 $110,389.02 $132,421.43 $174,658.18 $148,656.13 $159,200.53 $ 844,014.19
Eleva-Strum $18,851.13 $20,252.59 $27,500.62 $26,506.30 $27,971.24 $24,243.99 $ 145,325.87
Elk Mound $13,001.50 $14,383.15 $11,012.98 $10,717.79 $15,076.82 $11,894.77 $ 76,087.01
Fall Creek $15,151.08 $13,933.73 $11,763.66 $11,634.08 $17,158.70 $14,914.54 $ 84,555.79
Flambeau $21,320.10 $19,480.14 $18,506.98 $31,929.62 $36,990.75 $34,566.94 $ 162,794.53
Gilman $19,485.03 $20,883.26 $13,758.15 $13,639.01 $13,183.87 $ 7,985.76 $ 88,935.08
Gilmanton $11,158.29 $11,775.27 $13,374.41 $12,553.46 $10,251.11 $ 9,284.23 $ 68,396.77
Granton $10,520.53 $10,224.25 $12,218.24 $11,984.19 $18,246.75 $ 9,839.14 $ 73,033.10
Greenwood $11,653.99 $11,043.33 $12,510.49 $13,207.65 $30,066.30 $19,036.73 $ 97,518.49
Ladysmith $36,165.75 $24,793.77 $23,667.86 $65,569.91 $58,685.53 $68,053.77 $ 276,936.59
Lake Holcombe $ 7,778.52 $ 7,628.12 $ 9,176.63 $ 9,163.13 $12,113.71 $11,747.68 $ 57,607.79
Loyal $ 9,837.84 $ 9,672.37 $10,266.56 $18,987.22 $23,734.88 $20,565.07 $ 93,063.94
Medford $26,253.13 $23,327.51 $25,014.70 $25,024.66 $53,701.09 $73,206.77 $ 226,527.86
Mondovi $15,957.75 $17,580.14 $17,921.46 $17,258.05 $20,680.22 $25,511.95 $ 114,909.57
Neillsville $14,028.52 $12,959.06 $13,626.27 $21,344.35 $26,045.49 $19,799.56 $ 107,803.25
New Auburn $ 7,274.48 $ 7,311.61 $ 7,385.87 $ 5,499.74 $ 4,650.07 $ 5,682.33 $ 37,804.10
Osseo-Fairchild $18,889.55 $14,520.50 $19,151.97 $19,534.24 $21,839.50 $31,882.70 $ 125,818.46
Owen-Withee $10,113.11 $10,322.38 $10,789.97 $19,998.84 $19,256.04 $20,621.29 $ 91,101.63
Spencer $15,703.54 $13,816.46 $11,649.02 $11,400.42 $13,763.26 $ 9,753.98 $ 76,086.68
Stanley-Boyd $10,117.51 $ 8,536.15 $ 8,734.83 $17,023.56 $17,977.45 $27,452.74 $ 89,842.24
Thorp $ 8,456.06 $ 9,899.25 $11,063.02 $18,876.17 $16,430.07 $20,286.53 $ 85,011.10
Weyerhaeuser $ 7,005.28 $ 5,608.45 $ - $ - $ - $ - $ 12,613.73
TOTALS
$574,619.43
$594,805.62
$613,111.75 $796,375.14
$957,580.50
$897,244.84
$4,433,737.28
$4,433,737.28

Triennial Evaluation of Services
Page 9
CESA 10 Educational Technology Services
Consulting and Staff Development
Moodle Statistics
Moodle is a learning management system – network software for creating and managing classroom
websites with secure online learning activities. Moodle offers the greatest range of features with the most
user-friendly interface at the lowest possible cost. Over 600 teachers have been trained.
June 2009 through May 2010 ................................. 1,838,105 total hits June 2010 through May 2011 .................................. 2,209,455 total hits June 2011 through May 2012 .................................. 2,525,568 total hits
Teacher Training Enrollments
0
500000
1000000
1500000
2000000
2500000
3000000
June 2009 - May 2010 June 2010 - May 2011 June 2011 - May 2012
0
100
200
300
400
500
600
Google iOS (iPads in the Classroom)
Interactive Whiteboard
Moodle
2010
2011
2012

Triennial Evaluation of Services
Page 10
0
500
1000
1500
2000
2500
2008/2009 2009/2010 2010/2011 2011/2012
University
Technical College
Advanced Placement
High School to High School
CESA 10 Educational Technology
Distance Learning Services
Student Course Development
The following two charts demonstrate the ongoing growth and development of CESA 10 distance learning
student courses. Chart 1 documents the number of students in semester classes by year and by content
provider. Chart 2 documents the growth in high school options for students by tabulating the number of
semester-long class sections offered by year.
Chart 1 – Video Distance Learning Semester Student Enrollment
Chart 2 – Video Distance Learning Class Sections
Sections 2008-09 2010-11 2011-12
High School 42 58 74
HS Advanced Placement 18 24 26
Technical College 46 45 44
University 27 27 25
Total 133 154 169
Triennial Evaluation of Services
Page 11
FACILITIES MANAGEMENT
CESA 10’s Facilities Management Department helps schools and other public buildings throughout the state in the management of their facilities needs in the areas of health, safety, energy efficiency and others. The Department’s three main areas of concentration are:
Focus on Energy
Energy Management
Environmental Health and Safety Services
In addition, we have a division which brokers the purchase of natural gas for school districts.
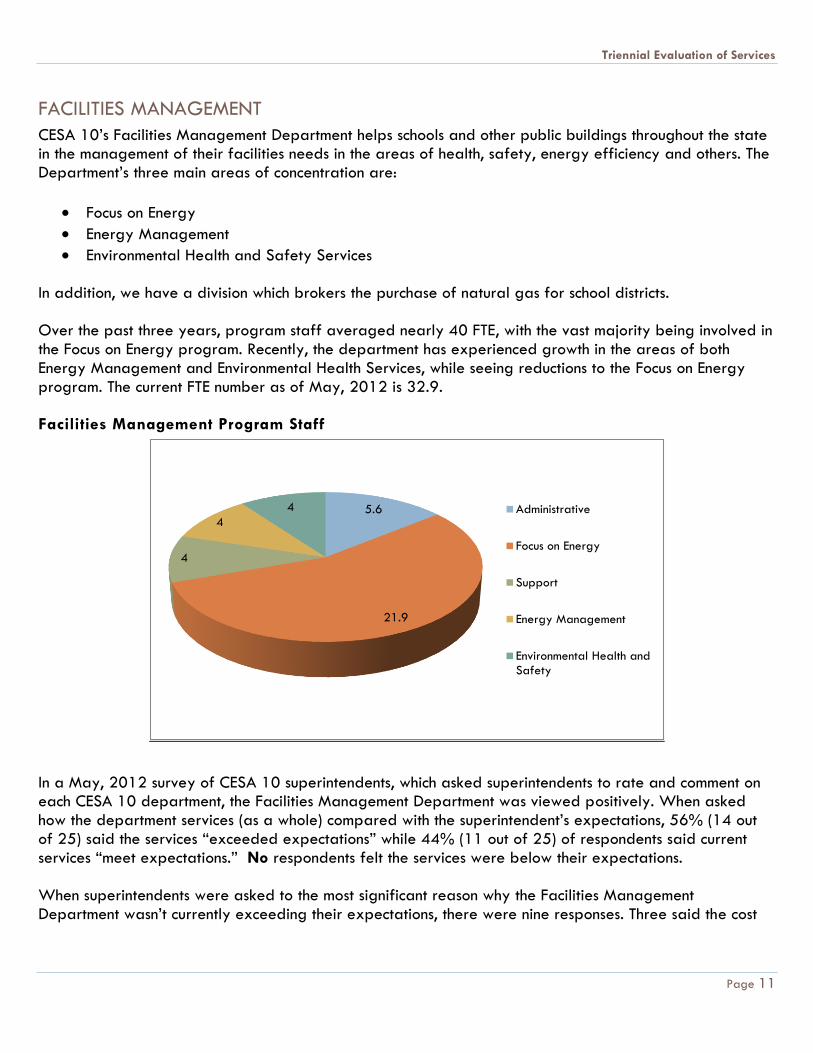
Over the past three years, program staff averaged nearly 40 FTE, with the vast majority being involved in the Focus on Energy program. Recently, the department has experienced growth in the areas of both Energy Management and Environmental Health Services, while seeing reductions to the Focus on Energy program. The current FTE number as of May, 2012 is 32.9.
Facilities Management Program Staff
In a May, 2012 survey of CESA 10 superintendents, which asked superintendents to rate and comment on each CESA 10 department, the Facilities Management Department was viewed positively. When asked how the department services (as a whole) compared with the superintendent’s expectations, 56% (14 out of 25) said the services “exceeded expectations” while 44% (11 out of 25) of respondents said current services “meet expectations.” No respondents felt the services were below their expectations.
When superintendents were asked to the most significant reason why the Facilities Management Department wasn’t currently exceeding their expectations, there were nine responses. Three said the cost
5.6
21.9
4
4
4 Administrative
Focus on Energy
Support
Energy Management
Environmental Health and Safety

Triennial Evaluation of Services
Page 12
of services were a factor, while three noted the quality of staff/consultants, and two the lack of a needed service (did not specify service). One respondent noted the quality of service was what kept them from being able to say that the Facilities Management Department was currently exceeding their expectations.
Focus on Energy
In the 2011 Chairman’s Report from the Governor’s Commission on Waste, Fraud and Abuse titled Reforming Government, Eliminating Waste, and Saving Taxpayer Dollars, it was noted that: “The Focus on Energy Schools and Government Program, operated out of CESA 10, has saved $59.6 million in energy costs for schools and local governments since its creation in 2001.”
The Focus on Energy component of Facilities Management makes energy conservation services available to all educational and government facilities across the entire state. In 2011, Focus on Energy helped schools and governments in Wisconsin save more than $8,386,000 on their energy bills. To provide Focus on Energy services statewide our energy advisors are located throughout the state as well as out of two primary offices in Chippewa Falls, WI and near Madison, WI.
Energy Advisors help customers make informed decisions about purchasing energy or energy consuming equipment. The advisors work as non-biased consultants, providing information to customers as well to contractors who are working in the public sector.
Savings and FTEs: 2001-2011
A 2012 survey of Focus on Energy Customers served by CESA 10 Facilities Management yielded several positive results:
0
5
10
15
20
25
30
35
$-
$10,000,000
$20,000,000
$30,000,000
$40,000,000
$50,000,000
$60,000,000
$70,000,000

Triennial Evaluation of Services
Page 13
94% of respondents agreed or strongly agreed that they would work with CESA 10/ Focus on Energy in the future.
96% of School and Government Sector respondents reported that participating with CESA 10 Focus on Energy was beneficial to their organization.
Several comments regarding individual Energy Advisors were written in the survey results including that they were: “awesome!,” “extremely helpful,” “great to work with,” “very important to our school district,” “outstanding,” and “a very valuable resource.”
Energy Management Services
For most of the period, this division had four Energy Managers statewide to assist schools and governments in saving energy by changing the way that facility managers operate their buildings. In 2012, due to the incredible success of Energy Management, there has been significant growth in this area and additional Energy Managers/Sustainability Specialists were added to support a new sustainability service which focuses on the comprehensive actions of building occupants (human behavior) and their effect on building efficiency, resource consumption, and the surrounding community.
The Energy Manager’s job is different than an Energy Advisor in that they do not work with their customers to install new equipment, but rather to make sure that the equipment that the school has operates as efficiently as possible and only when it is needed. o For example days when school is called off because of snow are typically the most expensive days to
operate a school because the heating and ventilating systems are operating as if the building were full of students yet the building is not getting the heat gains that are typical on a school day, such as heat from the students, computers and lights. The energy managers make certain that the heating and ventilating systems are not operating on these days, thus saving money for the district.
Most school districts either don’t have anyone that is capable of making these changes or, if they have someone with the expertise, they are often too busy to maximize the efficiency of their building.

Triennial Evaluation of Services
Page 14
Energy Management Services, Districts Served and FTE: 2004-2011
Environmental Health and Safety Services
87 school districts across eight CESA service regions contract for this service with CESA 10. Services cover a multitude of potential safety hazards including asbestos, lead, indoor air quality, and even removal of potentially hazardous materials like outdated or unsafe chemicals and even light bulbs.
CESA 10 assists schools in safely recycling fluorescent bulbs (lamps). In 2009/10 60,847 lamps were recycled. In 2010/11 62,648 lamps were recycled, and more than 99,700 fluorescent lamps were recycled in 2011/12.
Primary activities of the EHS group include assisting schools with health and safety issues within their schools.
Wisconsin schools are required by various regulatory agencies to have as many as 20 different health and safety plans for each district.
The plans need to be very detailed with procedures for tasks that are completed on a daily basis in some cases or just once a year in other cases.
As with the energy management, most schools either do not have the staff expertise in this area, or if they do the person is too busy with other tasks to keep the health and safety plans up to date, and to keep up with ever changing state and federal regulations. One example is Wisconsin Act 96 requiring all schools to
0
1
2
3
4
5
6
7
8
9
10
$0.00
$100,000.00
$200,000.00
$300,000.00
$400,000.00
$500,000.00
$600,000.00
$700,000.00
$800,000.00
$900,000.00
2004-2005 2005-2006 2006-2007 2007-2008 2008-2009 2009-2010 2010-2011 2011-2012
Savings at CESA 10 schools
Savings at Non-CESA 10 Schools
FTE

Triennial Evaluation of Services
Page 15
create and implement a plan for indoor environmental quality (IEQ). CESA 10 contracted schools received free assistance in creating IEQ plans that keep them in compliance with this new law, while other schools were offered the service at a nominal price.
Environmental Health and Safety Services, Districts Served and FTE: 2006-2011
INSTRUCTIONAL SERVICES
The mission of Instructional Services (IS) is to assist districts to improve the quality and effectiveness of teaching and learning through leadership, professional development, curriculum services, and direct program support. Based on a comprehensive assessment of districts’ needs, IS developed a strategic plan that focuses on delivering:
Educational leadership supporting evidence-based programs, instruction and data-based decision-making, while encouraging innovation;
Standards-based professional development that develops: o Local leadership capacity by targeting administrators and teacher leaders to participate in
content leadership teams, and o The capacity for CESA 10 staff to provide leadership by keeping abreast of current
educational research and participating in the IS Professional Development Learning community;
0
1
2
3
4
0
10
20
30
40
50
60
70
80
90
2006-2007 2007-2008 2008-2009 2009-2010 2010-2011 2011-2012
CESA #10
Other Districts
Total Contracts
fte

Triennial Evaluation of Services
Page 16
Curriculum services by developing a standardized and data-driven system of support so that services related to curriculum, instruction, and assessment can be customized based on individual district needs;
Direct program support to assist districts to implement state and federal programs including all Elementary and Secondary Education Act Programs (ESEA) including Titles I, II-A, III-A, IV-A and the Carl D Perkins Act; and
Member school districts with year-round access to resources that meet state standards, support current education initiatives and respond to the curricular and professional development needs of all educators through the Instructional Media Center.
The department employs a director, an assistant director, four full-time consultants, three support staff and nine part-time consultants. Major services provided by these individuals to CESA 10’s district during the last three school years include:
Leadership Services 28 districts Career & Technical Education Leadership 29 districts
Title I Services 24 districts STEM Leadership 27 districts
Title II-A Consortium 25 districts Gifted & Talented 13 districts
Title III Consortium 28 districts IMC Services 26 districts
Title IV-A Consortium 25 districts PI 34 Services 15 districts
The IS Department has implemented a process to survey teachers as part of the needs assessment concerning professional development. This process complements the structured interviews that are conducted with local district leadership teams. As a result, current professional development initiatives are focused on Common Core State Standards and instructional practices to meet those standards, build reflective leadership teams in math and science, implement the Professional Learning Communities framework, implement lesson study in math, implement model violence and drug prevention programs, implement comprehensive counseling models, and provide support for the development and implementation of Programs of Study based upon career clusters. Over the past three years, the department has responded to collected data that services to support Gifted & Talented Education should be addressed. To date we have increased this service from 7 districts to 13 districts. Additionally, services were included to provide leadership support for identified GT students. Based again on our needs assessment data, we have modified our services to districts that have increasing English Language Learners (ELL) populations. We currently have a part-time consultant who provides on-site assistance. The strategic plan for the IS Department for the upcoming year indicates that our primary goals will be to assist districts with (1) the identification and implementation of the Common Core State Standards and the Next Generation Science Standards, (2) understanding the new Wisconsin Accountability System, and (3) development and implementation of an educator effectiveness model.

Triennial Evaluation of Services
Page 17
Supporting Professional Staff
Fiscal
Year Leadership Data
Number of
Sessions
Average Number of
Participants
2008-09
AODA Network
3 20
2009-10 3 19
2010-11 3 16
2008-09
Career & Technical Education Leaders
2 23
2009-10 1 34
2010-11 2 23
2008-09
District Assessment Coordinators
3 20
2009-10 3 20
2010-11 3 23
2008-09
Gifted & Talented Education Leaders
3 3
2009-10 2 5
2010-11 3 9
2008-09
Literacy Leaders
3 40
2009-10 11 109
2010-11 4 86
2008-09
Mathematics Leaders
6 30
2009-10 6 30
2010-11 4 25
2008-09
Science Leaders
2 10
2009-10 2 10
2010-11 2 10
2008-09
Title III (ELL) Leaders
3 12
2009-10 3 12
2010-11 3 12
Professional Development Offerings
Fiscal Year Number of Sessions Total Participation
2008-09 111 2132
2009-10 155 3479
2010-11 144 4587
License Renewal Support Center
Fiscal
Year Number of Districts Total Participation
2008-09
Teacher Mentor Training
15 38
2009-10 5 8
2010-11 11 4

Triennial Evaluation of Services
Page 18
2008-09
PDP Team Training
0 0
2009-10 15 26
2010-11 0 0
2008-09
INSIGHT Support Seminars
12 19
2009-10 9 24
2010-11 17 5
2008-09
Writing PDP Goal
0 0
2009-10 4 8
2010-11 22 39
2008-09
Goal Approval
6 8
2009-10 0 0
2010-11 17 17
2008-09
Planning for PDP Completion
13 20
2009-10 7 9
2010-11 23 29
2008-09
PDP Verification
7 9
2009-10 0 0
2010-11 7 10
Instructional Resources
Fiscal Year Number of Items Purchased and Available for
Checkout to Participating Consortia Members
2008-09 13,924
2009-10 13,472
2010-11 13,589
Supporting Students and Professional Staff
Fiscal
Year Leadership Data
Number of
Students Number of Districts
2008-09
Title III - ELL
430 17
2009-10 445 17
2010-11 495 18
2008-09
StarLab
approximately
8,600/year
29
2009-10 29
2010-11 29
2008-09
Youth Risk Behavior Survey
856 3
2009-10 595 2
2010-11 unknown online survey
2008-09
Regional Spelling Bee
21 18
2009-10 30 26
2010-11 32 27
Fiscal
Year
Number of
Students
Number of
Teachers
Number of
Districts

Triennial Evaluation of Services
Page 19
2008-09
Destination ImagiNation
336 48 9
2009-10 329 47 8
2010-11 (not hosted by CESA 10)
2008-09
Gifted & Talented Grant
0 12 12
2009-10 0 12 12
2010-11 15 14 13
CRAY ACADEMY
Cray Research, Inc., the maker of supercomputers that was based in Chippewa Falls, Wisconsin, decided to explore ways to improve math, science and technology education in the Chippewa Valley. The Cray Foundation was created and provided the initial funding for the first Cray Academy in 1988. In 1994, a proposal was submitted to the National Science Foundation to fund the development of a statewide program. It was granted and facilitated the creation of the Wisconsin Academy’s Staff Development Initiative (WASDI). In 1995, CESA 10 assumed financial and programmatic responsibility for the continuation of the Cray Academy. The Academy continued to provide professional development for K-12 educators in the areas of mathematics, science, and technology. Over the years, however, the need for more diverse professional development was identified. In 1999, the Cray Academy began to offer sessions in reading, writing, and specific sessions dealing with special population needs. The focus on core curriculum continued until such time that it was appropriate to have a fully integrated summer institute, combining professional development session for ALL educators. The decision to bring educators from all disciplines together was very positive. It modeled the necessity of all educators to work side-by-side for the benefit of individual student achievement. An agency-wide planning committee builds its summer offerings from data collected from our districts. Further, consultants from the three departments within CESA10 (Instructional Services, Special Education, Educational Technology) offer several integrated sessions presenting the same basic philosophy to attending educators. Over the past three years we have seen a decline in participation. This drop in registrations is due to several factors with the predominate factor being the large variety of professional development offerings from many other sources. Other factors that have played into this are the change for the need of graduate credit for license renewal and salary adjustments and unrest with the state’s direction of leadership.
Cray Academy Number of Offered Sessions Number of Participants
Summer 2009 29 390
Summer 2010 26 314
Summer 2011 20 126

Triennial Evaluation of Services
Page 20
SPECIAL EDUCATION
CESA 10 Special Education Department assists school districts to provide appropriate educational services
for children with disabilities. This includes direct services to children, professional development services for
school staff, and administrative and budget services for school districts. For this review, services were
divided into four program areas, described below.
2011-2012 Special Education Programs
Program Professional
FTE
Districts
Served
Students
Served
Units
Provided
Administration 6.65 14 9,785 NA
Program Support 2.3 18 10,321 NA
Itinerant (OT, PT, VI, HI, AUD) 11.4 28 329 6,584 hours
Foster Grandparent 0.8 17 333 23,976
Administration
For the annual consortium membership fee, the Special Education Director and District Directors guide
member districts in meeting the requirements of state and federal special education laws and regulations,
coordinate the budgeting and management of special education services, and provide/supervise staff for
some programs. Specific activities include:
Supervise programs, develop budgets, and direct activities of the special education leadership, district directors, professional development, and itinerant services
Administer federal IDEA grant consortium, including budgets, claims, assurances, and procedural compliance
Ensure that districts adopt and follow the state-required policies and procedures, in preparation for audits and 5-year self-assessment process, and that IEP forms and procedures are timely and accurate, provide or arrange for professional development for these compliance requirements
Purchase, maintain, and provide technical support for IEP software and server used by all special education consortium staff
Manage third party billing and distribute revenues
Maintain database of all students in special education and use it to file state and federal reports including federal child count and the 20 indicators of the State Performance Plan

Triennial Evaluation of Services
Page 21
File special education budgets and claims for the district to facilitate shared programming between districts (i.e., package programs), distribute categorical aids to districts
Coordinate student placements in cooperative programs or outside facilities; process forms and billing for open enrollment, package contracts, CESA contracts
Coordinate the process and assist staff preparation for contentious IEP issues that involve facilitated IEPs, mediation, DPI complaints, and due process hearings
Operate special education programs as needed within districts, supervise and evaluate CESA-employed staff
Investigate parent complaints, advise districts on contentious issues within districts, and be proactive in preventing or resolving issues
Monitor programs and enrollments; identify staff and program needs, arrange for program support services, and ensure that teachers follow through on requested program support activities
Plan and carry out the comprehensive system of personnel development (CSPD); perform an annual needs assessment; deliver professional development offerings during the school year and summer; and evaluate professional development programs
Fulfill all requirements of the DPI Regional Services Network (RSN), to keep special education leadership informed of compliance activities and program initiatives using a variety of formats and delivery systems
Write and administer grant projects to support CESA-wide or district-specific initiatives
Lead projects and initiatives such as the Cray Academy Summer Institute, Response to Intervention/Reach, new teacher orientation, transition/guidance, and preschool options
Collaborate with community agencies to promote funding opportunities, program development, and services for students or faculty; assist districts with applications for funding
Promote interdepartmental and interagency projects within CESA 10 and school districts to facilitate the integration of special and general education, including such areas as Response to Intervention, PBIS, Transition/Guidance/Carl Perkins, curriculum standards and assessment, and assistive technology/technology integration
Program Support
For the annual consortium membership fee, Program Support Specialists assist districts to provide effective
curriculum and instruction for students with special needs in special and general education programs. Direct
services to students, consultation with teachers and staff development programs include:
Provide consultant services to assist teachers to develop IEP content , develop student or program schedules, plan and implement curriculum, and utilize ongoing progress monitoring; assist with program analysis related to caseload size, scheduling, or staffing needs; perform student assessments and participate in the determination of eligibility and/or development of an IEP for an individual student; act as an objective facilitator of an IEP team meeting; and train staff in how to implement components of an IEP in the areas of:
Triennial Evaluation of Services
Page 22
emotional/behavior disabilities specific learning disabilities
positive behavioral supports response to intervention
cognitive disabilities autism
speech or language disabilities traumatic brain injury
early childhood special education school psychology
assistive technology low-incidence disabilities
Provide consultation services regarding programs or students to support all general and special education staff serving children with disabilities
Interact with community agencies involved in programming for individual children with IEPs and facilitate student/teacher access to community resources
Itinerant and In-District Staff
Itinerant services are provided as fee for service programs through contracts with individual districts and
counties, as needed for individual students. Services include audiology, teachers of deaf/hard of hearing
(DHH), teachers of blind and visually impaired (VI), orientation and mobility, assistive technology
consultation, occupational therapy (OT), physical therapy (PT), and birth-to-3 early childhood teacher
(ECSE). In-district staff are CESA employees placed in districts to provide a program. These include school
psychologist, speech-language pathologist, cross-categorical teacher, paraprofessional, school nurse, and
educational interpreter.
Foster Grandparent Program
The Foster Grandparent Program (FGP) is available as a consortium membership service. Its primary
source of funding is a federal grant that offers qualifying seniors a non-taxable stipend for their hours
volunteered in the classroom. District fees and local grants supplement the program. During the 2011-
2012 school year, 66 foster grandparents volunteered in 25 schools, for a total of more than 40,000
hours. Of that total, 23,976 (60%) were spent with Special Education students. The remaining 16,024
hours (40%) were spent with children who needed remedial assistance. Foster grandparents’ activities are
based on the classroom curriculum, and supplement daily lessons taught by the classroom teachers. Foster
Grandparents:
Provide supplemental, remedial activities under the direction of a teacher
Provide positive support and mentoring to individual students
Assist classroom teachers in creating a rich learning environment for their students
Cost to Districts
The IDEA grant funds for consortium members are administered through CESA 10. When districts choose to
apply some of those funds to their CESA services, the billing to districts is reduced accordingly. The costs
Triennial Evaluation of Services
Page 23
$0
$200,000
$400,000
$600,000
$800,000
$1,000,000
$1,200,000
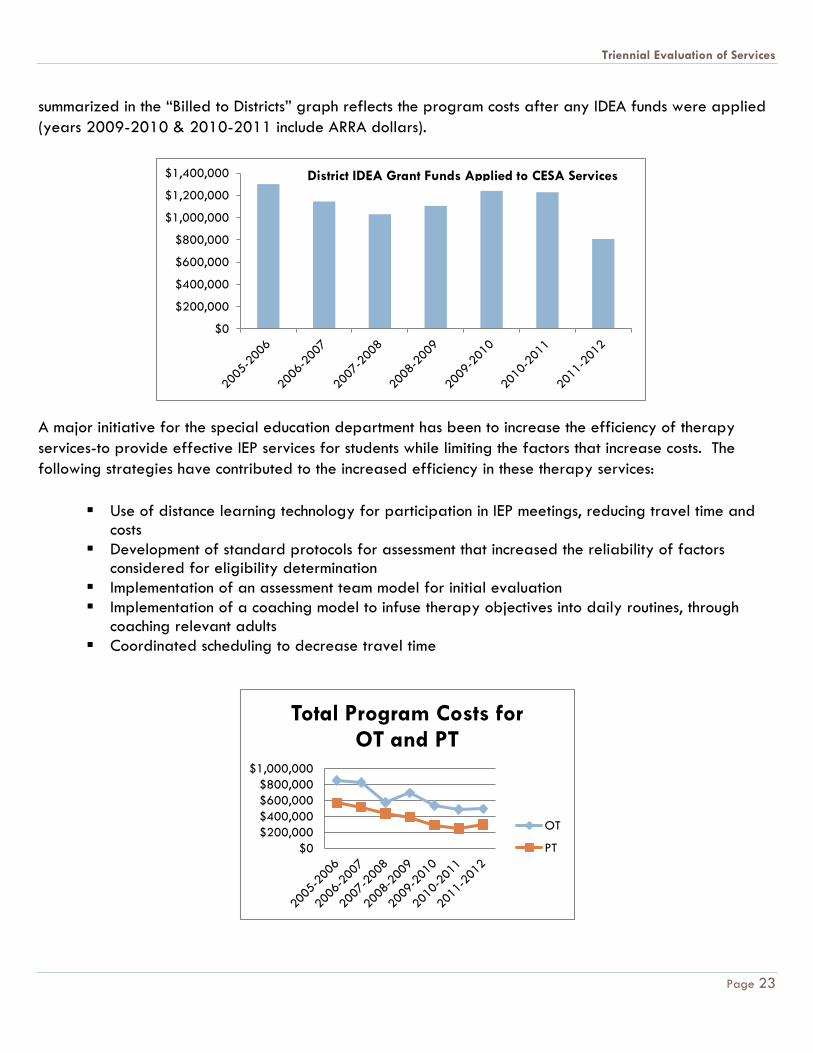
$1,400,000 District IDEA Grant Funds Applied to CESA Services
summarized in the “Billed to Districts” graph reflects the program costs after any IDEA funds were applied
(years 2009-2010 & 2010-2011 include ARRA dollars).
A major initiative for the special education department has been to increase the efficiency of therapy
services-to provide effective IEP services for students while limiting the factors that increase costs. The
following strategies have contributed to the increased efficiency in these therapy services:
Use of distance learning technology for participation in IEP meetings, reducing travel time and costs
Development of standard protocols for assessment that increased the reliability of factors considered for eligibility determination
Implementation of an assessment team model for initial evaluation
Implementation of a coaching model to infuse therapy objectives into daily routines, through coaching relevant adults
Coordinated scheduling to decrease travel time
$0
$200,000
$400,000
$600,000
$800,000
$1,000,000
Total Program Costs for OT and PT
OT
PT
Triennial Evaluation of Services
Page 24
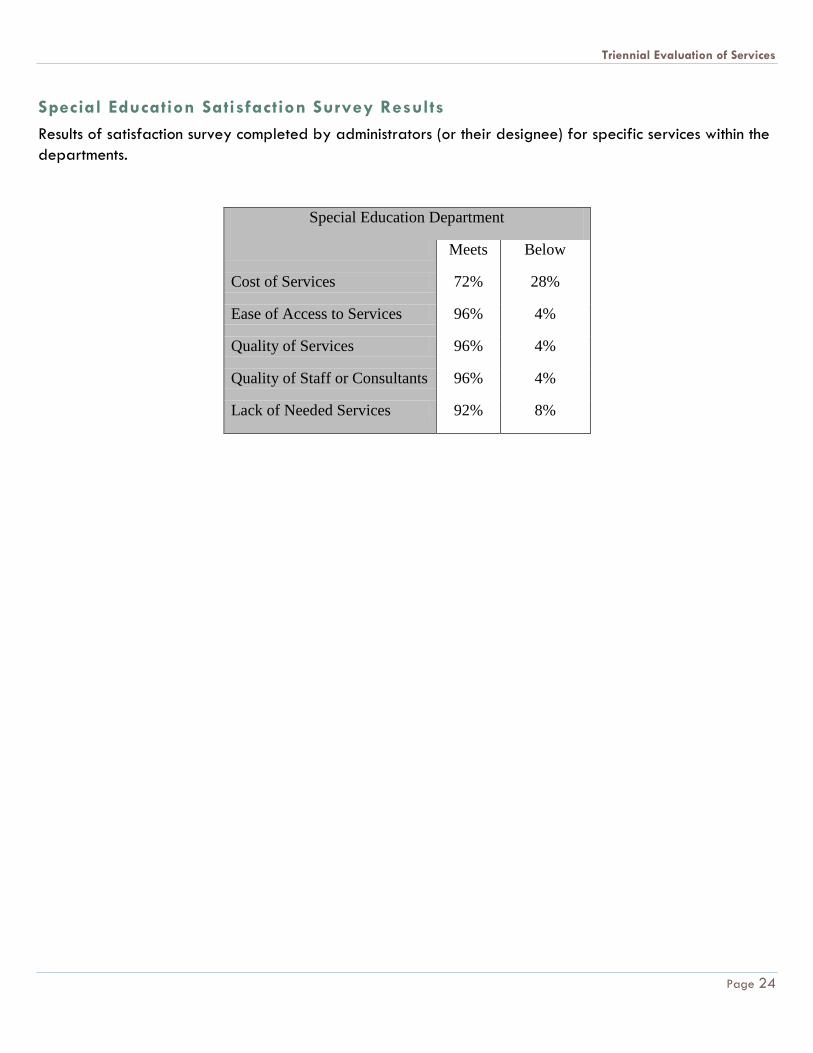
Special Education Satisfaction Survey Results
Results of satisfaction survey completed by administrators (or their designee) for specific services within the
departments.
Special Education Department
Meets Below
Cost of Services 72% 28%
Ease of Access to Services 96% 4%
Quality of Services 96% 4%
Quality of Staff or Consultants 96% 4%
Lack of Needed Services 92% 8%