Embed Size (px)
Citation preview
SOCIO ECONOMIC STATUS OF DOMESTIC WOMEN SERVANTS -
A CASE STUDY OF THRISSUR CORPORATION
SUBMITTED TO KERALA RESEARCH PROGRAMME ON LOCAL LEVEL
DEVELOPMENT, CDS, THIRUVANANTHAPURAM
VIMALA.M.
ACKNOWLEDGEMENT
It gives me much pleasure to acknowledge my deep sense of gratitude and indebtedness to KRPLLD which gave me approval for the pilot study. I owe a great deal to Dr.K.N.Nair, Programme Co-ordinator of KRPLLD for his inestimable help and candid suggestions for doing the project. May I make use of this occasion to express my deep gratitude to the experts of KRPLLD for their valuable suggestions. I express my sincere thanks to the domestic servants for their whole-hearted co-operations extended to me during the period of survey.
I owe a great deal to my family members for their support during the work. Above all I am highly indebted to God Almighty who I believe is always with me without whose blessings this work would not have been materialised. VIMALA.M.
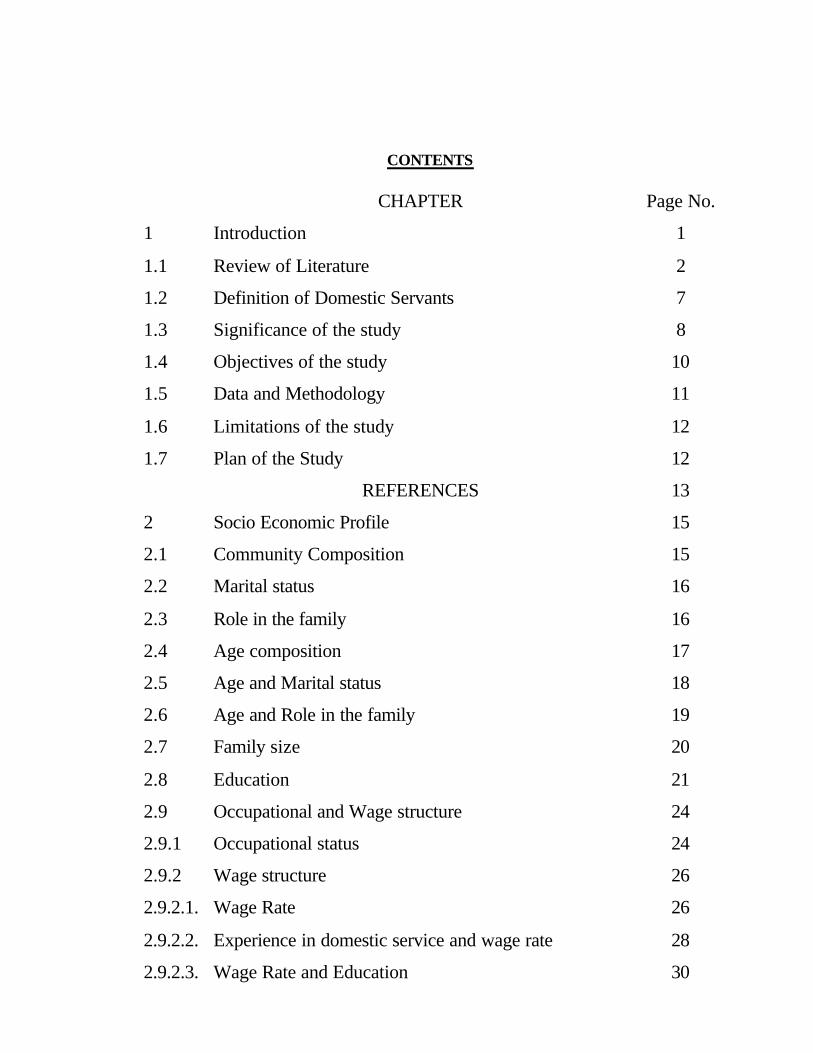
CONTENTS CHAPTER Page No.
1 Introduction 1
1.1 Review of Literature 2
1.2 Definition of Domestic Servants 7
1.3 Significance of the study 8
1.4 Objectives of the study 10
1.5 Data and Methodology 11
1.6 Limitations of the study 12
1.7 Plan of the Study 12
REFERENCES 13
2 Socio Economic Profile 15
2.1 Community Composition 15
2.2 Marital status 16
2.3 Role in the family 16
2.4 Age composition 17
2.5 Age and Marital status 18
2.6 Age and Role in the family 19
2.7 Family size 20
2.8 Education 21
2.9 Occupational and Wage structure 24
2.9.1 Occupational status 24
2.9.2 Wage structure 26
2.9.2.1. Wage Rate 26
2.9.2.2. Experience in domestic service and wage rate 28
2.9.2.3. Wage Rate and Education 30

2.9.2.4. Wage Rate and Age 31
2.9.3 Food for work 32
2.9.4 Help or Gifts 33
2.9.5 Experience in other jobs 34
2.9.6 Leave and Holidays 35
2.9.7 Working environment 35
2.9.8 Unionisation 36
2.10 Income and Management of Expenses 36
2.10.1 Income 36
2.10.2 Savings 40
2.10.3 Repayment of Loans 41
2.10.4 Other expenses 41
2.11 Health status 42
2.12 Rest and Leisure 43
2.13 Housing conditions 44
2.14 Other problems faced by the Domestic servants 46
3 Summary and conclusion 48
3.1 Summary of findings 48
3.2 Conclusion 52
Appendix
Bibliography

LIST OF TABLES
Table No. Title Page NO.
2.1 Community Composition of Domestic Servants 15
2.2 Marital status of Domestic servants 16
2.3 Distribution of Domestic servants according to their position in the family
17
2.4 Age Composition of Domestic servants 18
2.5 Agewise Distribution of Domestic servants according to their Marital status
19
2.6 Agewise Classification of Domestic servants according to their position in the family
20
2.7 Distribution of Domestic servants according to their family size
21
2.8 Distribution of Domestic servants according to their Education
23
2.9 Distribution of Part-time Domestic servants according to the number of houses they serve per day
24
2.10 Distribution of Domestic servants according to their working hours in a day
25
2.11 Distribution of Domestic Servants according to their wage rate
27
2.12 Distribution of Domestic Servants according to their experience in Domestic service
28
2.13 Distribution of Domestic servants according to their wage rate and experience
29
2.14 Distribution of Domestic servants according to their 30
education and wage rate
2.15 Distribution of Domestic servants according to their age and wage rate
32
2.16 Distribution of Domestic servants according to the types of job they engaged before entering the domestic service
34
2.17 Distribution of Domestic servants according to their monthly income
37
2.18 Distribution of Domestic servants according to the percentage of their income to the family income
39
2.19 Distribution of Domestic Servants according to their savings in different categories
40
2.20 Distribution of Domestic servants according to their savings as a share of their income
41
2.21 Distribution of Domestic servants according to the nature of their diseases
43
2.22 Distribution of Domestic servants according to the land holdings
44
2.23 Distribution of Domestic servants according to the Housing condition
45

CHAPTER-I
INTRODUCTION Women, along with man from times immemorial has formed an
integral part of social structure throughout the world. In Indian society, she
has played and continues to play an important role. It is true that the
progress of a country can be judged to a great extent by the status of her
women. She plays manifold role in the society: as a mother, as a sister and
as a wife. Thus she is the foundation stone of the family in particular and
the society in general.
While women represent 50 per cent of the adult population and one
third of labour force, they perform nearly two - third of all working hours
and receives only one-tenth of the world income. Human Development
Report for the year 2000 on the amount of time that women and men spend
on market and non market activities by considering 31 countries reveals that
women work longer hours than men in nearly every country. Women carry
on average 53 per cent of total burden of work in developing countries and
51 per cent of that in industrial countries. Also, roughly two-third of
women’s total work time is spent in unpaid non system of national accounts
activities.
There is no exaggeration in saying that the backbone of Indian work
force is the unorganized sector. According to 1991 census, the total women
work force of 87.77 million, their share in the organized sector was only 4.2
per cent while the rest of 95.8 per cent were in the unorganized sector where
there are no legislative safe guards even to claim either minimum or equal
wages along with their male counterparts. Thus the unorganized sector in India is the women’s sector1. The plight of the women in unorganized sector is miserable as they work at extremely low wages, with total lack of job security and unprotected by any government labour legislations. The women workers in unorganized sector covers most of those activities which are carried out by small and family enterprises, partly or wholly with family labour, which are largely non- unionised. The most common characteristics of this sector are the small size of establishment, often consisting of only one individual, with perhaps a couple of hired workers, casual nature of employment, ignorant and illiterate workers, superior and dominating employer and scattered nature of establishment. 1.1 Review of Literature Numerous studies have been made in the last few decades about the role of women in emerging labour market. Haque2 has analysed the concentration of women in low paid occupations. He argued that the socio economic conditions of women workers in South Asia are poor because they are concentrated in low paid occupations. This is primarily because the society has discriminated against women by not allowing them to act as major players in economic activities. Nirmala Banerjee3 argues that the emerging labour market is likely to prove even more problematic in the case of women workers than for the rest of Indian workers. Jaya Arunachalam4 has an pinion that the issue of informal sector are common to the developing countries, but have to beunderstood in the context where informal systems of work are promoted and encouraged among the working poor. The character of this sector is connected to highly exploitative irregular working conditions and wage discriminations. According to Sathya Sundaram5, the workers in unorganized sector remain unprotected by law. They are the most vulnerable section of the society and they enjoy no job or income security with little bargaining power. The unorganized sector is divided in to institutionalized and non- institutionalized sectors. The non- institutionalized unorganized sector comprises workers doing casual work like domestic workers, sweepers, scavengers etc. A key factor in the growth of informal activity in most developing regions has been the plummering value of wages. The informal sector has not only offered the possibility of work to the unemployed, but has permitted survival of many households with wage earners. Some division of labour exists between formal and informal sectors on the basis of gender. It has been suggested that women tend to stay within the informal sector because of the flexibility of working arrangements and diversity of opportunities6. Atanu Thaker7 has made an enquiry in to women’s workforce participation and she concluded that the proposal for participating in the workforce made by feminist literature and the gender empowerment measure (Proposed by UNDP) may not empower the women; rather it will burden the women more and more. The paper prepared by the Sandra Rothboeck and Surthi Acharya8 tries to argue that the gender segregation of jobs has two distinct elements. One referring to bunching of workers in jobs and the other to the social and occupational hierarchy that permeates it.
Women’s economic tasks in India can be divided in to three categories – as an entrepreneur, as a participant and as a contributor to the family’s real income. There is no uniform official policy as to whether or not all these three categories of tasks are to be taken into account for measuring women’s employment. Nirmala Banerjee9 has made an enquiry about women workers in the unorganized sector of Calcutta’s economy. She found that the employment was regular for working women and their wage rate was significantly lower as compared to those for men with equal qualifications. The working women in the informal sector included a significant number of children and old people and over 60 percent of them were illiterate. Leela Gulati10 has made an attempt to study the women in the unorganized sector in Kerala on the basis of micro- level observations. It appeared that women go to work because of the irregular nature of employment that their men are involved in and the low incomes they make. Regarding the kind of work opportunity open to women in the unorganized sector, very often they choose the type of work that their parents or relatives are involved in. Also they prefer to stick on the same kind of work they are similar with and pick closer by locations. Jeemol Unni and Uma Rani11 have made an attempt to study the informal sector in the light of structural adjustment programme. With steady decline in the growth of the formal sector in India following the introduction of the SAP, a large section of the growing labour force is being absorbed in agriculture and the unorganized informal structure resulting in a progressive increase in employment in the informal sector. However, the most important and the large sector of employed women is the unorganized sector which includes the landless agricultural labourers, workers in traditional Crafts, Village and Cottage industries, migrants to the cities employed as domestic workers and vendors. Domestic services has been, and still is, an important field of employment for many women. Yet, the ways in which it is organized have changed considerably throughout history and these changes have followed different trajectories. CLARA workshop on Domestic Services and mobility involving scholars from Europe, Asia and America, brought a rich contribution to studies about domestic workers12. The increased economic and political interconnectedness of different parts of the world has enabled a rapid increase in the number of labour migrants amongst domestic workers. The status of domestic workers and the statistical categories under which they fall have a direct impact on different state regulations and their status as citizens. The conditions under which domestic workers are defined as citizen are often linked to the larger political context such as fascism, religion and colonialism. Bulgovind Baboo and Laxmi Panwar13 have studied the maid servants in Hariana. The study emphasizes that they are leading a miserable life. They suffer from low wage, long hours of work, shift in nature of job, lack of freedom and low prestige due to inferior status of the job. Due to lack of coordination their children are neglected and familial relations becomes tense. The fragmented nature of their job, lack of education and low bargaining capacity refrain them from organizing collectively.

According to the Report on Working Condition of Domestic Servants in Delhi by the Ministry of Labour, Government of India, nearly 90 per cent of domestic workers are women14. According to the National Survey conducted by the School of Social Work15, women constituted 87.09 per cent of domestic workers in Karnataka, 82.38 per cent on Ranchi, 75 per cent in Kerala and 90.78 per cent in Andra Pradesh. The domestic workers face various problems and one of them is deplorable wage level. The wages of domestic workers have not kept pace with the spiraling price-rise. Every price rise cuts their real wage and further nutritional deficiency for them. The studies16 conducted in Bombay and Pune indicate that women domestic workers are often the sole supporters of their family. According to National Survey conducted by the School of Social Work17, in Calcutta only 6 per cent of the workers had made some contract with the employers, while, in other regions, it is a mere 1 to 2 per cent. The contract is made with a third party of agent and so the exploitation runs beyond the employer-employee relationship. According to the survey, in domestic service rest is considered a luxury by the employers and this problem has serious consequences on her health. The National Survey commence that though hours of work were regularized in Kerala, 76 per cent of its workers did not enjoy any holidays. A study of women domestics in Delhi18 indicates that women do not go to hospital due to fear of the hospital and long delays there. Most of the women hold a number of jobs and time is of great value to them. Dhanalakshmi19 pointed out some general issues concerning women in labour market. The issues include the segregation of women in to certain occupation, wage differentials between men and women for the same job, low and falling work participation rates of women etc. She made an attempt to study the domestic servants in Thiruvanathapuram city. The socio economic conditions of domestic servants and the need of servants in city have been studied. According to Padmini20, of all services in India, there is not a more unregulated or disorganized form of work than the domestic service. There are no regulated hours of work for women in domestic service, nor have laws been passed to protect them. Murugaiah21 has analysed occupational risk of domestic servants in Tirupathi selection grade Municipality in Andra Pradesh. The risk areas include high level of insecurity deplorable wages, long working hours etc. 1 .2 Definition of Domestic Servants : It is very difficult to define the term “domestic” because it is very vague. The term “domestic” denotes a class of “menials” which includes many types of workers, like ayah, kitchen helper, cook and sweeper. So we would define the term Domestic Servants as “those servants who do cooking, care the children, cleaning utensils, washing clothes, cleaning and sweeping the houses in return for the payment of wages”.
There are two types of domestic servants – Part-time servants and full-time servants. Part-time servants are, those who are employed at one or more than one house to perform some definite duties and go away when the assigned work is over. They are not residential helpers. Full- time servants are attached to one house only. They are present for the whole day at employer’s house and do whatever work is assigned to them. 1.3 Significance of the Study The 51st round survey of NSSO reveals that the number of women regular employees in urban area is 10 times those in Rural areas. Also the regular women work force in urban area has been increased by 15 per cent over the period from 1977 to 199522. So we can argue that the rapid process of urbanization led to such an increase in the number of urban work force. A substantial number of women in rural areas have little skills and practically no education. One of the low-ranking occupations assigned to the poorest classes of society is “domestic service’. Employment of servants has become very common in the urban areas of any cities where a large number of house wives going out for jobs. The employment of servants saves much of the time and energy for the working house wives of modern cities. Domestic servants have proved to be a necessity for non-working housewives also. In urban areas, they commonly engaged domestic servants to keep them in carrying out their household chores, partly due to physical inability and partly due to lack of time. Moreover, in nuclear families there is no stand-by in the family, if the housewife falls ill. Also we can argue that the new middle classes have developed a life style which has increased the demand for domestic servants. Thus the maid servant employed in household labour are playing a significant role especially in small towns of India. It is difficult to gauge the exact number of women in the occupation, as workers in the category have not been enumerated as such by the census. However, some studies bring about the information regarding the domestic servants in different parts of our country. Human Resources Development Report points out some common problems faced by the domestic servants which are; Deplorable wages High level of insecurity Illiteracy and lack of marketable skills, Lack of confidence in securing other productive jobs, Long and unregulated working hours. No paid holidays No paid sick leave Immense work load No maternity benefits Health problems and Social exploitation

Also elements of stigma of degradation is very much there is in this occupation. This stigma is the main reason for lack of standardization. Domestic service in our country is individualistic and unorganized to a certain extent and gives no norms to the workers who take it up. NGOs have an important role in creating economic organizations for them. SEWA has helped their members to form economic organizations and find a wide variety of organizational forms depending on the area, the activity and the capacity of the members. But, in our country only very few domestic workers come under such organizations. Under this situation, there arises certain questions such as what sort of people engaged in domestic service relations? What is the background of employers and domestic servants? And which are the socio economic factors responsible for choosing this occupation and thus earning low wage income? No more studies have been made to analyse the socio economic status of domestic women servants and problems faced by them. The present study is an attempt on that way. 1 .4 Objectives of the Study The specific objectives of the study are : To analysis the socio economic profile of the domestic women servants To understand their occupation structure and wage structure To examine the social problems being faced by them To examine their working back ground and the type of contact made by the employers to make the service of domestic servants available. Data and Methodology (A) Data:- The study was based on primary data collected from the domestic servants by direct interview. A schedule had been prepared by including the questions regarding their socio-economic factors. Fifty women servants were selected from Corporation area by purposive sampling method. Since the secondary information regarding the servants was not available and this was a pilot study, we depended on purposive sampling method. (B) Methodology: Simple arithmetic tools like percentage, average etc. have been used throughout the study. Chi-square test has been executed for examining the association between wage rate and education, wage rate and age, wage rate and experience etc.

To analyse the significant of variables like age, education, marital status, experience in domestic service and health status on monthly income of servants, regression model has been fitted. The specification of the model is: Yi = B0 + B1 X1i + B2 X2i + B3 X3i + B4 X4i + B 5 X5i + U I Where Yi = Monthly income X1i = Age X2i = Education X3i = Marital status X4i = Experience in domestic service X5i = Health status U i = Random disturbance term. 1.6 Limitations of the Study : Since it was a pilot study, an efficient sampling method had not been adopted. By purposive sampling, it was difficult to get a true representative sample. We could trace only 12 full-time servants out of 50 and migrant servants could not be found out. Also it suffers from the usual drawbacks of primary data. 1.7 Plan of the study : The study consisted of three chapters. The first being an introductory one gives a preface to our study. It consists of review of literature, importance of the study, objectives of the study, data and methodology, limitations etc. The second Chapter provides socio-economic profile of the domestic servants. It tries to analyse the socio economic conditions of both full-time and part-time servants. The third Chapter presents summary and conclusion of the study.
REFERENCES
1. D.P.Sing Mor, “Women and the Unorganized sector” Social
Welfare Vol-48, No.9, (2001)
2. T.Haque, “Labour Employment and Human Development in South Asia” Issues Concerning Employment of Women in South Asia, Edited by Asoka Chanda, Horst Mund, Tripurari Sharan and C.P.Thakur, B.R.Publishing Corporation for Institute for Human Devlopment.
3. Nirmala Banerjee, “Women in Emerging Labour Market”, Indian
Journal of Labour Economics, Vol.42, No.4 (1999)
4. Dr. Jaya Arunachalam, “Women in the informal Sector – Need for Policy Options”, Social Welfare, Vol.44, No.5 (1997)
5. Dr. Sathya Sundaram: Unorganised Women Labour In India,
S.N.Tripathy (Ed.), Discovery Publishing House, New Delhi, (1996)
6. Susan Bullock, “Women and Work” Zed Books Ltd, London
(1994)
7. Atanu Thakar, “A Post Modernist Enquiry into Women’s Work Force Participation”, The Indian Journal of Labour Economics, Vol.42, No.4 (1999)
8. Sandra Rothboeck and Sarthi Acharya, “Gender Based Segregation
in the Indian Labour Market”, The Indian Journal of Labour Economics, Vol. 42, No.4(1999)
9. Nirmala Banerjee, “Women Workers in the Unorganised Sector –
The Calcutta Experience, Sangham Books Pvt. Limited, Hyderabad (1985)
10. Leela Gulati: “Women in the Unorganized Sector with special reference to Kerala, C.D.S.W.P. No.172.
-14-
11. Jeemol Unni and Uma Rani, “Informal sector Women in the emerging labour Market”, the Indian Journal of Labour Economics, Vol.42, No: 4 (1999)
12. Annelies Moors and Ratna Saptari, CLARA workshop Report:
Domestic Service and Mobility, Agenda, (2002) Publications General
13. Balgovind Baboo and Laxmi Panwar, “Maid servants: A Case
Study in Haryana” Mainstream, Vol 23 No:1 (1984)
14. Dept. of Women and Child Development, Ministry of Human Resources Development, “Occupational Health Issues of Women in the Unorganized Sector”. Report of the Task Force on Health (1988)
15. A National Socio – Economic Survey of Domestic Workers;
School of Social Work, Roshini Nilaya , Research Department, Mangalore (undated)
16. ibid
17. Bhise Lata and Bhonsle Leela: “A sign of things to come”,
Manushi, May-June, New Delhi (1980)
18. Das Guptha Aparna, Profile of Women dwelling in the slums of New Delhi,PIDIT New Delhi (1980)
19. S.Dhanalakshmi, “Women in the Informal Labour Market – A case
study of Domestic Servants in Thiruvananthapuram city”, M Phil. Dissertation, Kerala University (1988)
20. Padmini Senguptha, Women Workers of India, Asia Publishing
House, Bombay (1960)
21. Dr.K.Murugaiah, “Women Domestic Workers” Social Welfare, Vol.49, No:2 (2002)
22. NSS 54th Round, Survey Results on Cultivation Practices in India,
Sarverkshana, 24 (1), 84th issue, July-September (2000)
-15-
CHAPTER 2
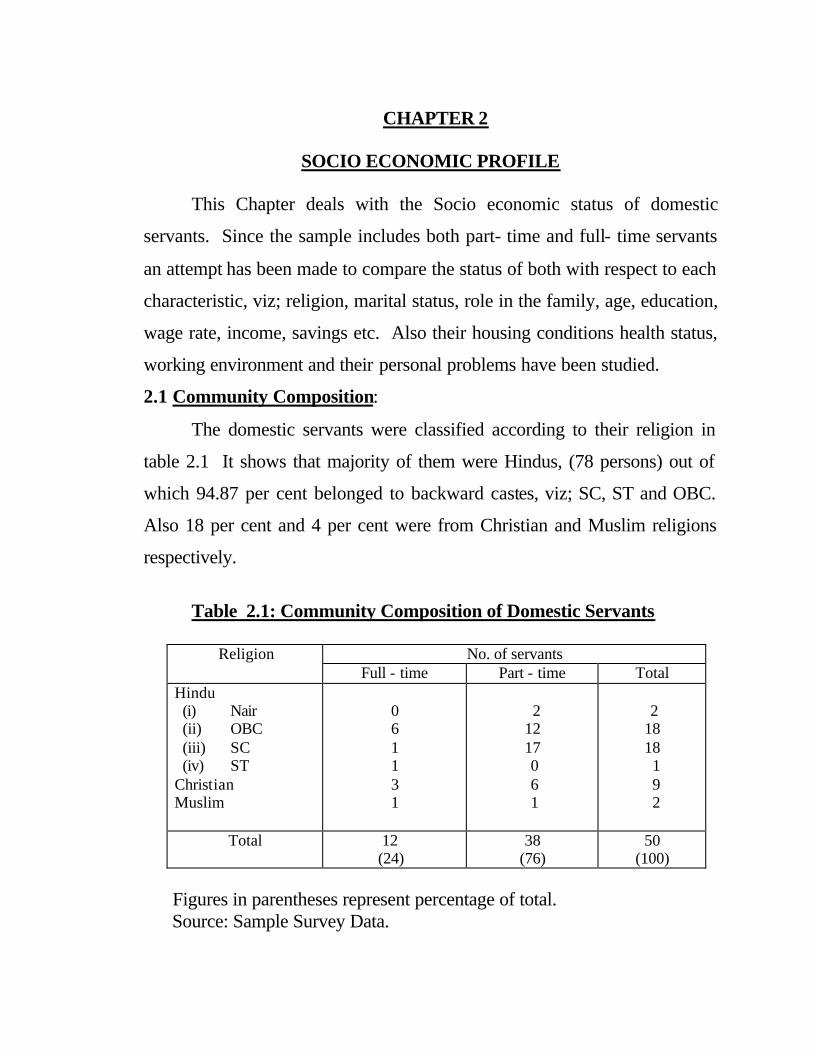
SOCIO ECONOMIC PROFILE This Chapter deals with the Socio economic status of domestic
servants. Since the sample includes both part- time and full- time servants
an attempt has been made to compare the status of both with respect to each
characteristic, viz; religion, marital status, role in the family, age, education,
wage rate, income, savings etc. Also their housing conditions health status,
working environment and their personal problems have been studied.
2.1 Community Composition:
The domestic servants were classified according to their religion in
table 2.1 It shows that majority of them were Hindus, (78 persons) out of
which 94.87 per cent belonged to backward castes, viz; SC, ST and OBC.
Also 18 per cent and 4 per cent were from Christian and Muslim religions
respectively.
Table 2.1: Community Composition of Domestic Servants
No. of servants Religion
Full - time Part - time Total Hindu (i) Nair (ii) OBC (iii) SC (iv) ST
Christian Muslim
0 6 1 1 3 1
2 12 17 0 6 1
2 18 18 1 9 2
Total
12 (24)
38 (76)
50 (100)
Figures in parentheses represent percentage of total. Source: Sample Survey Data.
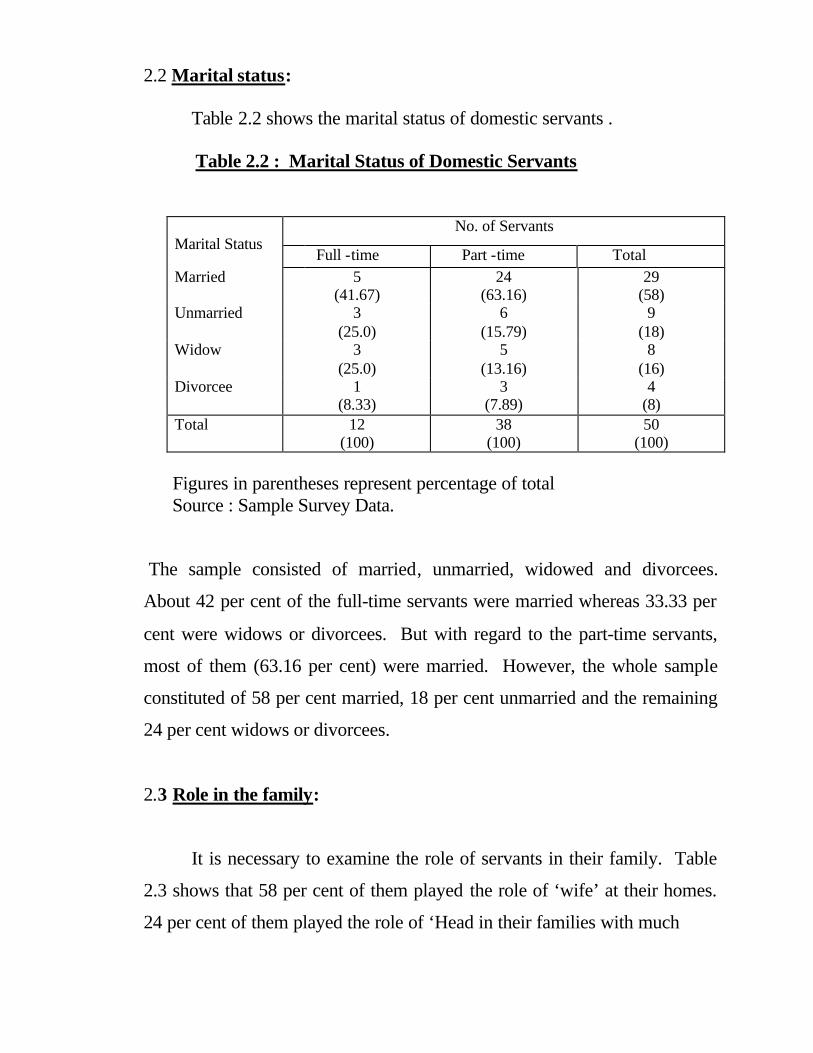
2.2 Marital status: Table 2.2 shows the marital status of domestic servants . Table 2.2 : Marital Status of Domestic Servants
No. of Servants Marital Status
Full -time Part -time Total Married 5
(41.67) 24
(63.16) 29
(58) Unmarried 3
(25.0) 6
(15.79) 9
(18) Widow 3
(25.0) 5
(13.16) 8
(16) Divorcee 1
(8.33) 3
(7.89) 4
(8) Total 12
(100) 38
(100) 50
(100) Figures in parentheses represent percentage of total Source : Sample Survey Data. The sample consisted of married, unmarried, widowed and divorcees.
About 42 per cent of the full-time servants were married whereas 33.33 per
cent were widows or divorcees. But with regard to the part-time servants,
most of them (63.16 per cent) were married. However, the whole sample
constituted of 58 per cent married, 18 per cent unmarried and the remaining
24 per cent widows or divorcees.
2.3 Role in the family:
It is necessary to examine the role of servants in their family. Table
2.3 shows that 58 per cent of them played the role of ‘wife’ at their homes.
24 per cent of them played the role of ‘Head in their families with much
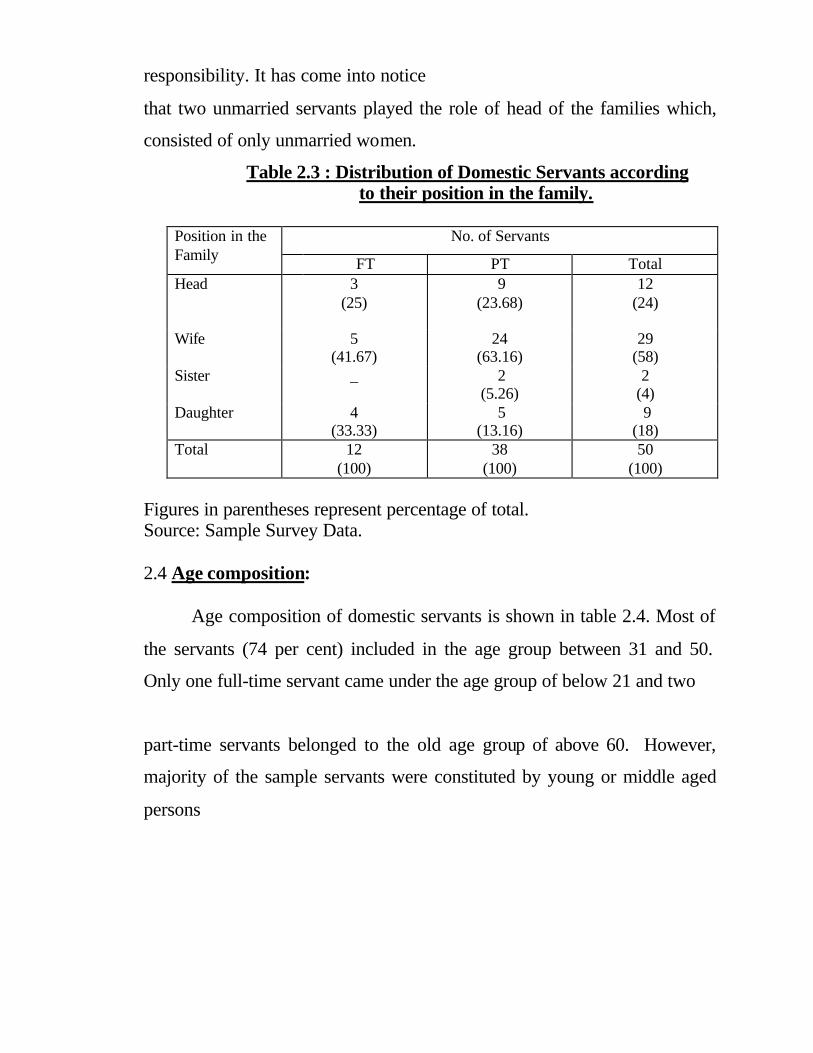
responsibility. It has come into notice
that two unmarried servants played the role of head of the families which,
consisted of only unmarried women.
Table 2.3 : Distribution of Domestic Servants according to their position in the family.
No. of Servants Position in the Family FT PT Total Head 3
(25) 9
(23.68) 12
(24)
Wife 5 (41.67)
24 (63.16)
29 (58)
Sister _ 2 (5.26)
2 (4)
Daughter 4 (33.33)
5 (13.16)
9 (18)
Total 12 (100)
38 (100)
50 (100)
Figures in parentheses represent percentage of total. Source: Sample Survey Data. 2.4 Age composition: Age composition of domestic servants is shown in table 2.4. Most of
the servants (74 per cent) included in the age group between 31 and 50.
Only one full-time servant came under the age group of below 21 and two
part-time servants belonged to the old age group of above 60. However,
majority of the sample servants were constituted by young or middle aged
persons
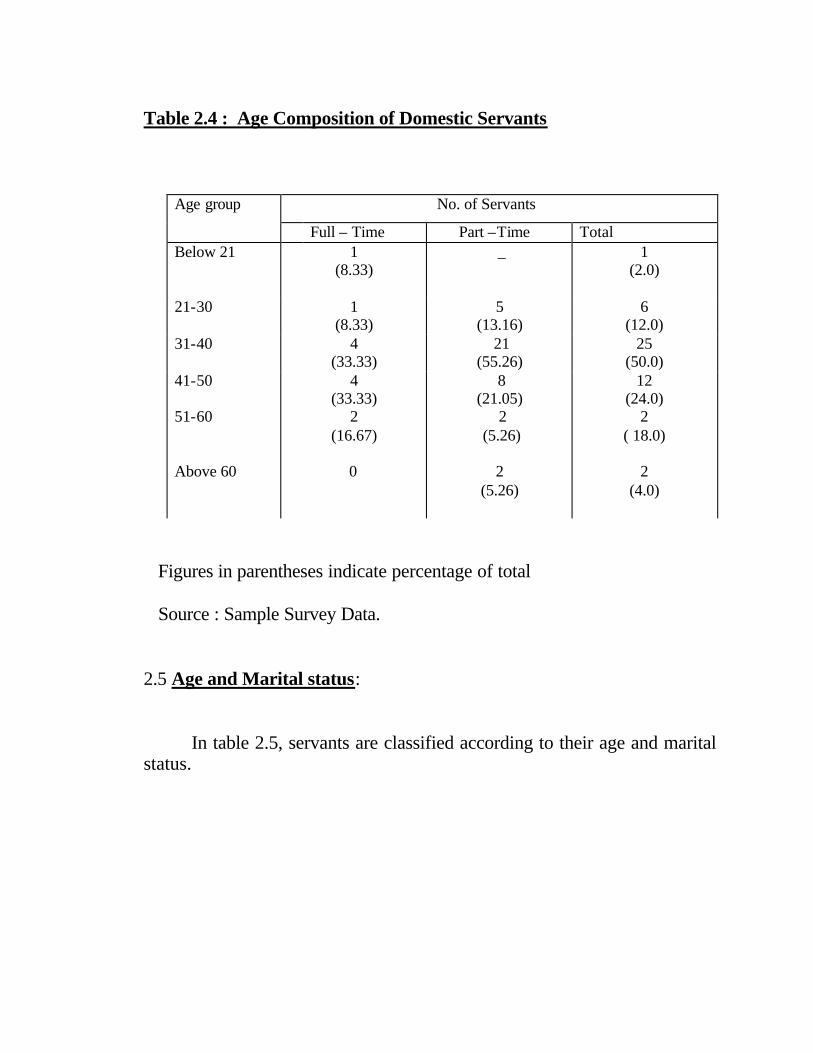
Table 2.4 : Age Composition of Domestic Servants
Figures in parentheses indicate percentage of total Source : Sample Survey Data. 2.5 Age and Marital status: In table 2.5, servants are classified according to their age and marital status.
No. of Servants Age group
Full – Time Part –Time Total Below 21 1
(8.33) _ 1
(2.0)
21-30 1 (8.33)
5 (13.16)
6 (12.0)
31-40 4 (33.33)
21 (55.26)
25 (50.0)
41-50 51-60 Above 60
4 (33.33)
2 (16.67)
0
8 (21.05) 2 (5.26)
2
(5.26)
12 (24.0)
2 ( 18.0)
2
(4.0)
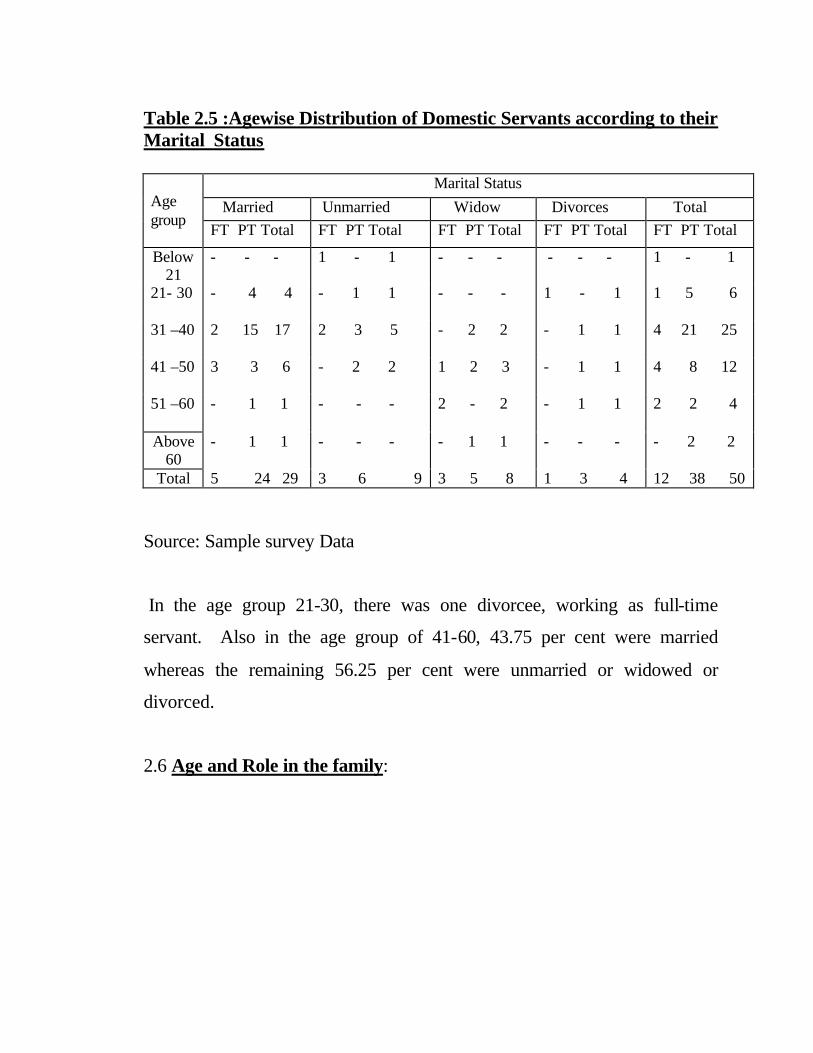
Table 2.5 :Agewise Distribution of Domestic Servants according to their Marital Status
Marital Status Married Unmarried Widow Divorces Total
Age group FT PT Total FT PT Total FT PT Total FT PT Total FT PT Total
Below 21
- - - 1 - 1 - - - - - - 1 - 1
21- 30
- 4 4 - 1 1 - - - 1 - 1 1 5 6
31 –40
2 15 17 2 3 5 - 2 2 - 1 1 4 21 25
41 –50
3 3 6 - 2 2 1 2 3 - 1 1 4 8 12
51 –60
- 1 1 - - - 2 - 2 - 1 1 2 2 4
Above 60
- 1 1 - - - - 1 1 - - - - 2 2
Total 5 24 29 3 6 9 3 5 8 1 3 4 12 38 50 Source: Sample survey Data In the age group 21-30, there was one divorcee, working as full-time
servant. Also in the age group of 41-60, 43.75 per cent were married
whereas the remaining 56.25 per cent were unmarried or widowed or
divorced.
2.6 Age and Role in the family:
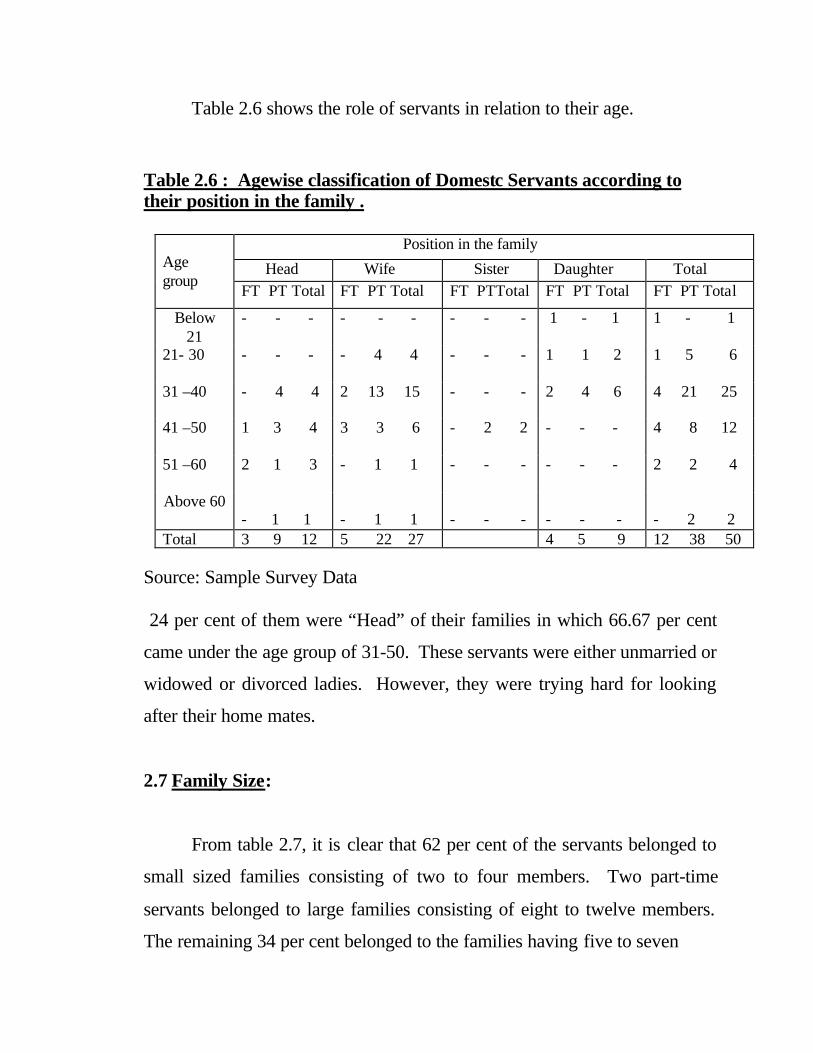
Table 2.6 shows the role of servants in relation to their age.
Table 2.6 : Agewise classification of Domestc Servants according to their position in the family .
Position in the family
Head Wife Sister Daughter Total
Age group FT PT Total FT PT Total FT PTTotal FT PT Total FT PT Total
Below 21
- - - - - - - - - 1 - 1 1 - 1
21- 30
- - - - 4 4 - - - 1 1 2 1 5 6
31 –40
- 4 4 2 13 15 - - - 2 4 6 4 21 25
41 –50
1 3 4 3 3 6 - 2 2 - - - 4 8 12
51 –60
2 1 3 - 1 1 - - - - - - 2 2 4
Above 60 - 1 1
- 1 1
- - -
- - -
- 2 2
Total 3 9 12 5 22 27 4 5 9 12 38 50 Source: Sample Survey Data 24 per cent of them were “Head” of their families in which 66.67 per cent
came under the age group of 31-50. These servants were either unmarried or
widowed or divorced ladies. However, they were trying hard for looking
after their home mates.
2.7 Family Size:
From table 2.7, it is clear that 62 per cent of the servants belonged to
small sized families consisting of two to four members. Two part-time
servants belonged to large families consisting of eight to twelve members.
The remaining 34 per cent belonged to the families having five to seven
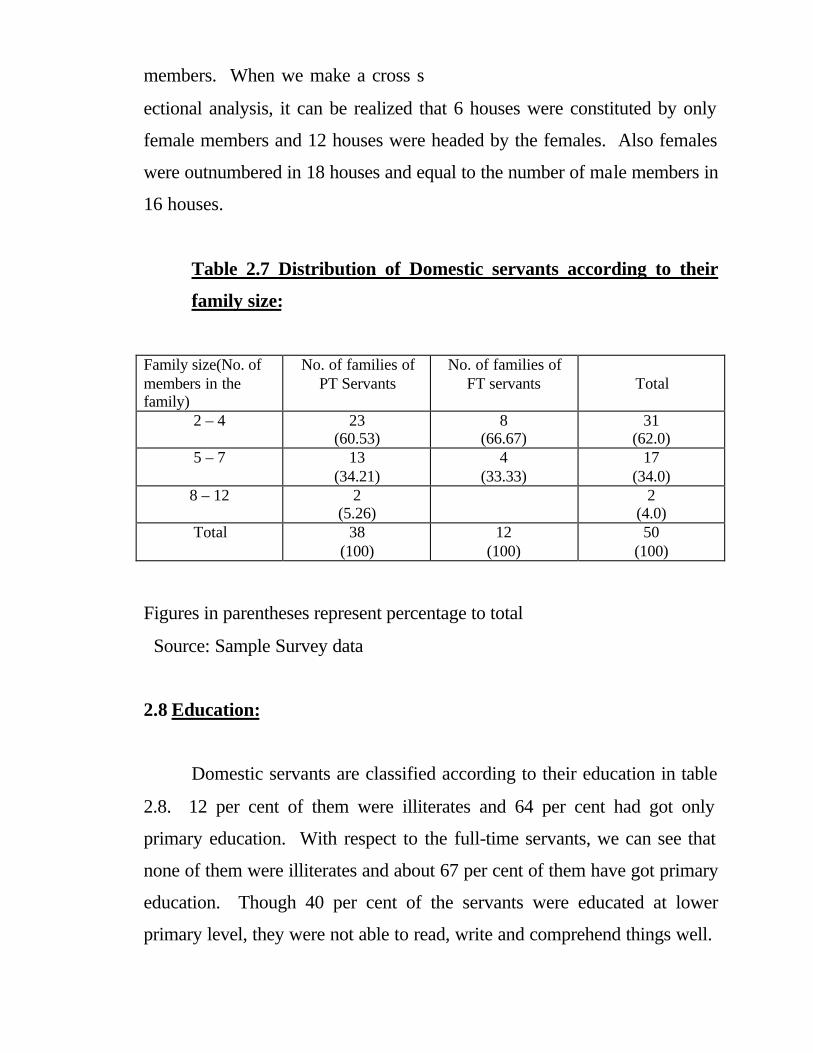
members. When we make a cross s
ectional analysis, it can be realized that 6 houses were constituted by only
female members and 12 houses were headed by the females. Also females
were outnumbered in 18 houses and equal to the number of male members in
16 houses.
Table 2.7 Distribution of Domestic servants according to their
family size:
Family size(No. of members in the family)
No. of families of PT Servants
No. of families of FT servants
Total
2 – 4 23 (60.53)
8 (66.67)
31 (62.0)
5 – 7 13 (34.21)
4 (33.33)
17 (34.0)
8 – 12 2 (5.26)
2 (4.0)
Total 38 (100)
12 (100)
50 (100)
Figures in parentheses represent percentage to total
Source: Sample Survey data
2.8 Education:
Domestic servants are classified according to their education in table
2.8. 12 per cent of them were illiterates and 64 per cent had got only
primary education. With respect to the full-time servants, we can see that
none of them were illiterates and about 67 per cent of them have got primary
education. Though 40 per cent of the servants were educated at lower
primary level, they were not able to read, write and comprehend things well.
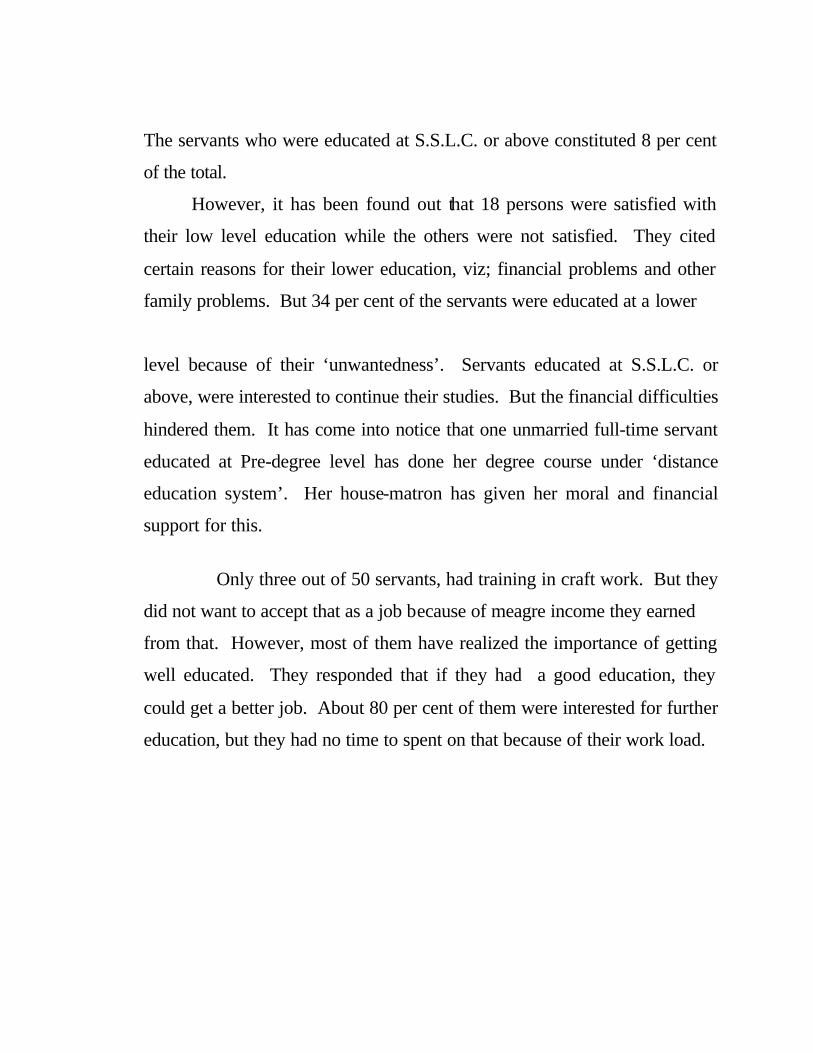
The servants who were educated at S.S.L.C. or above constituted 8 per cent
of the total.
However, it has been found out that 18 persons were satisfied with
their low level education while the others were not satisfied. They cited
certain reasons for their lower education, viz; financial problems and other
family problems. But 34 per cent of the servants were educated at a lower
level because of their ‘unwantedness’. Servants educated at S.S.L.C. or
above, were interested to continue their studies. But the financial difficulties
hindered them. It has come into notice that one unmarried full-time servant
educated at Pre-degree level has done her degree course under ‘distance
education system’. Her house-matron has given her moral and financial
support for this.
Only three out of 50 servants, had training in craft work. But they
did not want to accept that as a job because of meagre income they earned
from that. However, most of them have realized the importance of getting
well educated. They responded that if they had a good education, they
could get a better job. About 80 per cent of them were interested for further
education, but they had no time to spent on that because of their work load.
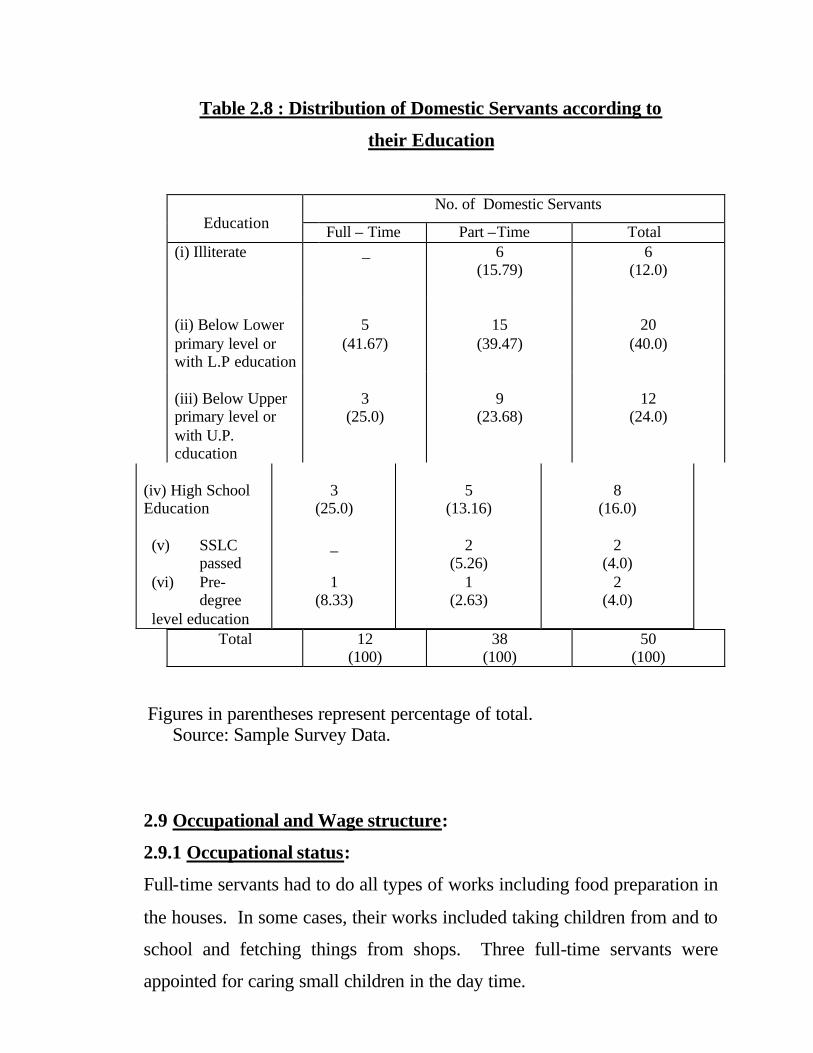
Table 2.8 : Distribution of Domestic Servants according to
their Education
(iv) High School Education (v) SSLC
passed (vi) Pre-
degree level education
3
(25.0) _ 1
(8.33)
5
(13.16) 2
(5.26) 1
(2.63)
8
(16.0) 2
(4.0) 2
(4.0)
Figures in parentheses represent percentage of total. Source: Sample Survey Data. 2.9 Occupational and Wage structure:
2.9.1 Occupational status:
Full-time servants had to do all types of works including food preparation in
the houses. In some cases, their works included taking children from and to
school and fetching things from shops. Three full-time servants were
appointed for caring small children in the day time.
No. of Domestic Servants Education Full – Time Part –Time Total
(i) Illiterate
_
6 (15.79)
6 (12.0)
(ii) Below Lower primary level or with L.P education
5
(41.67)
15
(39.47)
20
(40.0)
(iii) Below Upper primary level or with U.P. cducation
3
(25.0)
9
(23.68)
12
(24.0)
Total 12 (100)
38 (100)
50 (100)
With regard to the part-time
servants, they had to do the work such as cleaning the house, washing
clothes, cleaning bath rooms, washing utensils, fetching articles from the
shops etc. All part-time servants in the sample were doing almost all works
excluding kitchen work in the houses. So we could not classify them
according to the nature of their works.
Most of the part-time servants (84.21 per cent) had served in more
than one house in a day. About 63 per cent of them had worked in two or
three homes daily. There were 21 per cent of the servants who had worked
in 4 or 5 houses daily. This is clear from table 2.9.
Table 2.9 : Distribution of Part – time Domestic Servants according to the number of houses they serve per day
No. of Houses per day No. of part –time Servants
1 2 3 4 5
6 13 11 5 3
Total 38
Source: Sample Survey Data.
For getting a specific picture of their work load it is necessary to
classify them according to their working hours per day. Table 2.10 shows
that the full-time servants were working 6 to 10 hours daily. But the part-
time servants worked 2 to 10 hours per day, in which about 75 per cent of
them were working 4 to 8 hours daily.
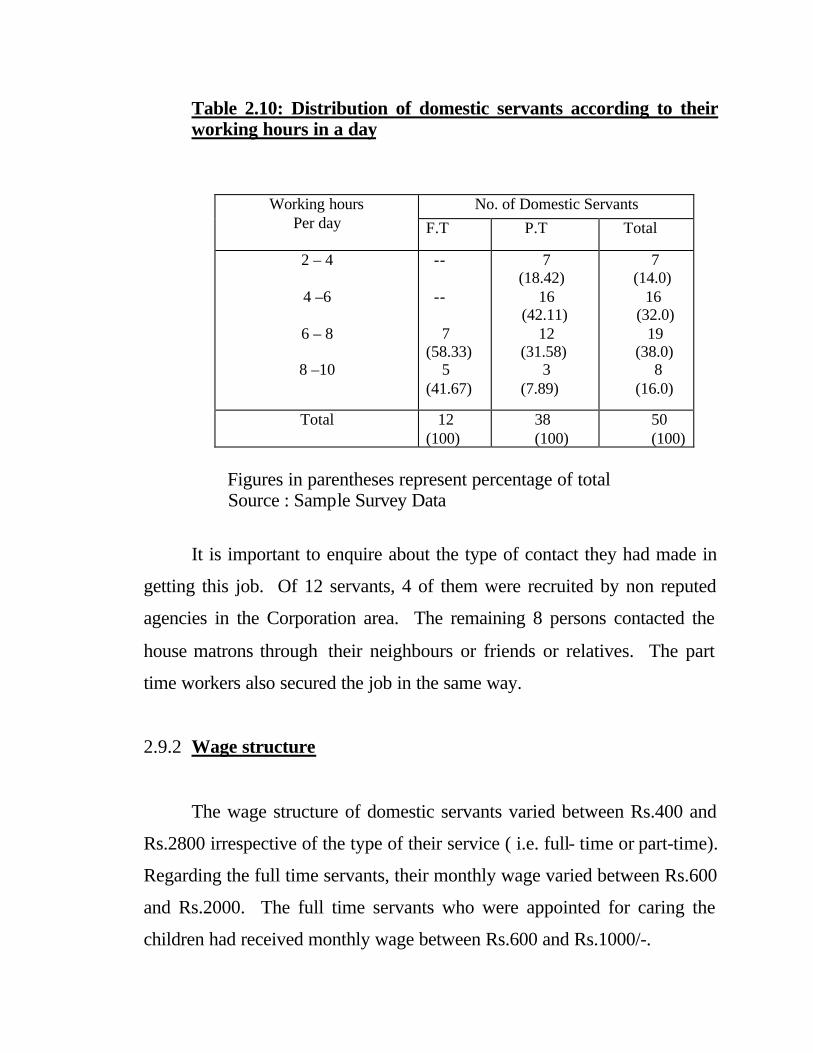
Table 2.10: Distribution of domestic servants according to their working hours in a day
No. of Domestic Servants Working hours
Per day
F.T P.T Total
2 – 4
4 –6
6 – 8
8 –10
-- -- 7 (58.33) 5 (41.67)
7 (18.42)
16 (42.11)
12 (31.58)
3 (7.89)
7 (14.0) 16 (32.0)
19 (38.0)
8 (16.0)
Total
12 (100)
38 (100)
50 (100)
Figures in parentheses represent percentage of total Source : Sample Survey Data
It is important to enquire about the type of contact they had made in
getting this job. Of 12 servants, 4 of them were recruited by non reputed
agencies in the Corporation area. The remaining 8 persons contacted the
house matrons through their neighbours or friends or relatives. The part
time workers also secured the job in the same way.
2.9.2 Wage structure
The wage structure of domestic servants varied between Rs.400 and
Rs.2800 irrespective of the type of their service ( i.e. full- time or part-time).
Regarding the full time servants, their monthly wage varied between Rs.600
and Rs.2000. The full time servants who were appointed for caring the
children had received monthly wage between Rs.600 and Rs.1000/-.
Four servants recruited by
agencies received Rs.1500 as monthly wage. These servants had been
exploited by the agencies. The house matron reported that they had to pay
Rs.2250 per month to the agency for getting service of their recruits. But the
servants had been getting only Rs.1500 per month, but some times that was
not regular. Some agencies acted as the exclusive guardians of their recruits
and they used to mortgage the ornaments of servants. Personal contact
between these servants and house matrons was comparatively low. Though
the other full time servants had received an amount of less than 1500 rupees
as their monthly wage, the love, consideration and the gifts and helps from
house matrons were large.
Regarding the part time servant they secured a monthly wage in the
range of Rs.400 to Rs.2500.
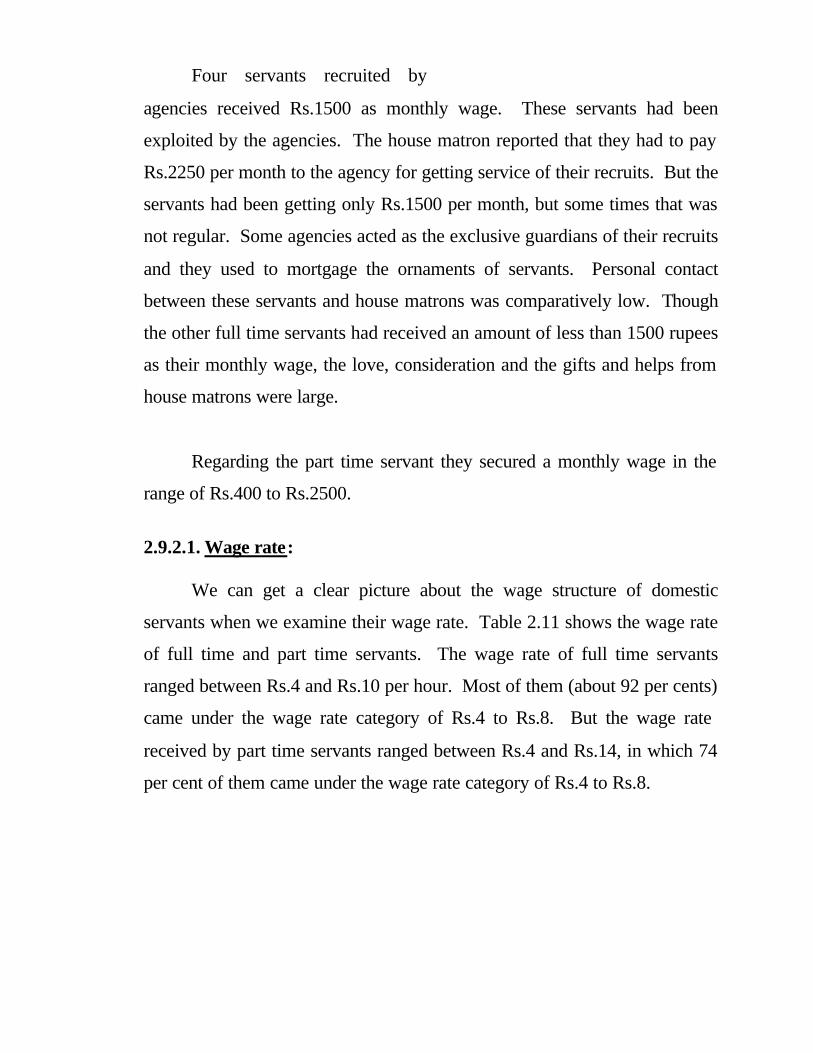
2.9.2.1. Wage rate: We can get a clear picture about the wage structure of domestic
servants when we examine their wage rate. Table 2.11 shows the wage rate
of full time and part time servants. The wage rate of full time servants
ranged between Rs.4 and Rs.10 per hour. Most of them (about 92 per cents)
came under the wage rate category of Rs.4 to Rs.8. But the wage rate
received by part time servants ranged between Rs.4 and Rs.14, in which 74
per cent of them came under the wage rate category of Rs.4 to Rs.8.
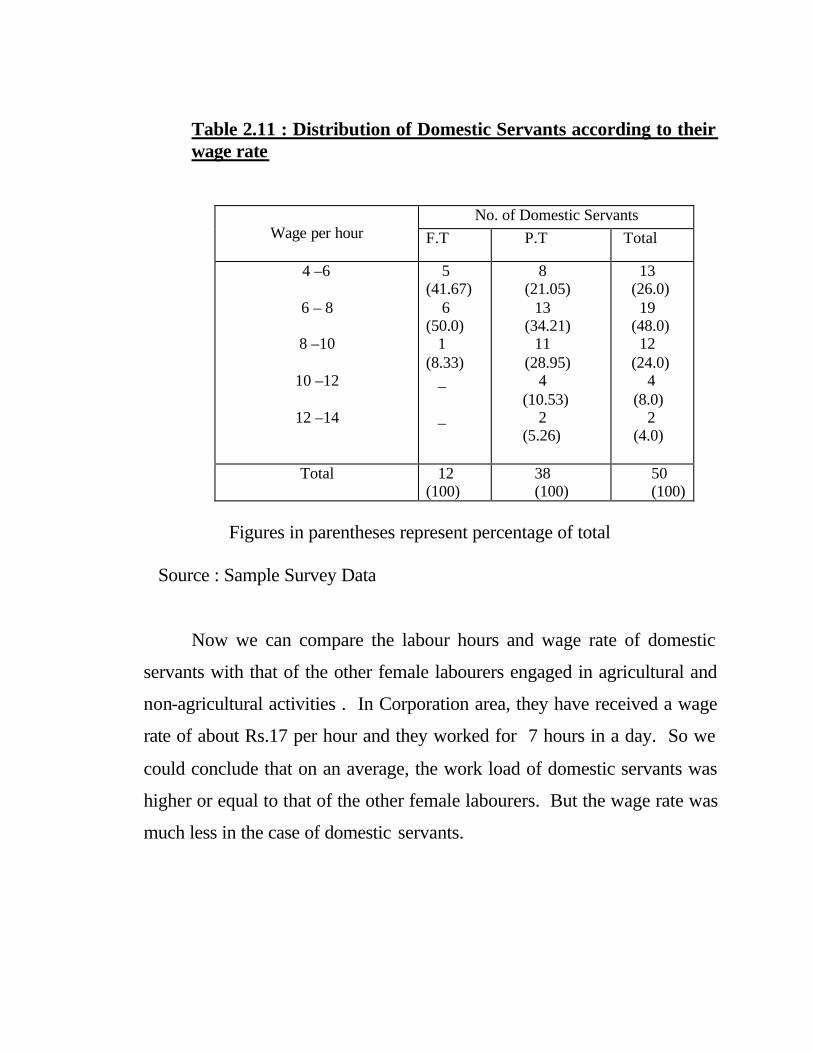
Table 2.11 : Distribution of Domestic Servants according to their wage rate
No. of Domestic Servants Wage per hour
F.T P.T Total
4 –6
6 – 8
8 –10
10 –12
12 –14
5 (41.67) 6 (50.0) 1 (8.33) _ _
8 (21.05)
13 (34.21)
11 (28.95)
4 (10.53)
2 (5.26)
13 (26.0) 19
(48.0) 12
(24.0) 4
(8.0) 2
(4.0)
Total
12 (100)
38 (100)
50 (100)
Figures in parentheses represent percentage of total Source : Sample Survey Data Now we can compare the labour hours and wage rate of domestic
servants with that of the other female labourers engaged in agricultural and
non-agricultural activities . In Corporation area, they have received a wage
rate of about Rs.17 per hour and they worked for 7 hours in a day. So we
could conclude that on an average, the work load of domestic servants was
higher or equal to that of the other female labourers. But the wage rate was
much less in the case of domestic servants.
2.9.2.2. Experience in domestic service and wage rate.
Table 2.12 presents the distribution of domestic servants according to
their experience in this field. It reveals that 48 per cent of the servants had
an experience of 2 to 5 years in the domestic service. About 16 per cent of
the part time servants had a long experience of 11 and more than 11 years.
With regard to the full time servants, about 92 per cent of them had an
experience of less than 5 years.
Table 2.12 : Distribution of Domestic Servants according to their
experience in Domestic Service
No. of Domestic Servants Experience in years
F.T P.T Total
Less than 2 years
2 - 5 5 - 8
8 - 11
11 & More
than 11 years
5 (41.67) 6 (50.0) 1 (8.33) _ --
--
18
(47.37) 9
(23.68) 5
(13.16) 6
(15.79)
5
(10.0) 24
(48.0) 10
(20.0) 5
(10.0) 6
(12.0)
Total
12 38 50
Figures in parentheses indicate percentage of total
Source : Sample Survey Data
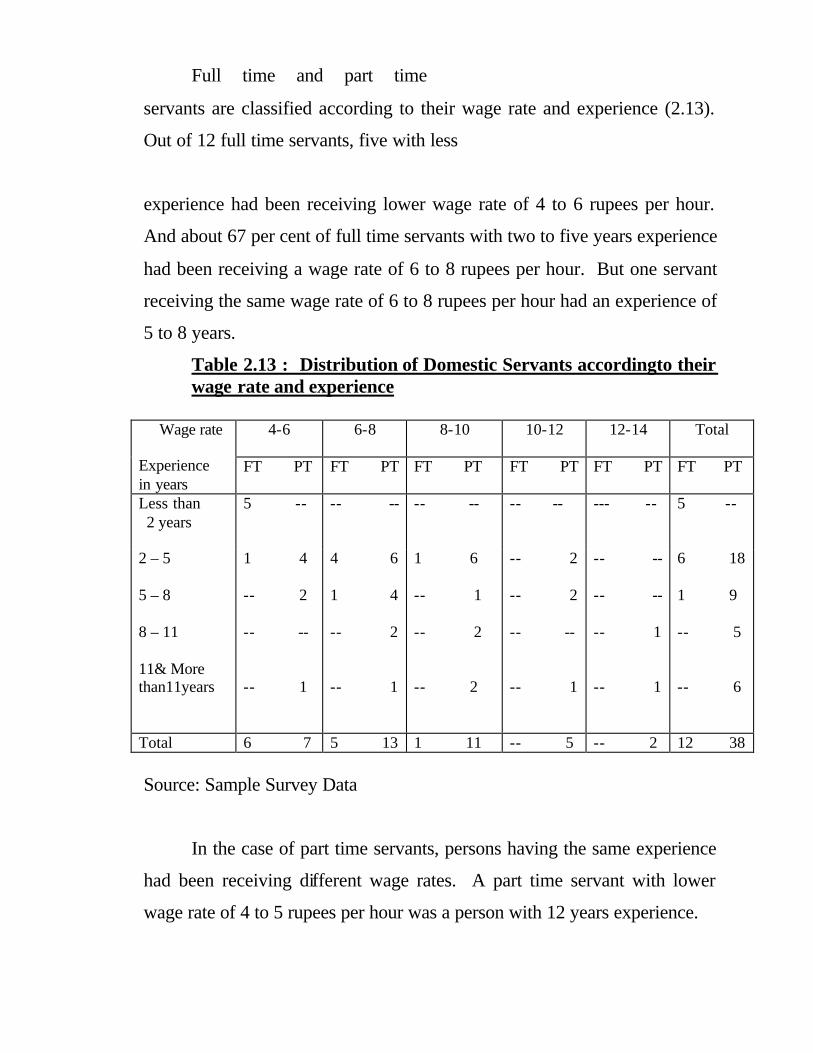
Full time and part time
servants are classified according to their wage rate and experience (2.13).
Out of 12 full time servants, five with less
experience had been receiving lower wage rate of 4 to 6 rupees per hour.
And about 67 per cent of full time servants with two to five years experience
had been receiving a wage rate of 6 to 8 rupees per hour. But one servant
receiving the same wage rate of 6 to 8 rupees per hour had an experience of
5 to 8 years.
Table 2.13 : Distribution of Domestic Servants accordingto their wage rate and experience
4-6
6-8 8-10 10-12 12-14 Total Wage rate
Experience in years
FT PT FT PT FT PT
FT PT FT PT FT PT
Less than 2 years
5 -- -- -- -- -- -- -- --- -- 5 --
2 – 5 5 – 8 8 – 11 11& More than11years
1 4 -- 2 -- -- -- 1
4 6 1 4 -- 2 -- 1
1 6 -- 1 -- 2 -- 2
-- 2 -- 2 -- -- -- 1
-- -- -- -- -- 1 -- 1
6 18 1 9 -- 5 -- 6
Total 6 7 5 13 1 11 -- 5 -- 2 12 38 Source: Sample Survey Data
In the case of part time servants, persons having the same experience
had been receiving different wage rates. A part time servant with lower
wage rate of 4 to 5 rupees per hour was a person with 12 years experience.
However, to examine whether
here existed any association between these attributes wage rate and
experience chi-square test has been executed. The test was done by taking
the hypothesis that there is no association between experience and wage rate.
The value of chi-square statistic was 0.269, which is less than the table value
of chi-square at 5 percent level of significance and the hypothesis was
accepted . Hence it was found that there was no association between
experience and wage rate .
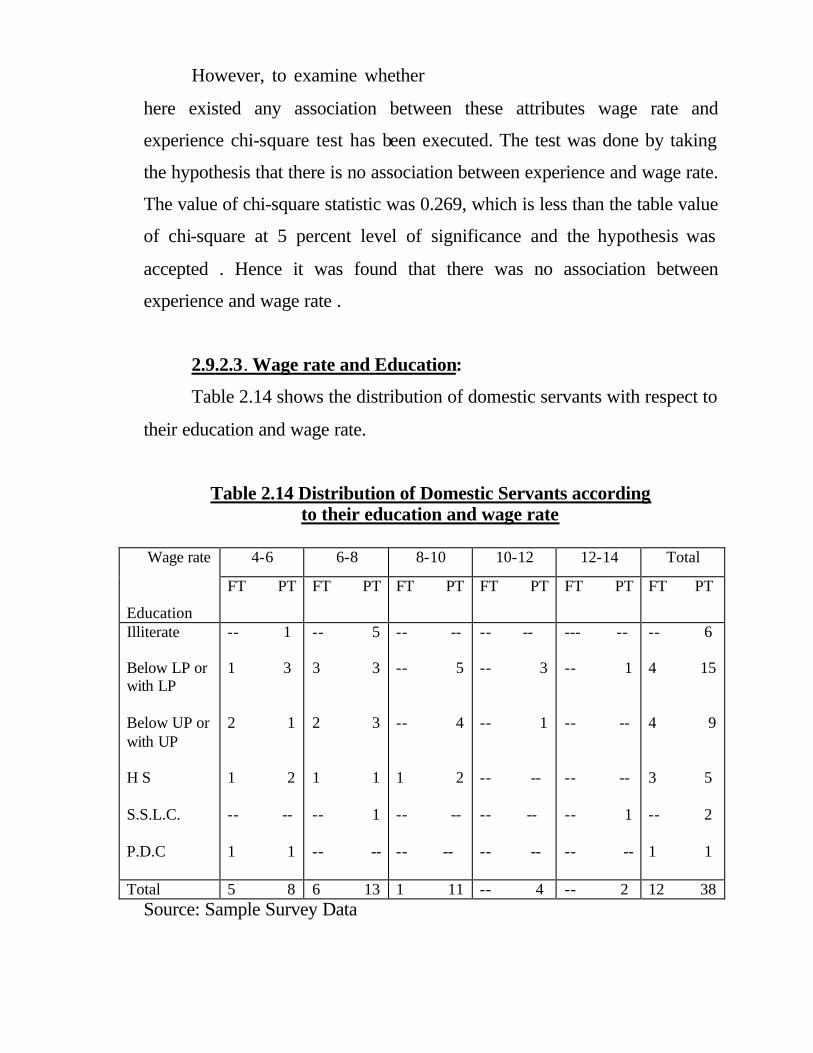
2.9.2.3. Wage rate and Education:
Table 2.14 shows the distribution of domestic servants with respect to
their education and wage rate.
Table 2.14 Distribution of Domestic Servants according to their education and wage rate
4-6 6-8 8-10 10-12 12-14 Total Wage rate
Education
FT PT FT PT FT PT
FT PT FT PT FT PT
Illiterate
-- 1 -- 5 -- -- -- -- --- -- -- 6
Below LP or with LP Below UP or with UP H S S.S.L.C. P.D.C
1 3 2 1 1 2 -- -- 1 1
3 3 2 3 1 1 -- 1 -- --
-- 5 -- 4 1 2 -- -- -- --
-- 3 -- 1 -- -- -- -- -- --
-- 1 -- -- -- -- -- 1 -- --
4 15 4 9 3 5 -- 2 1 1
Total 5 8 6 13 1 11 -- 4 -- 2 12 38 Source: Sample Survey Data
Of the 12 servants having
above high school level education, only 33.33 per cent of servants were
getting more than 8 rupees as their wage rate. At the same time, 43.75 per
cent of servants with primary education had got a wage rate of more than 8
rupees. The wage rate of illiterate servants was below 8 rupees per hour.
When we consider the full time servants, most of them (91.7 per cent)
came under the category of low wage rate (below rupees 8) irrespective of
their education level. Regarding the part-time servants, about 47 per cent of
them having primary education and 38 per cent with above high school
education had received higher wage rate.
The association between wage rate and education was tested using
chi-square statistic based on the hypothesis that there is no association
between these variables . The calculated value of chi-square was 0.99, which
was less than the table value of chi-square at 5 percent level of significance.
Hence the hypothesis was accepted.
29.2.4. Wage rate and Age:
It is necessary to assess the wage rate of servants in relation to their
age. Table 2.15 shows that 62.8 per cent of the total servants under the age
category of 21 to 50 years had got low wage rate of below 8 rupees per hour.
In the case of full-time servants, only one out of twelve came under the high
wage category of above 8 rupees per hour who was in the age group of 31 to
40 years. Regarding the part-time servants, 47 per cent of them in the age
group of 21 to 50 years got only low wage rate.

Here we took a hypothesis that age and wage rate were not associated
and chi-square statistics has been found out. The calculated chi-square value
was 0.99, which was less than the table value. Hence the hypothesis was
accepted and found that there was no association between these variables.
Table 2.15 Distribution of Domestic Servants according
to their age and wage rate
4-6 6-8 8-10 10-12 12-14 Total Wage rate Age FT PT FT PT FT PT
FT PT FT PT FT PT
Below 21
-- -- 1 -- -- -- -- -- -- -- 1 --
21- 30
31 - 40
41 - 50
51 - 60
Above 60
1 -- 1 6 2 2 1 -- -- --
-- 2 2 7 2 2 1 1 -- 1
-- 3 1 5 -- 2 -- -- -- 1
-- -- -- 2 -- 1 -- 1 -- --
-- -- -- 1 -- 1 -- -- -- --
1 5 4 21 4 8 2 2 -- 2
Total 5 8 6 13 1 11 -- 4 -- 2 12 38 Source: Sample Survey Data 2.9.3 Food for Work :
It was found that all of the full-time servants exclusively depended
upon their house matrons for food. Only a few of them (about 17 per cent)
had been getting nutrient food items from the houses while others were
offered low quality food. They were given food only after all members of
the house had taken food. Also their dining place was work area in most of
the cases.
But a very few part-time servants
had received their full day meal from the houses. Of the 38 part-time
servants, five of them had got full-day meal from the houses while another 5
had not received any food from the house matrons. The remaining 28
servants had received some light food items from their working places.
However, most of the part-time servants had responded that they were not
given nutrient food items from the houses.
2.9.4 Help or Gifts: The approach and consideration of house matrons to their servants can
be assessed from the information collected regarding the help or gifts that
the servants had received from the house matrons.
Full-time servants who had been appointed by the non-reported
agencies had not received any help or gifts. But those who secured the job
directly had received gifts on festival occasion and help in difficulties.
Some part-time servants (about 35 per cent) who had served their
matrons for 8 to 20 years reported that though their wage was not increased
much during their working period, their matrons were their soul supporters
in all respects. But 50 per cent of the part-time servants were not satisfied
with the approach of their house matrons to them. They hardly got help or
gifts from their masters. About 15 per cent of them complained that their
masters were not regular in paying wages to them.
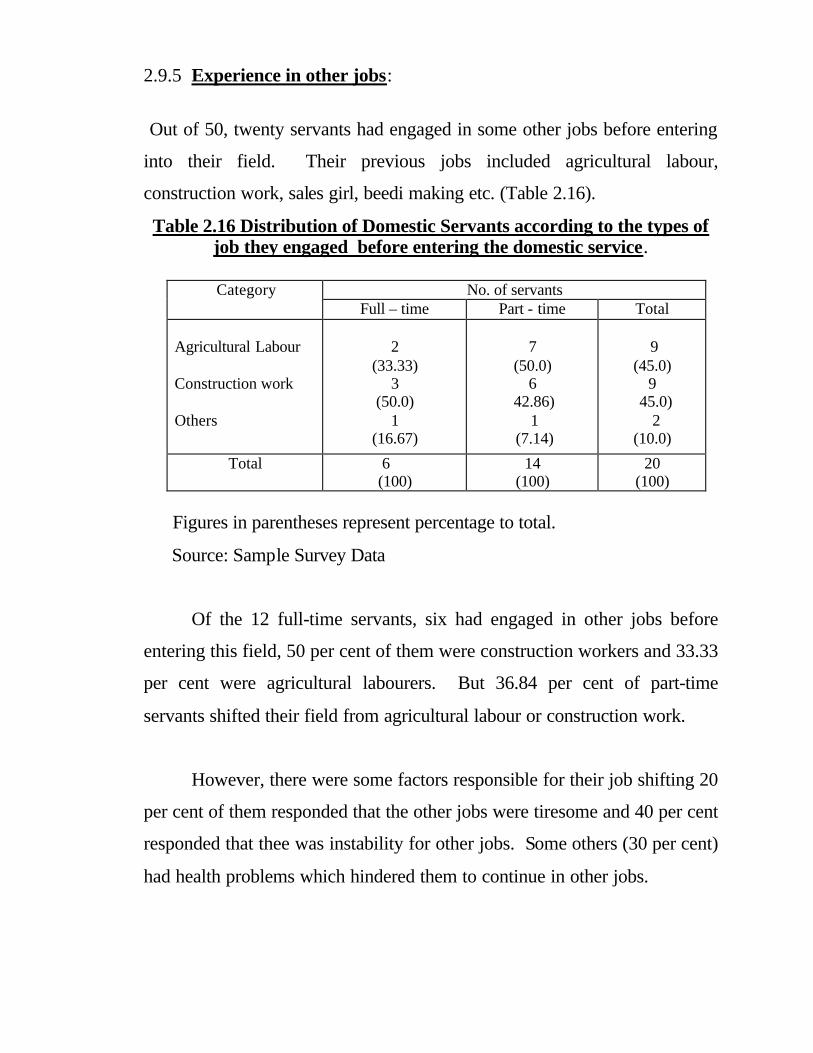
2.9.5 Experience in other jobs:
Out of 50, twenty servants had engaged in some other jobs before entering
into their field. Their previous jobs included agricultural labour,
construction work, sales girl, beedi making etc. (Table 2.16).
Table 2.16 Distribution of Domestic Servants according to the types of job they engaged before entering the domestic service.
No. of servants Category
Full – time Part - time Total Agricultural Labour Construction work Others
2
(33.33) 3
(50.0) 1
(16.67)
7
(50.0) 6
42.86) 1
(7.14)
9
(45.0) 9
45.0) 2
(10.0)
Total
6 (100)
14 (100)
20 (100)
Figures in parentheses represent percentage to total.
Source: Sample Survey Data
Of the 12 full-time servants, six had engaged in other jobs before
entering this field, 50 per cent of them were construction workers and 33.33
per cent were agricultural labourers. But 36.84 per cent of part-time
servants shifted their field from agricultural labour or construction work.
However, there were some factors responsible for their job shifting 20
per cent of them responded that the other jobs were tiresome and 40 per cent
responded that thee was instability for other jobs. Some others (30 per cent)
had health problems which hindered them to continue in other jobs.
2.9.6. Leave and Holidays:
About 54 per cent of the servant-maids responded that holidays upto 4
days in a month were given with full payment. Generally, employers cut
wages whenever the servants did not turn up for work, even when the
reasons were genuine, such as sickness, function in the house etc. In a few
cases, the servant-maids had sent substitutes whenever they fell to turn up.
Some times, continuous leave for one or two weeks led to the loss their job.
2.9.7.Working Environment:
The full-time servants recruited by agencies reported that they were
not satisfied with the working environment. In the case of two such
servants, there was some threat against their moral life. At the same time,
the part-time servants were some more free to choose a secured environment
as their work place.
About 70 per cent of the house matrons were employees either in
government sector or in reputed firms. They appointed servants for getting
them rest and saving time. But 20 per cent of the employers appointed
servants due to their health problems.
It was clear that 60 per cent of the servants were working in nuclear
families. But the accommodation or visiting of employer’s relatives or
cousin or visitors had not increased servants’ wage though their work load
was high.
Though the employers owned enough
equipments that facilitate the domestic work, all of these were not available
to the servants. For instance, though there were mixie, washing machine etc.
in the employer’s house, these were not being worked in the presence of
servants. However, it was clear that the electric charge and other cost of
working these equipments were very large when compared to the servants’
wage level.
2.9.8. Unionisation:
The servants weren’t the members of any political party or union.
They had’nt any political awareness though they were the voters.
The servants who were engaged in construction work earlier had
membership in Labour Welfare Fund. They were renewing their
membership by remitting a small terminal amount. But others had’nt
membership in any union and so they were not united. The domestic servant
were not in a position to argue for their rights under a unique power.
2.10. Income and Management of Expenses:
2.10.1 Income
Monthly income of the domestic servants varied between the range of
Rs.400 to Rs.2800 in which 58 per cent of them was under the income group
of 400 rupees to 1200 rupees. There was only 12 per cent of the servants
having an income of more than 1600 rupees per month. Table 2.17 reveals
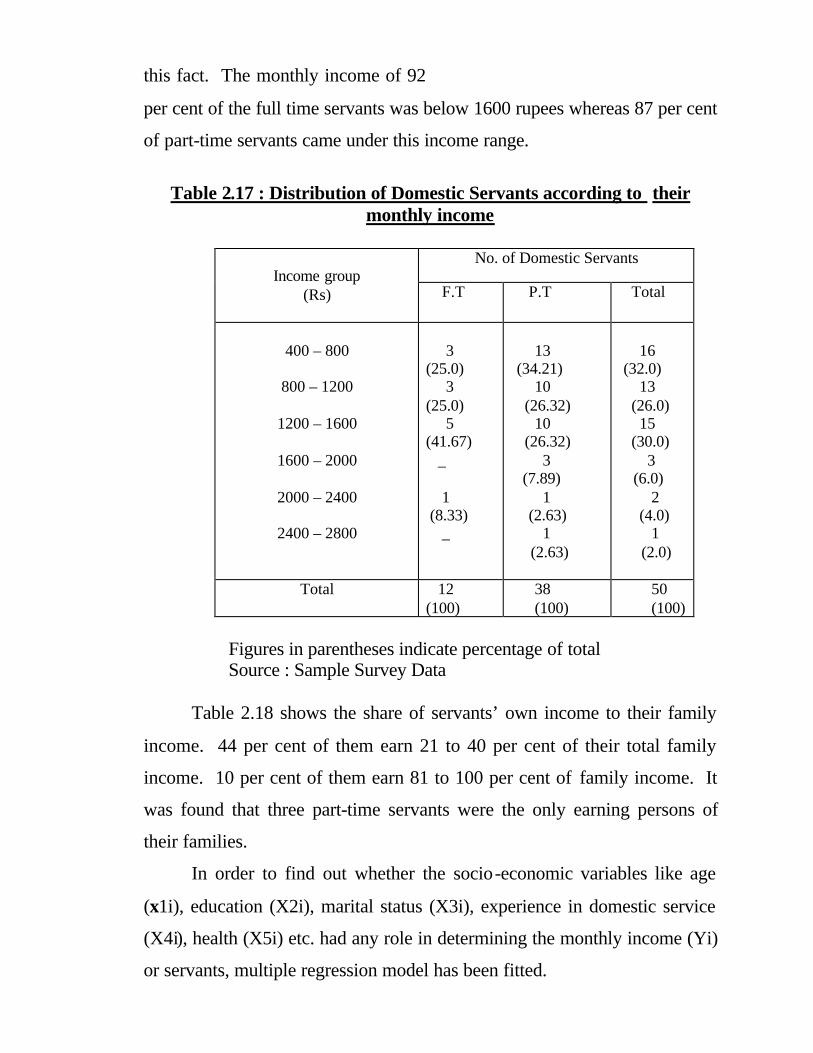
this fact. The monthly income of 92
per cent of the full time servants was below 1600 rupees whereas 87 per cent
of part-time servants came under this income range.
Table 2.17 : Distribution of Domestic Servants according to their
monthly income
No. of Domestic Servants Income group
(Rs)
F.T P.T Total
400 – 800
800 – 1200
1200 – 1600
1600 – 2000
2000 – 2400
2400 – 2800
3 (25.0) 3 (25.0) 5 (41.67) _ 1 (8.33) _
13
(34.21) 10
(26.32) 10
(26.32) 3
(7.89) 1
(2.63) 1
(2.63)
16
(32.0) 13
(26.0) 15
(30.0) 3
(6.0) 2
(4.0) 1
(2.0)
Total
12 (100)
38 (100)
50 (100)
Figures in parentheses indicate percentage of total Source : Sample Survey Data
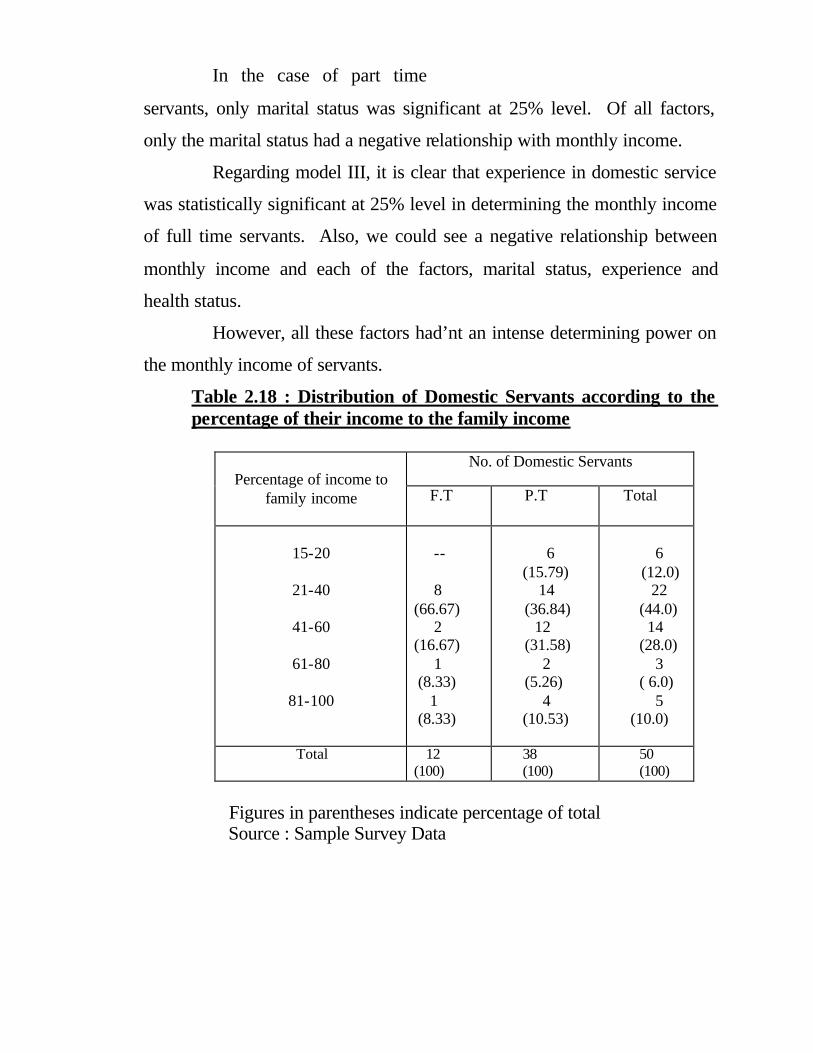
Table 2.18 shows the share of servants’ own income to their family
income. 44 per cent of them earn 21 to 40 per cent of their total family
income. 10 per cent of them earn 81 to 100 per cent of family income. It
was found that three part-time servants were the only earning persons of
their families.
In order to find out whether the socio-economic variables like age
(x1i), education (X2i), marital status (X3i), experience in domestic service
(X4i), health (X5i) etc. had any role in determining the monthly income (Yi)
or servants, multiple regression model has been fitted.
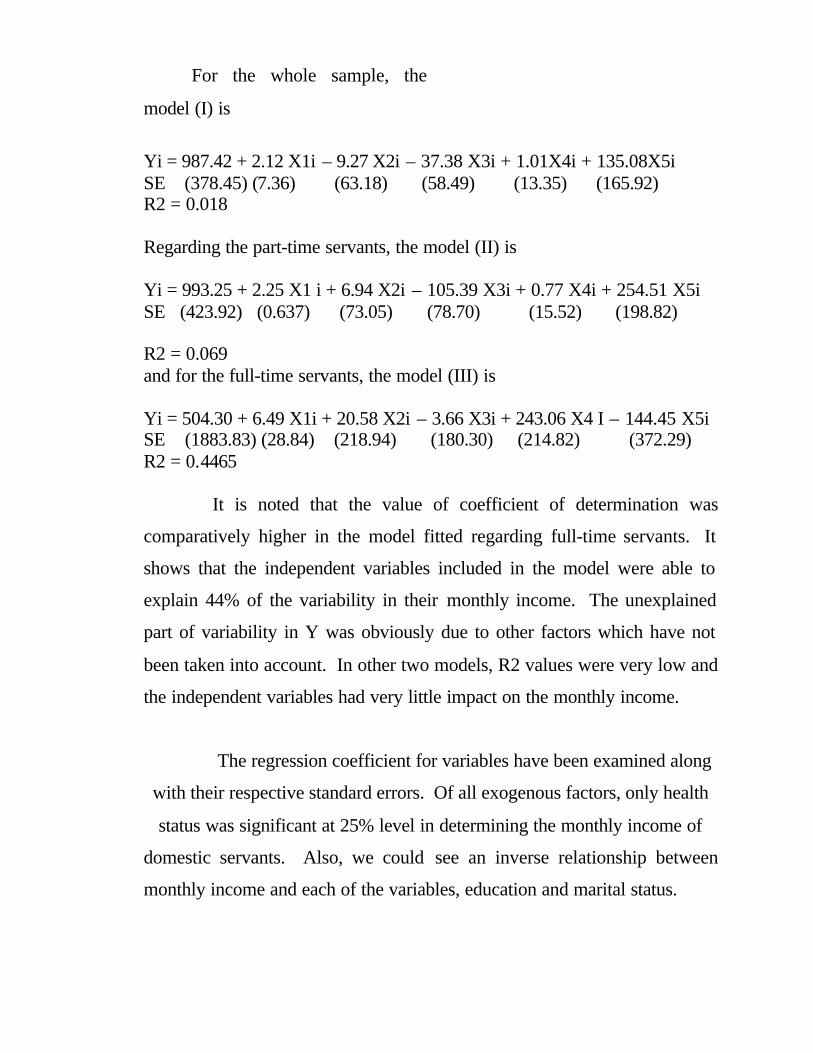
For the whole sample, the
model (I) is
Yi = 987.42 + 2.12 X1i – 9.27 X2i – 37.38 X3i + 1.01X4i + 135.08X5i SE (378.45) (7.36) (63.18) (58.49) (13.35) (165.92) R2 = 0.018 Regarding the part-time servants, the model (II) is Yi = 993.25 + 2.25 X1 i + 6.94 X2i – 105.39 X3i + 0.77 X4i + 254.51 X5i SE (423.92) (0.637) (73.05) (78.70) (15.52) (198.82) R2 = 0.069 and for the full-time servants, the model (III) is Yi = 504.30 + 6.49 X1i + 20.58 X2i – 3.66 X3i + 243.06 X4 I – 144.45 X5i SE (1883.83) (28.84) (218.94) (180.30) (214.82) (372.29) R2 = 0.4465 It is noted that the value of coefficient of determination was
comparatively higher in the model fitted regarding full-time servants. It
shows that the independent variables included in the model were able to
explain 44% of the variability in their monthly income. The unexplained
part of variability in Y was obviously due to other factors which have not
been taken into account. In other two models, R2 values were very low and
the independent variables had very little impact on the monthly income.
The regression coefficient for variables have been examined along
with their respective standard errors. Of all exogenous factors, only health
status was significant at 25% level in determining the monthly income of
domestic servants. Also, we could see an inverse relationship between
monthly income and each of the variables, education and marital status.
In the case of part time
servants, only marital status was significant at 25% level. Of all factors,
only the marital status had a negative relationship with monthly income.
Regarding model III, it is clear that experience in domestic service
was statistically significant at 25% level in determining the monthly income
of full time servants. Also, we could see a negative relationship between
monthly income and each of the factors, marital status, experience and
health status.
However, all these factors had’nt an intense determining power on
the monthly income of servants.
Table 2.18 : Distribution of Domestic Servants according to the percentage of their income to the family income
No. of Domestic Servants
Percentage of income to family income
F.T P.T Total
15-20
21-40
41-60
61-80
81-100
-- 8 (66.67) 2 (16.67) 1 (8.33) 1 (8.33)
6
(15.79) 14
(36.84) 12
(31.58) 2
(5.26) 4
(10.53)
6
(12.0) 22
(44.0) 14
(28.0) 3
( 6.0) 5
(10.0)
Total
12 (100)
38 (100)
50 (100)
Figures in parentheses indicate percentage of total Source : Sample Survey Data

2.10.2 Savings:
The saving behavior of domestic servants is as shown in table 2.19. It
was clear that only 33.33 per cent of the full-time servants had monthly
savings in gold kuri or kuri under “Sthreesakthi”. But 60.53 per cent of the
part-time servants had savings in post office, LIC or others including
friendship kuri.
Table 2.19 Distribution of Domestic Servants according to their savings
in different categories
No. of servants Category Full – time Part - time Total
P.O.Savings
LIC Policy
Others
--
--
4
13
1
9
13
1
13
Total
4 23 27
Figures in parentheses represent percentage to total.
Source: Sample Survey Data.
Now it is necessary to compare their savings with their monthly
income. Table 2.20 shows the share of their savings to the income. About
48 per cent of them had been saving less than 20 per cent of their income
37.04 per cent of them had saved 31 to 40 per cent of their income.
However, none of them saved more than 50 per cent of their income.
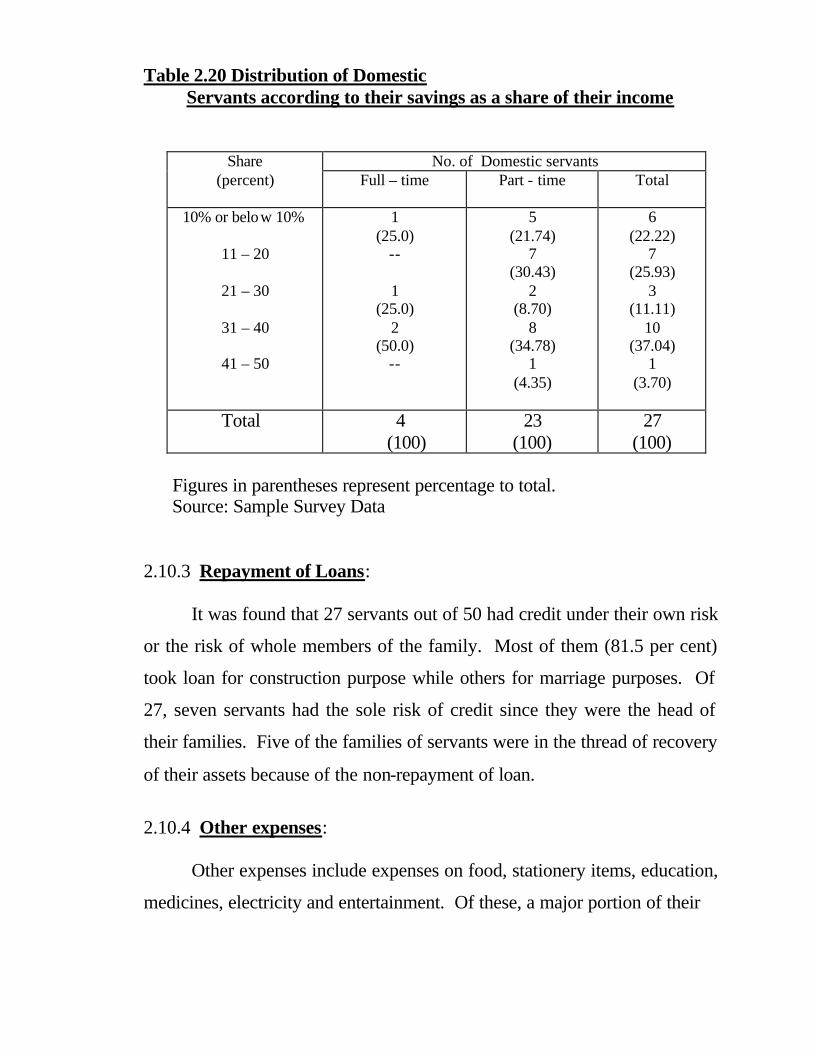
Table 2.20 Distribution of Domestic
Servants according to their savings as a share of their income No. of Domestic servants Share
(percent)
Full – time Part - time Total
10% or below 10%
11 – 20
21 – 30
31 – 40
41 – 50
1 (25.0)
-- 1
(25.0) 2
(50.0) --
5 (21.74)
7 (30.43)
2 (8.70)
8 (34.78)
1 (4.35)
6 (22.22)
7 (25.93)
3 (11.11)
10 (37.04)
1 (3.70)
Total
4 (100)
23 (100)
27 (100)
Figures in parentheses represent percentage to total. Source: Sample Survey Data 2.10.3 Repayment of Loans:
It was found that 27 servants out of 50 had credit under their own risk
or the risk of whole members of the family. Most of them (81.5 per cent)
took loan for construction purpose while others for marriage purposes. Of
27, seven servants had the sole risk of credit since they were the head of
their families. Five of the families of servants were in the thread of recovery
of their assets because of the non-repayment of loan.
2.10.4 Other expenses:
Other expenses include expenses on food, stationery items, education,
medicines, electricity and entertainment. Of these, a major portion of their

income was spent on food items.
Most of them respondent that their income was needful in quenching their
appetite. In some cases, their income had helped in the repayment of
family’s credit and in some other cases, it had helped them to make savings.
However, the income earned by the servant-maids were utilized for
the subsistence or welfare of their family rather than for their own needs and
welfare. In this respect, we could see that unmarried servants had been
exploited within their families by their married brothers, sisters and in some
cases, even by parents.
2.11 Health Status : Table 2.21 reveals different kinds of health problems faced by the
maid-servants. It was understood that 74 per cent of the servants suffered
from different types of diseases in which about 54 per cent had skin
diseases. This was because of the continuous use of soaps and detergents
and contact with dust and dirt. About 19 per cent of them had back pain due
to the lack of rest.
Table 2.21 Distribution of Domestic Servants according to the nature of their diseases
No. of servants Nature of
Disease Full – time Part - time Total
Back pain Leg pain Headache Goiter
Old age disease Diabatis & B.P.
2 1 -- -- -- --
5 4 2 1 1 1
7 5 2 1 1 1
Total
3 14 17
Source: Sample Survey Data
However, while 84 per cent of the part-time servants had health
problems, only 42 per cent of full-time servants suffered from the same . Of
these 37 servants, only 7 maid-servants under went regular treatment and
they had spent 5 per cent to 42 per cent of their income for this purpose.
The remaining had not any medical treatment due to financial problems.
2.12 Rest and Leisure:
Since rest and leisure provides good health status, it is necessary to
enquire about these factors. About 90 per cent of them responded that they
were getting rest only while sleeping at night. Also they hardly got leisure
time. They had to work from early morning till night in their own house and
working place.
Very few of them (10 per cent) had reading habit. They seldom read
newspapers or magazines. About 20 per cent of them had enjoyed watching
T.V. but was not regular.
2.13 Housing conditions:
Out of 50 sample servants, 41 possessed land in which about 83 per
cent occupied one to five cents or below 5 cents of land. Table 2.22 shows
this. Another importance feature of their living place was that majority of
them hailed from colonies or slums in Corporation area. The full-time
servants recruited by agencies were from distant places in Thrissur district.

Table 2.22 Distribution of Domestic Servants according to the landholdings
Land Area
(cents) No. of Domestic
Servants 5 or below 5
6 – 10
10 – 20
20 or above 20
34 (82.93)
4 (9.76)
2 (4.88)
1 (2.44)
Total 41
(100) Figures in parentheses represent percentage to total. Source: Sample Survey Data
Their housing conditions are given in table 2.23. While 78% of the houses
had tiles or concrete roof, 80 per cent had brick wall and 42 per cent had
dung plastered floor. Regarding the drinking water source, it was found
that 62 per cent of the houses depended on public well or public tap. Also
70 per cent of the houses were not electrified.
Table 2.23 Distribution of Domestic Servants according to the Housing condition
Category No. of Houses
I. Type of Roof (i) Leaves (ii) Tiles (iii) Concrete
11 29 10
II. Type of Wall (i) Leaves (ii) Mud (iii) Bricks
7 3 40
III. Type of floor (i) Dung plastered
21
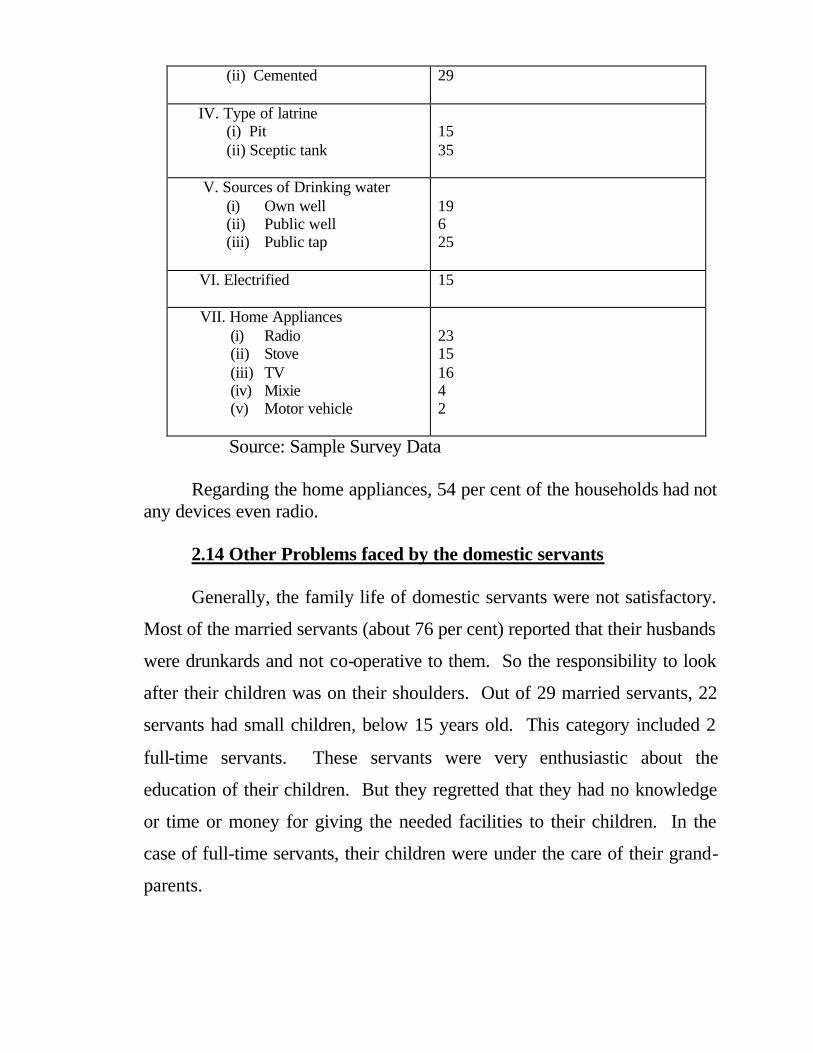
(ii) Cemented 29
IV. Type of latrine
(i) Pit (ii) Sceptic tank
15 35
V. Sources of Drinking water (i) Own well (ii) Public well (iii) Public tap
19 6 25
VI. Electrified 15
VII. Home Appliances (i) Radio (ii) Stove (iii) TV (iv) Mixie (v) Motor vehicle
23 15 16 4 2
Source: Sample Survey Data
Regarding the home appliances, 54 per cent of the households had not any devices even radio. 2.14 Other Problems faced by the domestic servants Generally, the family life of domestic servants were not satisfactory.
Most of the married servants (about 76 per cent) reported that their husbands
were drunkards and not co-operative to them. So the responsibility to look
after their children was on their shoulders. Out of 29 married servants, 22
servants had small children, below 15 years old. This category included 2
full-time servants. These servants were very enthusiastic about the
education of their children. But they regretted that they had no knowledge
or time or money for giving the needed facilities to their children. In the
case of full-time servants, their children were under the care of their grand-
parents.

The unmarried servants were
very much bothered about their family matters. They shared the
responsibility in their family. In some cases, their family members exploited
them for personal gains.
In case of four divorced servants, one having children didn’t get any
support from her family members. Other three divorcees were living with
their parents or brothers. The young widow servants were trying hard to
make both ends meet.
Though the parents of some of the servants were living with them,
they were not healthy. So the servants had to look after them also.
The servants were very pessimistic about their future. They felt that their
work was demeaning - washing others’ dirt. They responded that they were
tied to this job because of certain circumstances like low level education,
poor family background etc. Being stuck in the working place for a long
time, they had adverse effects on their feeling of well-being.
Regarding the relationship between servants and the society, they
responded that they had no time or wish to involve in others’ matters
because they were surrounded by different types of their own problems.
===========
CHAPTER-3
SUMMARY AND CONCLUSION
The domestic service is an unorganized and unregulated form of work
which has an individualistic nature. In urban areas, the demand for domestic
servants has been increased due to the lack of time and physical inability of
the housewives and also due to the emerging modern lifestyle among the
city habitants.
The study “Socio economic status of Domestic women servants: A
case study of Thrissur Corporation” was based on a primary survey of fifty
domestic servants. The survey was conducted keeping four objectives in
mind. Firstly, to analyse the socio-economic profile of the domestic women
servants. Secondly, to understand their occupational structure and wage
structure. Thirdly, to examine their working background and the type of
contact made by the employers to get the service of domestic servants.
Finally, it intends to discuss various problems faced by the domestic
servants. The analysis mainly depends on the tabular and descriptive
exercises though some statistical techniques had been used.
3.1 Summary of findings:
There were fifty domestic servants including twelve full-time servants
and thirty eight part time servants. Most of them (78 per cent) belonged to
Hindu religion, in which 95 per cent constituted backward castes. These
backward people hailed from Scheduled Caste colonies or slums in
Corporation area. Majority of them faced lack of basic amenities like
drinking water, electricity etc. About
54 per cent of the households handn’t any home appliance, even radio.
The sample consisted of married, unmarried, widowed and divorced
ladies in which married servants constituted 58 per cent. Also 50 per cent of
the servants were from the age group of 31 to 40 years. Out of 50 servants,
24 of them played the role of “head” in their families. They were either
widows or divorcees who were confined to much responsibility. The
situation of married servants were not different. In most of the cases, the
married servants had to carry entire family burden due to the irresponsible
nature of their husbands. The servants, who had school going children
had’nt enough time to look after their children because of their work load in
their own house and in work place.
Regarding their education, we could see that about 50 per cent of
them were not able to read, write and comprehend things well. At the same
time, we could see 8% of the educated (S.S.L.C. or above) servants. Their
poor background hindered them from attaining further education and
compelled to accept any job. Though 80 per cent of the servants were
interested for further education, they had no time to spend on it because of
their work load.
It was difficult to classify the servants according to the nature of their
work in domestic service because almost all works in the houses were being
done by them. The full-time servants had to do all works including food
preparation. Three out of twelve full time servants were appointed for
caring small children in day time. The daily working hours of full time
servants varied from 6 to 10 hours. The part time servants had to do almost
all cleaning and washing works in the house excluding kitchen work. The
part time servants were working in more than one house daily; 21 per cent

of them were working in 4 or 5
houses daily and 63 per cent of them in two or three homes. Their daily
working hours varied from 4 to 10 hours.
The wage rate of full time servants ranged between 4 rupees to 10
rupees while that of part time servants varied between 4 rupees to 14 rupees,
which was below the wage rate of a female labourer engaged in other works.
But the work load of domestic servants was high.
It was found that about 16 per cent of the part time servants had a long
experience of more than 11 years and 48 per cent of them had two to five
years of experience. But all of the full time servants had an experience of
less than 5 years. By comparing the experience and wage rate, it was found
that there was no relation between these factors. Also it was found that
wage rate was not in accordance with their age or education.
The full time servants exclusively depended upon their housematrons
for food, though the offered food was low in quality. But most of the part
time servants were offered some light food, not nutrient items, sometimes
was left-over food.
Very few of the servants were satisfied with the approach of house
matrons to them. The full time servants recruited by agencies reported that
they were not getting any human consideration from their masters. At the
same time, part time servants were some more free to choose their working
place. According to a few part time servants, their masters were not regular
in paying wages to them. Generally, the employers cut wages whenever the
servants did not turn up, though there were genuine reasons. At the same
time, the increase in work load in the houses in certain occasions had not
increased their wage level.
It was clear that the house
matrons appointed servants either for getting them rest or to get enough time
for their personal affairs. About 70 per cent of the house matrons were
employees and 20 per cent were permanently diseased. Thus we could
realize that the servants were needful to them, also in reducing the working
cost of modern equipments in the houses like washing machine, vacuum
cleaner, mixie, etc.
About 50 per cent of the servants had engaged in some other jobs
before entering the domestic service. They shifted their job because of
irregularity of the job and their health problems.
The servants were’nt the members of any political party or worker’s
union. They were not aware of their rights and not united. They were living
inside their small world of difficulties. So they bore the exploitation in
working place.
The non-reputed agencies had been exploiting the servants without
making a regular payment to them. The concerned house matrons were not
satisfactory in the role of these agencies. Most of the housewives used local
contacts for getting their servants.
The health condition of 74 per cent of the servants was more or less
problematic. About 54 per cent of them suffered from skin diseases. The
remaining suffered from back pain, head-ache, diabetics etc. However, only
a few of them underwent regular treatment.
The income earned by the servants contributed a considerable share to
their family income. The factors like age, education, marital status,
experience and health status were not much significant in determining their
income. About 54 percent of them had savings and they had been keeping
20 to 40 per cent of their income in this. Twenty seven servants out of fifty
had credit under their own risk or the risk of whole members of the family.
Most of the servants responded that they had been leading or miserable life
with poor financial back ground.
They utilized their income for the subsistence or welfare of their whole
family. In some cases, we could see that they were exploited within their
family itself.
3.2 Conclusion
Women domestic servants belonged to the economically
disadvantaged group and most of them lived in slums areas or Scheduled
caste colonies. There was not a uniformity in their wage structure and their
wage level was very low. However, they were compelled to do this job
because of lower education or poor financial background. They were
exploited at their working place and in some cases, even at their own homes.
In this context, it is necessary to make an awareness of the
exploitation faced by the domestic servants and inspire them to organize
themselves for protecting their rights and also to work for implementing
enactment of laws by the government. Then only they can live with status
and dignity equal to that of other members of the society.
=========

APPENDIX
Questionnaire
SOCIO ECONOMIC STATUS OF DOMESTIC WOMEN SERVANTS-
A Case Study of Thrissur Corporation .
[ A pilot study of 50 Servants] Ward No. : Name : Address : Age : Religion : Caste : I. Particulars of Family Members Sl. No.
Name Age Relationship with Head of family
Education Occupation Monthly income
II. Land and Housing Facilities: A. Do your family possess own land? : Yes/No If yes, land area :
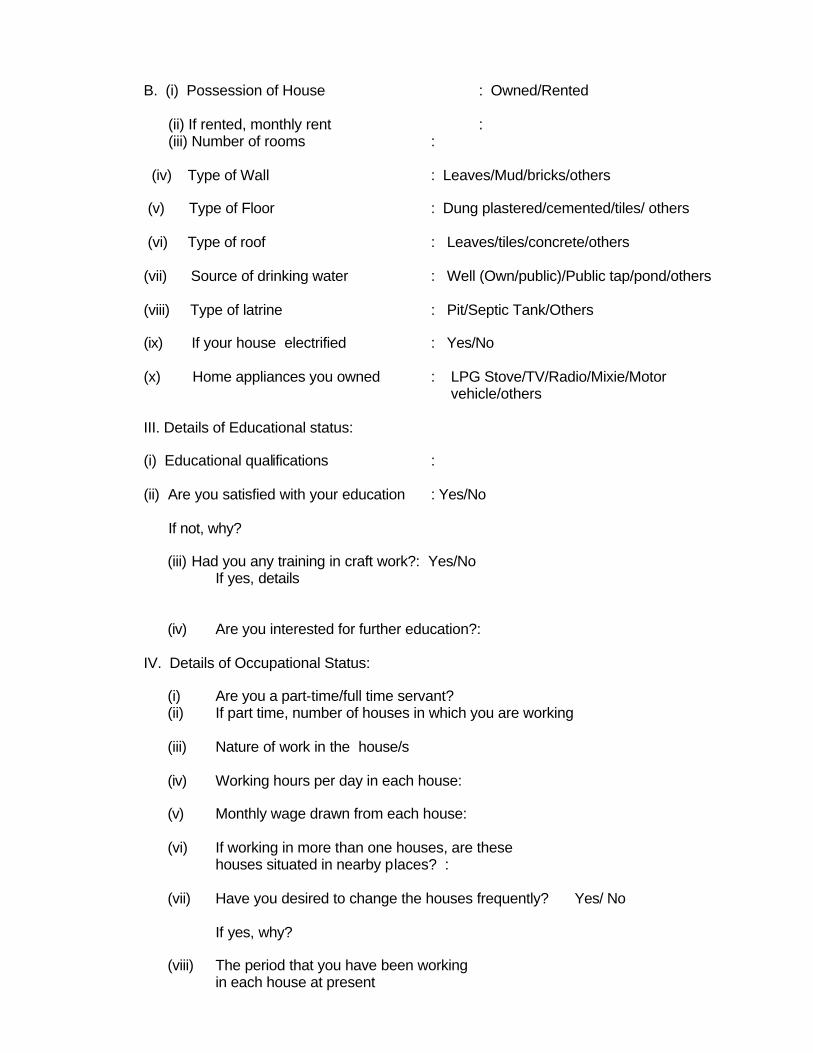
B. (i) Possession of House : Owned/Rented (ii) If rented, monthly rent : (iii) Number of rooms : (iv) Type of Wall : Leaves/Mud/bricks/others (v) Type of Floor : Dung plastered/cemented/tiles/ others (vi) Type of roof : Leaves/tiles/concrete/others (vii) Source of drinking water : Well (Own/public)/Public tap/pond/others (viii) Type of latrine : Pit/Septic Tank/Others (ix) If your house electrified : Yes/No (x) Home appliances you owned : LPG Stove/TV/Radio/Mixie/Motor vehicle/others III. Details of Educational status: (i) Educational qualifications : (ii) Are you satisfied with your education : Yes/No If not, why?
(iii) Had you any training in craft work?: Yes/No If yes, details
(iv) Are you interested for further education?: IV. Details of Occupational Status:
(i) Are you a part-time/full time servant? (ii) If part time, number of houses in which you are working
(iii) Nature of work in the house/s
(iv) Working hours per day in each house:
(v) Monthly wage drawn from each house:
(vi) If working in more than one houses, are these
houses situated in nearby places? :
(vii) Have you desired to change the houses frequently? Yes/ No
If yes, why?
(viii) The period that you have been working in each house at present

(ix) Are you satisfied with your wage?
(x) Had you gone to any other job? If yes, details
(xi) Why did you quit from that?
(xii) Had you any bitter experience from the house
matrons or others in the house? (xiii) Are the house matrons, loving and friendly to you?
(xiv) Have you accepted any other help or gifts
occasionally from the house matrons? If yes, nature of help/gifts:
(xv) Do you enjoy any holiday : Yes/No
(xvi) If yes, number of holidays in a month: (xvii) Did you get sick leave or any emergency leave
in need without wage cut? (xviii) If you are from any other district or states,
why did you come here in search of job? Who directed you to here?
(xix) If you are recruited by any agency,
Name of Agency: The terms and conditions between you and the agency: The period of appointment Are you satisfied with the agency’s functioning? Give details. V. Health and Food: (i) Do you suffer from any permanent disease? Yes/No
If yes, nature of disease
Have any treatment? If not, why?
Amount spent per month for treatment
(ii)
Leisure time in hours that you get per day

(iii)
Do you think that you want more time for rest?
(iv)
Details of food intake
Food items
Are these food items prepared by yourselves or got from the houses?
Your dining place in the work place
VI.: Management of monthly expenses Purpose Amount spent (Rs.)
VII. Saving Pattern
(i) Have you any chitty/Kuri / P.O. Savings/any other
(ii) Amount of Savings in each: VIII. Details of Loan/Credit if any: (i) Loan Amount : (ii) Purpose : (iii) Source : (iv) Interest rate : (v) Duration : (vi) Have you paid it without any fail till now? IX. Other Personal Details (I) Marital status Married/Unmarried/Widow/Divorcee
(ii)
If married, husband’s job
(iii)
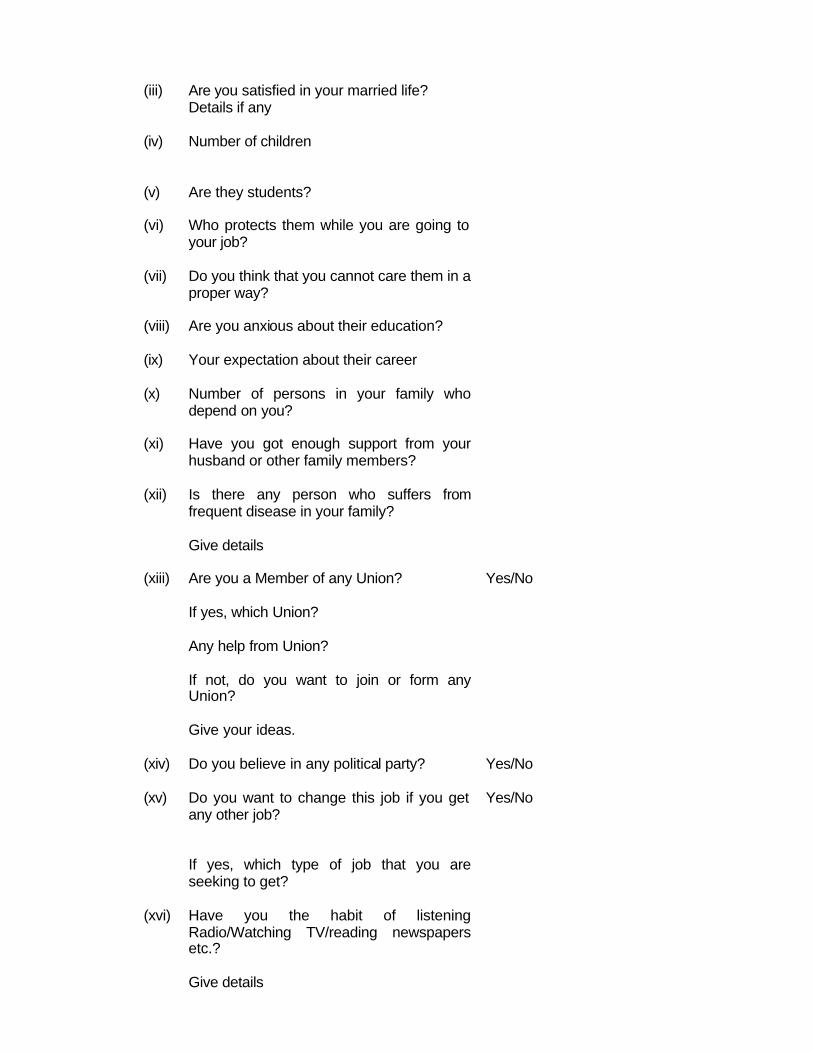
Are you satisfied in your married life? Details if any
(iv)
Number of children
(v)
Are they students?
(vi)
Who protects them while you are going to your job?
(vii)
Do you think that you cannot care them in a proper way?
(viii)
Are you anxious about their education?
(ix)
Your expectation about their career
(x)
Number of persons in your family who depend on you?
(xi)
Have you got enough support from your husband or other family members?
(xii)
Is there any person who suffers from frequent disease in your family? Give details
(xiii)
Are you a Member of any Union?
Yes/No
If yes, which Union? Any help from Union? If not, do you want to join or form any Union? Give your ideas.
(xiv)
Do you believe in any political party?
Yes/No
(xv)
Do you want to change this job if you get any other job? If yes, which type of job that you are seeking to get?
Yes/No
(xvi)
Have you the habit of listening Radio/Watching TV/reading newspapers etc.? Give details
(xvii)
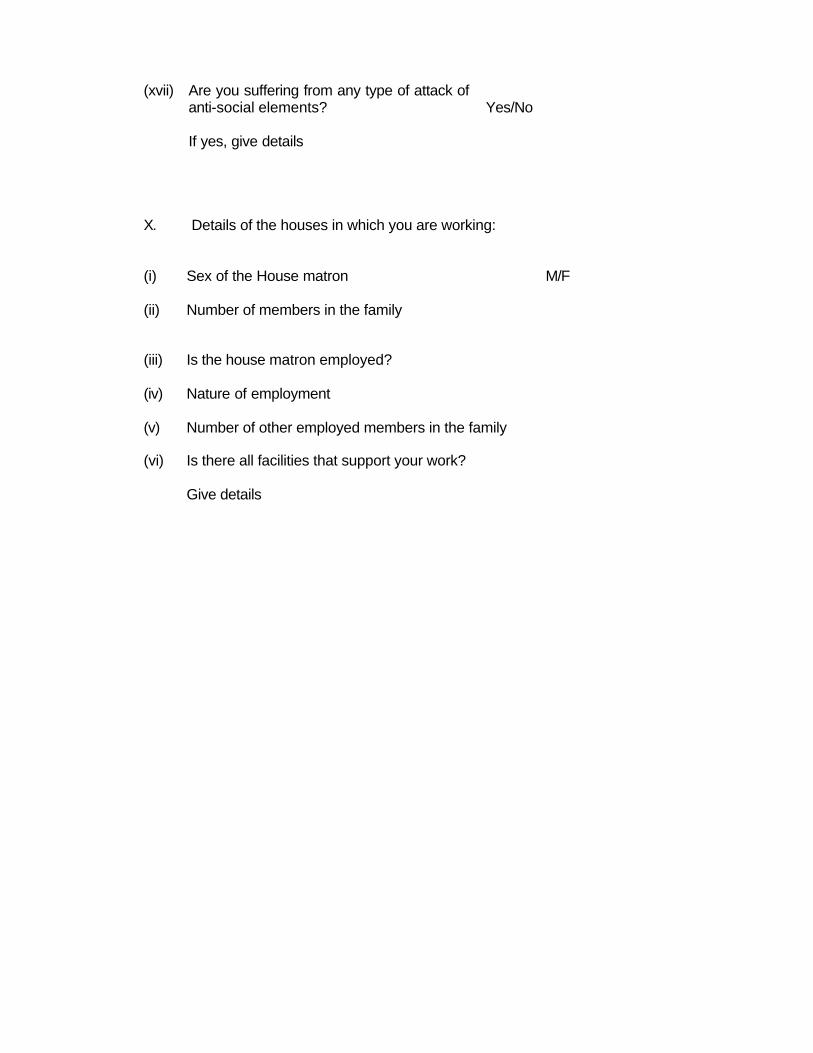
Are you suffering from any type of attack of anti-social elements? If yes, give details
Yes/No
X. Details of the houses in which you are working: (i) Sex of the House matron M/F
(ii) Number of members in the family
(iii)
Is the house matron employed?
(iv)
Nature of employment
(v)
Number of other employed members in the family
(vi)
Is there all facilities that support your work? Give details
BIBLIOGRAPHY
BOOKS
1 Dr.Sathyasundaram (Ed) (1996) Unorganised women Labour in India,
Discovery Publishing House, New Delhi
2 Susan Bullock (1994) Women and Work
Zed Books Ltd., London
3 Nirmala Banerjee (1985) Women Workers in the Unorganised Sector, The Calcutta Experience, Sangham Books Pvt. Ltd. Hyderabad
4 T.Haque (1993) Labour Employment and Human Development in South Asia: Issues concerning Employment of Women in South Asia, B.R.Publishing Corporation for Institute for Human Development
5 Das Gupta Aparna (1980) Profile of Women Dwelling in the slums of New Delhi, PIDIT New Delhi (1980)
6 Padmini Senguptha (1960) Women Workers of India, Asia Publishing House, Bombay (1960)
PERIODICAL ARTICLES 1 D.P.Singh Mor (2001) “Women and the Unorganised Sector”
Social Welfare, Vol. 48 (9)
2 Nirmala Banerjee (1999) “Women in Emerging Labour Market” Indian Journal of Labour Economics, Vol.42(4)
3 Dr.Jaya Arunachalam (1997) “Somen in the informal sector: Need for Policy Options”, Social Welfare, Vol.44(5)
4 Atanu Thakar (1999) “A Post Modernist Enquiry into Women’s Work Force Participation”, The Indian Journal of Labour Economics Vol.42(4)
5 Sandra Rothock and Sarthi Acharya (1999)
“Gender Based Segregation in the Indian Labour Market” The Indian Journal of Labour Economics Vol.42(4)
6 Jeemol Unni and Uma Rani (1999)
“Informal Sector Women in the emerging labour market”, The Indian Journal of Labour Economics, Vol. 42 (4)
7 Balgovind Baboo and Laxmi Panwar (1984)
“Maid Servants : A case study in Haryana” Mainstream Vol. 23 (1)
8 Bhise Lata and Bhonsle Leela (1980)
“A sign of things to come”, Manushi, May-June
9 Dr.K.Murugaiah (2002) “Women Domestic Workers” Social Welfare, Vol. 49(2)
10 Rajalakshmi Rama Rao (1987)
“Domestic Servants from Tamil Nadu in Delhi” Social Welfare Vol 44 (5)
11 Alaka and Chetna (1984) “Struggling at every step “Manushi, March-April
12 Pratima Chaudhary (1986) “Women Sweepers in Patna”, Social Welfare, May
13 Johanna Lessinger (1985) “Caught between work and modesty” Manushi May-June
14 Mangala Nori (1983) “Victims, Not offenders”, Manushi, No.19
15 Prabha Rani and Poonam Kaul (1986)
“For two meals a day: a report on Tamil Domestic Maids”, Manushi July-August.
REPORTS/WORKING PAPERS/THESES 1 Leela Gulati “Women in the Unorganised sector with special
reference to Kerala”, C.D.S.AW.P. No.172
2 Annelies Moors and Ratna Saptari
“Domestic service and Mobility” CLARA workshop Report, Agenda (2002) Publications General
3 Department of Women and Child Development
“Occupational Health issues of women in the Unorganised sector” Report of the Task-force on Health (1988) Ministry of Human Resources Development.
4 School of Social work
“A National Socio-economic, Survey of Domestic Workers, Report, Roshini Nilaya, Research Department, Mangalore (undated)
5 S.Dhanalakshmi “Women in the Informal Labour Market – A case study of Domestic Servants in Thiruvananthapurm City” M Phil. Dissertation, Kerala University (1988)
6 N.S.S. 54th Round “Survery Resolution Cultivation Practices in India” Sarvekshana, 24(1), 84th issue, July-September (2002)