Embed Size (px)
Citation preview

i
Socio-Economic Profile of the California Wetfish Industry
Caroline Pomeroy1 Monica S. Hunter2 Marc Los Huertos3
2002
In Pleschner, D.B., ed. 2002. California's Wetfish Industry: Its Importance Past, Present and Future. Santa Barbara, CA: California Seafood Council.
1 Associate Research Scientist, Institute of Marine Sciences, UC Santa Cruz 2 Consulting Socio-Cultural Anthropologist, Los Osos, CA 3 Environmental Studies Department, UC Santa Cruz
Socio-Economic Profile of the California Wetfish Industry
Pomeroy, Hunter and Los Huertos
Table of Contents
Abstract
Section 1: Introduction
Section 2: Background and Methods
Section 3: Development of the California Wetfish Industry Through 1995
Section 4: The Present Day California Wetfish Industry
Section 4.a: The Monterey Bay Area FisherySection 4.a.1: The ResourceSection 4.a.2: Ports and infrastructureSection 4.a.3: Processors and receiving capabilitiesSection 4.a.4: Fishing operations and their participants
Section 4.b: The Ventura/Port Hueneme Area FisherySection 4.b.1: The ResourceSection 4.b.2: Ports and infrastructureSection 4.b.3: Processors and receiving capabilitiesSection 4.b.4: Fishing operations and their participants
Section 4.c: The San Pedro/Terminal Island Area FisherySection 4.c.1: The ResourceSection 4.c.2: Ports and infrastructureSection 4.c.3: Processors and receiving capabilitiesSection 4.c.4: Fishing operations and their participants
Section 5: The California Wetfish Industry as a Whole
Section 6: Conclusion
References
Figures
Tables

Socio-Economic Profile of the California Wetfish Industry
Caroline PomeroyInstitute of Marine Sciences
University of California, Santa Cruz
Monica Hunter
Marc Los Huertos
Abstract
This study presents a socio-economic profile of the California wetfish industry, comprised of thefishermen, receivers and processors who are involved in the capture and processing of northernanchovy, jack and Pacific mackerel, Pacific sardine and California market squid. In southernCalifornia, the industry also targets coastal tunas and Pacific bonito. The profile is based onarchival, survey and ethnographic research, and focuses on the spatial and temporal organizationof the present day industry, the socio-economic characteristics of its participants, and theenvironmental, social, economic and regulatory context in which they operate. The present dayCalifornia wetfish industry has strong connections to the "traditional" industry of the last century.Most fishermen and processors have a long personal and family history in the fishery.Relationships among them are social as well as economic, and have enabled many to withstandthe challenges of variable and uncertain environmental, regulatory and economic conditions.Whereas the traditional wetfish industry directed effort primarily toward reduction and canning,the present day fishery is focused largely on the production of high quality fresh, frozen productfor human consumption and other uses.
The present day industry is organized around three regional centers of activity including theMonterey Bay, Ventura/Port Hueneme and San Pedro/Terminal Island areas. The complexlinkages among these centers of activity have been enhanced by processors' development ofreceiving and processing capabilities and fishermen's increased mobility among regions, and thesocial and economic ties between processors and fishermen. Each of the three regions has twomajor ports and associated infrastructure that play a critical role in the industry as receivingstations and/or home ports for the fishing operations. Harbor infrastructure, from receiving anddocking facilities to ice plants, boatyards and marine supply stores, varies considerably amongthese sites. In most cases, these harbors and marine businesses depend upon the commercialwetfish industry as a source of revenue, to qualify for federal dredging funds and/or as a culturalbackdrop to tourism. The wetfish industry is linked to local agricultural economies through itsshared use of transport services, ice plants, packing materials, cold storage facilities, and seasonallabor.
Although sardine, mackerel and anchovy have been the "bread and butter" of the wetfish industry,the recent growth of the squid fishery has prompted a substantial infusion of resources and energyinto the industry. However, sharp fluctuations in the availability of squid and in associated

Wetfish Socio-Economic Profile 2
markets (especially since the 1997-98 El Niño), and the recovery of the sardine resource and newmarkets have allowed many fishermen and processors to redirect some of their energies towardsardine. In 2000, commercial landings of wetfish and coastal tunas totaled 455.6 million pounds(227,734 short tons) worth $38.9 million, and accounted for 83.6% by weight and 29.3% by valueof all commercial fish landings in California.

Wetfish Socio-Economic Profile 3
Section 1: Introduction
The California wetfish industry is steeped in history that dates back more than a century to theuse of purse seines and lanterns by Chinese fishermen to catch squid off Monterey, and thecanning of sardines and other species that were transported to diverse and often distant markets.The primary outputs of the industry at that time included dried, canned, reduced and freshproducts. Since the early development of the commercial wetfish fisheries, the industry hasexperienced immense changes and fluctuations in environmental, economic and regulatoryconditions that have resulted in changes in technologies, practices and social and economicrelations. The present day California wetfish industry has much in common with its precursor, butalso differs from it in important ways.
We define the "California wetfish industry" as the fishermen, receivers and processors who catch,handle, process and pack four coastal pelagic finfish species: northern anchovy (Engraulismordax), jack and Pacific mackerel (Trachurus symmetricus and Scomber japonicus) and Pacificsardine (Sardinops sagax), and California market squid (Loligo opalescens).1 Together thesespecies are traditionally known as “wetfish” (because they were packed “wet” (or raw) in cans,then cooked) (Leet et al. 1992), or the “coastal pelagic species” (CPS). Some of the wetfishfishery participants also are involved in the fishery for coastal tunas [e.g., yellowfin (Thunnusalbacares), skipjack (Katsuwonus pelamis), Pacific northern bluefin (Thunnus thynnus)] andPacific bonito (Sarda chiliensis). An important commonality among wetfish fishermen is theiruse of "round haul" gear such as lampara nets, purse seines and drum seines to catch CPS. Asmaller group of fishermen uses scoop or brail gear, rather than round haul gear, to catch wetfish.In contrast to the round haul fleet, scoop and brail vessels deliver fish primarily to the live baitmarket, restaurants or small producers of specialty products for human consumption. This socio-economic profile focuses primarily on the round haul fleet and associated receivers andprocessors, but also provides some data and discussion pertinent to others engaged in the wetfishindustry.
In this chapter, we present a socio-economic profile of the present day California wetfish industrythat illustrates not only the commonalities and differences relative to the traditional industry, butmore importantly, the similarities and differences within the present day industry. The secondsection of this chapter provides a brief overview of the background and methods of the studiesupon which this report is based. The third section outlines key developments between the latter1800s and 1995 that helped shape the present day industry. The fourth section describes thepresent day industry. Our discussion is organized around the three regional centers of activity inthe fishery, which are (from north to south): the Monterey Bay area, the Ventura/Port Huenemearea, and the San Pedro/Terminal Island area (Figure 1). We describe the socio-economics of the 1 We use the following conventions throughout this chapter. Unless otherwise noted, “mackerel”refers to both jack and Pacific (or chub) mackerel, tons are reported as short tons (one short ton =2,000 pounds), and landings revenues are reported in nominal, ex-vessel dollars, unadjusted forinflation. See Hackett’s Wetfish Economics report for the 1982 Producer Price Index ratios,which can be used to calculate real (i.e., inflation-adjusted) values from the ex-vessel revenuesreported in this chapter. To protect confidentiality, the figures do not show data for those caseswhere fewer than three vessels or receivers reported landings.

Wetfish Socio-Economic Profile 4
wetfish industry at each of these sites in terms of resource availability, port and fisheryinfrastructure, processor receiving capabilities, and the characteristics of the fishermen andvessels involved in the region's fishery. In the fifth section, we discuss the key similarities anddifferences among the three regions. In a concluding section, we identify socio-economic factorsthat are most critical to understanding the dynamics and prospects for the future of the presentday California wetfish industry.

Wetfish Socio-Economic Profile 5
Section 2: Background and Methods
The information reported here is based upon two studies recently completed by the authors andcolleagues, and augmented by additional research conducted with support from the CaliforniaSeafood Council (CSC). The first study, conducted by Pomeroy and FitzSimmons under aresearch grant awarded by California Sea Grant, focused on the changing socio-economicorganization of the California market squid fishery. The second study, conducted by Pomeroy andassisted by Hunter, Los Huertos and others under contract to the National Oceanic andAtmospheric Administration (NOAA), built upon the Sea Grant study, and focused on the socio-economic impacts of potential marine reserves at the Channel Islands. For both studies, wecollected archival, ethnographic and survey interview data. Archival data included informationfrom the gray, refereed and trade literatures, and landings data from the Pacific States MarineFisheries Commission’s Pacific Fisheries Information Network (PacFIN) database. Field datawere collected using ethnographic and survey research methods. The former included directobservation of the fishery and related activities, and key informant interviews with fishermen,receivers and processors, harbor personnel, operators of support services, resource managers andothers knowledgeable of the industry. The survey interviews targeted skippers of squid catchervessels and light boats engaged in the squid fishery. The survey conducted for the Sea Grantstudy sought information on skippers' fishing history and experience, demographics, fishingoperations, markets, relationships and practices, and opinions about current and pending squidfishery management actions. The survey conducted for the Channel Islands study focusedexplicitly on the fishing experience and effort of skippers from all three regions who regularlyfish the Channel Islands, and their historic and current dependence on that area.2
Although both studies were driven primarily by questions and issues surrounding the squidfishery, the research necessarily entailed considerable attention to the other components of thewetfish fishery (i.e., for sardine, mackerel and anchovy). For most squid fishermen, CPS finfishare a critical part of their annual round of fishing activities, and the foundation of their identity asfishermen. Similarly, most receivers and processors involved in the squid fishery also have ahistory of involvement in the wetfish industry as a whole, as do the ports and other providers ofgoods and services to the industry.3
For this study, we augmented this information to bring the wetfish industry into sharper focus byconducting additional archival and field research in the summer and fall of 2001 with supportfrom the CSC. Supplemental archival research included retrieval and review of pertinentliterature from a variety of sources, and further analysis of the fleet’s wetfish landings data. Forthe latter, we secured permission to continue working with landings data from the PacFIN 2 A total of 73 skipper survey interviews were conducted for the two studies: 33 purse seineskippers and 3 light boat skippers were surveyed for the SG study, and 27 purse seine skippersand 8 light boat skippers were interviewed for the CI study. Seventeen of the purse seine skipperswere interviewed for both studies. Study participants have reviewed and validated the findings ofthe two studies. Tables 2 through 9 represent data from the surveyed purse seine skippers.
3 Overviews of the two studies are provided in Pomeroy and FitzSimmons (2001) and Pomeroyand Hunter (2001).

Wetfish Socio-Economic Profile 6
database used for the Sea Grant and Channel Islands studies, and obtained landings data for theyear 2000 to augment the data in hand. The data include all California, Oregon and Washingtonlandings (of all species) by vessels that landed squid between 1981 and 2000.4 The data weremanaged using Statistical Analysis Software (SAS), and analyzed using Statistical Package forthe Social Sciences (SPSS) and Excel. Strict protocols were observed to insure confidentiality ofstudy participant data.
Field data collection included a mail survey, telephone and in-person interviews with Californiawetfish processors, site visits to processing facilities in central and southern California, andtelephone and in-person interviews with wetfish fishermen. Several of the receivers, processorsand fishermen had participated in our previous studies of the squid fishery. The mail survey,which was designed by Hackett and Pomeroy, sought information on processors' sources ofwetfish, product types, quantities and revenues in 2000, facilities, observations of changes in theindustry and its environmental, economic and regulatory context over the past several years, andissues facing the industry. The survey was mailed to 62 processors identified using the Directoryof California Seafood Producers (CSC 2000) and Pomeroy’s knowledge of the industry. Ninerespondents, who together accounted for 61% of CPS wetfish landings, 61% of squid landingsand 8% of coastal tuna landings in California, provided data by return fax, phone interview or in-person interview.5
4 Landings by these vessels and their skippers in Alaska are currently unavailable.
5 The survey was mailed to California wetfish receivers/processors in June 2001, then followedwith a phone call and second mailing in July 2001. We then sought in-person interviews withreceiver/processors. Respondents included 7 of the 16 major wetfish receiver/processors asidentified by industry participants, and 2 smaller firms. [The number of large and small firms thatparticipate in the industry varies over time (Figures 5a-5d).] The nine survey respondentsprovided important input that validated and added to data from the Sea Grant and Channel Islandsstudies to enable us to provide a more complete picture of California wetfish processors. Thesample accounts for most of the wetfish landed in California, but does not capture the fullvariability among large and small processors within the industry.

Wetfish Socio-Economic Profile 7
Section 3: Development of the California Wetfish Industry Through 1995
Although the history of the wetfish fishery is discussed in depth elsewhere in this report, weprovide a brief overview of the development of the wetfish industry here as context for the socio-economic profile that follows. We begin by describing the emergence of each species as acomponent of the wetfish industry, then discuss key changes in resource availability, fishing andprocessing technologies and practices, markets, and regulations that followed (Table 1). Thesechanges have occurred in clusters over time, and may be used to help characterize "eras" in thedevelopment of the wetfish industry.
The five wetfish species and coastal tunas differ in how and when they became a part of theCalifornia wetfish industry. Although a bait fishery for Pacific sardine was in place by the late1800s, it was not until the turn of the century that it became the focus of a commercial fishery.The development of the commercial sardine fishery followed from the decline of salmon canning,the success of experiments in canning sardine, and identification of potential markets (McEvoy1986). The introduction of the lampara net by a Monterey fisherman in 1905, and the first use of apurse seine net in the fishery at San Pedro twenty years later also played an important role in thesardine fishery's establishment (McEvoy 1986). A small fishery for northern anchovy, primarilyfor reduction, developed alongside the fishery for sardine, but did not become notable until 1947,when the scarcity of sardines led to the beginning of anchovy canning operations (Bergen andJacobson 2002). The Pacific mackerel fishery emerged as a complement to the sardine fishery inthe 1920s. California’s commercial fisheries for squid and coastal tunas developed earlier andapart from wetfish. The fishery for California market squid was initiated by Chinese immigrantsat Monterey in the 1860s; small quantities of squid were first landed in southern California in theearly 1900s. Fields (1965) reported landings ranging between 1 and 2,862 short tons in the LosAngeles area between 1944 and 1960. The fishery for coastal tunas was started by Portugueseimmigrants in both central and southern California in the 1880s, although the commercialfisheries for bluefin, yellowfin and skipjack did not emerge until forty years later (McEvoy 1986,Bayliff 2002, Coan 2002).
From the early 1900s through and just beyond World War II, the wetfish industry experiencedphenomenal growth, due to technological, infrastructure and market developments fueled by theworld wars. Much of this development was spurred by federal contracts to expand the productionof sardine as a critical source of protein. Under the War Food Administration, nearly 50% of thecatch went to reduction for fishmeal to support the growing poultry industry and other wartimeneeds (McEvoy 1986). The end of this era, however, also saw the collapse of the sardine fisheryin the Monterey Bay area in the early 1950s, soon followed by the collapse of the fishery insouthern California (Parrish 2000, Wolf et al. 2002). Industry observers assert that the collapse ofthe sardine fishery was due, in part, to increased federal pressure for fish products to meetwartime needs, and a concomitant lack of regulation (Crehan pers. comm.).
The late 1950s through the early 1960s constitute the next era in the industry, one characterizedby the devastation of the sardine collapse on the one hand and the emergence of new technologiesand opportunities on the other. While the larger seiners and canneries shifted their effort andoperations offshore, the smaller seiners, lampara and scoop boats and fresh fish markets wereforced to face the challenge presented by the collapse of the sardine fishery. To adapt, theyshifted their effort to the more abundant anchovy, mackerel, squid and coastal tuna fisheries

Wetfish Socio-Economic Profile 8
which until then had played a secondary role to sardine. Fishermen in both the large vessel andthe small vessel fleets adopted several technological innovations including nylon nets to replacecotton ones, the power block to assist and speed retrieval of the net, and spotter planes and sonarto help them locate schools of wetfish and coastal tunas. Shoreside, the fresh fish markets beganto develop new freezing and storage capabilities on a small scale (in some cases closely linked toregional agricultural production) to improve and expand production of the available species.
Resource availability continued to deteriorate, however, leading to a shift in state resourcemanagement strategies and the beginning of the next period in the industry’s development. From1965 through 1974, the California wetfish industry, along with several others in the state and thenation, became subject to control through the use of quotas and other measures. By 1970, fishingfor all of the CPS finfish species was sharply curtailed by a series of measures: the imposition ofa quota on anchovy reduction in 1965, a moratorium on the directed non-bait sardine fishery in1967, and a moratorium on the Pacific mackerel fishery in 1970. The bait fishery for sardineremained open until 1974, when it, too, was closed pending recovery of the stock.
The circumstances of the wetfish industry changed again in the mid 1970s with the passage of theMagnuson Fishery Conservation and Management Act in 1976. In 1977, the mackerel fishery wasre-opened under a strict quota. The following year, the federal government approved the NorthernAnchovy Fishery Management Plan (FMP), which transferred management authority for theanchovy fishery from the state to the Pacific Fishery Management Council (PFMC), and started along process of shifting management authority for all West Coast wetfish species to the Council.In 1975, U.S. fishing vessels were excluded from Mexican waters (Leet et al. 1992). This,followed by Mexico’s 1976 declaration of its 200-mile Exclusive Economic Zone, eliminatedmost of the transboundary fishery for coastal tunas that had helped support the San Pedro wetfishfleet (and other tuna fishermen in southern California) during the severe wetfish shortages sincethe 1950s. The closure of the Mexican fishing grounds to the U.S. fleet disrupted the supply oftuna to southern California canneries. Together with other factors including water quality, marinemammal and other environmental protection regulations, this led to most of the remainingsouthern California tuna canneries to cease local operations. Amid these declines, however, manyin the wetfish industry again turned their harvesting and processing attention to squid.
The 1982-83 El Niño brought further declines in the coastal pelagic species (CPS) with theexception of Pacific mackerel and bonito (Squire 1993, Konno et al. 2002). This downturn did notlast, however. Close monitoring of the sardine resource by the California Department of Fish andGame (CDFG) indicated that the spawning biomass had substantially increased. This led to theopening of a small directed fishery in 1986 of 1,000 short tons, although it would still be severalyears before sardine would resume an important role in the industry (Wolf et al. 2002). In 1985,landings of squid in southern California overtook those in the Monterey area (Yaremko 2002),signaling the expansion of that fishery as an integral part of the California wetfish industry. Overthe ensuing 10 years, the industry benefited from improving resource conditions and changes inregulations that spurred new developments in the industry. In the late 1980s, prohibitions on theuse of purse seines and attracting lights in Monterey Bay were lifted.6 By 1992, nearly all of theMonterey wetfish fleet had switched from lampara nets to purse seine gear (Spratt and Ferry1993). Several fishermen built or bought newer, larger, more seaworthy vessels, while others had 6 The use of light boats, however, was and remains prohibited in District 17.

Wetfish Socio-Economic Profile 9
their vessels stretched and sponsoned to support the use of purse seine gear and larger catches.These changes also increased the mobility of Monterey Bay area fishermen. Although some hadbeen traveling to southern California during the winter months to fish for squid since the early1980s, the changes that occurred in the late1980s made it possible for more of the Monterey fleetto do so. In the early 1990s, conditions in the fishery continued to improve somewhat, supportedby a small but growing squid fishery (Yaremko 2002). In 1991, the sardine quota was increasedfrom 1,000 to 8,150, and then to 10,000 short tons. The 1992-93 El Niño brought warmertemperatures and a temporary drop in otherwise improving resource conditions, although itsimpacts were minor compared to the 1982-83 El Niño.
Between 1994 and 1996, the industry continued to focus primarily on squid, spurred by theopening of the Chinese market and declining resource conditions in squid fisheries elsewhere(e.g., the Falkland Islands). The squid fishery attracted fishermen from Washington and Alaska,some with strong family ties to the historic San Pedro fishery. Receivers and processors likewisefocused more of their attention on squid, activating and further investing in latent communication,transportation and production networks to build new capacity for receiving squid (and to a lesserextent, other wetfish). Several processors expanded their operations to include facilities at two orall three of the industry’s three centers of activity: Monterey, Ventura/Port Hueneme and SanPedro/Terminal Island. Meanwhile, the sardine resource continued to rebound, and the quotacontinued to increase (Wolf et al. 2002). Together, squid and sardine held new promise for theindustry and its participants as they entered a new era during the latter half of the 1990s, that ofthe present day California wetfish industry.
Section 4: The Present Day California Wetfish Industry
The present day wetfish industry emerged from the many and diverse developments in thehistoric industry described in the previous section. To provide a socio-economic profile of thepresent day industry, we build upon that understanding with in-depth analysis of its three centersof activity (from north to south): the Monterey Bay area in central California, and theVentura/Port Hueneme and San Pedro/Terminal Island areas in southern California (Figure 1).We describe the fishery, participants and practices at each of these sites in terms of four keyfeatures: resource availability; ports and associated infrastructure; processors' (or "markets'")receiving capacity; and the fishermen, their fishing operations and their ties to those markets.
Before proceeding, however, we provide a general overview of how the industry operates acrossthese sites. Even as there are important distinctions within and among the three centers ofactivity, they also have much in common in how they harvest, deliver, receive, process anddistribute California wetfish, the rules that govern these activities, and the basic infrastructure,goods and services that both support and depend upon the industry.
Fishing for wetfish and coastal tunas occurs in state and federal waters off the California coastand around the Channel Islands. Fishermen deliver their catch primarily at Monterey and MossLanding in central California, and San Pedro, Terminal Island, Port Hueneme and Ventura insouthern California (Figures 2, 3 and 4).7 Fishing for wetfish commonly entails the use of round 7 From time to time, CPS finfish and squid are also landed at other California ports such asAvila/Port San Luis and San Diego.

Wetfish Socio-Economic Profile 10
haul gear such as purse seines and drum seines to catch CPS finfish, squid and coastal tunas.Most fishing occurs at night, with vessels leaving port as early as noon (from San Pedro to fishthe northern Channel Islands) and as late as midnight (from Monterey to fish the Bay). Presentday vessels are equipped with fish-finding equipment including sonar, fathometers and globalpositioning systems (GPS). Skippers also draw upon their own knowledge and experience tolocate fish. Most use radios and cellular telephones to communicate with running partners, spotterpilots and light boat operators, other vessels in the fleet and the market.
When a "fishable" school of CPS finfish (anchovy, mackerel or sardine) is located, the net isdeployed from the stern of the vessel, assisted by a skiff, which holds one end of the net and itspurse line, while the purse seiner lays out the net to encircle the fish. Once the net is fullydeployed, the skiff returns the purse line to the seiner, where it is drawn using a hydraulic winchto enclose the fish in the net. The skiff man then fastens one side of the net to the skiff rail to helphold it open while the crew on the seiner work the net. The purse seine crew, assisted by a powerblock, begins to “dry up” the net to concentrate the catch alongside the boat. The crew deploys ahydraulic pump to pump the fish aboard through a large (12-24") hose, through a dewatering boxand into the hold. (A few seiners use a hydraulically powered scoop net rather than a pump toload the catch. Scoop boats use manual power or a hydraulic stocking brail to load the catch.)Seiners typically make two to four sets a night of several tons each, either to reach a market-imposed limit or to fill the boat if no limit is in effect. [Wetfish purse seiners have an averagecapacity of about 60 short tons (PacFIN data).] Some vessels are equipped with separate (orseparable) holds, allowing them to catch and deliver more than one species on a trip. Seiners mayalso catch mixed loads of mackerel and sardine, which sometimes school together.
The vessel then returns to port to deliver the fish to receivers. Most receiving stations consist of adocking facility with a shore-based pump that is used to transfer the fish from the hold to aweighing bin with a scale. Once the fish is weighed, it is transferred to totes, which docksidelaborers pack with ice. The loaded totes are then transferred by forklift to a truck for transport tothe processing plant. (Where a receiver/processor also has on-site processing facilities, the fish ispumped directly into weighing bins and then released into dry totes, which are moved by forkliftdirectly to the packing line.)
Statewide, there are 16 major firms, and a number of smaller receivers and processors whoparticipate in the California wetfish industry (Figures 5a-5d). Processing and packing facilities forCalifornia wetfish are located as far north as Watsonville and as far south as San Diego. Thecatch is variously processed, packed and sold in a variety of forms domestically for humanconsumption, petfood and bait, and exported for secondary processing, human consumption andaquaculture feed. (See Hackett’s Wetfish Economics report for more detailed information.)
The wetfish industry’s squid and tuna activities differ in a few notable ways from thoseassociated with CPS finfish. When fishing for squid, seiners usually are assisted in locatingand/or attracting squid by smaller "light boats" equipped with high intensity lights (limited to30,000 watts per vessel). Typically, seiners pay the light boat 20% of the gross revenues for squidcaught by this method. Some light boats also scoop squid for bait operations and/or specialtymarkets. As with CPS finfish, most squid fishing occurs at night, with landings delivered toreceivers in the Monterey, Port Hueneme/Ventura and San Pedro/Terminal Island areas in themorning, pumped into totes, and trucked to processing and packing facilities. Squid caught inMonterey Bay is landed and delivered to packing facilities within that area. Most of the southern

Wetfish Socio-Economic Profile 11
California catch is received at Ventura, Port Hueneme and San Pedro, by processors based in theMonterey, Port Hueneme/Ventura and San Pedro/Terminal Island areas, and delivered to packingfacilities from the Monterey area to San Diego (Figures 2, 3 and 4).
The distinctive features of the industry’s tuna activities include the use of larger purse seine netsand spotter pilots. Seiners typically pay spotter pilots 5 to 6% of their gross revenue from CPSfinfish and coastal tunas.8 Most tuna landed by the fleet is received by the wetfish markets andsold whole or headed and gutted, either fresh or frozen locally, or frozen for export.
Within the state, an extensive array of marine service and supply providers, from harbors, fueldocks and boatyards to trucking companies and packing material suppliers, play a criticalsupporting role to the industry, and in turn depends on the industry for business, revenues andother benefits. Harbors provide docking and associated facilities and services to both fishermenand receiver/processors for a fee, while relying on the tonnage delivered by the fleet to qualify forfederal dredging support. Fuel docks and boatyards provide fuel and other necessary goods andservices for vessel maintenance and operation, and depend on the fleet for revenues. Ice facilitiessupply both fishing and receiving operations. While some of these facilities are specialized toserve the fishing industry, many also support the agriculture industry. This is also the case formany of the trucking companies, cold storage facilities, as well as businesses that supply packingmaterials and day laborers.
At present the wetfish industry is governed by both state and federal law. Except for World WarII, when the federal government managed the wetfish fishery to maximize production, the State ofCalifornia has had authority over the fishery. Since the 1960s, state regulation has includedquotas on sardine, mackerel and anchovy. Since the late 1970s, portions of the quota have beenallocated to the state's northern region (north of San Simeon to the Oregon border) and to itssouthern region (south of San Simeon to the U.S.-Mexico border). In 1998, Amendment 8 to theNorthern Anchovy FMP assigned sardine, jack and Pacific mackerel and squid to the samemanagement unit as anchovy under the FMP, renamed the Coastal Pelagic Species (CPS) FMP.Under the CPS FMP, sardine and Pacific mackerel are “actively managed” by the PFMC andsubject to annually determined harvest limits based on biomass estimates. Anchovy, jackmackerel and squid are "monitored" species not subject to federal harvest limits, but potentially toother forms of management. In 1999, the Council adopted a limited entry program for the CPSfinfish fishery south of Point Arena, California, effective January 1, 2000.
Over time, squid fishing has been regulated by the state with legislative measures that restrict theuse of lights to attract squid, limit days or times when fishing is allowed, and for several years,prohibited the use of purse seines in Monterey Bay. The growth of the squid fishery especiallysince the early 1990s has prompted increased management. In 1997, the California Legislaturepassed SB 364, which instituted a $2,500 permit for catcher vessels and light boats, and a 3-yearmoratorium on entry into the fishery. SB 364 also mandated a study of the resource and thefishery (funded by permit fees) to provide data for the development of a squid fisherymanagement plan. In the interim, the California Fish and Game Commission has adopted 8 Spotter pilots also assist in some wetfish fishing operations, including those of some vessels thatdo not also fish for tuna. Some spotter pilots also receive 2 to 3% of the revenue from squidfishing, although they do not usually assist in that activity.
Wetfish Socio-Economic Profile 12
regulations that extend the Monterey Bay area weekend closure statewide and require lightshields and limit squid attracting lights to 30,000 watts per vessel. A draft management plan isbeing developed and will soon enter the public review process, with a final plan to be adopted byDecember 31, 2002.
Coastal tunas and bonito are subject to minimum size regulations and other managementmeasures established by the state and consistent with federal regulations.9 Federal regulations arelargely focused on tuna seiners, vessels three to four times the net tonnage of California wetfishvessels, that fish in the Eastern Tropical Pacific. Nonetheless, these regulations also affect thelocal wetfish fishery. Skippers who fish for yellowfin tuna are required to obtain a license andparticipate in a logbook program mandated by the Inter-American Tropical Tuna Commission.The fishery is also limited by an international quota (310,000 metric tons in 2002) (Donley pers.comm.) Although no such regulations govern the capture of bluefin tuna, dealers who import orexport bluefin tuna are required to have a license and follow strict reporting requirements for allshipments. There are no regulations regarding skipjack tuna at present.
The apparent abundance of the wetfish and coastal tuna species has varied considerably overtime. Evidence suggests that their spatial and temporal distribution and their availability to thefishery are strongly influenced by water temperatures (as influenced by variable weather andclimate). In a study of the relative abundance of pelagic species targeted by the California wetfishfishery between 1962 and 1990, Squire (1993) found that sardine showed declining abundancebetween 1966 and 1983, but then began to increase into the mid 1980s, and that trend hascontinued to the present (Wolf et al. 2002). In 1999, CDFG declared the sardine resource to befully recovered (CDFG 1999). Anchovy abundance increased through the 1970s, peaked in 1981,then declined through the 1980s (Squire 1993). The continued low biomass of anchovy isattributed to natural influences, as the directed fishery remains small due to the relatively lowvalue of the species compared to other wetfish species (Bergen and Jacobson 2002). The northernanchovy has been labeled a "boom-and-bust" species, subject to extreme short- and long-termfluctuations in response to changing oceanographic conditions (Starr et al. 1998). Squid areparticularly vulnerable to changing oceanographic conditions (especially water temperature),which play an important role in their spawning, distribution and abundance (Hixon 1983).Declines in the availability of squid appear to be correlated with El Niño events, including the1997-98 event (CDFG 2001).
In the following sections, we present characteristics of the California wetfish industry for each ofthe three regional centers of activity. We begin in the most northerly area, Monterey Bay, andproceed south, discussing the Ventura/Port Hueneme area, and then the San Pedro TerminalIsland area.
Section 4.a: The Monterey Bay Area Fishery
Section 4.a.1: The Resource
9 The minimum size for bluefin tuna is 7.5 pounds; the minimum size for bonito is 24 inches forklength or 5 pounds (California Fish and Game Code Sections 8375 and 8377(a)).

Wetfish Socio-Economic Profile 13
Sardine, anchovy and squid are the primary species targeted by the Monterey Bay wetfish fishery.Both sardine and anchovy are schooling fish, and are found in fishable aggregations along thecoast, usually within state waters. Squid are targeted in spawning aggregations, which occur inrelatively shallow waters within Monterey Bay and further north and south along the coast.Monterey wetfish fishermen tend to fish within a few miles of port and within Monterey Bay,although they have ranged further up and down the coast to fish squid in recent years.
Landings of wetfish in the Monterey Bay area have fluctuated widely since 1981 (Figures 2, 3and 4). (Landings of coastal tunas are very small in the area’s cooler waters.) In the early 1980s,landings were dominated by squid, northern anchovy and mackerel. Landings of mackerelincreased during the 1982-83 El Niño, replacing squid and anchovy which had become morescarce with the warmer water. In 1985, the squid fishery re-gained some strength, and was themajor fishery for the fleet through the late 1980s. Landings of Pacific sardine by the fleetappeared in the latter 1980s, but did not expand notably until the mid 1990s when growth in localprocessing capacity made this a more viable fishery for the fishermen. Landings of all of thewetfish species strengthened in 1994, dipped briefly in 1995, and peaked in 1997. With the onsetof the El Niño in late 1997, however, landings of all of these species except Pacific sardinedropped off substantially. Although squid landings have been slow to recover in the MontereyBay area , landings of Pacific sardine have remained strong with 12,000 short tons worth over$950,000 in ex-vessel value landed in 2000.
Section 4.a.2: Ports and infrastructure
Monterey and Moss Landing are the two major wetfish receiving ports in the Monterey Bay area.Although they share a long history in the wetfish fishery, they differ notably from one another intheir administration, facilities and activity related to commercial fishing in general and thewetfish fishery in particular. Pillar Point Harbor (often referred to as Princeton or Half MoonBay) has been the site of wetfish industry activity as well, but on a much smaller scale.
Pillar Point Harbor is the only protected harbor between San Francisco and Santa Cruz. It wasestablished by the San Mateo County Board of Supervisors in 1933, and is administered by theSan Mateo County Harbor District. The harbor supports commercial fishing, recreational fishing,other recreational boating and tourism activities. It has 369 berths for commercial andrecreational vessels, and four commercial fish receiving facilities (San Mateo County HarborDistrict 2002). On-site marine facilities include a fuel dock and ice facility; other marine serviceand supply businesses are located nearby.
Compared to Moss Landing and Monterey, Pillar Point Harbor has been the site of limited squidlanding activity, and considerably less CPS finfish offloading. Between 1981 and 2000, thewetfish fleet landed just over 11,000 short tons of squid and less than 2,000 short tons of CPSfinfish (most of it anchovy). Most of the wetfish landed at the harbor is loaded into iced totes andtrucked to processing facilities in Watsonville and Salinas.
Issues for the wetfish industry at Pillar Point Harbor include the limited infrastructure forsupporting wetfish offloading operations and the distance to the region's wetfish processing andpacking facilities. A second issue is competition with other harbor uses such as sport fishing andtourism, although commercial fisheries are valued as a cultural backdrop and provide product forlocal fish markets and restaurants that in turn attract business to the area.

Wetfish Socio-Economic Profile 14
Monterey Harbor, which falls under the jurisdiction of the City, has supported wetfish industryactivities since the late 1800s. Commercial fish receiving operations are located on MunicipalWharf Number 2, the more northerly of the two wharves inside the harbor. (Wharf Number 1,also known as "Fisherman's Wharf", hosts tourism businesses.) Although the wharf had not beenupgraded in many years, a $3 million renovation began in 1999 (Scheiblauer pers. comm.). Fivefish wholesalers have facilities located on the wharf, which they operate under 5-year leases fromthe city. The wharf has two wetfish pumps and limited fish packing and storage facilities, and istherefore used predominantly for offloading fish into trucks for transport to processing andpacking plants in nearby Sand City and agricultural centers such as Watsonville and Salinas.Because of the limited space for vehicle traffic, receivers generally try to limit themselves to onetruck on the wharf at a time.
Other services including a fuel dock, a boatyard and chandleries are located just off the wharf andacross the harbor near the breakwater. Approximately 140 commercial fishing vessels, includingmore than a dozen purse seiners, occupy harbor slips (Scheiblauer pers. comm.). The harbor alsohas nearly 200 moorings in the outer harbor and east of the wharf where some of the squid lightboats tie up. Since 1997, wetfish deliveries at Monterey have diminished, with more of the catchbeing delivered to Moss Landing. Nonetheless, the commercial wetfish industry is still seen bymany as an important economic, social and cultural component of the Monterey community.
Moss Landing Harbor, Monterey Harbor’s regional counterpart for the wetfish industry, differsmarkedly. Moss Landing Harbor was opened in 1947 as a fish receiving site to complementMonterey and as a key fuel receiving site along the central California coast. The Moss LandingHarbor District is chartered to operate under the direct authority of the state. Adjacent to Highway1 and a coastal railroad line, and less than 30 miles from the area's agricultural productioncenters, it is well situated for fish receiving and commerce. The harbor itself is enclosed by a spitof land known as "the island", which extends west and north from the mainland and is the site ofmost of the harbor's commercial fishing facilities and activities.
Moss Landing supports a diversity of commercial fishing and receiving operations, includingthree wetfish receiving operations, two owned and operated by area processors and one ownedand operated by a receiver that does not process wetfish. As occurs at Monterey, wetfish arepumped from the holds of the boats to iced totes that are then loaded into trucks for transport toprocessing plants in nearby Watsonville, Sand City and Salinas. A fourth wetfish receivingstation is under construction as part of a larger Moss Landing Harbor renovation project. Currentsupport facilities include a fuel dock and marine supply store, a boatyard and other boatmaintenance services. In 1999, an estimated 300 commercial fishing vessels tied up at MossLanding; about 10 of those were purse seiners (Stilwell pers. comm.).
In recent years, wetfish have not played a large role relative to some of the other fisheries basedat Moss Landing, but that may be changing with the recovery of the sardine fishery and newproducts and markets being developed by local processors. Through the 1990s, until thedevastating 1997-98 El Niño, squid came to play an increasingly important seasonal role in theharbor as well.
In addition to commercial fishing, Moss Landing supports other forms of light industry includingmarine research, which has grown in its scope and land use in the past few years, recreational

Wetfish Socio-Economic Profile 15
fishing and marine tourism (e.g., whale watching). There are tensions among these user groups,although commercial fishing continues to be a high priority for the harbor (Stillwell pers. comm.).An issue for both the commercial fishing industry and the marine research community, however,has been the interruption of regular dredging of the harbor following the identification of DDTand other hazardous materials in harbor sediments.
Section 4.a.3: Processors and receiving capabilities
Four major wetfish receiver/processors are based in the Monterey Bay area. All have long-standing family ties to the fishing industry and to the region. Three have primary wetfishreceiving operations at Moss Landing Harbor. Two firms directly receive wetfish at MossLanding; the third contracts with a local receiver to offload vessels. Two of the Moss Landingreceiver/processors also have facilities on the Monterey wharf. One of these regularly receiveswetfish at the Monterey wharf, as does the fourth Monterey Bay area receiver/processor. All fourof the wetfish receivers load fish into iced totes for transport to processing and packing facilitiesin Watsonville, Sand City and Salinas.
These four firms differ in their processing and packing capabilities and capacities, products anddistribution. Their permanent staff ranges from 6 to 80 full time employees, with up to anadditional 80 to 500 people employed by these firms during the height of the season, primarily attheir packing plants. In addition to receiving, processing, management and sales staff, MontereyBay area processors employ truckers, either directly or under contract with local truckingcompanies. For example, one processor reported using up to 27 "semi" trucks per day whenlandings are at their height to transport fish from receiving stations to the processing plant.
Most of the wetfish produced by these four receiver/processors is frozen and sold overseas. In themid 1990s, one Monterey Bay area processor built a large canning facility in anticipation of newfishing and market opportunities for sardine. This facility also produces "individual quick-frozen"sardine, and other products from wetfish. Other Monterey Bay area processors produce "valueadded" product such as tubes, tentacles and breaded squid. While much of this product isexported for secondary processing, human consumption, bait and animal feed, some is locally andnationally distributed to secondary processors as well as wholesale and retail outlets.
Section 4.a.4: Fishing operations and their participants
Although a great number of vessels have landed wetfish at Monterey Bay area ports over time, asmaller subset of them, known collectively as the Monterey Bay wetfish fleet, accounts for themajority of landings. The skippers and crew who operate these vessels have extensive social,cultural and economic ties to the wetfish fishery.
Our Sea Grant (SG) and Channel Islands (CI) studies of the squid fishery included surveys of 11purse seine skippers from the Monterey Bay area wetfish fleet. (Four of these skippers wereinterviewed for both studies.) Our ethnographic research included informal interviews with theseand other members of the Monterey wetfish fleet, and observation of fishing-related activities inthe area. The quantitative results presented below are drawn from the surveys conducted for theSG study (N=8), the CI study (N=9), or both ("SG+CI", N=11), and from PacFIN data on vesselcharacteristics.

Wetfish Socio-Economic Profile 16
The 11 wetfish vessels operated by the Monterey skippers average 56.8 feet in length, 43.2 nettons, and 333 horsepower (Table 2). These vessels range in age from 11 to 53 years, the oldestamong them having been built just as the Monterey sardine fishery collapsed. Eight of the 11vessels are of steel construction, representing a generation of vessels primarily from the late1970s through the late 1980s (Table 3). The skippers interviewed for the SG study reported anaverage hold capacity of 55.7 short tons for wetfish (Table 4). Two-thirds of the fishingoperations sampled use a drum seine, which reduces the number of crew needed. Average crewsize of these operations was 4.6 and 4.7 (excluding the skipper) for the SG and CI samples,respectively, but ranged from three to seven for both groups (Tables 4 and 5).
The skippers we interviewed from the Monterey fleet are relatively young compared to thosebased at southern California ports. In 2000, they ranged in age from 25 to 44 years (mean = 36)(Table 6). They have an average of 11.8 years of formal education. Eight (72.7%) are members offamilies with historical ties to the fishery. Seven (63.6%) have family involved in their fishingoperation. As of 2000, these skippers had an average of 20 years of commercial fishingexperience (range = 9-25 years). Of the 11 skippers interviewed for the SG and CI studies, 10(91%) fish both central and southern California squid; some of them also fish for CPS finfish inboth regions as well. Some of the Monterey fishermen interviewed have participated in thesouthern California fishery since the early 1980s. All, however, consider their home port to be inthe Monterey Bay area (Table 8). Of the 11 Monterey wetfish fishermen interviewed, all exceptone have fished for multiple Monterey Bay area companies. As a rule, however, they sell theircatch to one processor at a time; all of them sell to Monterey Bay area receiver/processors in bothcentral and southern California.
To complete their annual round of fishing, many Monterey skippers fish for San Francisco Bayherring and Alaska salmon (Table 9). Recent events in these fisheries, however, have promptedmany Monterey fishermen to depend more on California wetfish. In the late 1990s, purse seinerswere eliminated from the San Francisco Bay herring fishery when the fishery was reserved forgillnet fishermen. Purse seiners received two gillnet permits in exchange for each purse seinepermit, but not all have remained in the herring fishery. Moreover, resource and marketconditions in the fishery have been highly variable. The Alaska salmon fisheries have likewisebeen problematic, primarily due to the low ex-vessel prices of the past several years.
Of the skippers interviewed for both studies, 81.8% own their vessels. Skippers were asked toestimate the replacement value of their purse seiners for both studies (Tables 4 and 5).Replacement values ranged widely, but averaged about $726,000 among SG study respondentsand $751,000 among CI study respondents. Skippers were also asked to provide estimates ofoperating expenses, which generally included fuel, maintenance, mooring and insurance, butexcluded crew, light boat and spotter pilot payments.10 Estimates of annual operating expenses forthe SG study averaged $82,365; for the CI study, estimated expenses for 1999 averaged $94,373 10 These figures do not include permit fees, gear or vessel purchases, and some other expenses.Respondents noted that insurance costs have increased dramatically over the past several years,but vary also depending upon whether and where they are actively fishing. Mooring costs alsovary among ports and by type of accommodation (slip or mooring buoy, transient or permanent).Several respondents reported expenses for a temporary slip (e.g., at Ventura or Channel IslandsHarbor for the winter squid fishery) as well as a permanent homeport slip.

Wetfish Socio-Economic Profile 17
in 1999. (See Pomeroy and FitzSimmons 2001 and Pomeroy and Hunter 2001 for furtherinformation on expenses.)
Section 4.b: The Ventura/Port Hueneme Area Fishery
Section 4.b.1: The Resource
The fishing grounds in the Ventura/Port Hueneme area include the northern Channel Islands andthe mainland coast from Point Conception south. These fishing grounds lie within the SouthernCalifornia Bight, which includes a diversity of oceanic biophysical habitats and a rich diversity ofspecies, including all of those targeted by the California wetfish fishery. Spawning aggregationsof Pacific sardine and Pacific and jack mackerel peak in the spring and early summer in thisregion (Weber 1997). Bluefin tuna periodically occur in the region, but Pacific bonito are morecommon. Both species are caught by California wetfish fishermen in the late summer and earlyfall.
As in the Monterey area, landings by the wetfish fleet in the Ventura/Port Hueneme area havefluctuated since the early 1980s, although there has been a notable increase in landings overall,due primarily to the growth in the squid fishery (Figures 2, 3 and 4). A number of fishermen fromboth the Ventura/Port Hueneme area and San Pedro, however, report that this area has been animportant source of Pacific mackerel and coastal tunas, especially in the late 1980s. Through theearly 1980s, anchovy and mackerel dominated the catch, but were surpassed by squid landings in1986. Whereas anchovy landings remained well below 400 short tons through 1996, and averageannual landings of mackerel dropped from 5,100 short tons in the 1980s to just over 400 shorttons between 1990 and 2000, sardine and squid landings grew. Sardine landings first exceededmackerel landings in 1990, and averaged over 1,300 short tons per year through 2000. Squidlandings in the area jumped from 1987 to 1988 and again from 1994 to 1995. With the exceptionof El Niño years 1992 and 1998, squid have been the most important species in tons and valuecaught in the Ventura/Port Hueneme area since 1986.
Section 4.b.2: Ports and infrastructure
Four harbors in the Ventura/Port Hueneme area play an important role in the California wetfishfishery. From north to south, they are: Santa Barbara, Ventura, Channel Islands Harbor and PortHueneme.
Santa Barbara Harbor is administered by the City of Santa Barbara, and is geared primarilytoward coastal tourism and recreation. Nonetheless, it has supported a variety of commercialfisheries since 1933 (Hazard pers. comm.). It has over 1,100 slips, 19% of which are reserved forcommercial fishing vessels, although in mid 1999, only 10 to 11% were in use (Hazard pers.comm.). On-site facilities include a fuel dock, an ice-producing facility, a chandlery, a smalldrydock facility, and a marine surveyor, and serve both commercial and recreational users.
Compared to Port Hueneme and Ventura, Santa Barbara Harbor has played a minor role in thewetfish industry. Very little wetfish is landed at Santa Barbara, although a few thousand dollarsworth of northern anchovy and mackerel have been landed in some years. Since 1984, landings of

Wetfish Socio-Economic Profile 18
coastal tunas by those involved in the wetfish fishery have amounted to less than $3000 per year.Squid, however, has played a more prominent role, especially in the past seven years. At leastsome squid has been landed at Santa Barbara every year since 1981, although there is nopermanent receiving station at the harbor. Santa Barbara Harbor's interest in squid increased inthe mid 1990s. Because of the harbor's tourism and recreation focus, however, the offloading ofsquid has been tightly managed. The harbor requires the use of a portable pump and tanker trucksrather than totes, and limits offloading to the early morning hours. One receiving operationoffloaded squid at Santa Barbara in 1996 and 1997, but did not do so the next year because thescarcity of squid during the 1997-98 El Niño made this operation economically impractical.Almost no squid was landed at Santa Barbara in 1999; landings picked up again in 2000. In late2001, a Monterey Bay area firm established a receiving station at the harbor (in place of theprevious one).
Although Santa Barbara Harbor is strongly oriented toward recreation and tourism, formerHarbormaster Hazard noted that commercial fisheries bring both tangible and intangible value tothe harbor. Nonetheless, there are several issues associated with squid offloading at the harbor.These include sanitary issues caused by birds attracted to the offloading site, spillage and stainingof docks and walkways by wastewater ("stick water") from vessels and offloading operations thatcontains fish, seawater and oil residues, and other potential incompatibilities with tourism andrecreation businesses and activities at the harbor.
Ventura Harbor is operated by an independent port district that was established by the Cityfollowing a vote of its citizens in 1952. In contrast to Port Hueneme, Ventura Harbor is ashallow-draft, small boat harbor. Existing facilities that support the commercial fishing industryinclude a "fisheries building" that houses three fish buying stations and a fish market, an iceflaking facility, a boatyard, a fuel dock and a nearby chandlery. Recent additions include a 150-ton boatlift and a second fuel dock. The harbor has over 1,300 slips in 3 marinas. Commercialfishing activity is concentrated in one of the marinas (adjacent to Ventura Harbor Village, thetourism complex). About 70% of the marina's 200 slips are occupied by commercial vessels(Johnson pers. comm.), the majority of those being fishing vessels. There are three wetfish/squidpumping stations located at Ventura Harbor. The first of these was installed in 1985. A fourthreceiver has used a portable pump to receive squid at the harbor as well. Although space fortrucks is limited, a few can park behind and between the fisheries building and the boatyardoffice. The wetfish (primarily squid) landed at Ventura Harbor is pumped from the vessels toweighing stations (through lines laid under the Harbor Village walkway) where it is loaded intototes with ice. The totes are loaded into refrigerated trucks and transported to processing plants inthe Monterey Bay, Los Angeles and San Diego areas.
A recent Ventura Harbor Port District study cited commercial fishing as one of three economicsectors, along with tourism and recreational boating, of "crucial importance" to the harbor(Belknap 2001). The report also notes, "The health of the commercial fishing industry impacts theharbor in several primary and secondary ways. Direct revenues are generated from slip leases,fish handling and fuel usage. Indirectly, the commercial fishing workers bring activity andspending to the retail area and fishing operations also provide an attraction for visitors" (Belknap2001: 21).
In recent years, Ventura has become an important site for squid offloading operations (Figure 2).In 1997, squid accounted for 94% of the fish offloaded at the harbor (Peña pers. comm.). As at

Wetfish Socio-Economic Profile 19
Port Hueneme, squid landings at Ventura Harbor first increased notably in 1985, but then droppedto near zero in the early 1990s. Landings resumed at a much higher level in 1993, and continuedto increase through 1996. The ex-vessel value of landings dropped somewhat in 1997 with theonset of the 1997-98 El Niño late in the year, just as the winter squid season was getting underway. Landings in 1998, at the height of the El Niño, were 10% of landings for 1997, butrebounded in 1999 to over 12,000 short tons of squid worth $4 million, and in 2000 to more than20,000 short tons worth $6.8 million. Over the past 20 years, the annual ex-vessel value of Pacificsardine, mackerel and coastal tuna landings by wetfish fishermen has been about the same, at justover $100,000, less than 1% of the value of squid landed at Ventura Harbor. Whereas mackereland coastal tuna landings have been spread out across the 20-year period, most sardine landingsoccurred between 1996 ad 1999. Northern anchovy landings have been minimal, with 219 shorttons worth less than $40,000 in ex-vessel value landed over the past 20 years, and less than 4short tons worth $2,000 landed since 1996.
Ventura Harbor managers’ efforts to accommodate a diversity of activities at the harbor,including commercial fishing, has highlighted issues for the wetfish industry. Recentimprovements at the harbor have been geared, in part, toward supporting the commercial fishingindustry. At the same time, the multiple and diverse uses of the harbor at times compete with oneanother, and raise concerns about public safety amid commercial fish offloading operations andassociated liability issues. Moreover, harbor managers are concerned about the wide fluctuationsin resource availability, and recent and pending changes in marine resource management. Inparticular, they are concerned that proposed marine reserves at the Channel Islands could limit orreduce the fishery's viability and its economic contribution to the harbor.
Channel Islands Harbor, located between Ventura and Port Hueneme, is owned and administeredby Ventura County. Its primary focus is recreation, including sport fishing. It is the site of a livebait holding facility that provides anchovy, sardine and squid to commercial and privaterecreational fishing operations in the area. Other than this facility, there is no wetfish receivingstation at the harbor. Several commercial fishing vessels and fish buyers not associated with thewetfish fishery use the harbor to deliver and receive fish and tie up. Support facilities include aboatyard, chandlery, fuel dock and other marine services. About 60 of the harbor's 2800 slips areallocated to commercial fishing vessels (Anonymous. n.d.). Most of these are located at theharbor’s "Commercial Fishing Marina" on the west side of the harbor. As many as four or fivepurse seiners, and several squid light boats tie up at this location. Some of the purse seiners areresident year-round, while others are based there only during the winter squid season. Membersof the Monterey Bay wetfish fleet also tie up at Channel Islands Harbor during the winter squidfishing season at slips located on the east side of the harbor at Channel Islands Landing.
Because little wetfish receiving and no wetfish pumping occur at the harbor, the issues for thewetfish industry at Channel Islands Harbor pertain more to vessel maintenance and traffic thanfishing or offloading per se. The harbor's emphasis on recreation limits the support directedtoward commercial fishing operations.
The Port of Hueneme is the top wetfish receiving harbor in the area, and has been the top squidreceiving port in the state since 1985. It falls under the jurisdiction of the Oxnard Harbor District,chartered by state government (like Moss Landing). As the only deepwater port between LosAngeles and San Francisco, it serves the cargo and offshore oil industries. The port also hostscommercial fishing activity, primarily the offloading of fish. [The harbor has 18 small craft
Wetfish Socio-Economic Profile 20
berths, few of which are used by commercial fishing vessels (Port of Hueneme 2002).] The portalso has a diesel-only fuel dock, but does not have ice, drydock, a chandlery or other facilities on-site, although Oxnard, nearby Channel Islands Harbor and Ventura offer many of these goods andservices. Six firms, including five processors of seafood and one bait company, offload wetfish atPort Hueneme. Each of the five processors has a portable pump and other equipment set up at aleased site in the port. Two of these stations are located in the inner port area, and three arelocated just inside the entrance to the port.
Port Hueneme has long been a site of wetfish offloading activity (Figures 2 and 4). A 1979 reporton the commercial fishing facilities in the region noted that the majority of the landings at PortHueneme consisted of squid and anchovy, which were then processed at a cannery in Oxnard andtrucked to Los Angeles for distribution (Bybee and Richards 1979:22). Landings of northernanchovy at Port Hueneme declined following the 1982-83 El Niño through the end of the 1980s,but have increased in the 1990s. Mackerel landings were strong through the 1980s, dropped off in1991, and have increased in the past few years (with considerable inter-annual variation).Landings of Pacific sardine began as soon as the moratorium was lifted in 1986, but remainedsmall until 1990 when an increased quota allowed for more fishing activity. Although landingsdipped in 1998, over 980 short tons of Pacific sardine worth over $230,000 was landed at PortHueneme in 1997 and again in 1999. In 1985, following the 1982-83 El Niño, squid landings atPort Hueneme began to increase markedly, with over 3,200 short tons landed in 1985, the yearsouthern California landings first exceeded those in Monterey. Through 1994, when 18,500 shorttons were landed, the ex-vessel value of squid landings at Port Hueneme ranged between$700,000 and over $4.7 million (except during 1992, a relatively mild El Niño year). The ex-vessel value of landings jumped in 1995 to about $14 million. Landings dropped to less than atenth of that value in 1998, the height of the 1997-98 El Niño. Landings rebounded in 1999 toover 57,000 short tons worth just under $20 million, and slowed somewhat to just over 50,000worth just under $10 million.
The issues for the wetfish industry at Port Hueneme are quite different from those described formost of the other wetfish harbors in the state, owing to the port's primary role as a cargo port.Vessels associated with the loading and offloading of cargo have priority over fishing vessels.Fishing vessels are required to remain outside the harbor until given permission by the port toenter, and must leave the harbor as soon as they have offloaded their catch. On occasion, theoffloading of wetfish vessels has been interrupted and the vessels have been required to leave theharbor temporarily to make room for an incoming or outgoing cargo vessel. A second issue forthe wetfish industry arose at Port Hueneme in 1999, when water quality problems were detectedcoincident with the high level of offloading activity at the port. The wetfish industry has sinceimplemented measures to better contain stick water from the vessels and offloading operations.Finally, the more general lack of support facilities such as an ice plant are problematic for theindustry. At present, receivers must truck ice in to the port, either from a local ice plant thatserves the region's local agricultural industry or from plants near the Monterey and Los Angelesarea wetfish processing facilities. Recent discussions between the port and receivers and serviceproviders, however, may lead to reorganization of offloading at the port to address many of theforegoing issues, and would include the installation of an ice plant on site.

Wetfish Socio-Economic Profile 21
Section 4.b.3: Processors and receiving capabilities
Historically, Port Hueneme has played an important role in the wetfish industry, predominantly asa receiving station, although a local cannery packed anchovy and squid through the late 1970s(Bybee and Richards 1979). With the recent growth in the southern California squid fishery,however, wetfish receiving capabilities have greatly expanded throughout the Ventura/PortHueneme area. Although the number of receivers and processors operating in the area variessome from year to year, eight wetfish processors regularly receive wetfish in the Ventura/PortHueneme area. Two of the eight (including one Monterey Bay area processor) have processingand packing operations in Oxnard, within a few miles of their receiving stations. Three of theport’s wetfish receiver/processors are headquartered in the Monterey Bay area, nearly 300 milesto the north. Two are based in or near the San Pedro/Terminal Island area, about 80 miles to thesouth. Three processors are based locally, although the processing and packing facilities of two ofthese are located at least 80 miles from the receiving station. (The characteristics of theprocessing firms based in the Monterey and San Pedro/Terminal Island areas are described intheir respective sections.)
Although the logistics and cost of establishing and maintaining these facilities are not trivial, thearrangements described above have proven practical. Improvements in navigation and fishfinding equipment, and in vessel safety and seaworthiness have enabled fishing operations toaccess and work more efficiently along the Ventura area coast and offshore at the ChannelIslands. Growth in the demand and new market opportunities for squid and, to a lesser extent,sardine, have made it worthwhile for fishermen to fish the area and for processors to developlocal receiving capabilities. Key factors that limit this expansion, however, include vessel transittime and the perishability of the product (especially squid). Transit time between the ChannelIslands and Ventura/Port Hueneme area coastal fishing grounds and receiving stations in the SanPedro/Terminal Island and Monterey areas ranges from about 8 to well over 14 hours. In contrast,transit time from the fishing grounds to Ventura Harbor or Port Hueneme is generally less than 6hours. It is more cost effective for processors to receive squid (and in some cases, wetfish) assoon as possible after it is caught, thoroughly ice and refrigerate it, and truck it to processingfacilities several hours away. Moreover, the recent influx of purse seiners primarily fromWashington to this area has increased the potential supply of squid to processors.
Wetfish receiving operations in the Ventura/Port Hueneme area include a newly establishedportable pump at Santa Barbara, three permanent pumps and one portable pump at VenturaHarbor, and five portable pumps at Port Hueneme, as well as bait receiving facilities at ChannelIslands Harbor and Port Hueneme. Each wetfish pumping operation employs from 2 to 10individuals to offload the fishing vessels. Whereas some receivers operate their own trucks, mostcontract with individual truck drivers or trucking companies to supplement or entirely cover theirfish transporting needs. The two local processing plants employ a few additional coremanagement and sales staff, and contract with temporary agencies for seasonal line labor toprocess and pack the fish. The timing of the southern California squid fishery during the wintermonths complements the local spring-summer-fall agricultural season, and affords ready sourcesof labor, transport and cold storage to the wetfish industry during the agricultural off-season.11
11 This arrangement has worked well for the past several years, although it was stressed duringand immediately following the 1997-98 El Niño. During the El Niño, the scarcity of squid led to

Wetfish Socio-Economic Profile 22
Section 4.b.4: Fishing operations and their participants
The fishing operations and fishermen involved in the Ventura/Port Hueneme fishery include largesubsets of the Monterey Bay and San Pedro/Terminal Island fleets. Although these fleets andparticipants are described in detail in the context of their respective home port areas, we providesome background on their activities in the Ventura/Port Hueneme area, followed by a detaileddescription of the Ventura fleet and its participants.
Many of the same factors that have prompted the development of shore-based receiving andprocessing infrastructure for wetfish in the Ventura/Port Hueneme area have also attractedMonterey Bay and San Pedro/Terminal Island fishermen to the area. In addition to the "pull" ofthe area's squid (and other wetfish) resources and associated economic opportunities, additional"push" factors have prompted purse seiners from Monterey Bay and San Pedro as well as thosefrom out-of-state to fish the Ventura/Port Hueneme area. For Monterey Bay area fishermen, thewinter Channel Islands squid fishery has provided a critical substitute for purse seiners recentlyexcluded from the San Francisco Bay herring fishery. Also for the Monterey Bay fishermen, andfor purse seiners from out of state, the squid fishery has proved lucrative in the face of decliningrevenues from summer salmon fishing in Alaska. San Pedro/Terminal Island fishermen have longfished the Channel Islands for mackerel, squid and coastal tunas, and particularly for squid in thelatter 1990s. Although the San Pedro fishermen usually have ready access to wetfish closer totheir home port, increased abundance and demand for squid have made it worthwhile for them tomake the long run up to the Channel Islands to fish. At the height of the season, some San Pedrovessels deliver to receivers and tie up at Ventura Harbor.
The Ventura fleet consists of the subset of fishermen who fish in southern California waters andtie up at area ports during most or all of the time they fish in California. These vessels include asmall year-round purse seine fleet, and a larger fleet of seiners from out-of-state, primarilyWashington. Of the 20 Ventura-based purse seine skippers surveyed for the SG and CI studies, 11fish for CPS finfish as well as squid.
The 18 vessels operated by the Ventura wetfish skippers we interviewed average 55.8 feet inlength, 56.5 net tons, and 364 horsepower (Table 2). The vessels range in age from 8 to 64 years(mean = 22.7 years). Eight of the vessels are of fiberglass construction, seven have steel hulls,two have wood hulls, and one has a "plastic" hull (Table 3). The 13 skippers interviewed for theSG study reported an average hold capacity of 63.6 short tons for wetfish (Table 4). As with theMonterey fleet, just under two-thirds of the fishing operations sampled use a drum seine. Even so,mean crew size was smaller than that of the Monterey fleet, at 3.5 for the SG study and 4.1 for theCI study (Tables 4 and 5). All of the Ventura wetfish fishermen have fished for differentcompanies over time. Generally, however, fishermen sell their catch to one receiver/processor at atime.
The skippers we interviewed from the Ventura fleet are older than those in the Monterey fleet,ranging in age from 30 to 60 years (mean = 44.4) (Table 6). They have an average of 13.2 yearsof formal education. Nearly two-thirds (65%) of them come from fishing families; just under one- cutbacks in local receiving and processing operations. The re-appearance and abundance of squidin the spring and summer of 1999 put a strain on local labor, trucking and cold storage resources,competing with the local agricultural growing season.

Wetfish Socio-Economic Profile 23
third (30%) have family involved in their fishing operation. In some cases, family historyincludes parents or grandparents who lived and fished in the San Pedro area decades ago. Venturaskippers' commercial fishing experience averaged 25 years (as of 2000), and ranged from 15 to41 years. Over half (55%) of the 20 skippers interviewed reported residing out-of-state. The 9Ventura skippers who reside in-state live in southern California, between Santa Barbara and SanDiego (Table 7). Seven of the eleven (63.6%) out-of-state residents consider their home port to bein Washington, while three (36.4%) reported Ventura as their home port.
In terms of their annual round of fishing, the Ventura fishermen fall into two groups (Table 9).One group, consisting primarily of resident fishermen, fishes in southern California only for CPSfinfish, squid and, on occasion, coastal tuna and bonito. Although some of the these fishermenhave also fished for wetfish and/or squid in the Monterey Bay area, none reported doing soregularly. The second group, which consists primarily of out-of-state fishermen, also fishes inAlaska during the late spring and summer with purse seine or gillnet for salmon and/or herring.This second group has been attracted by new opportunities in southern California’s winter squidfishery, especially with the availability and price problems in the Alaska salmon fisheries thatwere noted for Monterey fishermen.
Fourteen of the 20 Ventura/Port Hueneme skippers (70%) own their vessels. Skippers estimatedthe replacement value of their purse seiners for both studies (Tables 4 and 5). Replacement valueranged widely, averaging over $1 million in the SG study and $714,000 in the CI study. Marketvalue (measured in the SG study only) averaged just over $700,000, and ranged from $150,000 to$1.8 million. Estimates of annual operating expenses, averaged about $103,000 in the SG studyand $126,000 in the CI study.
Section 4.c: The San Pedro/Terminal Island Area Fishery
Section 4.c.1: The Resource
The fishing grounds most readily accessed by the San Pedro/Terminal Island wetfish fleet are theareas along the mainland coast spanning both north and south of the Los Angeles area, offshorebanks, and islands to the west, most notably Santa Catalina. The local wetfish fishery targets thefull range of wetfish species (northern anchovy, Pacific and jack mackerel, Pacific sardine andmarket squid), coastal tunas and bonito. The availability of these species to the fishery, however,varies considerably in time and space (Figures 2, 3 and 4). . Most fishing for mackerel occursfrom mid summer through the early fall when stocks are generally found closer to shore (subjectto the availability of the resource and the quota). Through the 1980s, mackerel (primarily Pacificmackerel) accounted for the greatest proportion, in both tons and value of the wetfish landed bythe San Pedro fleet. Mackerel landings increased in the latter 1980s, and peaked at a little over52,000 short tons in 1988 and 1989. They declined in the early 1990s, and have ranged betweenabout 10,000 and 20,000 short tons since, and peaked at just over 23,000 short tons in 2000. In2001, some southern California wetfish fishermen reported finding little mackerel, despite areasonably high quota. Sardine are a growing, year-round target of the fleet. Incidental landingsof Pacific sardine occurred in the early 1980s, then increased to 300 short tons in 1986 when thedirected fishery reopened. Landings fluctuated through 1990, then increased notably from about1,200 short tons to over 6,000 short tons in 1991 and 15,000 short tons in 1992. Landings havecontinued to grow as the annual quota has been raised with evidence of the recovery of theresource. Landings in the latter half of the 1990s ranged between 26,000 and just over 40,000

Wetfish Socio-Economic Profile 24
short tons, making Pacific sardine the second most important species to the region’s wetfishfishery in both weight and value landed. Northern anchovy landings played an important role inthe fishery of the early 1980s, but are currently the least important wetfish species to the SanPedro/Terminal Island area. Over 88% of all northern anchovy landings between 1981 and 2000were caught in 1981 and 1982. Since then landings have averaged about 450 short tons per year,with just over 1,500 short tons landed in 1999 and 1,300 short tons landed in 2000.
Coastal tunas (including bonito) have been of considerable importance to the San Pedro wetfishindustry, even as the closing of local canneries has reduced market opportunities for the catch.Fishing for coastal tunas usually occurs in August and September when the fish migrate intosouthern California waters. These species are more available to the fishery during warm wateryears, when they migrate into southern California waters from foreign waters further south. Thefleet’s landings of coastal tunas in the 1980s varied between about 4,300 and 8,900 short tons,and between about 1,500 and 8,700 short tons in the 1990s. Just over 1,200 short tons of coastaltunas and bonito were landed in the San Pedro/Terminal Island area in 2000.
During the latter half of the 1990s, squid landings in the San Pedro/Terminal Island area grewtremendously. Squid landed at San Pedro/Terminal Island had an ex-vessel value of nearly $1million in 1981, but dropped thereafter to a low of less than $40,000 in 1984. The following year,however, landings nearly reached their 1981 value. Landings held at well over $1 millionannually from 1986 through 1991, then dropped during the mild El Niño of 1992. Landingsrebounded the following year and climbed to over $5.8 million in ex-vessel revenue in 1997, thenplummeted to just over $130,000 worth in 1998. As occurred in the Ventura/Port Hueneme area,however, the fishery rebounded strongly in 1999, with landings worth over $9.1 million in ex-vessel value. Although much of this catch came from the region’s nearby fishing grounds, someof it also came from the Channel Islands, as some local fishermen continued to deliver toreceivers at San Pedro/Terminal Island despite the long transit.
Section 4.c.2: Ports and infrastructure
San Pedro Harbor and Fish Harbor on Terminal Island are the area’s main wetfish harbors. Bothfall under the jurisdiction of the Port of Los Angeles. Although extensive commercial fishingrelated activity occurs at both sites, most wetfish-related activity occurs in San Pedro Harbor. SanPedro Harbor includes the San Pedro Municipal Fish Market located on the west side of the Port’smain channel, and a side channel known as the "San Pedro slip". The fish market houses fivereceiver/processors who are involved in a variety of other domestic and import fisheries, as wellas the wetfish fishery. The landward side of the building includes loading docks. Facilities in thevicinity include a fuel dock, boatyards, marine repair facilities and chandleries.
Fish Harbor is located on Terminal Island, which lies just east of the Port of Los Angeles’ mainchannel and San Pedro Harbor. Many of the area’s canneries were located at Fish Harbor throughthe 1950s, with some remaining through the 1990s. (The last cannery closed in Fall 2001.) Onemajor wetfish receiving and processing operation is located at Fish Harbor, along with a petfoodprocessing plant. A third site at Fish Harbor has been used on a temporary basis for wetfishreceiving at various times by receiver/processors from all three regions. Other commercial fishreceiving and processing also occurs, and a diversity of fishing operations, from local gillnettersto longliners from overseas, tie up at Fish Harbor. A boatyard is located on the west side of theharbor.

Wetfish Socio-Economic Profile 25
Despite its lengthy history and strong social, cultural and economic ties to the area, the SanPedro/Terminal Island wetfish fishery has been overshadowed by the Port’s stronger interest inand attention to the cargo, oil and gas, and cruise ship industries. The loss of canning operationsthrough the latter twentieth century and the expansion of these other activities in recent yearshave exacerbated the neglect of the local commercial fishery facilities.
Section 4.c.3: Processors and receiving capabilities
Like the Monterey Bay area, the San Pedro/Terminal Island area's history as a receiving andprocessing center for California wetfish dates back to the late1800s. With the enhancement offreezing and storage capacities begun in the 1960s, the departure of the canneries, and the growthof new markets for squid, San Pedro's fish markets assumed a more prominent role in the wetfishindustry. As several industry participants have noted, "the fish markets became fish processors".
In the San Pedro/Terminal Island area, five major receiver/processors receive wetfish at theMunicipal Fish Market. Each of these firms operates offloading facilities which are leased fromthe Port. Each has a dockside pump to offload fish from the boats, scales to weigh the fish, and anenclosed area for small scale processing and/or packing. Wetfish are pumped ashore and intoweighing bins, then released into totes and packed with ice. The totes are then moved by forkliftfrom the dockside weighing station inside the facility where, in some cases, the fish are processedand packed, then loaded into trucks for regional distribution. Most of the catch, however, istransported by truck to processing and packing facilities elsewhere in the Los Angeles area (e.g.,Wilmington).
Two additional receiver/processors operate at Fish Harbor on Terminal Island. Whereas oneproduces petfood, the other processes and packs CPS finfish, squid and tuna products for humanconsumption. These operations, in contrast to most other wetfish receiving/processing operations,are entirely self-contained. The former is supplied by one or two purse seiners that regularlydeliver anchovy, sardine and mackerel. Fish are pumped from each vessel, up a two-storyconveyor, and into the plant to be processed into petfood. The fish delivered to the latter firm'sdockside receiving station is pumped directly from the vessel to a weighing bin inside the plant,released into totes, and then transferred by forklift to the packing line.
Most of the San Pedro/Terminal Island wetfish receiver/processors can receive between 200 and300 short tons of fish per day from as many as twelve purse seiners during the height of thewinter squid fishery. They employ from 6 to 20 dock personnel, and from 50 to over 300 peopleto process the fish. They also employ truck drivers, cold storage, sales, managerial andmaintenance personnel. Whereas some firms rely on seasonal labor to fill out their workforceduring the winter peak season, others maintain a large permanent staff.
The San Pedro/Terminal Island processors export most of the California wetfish and coastal tunathey receive. Much of this product is exported to China, Japan and Southeast Asian countries infrozen 50-pound blocks for secondary processing into frozen and canned products for humanconsumption. Some of the product, however, especially squid, is packed whole in 1-, 3-, 5- and25-pound boxes. At least one local firm does some "value added" production of prepared tubes,tentacles, rings and other squid products. Some processors also distribute a small amount ofwetfish locally.

Wetfish Socio-Economic Profile 26
In addition to these receiver/processors, the San Pedro/Terminal Island area also is the site of anumber of live and dead bait suppliers that serve private and commercial local sport fishingoperations. Typically, there is one live bait firm at each southern California harbor. At San Pedro,however, there are two, each of which is supplied by one or two live bait vessels. Each live baitoperation maintains barges in the harbor that serve as holding pens for sardine, anchovy andsquid. Private and commercial sport fishing boats can purchase live bait by the scoop (50-200pounds or more) directly at the barge, which is tended by one or two overseers. Dead bait isproduced in the San Pedro/Terminal Island area, both by the wetfish receiver/processorsdescribed above, and by dedicated bait receiver/processors with facilities located nearby (e.g., inGardena). These bait operations are considerably smaller, employing no more than a dozenindividuals. They are regularly supplied by a few of the smaller seiners. Almost all of this baitproduction is packaged in small units (e.g., one-pound bags) for sale to sport fishermen throughretailers throughout the region and, in a few cases, in other states.
Section 4.c.4: Fishing operations and their participants
The San Pedro wetfish skippers and crew, like their central California counterparts, haveextensive social, cultural and economic ties to the wetfish industry. Several of the skippers, andmany of the crew, come from families whose involvement in wetfish fisheries extends not onlyback in time, but also back to Italy and the former Yugoslavia.
Survey interviews conducted for the Sea Grant (N=12) and Channel Islands (N=8) studies of thesquid fishery included 16 purse seine skippers from the San Pedro/Terminal Island area fleet.(Because all of them tie up at San Pedro Harbor, we refer to them as the "San Pedro fleet".) Ourethnographic research also included informal interviews with other members of the San Pedrowetfish fleet, and observation of fishing-related activities in the area.
The vessels operated by the San Pedro skippers we interviewed average 67.2 feet in length, 62.7net tons, and 366 horsepower (Table 2). These purse seine vessels range in age from 11 to 65years, the oldest having been built at the height of the southern California sardine fishery. TheSan Pedro purse seine fleet is notably larger (in length) and older (average vessel age = 39.4years) than the Monterey and Ventura fleets. Seven of the 16 vessels have steel hulls, 6 havewood hulls, and the remaining three have fiberglass or aluminum hulls (Table 3). The skippersinterviewed for the SG study reported an average hold capacity of 64.6 short tons for wetfish(Table 4). In contrast to the Monterey and Ventura/Port Hueneme fleets, only one-third of the SanPedro fishing operations sampled for the SG study uses a drum seine. Average crew size (notincluding the skipper) was 5.5 (range = 3 - 8) for SG study operations and 6.9 (range = 3 – 9) forCI study operations (Tables 4 and 5). Operations that do not use a drum seine carry three to fivemore crew than those that do. In addition, most seiners add a crewman when fishing for tuna.
The skippers we interviewed from the San Pedro fleet are older than their Monterey and Venturacounterparts, and range in age from 33 to 67 years (mean = 49.8) (Table 6). They have an averageof 9.7 years of formal education. All of the skippers we interviewed come from fishing families,although only 6 (37.5%) have family involved in their fishing operation. Experience ascommercial fishermen ranged from 18 to 59 years, and averaged 35.6 years (as of 2000),considerably longer than the two other fleets. Of the 16 skippers interviewed for the SG and CIstudies, none fishes in the central California wetfish fishery. Fifteen (93.8%) of the skippers

Wetfish Socio-Economic Profile 27
interviewed reported San Pedro as their home port, including two fishermen who reside inWashington (Table 8). All three of the Washington residents have strong family, social andcultural ties to San Pedro.
San Pedro fishermen are almost entirely dependent on CPS finfish, squid and coastal tuna fortheir income (Table 9). Four of the 16 skippers interviewed have fished San Francisco Bayherring in the past, but none does any longer. Six (37.5%) of them have fished for salmon inAlaska in the past, but fewer do so at present. All of the San Pedro wetfish fishermen interviewedexcept one have fished for different markets over time. As a rule, however, they sell their catch toone of the San Pedro/Terminal Island receiver/processors at a time.
Most of the San Pedro skippers interviewed (87.5%) own their vessels; two are non-owneroperators. Skippers estimated the replacement value of their purse seiners, which ranged widelybut averaged about $1 million for both studies (Tables 4 and 5). Average market value (estimatedfor the SG study only) was considerably lower, at $529,000. Generalized estimates of annualoperating expenses for the SG study averaged about $99,800. For the CI study, which focused on1999 expenses only, this figure averaged just over $225,000.
Section 5: The California Wetfish Industry as a Whole
We have analyzed a variety of sources of data on the California wetfish fishery, includingarchival, survey and ethnographic data, to describe the cultural traditions and changing dynamicsof the present day fishery. The three regional centers of activity described in the preceding sectionare the primary nodes in the complex social and economic network that constitute the Californiawetfish industry. The main participants in the industry, the receiver/processors, the fishermen andtheir fishing operations, are characterized by a range of mobility and diversification thatinfluences their capacity to adapt to variability and uncertainty in both supply and demand forCalifornia wetfish and coastal tuna products.
The variability and uncertainty in supply stems from both "natural" and "anthropogenic" factors.Natural factors such as oceanic conditions, especially water temperature, have been shown to beclosely correlated with the abundance and distribution of CPS finfish, squid and coastal tunas(e.g., Squire 1993, Leos 1999). The disappearance of squid from the fleets' central and southernCalifornia fishing grounds during the 1997-98 El Niño provides a stark example of the potentialfor short-term fluctuations in resource availability to the fishery.
Among the significant anthropogenic factors that influence the supply of wetfish are commercialfishery regulations. It is assumed that fishermen will always find a market for their fish, and thatthe market will expand indefinitely to accommodate increased catches (although prices may alsofall as supply increases. This approach, which is the basis for most fishery regulation,oversimplifies how most fishery systems operate (Pomeroy and FitzSimmons 2001). The amountof wetfish caught has been governed by quotas for each of the three CPS finfish species since the1960s. These have included moratoria on directed take of Pacific mackerel and Pacific sardinefrom 1970 to 1977 and from 1974 though 1985, respectively. Time and area closures such as theweekend closure in the squid fishery also have influenced the supply of wetfish and associatedspecies, as have closures of Santa Monica Bay and areas at Santa Catalina Island and the ChannelIslands to round haul or all commercial fishing gear. The closure of Mexican waters to U.S tunafishermen in the late 1970s, and increased enforcement of the international border by the U.S.

Wetfish Socio-Economic Profile 28
government in recent years have also limited tuna fishing by the San Pedro fleet. Most recently,the moratorium on entry into the squid fishery in 1998 (and the prospect of permanent limitedentry) as well as the implementation of limited entry in the CPS finfish fishery in 2000 have alsoaffected the supply of these species.
Finally, supply is likely to be impacted by the proposed closure of fishing grounds as part of state,federal and international efforts to establish marine protected areas (MPAs) along the U.S. WestCoast. Within the state, a network of marine reserves is being planned pursuant to the 1999Marine Life Protection Act (MLPA). The recent Channel Islands marine reserve process pertainsto both state and federal waters around the Islands. Also in federal waters, the PFMC isconsidering marine protected areas (MPAs) for the U.S. west coast. A larger initiative involvingthe U.S., Canada and Mexico may lead to the establishment of a system of MPAs from Alaska toBaja California in the near future. These factors may affect the total quantity of fish landed, andare likely to influence the temporal and spatial distribution of activity both on the water andshoreside.
Similarly, the fishery is affected by variability and uncertainty in domestic and especially globalmarket demand for particular species, product types, amounts and prices. These, in turn, are afunction of the supply, for example, of squid from the Falkland Islands or anchovies from Peru,and demand for low cost squid by China or table quality sardine by Japan. These components ofsupply and demand external to the California wetfish fishery interact with one another in a globalcontext to dictate demand for California product.
California wetfish fishermen and receiver/processors alike have certain cultural characteristics,and have particular strategies they use, to respond to uncertainty and variability in resource,economic and regulatory conditions. Many industry participants have strong family ties and othersocial and economic relations that afford a source of resilience in times of economic stress.Within and across years, fishermen and receiver/processors also adapt by diversifying theiractivities, although the nature and extent of this diversification has changed over time and variesconsiderably within and among centers of activity, their respective fleets of fishermen, andgroups of receiver/processors.
Historically, the industry focused on the production of large volumes of CPS finfish to produce alimited set of products for lower end markets. Fishermen and processors were diversified in thesense that they shifted their effort among wetfish species according to their availability and theirprice in the market place.
This pattern has shifted somewhat, with the demand for high quality products in more complexand competitive global markets. As in the traditional wetfish industry, California wetfishfishermen are diversified in their ability to shift among the wetfish species. Market-imposed triplimits and other factors, however, have prompted many fishermen to improve their at-seahandling of fish. Those who also fish for San Francisco Bay herring or tuna are more diversifiedwithin their respective regional fishery contexts. Still others who fish in Alaska are perhaps evenmore diversified. This diversification has its liabilities, however, given the additional investmentsrequired to participate in these other fisheries and their own variability and uncertainty, whichhave been especially evident in recent years. Receiver/processors of California wetfish likewisehave diversified to some extent. Forms of diversification among them have included the shift of

Wetfish Socio-Economic Profile 29
fish markets to fish processors, reliance on multiple species, identification of and response to newmarket opportunities and the development of new product lines.
The rebirth of the sardine fishery and the growth of the squid fishery have occurred amid agrowing interest in squid, and to a lesser extent, sardine for human consumption. Changes ininfrastructure such as the loss of wetfish and tuna canneries and reduction markets, and the globaldemand for high quality product have led to incremental changes in how fish is handled on theboat, landed and packed, and to the identification and production of new product forms.

Wetfish Socio-Economic Profile 30
Section 6: Conclusion
Variability and uncertainty in resource availability and market demand are a given for the fishingindustry. Many fishermen and processors view this as an opportunity, but also as a challenge. Thevalue of California wetfish products is inextricably linked to sharp fluctuations in supply andvalue of competing commodities in the global market. Nevertheless, wetfish account for asignificant proportion of California commercial fishing landings, nearly 84% by weight and over29% by ex-vessel value in 2000.
The receptiveness of California ports and the maintenance of infrastructure to support theindustry varies within and among the three regions. Many port managers see value in the wetfishindustry to provide revenue to harbor operations directly, to help qualify for federal dredgingdollars, and to support local businesses. In some areas, the wetfish industry also provides a visiblecultural backdrop of the traditional fishing operations associated with historic California ports andharbors. However, real or perceived competition with other uses at some ports has createdtensions and problems. Fishing, receiving and processing operations require well maintainedinfrastructure and adequate space for efficient operation. They also need access to goods andservices including ice, fuel, marine supply goods, boatyards and qualified personnel to providethese, all at reasonable cost. These facilities, goods and services must be able to adapt tofluctuations in fishery activity associated with the seasonality and the inter-annual variability ofthe fisheries. At some ports, these facilities are in place or under construction, either in theinterest of supporting the commercial fishing industry, or because such infrastructure is of valueto other harbor users as well. At other ports such as Port Hueneme and San Pedro, the high valueof cargo and related industries has put a premium on space and facilities. As a result, the fishingindustry has been allocated a minimum of space, and operations have become congested.
In addition to the port and infrastructure issues noted above, California wetfish processors faceadditional challenges. Although many in the industry have mechanized their operations in recentyears, the production of value-added products from wetfish continues to require considerablehuman participation. As one processor noted, when it comes to producing value-added product,wetfish processing is still an "artisanal industry". In terms of both labor and facilities, the wetfishfishery is complementary to the regional agricultural economies of the Monterey andVentura/Port Hueneme areas, as it draws upon the same labor pool, services, supplies andsupporting facilities during agriculture’s low season. Freezing and cold storage capabilities toproduce and store "blast frozen" and "individual quick frozen" products also serve a criticalfunction in meeting the demand for quality products as well as providing fishermen andprocessors with the means to deal with the multiple sources of variation in both the supply anddemand for wetfish products. Industry participants note that wholesale prices have not kept pacewith the costs of these inputs.
The issues for California wetfish fishermen and their fishing operations include access toresources and the revenue they receive for their role in adding value to California wetfish andcoastal tunas. The importance of access to resources follows from the inherent variability anduncertainty in both local resource availability and demand for the catch. It is assumed thatfishermen will find a market for their fish, and that the market will expand indefinitely toaccommodate increased catches (though prices paid to fishermen may also fall as supplyincreases). Fishermen frequently highlight the importance of their annual round and the need to
Wetfish Socio-Economic Profile 31
adapt to changes in resource availability and demand. They count on at least one, hope for two oftheir fisheries to sustain their operations each year; an ideal year is one in which three of theirfisheries are abundant and bring a reasonable price. These may be the wetfish species (anchovy,mackerel, sardine and squid), but more likely also include coastal tunas, San Francisco Bayherring or Alaska salmon. Over the past two decades, however, ex-vessel prices have not keptpace with the costs of fishing. Moreover, increases in ex-vessel value during that time have notkept pace with increases in export value, as the real value of California wetfish and coastal tunaincreased by 317 percent between 1989 and 2000, real harvester revenues increased by 88.4percent in the same time period (Hackett Wetfish Economics report).
We have identified key socio-economic features of the present day wetfish fishery that areessential to understanding its dynamics and prospects for the future. Of particular importance arethe extensive and long standing social and economic linkages among fishery participants, whichafford both human and social resources and resilience that are critical to the fishery's viability.The increased mobility of fishermen and processors, their use of enhanced communicationscapabilities, and response to market demand for higher quality product have played a key role inshaping the current dynamic of the fishery. These features demonstrate the ability of Californiawetfish industry participants to adapt to uncertain and variable environmental, regulatory andglobal market conditions.

Wetfish Socio-Economic Profile 32
References
Anonymous. n.d. Channel Islands Harbor Overview. http://www.sailorschoice.com/ciharbor.htm.accessed January 2002.
Bayliff, W.H. 2002. Bluefin tuna. In Leet, W., C. Dewees, R. Klingbeil, and E. Larson, eds.California's Living Marine Resources: A Status Report. California Department of Fish and Game.
Belknap, A.S. 2001. Ventura Port District Study. Prepared for the City of Ventura. Ventura, CA.
Bergen, D., and L. Jacobson. 2002. Northern anchovy. In Leet, W., C. Dewees, R. Klingbeil, andE. Larson, eds. California's Living Marine Resources: A Status Report. California Department ofFish and Game.
California Department of Fish and Game (CDFG). 2001. Status of the Market Squid Fishery withRecommendations for a Conservation and Management Plan. Report to the Legislature.Sacramento: Marine Region, California Department of Fish and Game.
_____. 2000. Review of some California fisheries for 1999. California Cooperative OceanicFisheries Investigations Reports 41.
_____. 1999. Pacific sardine resource now officially recovered. CDFG Press Release, January 15,1999.
California Seafood Council (CSC). 2000. Directory of California Seafood Producers. SantaBarbara: CSC.
Coan, A.L., Jr. 2002. Skipjack tuna. In Leet, W., C. Dewees, R. Klingbeil, and E. Larson, eds.California's Living Marine Resources: A Status Report. California Department of Fish and Game.
_____. 2002. Yellowfin tuna. In Leet, W., C. Dewees, R. Klingbeil, and E. Larson, eds.California's Living Marine Resources: A Status Report. California Department of Fish and Game.
Crehan, T. Personal communication, February 2002.
Donley, P. Personal communication, January 2002.
Fields, W.G. 1965. The structure, development, food relations, reproduction, and life history ofthe squid Loligo Opalescens Berry. Fish Bulletin 131. Sacramento: California State ResourcesAgency, Department of Fish and Game.
Hazard, J. Personal communication, June 1999.
Hixon, R.F. 1983. Loligo opalescens. In P.R. Boyle, ed., Cephalopod Life Cycles, volume 1:Species Accounts. London: Academic Press. pp.95-114.
Johnson, J. Personal communication, December 1998.

Wetfish Socio-Economic Profile 33
Konno, E., P. Wolf, and D. Bergen. 2002. Pacific mackerel. In Leet, W., C. Dewees, R. Klingbeil,and E. Larson, eds. California's Living Marine Resources: A Status Report. CaliforniaDepartment of Fish and Game.
Leet, W.S., C.M. Dewees, and C.W. Haugen, eds. 1992. California's Living Marine Resourcesand Their Utilization. Davis, CA: Sea Grant Extension Program, Dept. of Wildlife and FisheriesBiology, University of California.
Mason, J., and T. Bishop. 2002. Jack mackerel. In Leet, W., C. Dewees, R. Klingbeil, and E.Larson, eds. California's Living Marine Resources: A Status Report. California Department ofFish and Game.
McEvoy, A.F. 1986. The Fisherman's Problem: Ecology and Law in the California Fisheries,1850-1980. Cambridge: Cambridge University Press.
Parrish, R. 2000. A Monterey sardine story. In Thomas, T., ed. The Sardine Fisheries. J.B.Phillips Historical Fisheries Report. Monterey: Monterey Maritime Museum, pp. 2-4.
Peña, O. Personal communication, February 1999.
Pomeroy, C., and M. FitzSimmons. 2001. Socio-Economic Organization of the California MarketSquid Fishery: Assessment for Optimal Resource Management. California Sea Grant ProjectFinal Report.
Pomeroy, C., and M.S. Hunter. 2001. The Channel Islands squid fishery. Summary prepared forthe March 21, 2001 Marine Reserves Working Group Meeting, Santa Barbara, CA, March 17,2001.
Port of Hueneme. http://www.portofhueneme.org/html/technical_info.html. accessed January2002.
San Mateo County Harbor District. http://www.smharbor.com/pillarpoint/. accessed January2002.
Scheiblauer, S. Personal communication, May 1999.
Spratt, J.D., and L.A. Ferry. 1993 A profile of the Monterey squid fleet in 1992. Marine resourcesadministrative report no. 93-1. Sacramento, CA: State of California, The Resources Agency,Department of Fish and Game.
Squire, J.L. 1993. Relative abundance of pelagic resources utilized by the California purse-seinefishery: Results of an airborne monitoring program, 1962-90. Fishery Bulletin 91(2): 348-361.
Starr, R. M., K. Johnson, E. Laman, and G. Cailliet. 1998. Fishery resources of the Monterey BayNational Marine Sanctuary. La Jolla, California Sea Grant College System, University ofCalifornia.

Wetfish Socio-Economic Profile 34
Stilwell, J. Personal communication, May 1999.
Weber, M.L. 1997. The Marine Fisheries of Southern California: A Briefing Book. San Pedro,CA: Cabrillo Marine Aquarium and Palos Verdes/South Bay Audubon Society.
Wolf, P., P. Smith, and D. Bergen. 2002. Pacific sardine. In Leet, W., C. Dewees, R. Klingbeil,and E. Larson, eds. California's Living Marine Resources: A Status Report. CaliforniaDepartment of Fish and Game.
Yaremko, M. 2002. California market squid. In Leet, W., C. Dewees, R. Klingbeil, and E. Larson,eds. California's Living Marine Resources: A Status Report. California Department of Fish andGame.


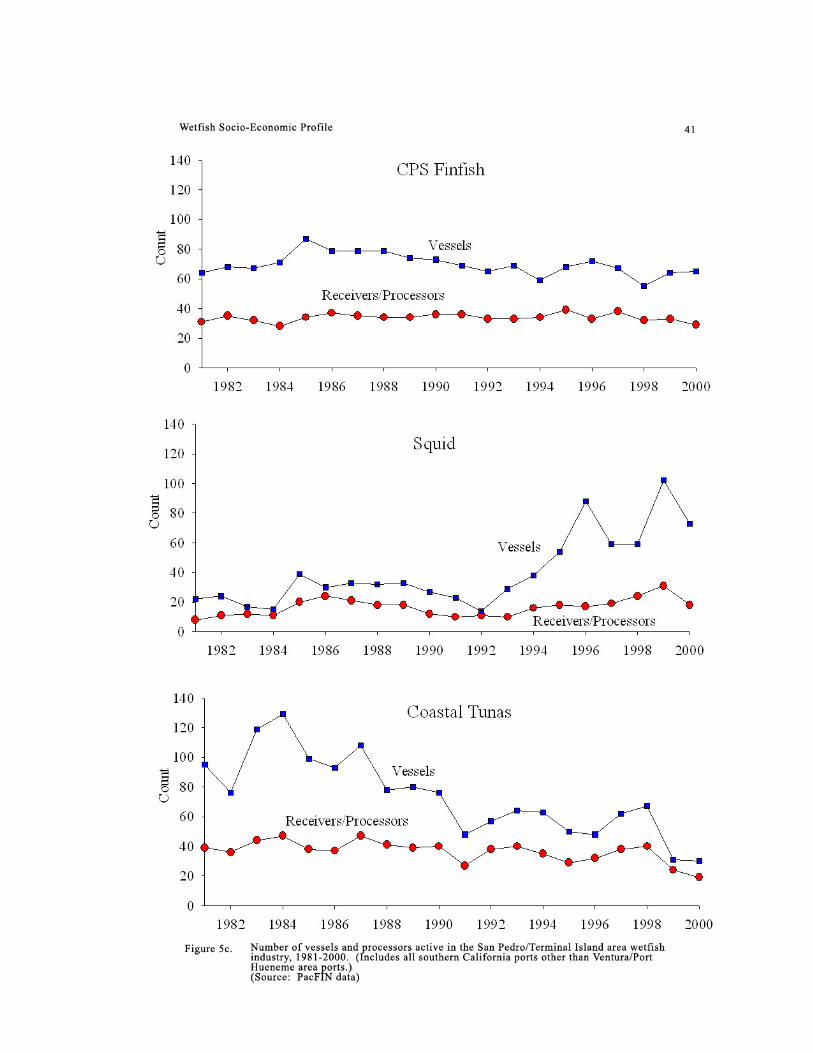


Wetfish Socio-Economic Profile 43
Table 1. Chronology of developments in the California wetfish fishery.1863 Commercial fishery for squid started by Chinese at Monterey1890s Sardine and mackerel first canned at San Pedro
Halfhill canned sardines at San Pedro<1900Gasoline engine first adopted by some vessels
1902 Booth experimented with canning sardine at Monterey1905 Lampara net introduced, Monterey Bay1918 Commercial fishery for northern bluefin tuna began1920s Pacific mackerel canned1925 Norwegian skipper at San Pedro experimented with purse seine to fish sardines1930s Lampara boats replaced by purse seines (sardine, mackerel)1935 CA reduction restriction removed1945 Squid first landed in S CA1947 Horse mackerel changed to jack mackerel (by US FDA)1950-51 Sardine collapse, Monterey1953 Sardine collapse, San Pedro1953 Purse seine nets prohibited in Monterey Bay1956 Nylon purse seine nets [and power block?] introduced
Squid attracting lights banned in Monterey Bay1959Power block adopted
1961 S CA squid fishery emerged1965 CDFG anchovy reduction quota established1967 Directed (non-bait) sardine fishery moratorium implemented1970 Pacific mackerel moratorium implemented1972 Peruvian anchoveta fishery collapsed1974 Sardine moratorium implemented1977 Pacific mackerel fishery re-opened (under quota system)1978 Northern Anchovy FMP implemented1980 CA wetfish fleet precluded from fishing Mexican waters for Pacific bonito1981 Jack mackerel included in Federal Groundfish FMP
State moratorium on Pacific mackerel fishery when biomass <20,000 tons1985S CA squid fishery overtook Monterey fishery in tons landed
1986 Directed fishery for sardine opened1988 Moratorium on squid attracting lights in most of Monterey Bay lifted1989 Purse seines and squid attracting lights permitted throughout Monterey Bay1991 Sardine quota increased from 1,000 tons to 10,000 tons1994 Opening of the Chinese market for squid1997 SB 364 Squid Fishery Management Bill passed1998 $2,500 permit for squid catcher and light boats instituted
Sardine fishery declared recoveredJack mackerel dropped from GFMP and added (as monitored species) to CPS FMP30,000 watt limit and light shields required for squid catcher and light boats
1999
Mandatory logbooks and statewide weekend closures for the squid fisheryimplemented
2000 CPS Limited Entry implemented; management (except squid) shifted to PFMC
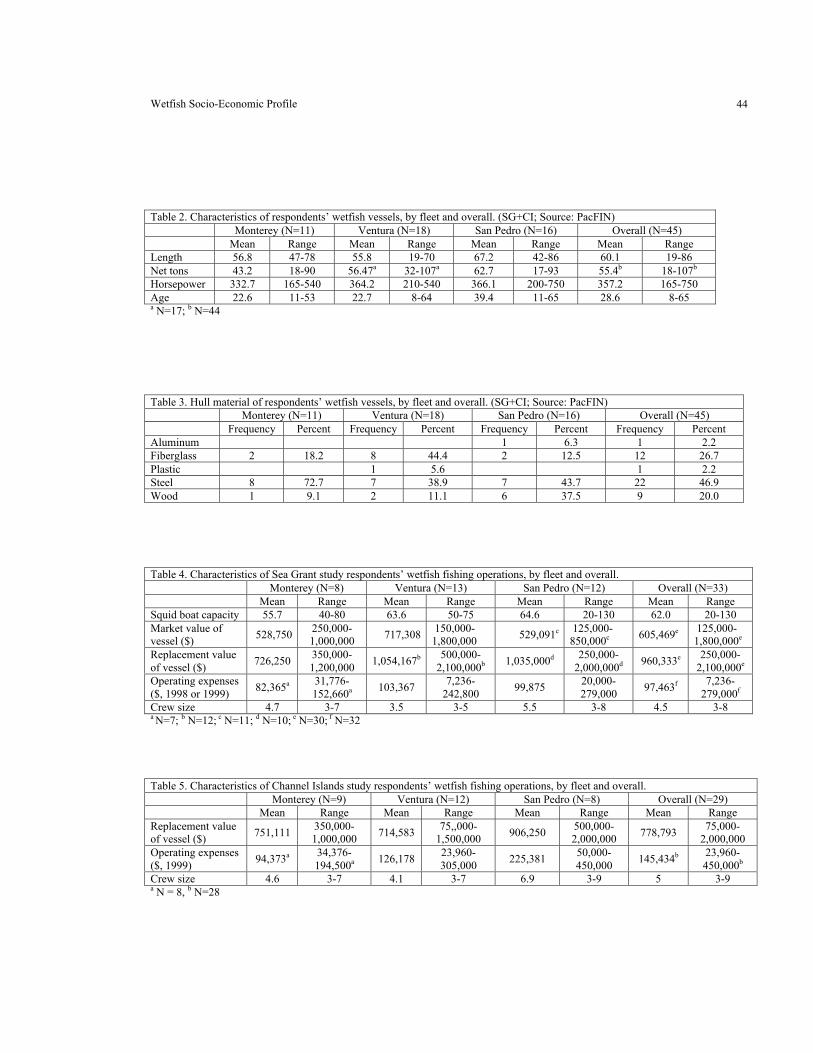
Wetfish Socio-Economic Profile 44
Table 2. Characteristics of respondents’ wetfish vessels, by fleet and overall. (SG+CI; Source: PacFIN)Monterey (N=11) Ventura (N=18) San Pedro (N=16) Overall (N=45)
Mean Range Mean Range Mean Range Mean RangeLength 56.8 47-78 55.8 19-70 67.2 42-86 60.1 19-86Net tons 43.2 18-90 56.47a 32-107a 62.7 17-93 55.4b 18-107b
Horsepower 332.7 165-540 364.2 210-540 366.1 200-750 357.2 165-750Age 22.6 11-53 22.7 8-64 39.4 11-65 28.6 8-65a N=17; b N=44
Table 3. Hull material of respondents’ wetfish vessels, by fleet and overall. (SG+CI; Source: PacFIN)Monterey (N=11) Ventura (N=18) San Pedro (N=16) Overall (N=45)
Frequency Percent Frequency Percent Frequency Percent Frequency PercentAluminum 1 6.3 1 2.2Fiberglass 2 18.2 8 44.4 2 12.5 12 26.7Plastic 1 5.6 1 2.2Steel 8 72.7 7 38.9 7 43.7 22 46.9Wood 1 9.1 2 11.1 6 37.5 9 20.0
Table 4. Characteristics of Sea Grant study respondents’ wetfish fishing operations, by fleet and overall.Monterey (N=8) Ventura (N=13) San Pedro (N=12) Overall (N=33)
Mean Range Mean Range Mean Range Mean RangeSquid boat capacity 55.7 40-80 63.6 50-75 64.6 20-130 62.0 20-130Market value ofvessel ($) 528,750 250,000-
1,000,000 717,308 150,000-1,800,000 529,091c 125,000-
850,000c 605,469e 125,000-1,800,000e
Replacement valueof vessel ($) 726,250 350,000-
1,200,000 1,054,167b 500,000-2,100,000b 1,035,000d 250,000-
2,000,000d 960,333e 250,000-2,100,000e
Operating expenses($, 1998 or 1999) 82,365a 31,776-
152,660a 103,367 7,236-242,800 99,875 20,000-
279,000 97,463f 7,236-279,000f
Crew size 4.7 3-7 3.5 3-5 5.5 3-8 4.5 3-8a N=7; b N=12; c N=11; d N=10; e N=30; f N=32
Table 5. Characteristics of Channel Islands study respondents’ wetfish fishing operations, by fleet and overall.Monterey (N=9) Ventura (N=12) San Pedro (N=8) Overall (N=29)
Mean Range Mean Range Mean Range Mean RangeReplacement valueof vessel ($) 751,111 350,000-
1,000,000 714,583 75,,000-1,500,000 906,250 500,000-
2,000,000 778,793 75,000-2,000,000
Operating expenses($, 1999) 94,373a 34,376-
194,500a 126,178 23,960-305,000 225,381 50,000-
450,000 145,434b 23,960-450,000b
Crew size 4.6 3-7 4.1 3-7 6.9 3-9 5 3-9a N = 8, b N=28

Wetfish Socio-Economic Profile 45
Table 6. Characteristics of surveyed wetfish skippers in 2000, by fleet and overall. (SG+CI)Monterey (N=11) Ventura (N=20) San Pedro (N=16) Overall (N=47)
Mean Range Mean Range Mean Range Mean RangeAge 36.0 25-44 44.4a 30-60a 49.8 33-67 44.26b 25-67bYears schooling 11.8 8-16 13.2 8-17 9.7 0-14 11.7 0-17Years commercial fishing 20.0 9-25 25.0 15-41 35.6 18-59 27.5 9-59
a N=19; b N=46
Table 7. State of residence of surveyed wetfish skippers, by fleet and overall. (SG+CI)Monterey (N=11) Ventura (N=20) San Pedro (N=16) Overall (N=47)
Frequency Percent Frequency Percent Frequency Percent Frequency PercentCalifornia 11 100 9 45 13 81.2 33 70.2Washington 10 50 3 18.8 13 27.7Alaska 1 5 1 2.1
Table 8. Home port of wetfish skippers, by fleet and overall. (SG+CI)Monterey (N=11) Ventura (N=20) San Pedro (N=16) Overall (N=47)
Frequency Percent Frequency Percent Frequency Percent Frequency PercentHalf Moon Bay 1 9.1 1 2.1Monterey 10 90.9 10 21.3Ventura 7 35 7 14.9Channel Islands Harbor 2 10 2 4.3San Pedro 15 93.7 15 31.9San Diego 2 10 2 4.3Washington 6 30 1 6.3 7 14.9Alaska 3 15 3 6.4
Table 9. Respondents’ annual round of fisheries, by fleet and overall. (SG+CI)Monterey (N=11) Ventura (N=20) San Pedro (N=16) Overall (N=47)
Frequency Percent Frequency Percent Frequency Percent Frequency PercentWetfish 10 90.9 11 55 16 100 37 78.7Squid 11 100 20 100 16 100 47 100Coastal tunas 1 9.1 3 27.3 14 87.5 18 38.4SF Bay herring 11 100 4 36.4 4 25 19 51.0Other CAfisheries 1 9.1 - - - - 1 2.1
AK fisheries 11 100 16 80 6 37.5 33 70.2

Disclaimer
The chapters and summary materials by Caroline Pomeroy and Steven Hackett included in thisreport were funded through a grant from the California Seafood Council (CSC). Pomeroy andHackett retained intellectual freedom regarding authorship of the analytical content and thenarrative description of their analyses. Therefore any views and opinions expressed in Pomeroyand Hackett's studies are strictly those of the authors, and do not necessarily reflect the views oropinions of industry participants, Diane Pleschner, or the California Seafood Council.
Acknowledgements
Pomeroy and Hackett would like to acknowledge the cooperation, support, and helpful commentsprovided by CSC Director Diane Pleschner in the preparation of their study reports, and thecareful review provided by industry participants. These reports would not have been possiblewithout the cooperation of industry participants who provided valuable information on theirknowledge of and experience in the industry. Pomeroy and Hackett would also like to thankPacFIN database manager Will Daspit, Pacific States Marine Fisheries Commission, Gina Wadeand Nancy Wright of the Marine Region GIS Lab, California Department of Fish and Game, andSteven Schellenberg. Valuable research assistance was provided by Matthew Krachey.
Both Pomeroy’s and Hackett’s studies were informed by Pomeroy’s prior research on the squidfishery. Pomeroy and FitzSimmons’ study of the squid fishery was funded by grant numberNA66RG0477 from the National Sea Grant College Program, National Oceanic and AtmosphericAdministration, U.S. Department of Commerce, project number R/MA-39 through the CaliforniaSea Grant College System, and in part by the California State Resources Agency. Matching fundswere provided by the Institute of Marine Sciences, UC Santa Cruz. Pomeroy’s study of theChannel Islands squid fishery was conducted under contract to NOAA. Both studies (as well asthe present effort) benefited immeasurably from the contributions, insights and good will ofwetfish fishery participants, resource managers and scientists. Monica Hunter, Marc Los Huertos,Natalie McKinney and Doug Reese provided invaluable assistance on both studies of the squidfishery.