Embed Size (px)
Citation preview
i
Socio-economic impact of Bt cotton in Bathinda district
of Punjab
A Dissertation submitted to the Central University of Punjab
For the Award of
Master of Philosophy
In
Economics
BY
Amandeep Kaur
Supervisor
Dr. A.S. Kahlon
Centre for Economic Studies
School for Social Sciences
Central University of Punjab, Bathinda
July, 2013

ii
DECALARATION
I declare that the dissertation entitled “SOCIO-ECONOMIC IMPACT OF BT
COTTON IN BATHINDA DISTRICT OF PUNJAB” has been prepared by me under
the guidance of Dr. A.S. Kahlon, COC, Centre for Economic Studies, School for
Social Sciences, Central University of Punjab. No part of this dissertation has
formed the basis for the award of any degree or fellowship previously.
Amandeep Kaur
Centre for Economic Studies,
School for Social Sciences,
Central University of Punjab,
Bathinda - 151001.
Date:
iii
CERTIFICATE
I certify that Amandeep Kaur has prepared her dissertation entitled “SOCIO-
ECONOMIC IMPACT OF BT COTTON IN BATHINDA DISTRICT OF PUNJAB”,
for the award of M.Phil. degree of the Central University of Punjab, under my
guidance. She has carried out this work at the Centre for Economic Studies,
School for Social Sciences, Central University of Punjab.
Dr. A.S. Kahlon
Associate Professor
Centre for Economic Studies,
School for Social Sciences,
Central University of Punjab,
Bathinda - 151001.
Date:
iv
ACKNOWLEDGEMENT
I consider myself fortunate to work under the supervision of Dr. A.S.Kahlon. This
dissertation would not have been possible without the unwavering support,
encouragement and guidance of him. I pay my deepest gratitude to respected Dr.
Paramjit Singh Romana, Dean Student Welfare, Central University of Punjab,
Bathinda for providing moral support and encouragement.
I owe my most sincere gratitude to Dr. R.K. Mahajan, Professor, Department of
Economics, Regional Centre, Bathinda, Dr. Anupama Uppal, Professor,
Department of Economics, Punjabi University Patiala and Dr. Sandeep Kaur
Bhatia, Assistant Professor, Centre for South and Central Asian Studies, Central
University of Punjab, Bathinda for their immense support and guidance.
My profound appreciation to Mr. Sumit Kumar, Research Scholar, Punjab
University, Chandigarh for his helpful insights on this topic.
Heartiest thanks to all my friends; Simranjeet Kaur (sister), Akarsh Arora,
Harwinder kaur, Ramandeep Kaur, Pallavi Goyal, Anita and Neha Jindal . My
extended thanks to all my seniors, juniors and non-teaching staff for their
cooperation.
My heartiest gratitude to my parents for their continuous support and constant
encouragement.
.
Amandeep Kaur

v
ABSTRACT
“Socio-Economic Impact of Bt Cotton in Bathinda district of Punjab”
Name of student : Amandeep Kaur
Registration Number : CUP/MPhil-PhD/SSS/CSS/2010-2011/06
Degree for which submitted : Master of Philosophy
Name of Supervisor : Dr. A.S.Kahlon
Centre : Centre for Economic Studies
School of Studies : School for Social Sciences
Key words : Bt cotton, socio-economic, Desi cotton,
Net returns, Yield.
An attempt has been made in this study to assess the socio-economic impact of Bt
cotton in Bathinda district of Punjab. The assessment is based mainly on primary
data which is processed by applying regression analysis, Probit model and simple
averages. On an average, 77.67 percent of total cropped area of the district is
under Bt cotton cultivation as compared to 0.39 percent of Desi cotton cultivation.
The decision of a farmer to adopt Bt cotton is significantly influenced by age and
education of the farmer i.e. younger and better educated farmers prefer Bt cotton
to Desi cotton. The study reveals that Bt cotton farmers are earning relatively
higher net returns than that of Desi cotton farmers by Rs 19336 per acre due to
relatively higher yield of 809 kg per acre as compared to Desi cotton yield of 420
kg per acre. The category wise analysis of Bt cotton farmers and Desi cotton
farmers shows that farmers belonging to „Others‟ category are earning more net
returns than the Marginal and Small farmers. It was largely due to increased area
under irrigation by „Others‟ category of farmers. The social impact on the basis of
perceptions of the sample farmers also revealed that Bt cotton is not adversely
impacting health and reduced number of sprays has improved the quality of
environment. Not a single farmer attributed the suicide cases to Bt cotton.
Although Bt cotton cultivation is economically viable, yet higher seed cost hinders
the pace of adoption by the Marginal and Small farmers. It is suggested that there
is an urgent need for government to regulate the price of seeds of Bt cotton.
Amandeep Kaur Dr. A.S.Kahlon

vi
TABLE OF CONTENTS
Sr. No. Content Page number
1. Introduction (Chapter I) 1-10
2. Review of Literature (Chapter II) 11-20
3. Objectives and Methodology (Chapter III) 21-28
4. Socio-Economic impact of Bt cotton
(Chapter IV)
29-43
5. Summary and Conclusions (Chapter V) 44-46
6. References 47-51

vii
LIST OF TABLES
Table
Number Table Description
Page
Number
1.1 Global area of major transgenic crops from 2001-2011(mn hectares)
3
1.2 Global area of GM crops during 2011 4
1.3 Area, Production and Yield of Cotton in India (2000-01 to 2011-12)
5
1.4 Area, Production and Yield of Major Indian states (2004-05 to 2011-12)
6
1.5 Area, Yield and production of cotton in cotton
belt of Punjab during 2000-01 to 2010-11 10
3.1 Area under cotton cultivation in cotton Belt of Punjab (2000-01 to 2010-11) („000‟ ha)
22
3.2 Area, Yield and Production of American and Desi Cotton in different blocks of Bathinda (2005-06 to 2010-11)
24
3.3 Area, yield and production of major crops in Bathinda (2000-01 to 2011-12)
28
4.1 Factors influencing Bt cotton adoption of Sample Farmers
32
4.2 Regression of Net Returns 33
4.3 General Characteristics of Farmers 34
4.4 Economics of Bt cotton and Desi cotton in 2011 and 2012 (Rupees per acre)
36
4.5 Economics of Bt cotton farmers (Category wise) (Rs per acre)
38
4.6 Economics of Desi cotton farmers (Category wise) (Rs per acre)
39
4.7 Average seed cost of Bt cotton and Desi Cotton (Rs per acre)
41
4.8 Application of spray (pesticides, insecticides, weedicides)
42
4.9 Hired Labour cost (Rs per acre) 42
4.10 Average Yield of Sample Farmers (Kg per acre)
43

viii
LIST OF FIGURES
Figure Number
Description of Figure Page Number
1 Area under Cotton cultivation in north zone during 2004-05 to
2011-12 (lakh hectares)
6
2 Cotton Production in north zone during 2004-05 to 2011-12 (lakh bales)
6
3 Yield of Cotton in north zone during 2004-05 to 2011-12 (Kg/ha)
7
4 Adoption of Bt cotton seeds in Bathinda (2002- 2009) 29

ix
LIST OF ABBREVIATIONS
S.No Full form Abbreviation
1 Genetically Modified GM
2 Bacillus thuringiensis Bt
3 Million Hectares mn ha
4 Kilogram per hectare Kg per ha
5 Rupees Rs.

Chapter I
Introduction
In today‟s world there is hardly any area left behind where science and technology
has not made any impact in one way or the other. Genetically Modified (GM) crops
are also the result of a type of technology known as „Genetic Engineering‟ which
involves either manipulation of genes within a species or transfer of genes from
one species to another. Use of such technology has lead to a new agricultural
revolution known as „Gene Revolution‟ in which biotechnology has enabled the
production of genetically modified crops (Wu and Butz, 2004). This revolution aims
at improvement in crop production, introduction of new plant varieties with more
nutrients and temperature resistance. Such characteristics allow these crops to
grow even in unfavorable conditions resulting in low cost and relatively higher
profits (NSTA, 2007).
Bt or Bacillus thuringiensis is a soil bacterium which was first discovered in
1901 by Ishiwata, a Japanese microbiologist and subsequently during 1915 a
German scientist isolated the crystal toxin in the Thuringen region of Germany.
Later on when the existence of some toxic (cry) to certain insects was found in Bt,
it was sold to France for spray formulation and during 1961 Bt was registered as a
microbial pest control agent under the Federal Insecticide and Rodenticide Act in
the US. In India Bt formulations have been registered under Pesticides Act 1968.
The genetic transfer technology encompassed these cry genes and produced Bt
proteins in plant cells to effectively kill the targeted insects (Kariharloo and Kumar,
2009).This made it possible to evolve insect resistant and highly productive
varieties of different crops. With the advent of biotechnology, this bacterial gene
has been introduced genetically into the cotton seed and it protects the plants from
bollworms, a major pest of cotton. The worms feeding on the leaves of a Bt cotton
plant become lethargic and sleepy and are gradually eliminated (Gandhi and
Namboodiri, 2006). This results in more production and relatively less use of
pesticide.
Due to a relatively higher yield of GM crops, the global area under
plantation of these crops had been increasing since their commercial cultivation in
1996. The area under cultivation increased from 1.7mn hectare in 1996 to 90mn
hectare in 2005 and further to 160mn hectares during 2011. Almost 50% of this

2
phenomenal increase during 2011 had been in the developing countries and it is
expected that the area under GM crops in developing countries would exceed than
that of developed countries during 2012. The top ten countries cultivating GM
crops in 2011 were USA (69 m. ha.), Brazil (30.3 m. ha.), Argentina (23.7 m. ha.),
India (10.6 m. ha), Canada (10.4 m. ha.), China (3.9 m. ha.), Paraguay (2.8 m.
ha.), Pakistan (2.4 m. ha.), South Africa (2.3 m. ha.) and Uruguay (1.3 m. ha.)
(The International Service for the Acquisition of Agri-biotech Applications, Brief 43,
2011).
Some of the globally cultivated transgenic crops are Soybean, Maize,
Cotton, Canola, Squash, Tomato, Poplar, Sugarbeet and Papaya. The global area
under cultivation of transgenic crops of soybean, maize and cotton has taken the
lead till date and it has increased more than two times (33.3m. ha. to 75.4 m. ha.),
five times (9.8 m. ha. to 51.0 m. ha.), and three times (6.8 m. ha. to 24.7 m. ha.)
respectively during 2011 (Table 1.1). With the passage of time the pace of
adoption of these crops improved due to its higher yields. Despite the
controversies regarding the adoption of GM crops, the area under cultivation of
these crops is expected to increase in future also.
Table 1.1
Global Area of major transgenic crops from 2001-2011 (mn hectares)
Year Soybean Maize Cotton Canola
2001 33.3 9.8 6.8 2.7
2002 36.5 12.4 6.8 3
2003 41.4 15.5 7.2 3.6
2004 48.4 19.3 9 4.3
2005 54.5 21.2 9.8 4.6
2006 58.6 25.2 13.4 4.8
2007 58.6 35.2 15 5.5
2008 67.8 37.3 15.5 5.9
2009 69.2 41.7 16.1 6.7
2010 73.3 46 21 7
2011 75.4 51 24.7 8.2
Source: The International Service for the Acquisition of Agri-biotech Applications Brief 43, 2011
These transgenic crops (Soybean, Maize, Cotton, Canola, Squash, Tomato,
Poplar, Sugarbeet and Papaya) are being cultivated in 29 countries of the world.
Out of these 29 countries, 19 are developing countries and 10 are developed
ones. It is estimated that 16.7 million farmers benefitted in these countries during

3
2011. Of the total beneficiaries, over 90% or 15 million (up 8% from 2010) were
small and resource-poor farmers from developing countries. The main
beneficiaries were from two countries i.e. 7 million in China and another 7 million
in India who planted a record of 14.5 million hectares of Bt crops. Out of 29
countries, 15 top countries are listed below in the Table 1.2. Among these 15
countries, India is doing well in the cultivation of GM crops. It has improved its
ranking to 4th position during 2011 as compared to 8th position during 2002. This
improvement in ranking can largely be attributed to the adoption of Bt cotton as the
area under cultivation has increased from 0.1 m. ha. during 2003 to 10.6 m. ha
during 2011.
Table 1.2
Global Area of GM Crops during 2011 (mn hectares)
Rank Country Area (in mn hectares) GM Crops
1 USA 69 Soybean, Maize, Cotton, Canola, Squash, Papaya, Alfalfa, Sugarbeet
2 Brazil 30.3 Soybean, Maize, Cotton
3 Argentina 23.7 Soybean, Maize, Cotton
4 India 10.6 Cotton
5 Canada 10.4 Canola, Maize, Soybean, Sugarbeet
6 China 3.9 Cotton, Tomato, Poplar, Papaya, Sweet Pepper
7 Paraguay 2.8 Soybean
8 Pakistan 2.6 Cotton
9 South Africa
2.3 Maize, Soybean, Cotton
10 Uruguay 1.3 Soybean, Maize
11 Bolivia 0.9 Soybean
12 Australia 0.7 Cotton, Canola, Carnation
13 Philippines 0.6 Maize
14 Myanmar 0.3 Cotton
15 Burkina Faso
0.3 Cotton
Total 160 Source: The International Service for the Acquisition of Agri-biotech Applications Brief 43, 2011
The introduction of Bt cotton has transformed the cotton crop into more
productive and profitable crop of the country. India has become the largest
producer and consumer of cotton after China during 2008-09 with 21% of the total

4
global production which became possible due to the adoption of BT cotton
(Kariharloo and Kumar, 2009). But the area, production and yield of cotton shows
a mixed trend in India since 2002 when the Bt technology was introduced in the
country (Table 1.3). However the area has shown an increasing trend since 2008-
09.
Cotton production increased to 307.0 lakh bales during 2007-08 from 140.0
lakh bales in 2000-01 but it fell to 290.0 lakh bales in 2008-09 due to erratic rainfall
and high pest incidence. The introduction of Bt cotton seeds has played a catalytic
role in enhancing cotton production in India. Incidentally, when Bt seeds were
introduced, cotton production dipped by 13.9% to 136.0 lakh bales due to the
severe drought that hit major cotton producing states such as Gujarat, Andhra
Pradesh, and parts of Tamil Nadu. The data on yield shows considerable
variations during 2000-01 to 2011-12. However, except two years (2002-03 and
2008-09) the commercial cultivation of Bt cotton seeds has brought about a
breakthrough in cotton production and this has led to significant improvement in
the productivity levels and living standards of Indian farmers.
Table 1.3 Area, Production and Yield of Cotton in India (2000-01 to 2011-12)
Year Area (lakh ha)
Production (lakh bales of 170 kg)
Yield (kg per ha)
2000-01 85.7 140 278
2001-02 87.3 158 308
2002-03 76.6 136 302
2003-04 76.3 179 399
2004-05 87.8 243 470
2005-06 86.7 241 472
2006-07 91.4 280 521
2007-08 94.1 307 554
2008-09 94 290 524
2009-10 103.1 305 503
2010-11 111.4 339 517
2011-12 121.9 345 481
Source: Cotton Advisory Board
Cotton cultivation in India is mainly concentrated in three zones i.e. Northern zone,
Central zone and Southern zone. Northern zone comprises Punjab, Haryana and

5
Rajasthan, the Central zone includes Maharashtra, Madhya Pradesh and Gujarat
and the Southern zone consists of Andhra Pradesh, Karnataka and Tamil Nadu.
Table 1.4
Area, Production and Yield of Major Indian states (2004-05 to 2011-12)
Zones 2004/05 2005/06 2006/07 2007/08 2008/09 2009/10 2010/11 2011/12
Northern Zone
A 15.68 15.94 14.87 14.56 12.85 14.62 13.57 16.95
P 43 46 50 44 39 40.25 39 50
Y 466 491 572 514 516 468 489 501
Central Zone
A 53.26 56.01 60.99 62.5 61.21 67.39 72.15 78.24
P 141 143 171 192 170 179 202 200
Y 450 434 477 522 472 452 476 435
Southern Zone
A 18.3 15.05 14.69 16.32 19.16 20.34 24.51 25.24
P 46 42 46 58 67 71.75 68 65
Y 427 474 532 604 594 600 472 438
„Others‟
A 0.66 1.2 0.85 0.72 0.84 0.75 1.19 1.48
P 13 13 13 13 14 14 30.1 30.1
Y - - - - - - - -
All India
A 87.9 88.2 91.4 94.1 94.06 103.1 111.42 121.91
P 243 244 280 307 290 305 339.1 345.1
Y 470 478 521 554 524 502 517 481
Source: Central Institute for Cotton Research
Note: A=Area under cultivation (lakh hectares)
P= Production (lakh bales of 170 kg each)
Y= Yield (kg per hectare)
Besides these nine states, cotton cultivation has gained momentum in Orissa
(included in others) as well. Cotton is also cultivated in small areas of non-
traditional states such as Uttar Pradesh, West Bengal and Tripura. Bt technology
was adopted by the different zones at different points of time. States of central and
southern zone started using Bt technology during 2002 while Northern Zone
adopted this technology during 2005 (Table 1.4). Central zone among three zones
has gained momentum in terms of area under cultivation of cotton and production
since the introduction of Bt cotton in India (2002) but sometimes northern zone
was leading in terms of yield of Bt cotton (2010-11 and 2011-12).
Among the states of northern zone of India, on an average Punjab has
been the prominent state with relative higher yield, production and area under
cotton cultivation. The adoption of Bt technology started in 2005 in Punjab after the
approval of the Genetic Engineering Approval Committee. The immediate result of
this adoption was coverage of more area under Bt cotton cultivation leading to
higher yields and production in 2006-07 but after that a mixed trend is being
6
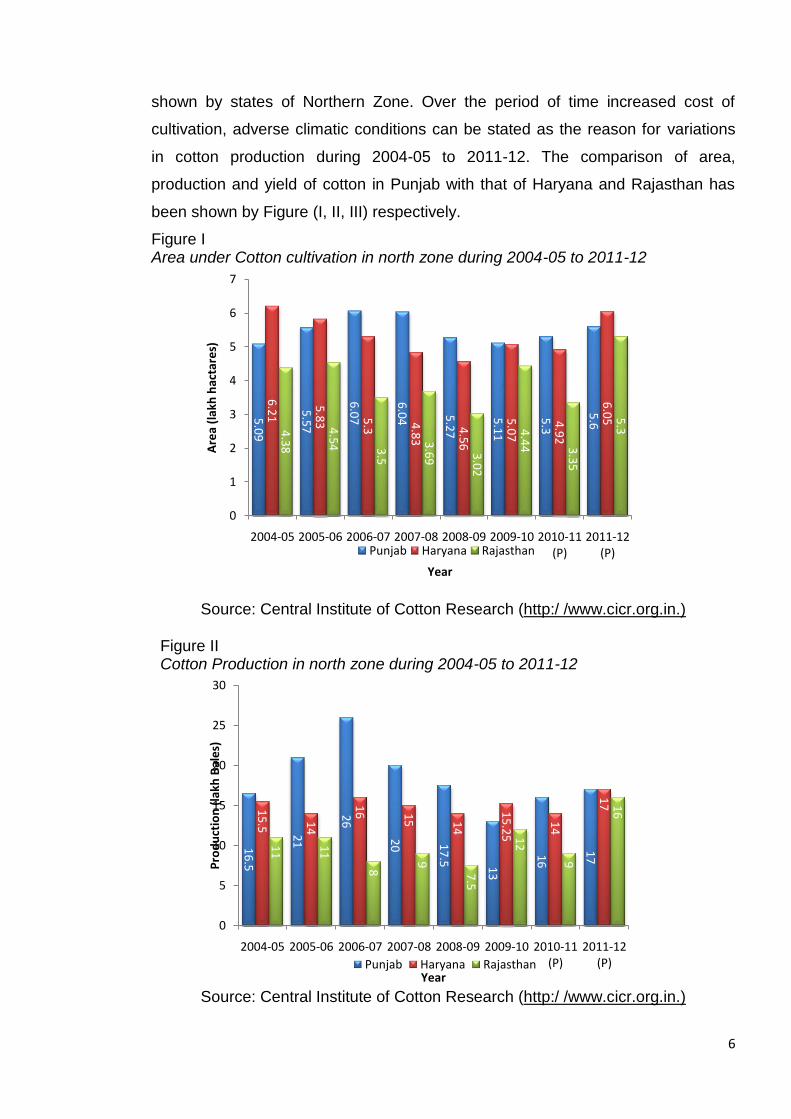
shown by states of Northern Zone. Over the period of time increased cost of
cultivation, adverse climatic conditions can be stated as the reason for variations
in cotton production during 2004-05 to 2011-12. The comparison of area,
production and yield of cotton in Punjab with that of Haryana and Rajasthan has
been shown by Figure (I, II, III) respectively.
Figure I Area under Cotton cultivation in north zone during 2004-05 to 2011-12
Source: Central Institute of Cotton Research (http:/ /www.cicr.org.in.)
Figure II Cotton Production in north zone during 2004-05 to 2011-12
Source: Central Institute of Cotton Research (http:/ /www.cicr.org.in.)
5.0
9
5.5
7
6.0
7
6.0
4 5.2
7
5.1
1
5.3
5.6
6.2
1
5.8
3 5.3 4.8
3
4.5
6
5.0
7
4.9
2
6.0
5
4.3
8
4.5
4 3.5
3.6
9 3.0
2
4.4
4 3.3
5
5.3
0
1
2
3
4
5
6
7
2004-05 2005-06 2006-07 2007-08 2008-09 2009-10 2010-11 (P)
2011-12 (P)
Are
a (l
akh
hac
tare
s)
Year
Punjab Haryana Rajasthan1
6.5
21
26
20 17
.5 13
16
17
15
.5 14
16 1
5 14
15
.25
14
17
11
11
8
9
7.5
12
9
16
0
5
10
15
20
25
30
2004-05 2005-06 2006-07 2007-08 2008-09 2009-10 2010-11 (P)
2011-12 (P)
Pro
du
ctio
n (
lakh
Bal
es)
YearPunjab Haryana Rajasthan

7
Figure III Yield of Cotton in north zone during 2004-05 to 2011-12
Source: Central Institute of Cotton Research (http:/ /www.cicr.org.in.) In Punjab cotton is mainly cultivated in the Malwa region which includes the
districts of Bathinda, Faridkot, Muktsar, Moga, Mansa, Ferozpur. In this region
agriculture is the principal source of livelihood. The role of the secondary and
tertiary sector is minimal in providing alternative employment. This region is also
known as the cotton belt of Punjab due to its cotton plantation in Kharif season.
Cotton production is classified in two varieties American Cotton and Desi Cotton
and 90-95% of American Cotton is Bt Cotton. Among all these districts Bathinda
has remained in the forefront in cotton production even before the introduction of
Bt cotton but the adoption of this very technology has helped to increase the
production manifold (Table 1.5). Since 2000-01 till date Bathinda district has taken
the lead in area under cultivation of American cotton from 114.7 thousand ha in
2000-01 to 142 thousand ha in 2005-06 and further to 145 thousand ha in 2010-
11. This was made possible only because of adoption of Bt technology. On the
other hand, area under cultivation of Desi cotton went on declining from 32.3
55
1
61
0
72
8
56
3
56
5 43
2
59
3
59
1
42
4 37
3
51
3
52
8
52
2
51
1
58
7
56
142
7
39
7
38
9
41
5
42
2
45
9
51
2
54
8
0
100
200
300
400
500
600
700
800
2004-05 2005-06 2006-07 2007-08 2008-09 2009-10 2010-11 (P)
2011-12 (P)
Yie
ld (
Kg/
ha)
YearPunjab Haryana Rajasthan

8
thousand ha in 2000-01 to mearly 2 thousand ha in 2010-11. This clearly shows
the high adoption rate of American cotton over the years.

9
Table 1.5 Area, Yield and production of cotton in cotton belt of Punjab during 2000-01 to 2010-11
DISTRICT FEROZPUR FARIDKOT MUKTSAR MOGA BATHINDA MANSA SANGRUR
YEAR A P Y A P Y A P Y A P Y A P Y A P Y A P Y
2000-01
AC 98.0 291 505 8.4 22 439 71.8 192 455 2.2 29 0.90 114.7 258 382 56.7 141 422 6.0 12 343
DC 15.7 49 531 5.7 13 381 14.7 40 461 5.9 13 415 32.3 74 387 21.8 51 397 15.5 30 328
2001-02
AC 129 295 389 28.5 59 352 115.5 258 380 5.1 5 178 139.2 340 415 77.7 160 350 10.5 20 322
DC 14.1 30 361 7.6 13 293 10 17 295 9.2 15 280 22.8 35 262 14.5 23 273 17.5 27 261
2002-03
AC 107.7 269 425 11.3 19 284 76.3 187 413 1.1 1 188 109.3 309 480 57.9 150 439 9.1 19 349
DC 13 22 292 5.3 8 243 8.7 14 278 4 4 190 16.2 40 418 12.1 18 250 14.6 20 237
2003-04
AC 105 398 644 16 48 511 83 248 507 1 4 687 113 372 560 63 221 595 5 13 522
DC 45 45 589 10 10 435 19 20 416 7 7 398 39 39 441 22 22 422 24 24 369
2004-05
AC 123 509 704 17 57 573 99 414 711 3 12 661 129 552 727 74 324 745 9 45 849
DC 10 39 664 4 11 473 6 23 647 3 8 470 12 41 584 8 26 552 10 20 339
2005-06
AC 131 578 750 23 103 759 112 522 793 5 22 765 142 631 755 85 348 697 14 50 607
DC 9 36 679 3 10 571 5 20 689 2 6 484 9 28 525 6 17 473 8 14 304
2006-07
AC 144 621 733 27 129 813 127 586 785 6 27 763 154 716 790 91 393 735 12 48 682
DC 7 27 653 2 8 656 4 13 533 1 2 408 7 23 552 5 12 395 6 16 465
2007-08
AC 135 458 577 26 99 649 124 464 636 7 28 668 160 645 685 97 430 753 12 53 749
DC 4 14 588 2 6 538 4 17 704 1 4 672 5 15 507 3 8 475 3 7 389
2008-09
AC 117 474 688 20 82 696 105 468 758 5 32 798 149 701 800 88 361 697 12 44 629
DC 3 10 592 1 3 499 2 8 648 1 3 497 4 13 544 2 5 445 2 5 431
2009-10
AC 123 408 564 17 69 694 95 388 694 3 14 822 147 649 750 87 323 632 11 53 825
DC 3 9 506 1 2 337 1 3 547 1 3 486 3 10 590 2 4 364 2 4 328
2010-11
AC 114 376 560 14 53 649 88 324 626 3 9 503 145 601 705 86 345 682 9 32 596
DC 2 6 536 1 3 491 1 6 513 (a) -- 0 2 6 483 2 6 477 2 4 349
Source: Statistical Abstract of Punjab (Various issues) A= Area in ‘000’ ha (a) = area less than 500 hectares Y= Average Yield in Kgs/ ha P= Production in ‘000’ bales AC= American Cotton DC= Desi Cotton

10
The production of American cotton followed a mixed trend for Bathinda
but it was always more in comparison to other districts. The same trend
is being followed for yield except year 2000-01 (382 kg per ha) and
2003-04 (560 per ha) but after 2005-06 Bathinda has remained on first
position in terms of area under cultivation, production as well as yield in
comparison to other districts of cotton belt of Punjab.

11
Chapter II
Review of Literature
Cotton plays an important role in industrial activity, employment and foreign
exchange earnings as cotton textiles is one of the largest industries in India and it
accounts for 4% of GDP, 20% of the workforce and 17% share of total export
earnings. India plays an important role in the production of cotton worldwide and it
ranked second in cotton production in 2007-08 after overtaking the USA (DOCD
GOI, 2009). The yield and production of cotton crop increased after the adoption of
Bt cotton. The introduction of Bt seeds led to a revolutionary change in the
production of the cotton crop and became the sigh of relief for the farmers who
were suffering from high losses due to severe pest attacks. The positive impact of
this technology was in the form of relatively higher yields, income and relatively
less expenditure on pesticides, and chemical fertilizers. The increased income
from biotech crops for small and resource-poor farmers represents an initial
modest contribution towards the alleviation of their poverty. It was also said that
during the second decade of commercialization, 2006 to 2015, biotech crops have
an enormous potential for contributing to the Millennium Development Goals
(MDG) of reducing poverty by 50% by 2015. However, different economists have
different views regarding the impact of Bt technology.
The International Service for the Acquisition of Agri-biotech
Applications (ISAAA) has published various issues to show the global status of
biotech crops during 2005-2011. According to these briefs, the global scenario of
biotech crops since the commercialization in 1996 has shown an increasing trend
in 29 countries comprising developed as well as developing countries. The area
under cultivation in the world has increased from 1.7mn hectare in 1996 to 90 mn
hectare in 2005 and further to 160 mn hectares during 2011 which has recorded
94 fold increase in just 16 years after the introduction of these crops. Developing
countries cultivate up to 50% of the total biotech crops which mainly constitute
soybean, maize, cotton, canola, sugarbeet, papaya etc. This has led to increase in
production and yield in the producing countries and has become the source to
earn higher profits.
12
The review of Literature has been discussed in two major sections to i.e.
Economic impact and Social impact of Bt Cotton. The impact is different for
different farmers of different regions and has positive as well as negative socio-
economic impact.
Economic Impact
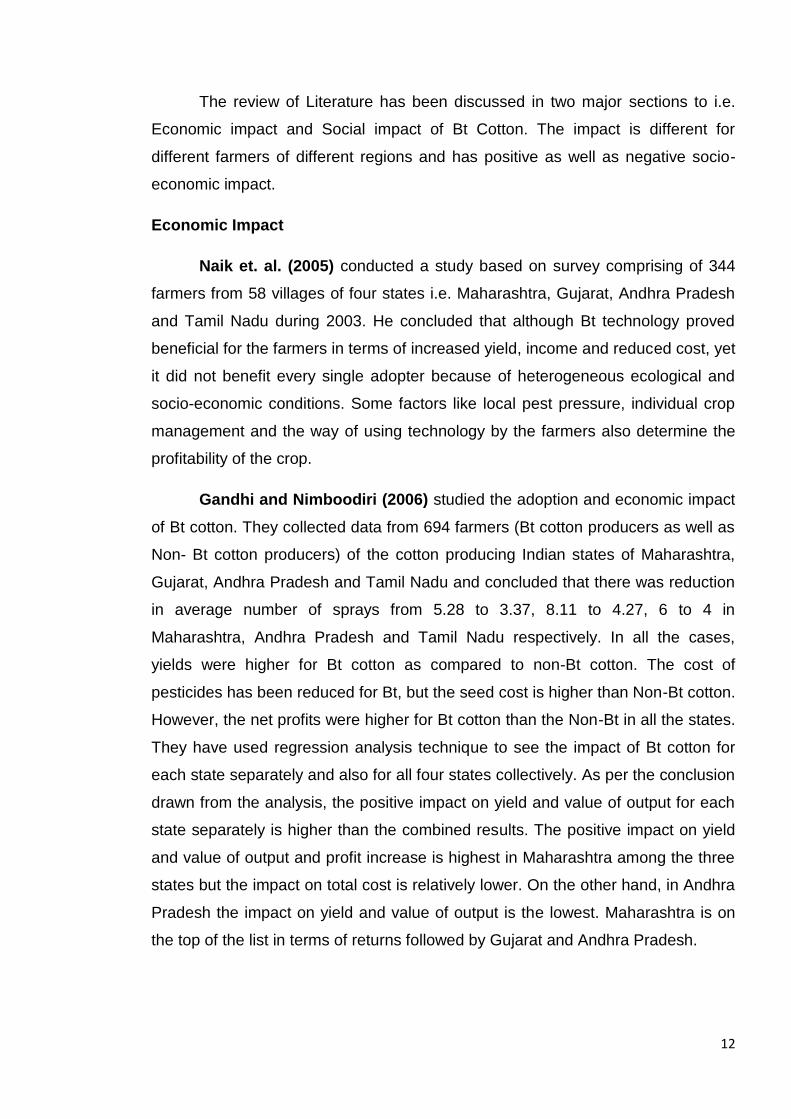
Naik et. al. (2005) conducted a study based on survey comprising of 344
farmers from 58 villages of four states i.e. Maharashtra, Gujarat, Andhra Pradesh
and Tamil Nadu during 2003. He concluded that although Bt technology proved
beneficial for the farmers in terms of increased yield, income and reduced cost, yet
it did not benefit every single adopter because of heterogeneous ecological and
socio-economic conditions. Some factors like local pest pressure, individual crop
management and the way of using technology by the farmers also determine the
profitability of the crop.
Gandhi and Nimboodiri (2006) studied the adoption and economic impact
of Bt cotton. They collected data from 694 farmers (Bt cotton producers as well as
Non- Bt cotton producers) of the cotton producing Indian states of Maharashtra,
Gujarat, Andhra Pradesh and Tamil Nadu and concluded that there was reduction
in average number of sprays from 5.28 to 3.37, 8.11 to 4.27, 6 to 4 in
Maharashtra, Andhra Pradesh and Tamil Nadu respectively. In all the cases,
yields were higher for Bt cotton as compared to non-Bt cotton. The cost of
pesticides has been reduced for Bt, but the seed cost is higher than Non-Bt cotton.
However, the net profits were higher for Bt cotton than the Non-Bt in all the states.
They have used regression analysis technique to see the impact of Bt cotton for
each state separately and also for all four states collectively. As per the conclusion
drawn from the analysis, the positive impact on yield and value of output for each
state separately is higher than the combined results. The positive impact on yield
and value of output and profit increase is highest in Maharashtra among the three
states but the impact on total cost is relatively lower. On the other hand, in Andhra
Pradesh the impact on yield and value of output is the lowest. Maharashtra is on
the top of the list in terms of returns followed by Gujarat and Andhra Pradesh.

13
Singh et. al. (2006) undertook a study to measure the comparative
economics of Bt cotton and non-Bt cotton cultivation and their impact on
productivity, cost of production, extent of pesticides use, income and employment
in the state. A sample of 40 experimental plots comprising 20 plots of Bt cotton
and 20 plots of non-Bt cotton, were selected in Ramgarh Bunder village of of
Bathinda district. As per the conclusion drawn by the authors, Bt cotton was found
to be cost effective as it could reduce the per quintal production cost by Rs 64.
Moreover, Bt cotton generated more employment (17 mandays per hectare) and
income (Rs 4300) as compared to Non-Bt cotton.
Narayanamoorthy and Kalamkar (2006) have revealed that the costs of
cultivation of Bt cotton crop is substantially higher than that of non-Bt crop and has
not led to reduce consumption of pesticides. However, productivity is found to be
substantially higher in Bt cotton than that of non-Bt cotton varieties. The cost of
production as well as profit per hectare was also found to be relatively higher for Bt
cotton cultivating farmers as compared to Non-Bt cultivating farmers.
Dev and Rao (2007) analyzed socio-economic impact of the Bt technology
during 2004-05. For this they conducted survey of 623 farmers (selection of
farmers based upon farm size and social category) from four districts of Andhra
Pradesh i.e. Warangal, Nalgonda, Guntur and Kurnool. Their work also proved the
higher profitability of Bt cotton to Non- Bt cotton in terms of higher yield and net
returns in the above mention districts. The small farmers belonging to SC farmers
who were Bt producers got relatively more benefit than that of non-Bt SC farmers.
Asia- Pacific Consortium on Agriculture Biotechnology (2006 and
2009) The pace how Bt cotton was being used for experimentation and how it was
commercialized and till date how it is being treated as the main Kharif crop in
different parts of the country has been depicted in the consecutive status reports
of the Bt cotton by APCoAB (Asia- Pacific Consortium on Agriculture
Biotechnology). These reports have witnessed an immense growth in the adoption
rate of Bt technology. After its commercialization it further led to increase in
cultivated area, production, yield and cost reduction over the years. The reasons
for the technology to be considered as the bane for some sections of the society
are also discussed.

14
Subramanian and Qaim (2009) conducted a micro level study of a village
Kanzara in Maharashtra using Micro Social Accounting Matrix to analyze socio
economic impact of Bt cotton. They reported an increase in aggregate returns to
labour by Rs.39 thousand with particularly increase in employment of female hired
workers. Aggregate increase in income was by Rs. 106 thousand and main
beneficiaries of this increase were vulnerable farmers.
Choudhary and Gaur (2010) analyzed the twelve studies on the impact of
Bt cotton in India that were conducted by public institutes during the period of
1998- 2010. These studies covered both pre and post commercialization period
and concluded that Bt cotton has contributed in increasing yield, income and
employment and also led to cost reduction and poverty alleviation.
Arora and Bansal (2011) have studied the factors impacting the diffusion
rate of BT cotton in India. The variables which determine economic impact on
diffusion of Bt cotton such as technological development, seed prices, cotton
prices are used in their study. This study was carried out for the period of 2002-
2008 using panel data set for nine cotton growing states of India. This study
concluded that technological development and cotton prices have positive impact
on the diffusion rate and seed prices have negative impact in the sense that with
increase in prices of seeds, diffusion rate is slow.
Kiresur and Ichangi (2011) analyzed the economic impact of Bt Cotton in
India through field survey in different districts of Karnataka. The authors reported
that on an average, per farm, the area under Bt cotton was 2.21 ha. With a yield of
24 q/ha, Bt cotton had registered 31 per cent higher yield and 151 per cent higher
net return over non-Bt cotton resulting in the net additional benefit of Rs.18429 per
hectare. The production function had depicted increasing returns to scale.
Social Impact
Purcell and Perlak (2004) expressed their view regarding the global impact
of Bt cotton, an insect resistance crop in their study. The results drawn from the
study was in favour of Bt cotton as it led to economic and production benefits
through net income advantage, more yield, less number of sprays, environmental
benefits through improvement in water quality due to less application of
15
insecticides. The adoption of Bt cotton has resulted in improvement in the
standard of living of the farmers.
Gill et al (2008) has came up with the detailed socio-economic profile of
312 farmers (classified in five categories i.e. marginal, small, semi medium,
medium and large) of two cotton producing districts of Punjab. It depicts the
educational level, resources owned, cropping pattern etc and correlates this with
the living standards of people. His study depicts the strong positive economic
impact of Bt technology but also mentions some concerns related to its
sustainability due to wrong practices followed by some farmers, inappropriate
moisture content in soil, illegal varieties of Bt seeds leading to limit the economic
benefits from this crop. The study suggests that there should be provision of
quality seeds and extension support to the farmers.
Jalota et.al.(2008) analyzed Bt cotton from a different angle as against the
conventional analysis. He conducted a study to see the effect of temperature on
the productivity of Bt cotton for Bathinda district of Punjab. Cropsyst Model was
used rather than field experimentation as it was difficult to control/create weather
variability. So simulation for the 15 years period were made i.e. 1991-2005 and
relationship was found between temperature and cotton production that with the
increase in temperature from 28 oC to 32 oC , reduction in cotton seed yield was
found i.e from 4700 kg/ha to 2300 kg/ha and it was more during sowing to
flowering stage.
Vishwanathan and Lalitha (2008) conducted a survey of Bt and non- Bt
farmers from five districts of Vidarbha region of Maharashtra covering 200 cotton
farmers during 2007-08. The study has covered different aspects related to the Bt
cotton like expansion of the technology, from farm level responses regarding
adoption and use of different varieties of Bt seeds. It has also focused on the
issues of main concerns such as its impact on pesticide use, production and yield.
They opined that Bt technology has led to control only bollworms and not the
sucking pests. Therefore results are not realized up as expected at the time of
introduction of Bt cotton. They suggested that for bright future of Indian agriculture
along with flourishing Bt technology, it is essential to restructure input as well as

16
output markets and evolve new institutions and regulatory system for proper
guidance.
Qaim (2009) has worked out the economics of GM crops in his study. It
shows that Bt is economically viable and also beneficial for environment and
health. The author has analyzed that Bt adoption has led to increase in income
and production of farmers. The less use of pesticides has resulted in safe
environment and healthy food available for the consumers. However, he has
expressed concern about the monopolization of seed market and exploitation of
small holders.
Kuruganti (2009) in an article entitled “Bt Cotton and the Myth of Enhanced
Yields” has concluded that in case of Bt cotton the increased yield and reduction in
use of pesticides can also be due to the other factors prevailing at that time like
more irrigation facilities, good rainfall, low pest pressure due to agro- climatic
conditions etc.
Padaria et. al. (2009) through the logit analysis used for the primary survey
of 180 farmers (120 of adopters of Bt cotton and 60 non adopters) from two
districts of each state Karnataka and Punjab analyzed the factors influencing the
Bt adoption. The authors concluded that the size of holding, capital base,
extension contact, innovativeness, achievement motivation, and perception about
the technology have positive significant influence over the decision regarding
adoption of Bt cotton. However, a priori expectation, information source pluralism,
mass media exposure, social participation and education were not found to have a
significant influence on adoption decision of farmers. They also suggested the
need for training the farmers as the adoption of new technologies involves the
requisite know-how about the modern genetic technologies.
Sabir et. al. (2011) this study revealed that the growth of Bt cotton has also
changed the cropping pattern of Pakistan‟s Punjab. It was conducted in different
cotton growing districts of Punjab. The size of sample was 300 farmers and it
concluded that there is a noticeable effect of Bt cotton on the cropping pattern i.e.
the area under plantation of Bt cotton has increased in relation to other crops like
wheat and sugarcane. This change in cropping pattern and shifting of the interest

17
from food crops to commercial crops has been indicated as harmful for the growth
of the economy as it will create the problem of food security in future.
Pray et. al. (2011) have studied the impact of Bt cotton in India as well as in
china which are the main producer and consumer countries of the cotton. The
study revealed that Bt cotton has led to reduce the pesticide use and has been
effective in controlling the bollworm in both the countries. The net benefits are
appropriated relatively more by the Indian farmers more than the farmers in china
party due to effective policies of price management by the Indian government.
Central Institute for Cotton Research, Coimbatore (2011) has pointed
out that at present there are the some problems regarding the cultivation of Bt
cotton because of mealy bug attack which causes the loss in production of the
crop. To prevent the crop from attack of unwanted and sucking pest there is
recommendation of Multitier Cropping pattern in technical bulletin published by
CICR. The conclusion drawn from the study was that this system is helpful in
efficient use of production components such as soil, water, sunlight, air and other
inputs on sustainable basis etc. An experiment was done by adopting multitier
system for Bt cotton+ Radish +Cluster beans+ Beet root by the department and it
gave the highest gross returns, net returns per day profitability and equivalent Bt
cotton productivity was obtained as in sole cotton production.
Choudhary and Gaur (2011) have stated that in India Bt cotton is
considered as multipurpose crop in three forms i.e. edible oil for human
consumption, de-oiled cakes for animals and fiber for textiles etc. This study has
brought out a manifold increase in production of cotton seeds and its byproducts
as oil and meal for human consumption which was 46mn tones in 2002-03 and
reached the level of 1.20mn tones in 2010-11.
Mal et. al. (2011) analyzed the impact of Bt cotton in their study which delt
with the issue of technical efficiency and environmental impact of Bt and Non-Bt
cotton based upon the survey of north India mainly from two states Punjab and
Haryana. It consisted of 200 farmers from eight villages from four districts of both
the states. The study using the stochastic frontier approach concluded that the
average technical efficiency of Bt cotton farmers is higher than that of Non-Bt

18
cotton farmers and also Bt cotton farms have the lower environmental impact
quotient indicating the low damage to the environment.
Kurungtati and Radhakrishnan (2011) the study revealed that the story of
Bt cotton is clearly that of false hype and failed promises. Bt cotton has failed to
meet its promise in terms of sustained yield gains, pest protection and reduction in
pesticide usage. It is time for the government, scientists and policy-makers to
reject the hype around Bt cotton, and focus on sustainable solutions and pro-
farmer measures to achieve production, environmental safety and farmers‟ welfare
that are long-lasting.
Kaphengst et. al. (2011) have assessed the performance of GM crops
worldwide. Bt cotton has shown heterogeneity across different countries and
reason for this difference is use of different pest management practices. The area
where crops have adapted to the local conditions and pest control management is
efficient; Bt cotton has shown less net profits. The conclusion drawn from the
study for overall GM crops is that it can lead to yield increases mostly through
reduced yield losses from insect infestation and weeds. The authors were also of
the opinion that the studies are very much influenced by the way of data collection
and also who is doing the data collection i.e. private companies or public
institutions. So due these reasons conclusion drawn from the various studies
cannot be generalized.
Kathage and Qaim (2011) in their survey collected data from four states
named Maharashtra, Andhra Pradesh, Karnataka and Tamil Nadu of India in four
waves during the period of 2002-2008. They concluded that Bt cotton has positive
impact on yield, profits and living standards of the farmers. The per acre yield an
profits have been increased by 24% and 50% respectively. These effects have
also been stable over time and it has also led to significant increase in
consumption expenditure resulting in the increase in standard of living.
Waghmare and Shendage (2012) conducted an economic analysis of Bt
cotton in cotton growing area of western Maharashtra. A sample of 60 farmers
comprising five household of Bt cotton and five of non- Bt cotton from six villages
each was taken during 2008-09. By applying the Cob-Douglas production function
for this analysis they have concluded that in terms of yield, net returns and

19
pesticides cost Bt cotton has benefitted more than non-Bt. However, non
availability of quality seeds and in adequate quantity has been the main
constraints in the adoption of technology. It needs the serious attention of the
Government.
Shah (2012) has touched the aspect of adoption, government intervention
in price policy and investment initiatives for Bt cotton. With the Increased pace of
adoption, price of Bt seeds also increased but with the government intervention in
2006, price control policy was used. This policy led to hike in the benefits and
profits of farmers but loss to the private companies. So author suggests that
government policies should be in such a way that could last for long run without
hampering the profits of seed companies as Bt cotton constituted the 40% of the
Indian seed market and some 7-8 big companies dominate this market.
Kouser and Qaim (2012) in their study of Pakistan have analyzed health
and environmental externalities of Bt cotton in addition to economic externalities of
Bt and non-Bt adopters. This study has concluded that Bt adoption results in less
pesticide use, higher yields and higher gross margins but in addition to it they have
also brought about significant health advantages in terms of reduced incidence of
acute pesticide poisoning and environment advantages in the form of higher
farmland biodiversity and lower soil and water contamination.
Freeman (2012) has conducted a study using a sample of 10 farmers for
two districts i.e. Guntur and Warangal of Andhra Pradesh. He has described
economic as well as the ecological and human issues related to Bt cotton. The
study has revealed that the decisions regarding the adoption of technology are not
on the basis of farmers own practices and participation rather the political parties
or the authorities who are the beneficiaries decides about the usage without taking
into account the human and ecological implications of the technology.
Gaurav and Mishra (2012) in their study emphasized upon the risk
associated with the adoption of Bt technology and also other factors which
constitutes the yield risk. They have used the mixed method framework for
analyzing the data. First of all they have combined data of two cross- sectional
surveys in Gujarat (Saurashtra and Southern-Plains) and Maharashtra (Western
Vidarbha) for the period 2009-10 and then have compared it with unit-level data for
20
the corresponding regions from a nationally representative sample for the period
2002-03. From this analysis they have shown how the risk associated with Bt
technology can be identified although it has a number of benefits among different
parts of country.
Ashok et.al. (2012) studied the environmental and economic impact of Bt
technology in four states i.e. Andhra Pradesh, Gujarat, Maharashtra and Tamil
Nadu using a sample of 480 farmers selected from two districts of each state on
the basis of maximum area under Bt cultivation. The influence of technology was
seen through various analytical methods such as to measure the economic impact
ANOVA and Economic surplus models were used and importance of technology
was shown via more surplus and high yield in different states. He has also
discussed the aspect of cultivation of Refugee Crop along with Bt crop but due to
the fear of more severe pest attack leading to more expenditure on pest controls,
people were not using the refugee crop as required. The study has also quantified
the environmental impact by using formula of environment impact quotient which
was lower for Bt cotton in all states meaning thereby Bt cotton has not degraded
the environment.
Nahatkar and Yadav (2012) in their case study of Nimar valley of central
India, took a sample of 45 farmers (constituting 15 farmers of each category small,
Medium and large farmers). They concluded that Bt technology is a scale neutral
technology and has benefitted all the farmers irrespective of their size of holdings
because there is not much difference in cost of cultivation and returns per hectare
to all categories of farmers. So he has rejected the myth adopted by the people
that frontier technology is not adopted by the small and marginal farmers due to
cost and access factors.
Kalamkar (2012) in his study has reviewed the adoption and performance
of Bt cotton in India. He opined that this issue has remained a controversial and
debatable issue as most of the studies are favouring the positive impacts of this
technology and some studies conducted by the NGO‟s are focusing more on the
failure part of the technology especially the environmental and health issues.
Therefore there is inconsistency in results regarding the performance of Bt in
different states.
21
Chapter III
Objectives and Methodology
An attempt has been made in this study to analyze the socio-economic impact of
Bt cotton in Bathinda which is one of the major cotton producing districts of
Punjab. The main objectives of this study are:
1) To analyze the determinants of Bt cotton adoption.
2) To examine the socio- economic and environmental impact of Bt cotton
farmers vis- a- vis Desi cotton farmers.
3) To work out the economics of Bt cotton vis- a- vis Desi cotton in Bathinda
district.
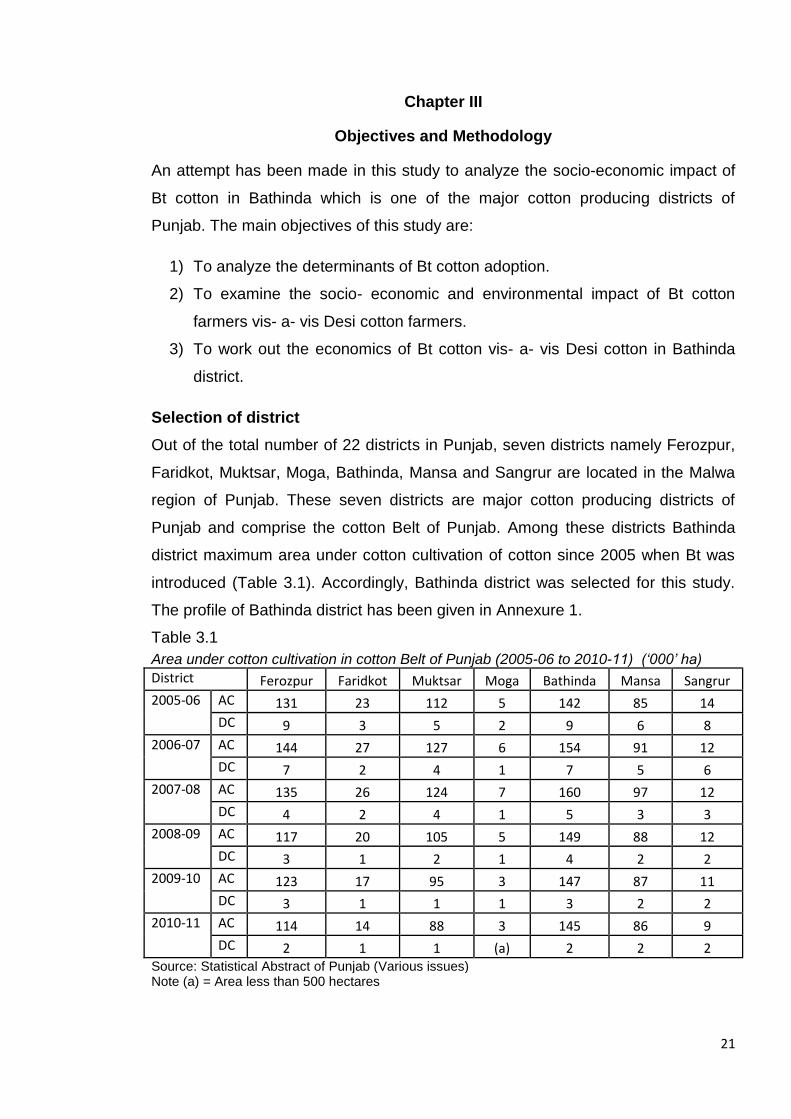
Selection of district
Out of the total number of 22 districts in Punjab, seven districts namely Ferozpur,
Faridkot, Muktsar, Moga, Bathinda, Mansa and Sangrur are located in the Malwa
region of Punjab. These seven districts are major cotton producing districts of
Punjab and comprise the cotton Belt of Punjab. Among these districts Bathinda
district maximum area under cotton cultivation of cotton since 2005 when Bt was
introduced (Table 3.1). Accordingly, Bathinda district was selected for this study.
The profile of Bathinda district has been given in Annexure 1.
Table 3.1
Area under cotton cultivation in cotton Belt of Punjab (2005-06 to 2010-11) (‘000’ ha)
District Ferozpur Faridkot Muktsar Moga Bathinda Mansa Sangrur
2005-06 AC 131 23 112 5 142 85 14
DC 9 3 5 2 9 6 8
2006-07 AC 144 27 127 6 154 91 12
DC 7 2 4 1 7 5 6
2007-08 AC 135 26 124 7 160 97 12
DC 4 2 4 1 5 3 3
2008-09 AC 117 20 105 5 149 88 12
DC 3 1 2 1 4 2 2
2009-10 AC 123 17 95 3 147 87 11
DC 3 1 1 1 3 2 2
2010-11 AC 114 14 88 3 145 86 9
DC 2 1 1 (a) 2 2 2 Source: Statistical Abstract of Punjab (Various issues) Note (a) = Area less than 500 hectares
22
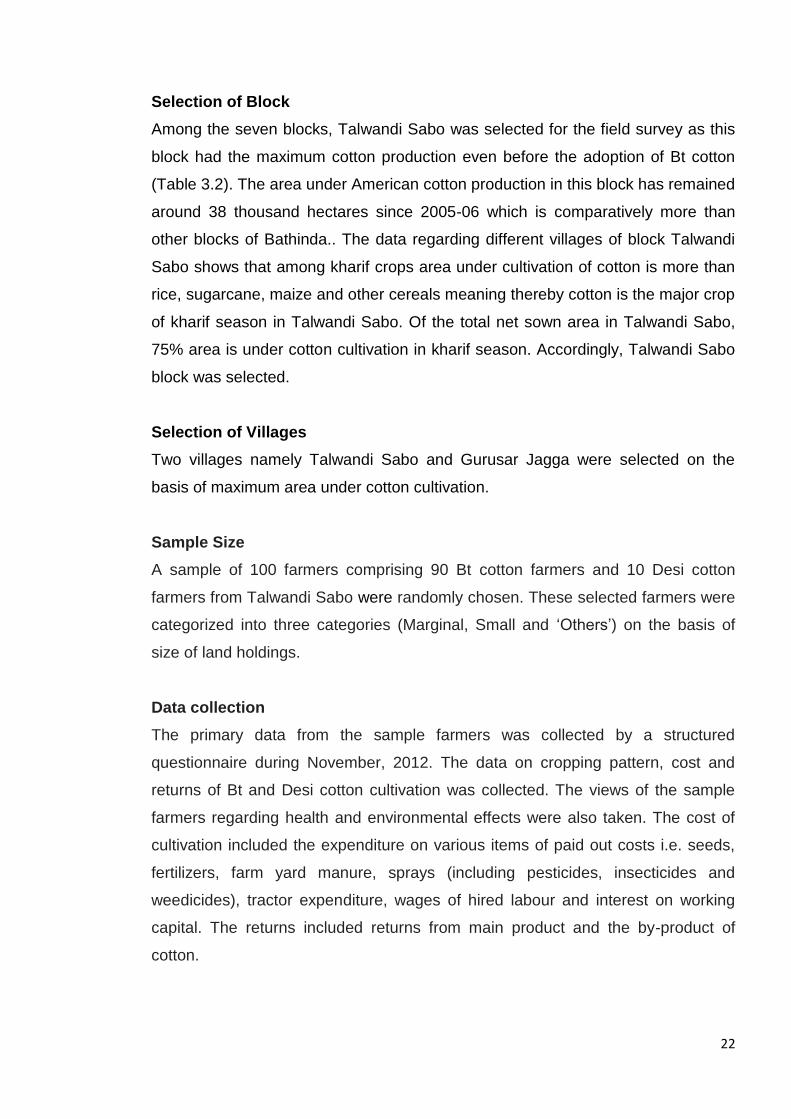
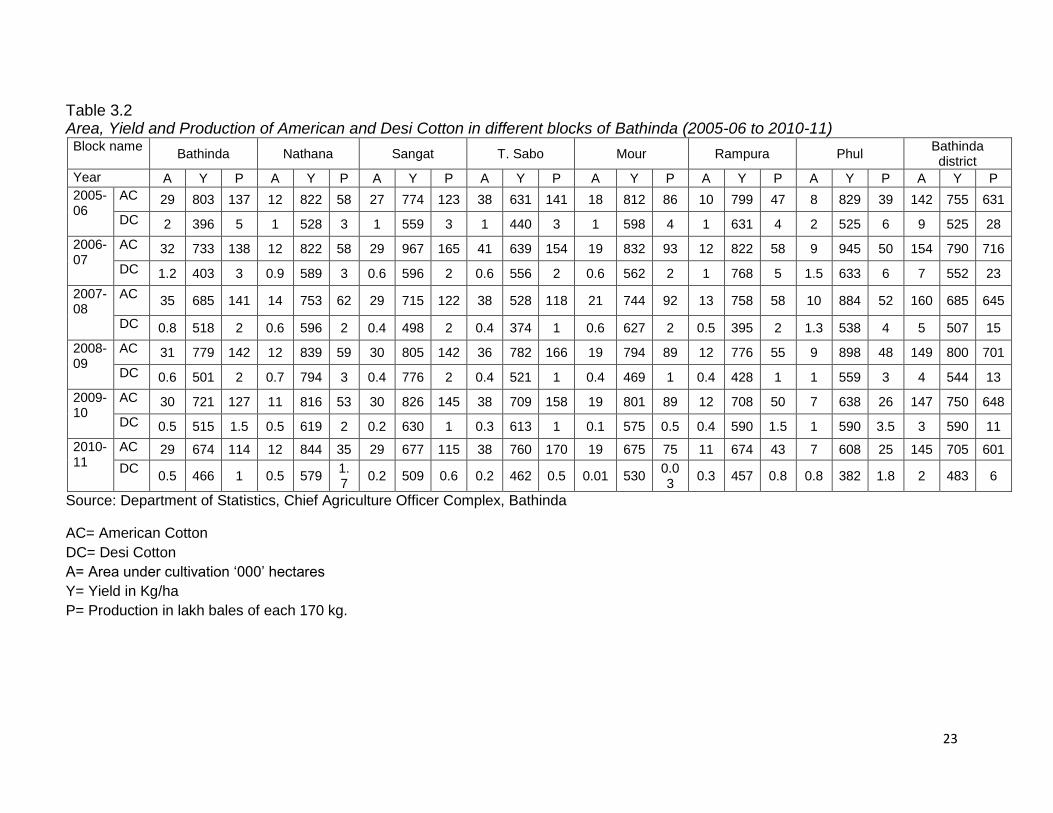
Selection of Block
Among the seven blocks, Talwandi Sabo was selected for the field survey as this
block had the maximum cotton production even before the adoption of Bt cotton
(Table 3.2). The area under American cotton production in this block has remained
around 38 thousand hectares since 2005-06 which is comparatively more than
other blocks of Bathinda.. The data regarding different villages of block Talwandi
Sabo shows that among kharif crops area under cultivation of cotton is more than
rice, sugarcane, maize and other cereals meaning thereby cotton is the major crop
of kharif season in Talwandi Sabo. Of the total net sown area in Talwandi Sabo,
75% area is under cotton cultivation in kharif season. Accordingly, Talwandi Sabo
block was selected.
Selection of Villages
Two villages namely Talwandi Sabo and Gurusar Jagga were selected on the
basis of maximum area under cotton cultivation.
Sample Size
A sample of 100 farmers comprising 90 Bt cotton farmers and 10 Desi cotton
farmers from Talwandi Sabo were randomly chosen. These selected farmers were
categorized into three categories (Marginal, Small and „Others‟) on the basis of
size of land holdings.
Data collection
The primary data from the sample farmers was collected by a structured
questionnaire during November, 2012. The data on cropping pattern, cost and
returns of Bt and Desi cotton cultivation was collected. The views of the sample
farmers regarding health and environmental effects were also taken. The cost of
cultivation included the expenditure on various items of paid out costs i.e. seeds,
fertilizers, farm yard manure, sprays (including pesticides, insecticides and
weedicides), tractor expenditure, wages of hired labour and interest on working
capital. The returns included returns from main product and the by-product of
cotton.
23
Table 3.2 Area, Yield and Production of American and Desi Cotton in different blocks of Bathinda (2005-06 to 2010-11) Block name
Bathinda Nathana Sangat T. Sabo Mour Rampura Phul Bathinda district
Year A Y P A Y P A Y P A Y P A Y P A Y P A Y P A Y P
2005-06
AC 29 803 137 12 822 58 27 774 123 38 631 141 18 812 86 10 799 47 8 829 39 142 755 631
DC 2 396 5 1 528 3 1 559 3 1 440 3 1 598 4 1 631 4 2 525 6 9 525 28
2006-07
AC 32 733 138 12 822 58 29 967 165 41 639 154 19 832 93 12 822 58 9 945 50 154 790 716
DC 1.2 403 3 0.9 589 3 0.6 596 2 0.6 556 2 0.6 562 2 1 768 5 1.5 633 6 7 552 23
2007-08
AC 35 685 141 14 753 62 29 715 122 38 528 118 21 744 92 13 758 58 10 884 52 160 685 645
DC 0.8 518 2 0.6 596 2 0.4 498 2 0.4 374 1 0.6 627 2 0.5 395 2 1.3 538 4 5 507 15
2008-09
AC 31 779 142 12 839 59 30 805 142 36 782 166 19 794 89 12 776 55 9 898 48 149 800 701
DC 0.6 501 2 0.7 794 3 0.4 776 2 0.4 521 1 0.4 469 1 0.4 428 1 1 559 3 4 544 13
2009-10
AC 30 721 127 11 816 53 30 826 145 38 709 158 19 801 89 12 708 50 7 638 26 147 750 648
DC 0.5 515 1.5 0.5 619 2 0.2 630 1 0.3 613 1 0.1 575 0.5 0.4 590 1.5 1 590 3.5 3 590 11
2010-11
AC 29 674 114 12 844 35 29 677 115 38 760 170 19 675 75 11 674 43 7 608 25 145 705 601
DC 0.5 466 1 0.5 579
1.7
0.2 509 0.6 0.2 462 0.5 0.01 530 0.03
0.3 457 0.8 0.8 382 1.8 2 483 6
Source: Department of Statistics, Chief Agriculture Officer Complex, Bathinda
AC= American Cotton
DC= Desi Cotton
A= Area under cultivation „000‟ hectares
Y= Yield in Kg/ha
P= Production in lakh bales of each 170 kg.

24
The secondary data was collected from The International Service for the
Acquisition of Agri-biotech Applications (ISAAA) briefs (2005-2011), Official
website of Central Institute for Cotton Research (CICR), Statistical Abstract of
Punjab (Various issues), Department of Statistics, Chief Agriculture Officer
Complex, Bathinda, Department of Agriculture, Rampura and Official website of
Bathinda district.
Frame work for analysis
Tabular analysis, Regression analysis and Logit model were the tools applied to
analyze the data.
25
Annexure 1
Profile of Bathinda District
Bathinda District is situated in the Southern part of Punjab State in the heart of
Malwa region. It forms part of newly created division Faridkot Revenue
Commissioners Division and is situated between 29 o-33 & 30o-36 North latitude
and 74o-38 and 75o-46 East longitude. The district is surrounded with Sirsa and
Fatehabad of Haryana State in the south, Sangrur and Mansa district in the East,
Moga in the North-east and Faridkot & Muktsar in the North-west
(http://bathinda.nic.in/ Accessed 2012 Nov,14).
Topography
The district is situated within the Sutlej-Ganga plain. The soil is sandy and sand
dunes are noticeable in Talwandi Sabo and Sangat blocks. The industrious
farmers of the district have changed the profile of the district from a desert to
flourishing green fields and made it one of the leading agriculture districts (Potential
Linked Credit Plan 2012-13 Bthinda, NABARD)
Climate
The climate is extremely hot in summer and the temperature often touches 48
degree Celsius in the month of May and June. It is hot and humid in the rainy
season (i.e. July, August and part of early September) while it is extremely cold in
the months of November to February and the temperature goes down to as low as
2 degree Celsius (http://bathinda.nic.in/District_Plan Accessed 2012 Nov, 14).
Soil
Prominent types of soil in the district are loam, clay loam, sandy and sand dunes.
Clay loam soil is suitable for cotton, wheat, sugarcane, mustard, etc. while the
sandy soils are suitable for cultivation of gram under rainfed conditions. The agro
climatic conditions are suitable for raising horticulture crops particularly Kinnow,
Grapes, Guava, Ber, Aonla, etc.
Irrigation
Canals are the main source of irrigation in the district, supplemented by the
tubewells. The total irrigated area is 297,123 hectares, which constitutes 100 % of
the Net sown area. The share of the canals is 217,000 hectares while 80,123
hectares is irrigated using tube wells & wells.

26
Administration
From Administrative point of view District Bathinda is divided into three Tehsils:
Bathinda
Rampurphul
Talwandisabo These Tehsils have been further divided into 7 blocks as under: 1. Bathinda 2. Sangat 3. Nathana 4. Talwandi Sabo
5. Rampura 6. Phul 7. Maur
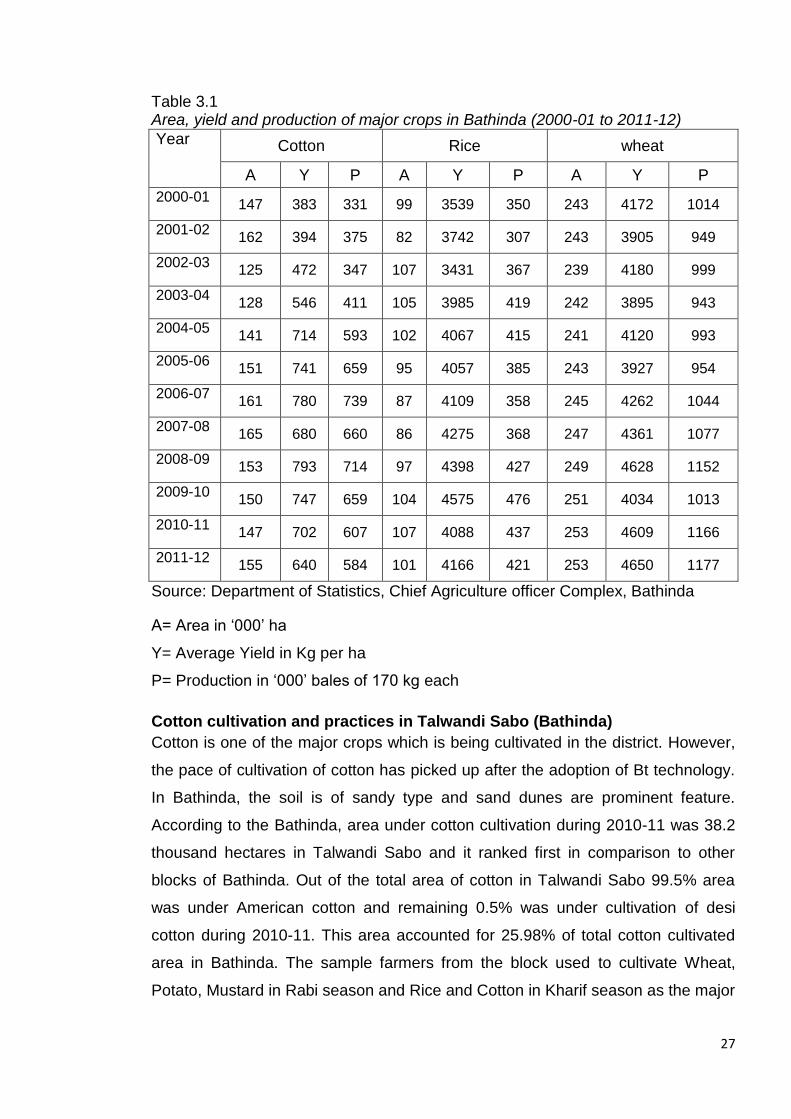
Agriculture
Wheat, paddy and cotton are the main crops of the district. The other crops grown
in the district are oilseeds, gram, vegetables etc. Bathinda district alone accounts
for a quarter of the cotton produced in Punjab. It is also clear from the data (Table
3.1) that cotton production is considered as the second priority among all major
crops produced in Bathinda district. But if only kharif crop is taken into
consideration than cotton production is the top priority. The introduction of Bt
cotton was a boon for the cotton producers in Bathinda which led to increase in
production and yield of cotton resulting in raising the income of the farmers.
27
Table 3.1 Area, yield and production of major crops in Bathinda (2000-01 to 2011-12)
Year Cotton Rice wheat
A Y P A Y P A Y P
2000-01 147 383 331 99 3539 350 243 4172 1014
2001-02 162 394 375 82 3742 307 243 3905 949
2002-03 125 472 347 107 3431 367 239 4180 999
2003-04 128 546 411 105 3985 419 242 3895 943
2004-05 141 714 593 102 4067 415 241 4120 993
2005-06 151 741 659 95 4057 385 243 3927 954
2006-07 161 780 739 87 4109 358 245 4262 1044
2007-08 165 680 660 86 4275 368 247 4361 1077
2008-09 153 793 714 97 4398 427 249 4628 1152
2009-10 150 747 659 104 4575 476 251 4034 1013
2010-11 147 702 607 107 4088 437 253 4609 1166
2011-12 155 640 584 101 4166 421 253 4650 1177
Source: Department of Statistics, Chief Agriculture officer Complex, Bathinda
A= Area in „000‟ ha
Y= Average Yield in Kg per ha
P= Production in „000‟ bales of 170 kg each
Cotton cultivation and practices in Talwandi Sabo (Bathinda)
Cotton is one of the major crops which is being cultivated in the district. However,
the pace of cultivation of cotton has picked up after the adoption of Bt technology.
In Bathinda, the soil is of sandy type and sand dunes are prominent feature.
According to the Bathinda, area under cotton cultivation during 2010-11 was 38.2
thousand hectares in Talwandi Sabo and it ranked first in comparison to other
blocks of Bathinda. Out of the total area of cotton in Talwandi Sabo 99.5% area
was under American cotton and remaining 0.5% was under cultivation of desi
cotton during 2010-11. This area accounted for 25.98% of total cotton cultivated
area in Bathinda. The sample farmers from the block used to cultivate Wheat,
Potato, Mustard in Rabi season and Rice and Cotton in Kharif season as the major
28
crops. Due to scarcity of water farmers prefer to go for cotton plantation
particularly of Bt cotton rather than rice. The benefits gained from the Bt cotton are
relatively higher than the conventional cotton which induce a farmer to prefer Bt
varieties rather than Desi cotton varieties.

29
Chapter IV
Socio- Economic Impact of Bt cotton
Cotton is an important kharif crop playing a key role in the economic development
of the Bathinda district. However, there had been wide variations and a decline in
production of cotton crop during 90‟s. It is attributable to many factors such as
changes in climate, untimely and erratic rains, pest attack and indiscriminate use
of pesticides. American bollworm had been the major reason for the decline in
cotton production and yields. However, the adoption of Bt cotton by the farmers in
the district during 2005 has somewhat stabilized the production and yields. It has
been the most important factor affecting the rural economy of the district. There
are two basic varieties of Cotton, namely, American Cotton and Desi Cotton.
Under Bt Cotton category, Ankur, Rassi, Bollguard and Monsanto varieties had
been under cultivation. The adoption of this new technology largely led to
replacement of the conventional seeds (Figure IV). The total area under Bt cotton
cultivation was 138 thousand hectares as compared to 3 thousand hectares under
Desi cotton cultivation during 2008-09. It shows large scale adoption of Bt cotton
seeds in the district.
Figure IV Adoption of Bt cotton seeds in Bathinda district (2002- 2009)
Source: Department of Statistics, Chief Agriculture Officer Complex, Bathinda.
416
62
110
143 142 138
16 15 12 9 7 5 30
20
40
60
80
100
120
140
160
2002-03 2003-04 2004-05 2005-06 2006-07 2007-08 2008-09
Are
a (T
ho
usa
nd
He
ctar
es)
Year
Bt Cotton Others Desi Cotton

30
There are numerous determinants which influences this adoption of Bt cotton such
as education, age, caste, land holdings etc. An econometric tool named as Logit
model was used to analyze the factors that had affected the adoption of Bt cotton.
Logit Model
Logit model was applied to the primary data in order to identify and analyse the
factors that governed the farmer‟s decision to adopt Bt technology. The influence
of various socio-economic factors to adopt new technologies by the farmers has
been investigated by a number of studies. In our study, like in most of the studies
on adoption behavior, BTi has been taken as the Dummy dependent variable while
landholdings, age of the farmer, education of the farmer and caste (SC/BC/GEN)
to which the farmer belongs are independent variables. One more variable which
includes the interaction effect of both education and age is also considered. Thus,
Logit model as specified below was estimated.
BTi = β0 + β1 LHLDi + β2 AGEi + β3 EDUi + β4 SC/BCi + β5 AGEEDU+ ut…….. (1)
where,
LHLDi = landholding of ith household (in acres)
AGEi = age of the farmer of ith household (in completed years)
EDUi = education of the farmer of ith household (in completed years of
schooling)
SC/BCi = dummy variable and
=1 if households belong to SC or BC caste
= 0 if households belongs general category
AGEEDU = Age*Edu
BTi = dummy variable and
= 1 if household is using BT cotton seed
= 0 if household is not using BT cotton seed
ut = error term

31
Regression analysis
Regression analysis has been applied to find out the impact of different variables
on Net returns of farmer adopting Bt or Desi cotton. To run regression equation,
Net returns was taken as dependent variable and landholdings, age, education of
farmer, caste, labour cost, yield and farmers who have adopted Bt cotton were
used as independent variables.
NRi = β0 + β1LHLDi + β2 AGEi + β3 EDUi + β4 SC/BCi +β5 LCi+ β6YLDi + β7 BTi
+ut……(2)
where,
NRi = Net returns of ith household (Rupees per acre)
LHLDi = landholding of ith household (acres)
AGEi = age of the farmer of ith household (completed years)
EDUi = education of the farmer of ith household (completed years of
schooling)
SC/BCi = dummy variable and
=1 if households belong to SC or BC caste
= 0 if households belong to general category
LCi = Labour cost (Rupees per acre)
YLDi = Yield of the farmer of ith household (kg per acre)
BTi = dummy variable and
= 1 if household is using BT cotton seed
= 0 if household is not using BT cotton seed
ut = error term
Result of Equation (1)
The Logit regression taking Bt as the dependent variable is estimated with the help
of odd ratios and 5 independent variables including land holdings, age of the
farmer, education of the farmer, social category. The odd ratios for only age and
education with their interaction effect are found to be statistically significant. But
size of land holdings, social category and family size are not having any significant
impact on adoption of Bt cotton.

32
Age is the prominent factor affecting the adoption rate. The analysis shows that as
age increases, probability of adoption of Bt cotton decreases as the coefficient
shows the negative and statistically significant relationship between age of the
farmer and Bt cotton adoption. The tabular analysis (Table 4.3) also shows that
relatively younger farmers had adopted Bt cotton.
Education is another indicator leading to the more adoption of Bt cotton.
With increase in education level farmers are more induced to use high
technological varieties (Bt cotton) for more production and net returns.
The interaction effect of age and education has also been worked out which
represents that young and educated farmers prefer Bt cotton cultivation as
compared to Desi cotton cultivation.
Table 4.1
Factors influencing Bt cotton adoption of Sample Farmers
Variable Coefficient Odds Ratio Standard error z values
Land Holding -0.0152 0.9849 0.055 -0.27 Age of farmer -0.4092*** 0.6641 0.1529 -2.68 Education of farmer 0.077* 1.07 0.054 1.91 SC/BC 1.788 5.981 1.201 1.49 Age and Education 0.0335* 1.034 0.2369 1.83 Constant 24.375 (-) 9.188 2.65 N 100
Pseudo-R2 0.29 Dependent variable: dummy variable BT
***,* Significant at 1% and 10% level of significance
The model is also tested for goodness of fit by chi square test which shows that model is
fit as prob> chi2 = 0.8550 is insignificant.
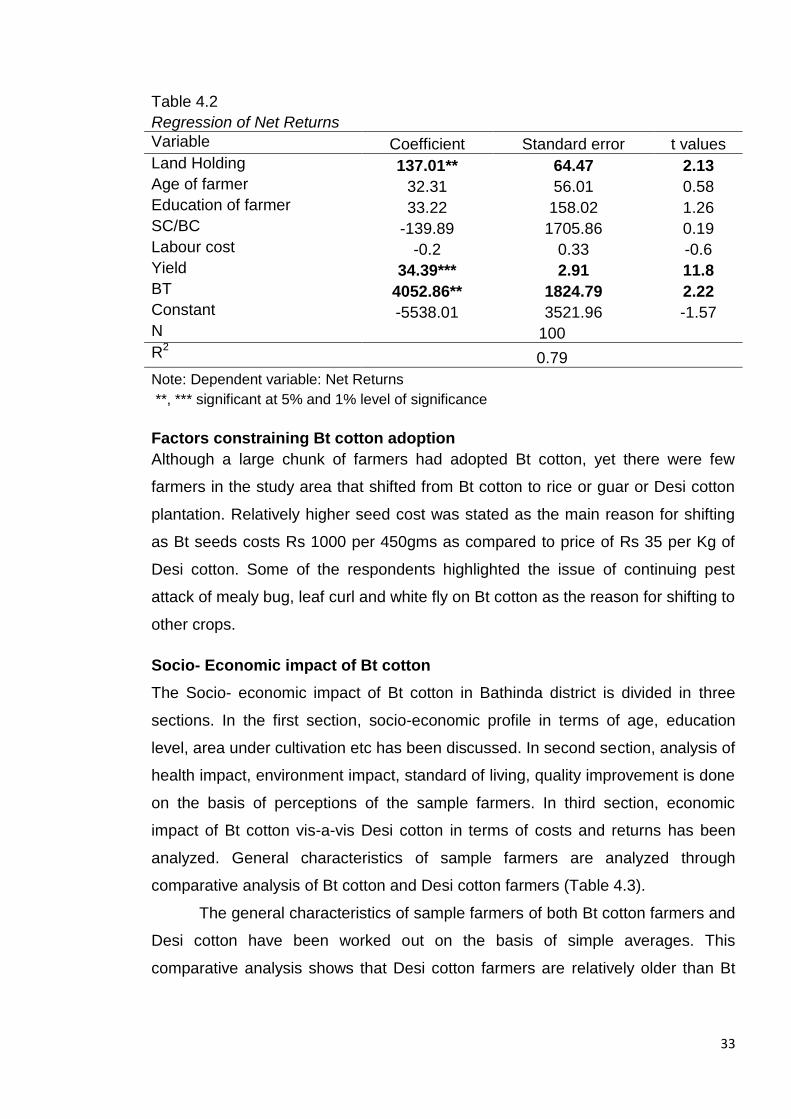
Result of Equation (2)
The estimates of regression with Net returns as dependent variable are given in
Table 4.2. It may be observed that landholdings, farmers who have adopted Bt
cotton and yield have a positive and significant impact on net returns at 5%, 5%
and 1% level of significance respectively. The statistical significance of the yield at
1% level of significance shows that yield turned out to be the major factor in
getting higher Net returns.
33
Table 4.2
Regression of Net Returns
Variable Coefficient Standard error t values
Land Holding 137.01** 64.47 2.13 Age of farmer 32.31 56.01 0.58 Education of farmer 33.22 158.02 1.26 SC/BC -139.89 1705.86 0.19 Labour cost -0.2 0.33 -0.6 Yield 34.39*** 2.91 11.8 BT 4052.86** 1824.79 2.22 Constant -5538.01 3521.96 -1.57 N 100
R2 0.79
Note: Dependent variable: Net Returns
**, *** significant at 5% and 1% level of significance
Factors constraining Bt cotton adoption
Although a large chunk of farmers had adopted Bt cotton, yet there were few
farmers in the study area that shifted from Bt cotton to rice or guar or Desi cotton
plantation. Relatively higher seed cost was stated as the main reason for shifting
as Bt seeds costs Rs 1000 per 450gms as compared to price of Rs 35 per Kg of
Desi cotton. Some of the respondents highlighted the issue of continuing pest
attack of mealy bug, leaf curl and white fly on Bt cotton as the reason for shifting to
other crops.
Socio- Economic impact of Bt cotton
The Socio- economic impact of Bt cotton in Bathinda district is divided in three
sections. In the first section, socio-economic profile in terms of age, education
level, area under cultivation etc has been discussed. In second section, analysis of
health impact, environment impact, standard of living, quality improvement is done
on the basis of perceptions of the sample farmers. In third section, economic
impact of Bt cotton vis-a-vis Desi cotton in terms of costs and returns has been
analyzed. General characteristics of sample farmers are analyzed through
comparative analysis of Bt cotton and Desi cotton farmers (Table 4.3).
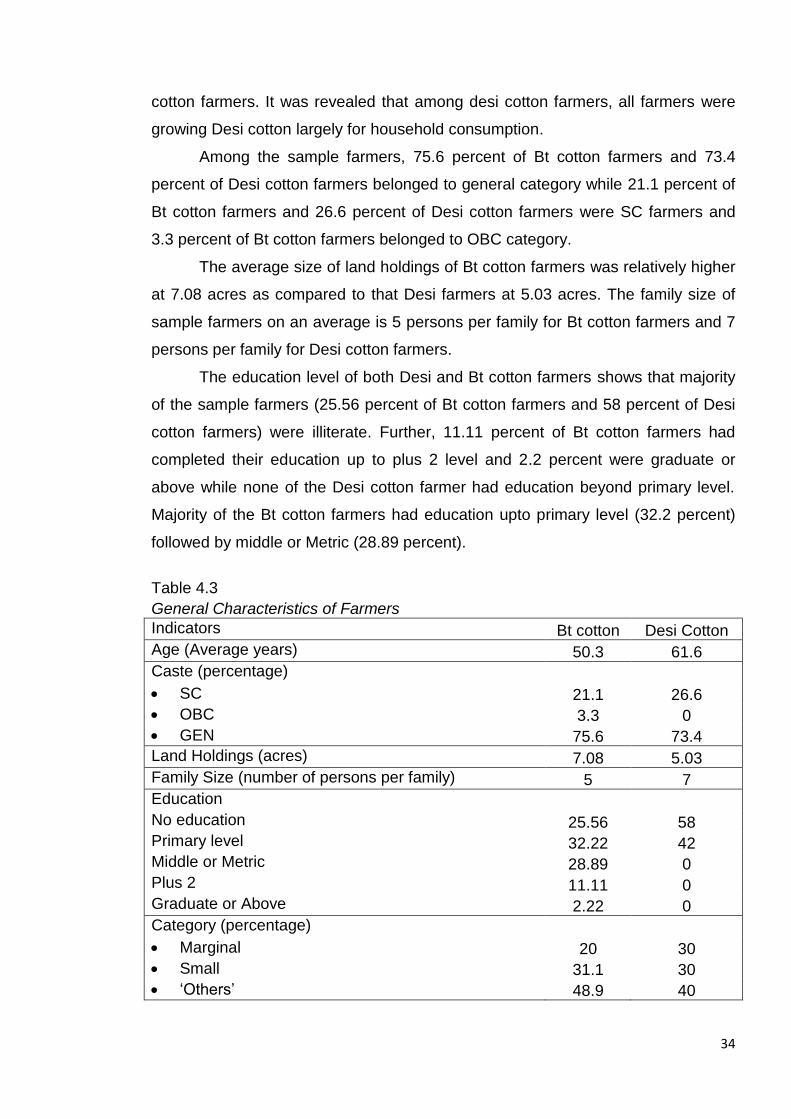
The general characteristics of sample farmers of both Bt cotton farmers and
Desi cotton have been worked out on the basis of simple averages. This
comparative analysis shows that Desi cotton farmers are relatively older than Bt
34
cotton farmers. It was revealed that among desi cotton farmers, all farmers were
growing Desi cotton largely for household consumption.
Among the sample farmers, 75.6 percent of Bt cotton farmers and 73.4
percent of Desi cotton farmers belonged to general category while 21.1 percent of
Bt cotton farmers and 26.6 percent of Desi cotton farmers were SC farmers and
3.3 percent of Bt cotton farmers belonged to OBC category.
The average size of land holdings of Bt cotton farmers was relatively higher
at 7.08 acres as compared to that Desi farmers at 5.03 acres. The family size of
sample farmers on an average is 5 persons per family for Bt cotton farmers and 7
persons per family for Desi cotton farmers.
The education level of both Desi and Bt cotton farmers shows that majority
of the sample farmers (25.56 percent of Bt cotton farmers and 58 percent of Desi
cotton farmers) were illiterate. Further, 11.11 percent of Bt cotton farmers had
completed their education up to plus 2 level and 2.2 percent were graduate or
above while none of the Desi cotton farmer had education beyond primary level.
Majority of the Bt cotton farmers had education upto primary level (32.2 percent)
followed by middle or Metric (28.89 percent).
Table 4.3
General Characteristics of Farmers
Indicators Bt cotton Desi Cotton
Age (Average years) 50.3 61.6
Caste (percentage)
SC 21.1 26.6
OBC 3.3 0
GEN 75.6 73.4
Land Holdings (acres) 7.08 5.03
Family Size (number of persons per family) 5 7
Education
No education 25.56 58 Primary level 32.22 42 Middle or Metric 28.89 0 Plus 2 11.11 0 Graduate or Above 2.22 0
Category (percentage)
Marginal 20 30
Small 31.1 30
„Others‟ 48.9 40

35
(i) Social impact based on perceptions of sample farmers
Improvement in Environmental Factors
90 percent of the sample farmers opined that Bt cotton needs relatively less
number of irrigations (4) as compared to irrigations about 6 for Desi cotton i.e.
relative water demand has decreased for Bt cotton cultivation. All the Bt cotton
farmers were of the view that there was a reduction in American Bollworm attack
over the years. Due to less incidence of pest attacks, less number of sprays (4)
are applied to Bt cotton as compared to 7 sprays used for Desi cotton cultivation
and this surely has contributed towards better and safe environment. All in all, as
per the farmers‟ perception, Bt cotton has led to an improvement in the quality of
environment. Number of studies Qaim (2009), Mal et.al.(2011), Kouser and Qaim
(2012), Ashok et.al (2012) also supported that Bt cotton is not harmful for the
environment.
Health related indicators
Some studies regarding GM technology have delved upon the adverse impact of
Bt cotton on health. However, all the sample farmers opined that they were not
facing any health problem or any type of skin allergy. Not a single farmer among
the total sample was affirmative about the adverse impact of Bt cotton on food
chain.
Farmer suicides
The issue of farmer suicides has been discussed by various scholars and some of
them have described the association of farmer suicides with Bt cotton. But on the
basis of perceptions of all the sample farmers, the main reasons for suicides were
family disputes, inflation, reckless social expenditure, lack of budget management,
old debt etc and not a single farmer attributed the suicide cases to Bt cotton.
(i) Economic impact
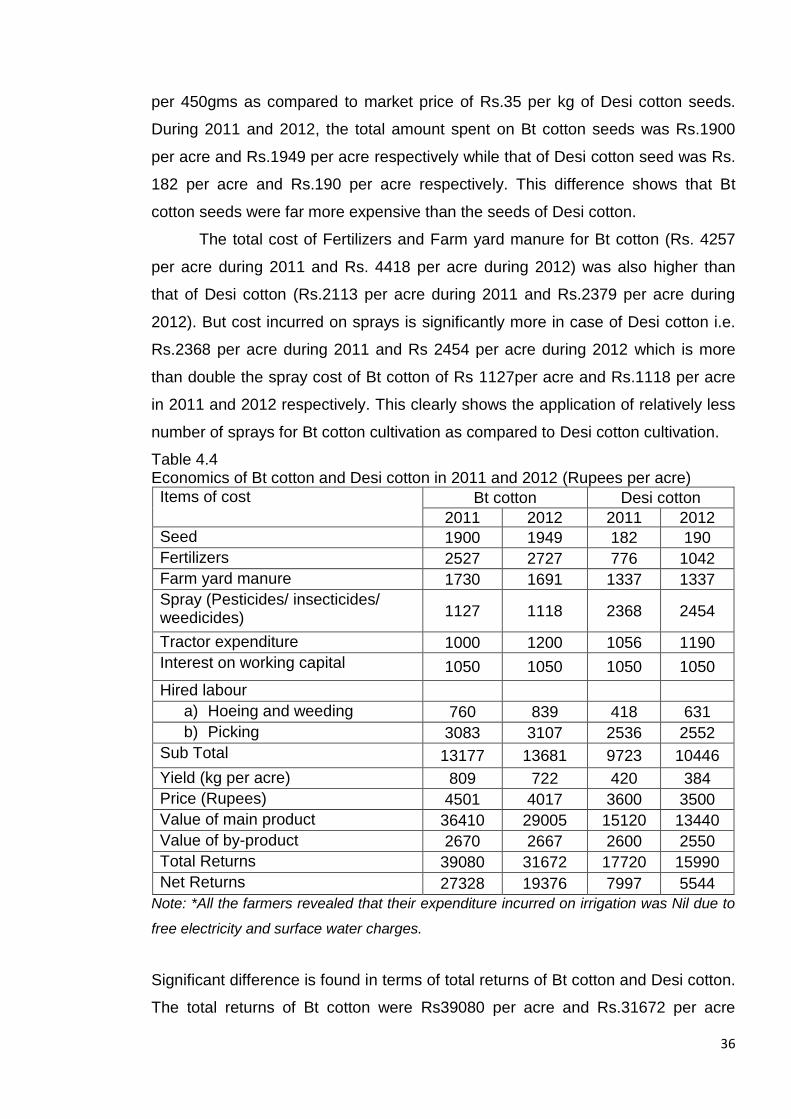
Economics of Bt cotton vis-a-vis Desi Cotton
The economics of Bt cotton and Desi cotton has been worked out for the years
2011 and 2012 (Table 4.4). On an average, the total cost of Bt cotton cultivation is
Rs.13177 per acre and Rs.13681 per acre during 2011 and 2012 respectively
while that of Desi cotton is Rs.9723 per acre and Rs.10446 per acre during 2011
and 2012 respectively. The relatively higher price of Bt cotton seeds is the major
component of cost of cultivation as the market price of Bt cotton seeds is Rs.1000
36
per 450gms as compared to market price of Rs.35 per kg of Desi cotton seeds.
During 2011 and 2012, the total amount spent on Bt cotton seeds was Rs.1900
per acre and Rs.1949 per acre respectively while that of Desi cotton seed was Rs.
182 per acre and Rs.190 per acre respectively. This difference shows that Bt
cotton seeds were far more expensive than the seeds of Desi cotton.
The total cost of Fertilizers and Farm yard manure for Bt cotton (Rs. 4257
per acre during 2011 and Rs. 4418 per acre during 2012) was also higher than
that of Desi cotton (Rs.2113 per acre during 2011 and Rs.2379 per acre during
2012). But cost incurred on sprays is significantly more in case of Desi cotton i.e.
Rs.2368 per acre during 2011 and Rs 2454 per acre during 2012 which is more
than double the spray cost of Bt cotton of Rs 1127per acre and Rs.1118 per acre
in 2011 and 2012 respectively. This clearly shows the application of relatively less
number of sprays for Bt cotton cultivation as compared to Desi cotton cultivation.
Table 4.4 Economics of Bt cotton and Desi cotton in 2011 and 2012 (Rupees per acre)
Items of cost Bt cotton Desi cotton
2011 2012 2011 2012
Seed 1900 1949 182 190
Fertilizers 2527 2727 776 1042
Farm yard manure 1730 1691 1337 1337
Spray (Pesticides/ insecticides/ weedicides) 1127 1118 2368 2454
Tractor expenditure 1000 1200 1056 1190
Interest on working capital 1050 1050 1050 1050
Hired labour
a) Hoeing and weeding 760 839 418 631
b) Picking 3083 3107 2536 2552
Sub Total 13177 13681 9723 10446
Yield (kg per acre) 809 722 420 384
Price (Rupees) 4501 4017 3600 3500
Value of main product 36410 29005 15120 13440
Value of by-product 2670 2667 2600 2550
Total Returns 39080 31672 17720 15990
Net Returns 27328 19376 7997 5544
Note: *All the farmers revealed that their expenditure incurred on irrigation was Nil due to
free electricity and surface water charges.
Significant difference is found in terms of total returns of Bt cotton and Desi cotton.
The total returns of Bt cotton were Rs39080 per acre and Rs.31672 per acre

37
during 2011 and 2012 respectively as against Rs.17720 per acre and Rs.15990
per acre for Desi cotton during 2011 and 2012 respectively. Due to higher total
returns, net returns were also higher for Bt cotton as against Desi cotton by
Rs.19331 per acre during 2011 and by Rs.13832 per acre during 2012. This was
largely due to relatively higher yields of Bt cotton as compared to Desi cotton.
Economics of Bt cotton and Desi cotton (Category wise)
A comparative analysis of economics of Bt cotton and Desi cotton has also been
done for the three categories of farmers (Table 4.5 and Table 4.6). These three
categories are Marginal, Small and „Others‟ farmers. A farmer who is having less
than or equal to one hectare (2.5 acres) of land holdings is categorized as a
„Marginal farmer‟ and a farmer who has less than or equal to 2 hectares (5 acres)
of land holdings is considered as „Small farmer‟ and who is having more than 2
hectares (5 acres) of landholdings is considered as farmer belonging to „Others‟
category. Out of total Bt farmers 20 percent were Marginal farmers, 31.1 percent
were small farmers and 48.9 percent were „Others‟. In case of Desi cotton farmer‟
Marginal, small and farmers of „Others‟ category were 30 percent, 30 percent and
40 percent respectively (Table 4.3).
Cost of Cultivation
The economics of Bt cotton farmers (Table 4.5) shows that cost of hired labour
(Hoeing, weeding and picking) forms the largest component of total cost of
cultivation of Bt cotton. Among all the categories of Bt cotton farmers except
Marginal farmers during 2011, hired labour cost was on an average above Rs.
4000 per acre during 2011 and 2012 respectively. The relatively higher yield of Bt
cotton has resulted in hiring more labours for pickings.
Fertilizers and Farm yard manure was another major component of cost of
cultivation. Among all the three categories of Bt cotton farmers, small farmers were
spending relatively more (Rs.4456 per acre during 2011 and Rs.4613 per acre
during 2012) followed by farmers belonging to category of „Others‟ (Rs.3997 per
acre during 2011 and Rs.4147 per acre during 2012) and marginal farmers (Rs.
3329 per acre during 2011 and Rs.3475 per acre during 2012). It was revealed
that relatively low resource base of some Marginal farmers forced them to apply
relatively less Fertilizers and Manure.
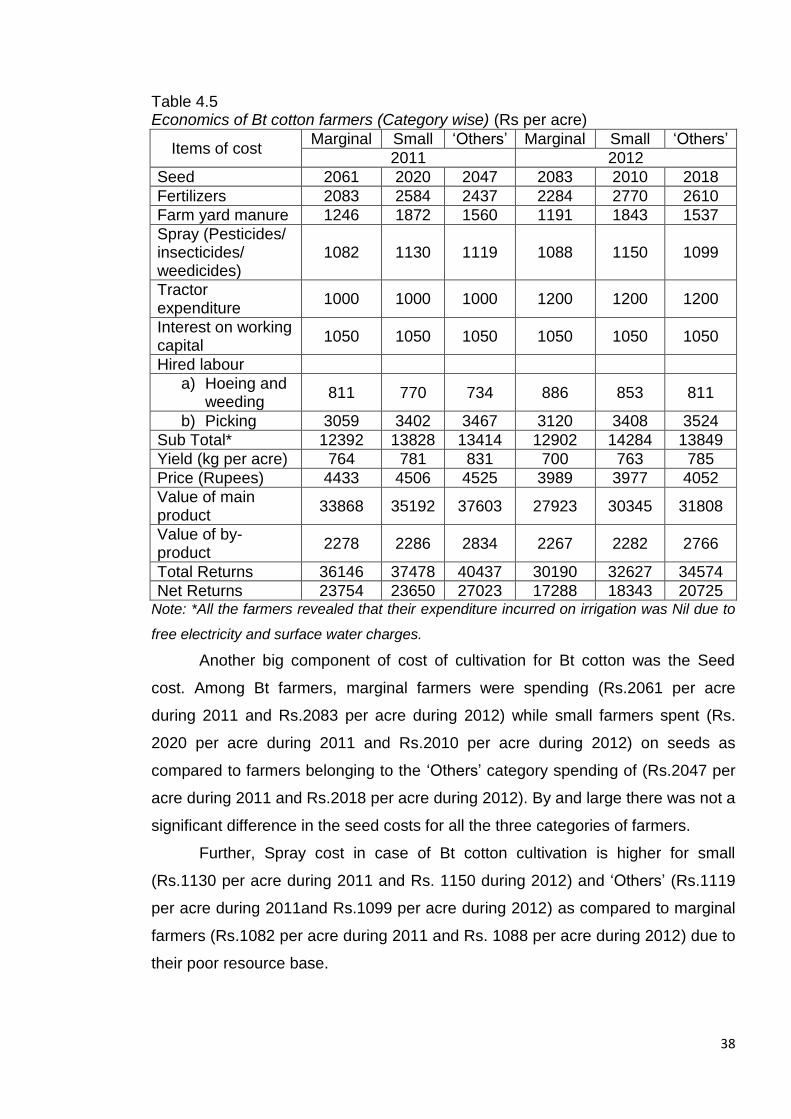
38
Table 4.5 Economics of Bt cotton farmers (Category wise) (Rs per acre)
Items of cost Marginal Small „Others‟ Marginal Small „Others‟
2011 2012
Seed 2061 2020 2047 2083 2010 2018
Fertilizers 2083 2584 2437 2284 2770 2610
Farm yard manure 1246 1872 1560 1191 1843 1537
Spray (Pesticides/ insecticides/ weedicides)
1082 1130 1119 1088 1150 1099
Tractor expenditure
1000 1000 1000 1200 1200 1200
Interest on working capital
1050 1050 1050 1050 1050 1050
Hired labour
a) Hoeing and weeding
811 770 734 886 853 811
b) Picking 3059 3402 3467 3120 3408 3524
Sub Total* 12392 13828 13414 12902 14284 13849
Yield (kg per acre) 764 781 831 700 763 785
Price (Rupees) 4433 4506 4525 3989 3977 4052
Value of main product
33868 35192 37603 27923 30345 31808
Value of by-product
2278 2286 2834 2267 2282 2766
Total Returns 36146 37478 40437 30190 32627 34574
Net Returns 23754 23650 27023 17288 18343 20725 Note: *All the farmers revealed that their expenditure incurred on irrigation was Nil due to
free electricity and surface water charges.
Another big component of cost of cultivation for Bt cotton was the Seed
cost. Among Bt farmers, marginal farmers were spending (Rs.2061 per acre
during 2011 and Rs.2083 per acre during 2012) while small farmers spent (Rs.
2020 per acre during 2011 and Rs.2010 per acre during 2012) on seeds as
compared to farmers belonging to the „Others‟ category spending of (Rs.2047 per
acre during 2011 and Rs.2018 per acre during 2012). By and large there was not a
significant difference in the seed costs for all the three categories of farmers.
Further, Spray cost in case of Bt cotton cultivation is higher for small
(Rs.1130 per acre during 2011 and Rs. 1150 during 2012) and „Others‟ (Rs.1119
per acre during 2011and Rs.1099 per acre during 2012) as compared to marginal
farmers (Rs.1082 per acre during 2011 and Rs. 1088 per acre during 2012) due to
their poor resource base.

39
Returns
The yield of farmers of „Others‟ category was higher as compared to marginal and
small farmers for Bt cotton for both years i.e. 2011 and 2012. The yield of „Others‟
farmers was worked out to be 831 kg per acre as compared to that of small and
marginal farmers of 764 kg per acre and 731kg per acre respectively during 2011.
Due to average weather conditions, there was a reduction in yield of farmers
belonging to all three categories during 2012, yet it was (785 kg per acre) still
relatively higher than that of other two categories.
Due to relatively higher yield, farmers belonging to „Others‟ category
earned relatively higher Net returns of Rs 27023 per acre as compared to Net
returns of marginal (Rs.23754 per acre) and small farmers (Rs. 23650 per acre)
during 2011.
Table 4.6 Economics of Desi cotton farmers (Category wise) (Rs per acre)
Items of cost Marginal Small „Others‟ Marginal Small „Others‟
2011 2012
Seed 173 177 184 185 193 187
Fertilizers 597 968 767 1300 968 920
Farm yard manure 1033 1644 1333 1033 1644 1111
Spray (Pesticides/ insecticides/ weedicides)
2357 2320 2413 2454 2404 2492
Tractor expenditure
1000 1000 1000 1200 1200 1200
Interest on working capital
1050 1050 1050 1050 1050 1050
Hired labour
a) Hoeing and weeding
400 430 423 637 650 617
b) Picking 2333 2520 2700 2453 2460 2827
Sub Total 8943 10109 9870 10312 10657 10404
Yield (kg per acre) 373 353 505 340 333 460
Price (Rs.) 3533 3733 3675 3400 3500 3538
Value of main product
13178 13177 18559 11560 11655 16275
Value of by-product
2183 2200 2200 2067 2067 2050
Total 15361 15377 20759 13627 13722 18325
Net Returns 6418 5268 10889 3315 3065 7921 Note:*All the farmers revealed that their expenditure incurred on irrigation was Nil due to
free electricity and surface water charges.
40
Cost of Cultivation
The economics of Desi cotton farmers (Table 4.6) reveals that the total cost of
Desi cotton cultivation is relatively higher for small farmers(Rs 10109 per acre and
Rs.10316 per acre during 2011 and 2012 respectively) than that of other two
categories. Out of the total cost, more amount was spent on sprays i.e. Rs 2320
per acre during 2011 and Rs.2404 per acre during 2012. But in comparison to
other two categories, spray cost was higher for farmers belonging to „Others‟
category.
The amount spent on Fertilizers and Farm yard manure was another major
component of cost of Desi cotton cultivation. Among all the three categories of
Desi cotton farmers, small farmers were spending relatively more (Rs.2612 per
acre) followed by farmers belonging to category of „Others‟ (Rs.2100 per acre) and
marginal farmers (Rs. 1630 per acre) during 2011. But during 2012 marginal
farmers were spending more (Rs.2333 per acre) as compared to other two
categories.
Desi cotton farmers of all categories were spending on an average a
minimum amount of Rs182 per acre during 2011 and Rs190 per acre during 2012.
Returns
The yield of Desi cotton farmers belonging to „Others‟ category (505 kg per acre
during 2011 and 460 kg per acre during 2012) was found to be higher than that of
marginal farmers (373 kg per acre during 2011 and 340 kg per acre during 2012)
and small farmers (353 kg per acre during 2011 and 333 kg per acre during 2012).
One of the major factors for higher yield of Desi farmers of „Others‟ category can
be relatively more area under irrigation. The relative higher yield of „Others‟
farmers resulted in higher total returns of Rs.10889 per acre and Rs.7921 per acre
during 2011 and 2012 respectively.
The interest on working capital charges for all the categories of farmers for
both Bt cotton and Desi cotton was constant at Rs.1050 per acre. In working out
cost of cultivation, tractor expenditure was valued at market prices despite the
fact that many of the sample farmers owned tractors. The expenditure of using
tractor was Rs.1000 per acre during 2011 and Rs.1200 per acre during 2012 for
Bt cotton farmers as well as for Desi cotton farmers.
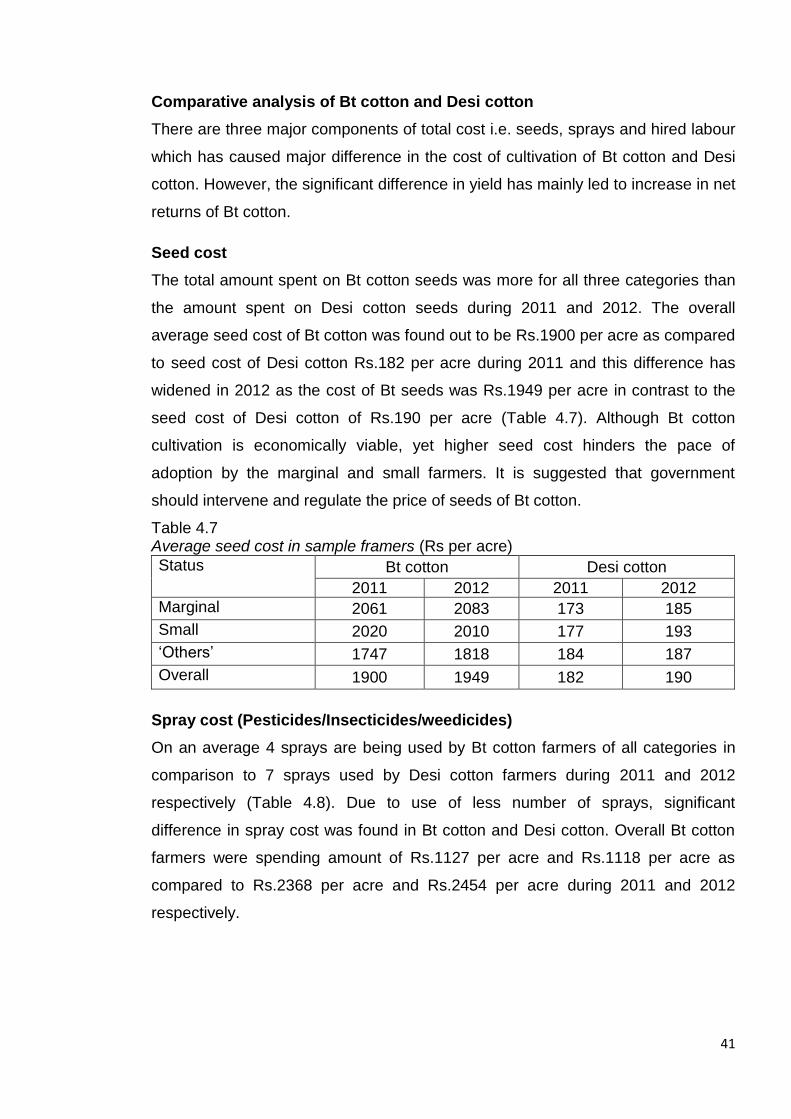
41
Comparative analysis of Bt cotton and Desi cotton
There are three major components of total cost i.e. seeds, sprays and hired labour
which has caused major difference in the cost of cultivation of Bt cotton and Desi
cotton. However, the significant difference in yield has mainly led to increase in net
returns of Bt cotton.
Seed cost
The total amount spent on Bt cotton seeds was more for all three categories than
the amount spent on Desi cotton seeds during 2011 and 2012. The overall
average seed cost of Bt cotton was found out to be Rs.1900 per acre as compared
to seed cost of Desi cotton Rs.182 per acre during 2011 and this difference has
widened in 2012 as the cost of Bt seeds was Rs.1949 per acre in contrast to the
seed cost of Desi cotton of Rs.190 per acre (Table 4.7). Although Bt cotton
cultivation is economically viable, yet higher seed cost hinders the pace of
adoption by the marginal and small farmers. It is suggested that government
should intervene and regulate the price of seeds of Bt cotton.
Table 4.7 Average seed cost in sample framers (Rs per acre)
Status Bt cotton Desi cotton
2011 2012 2011 2012
Marginal 2061 2083 173 185
Small 2020 2010 177 193
„Others‟ 1747 1818 184 187
Overall 1900 1949 182 190
Spray cost (Pesticides/Insecticides/weedicides)
On an average 4 sprays are being used by Bt cotton farmers of all categories in
comparison to 7 sprays used by Desi cotton farmers during 2011 and 2012
respectively (Table 4.8). Due to use of less number of sprays, significant
difference in spray cost was found in Bt cotton and Desi cotton. Overall Bt cotton
farmers were spending amount of Rs.1127 per acre and Rs.1118 per acre as
compared to Rs.2368 per acre and Rs.2454 per acre during 2011 and 2012
respectively.
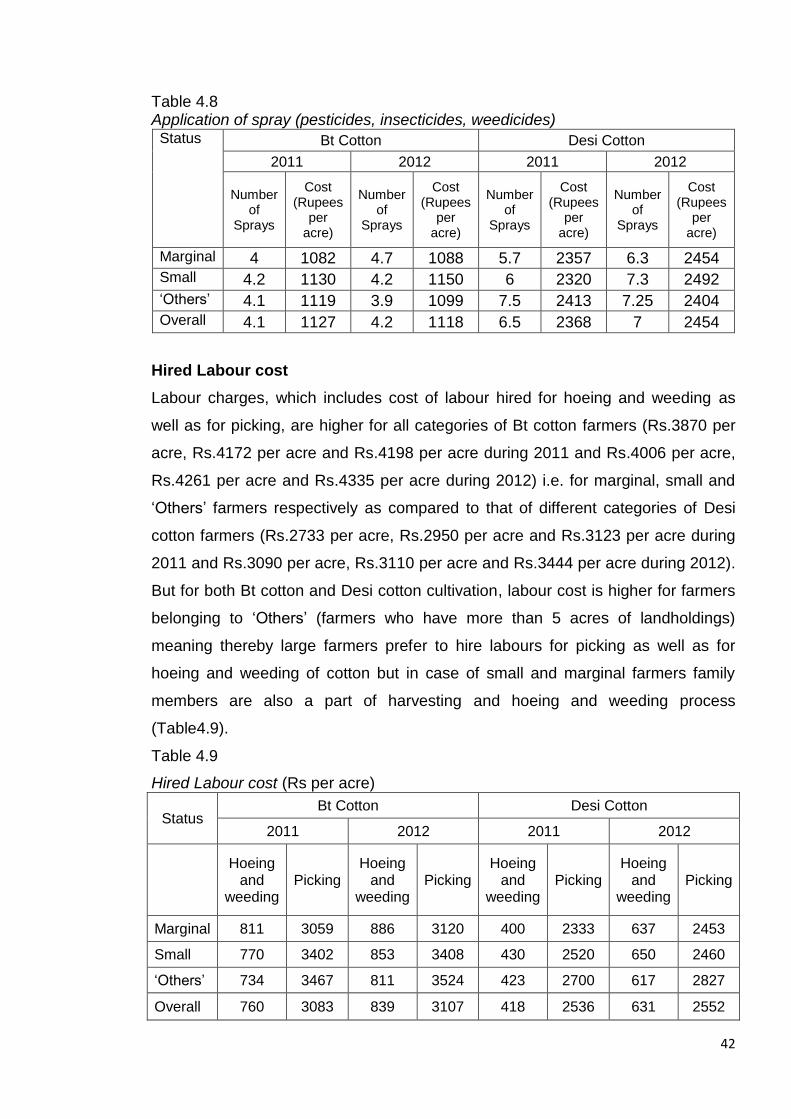
42
Table 4.8 Application of spray (pesticides, insecticides, weedicides)
Status Bt Cotton Desi Cotton
2011 2012 2011 2012
Number of
Sprays
Cost (Rupees
per acre)
Number of
Sprays
Cost (Rupees
per acre)
Number of
Sprays
Cost (Rupees
per acre)
Number of
Sprays
Cost (Rupees
per acre)
Marginal 4 1082 4.7 1088 5.7 2357 6.3 2454 Small 4.2 1130 4.2 1150 6 2320 7.3 2492
„Others‟ 4.1 1119 3.9 1099 7.5 2413 7.25 2404
Overall 4.1 1127 4.2 1118 6.5 2368 7 2454
Hired Labour cost
Labour charges, which includes cost of labour hired for hoeing and weeding as
well as for picking, are higher for all categories of Bt cotton farmers (Rs.3870 per
acre, Rs.4172 per acre and Rs.4198 per acre during 2011 and Rs.4006 per acre,
Rs.4261 per acre and Rs.4335 per acre during 2012) i.e. for marginal, small and
„Others‟ farmers respectively as compared to that of different categories of Desi
cotton farmers (Rs.2733 per acre, Rs.2950 per acre and Rs.3123 per acre during
2011 and Rs.3090 per acre, Rs.3110 per acre and Rs.3444 per acre during 2012).
But for both Bt cotton and Desi cotton cultivation, labour cost is higher for farmers
belonging to „Others‟ (farmers who have more than 5 acres of landholdings)
meaning thereby large farmers prefer to hire labours for picking as well as for
hoeing and weeding of cotton but in case of small and marginal farmers family
members are also a part of harvesting and hoeing and weeding process
(Table4.9).
Table 4.9
Hired Labour cost (Rs per acre)
Status Bt Cotton Desi Cotton
2011 2012 2011 2012
Hoeing
and weeding
Picking Hoeing
and weeding
Picking Hoeing
and weeding
Picking Hoeing
and weeding
Picking
Marginal 811 3059 886 3120 400 2333 637 2453
Small 770 3402 853 3408 430 2520 650 2460
„Others‟ 734 3467 811 3524 423 2700 617 2827
Overall 760 3083 839 3107 418 2536 631 2552

43
Yield
From the analysis, yield of farmers belonging to category of „Others‟ is found more
i.e.831 kg per acre as compared to marginal and small farmers in 2011. And this
holds true for year 2012 also but with low yield than that of in 2011. Less rain fall
and low minimum support prices in 2012 can be attributed to fall in yield level of
each of the category. The yield of Bt cotton as well as Desi cotton is more for the
farmers of „Others‟ category but yield of „Others‟ of Bt cotton is comparatively
higher than the „Others‟ of Desi cotton (Table 4.10).
Table 4.10 Average Yield of Sample Farmers (Kg per acre)
Status Bt Cotton Desi Cotton
2011 2012 2011 2012
Marginal 764 700 373 340
Small 781 763 353 333
„Others‟ 831 735 505 460
Thus socio-economic profile as well as economics of Bt cotton vis-a-vis
Desi cotton farmers shows that Bt cotton farmers are earning more profits and
have better standards of living. Moreover the category wise analysis also shows
the superiority of all categories of Bt cotton farmers in comparison to Desi cotton
farmers. There is a huge difference between the net returns of farmers of all three
categories of Bt cotton and Desi cotton. The Marginal, Small and „Others‟ growing
Bt cotton were earning more net returns by Rs.17336 per acre, Rs.18382 per acre
and Rs.16134 per acre respectively during 2011 and Rs.13973 per acre, Rs.15278
per acre and Rs.12804 per acre respectively during 2012 than Desi cotton
farmers. This simply means that Bt cotton farmers belonging to marginal and small
category are better off than marginal and small farmers of Desi cotton cultivation. If
comparison is done among Bt cotton farmers only, farmers belonging to „Others‟
category are earning higher profits of Rs.27023 per acre and Rs.20725 per acre
than that of marginal (Rs.23754 per acre and Rs.17288 per acre) and small
farmers (Rs.23650 per acre and Rs.18343 per acre) during 2011 and 2012
respectively. It was largely due to increased area under irrigation by „Others‟
category of farmers.
44
Chapter V
Summary and Conclusions
The role played by „genetic engineering‟ in the form of transfer of genes to produce
genetically modified crops was a remarkable effort during 90‟s which led to
increase in production and income. Among all GM crops, Bt cotton has covered
maximum number of beneficiaries in India. The introduction of Bt cotton seeds has
played a catalytic role in enhancing cotton production in India since 2002. In India,
the cotton cultivation is mainly concentrated in three zones i.e. Northern zone,
Central zone and Southern zone. Among the states of northern zone of India, on
an average, Punjab has been the prominent state with relative higher yield,
production and area under cotton cultivation. The adoption of Bt technology
started in 2005 in Punjab after the approval of Genetic Engineering Approval
Committee. The immediate result of this adoption was coverage of more area
under Bt cotton cultivation leading to higher yields and production. In Punjab
cotton is mainly cultivated in the Malwa region which includes the districts of
Bathinda, Faridkot, Muktsar, Moga, Mansa, Ferozpur. Among all the major cotton
producing districts of Punjab, Bathinda has remained in the forefront even before
the introduction of Bt cotton but the adoption of this very technology has helped to
increase the production manifold.
For in-depth investigations, a sample of 100 farmers was selected using the
multi-stage random sampling method. In the first stage, the district with the highest
area under Bt cotton crop in Punjab during 2010-11, namely Bathinda district was
selected for the study. Among different blocks of Bathinda, the block with
maximum area under cultivation of American cotton was selected i.e. Talwandi
Sabo. Finally, a sample of 100 farmers comprising 90 Bt farmers and 10 Desi
cotton farmers from two villages Talwandi Sabo and Gurusar Jagga were
randomly chosen. With a view to achieve the specific objectives of the study,
primary data pertaining to the agricultural year 2011 and 2012 were collected from
the sample farmers with a fairly comprehensive structured schedule. The data thus
collated was processed using tabular analysis, Logit model and Regression
analysis.
Some of the main determinants which influences the adoption of Bt cotton
in the study area were age and education of the farmer. Relatively younger and
45
educated farmers were early adopters of Bt cotton as compared to older and
illiterate farmers who still cultivate Desi cotton and that too largely for household
consumption.
The socio-economic profile of the sample farmers encompassed education
level, age, cropping pattern etc. The data regarding education level of the sample
farmers shows that 40.1 percent of Bt cotton farmers and 58 percent of Desi
cotton farmers were illiterate and none of the Desi cotton farmer had education
beyond primary level. Desi cotton farmers were relatively older than Bt cotton
farmer. The cropping pattern shows that among kharif crops, cotton cultivation has
taken the lead by covering 78.07 percent of total cropped area of Bathinda district.
The social impact of Bt cotton which was analyzed on the basis of
perceptions of the farmers revealed that Bt cotton cultivation had no adverse effect
on health. However, reduced number of sprays for Bt cotton has contributed to the
safety of environment. Bt cotton has not led to farmer suicides while reckless
social consumption, inflation, family disputes were formed to be the main reasons
for suicides.
The economics of Bt cotton vis-a-vis Desi cotton shows that Bt cotton
farmers are earning more profits and therefore have better standard of living.
There is a huge difference between the net returns of farmers of all three
categories of Bt cotton and Desi cotton. The Marginal, Small and „Others‟ growing
Bt cotton were earning more net returns by Rs.17336 per acre, Rs.18382 per acre
and Rs.16134 per acre respectively during 2011 and Rs.13973 per acre, Rs.15278
per acre and Rs.12804 per acre respectively during 2012 than Desi cotton
farmers. This was largely due to higher yield of Bt cotton of 809 kg per acre and
722 kg per acre as compared to Desi cotton (420 kg per acre and 384 kg per acre)
during 2011 and 2012 respectively.
The comparative analysis of seed cost and spray cost of Bt cotton with Desi
cotton revealed that farmers engaged in Bt cotton cultivation saved up to Rs 1241
per acre during 2011 and Rs 1336 per acre during 2012 due to use of less number
of sprays. But they spent more of Rs 1718 per acre and Rs 1760 per acre on
seeds as compared to Desi cotton seeds during 2011 and 2012 respectively. The
high seed price has increased the total cost of Bt cotton as compared to total cost

46
of Desi cotton. It was revealed by resource poor Marginal Desi cotton farmers that
high seed cost is one of the factors hindering the adoption of Bt cotton. So it is
suggested that government should regulate the price of Bt cotton seeds.

47
Bibliography
Anonymous (2006). BT Cotton in India: A Status Report. Asia-Pacific Consortium
on Agricultural Biotechnology, Asia-Pacific Association of Agricultural
Research Institutions, New Delhi.
Anonymous (2007). Genetically Modified Crops: Resources for Environmental
Literacy. Council National Science Teachers Association, NSTA Press,
USA.
Anonymous (2009). Revolution in Indian Cotton. Directorate of Cotton
Development Ministry of Agriculture, Department of Agriculture &
Cooperation Government of India.
Anonymous (2012). Potential Linked Credit Plan 2012-13 Bathinda, NABARD,
Punjab Regional Office, Chandigarh.
Arora, A. and Bansal, S. (2011). Diffusion of Bt Cotton in India: Impact of Seed
Prices and Technological Development. Agricultural & Applied Economics
Association‟s AAEA & NAREA Joint Annual Meeting. Pittsburgh.
Ashok, K. R. et. al. (2012). Economic and Environmental impact of Bt Cotton in
India. Indian Journal of Agriculture Economics. 67(3).
Choudhary, B. and Gaur, K. (2010). BT cotton in India: A Country profile. The
International Service for the Acquisition of Agri-biotech Applications. New
Delhi.
Choudhary, B. and Gaur, K. (2011). Socio Economic and farm level impact of BT
cotton in India: 2002 to 2010. The International Service for the Acquisition
of Agri-biotech Applications. New Delhi.
Dev, S. M. and Rao, N. C. (2007). Socioeconomic Impact of Bt Cotton. Centre for
Economic and Social Studies, Monograph Series (3), Hyderabad.
Gandhi, V. P. and Namboodiri, N.V. (2006). The Adoption and Economics of Bt
Cotton in India: Preliminary Results from a Study. W.P. (2006-09-04), IIT,
Ahmadabad.
48
Gaurav, S. and Mishra, S. (2012). To Bt or Not to Bt? Risk and Uncertainty
Considerations in Technology Assessment. Indira Gandhi Institute of
Development Research, WP-2012-001.
Gill, S. S., Singh, S. and Brar, J. S. (2010). Cotton Economy, Cotton Producers,
and Bt cotton Cultivation in Indian Punjab: An Assessment of Economic
impact and Sustainability issues. In: Gill, S. S., Singh, L. and Marwah, R.
(Eds.) Economic and Environmental Sustainability of the Asian Region, pp.
419-441. Routledge Taylor and Francis Group, London, New York, New
Delhi.
Gruère, G. P., Mehta-Bhatt, P., & Sengupta, D. (2008). Bt cotton and farmer
suicides in India. Reviewing the evidence. International Food Policy
Research Institute (IFPRI) Discussion Paper, 808.
Jalota et. al. (2008). Simulating the Effect of Temperature on Growth and Yield of
Bt Cotton Under Semi-Arid Conditions of Punjab, India. ISPRS Archives
XXXVIII-8/W3 Workshop Proceedings: Impact of Climate Change on
Agriculture.
James, Clave. (2008). Global Status of Commercialized Biotech/GM Crops: 2008.
ISAAA Brief 39. New Delhi.
Kalamkar, S. S. (2012). Biotechnology in Agriculture: Review of Adoption and
Performance of Bt Cotton in india. Indian Journal of Agriculture Economics,
67(3).
Kaphengst Timo et. al. (2011). Final Report: Assessment of the Economic
Performance of GM crops Worldwide. Ecological Institute. Berlin.
Kariharloo, J. L. and Kumar, P.A. (2009). BT Cotton in India: A Status Report.
Asia-Pacific Consortium on Agricultural Biotechnology, Asia-Pacific
Association of Agricultural Research Institutions, New Delhi.
Kathage, J. and Qaim, M. (2011). Are the economic benefits of Bt cotton
sustainable? Evidence from Indian panel data.
49
Kiresur, V.R. and Ichangi, M. (2011). Socio-Economic Impact of Bt Cotton: A Case
Study of Karnataka. Agricultural Economics Research Review, 24, 67-81.
Kouser, S. and Qaim, M. (2012). Valuing financial, health and environmental
benefits of Bt cotton in Pakistan. International Association of Agricultural
Economists (IAAE) Triennial Conference.
Kuruganti, K. (2009). Bt Cotton and the Myth of Enhanced Yields. Economic &
Political Weekly, 44(2), 29-33.
Mal et. al. (2011). Technical Efficiency and Environmental Impact of Bt Cotton and
Non-Bt Cotton in North India. AgBioForum, 14(3),164-170.
Nahatkar, S. and Yadav, S. (2012). Scale Neutrality of frontier Technology in
Agriculture: A Case Study of Bt Cotton Production in Nimar Valley Agro-
climatic Zone of Madhya Pradesh. Indian Journal of Agriculture Economics,
67(3).
Naik et. al. (2005). Bt Cotton Controversy: Some Paradoxes Explained. Economic
& Political Weekly, 40(15), 1514-1517.
Narayanmoorthy, A. and Kalamkar, S. S. (2006). Is Bt Cotton Cultivation
Economically Viable for Indian Farmers? An Empirical Analysis. Economic
& Political Weekly, 2716-2724.
Padaria, R.N. et. al. (2009). A Logit Analysis of Bt Cotton Adoption and
Assessment of Farmers‟ Training Need. Indian Research Journal of
Extension Education, 9 (2), 39-45.
Peshin, R. et. al. (2007). Attributes and Socio-economic Dynamics of Adopting Bt
Cotton. Economic & Political Weekly.
Pray C. E. et. al. (2011). Impact of Bt Cotton, the Potential Future Benefits from
Biotechnology in China and India.
Purcell, J. P. and Perlak, F. J. (2004). Global Impact of Insect-Resistant (Bt)
Cotton. AgBioForum, 7(1&2), 27-30.
50
Sabir, H. M., Tahir, S. H. and Khan, M. B. (2011). BT Cotton and its Impact on
Cropping Pattern in Punjab. Pakistan Journal of Social Sciences, 31(1),
127-134.
Shah, D. (2012). Bt cotton in India: A Review of Adoption, Governmant
Interventions and Investment initiatives. Indian Journal of Agriculture
Economics. 67(3)
Singh S., Singh, S. and Kingra, H.S. (2006). Economic impact of Bt cotton
cultivation in Punjab. Agricultural Economics Research Review, 19.
Conference.
Subramanian, A. and Matin, Q. (2009). Rural Poverty and Employment Effects of
Bt Cotton in India. International Association of Agricultural Economists
(IAAE) Conference, Beijing.
Vishwanathan, P. K. and Lalitha, N. (2010). Does GM Technology Pay Rich
Dividends? Reflections from Bt Cotton Farmers in Maharashtra. In: Gill, S.
S., Singh, L. and Marwah, R. (Eds.) Economic and Environmental
Sustainability of the Asian Region, pp. 391-418. Routledge Taylor and
Francis Group, London, New York, New Delhi.
Waghmare, M. N. and Shendage, P. N. (2012). Imapct of Genetically Modified
Crops on Productivity and Profitability- An Economic Analysis of Bt Cotton
Cultivation. Indian Journal of Agriculture Economics, 67(3).
Wu, Felicia and Butz, P. W. (2004). The Future of Genetically Modified Crops
Lessons from the Green Revolution. RAND Corporation. Pittsburgh.
[CICR] Central Institute of Cotton Research. (2009). Cotton Database.
homepage.<http:/ /www.cicr.org.in. >. Accessed 2011 Nov, 20.
Anonymous (2011). State of Indian Agriculture 2011-12. Department of Agriculture
and Cooperation, Ministry of Agriculture, GOI. homepage.
< http://agricoop.nic.in/ >. Accessed 2011 Nov,20.
Kurungati, K. and Radhakrishnan, S. (2011). 10 Years of Bt Cotton: False Hype
and Failed Promises Cotton farmers‟ crisis continues with crop failure and
51
suicides. Coalition for a GM-Free India. homepage. <www.indiagminfo.org>.
Accessed 2012 Nov, 20.
Official website of Bathinda district homepage.
<http://bathinda.nic.in/District_Plan>. Accessed 2012 Nov,14.
Qaim, M. (2009). The Economics of Genetically Modified Crops. The Annual
Review of Resource Economics.
<10.1146/annurev.resource.050708.144203>. Accessed 2012 July, 27.