Embed Size (px)
Citation preview
1
A question of integrity:
Variants of Bt cotton, pesticides, and productivity in Pakistan
Xingliang Ma1, Melinda Smale2, David J. Spielman3,
Patricia Zambrano3, Hina Nazli4 and Fatima Zaidi3
1 Independent researcher, [email protected].
2 International Food Policy Research Institute. [email protected]; [email protected];
2Michigan State University, corresponding author. [email protected],
3Pakistan Strategy Support Program. [email protected]
Selected paper prepared for presentation at the 2016 Agricultural & Applied Economics
Association Annual Meeting, Boston, Massachusetts, July 31-August2
Copyright 2016 by authors (above). All rights reserved. Readers may make verbatim copies of
this document for non-commercial purposes by any means, provided that this copyright notice
appears on all such copies.
2
Abstract
Bt cotton remains one of the most widely grown biotech crops among smallholder farmers in
lower income countries, and numerous studies attest to its advantages. However, the
effectiveness of Bt toxin, which depends on many technical constraints, is heterogeneous. In
Pakistan, the diffusion of Bt cotton occurred despite a weak regulatory system and without seed
quality control; whether or not many varieties sold as Bt are in fact Bt is also questionable. We
utilize nationally representative sample data to test the effects of Bt cotton use on productivity.
Unlike previous studies, we invoke several indicators of Bt identity: variety name, official
approval status, farmer belief, laboratory tests of Bt presence in plant tissue, and biophysical
assays measuring Bt effectiveness. Only farmer belief affects cotton productivity in the standard
production model, which does not treat Bt appropriately as damage-abating. In the damage
control framework, all Bt indicators reduce damage from pests. Biophysical indicators have the
largest effect and official approval has the weakest. Findings have implications for impact
measurement. For policymakers, they suggest the need, on ethical if not productivity grounds, to
improve variety information and monitor variety integrity closer to point of sale.
3
Introduction
Bt cotton varieties confer genetic resistance to a major order of insect pests (lepidoptera).
Following their initial release in the United States in 1996, experts predicted that Bt cotton
varieties would boost yields especially in lower income countries, where conventional methods
of controlling these pests—which involve the repeated application of insecticides—are especially
costly or poorly managed (e.g., Qaim and Zilberman 2003). Subsequent reviews of economic
analyses based on farm surveys (Qaim 2009; Smale et al. 2010), as well as meta-analyses (Finger
et al. 2011; Areal et al. 2013; Klümper and Qaim 2014), have generally borne out this prediction.
Perhaps the strongest evidence is that on a global scale, Bt cotton remains one of the most widely
grown genetically modified (GM) crops among smallholder farmers in lower income countries.
However, the effectiveness of Bt cotton as a strategy for abating pest damage on farms
depends on several factors, some of which may jeopardize the economic potential of the crop and
raise ethical concerns. First, the expression of Bt toxin, which depends on technical constraints
related to the conditions in the laboratory where the transformation is conducted, and the
backcrossing procedure, is heterogeneous (e.g., Xia et al. 2005; Showalter et al. 2009). In
Pakistan, breeders often develop Bt cotton varieties by backcrossing local genotypes with alien
Bt varieties that contain the Bt gene through a Cry1Ac event that was not patented in Pakistan
(Ali et al. 2012). Second, Bt toxin is expressed across a range of values, not all of which may be
lethal for the targeted pest. In 2012, Cheema et al. (2015) collected Bt cotton seed samples from
famers and seed dealers in selected districts in Punjab and found sub-lethal concentrations of the
Bt toxin in 98 percent of the genotypes tested.
Third, farmers who grow Bt cotton varieties may manage them differently than they
would non-Bt varieties because they believe them to be intrinsically different. Not all
management practices are observable and some affect yields, costs, and profitability. The host
variety may in fact convey greater (or less) yield potential than the genetic background of the
non-Bt variety, either complementing (or counteracting) Bt expression (see studies by Huang et
al. 2002 for China; Crost et al. 2007 and Gruère and Sun 2012 for India; Areal et al. 2013).
Further, in Pakistan, the diffusion of Bt cotton varieties occurred despite a weak
regulatory system and without seed quality control (Rana 2014). Evidence of Bt cotton
cultivation was found as early as 2002 but it was not until 2010 that Pakistan’s National
Biosafety Committee gave its first variety-specific approvals for the release of Bt cotton (Nazli et
4
al. 2012). Between 2010-2014, there were 32 approved varieties of Bt cotton in Pakistan
although numerous other unapproved Bt varieties of possibly variable quality are thought to be
available in the market (Spielman et al. 2015a). Evidence from controlled tests conducted on
field samples has shown that whether varieties sold as Bt actually carry the transgenes is
questionable. Ali et al. (2010) found that 19 percent of seed samples drawn from farmers’ fields
in Sindh and 10 percent of those collected in Punjab tested non-positive for Bt toxin expression;
Ali et al. (2012) found that 30 percent of the seed samples obtained directly from the market
tested non-positive for the Bt gene expression.
In this paper, we use a damage control framework to test how the integrity of Bt cotton
varieties affects cotton productivity among smallholder growers in Pakistan. By variety
integrity, we refer to the physical, physiological and genetic characteristics of the seed are
consistent, measurable or recognizable to farmers (e.g., true to type; true to label, as in Sperling
et al. 2004). We invoke five definitions of Bt integrity based on data from face-to-face interviews
whether the variety identified by the farmer is 1) named as a Bt or non-Bt variety by the supplier
(“Bt name”); 2) entered in the official catalog as a Bt variety or not (“Bt official”); 3) believed by
the farmer to be Bt or not (“Bt belief”); 4) confirmed or rejected as Bt by laboratory tests of
cotton tissue samples taken from the main plots of farmers’ fields (“Bt presence”); and 5), found
to be effective in causing insect mortality beyond a predetermined threshold in further laboratory
tests conducted on the expression of the Bt toxin in the cotton tissue sample (“Bt effective”).
Laboratory tests have rarely been used in applied economics studies of biotech crops,
despite that they are frequently employed in the biophysical sciences. Here, two specific
laboratory tests were employed to construct the fourth and fifth indicators, respectively: lateral
flow strip assays (commercially known as ImmunoStrip tests or “strip” tests) to test for the
presence of the Bt (Cry) protein, measured as a binary variable; and antibody-based enzyme-
linked immunosorbent assay (ELISA) tests to assess the expression levels of protein, measured
as a continuous variable. Similar to Pemsl et al. (2005), we also conducted an independent
bioassay to determine the lethal Bt toxin expression level for a common group of target insects
(Spielman et al. 2015b). Only Bt varieties with ELISA test scores that surpassed the threshold
determined by the bioassay are classified as effective.
We estimate the damage control model with nonlinear least squares, which imposes some
restrictions on choice of more flexible functional forms because of its complexity. We assume
5
that the potential yield function follows a conventional Cobb-Douglas production function and
that the cumulative distribution function of the damage abatement component follows an
exponential form. We estimate and compare five models, each including one of the Bt indicators.
Our analysis contributes to the literature in two ways. First, as compared to previous
applied microeconomics studies conducted in Pakistan (Ali and Abdulai 2010; Nazli et al. 2012;
Kouser and Qaim 2013), we utilize data collected from a detailed survey of a nationally
representative sample of cotton growers. Each of these studies demonstrated that Bt cotton
varieties are more productive and farmers who grow them use less pesticide (Ali and Abdulai
2010; Nazli et al. 2012; Kouser and Qaim 2013). Secondly, as compared to previous analyses of
the productivity impacts of Bt cotton (e.g., Huang et al. 2002; Qaim and de Janvry 2005; Kouser
and Qaim 2013), which differentiated Bt and non-Bt varieties based solely on name, we utilize
farmer perceptions as well as results of laboratory tests in our analysis. Clearly, a variable based
on name is appropriate if cotton varieties sold and/or planted as Bt consistently carry the Bt
genes and consistently express themselves at lethal levels. As we argue above, this is not likely
to be the case. If, as the evidence suggests for Pakistan, variety integrity is questionable and the
effectiveness of Bt expression is heterogeneous, use of a variable based on name could bias
results.
The lack of, or ineffectiveness of, the Bt toxin in a so-called Bt cotton variety raises non-
trivial issues both for Pakistan’s economy and the international cotton market. Cotton is an
important source of rural income in Pakistan, with approximately 2.2 million farm directly
engaged in cotton cultivation, accounting for 26 percent of all farms in the country (GOP 2012).
Cotton also accounts for over 50 percent of foreign exchange earnings via the textiles industry
(GOP 2014). Globally, Pakistan has been consistently ranked as the world’s fourth largest cotton
producer and third largest consumer (GOP 2014).
Ineffectiveness of Bt cotton could potentially contribute to the natural evolution of pest
resistance, encumbering farmers with greater losses and insecticide costs in the future. Kouser
and Qaim (2013) observe that while cotton growers in Pakistan apply less pesticides to plots
where they plant Bt varieties, these reductions are small in comparison to those observed in
studies from other lower income countries. This is consistent with findings from China, where
Huang et al. (2002) reported that despite reductions in pesticide application, overuse continued
among cotton growers even after adoption of Bt cotton varieties. Pemsl et al. (2005) identified

6
market and institutional failures as possible reasons for such practices, although more recent
work by Liu and Huang (2013) attributes this problem to the risk preferences of cotton farmers.
A competing hypothesis is that, because the effectiveness of Bt cotton varieties may not be high
enough to resist pests effectively, farmers continue to apply high levels of pesticides to ensure
their crop is adequately protected from cotton bollworms. In Pakistan, one possible reason they
can afford to do this is the relatively low cost of Bt cotton seed.
Below, we begin by presenting the modeling framework, with reference to key literature
and previous findings. In Section III, we present the elements of our empirical strategy, including
the data source and variable definitions. Findings, including descriptive statistics, regression
results, and robustness checks, are discussed in the Section IV. Conclusions are drawn in Section
V. Section VI reports implications for public policy in Pakistan and further research on this
topic.
Empirical strategy
Relevant models
In their landmark 1986 article, Lichtenberg and Zilberman (1986) distinguished the crop
production roles of damage-abating and productivity-enhancing inputs. Farmers apply inputs
such as fertilizer to augment the yields they expect to attain, while they deploy pesticides to
counteract yield losses relative to planned or expected output. A major insight in this article was
to show that standard production models (the Cobb-Douglas, specifically) can lead to biased
findings concerning the marginal productivity and efficiency of pesticide use. Since this study,
numerous adaptations and advances from the basic model, many of which have focused on
model specification, have been proposed (e.g., Fox and Weersink 1995; Saha et al. 1997; Guan et
al. 2005; Chambers et al. 2010). Hall and Moffitt (2002) demonstrated that the specification bias
in estimates of marginal productivity of pesticides generated by applying a Cobb-Douglas model
instead of a damage control framework could be negative rather than positive as originally
argued by Lichtenberg and Zilberman (1986).
In the original notation of Lichtenberg and Zilberman (1986), the damage control
function is defined as Y=F[(Z), G(𝐗)], where the vector Z includes productive, or
“conventional” inputs as usually modeled in a production analysis, and the vector X consists of
7
control inputs. G(X) is increasing in X and approaches an upper limit of 1, where Y=F(Z)). As X
decreases, G(X), and Y=F(Z, 0) approach the lower limit of 0, or a level that represents
maximum destructive capacity. In empirical work, the function is generally simplified as a
proportional one: Y=F(Z)G(X). A damage abatement effect is then understood as the proportion
of the destructive capacity (represented as a cumulative density function valued between 0 and 1)
that can be offset by utilizing a given amount of a control input. Weibull, exponential, and
logistic functions are commonly selected to represent the cumulative distribution function G(X),
which lies in a [0,1] interval. Meanwhile, F(Z) is interpreted as potential or maximum yield that
can be obtained with zero pest damage or maximum pest control.
A damage control input can be understood not only as an input such as pesticide but also
as a crop variety carrying genetic resistance to pests or disease, tolerance to abiotic stresses, or as
any other input that a farmer uses with the goal of mitigating yield losses (Horna et al. 2008).
Thus, economists have applied the damage control framework to measure the impact of growing
Bt cotton varieties. Within this body of work, the most pertinent studies are those conducted by
Shankar and Thirtle (2005) in South Africa, Pemsl et al. (2005) in China, Qaim and de Janvry
(2005) in Argentina, and Kouser and Qaim (2013) in Pakistan.
Shankar and Thirtle (2005) employed a Cobb-Douglas functional form for F(Z) “due to
the relatively small size of the available sample,” which included a cross-section of only 91
observations out of a sample of 100 smallholder cotton farmers in Makhathini Flats, KwaZulu-
Natal, South Africa. Data collected on input use were also cursory in these initial years of Bt
cotton use, including conventional inputs land (ha), labor (days), total seed quantities (kg), and
pesticides (kg). The authors recognized that while a damage abatement input such as a pesticide
should only be included in the damage function, in the case of varieties with genetic traits that
confer insect resistance, the genetic background of the variety into which the genes are inserted
could also generate an affect in the production function. Comparing several models, they found
that in the most parsimonious models, conventional inputs had strong and expected signs, but in
none of the production models was the Bt indicator statistically significant. At the same time, the
Bt indicator and pesticide use were both highly significant in damage control, regardless of
model.
A second landmark study was conducted by Qaim and de Janvry (2005) on Bt cotton and
pesticide use in Argentina. Given that Bt cotton had not been widely adopted in Argentina, the
8
study utilized various methods to address a potential bias in estimated parameters resulting from
self-selection by early adopters, including plot-based estimation for partial adopters, which
controls for intrinsic, unobserved farmer characteristics. Qaim and de Janvry (2005) found that
growing Bt cotton varieties had a positive effect in their production model (a quadratic functional
form). Since Bt genes had been incorporated in varieties that had never been grown in Argentina,
this result could have reflected a germplasm effect (although the authors argued to the contrary).
The damage function showed a significant effect of growing Bt cotton on the reduction of pest
damage, along with pesticides.
In both of these papers, Bt use was measured as a binary dummy variable. Neither study
described whether categorization was based on farmer belief that the variety was Bt, comparing
names reported by farmers to a supplier or official list, or another form of verification. Pemsl et
al. (2005) addressed this shortcoming in an analysis based on data collected in Shandong
Province, China. Recognizing that “the variety dummy may include also non-pest control effects
if other factors cannot be adequately controlled (p. 47),” they measured the Bt trait by selecting
cotton leaf samples from the plots of the farmers they surveyed and examining the tissue for
toxin expression. They estimated the insecticide use function and production function with
damage abatement simultaneously, adding farmer experience, village fixed effects, herbicide,
and crop rotation to labor and pesticide factors. A variety dummy was included in the model in
addition to their variable measuring the concentration of Bt toxin. The authors estimated a
Cobb-Douglas production model with an exponential form for the damage function.
The findings of Pemsl et al. (2005) differ substantively from others reported in the
literature at that time. The authors highlighted the lack of standards and market imperfections in
China’s cotton seed market that accompanied the introduction of Bt cotton. A striking finding
reported by Pemsl et al. (2005) was that neither the coefficient on pesticide use nor that on Bt
toxin concentration was statistically significant in damage control model, contradicting previous
work for China (Huang et al. 2002) and other work we cite here. They suggest that the variability
in input quality, combined with the low variability in pesticide use and its generally high level of
use could explain this result. Further, the variety dummy was significant and positive in the
insecticide use equation, but of no statistical significance in the damage control model.
In focusing on how Bt is measured, we are influenced by Pemsl et al. (2005). Otherwise,
the analysis by Kouser and Qaim (2013), applied to data collected in Pakistan, is the most

9
pertinent to our study. Like Qaim and de Janvry (2005), Kouser and Qaim (2013) specified a
quadratic form for the production function, reporting that similar results were obtained when
other functional forms were employed. Their Bt variable was a dummy variable, and the data
they use were collected from a sample of 352 farmers located in four districts in Punjab, where
42 percent of the country’s cotton area is produced. Kouser and Qaim (2013) found that the Bt
variety dummy both increased cotton yield in both the standard production model and reduced
losses in the damage control model. This finding suggests both a germplasm effect and a Bt
effect, though as noted by Pemsl et al. (2005), these could be confounded in the binary variable
measuring Bt.
Shankar and Thirtle (2005), like Qaim and de Janvry (2005), chose the logistic
distribution as the more suitable characterization for G(X) than either the exponential or the
Weibull distributions. They noted that the exponential form implies concavity when G(X) is > 0,
or that damage abatement increases at a decreasing rate, contending that a positive second
derivative of the function is plausible; they also found “counter-intuitive” results when testing
the models with a Weibull specification (Qaim and de Janvry 2005: 104). In contrast, Pemsl et
al. (2005) and Kouser and Qaim (2013) estimate their model assuming an exponential
distributional form. Kouser and Qaim (2013) concluded that their findings were robust to form of
the damage function.
Specification
We estimate the damage control model with nonlinear least squares, which imposes some
restrictions on choice of more flexible functional forms because of its complexity. Concerning
the production model, we chose the Cobb-Douglas functional form for comparability and
because it is parsimonious. We also tested the quadratic functional form, but most of the
estimated coefficients were statistically insignificant although they have similar signs to those
generated using the Cobb-Douglas functional form. With respect to the damage function, the
Weibull functional form is restrictive on its domain and cannot be applied when many inputs are
close to zero in value. Estimation with a logistic functional form returned similar results to those
obtained with the exponential form, except that many coefficients lost their statistical
significance. Thus, in the empirical analysis that follows, we assume that F(Z) follows a
10
conventional Cobb-Douglas production function and the damage abatement function follows an
exponential cumulative distribution function form:
𝐹(𝐙) = 𝛽0 ∏ 𝒁𝑖𝛽𝑖
𝑖
𝐺(𝐗) = 1 − 𝑒−𝛾1𝑥1−𝛾2𝑥2
where the vector Z consists of conventional inputs (labor, fertilizer, seed, irrigation), specified as
logarithms. For comparative purposes, we estimate both a standard production model and a
damage control model.
In our production function formulation, we test the effects of our different Bt indicators
as dummy variables on the intercept term. In addition, we include the years of education of the
household head to account for the effect of human capital and management capacity, land
cultivated in the preceding year for scale effect, and the agro-climatic zones within the cotton-
growing regions to control for differences in rainfall and temperature that could potentially affect
cotton production. The scale of the farm operation, which is captured by land cultivated in the
previous season to ensure that it is predetermined in the current season, may relate positively to
productivity through improving access to a range of inputs and information (Feder and Slade
1984). On the other hand, larger scale may reduce the intensity of input use and management,
detracting from per acre yields. Insecticide use is also included in the initial production function
estimation for completeness and purposes of comparison with the damage abatement model.
In the damage abatement model, the vector X is composed of insecticide use and the
same Bt variables. The vector Z′ in this model is identical to Z without Bt variables. We test
multiple Bt indicators in separate models. The dependent variable in both models is observed
cotton production in kgs per acre.
Since Bt cotton in Pakistan has diffused broadly through unofficial channels beginning in
2002, variety identity and the effectiveness of Bt expression are uncertain, the potential bias in
parameter estimates from self-selection is unlikely to be important and also difficult to discern.
Bt cotton was grown on over 2.9 M ha in Pakistan according to James (2014), and cultivated by
85 percent of cotton farmers in our data.

11
Data and variables
Data source
Data for this study are drawn from two sources: (1) a household survey, and (2) a
biophysical survey, both conducted during the 2013 kharif (monsoon) season when cotton is
grown throughout Pakistan. The household survey was designed by the International Food Policy
Research Institute (IFPRI) and implemented by Innovative Development Studies (IDS). Data
were collected in face-to-face interviews with 728 farmers who were selected in a statistically
representative sample of all cotton-growing agro-climatic zones in both Punjab and Sindh
Provinces, accounting for more than 99 percent of the cotton cultivated in Pakistan. Households
were selected in a two-stage sampling procedure stratified by cotton-growing agro-climatic
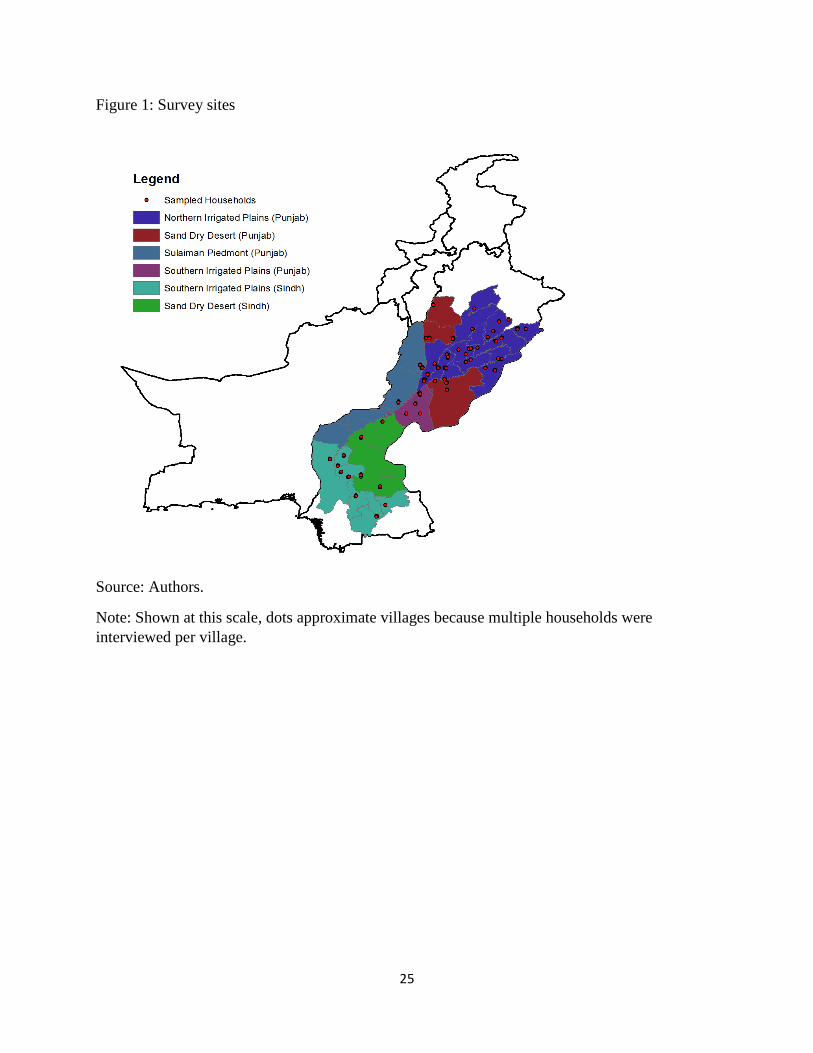
zones (Figure 1). In the first stage, 52 villages are chosen with probabilities that were
proportional to farming population sizes. In the second stage, 14 cotton households are chosen
from each village with equal probability of selection.
The detailed survey was conducted in three rounds during the course of the 2013 cotton-
growing season. The first round was implemented at planting (April 2013), and obtained data on
household, farm, and plot characteristics of cotton growers. The second round was implemented
during or immediately following the first picking, and obtained data relating to input use up to
the first picking (October 2013). The third round was conducted in February 2014 after the
harvest and obtained data on the harvest from each picking and the total sales of cotton. Of the
original sample of 728 households, 46 chose not to grow cotton in kharif 2013, 70 lost their
crops to flood or other natural disasters, 4 migrated, 8 dropped out in the second or third round
surveys, and 29 did not participate in the corresponding biophysical survey.
Summary statistics for those who remained in the sample and those who did not,
provided in an online appendix, demonstrate that the observable household characteristics of the
two groups of farmers are not significantly different. For example, years of education of
household head, and daily expenditure on food per person in the household as a measure of
poverty status, are both insignificant in the mean comparison test across these two groups. They
also have similar average household size and total land owned and operated in 2012. Although
there is slightly difference in household age it is unlikely that it will make distinct difference in
cotton cultivation practices. We believe that the sample retained sufficient coverage of the

12
heterogeneity of cotton-growing households and cotton agro-climatic zones found in Pakistan.
However, we recognize that the combination of household survey dropouts and households that
could not be surveyed for either the first or second rounds of the biophysical survey does limit
the size of the analytical sample.
Fertilizer application rates and irrigation hours were elicited by plot. If more than one
variety was sown per plot, it is not possible to ascertain how much of the input was applied to
each. We restricted the analysis to plots with only one cotton variety in order to accurately
measure the contribution of each input. An alternative might have been to weigh input use by
variety area shares on each plot, although this procedure would have introduced measurement
errors of a different nature. Complete information is available for a total of 535 households, with
each household’s unique cotton variety in the main plot meeting these criteria.
The second component of data collection—the biophysical survey—was led by the
University of Agriculture, Faisalabad (UAF) and the National Institute for Genomics and
Advanced Biotechnology (NIGAB), Islamabad, in collaboration with IFPRI and IDS. In the
biophysical survey, leaf and boll tissue samples were collected from the main cotton plots of
sample farmers and were analyzed in the lab to detect the presence of Bt toxin by Strip tests and
to measure its concentration levels by ELISA tests. A total of two rounds of tests were
conducted, the first at approximately 70 days after sowing (DAS) and the second at
approximately 120 days after sowing (DAS). The first round of data collection conducted
through the biophysical survey, which was constructed in a way that is consistent with the
procedure reported by Pemsl et al. (2005), is utilized here. Data collected in the second round at
120 DAS generated similar results.
In the first round, the bio-physical study team randomly selected five plants in the main
plot of each sample farmer. They then collected leaf samples from among leaves of similar size,
position, color and age from each identified plant separately. These leaf samples were shipped to
the lab and two samples that were collected from different plants were randomly selected to
conduct both the strip and ELISA tests. Both UAF and NIGAB used the industry-standard
equipment (EnvirologixTM QuickStixTM Combo Kits) for Bt toxin detection and followed the
same statistical procedure to measure Bt toxin expression. To establish a threshold for Bt
effectiveness based on the ELISA test results, the UAF team conducted a bioassay study in
which cotton leaf samples from 25 cotton varieties with known levels of Bt toxin concentration

13
were fed to 936 targeted insects (H. armigera or American bollworm) to determine mortality
rates after three days of cotton leaf consumption. A Logit regression of the mortality status over
the ELISA scores suggests that any ELISA score greater than 0.60 μg/g will kill the target insect
with likelihood greater than 50 percent. Similarly an ELISA score of 0.74 μg/g is associated with
a likelihood of 60 percent mortality of the target insect, 0.88 μg/g corresponds to a likelihood of
70 percent, 1.06 μg/g 80 percent, and 1.34 μg/g 90 percent.
Measuring Bt
A perusal of the applied economics literature on the impact of GM crops indicates that
researchers have generally assumed that farmers know with certainty whether the variety they
grow is GM or not. While this assumption may be valid in countries where GM varieties have
been commercialized with well-articulated input supply chains, biosafety and seed marketing
regulations, and labeling and packaging practices, it is less likely to be so in countries where
farmers buy their seed from local informal and unregulated markets, or acquire it from
neighbors, friends or acquaintances.
Several approaches were observed in survey instruments used in previous studies. One
method is to ask farmers directly if they planted Bt cotton. A more sophisticated method involves
asking the farmer if he/she has ever heard of Bt cotton. If the answer is negative, the enumerator
provides a definition, and then asks farmers whether they planted Bt cotton. A third approach is
to ask the farmer to name the varieties he/she has planted and, with the help of local experts,
classify the varieties as Bt or non-Bt based on reported names.
As noted above, Pemsl et al. (2005) provide the first study that introduces a more
objective method of indicating whether or not a variety is Bt. They do so by measuring Bt toxin
concentration of the cotton planted by each survey respondent and using these concentration
levels to generate a continuous variable, along with a more rudimentary variable that classifies
the Bt as either good or bad quality.
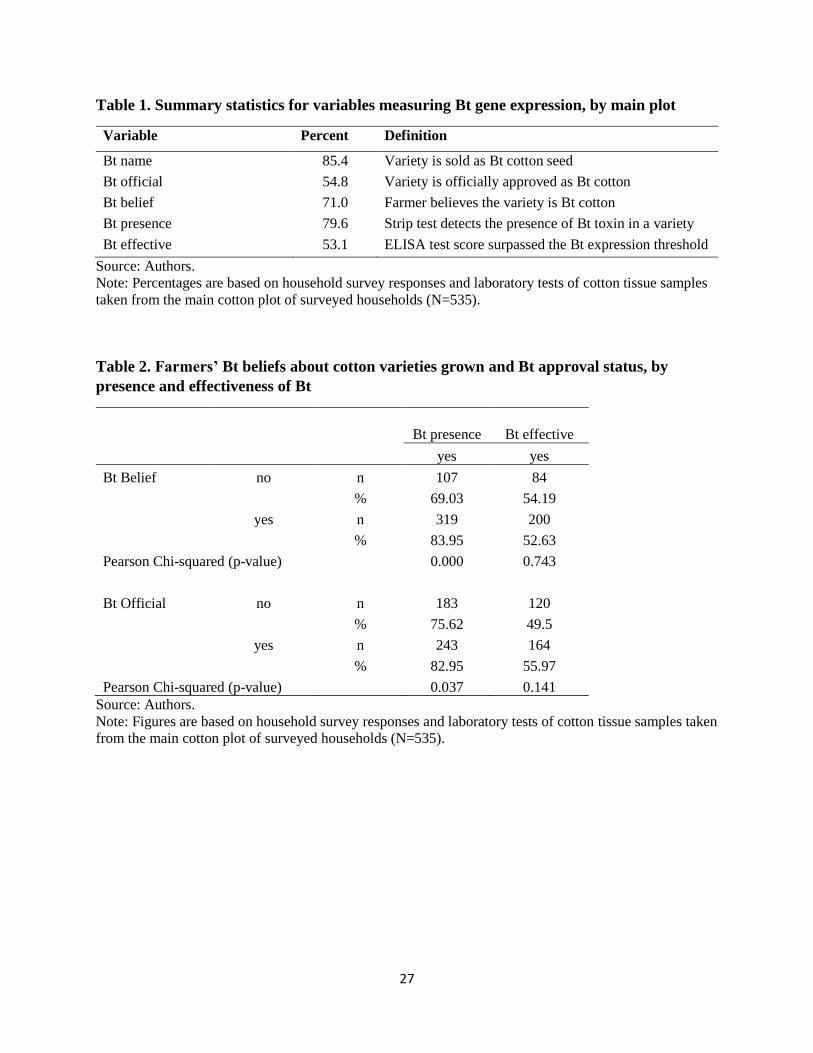
In our analysis, we test five Bt indicators (Table 1). The first, "Bt name,” was developed
by linking the farmer’s survey response when asked the name of the variety planted to publicly
available information about whether a named variety is Bt or not. This information is generally
provided by the seed supplier, but since we rely on farmers’ accuracy in reporting variety names
and expert judgment to classify names, we consider this indicator to be the least reliable. We
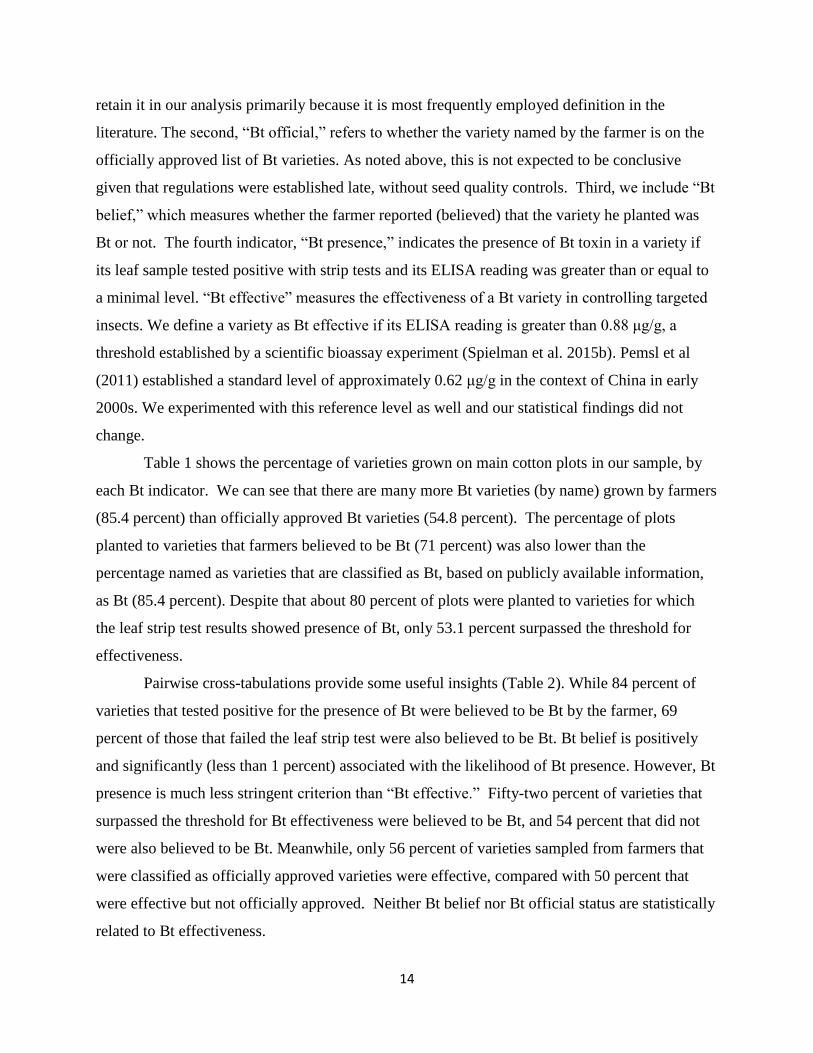
14
retain it in our analysis primarily because it is most frequently employed definition in the
literature. The second, “Bt official,” refers to whether the variety named by the farmer is on the
officially approved list of Bt varieties. As noted above, this is not expected to be conclusive
given that regulations were established late, without seed quality controls. Third, we include “Bt
belief,” which measures whether the farmer reported (believed) that the variety he planted was
Bt or not. The fourth indicator, “Bt presence,” indicates the presence of Bt toxin in a variety if
its leaf sample tested positive with strip tests and its ELISA reading was greater than or equal to
a minimal level. “Bt effective” measures the effectiveness of a Bt variety in controlling targeted
insects. We define a variety as Bt effective if its ELISA reading is greater than 0.88 μg/g, a
threshold established by a scientific bioassay experiment (Spielman et al. 2015b). Pemsl et al
(2011) established a standard level of approximately 0.62 μg/g in the context of China in early
2000s. We experimented with this reference level as well and our statistical findings did not
change.
Table 1 shows the percentage of varieties grown on main cotton plots in our sample, by
each Bt indicator. We can see that there are many more Bt varieties (by name) grown by farmers
(85.4 percent) than officially approved Bt varieties (54.8 percent). The percentage of plots
planted to varieties that farmers believed to be Bt (71 percent) was also lower than the
percentage named as varieties that are classified as Bt, based on publicly available information,
as Bt (85.4 percent). Despite that about 80 percent of plots were planted to varieties for which
the leaf strip test results showed presence of Bt, only 53.1 percent surpassed the threshold for
effectiveness.
Pairwise cross-tabulations provide some useful insights (Table 2). While 84 percent of
varieties that tested positive for the presence of Bt were believed to be Bt by the farmer, 69
percent of those that failed the leaf strip test were also believed to be Bt. Bt belief is positively
and significantly (less than 1 percent) associated with the likelihood of Bt presence. However, Bt
presence is much less stringent criterion than “Bt effective.” Fifty-two percent of varieties that
surpassed the threshold for Bt effectiveness were believed to be Bt, and 54 percent that did not
were also believed to be Bt. Meanwhile, only 56 percent of varieties sampled from farmers that
were classified as officially approved varieties were effective, compared with 50 percent that
were effective but not officially approved. Neither Bt belief nor Bt official status are statistically
related to Bt effectiveness.

15
Thus, when farmers plant approved Bt varieties of cotton, their chances of achieving Bt
effectiveness are not far from a coin toss (50/50). In practice, Pakistani cotton farmers are
obliged to rely on the names of cotton varieties, which could be false, or their own beliefs, to
determine if a variety is Bt or not and to plan accordingly for its cultivation. Lacking sufficient
information, farmers’ belief may not be accurate and therefore they may not make the optimal
production decisions. These statistics are relevant to our analysis because we propose that
farmers’ perceptions of what they grow affect how they manage their crops, such as the timing
and quantity of insecticide applications, how well the crop performs in terms of harvested yield,
and their capacity to control damage from pests.
Other explanatory variables
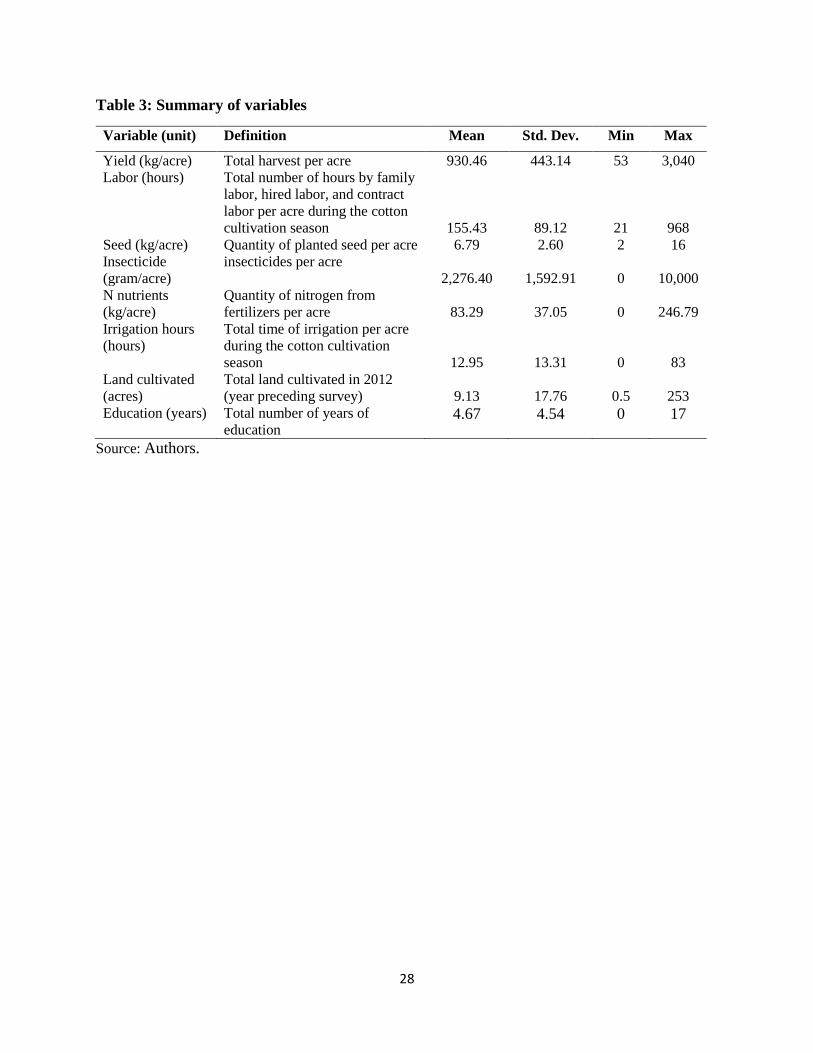
Summary statistics for other explanatory variables are shown in Table 3. We asked farmers about
the use of pesticides in various forms and in different cultivation time periods and then
aggregated them into a single measure. For fertilizer, we computed the quantity of nitrogen
contained in each type of fertilizer applied to the plot during the entire growing season and
divided by the plot area to obtain a rate of N nutrient kgs applied per acre. For labor—a
particularly important input given that cotton is a labor-intensive crop—we asked detailed
questions about the use of family labor, contracted labor, and hired labor, differentiating male
and female labor in the whole cotton cultivation season. Here, to simplify our conventional input
variables, we aggregated over categories to generate the total number of labor hours. For water
and irrigation inputs, and given that many farmers rely on monsoon rains during the kharif
season, groundwater, and canal water from Pakistan’s expansive Indus River basin irrigation
system, we asked detailed questions about water management and calculated both the total
number of irrigations by hours irrigated, aggregating to total time (hours) irrigating the plot.
Finally, we consider agro-climatic zones among our explanatory variables to account for
the potentially heterogeneous conditions under which cotton is cultivated in Pakistan. The vast
majority of farms are located in the Northern Irrigated Plains of Punjab, followed by the
Southern Irrigated Plains of Sindh. The Sand Dry Deserts of either province, and the Sulaiman
Piedmont, represent a minority given much lower population densities in these areas.
16
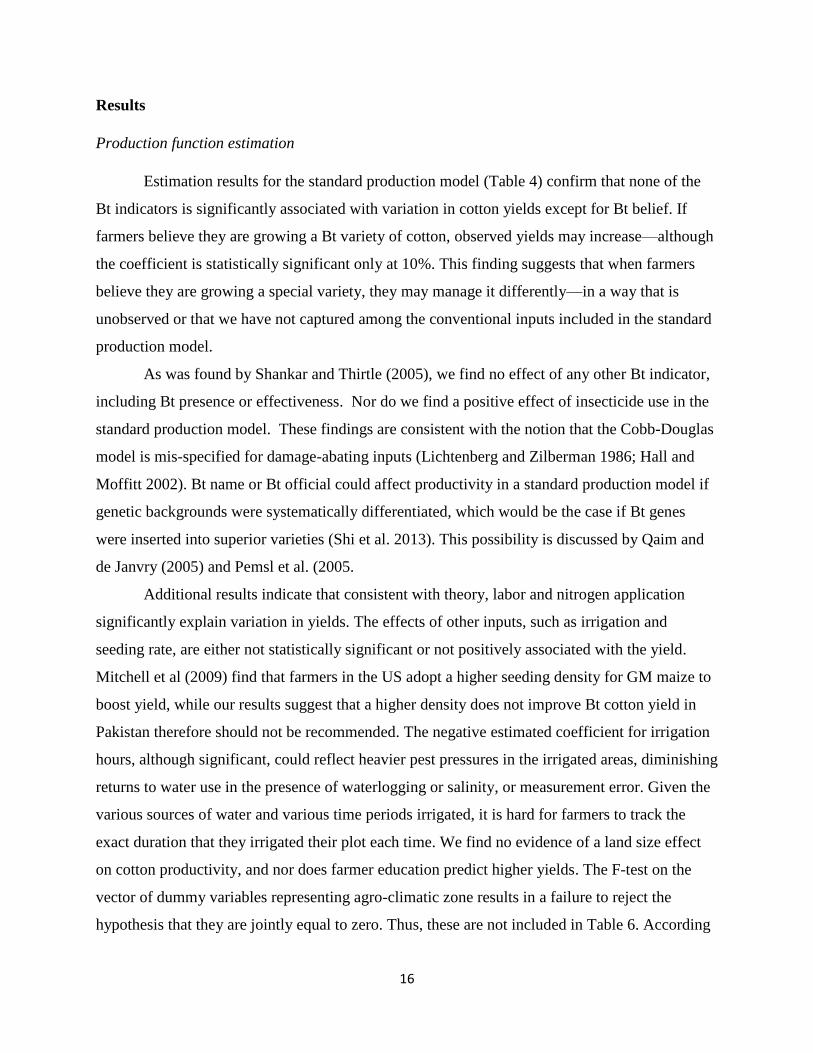
Results
Production function estimation
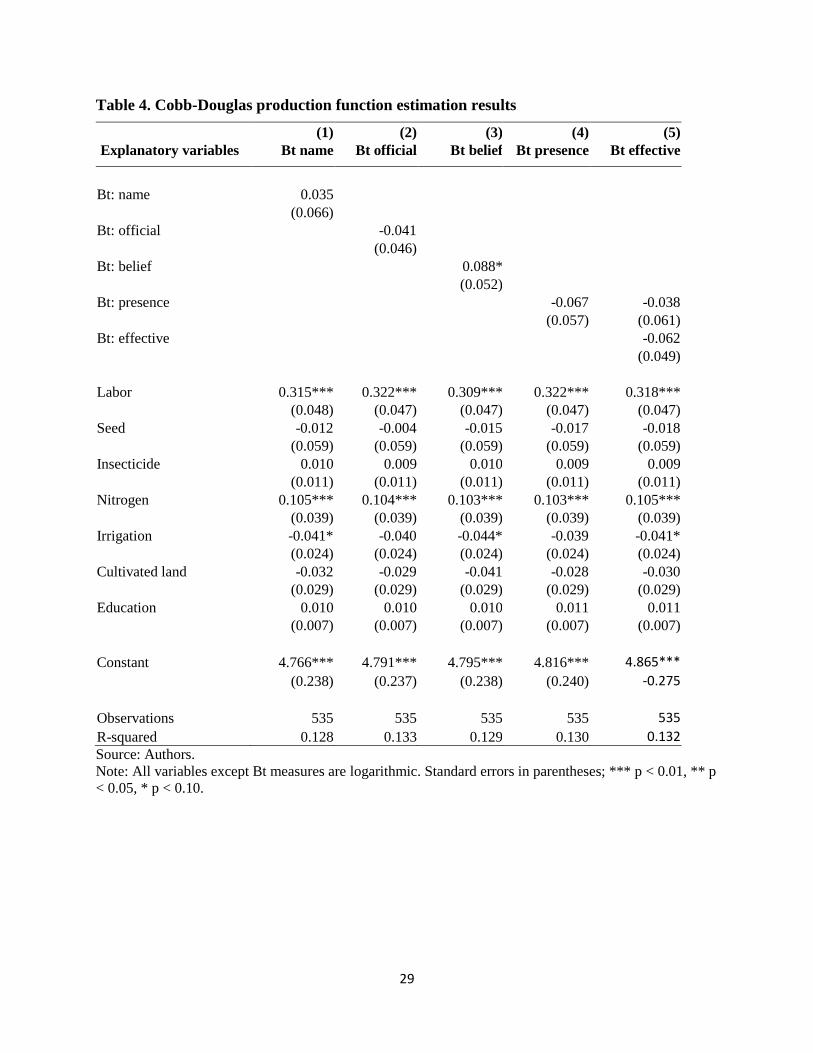
Estimation results for the standard production model (Table 4) confirm that none of the
Bt indicators is significantly associated with variation in cotton yields except for Bt belief. If
farmers believe they are growing a Bt variety of cotton, observed yields may increase—although
the coefficient is statistically significant only at 10%. This finding suggests that when farmers
believe they are growing a special variety, they may manage it differently—in a way that is
unobserved or that we have not captured among the conventional inputs included in the standard
production model.
As was found by Shankar and Thirtle (2005), we find no effect of any other Bt indicator,
including Bt presence or effectiveness. Nor do we find a positive effect of insecticide use in the
standard production model. These findings are consistent with the notion that the Cobb-Douglas
model is mis-specified for damage-abating inputs (Lichtenberg and Zilberman 1986; Hall and
Moffitt 2002). Bt name or Bt official could affect productivity in a standard production model if
genetic backgrounds were systematically differentiated, which would be the case if Bt genes
were inserted into superior varieties (Shi et al. 2013). This possibility is discussed by Qaim and
de Janvry (2005) and Pemsl et al. (2005.
Additional results indicate that consistent with theory, labor and nitrogen application
significantly explain variation in yields. The effects of other inputs, such as irrigation and
seeding rate, are either not statistically significant or not positively associated with the yield.
Mitchell et al (2009) find that farmers in the US adopt a higher seeding density for GM maize to
boost yield, while our results suggest that a higher density does not improve Bt cotton yield in
Pakistan therefore should not be recommended. The negative estimated coefficient for irrigation
hours, although significant, could reflect heavier pest pressures in the irrigated areas, diminishing
returns to water use in the presence of waterlogging or salinity, or measurement error. Given the
various sources of water and various time periods irrigated, it is hard for farmers to track the
exact duration that they irrigated their plot each time. We find no evidence of a land size effect
on cotton productivity, and nor does farmer education predict higher yields. The F-test on the
vector of dummy variables representing agro-climatic zone results in a failure to reject the
hypothesis that they are jointly equal to zero. Thus, these are not included in Table 6. According
17
to the Cobb-Douglas functional form, the sum of estimated input elasticities (well below 1)
suggests decreasing returns to scale. This finding may reflect the particularly labor-intensive
nature of cotton production on these smallholder farms. The mean values of the constant term
suggest that without inputs, expected yields are close to 1 T/ha. The data show that mean yields
across main plots are 2.2 T/ha.
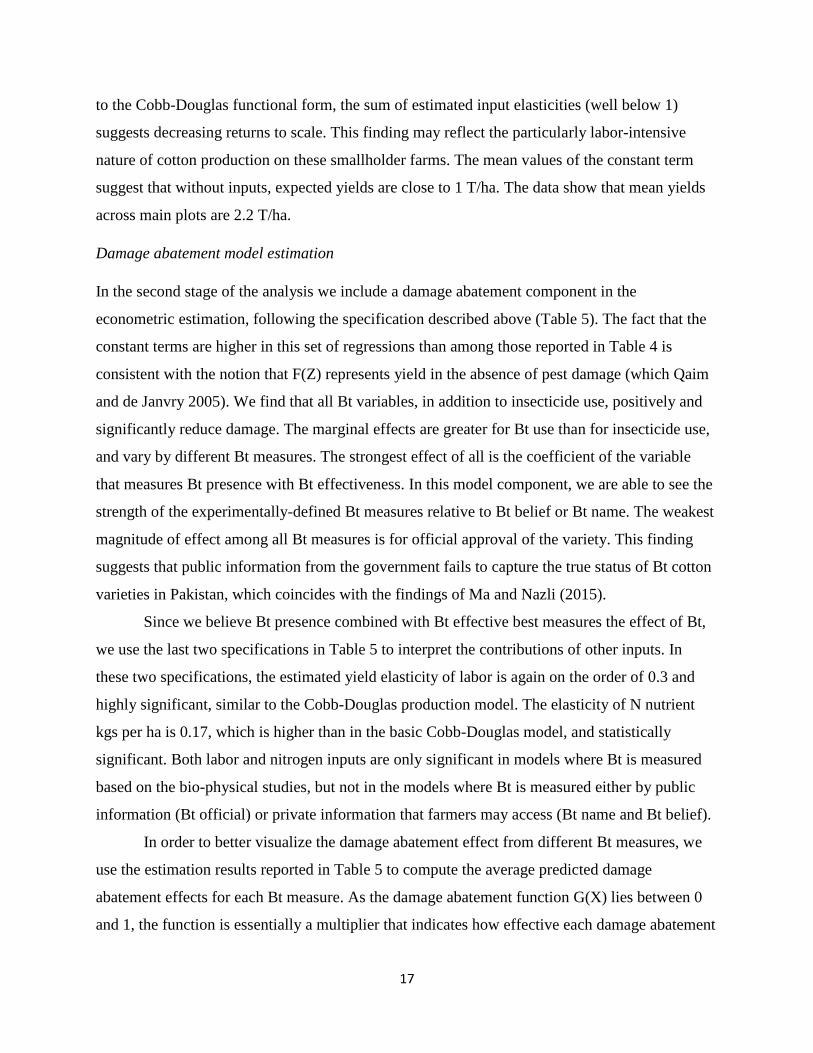
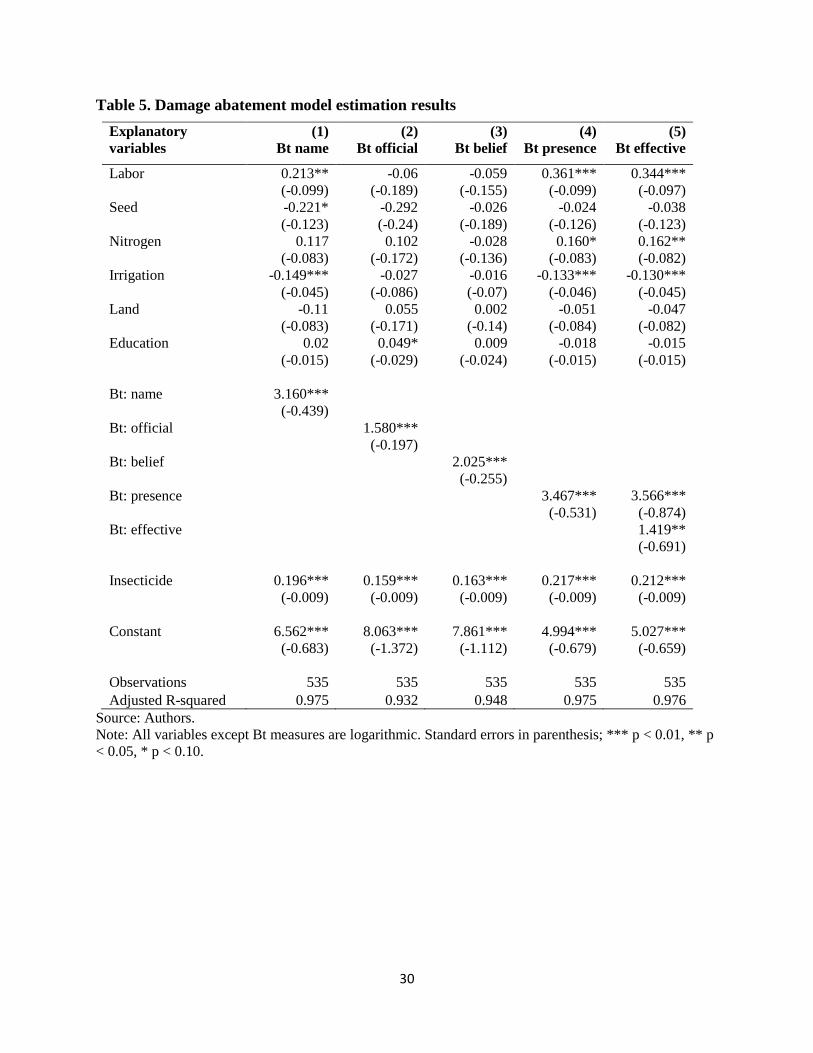
Damage abatement model estimation
In the second stage of the analysis we include a damage abatement component in the
econometric estimation, following the specification described above (Table 5). The fact that the
constant terms are higher in this set of regressions than among those reported in Table 4 is
consistent with the notion that F(Z) represents yield in the absence of pest damage (which Qaim
and de Janvry 2005). We find that all Bt variables, in addition to insecticide use, positively and
significantly reduce damage. The marginal effects are greater for Bt use than for insecticide use,
and vary by different Bt measures. The strongest effect of all is the coefficient of the variable
that measures Bt presence with Bt effectiveness. In this model component, we are able to see the
strength of the experimentally-defined Bt measures relative to Bt belief or Bt name. The weakest
magnitude of effect among all Bt measures is for official approval of the variety. This finding
suggests that public information from the government fails to capture the true status of Bt cotton
varieties in Pakistan, which coincides with the findings of Ma and Nazli (2015).
Since we believe Bt presence combined with Bt effective best measures the effect of Bt,
we use the last two specifications in Table 5 to interpret the contributions of other inputs. In
these two specifications, the estimated yield elasticity of labor is again on the order of 0.3 and
highly significant, similar to the Cobb-Douglas production model. The elasticity of N nutrient
kgs per ha is 0.17, which is higher than in the basic Cobb-Douglas model, and statistically
significant. Both labor and nitrogen inputs are only significant in models where Bt is measured
based on the bio-physical studies, but not in the models where Bt is measured either by public
information (Bt official) or private information that farmers may access (Bt name and Bt belief).
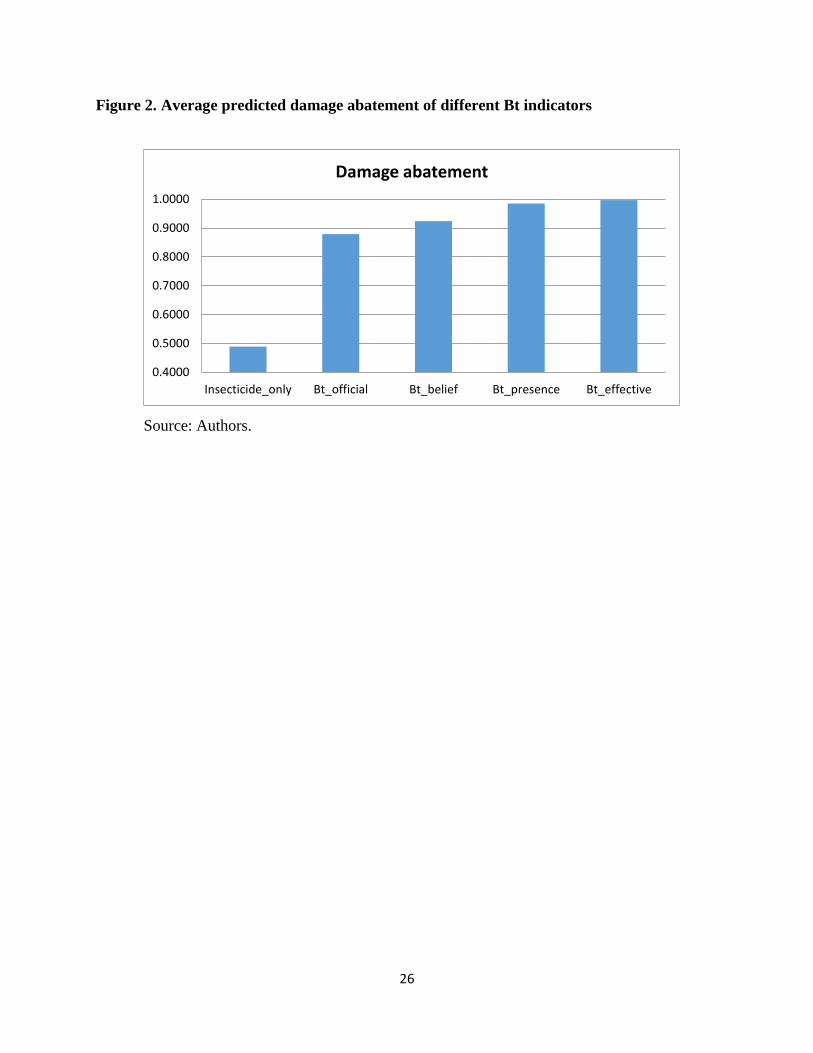
In order to better visualize the damage abatement effect from different Bt measures, we
use the estimation results reported in Table 5 to compute the average predicted damage
abatement effects for each Bt measure. As the damage abatement function G(X) lies between 0
and 1, the function is essentially a multiplier that indicates how effective each damage abatement
18
choice is for yield protection. The closer the value is to 1, the more effecting is the damage
abatement. Figure 2 illustrates the differences among the indicators we have tested. Bt name was
omitted because among our indicators, it is the most unreliable.
Our results suggest that without Bt, half of the yield will be lost if only an average
amount of insecticides is applied. Officially approved Bt varieties, together with insecticides, can
protect about 88 percent of cotton yield from pest damages. If a farmer grows a variety that she
believes to be Bt, then together with insecticide it about 92 percent of her cotton yield is
protected. If a real Bt variety has been planted, as measured by Bt presence, no matter how
effective the gene, then together with insecticide, about 98 percent of yield is protected. A real
and effective Bt variety will protect almost 100 percent of the yield based on our estimates.
In summary, we find that the integrity of Bt cotton varieties in Pakistan is closely
associated with the abatement of damage to cotton from lepidopteran pests in Pakistan, and thus
to maximum yield that can be obtained in the presence of pest pressures. These findings
highlight the need for researchers—and, more generally, proponents of Bt technology—to use
greater caution in measuring the yield impacts of Bt cotton in Pakistan, and in making the case
that Bt cotton can contribute to yield improvement. These findings also highlight the utility of
specific laboratory tests to measure the presence and efficacy of Bt gene expression when
studying the economic impact of Bt cotton or other GM crops.
Conclusions and implications
Since its introduction in 1996, Bt cotton has diffused rapidly and broadly across cotton-growing
regions of the world. Most impressive has been its adoption by smallholder farmers in poorer
countries, where accumulated evidence demonstrates its profitability, labor savings, and
substantial reduction of damage from lepidopteran insects.
One recurring, yet relatively unexplored thematic thread in the literature has been the
recognition that smallholder cotton growers in poorer countries are not well informed about Bt
cotton or how to grow it. Proponents of the crop might argue that certain types of knowledge are
of no real importance if the crop benefits farmers; those observers who are concerned about the
ethics argue that empowering poorer farmers with knowledge is a social imperative.
The term “variety integrity” is sometimes used to characterize a variety that grows true to
its type or true to is label. We invoke that notion in this paper. Here, we take a pragmatic view
19
that when a farmer does not know whether the seed he or she planted is Bt or not, and has no
firm expectations concerning its effectiveness against pests, production plans are most likely to
be suboptimal. In the aggregate, we would consider that such decision-making has both private
and social costs in terms of output and savings foregone, potential contributions to future
epidemics related to the buildup of genetic resistance to Bt toxin, and negative externalities from
continued, excessive use of pesticides despite the adoption of Bt varieties.
Pakistan’s experience is particularly well-suited for a test of hypotheses concerning farmer
knowledge of Bt expression. In Pakistan, Bt cotton was disseminated to farmers before it was
officially approved, and the Bt cotton industry is highly competitive, with a large number of
small-scale firms selling seed in local markets. The analysis in this paper contributes to the
existing literature by testing the effects of various definitions of Bt cotton on productivity and
damage control. We follow closely the work of major previous studies in our overall
specification of the models, but introduce four definitions of Bt cotton in addition to variety
name: (1) farmers’ belief; (2) official approval status; (3) presence of Bt; and (5) Bt
effectiveness. The last two measures are based on measurements from laboratory tests, and the
effectiveness variable is based on a combination of a continuous score and a threshold value
from a bioassay. To our knowledge, previous studies, with the notable exception of work by
Pemsl et al. (2005), have relied entirely on variety name.
The estimation of the Cobb-Douglas production function generates results that are
broadly consistent with economic theory. The yield-enhancing inputs (fertilizer and labor) have a
strong effect on cotton productivity. By contrast, insecticides, which are damage-controlling,
have no discernible influence on productivity. None of the Bt measures, except “Bt belief,” has a
significantly positive effect on yields. Believing that a cotton variety is Bt may be associated
with better management practices for which we have not already controlled in our covariates, or
“intrinsic” management characteristics. The insignificance of other Bt measures attests to the
notion that the genetic backgrounds do not differ systematically between Bt and non-Bt varieties
in Pakistan, so that there is no independent yield effect due to background. This last possibility
echoes what has already been stated in the literature: it is difficult to distinguish the Bt effect
when the backgrounds into which the Bt gene is placed may differ. Observed yield effects may
be the Bt gene, the genetic background, or the interaction of the two.
20
Moreover, because of the potential for bias in estimated coefficients, the damage
abatement framework is the preferred method for estimating the effects on productivity of inputs
that maintain yields against pests and disease rather than directly enhancing yield. When we
estimate the model in the damage abatement framework, we find that all Bt variables reduce
yield losses alongside insecticide use, and by a relatively large magnitude. However, the models
with the biophysical measures are the most complete. That is, these retain the strong positive
effects of conventional inputs as well as the effects of Bt gene expression. The marginal effects
of these measures are also considerably stronger than that of Bt belief. Our predicted average
effects suggest that Pakistani farmers benefit greatly from adopting Bt cotton varieties, which
potentially protect more than half of the yield loss. However, the officially approved Bt varieties
are considerably less effective than true Bt varieties.
To our knowledge, our general finding regarding the variants of Bt and how these may
differentially affect both farmers’ capacity to control damage effectively are unique in the
applied economics literature about GM crops. The approach has highlighted the importance of
measuring about input use in productivity analyses, and particularly in the study of highly
contentious, biotech crops. Based on our analysis, we recommend measuring Bt toxin expression
using biophysical methods if accuracy in assessing impacts is the objective and variety integrity
is questionable. Farmer’s self-reported status may be appropriate when variety identity is known
by farmers. The findings presented here also have implications for the design and management
of Pakistan’s regulatory system governing both GM crops and seed more generally. The issues
associated with seed and varietal integrity evidenced here suggest, first, the need for more
effective monitoring systems. While there is little to suggest that seed certification systems are
effective in monitoring ensuring seed quality for farmers, there is likely more that can be done
with point-of-sale monitoring and other forms of market surveillance (Rana 2014). This may be
especially true if laboratory tests are used more routinely and if they become cheaper and faster
to use. Second, our findings suggest that social welfare could be substantially increased by
improving information dissemination to farmers—perhaps through engagement of farmer-based
and/or private information channels.
These results are also applicable to the many lower income countries beyond Pakistan
where seed quality is an issue. In his insightful review of the global evidence on Bt cotton, Tripp
(2009) concluded that adopters of Bt cotton will not be the poorest of the poor, but those with
21
more assets and knowledge; he emphasized that biosafety regimes and more investment in
cutting edge research are necessary but not enough for the crop to benefit poorer farmers,
arguing the need for strong input markets and institutional design, and more germane to this
study, empowering farmers through provision of information. We would certainly argue the
same based on the statistics we have seen. Believing a variety is Bt cotton when it is not likely to
be a utility-enhancing situation, let alone a profit-maximizing one, for smallholder farmers.
A number of years after the publication of Tripp’s (2009) collection of studies, the results
shown here for Pakistan suggest some crucial differences. There is no evidence here that Bt
cotton farmers are more advantaged than other cotton farmers in Pakistan, and the prices they
pay for seed are relatively low by global standards. Yet, there is considerable evidence that the
integrity of the Bt cotton varieties they grow is questionable and that many do not know with
certainty whether the varieties they are growing are Bt or not. While this may be cause for
concern, our results confirm that no matter which definition we use, Bt cotton per se reduces
damage significantly. On the other hand, none of the definitions except “Bt belief” is positively
associated with cotton productivity. Thus, although better provision of information seems to be
an ethical imperative, this type of investment may not necessarily improve cotton productivity.

22
Acknowledgments
This work was supported by IFPRI’s Pakistan Strategy Support Program with funding from the U.S.
Agency for International Development; and by the CGIAR Research Program on Policies, Institutions,
and Markets. The authors gratefully acknowledge data, information, and insights provided by Guillaume
Gruère, Ahsan Rana, Mubarik Ali, Khuda Bakhsh, Asif Ali, ShaukatAli, Masooma Naseer Cheema,
Aamer Irshad, Arif Nadeem, Muhammad Anjum Ali, Kauser Abdulla Malik, Shahzad Kouser, Sohail J.
Malik, Steve Davies, and Andrew Roberts; and Saira Malik, Tahir Ahmad, and Lorena Danessi for their
administrative support. Researchers Asjad Tariq, Saqib Shahzad, Shehryar Rashid, Amina Mehmood,
and Asma Shahzad was provided valuable assistance. Any and all errors are the sole responsibility of the
authors.
References
Ali, S., H. Shahid, M. Shahid, G.M. Ali, and Z. Yusuf. 2010. Status of Bt cotton cultivation in
major growing areas of Pakistan.” Pakistan Journal of Botany 42(3): 1583-1594.
Ali S., S.H. Shah, G. M. Ali, A. Iqbal, M. Asad, Y. Zafar. 2012. “Bt Cry toxin expression profile
in selected Pakistani cotton genotypes.” Current Science 102(12)(25): 1632-1636.
Ali A. and A. Abdulai 2010. The adoption of genetically modified cotton and poverty reduction
in Pakistan. Journal of Agricultural Economics 61(1): 175–192.
Areal, F.J., L. Riesgo, and E. Rodríguez-Cerezo. 2013. Economic and agronomic impact of
commercialized GM crops: a meta-analysis. Journal of Agricultural Science 151: 7-33.
Chambers, R.G., G. Karagiannis, and V. Tzouvelekas. 2010. Another look at pesticide
productivity and pest damage. American Journal of Agricultural Economics 92(5): 1401–1419;
doi: 10.1093/ajae/aaq066.
Cheema, H. M. N., A. A. Khan, M. I. Khan, U. Aslam, I. A. Rana and I. A. Khan. 2015.
Assessment of Bt cotton genotypes for the Cry1Ac transgene and its expression. Journal of
Agricultural Science 153: 1-9.
Feder, G., and R. Slade. 1984. The acquisition of information and the adoption of new
technology. American Journal of Agricultural Economics 66 (August 1984):312-20.
Fox, G. and A. Weersink. 1995. Damage control and increasing returns. American Journal of
Agricultural Economics 77(1): 33-39.
GOP (Government of Pakistan). 2013. Pakistan Economic Survey 2012-13. Islamabad: Ministry
of Finance. <http://www.finance.gov.pk/survey/chapters_14/02_Agriculture.pdf>, accessed May
2013.
__________. 2012. Census of Agriculture 2010. Lahore: Agriculture Census Organization.
<http://www.pbs.gov.pk/content/agricultural-census-2010-pakistan-report>, accessed May 2015.
Gruère G.P. and Y. Sun. 2012. Measuring the Contribution of Bt Cotton Adoption to India’s
Cotton Yields Leap.” IFPRI Discussion Paper 01170. Washington, DC: International Food
Policy Research Institute.

23
Guan, Z., A. O. Lansing, A. Wossink, and R. Huirne. 2005. Damage control inputs: A
comparison of conventional and organic farming systems. European Review of Agricultural
Economics 32 (2): 167-189.
Horna, D., M. Smale, R. Al-Hassan, J. Falck-Zepeda, and S. Timpo. 2008. Insecticide Use on
Vegetables in Ghana: Would GM seed benefit farmers? IFPRI Discussion Paper No. 00785,
Environment and Production Technology Division, International Food Policy Research Institute
(IFPRI), Washington, DC.
Huang, J., R. Hu, S. Rozelle, F. Qiao, and C. Pray. 2002. Transgenic varieties and productivity of
smallholder cotton farmers in China. Australian Journal of Agricultural and Resource
Economics 46(3): 367–387.
James, C. 2014. Global Status of Commercialized Biotech/GM Crops in 2014. Brief 49.
International Service for the Acquisition of Agri-biotech Applications (ISAAA). Ithaca, New
York.
Klümper, W., and M. Qaim. 2014. A Meta-Analysis of the Impacts of Genetically Modified
Crops. PLoS ONE 9(11): 1-7.
Kouser, S. and M. Qaim. 2013. Bt cotton, damage control and optimal levels of pesticide use in
Pakistan. Environment and Development Economics 19(6): 704-723.
Lichtenberg E. and D. Zilberman. 1986. The econometrics of damage control: Why specification
matters. American Journal of Agricultural Economics 68(2): 261–273.
Liu, E. M. and J. Huang. 2013. Risk preferences and pesticide use by cotton farmers in China.
Journal of Development Economics 103(C): 202-215.
Ma X. and H. Nazli. 2015. Bt, Public Information, and the Efficiency of Cotton Production in
Pakistan. Mimeo.
Mitchell P., G. Shi, X. Ma, and J. G. Lauer. 2009. Effect of Prices, Traits and Market Structure
on Corn Seeding Density. Selected paper, Annual Meeting of the Agricultural and Applied
Economics Association, July 26-28, 2009, Milwaukee, Wisconsin.
Nazli H., D. Orden, R. Sarker, and K. Meilke. 2012. Bt cotton adoption and well-being of
farmers in Pakistan. Selected paper at the International Association of Agricultural Economists
(IAAE) Triennial Conference, Brazil.
Pemsl, D., H. Waibel, and A.P. Gutierrez. 2005. Why do some Bt-cotton farmers in China
continue to use high levels of pesticides?” International Journal of Agricultural Sustainability
3(1): 44-56.
Qaim M. and A. de Janvry. 2005. Bt cotton and pesticide use in Argentina: Economic and
environmental effects. Environment and Development Economics 10(2): 179–200.
Qaim, M. and D. Zilberman. 2003. Yield effects of genetically modified crops in developing
countries. Science, 299: 900–902.
Rana, M.A. 2014. The Seed Industry in Pakistan: Regulation, Politics and Entrepreneurship.
Pakistan Strategy Support Program (PSSP) Working Paper no. 19. Washington, DC:
International Food Policy Research Institute.
24
Saha, A., C.R. Shumway and A. Havener. 1997. The economics and econometrics of damage
control. American Journal of Agricultural Economics 79: 773-785.
Shankar, R. and C. Thirtle. 2005. Pesticide productivity and transgenic cotton technology: The
South African smallholder case. Journal of Agricultural Economics 56(1): 97-116.
Shi, Guanming, J. P. Chavas, J. Lauer, and E. Nolan. 2013. An analysis of selectivity in the
productivity evaluation of biotechnology. American Journal of Agricultural economics
95(3):739-754.
Showalter A.M., S. Heuberger, B.E. Tabashnik and Y. Carrière. 2009. Development, Agronomic
Performance and Sustainability of Transgenic Cotton for Insect Control. In Biotechnology and
Agricultural Development: Transgenic Cotton, Rural Institutions, and Resource-Poor Farmers,
R. Tripp, ed., New York: Routledge.
Smale, M., A. Niane and P. Zambrano. 2010. Impact economique des cultures transgéniques sur
les producteurs dans l’agriculture non-industrialisée: La première décennie. Économie rurale [En
ligne], 315, janvier-février 2010. <http://economierurale.revues.org/index2512.html>, accessed
August 2015.
Sperling, L., T. Osborne, and D. Cooper. 2004. Towards Effective and Sustainable Seed Relief
Activities. FAO Plant Production and Protection Paper no. 181. Rome: Food and Agriculture
Organization of the United Nations.
Spielman, D.J., H. Nazli, X. Ma, P. Zambrano and F. Zaidi. 2015a. Technological opportunity,
regulatory uncertainty, and Bt cotton in Pakistan. AgBioForum, 18(1), 98-112. .
Spielman, D. J., F. Zaidi, P. Zambrano, A. A. Khan, M. N. H. Cheema, S. Ali, X. Ma, S. A.
Khan, A. Iqbal, M. A. Zia, and G. M. Ali. 2015b. Measuring the effectiveness of Bt cotton
varieties: Evidence from Pakistan. Mimeo.
Tripp, R. 2009. Biotechnology and Agricultural Development: Transgenic Cotton, Rural
Institutions, and Resource-Poor Farmers. New York: Routledge.
Xia, L., Q. Xu and S. Guo. 2005. Bt insecticidal gene and its temporal expression in transgenic
cotton plants. Acta Agronomica Sinica 31: 197-2002.
25
Figure 1: Survey sites
Source: Authors.
Note: Shown at this scale, dots approximate villages because multiple households were
interviewed per village.
26
Figure 2. Average predicted damage abatement of different Bt indicators
Source: Authors.
0.4000
0.5000
0.6000
0.7000
0.8000
0.9000
1.0000
Insecticide_only Bt_official Bt_belief Bt_presence Bt_effective
Damage abatement
27
Table 1. Summary statistics for variables measuring Bt gene expression, by main plot
Variable Percent Definition
Bt name 85.4 Variety is sold as Bt cotton seed
Bt official 54.8 Variety is officially approved as Bt cotton
Bt belief 71.0 Farmer believes the variety is Bt cotton
Bt presence 79.6 Strip test detects the presence of Bt toxin in a variety
Bt effective 53.1 ELISA test score surpassed the Bt expression threshold
Source: Authors.
Note: Percentages are based on household survey responses and laboratory tests of cotton tissue samples
taken from the main cotton plot of surveyed households (N=535).
Table 2. Farmers’ Bt beliefs about cotton varieties grown and Bt approval status, by
presence and effectiveness of Bt
Bt presence Bt effective
yes yes
Bt Belief no n 107 84
% 69.03 54.19
yes n 319 200
% 83.95 52.63
Pearson Chi-squared (p-value) 0.000 0.743
Bt Official no n 183 120
% 75.62 49.5
yes n 243 164
% 82.95 55.97
Pearson Chi-squared (p-value) 0.037 0.141
Source: Authors.
Note: Figures are based on household survey responses and laboratory tests of cotton tissue samples taken
from the main cotton plot of surveyed households (N=535).
28
Table 3: Summary of variables
Variable (unit) Definition Mean Std. Dev. Min Max
Yield (kg/acre) Total harvest per acre 930.46 443.14 53 3,040
Labor (hours) Total number of hours by family
labor, hired labor, and contract
labor per acre during the cotton
cultivation season 155.43 89.12 21 968
Seed (kg/acre) Quantity of planted seed per acre 6.79 2.60 2 16
Insecticide
(gram/acre) insecticides per acre
2,276.40 1,592.91 0 10,000
N nutrients
(kg/acre) Quantity of nitrogen from
fertilizers per acre 83.29 37.05 0 246.79
Irrigation hours
(hours) Total time of irrigation per acre
during the cotton cultivation
season 12.95 13.31 0 83
Land cultivated
(acres) Total land cultivated in 2012
(year preceding survey) 9.13 17.76 0.5 253
Education (years) Total number of years of
education 4.67 4.54 0 17
Source: Authors.
29
Table 4. Cobb-Douglas production function estimation results
Explanatory variables
(1) (2) (3) (4) (5)
Bt name Bt official Bt belief Bt presence Bt effective
Bt: name 0.035
(0.066)
Bt: official -0.041
(0.046)
Bt: belief 0.088*
(0.052)
Bt: presence -0.067 -0.038
(0.057) (0.061)
Bt: effective -0.062
(0.049)
Labor 0.315*** 0.322*** 0.309*** 0.322*** 0.318***
(0.048) (0.047) (0.047) (0.047) (0.047)
Seed -0.012 -0.004 -0.015 -0.017 -0.018
(0.059) (0.059) (0.059) (0.059) (0.059)
Insecticide 0.010 0.009 0.010 0.009 0.009
(0.011) (0.011) (0.011) (0.011) (0.011)
Nitrogen 0.105*** 0.104*** 0.103*** 0.103*** 0.105***
(0.039) (0.039) (0.039) (0.039) (0.039)
Irrigation -0.041* -0.040 -0.044* -0.039 -0.041*
(0.024) (0.024) (0.024) (0.024) (0.024)
Cultivated land -0.032 -0.029 -0.041 -0.028 -0.030
(0.029) (0.029) (0.029) (0.029) (0.029)
Education 0.010 0.010 0.010 0.011 0.011
(0.007) (0.007) (0.007) (0.007) (0.007)
Constant 4.766*** 4.791*** 4.795*** 4.816*** 4.865***
(0.238) (0.237) (0.238) (0.240) -0.275
Observations 535 535 535 535 535
R-squared 0.128 0.133 0.129 0.130 0.132
Source: Authors.
Note: All variables except Bt measures are logarithmic. Standard errors in parentheses; *** p < 0.01, ** p
< 0.05, * p < 0.10.
30
Table 5. Damage abatement model estimation results
Explanatory
variables
(1) (2) (3) (4) (5)
Bt name Bt official Bt belief Bt presence Bt effective
Labor 0.213** -0.06 -0.059 0.361*** 0.344***
(-0.099) (-0.189) (-0.155) (-0.099) (-0.097)
Seed -0.221* -0.292 -0.026 -0.024 -0.038
(-0.123) (-0.24) (-0.189) (-0.126) (-0.123)
Nitrogen 0.117 0.102 -0.028 0.160* 0.162**
(-0.083) (-0.172) (-0.136) (-0.083) (-0.082)
Irrigation -0.149*** -0.027 -0.016 -0.133*** -0.130***
(-0.045) (-0.086) (-0.07) (-0.046) (-0.045)
Land -0.11 0.055 0.002 -0.051 -0.047
(-0.083) (-0.171) (-0.14) (-0.084) (-0.082)
Education 0.02 0.049* 0.009 -0.018 -0.015
(-0.015) (-0.029) (-0.024) (-0.015) (-0.015)
Bt: name 3.160***
(-0.439)
Bt: official 1.580***
(-0.197)
Bt: belief 2.025***
(-0.255)
Bt: presence 3.467*** 3.566***
(-0.531) (-0.874)
Bt: effective 1.419**
(-0.691)
Insecticide 0.196*** 0.159*** 0.163*** 0.217*** 0.212***
(-0.009) (-0.009) (-0.009) (-0.009) (-0.009)
Constant 6.562*** 8.063*** 7.861*** 4.994*** 5.027***
(-0.683) (-1.372) (-1.112) (-0.679) (-0.659)
Observations 535 535 535 535 535
Adjusted R-squared 0.975 0.932 0.948 0.975 0.976
Source: Authors.
Note: All variables except Bt measures are logarithmic. Standard errors in parenthesis; *** p < 0.01, ** p
< 0.05, * p < 0.10.