Embed Size (px)
Citation preview

ARTICLE IN PRESS
0301-4797/$ - se
doi:10.1016/j.je
�CorrespondResources Res
Datun Road, A
fax: +8610 648
E-mail addr
(X. Li).
Journal of Environmental Management 83 (2007) 351–364
www.elsevier.com/locate/jenvman
Socio-economic driving forces of land-use change in Kunshan, theYangtze River Delta economic area of China
Hualou Longa,b,�, Guoping Tangc, Xiubin Lia, Gerhard K. Heiligb
aInstitute of Geographic Sciences and Natural Resources Research (IGSNRR), Chinese Academy of Sciences, 11A Datun Road, Anwai,
Beijing 100101, PR ChinabInternational Institute for Applied Systems Analysis (IIASA), A-2361 Laxenburg, Austria
cDepartment of Geography, University of Oregon, OR 97403, USA
Received 9 May 2005; received in revised form 3 April 2006; accepted 7 April 2006
Available online 5 July 2006
Abstract
This paper analyzes characteristics, major driving forces and alternative management measures of land-use change in Kunshan,
Jiangsu province, China. The study used remote sensing (RS) maps and socio-economic data. Based on RS-derived maps, two change
matrices were constructed for detecting land-use change between 1987 and 1994, and between 1994 and 2000 through pixel-to-pixel
comparisons. The outcomes indicated that paddy fields, dryland, and forested land moderately decreased by 8.2%, 29% and 2.6% from
1987 to 1994, and by 4.1%, 7.6% and 8% from 1994 to 2000, respectively. In contrast, the following increased greatly from 1987 to 1994:
artificial ponds by 48%, urban settlements by 87.6%, rural settlements by 41.1%, and construction land by 511.8%. From 1994 to 2000,
these land covers increased by 3.6%, 28.1%, 23.4% and 47.1%, respectively. For the whole area, fragmentation of land cover was very
significant. In addition, socio-economic data were used to analyze major driving forces triggering land-use change through bivariate
analysis. The results indicated that industrialization, urbanization, population growth, and China’s economic reform measures are four
major driving forces contributing to land-use change in Kunshan. Finally, we introduced some possible management measures such as
urban growth boundary (UGB) and incentive-based policies. We pointed out that, given the rapidity of the observed changes, it is critical
that additional studies be undertaken to evaluate these suggested policies, focusing on what their effects might be in this region, and how
these might be implemented.
r 2006 Elsevier Ltd. All rights reserved.
Keywords: Land-use change; Driving forces; Urbanization; Land management measures; The Yangtze River Delta; China
1. Introduction
Since China initiated economic reforms and an open-door policy in 1978, tremendous land-use change hasoccurred in many coastal regions of China such as theYangtze River Delta region (Xu, 2004) and Pearl RiverDelta region (Weng, 2002; Seto and Kaufmann, 2003; Liand Yeh, 2004). In these regions, the conversion ofcultivated land to non-agricultural land has been consid-
e front matter r 2006 Elsevier Ltd. All rights reserved.
nvman.2006.04.003
ing author. Institute of Geographic Sciences and Natural
earch (IGSNRR), Chinese Academy of Sciences, 11A
nwai, Beijing 100101, PR China. Tel.: +86 10 64889297;
54230.
esses: [email protected] (H. Long), [email protected]
ered a major feature of land-use change (Li, 1999; Yangand Li, 2000). The fragmentation of cultivated land canbe also observed due to construction on land of thecountryside (Lin and Ho, 2003; Long and Li, 2005). Inaddition, the adoption of market principles has resulted inthe internal restructuring of agricultural land use fromtraditional paddy production to more diversified agricul-tural activities such as growing cash crops, fruits andaquaculture (Heilig, 1999; Li and Yeh, 2004). Theaccelerated industrialization and urbanization followingeconomic reforms and population increases have greatlyaffected land-use change through the increase of built-upareas and urban sprawl (Wu et al., 2004). With thecontinuous growth of China’s economy, massive farmlandloss for the benefit of market farming and non-agricultural

ARTICLE IN PRESSH. Long et al. / Journal of Environmental Management 83 (2007) 351–364352
development may occur without appropriate planning andmanagement of existing land resources in these regions.
Both remote sensing (RS) and geographic informationsystems (GIS) have been widely applied and recognized aspowerful and effective tools in detecting the spatio-temporal dynamics of land use and land cover (LULC)(Fazal, 2000; Hathout, 2002; Herold et al., 2003; Mapedzaet al., 2003; Alphan, 2003; Nagendra et al., 2004; Wang etal., 2005). RS can provide researchers with valuable multi-temporal data for monitoring land-use patterns andprocesses (Lambin et al., 2001; Yildirim et al., 2002), andGIS techniques make possible the analysis and mapping ofthese patterns (Imbernon, 1999; Zhang et al., 2002). Onecan develop spatially explicit time series of land-use changebased on RS (Moglen and Beighley, 2002; Poyatos et al.,2003; Himiyama, 1998). The widely used approach ofchange detection enables us to discover the structuralvariation among different land-cover patterns (Chen et al.,2003; Walker, 2003; Liu et al., 2003a). In addition,statistical analysis such as correlation analysis (Shoshanyand Goldshleger, 2002; Hietel et al., 2004; Krausmannet al., 2003), multi-variate analysis (Kaufmann and Seto,2001; Aspinall, 2004), and econometric models (Burgi andTurner, 2002; Lo and Yang, 2002; Seto and Kaufmann,2003; Veldkamp and Verburg, 2004) are used to diagnoseland-use change based on time series socio-economic data.These time series analyses of land-use change and theidentification of driving forces responsible for thesechanges are significant not only for the sustainablemanagement of land resources, but also for the projectionof future land-use trajectories (Kelly, 2003; Giri et al.,2003; Alig et al., 2004).
Recently, issues related to LULC change have attractedinterest among a wide variety of researchers, ranging fromthose who favor modeling spatial and temporal patterns ofland conversion to those who try to understand causes andconsequences of land-use change (Muller and Middleton,1994; Brown et al., 2000; Irwin and Geoghegan, 2001;Veldkamp and Lambin, 2001; Burgi et al., 2004). Althoughindustrialization, urbanization, and population growthhave been considered the most common forces contributingto land-use change on a global scale, there is no consensusconcerning the factors contributing to land-use change inChina’s coastal regions. For example, rural housingdevelopment may have contributed greatly to the loss ofagricultural land (Xu, 2004), and large-scale investments inindustrial development, rather than local land users, maybe a major factor in causing urban land-use change (Setoand Kaufmann, 2003). In addition, there is considerabledebate on the extent and magnitude of Chinese rural land-use change since the onset of reforms in 1978 (Xu, 2004),largely because of the complexity of land-use changeregarding its process, dynamic, and driving forces (Theo-bald, 2001; Burgi and Turner, 2002; Lambin et al., 2003).Therefore, Verburg and Veldkamp (2001) have stated thata single research approach does not suffice for a completeanalysis of land-use change. Instead, a combination of
multiple approaches is necessary for land-use changeresearch (Lambin et al., 2000; Cai, 2001; Long, 2003).In this paper, our main objectives are to explore the
characteristics of land-use change in Kunshan and itsmajor driving forces through combining RS-derived LULCmaps and socio-economic data. Using historical LULCdata, we first reclassified the LULC types in the threeRS-based maps into eight categories, and then convertedthese reclassified maps into raster format with a spatialresolution of 200� 200m. Based on these maps, twochange matrices were constructed for detecting land-usechange between 1987 and 1994, and between 1994 and 2000through pixel-to-pixel comparisons. In addition, socio-economic data were used to analyze major driving forcestriggering land-use change in Kunshan through bivariateanalysis. Finally, we suggested some possible managementmeasures that are crucial for future sustainable utilizationand management of its existing land resources, e.g.managing urban growth and protecting cultivated land.
2. Materials and methods
2.1. Study area
Our study area, Kunshan, is located inside the YangtzeRiver Delta economic area (YRDEA), one of the fastestgrowing regions in China (Fig. 1). It ranges from12010900400E to 12014802100E, and from 3110603400N to3113203600N. There are three of the biggest cities in Chinaaround Kunshan: Shanghai (to the east), Nanjing (to thewest and the capital of Jiangsu province), and Hangzhou(to the south and the capital of Zhejiang province).Kunshan covers about 928 km2 with average elevationbelow 50m. The northern subtropical monsoon climatedominates Kunshan year-round, with mean daily tempera-ture of 15.3 1C, mean annual rainfall of 1060mm, andmean annual non-frost period of 299 days, all of which arebeneficial for agricultural production.Kunshan is unique because of its high population density
and agricultural intensity. Kunshan’s population has beenincreasing by an annual rate of 0.23% since the early 1980s.With a total population of about 600 thousand, thepopulation density in Kunshan was up to 646persons/km2
in 2002, which was much higher than the average populationdensity (131persons/km2) of China at the same period. Ofthe total population, 53% were engaged in farming,providing much of the labor force to produce commercialgrains in the south part of Jiangsu province. The gross grainoutput in Kunshan, an important grain production base ofChina’s Jiangsu province, amounted to 283 000 tons in 2000(Jiangsu Statistical Bureau (JSB), 2001).The growth of Shanghai, the most important industrial,
commercial, and financial center of China, and theprosperity of Nanjing and Hangzhou, have pushedKunshan into the industrial age since the early 1980s. In1984, Kunshan was defined as one of the open cities andcounties by the State Council of China, largely because of

ARTICLE IN PRESS
Fig. 1. The study area Kunshan in the Yangtze River Delta economic area (YRDEA).
H. Long et al. / Journal of Environmental Management 83 (2007) 351–364 353
certain policies established by Kunshan local government,such as devoting major efforts to developing township andvillage enterprises (TVEs). Because of the special geo-graphic location, Kunshan has been booming since 1984.At present, Kunshan is famous for its economic andtechnological development zone (ETDZ), one of the mostsuccessful development zones in China (Long et al., 2000;Long and Meng, 2004). In 2000, Kunshan’s gross domesticproduct (GDP) per capita amounted to 33 936 yuan (1 US$E8.28 yuan), and 59 861 yuan per capita for gross outputvalue of industry, which was much higher than the averagegross output value (6768 yuan) of industry in China at thesame period. The average agricultural net income inKunshan was 5616 yuan per capita, and the averagegovernment revenue reached a record of 2162 yuan percapita in Jiangsu province (JSB, 2001).
However, with the growth of population and economicactivities, land use in Kunshan has changed dramatically asevidenced by the continuous decline of cultivated land. In1994, the total area of cultivated land in Kunshan wasaround 48 828 ha. By the end of 2002, it had decreased to45 883 ha, a decline of 6% in 8 years. The ongoing land-usechange in Kunshan is not only a serious challenge to thelocal government, but can be also seen as a model of land-use change in rapidly developing regions of China.
2.2. Data sources and processing
The analysis of land-use change in Kunshan is based onthree LULC maps at a 1:100 000 scale. These maps were
derived from historical Landsat thematic mapper (TM)satellite images, which were acquired on 18 May 1987, 29June 1994, and 4 May 2000, respectively, by the Institute ofRS Applications, the Chinese Academy of Sciences. Anefficient classification system was drafted and an effectiveresearch team was organized to work on remote senseddata through human–machine interactive interpretation toguarantee classification consistency and accuracy. Land-use maps, classified into six first levels and 25 second levelsof land-use categories in total, were drawn based on theLandsat TM data (Liu et al., 2003b). After geometricalimage correction and geo-referencing, the average locationerrors were estimated at less than 50m (about two pixels).An out-door survey and random sample check (covering aline survey of 70 000 km and 13 300 patches) verified thatthe average interpretation accuracies for land-use/land-cover were 92.9% and 97.6% for land-use changeinterpretation (Liu et al., 2003b).There were six major LULC types (cultivated land,
woodland, grassland, water body, unused land, and ruraland urban settlements), and 25 sub-categories in theoriginal LULC datasets. However, based on groundsurvey, it was found that grassland and unused land donot exist in Kunshan. Therefore, we reclassified the originalLULC types into eight classes: paddy fields, dryland,forested land, lakes and rivers, artificial ponds for fishingand other domestic purposes, urban settlements, ruralsettlements, and construction land mainly for mining andtransportation. Then, we measured the variations amongthe eight different LULC types by converting the three

ARTICLE IN PRESS
Fig. 2. Reclassified and gridded LULC types in 1987, 1994, and 2000 in Kunshan.
H. Long et al. / Journal of Environmental Management 83 (2007) 351–364354
LULC vector format maps into raster format with a spatialresolution of 200� 200m (the minimum area of landcovers in Kunshan is around 0.04 km2) using ESRI’sArcGIS spatial analyst module. Fig. 2 illustrates the threegridded and reclassified LULC maps in 1987, 1994, and2000 in Kunshan.
Because of the shortage of published annual time-seriesdata of LULC in Kunshan, socio-economic data werecollected from the local government (Table 1). These socio-economic data include time-series data on population,industry, agriculture (crop yield and agricultural land),fisheries (aquatic products), residential areas per capita,and construction land (here mainly used for mining andtransportation) in the whole region between 1989 and 2000.Historical socio-economic data before 1989 were notavailable. These data were used to analyze potentialdriving forces resulting in land-use change in Kunshan.
2.3. Methods
The three reclassified and gridded LULC maps (Fig. 2)were mainly used to detect the internal variations of LULCin Kunshan between two different periods: from 1987 to1994, and from 1994 to 2000. For each pair of griddeddatasets, a change matrix was constructed. Then, for eachLULC category i in a change matrix A, the change betweenthe two periods was calculated according to the followingequation:
CHi ¼ ðpi: � p:iÞ=p:i � 100, (1)
where CHi is the change of LULC in row i relative to theprevious compared year; pi. is the row total of grid cells forcategory i; p.i is the column total of grid cells for category i.
For exploring the internal conversion between differentLULC types, which took place between the two compared
periods, we treated the change (decrease or increase) of aLULC type in a given year relative to the compared year asa result of several ‘‘loss or gain’’ conversions. Thus, foreach LULC type we calculated the percentage of ‘‘conver-sion loss to’’ or ‘‘conversion gain from,’’ in relation tothe total ‘‘loss or gain’’ conversion of a LULC typeaccording to
PlossðiÞ;j ¼ ðpj;i � pi;jÞ=ðpi: � p:iÞ � 100 iaj;
PgainðiÞ;j ¼ ðpi;j � pj;iÞ=ðpi: � p:iÞ � 100 iaj;
((2)
where PlossðiÞ;j is the percentage taken by type j in the total‘‘conversion loss’’ of category row i; PgainðiÞ;j is thepercentage taken by type j in the total ‘‘conversion gain’’of category row i; pi;j , and pj;i is the individual entry in achange matrix A.Our initial research showed that the decrease and
fragmentation of paddy fields is the most significantfeature of land-use change in Kunshan. Paddy fieldsaccount for more than 92% of local agricultural land.Therefore, considering the limitation of only 3 years ofLULC data (derived from remotely sensed images), weused the annual series of agricultural land data to explorethe possible driving forces contributing to land-use changein Kunshan. Several bivariate statistical analyses weremade to explore the correlations between different socio-economic variables (Table 1).
3. Results
3.1. Characteristics of land-use change in Kunshan
Land use has changed greatly over the period from 1987to 2000 in Kunshan. From 1987 to 1994, paddy fields,dryland, and forested land decreased by 8.2%, 29%, and
ARTICLE IN PRESSH. Long et al. / Journal of Environmental Management 83 (2007) 351–364 355
2.6%, respectively. In contrast, artificial ponds, urbansettlements, rural settlements and construction land in-creased by 48%, 87.6%, 41.1%, and 511.8%, respectively,in the same period (Table 2). These trends continued in theperiod from 1994 to 2000. By the end of 2000, paddy fields,dryland and forested land had decreased by 4.1%, 7.6%,and 8%, respectively, relative to 1994. Artificial ponds,urban settlements, rural settlements, and construction landhad expanded by 3.6%, 28.1%, 23.4%, and 47.1%,respectively, in the same period (Table 3). The areas ofnatural lakes and rivers were relatively stable within thesetwo periods. To a large extent, land-use change from 1987to 2000 was characterized by a serious replacement ofpaddy fields with artificial ponds, urban and ruralsettlements, and construction land.
In addition to LULC change, we also analyzed changesin fragmentation of land in Kunshan between 1987 and2000. Although many indices are available for assessmentof spatial patterns, e.g. fragmentation, in landscape
Table 1
Annual series socio-economic data in Kunshan over the period from 1989 to
Year Population Industrial output
value (10 000 yuan)
Crop yield (ton) Aq
pr
1989 554,500 108,956 485,757 22
1990 564,610 113,640 473,569 23
1991 568,430 150,218 466,697 23
1992 572,051 245,564 464,466 27
1993 575,519 348,724 421,078 36
1994 578,269 454,567 429,153 40
1995 580,504 580,085 433,122 45
1996 583,364 685,578 457,048 54
1997 585,155 763,534 441,275 58
1998 587,509 868,949 374,626 67
1999 588,865 1,006,483 353,946 56
2000 594,592 1,192,328 283,236 60
Data sources: the data of residential areas and construction land are from Ku
Yearbook of Kunshan in 2000, provided by People’s Government of Kunsha
Agricultural land here is mainly composed of paddy fields and dryland.
Table 2
Change matrix of each compared LULC type in 1987 and 1994, and its chang
LULC type in 1994 LULC type in 1987
PF DL FL LR AP
PF 17152 0 0 0
DL 0 66 0 0
FL 0 0 75 0
LR 80 0 0 1922
AP 495 0 0 0 10
US 460 27 0 0
RS 327 0 2 1
CL 174 0 0 0
Total 18688 93 77 1923 10
Note: PF ¼ paddy fields, DL ¼ dryland, FL ¼ forested land, LR ¼ lakes
settlements, CL ¼ construction land.
ecology (Sleeman et al., 2005), we simply used patchcounts and average patch area to measure the fragmenta-tion of LULC in Kunshan. Table 4 shows the changes indifferent LULC patches from 1987 to 1994, and from 1994to 2000 in Kunshan. These data were calculated based onthe three reclassified vector maps of LULC in Kunshan. In1987, the total number of patches of LULC was 583. By1994, they had increased to 714, and by 2000 the numberwas 869. As a result, the average area of each patch shrunkfrom 159.2 ha in 1987 to 130.0 ha in 1994 and further to106.8 ha in 2000. We found that the fragmentation ofLULC in Kunshan was mainly due to the expansion ofrural settlements and artificial ponds. In 1987, there were155 patches of artificial ponds; by 2000, the number offishponds had increased to 269 (an increase of 73.5%).Likewise, rural settlements increased sharply from 290 in1987, to 326 in 1994, and to 446 in 2000. Over the wholeperiod between 1987 and 2000, the fragmentation of paddyfields was the most distinct trend. In 1987, there were only
2000
uatic
oducts (ton)
Residential areas
per capita (m2)
Agricultural
land (ha)
Construction
land (ha)
,350 39.9 78,001.4 —
,511 40 77,899.4 —
,333 42 77,664.7 —
,236 48 71,888.1 —
,691 42.2 70,937.9 —
,270 43.4 69,479.3 2819.04
,500 45.5 68,741.2 2871.31
,228 48 68,339.5 2931.63
,780 53 67,672.4 2963.73
,115 58.2 66,695.0 3070.93
,000 62.77 66,423.1 3069.49
,000 61.2 66,147.8 3109.64
nshan Land Administration Bureau; other data are from Socio-Economic
n City. Construction land data are not available for years prior to 1994.
es in 1994
Changes in
1994 (%)US RS CL Total
1 0 0 0 17153 �8.2
0 0 0 0 66 �29
0 0 0 0 75 �2.6
0 0 0 0 2002 4.1
28 0 0 0 1523 48
0 556 0 0 1043 87.6
0 0 803 0 1133 41.1
0 0 0 34 208 511.8
29 556 803 34 23203
and rivers, AP ¼ artificial ponds, US ¼ urban settlements, RS ¼ rural

ARTICLE IN PRESS
Table 3
Change matrix of each compared LULC type in 1994 and 2000, and its changes in 2000
LULC type in 2000 LULC type in 1994 Changes in
2000 (%)PF DL FL LR AP US RS CL Total
PF 16454 3 0 0 0 0 0 0 16457 �4.1
DL 0 61 0 0 0 0 0 0 61 �7.6
FL 0 0 69 0 0 0 0 0 69 �8
LR 0 0 0 1998 0 0 0 0 1998 �0.2
AP 63 0 0 0 1515 0 0 0 1578 3.6
US 288 0 0 0 5 1043 0 0 1336 28.1
RS 253 2 3 4 3 0 1133 0 1398 23.4
CL 95 0 3 0 0 0 0 208 306 47.1
Total 17153 66 75 2002 1523 1043 1133 208 23203
Note: PF ¼ paddy fields, DL ¼ dryland, FL ¼ forested land, LR ¼ lakes and rivers, AP ¼ artificial ponds, US ¼ urban settlements, RS ¼ rural
settlements, CL ¼ construction land.
Table 4
Changes of LULC patches from 1987 to 1994, and to 2000
LULC type Patch counts Minimum area (ha) Maximum area (ha) Average area (ha)
87 94 00 87 94 00 87 94 00 87 94 00
PF 16 9 31 1.36 0.36 0.36 73788.5 67714.4 64791.4 4662.2 7604.0 2122.0
DL 13 9 9 5.13 7.95 7.95 133.0 115.3 115.3 29.2 31.0 27.6
FL 11 11 11 4.07 4.07 4.07 131.3 119.7 106.3 27.3 26.2 24.0
LR 43 60 60 0.05 0.05 0.05 1619.6 1619.6 1619.6 179.7 134.1 133.8
AP 155 267 269 0.14 0.14 0.14 348.3 348.3 348.3 27.2 23.2 23.9
US 37 18 34 1.96 47.55 1.55 875.0 1891.7 2540.7 59.5 231.6 155.9
RS 290 326 446 0.09 0.12 0.12 69.3 82.8 108.3 11.0 13.9 12.3
CL 18 14 9 0.98 6.38 3.37 36.3 510.1 759.5 8.5 58.2 133.7
Total 583 714 869 159.2 130.0 106.8
Note: PF ¼ paddy fields, DL ¼ dryland, FL ¼ forested land, LR ¼ lakes and rivers, AP ¼ artificial ponds, US ¼ urban settlements, RS ¼ rural
settlements, CL ¼ construction land.
H. Long et al. / Journal of Environmental Management 83 (2007) 351–364356
16 patches of paddy fields and the average area was4662.2 ha. However, by 2000, the number of paddy fieldshad increased to 31 and the average area had decreased to2122 ha (a decrease of roughly 50%).
The accelerating urbanization process may increase thedegree of fragmentation and structural complexity ofLULC (Jenerette and Wu, 2001). Table 5 presents theurbanization-related land-use change in Kunshan from1987 to 1994. During this period, the increase of artificialponds, urban settlements, rural settlements and construc-tion land accounted for 32.2%, 30%, 20.5%, and 11.3% ofthe decrease of paddy fields, respectively. From 1987 to1994, the reduction of dryland was completely due to urbansettlements expansion (100%). Rural settlements expansion(100%) accounted for all of the shrinking of forested land inthe same period. However, the expansion of artificial ponds,urban and rural settlements, and construction land between1987 and 1994, occurred mainly at the expense of paddyfields, which accounted for 100.2%, 94.5%, 99.1% and100.0% of changes in artificial ponds, urban settlements,rural settlements, and construction land, respectively.
Over the period from 1994 to 2000, the trend of internalstructural variability of LULC in Kunshan was similar tothe period before. The decrease of paddy fields was causedmainly by the expansion of urban settlements, ruralsettlements, construction land, and artificial ponds. Simi-larly, the expansion of rural settlements and increase ofconstruction land were two main factors in the decline offorested land. Although the expansion of artificial ponds,urban settlements, rural settlements, and construction landmay have taken up some part of previous ponds andforested land, most of these changes occurred on paddyfields, which accounted for 114.5%, 98.3%, 95.5%, and96.9% of the increases of these LULC types, respectively(Table 6).
3.2. Major driving forces of land-use change in Kunshan
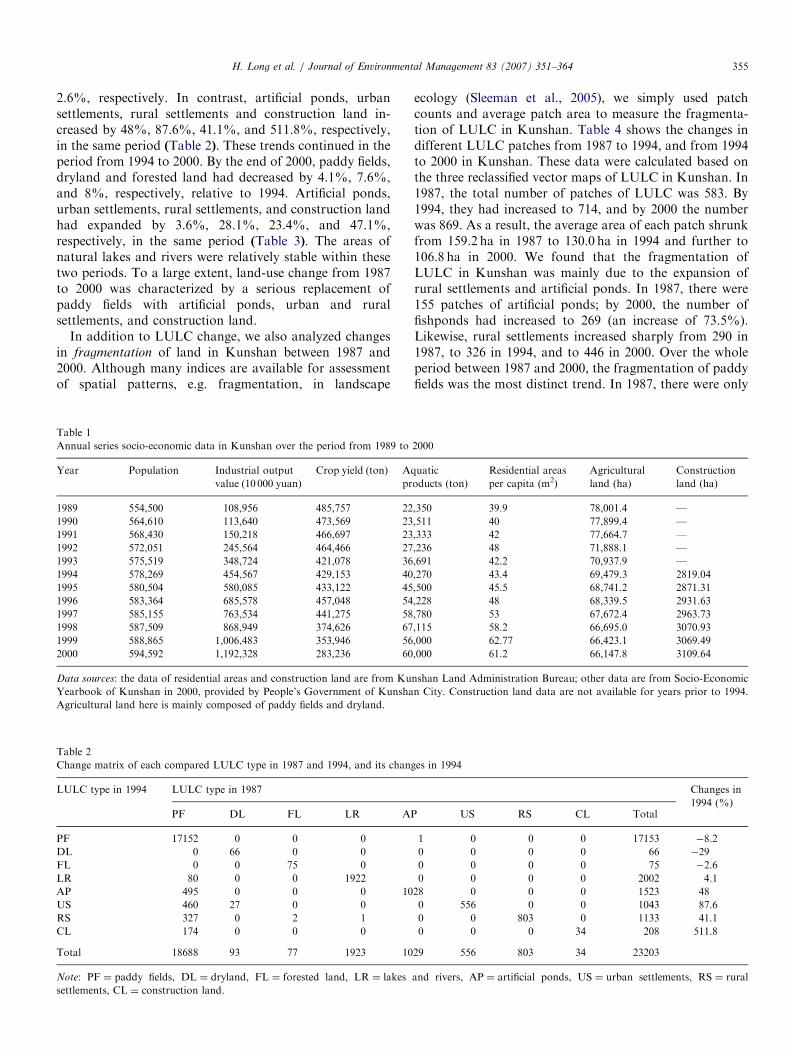
The relationships between different variables in Table 1are illustrated by Fig. 3 and Table 7. Our statistical analysissuggested that rapid industrialization and urbanization,population growth, and economic reforms in China are

ARTICLE IN PRESS
Table 5
Internal conversions between LULC types from 1987 to 1994 and the percentages taken by corresponding types in such loss or gain conversions
LULC type Loss or gain
in 1994
Type (1) Percent (%) Type (2) Percent (%) Type (3) Percent (%) Type (4) Percent (%)
PF� �8.2% AP 32.2 US 30.0 RS 20.5 CL 11.3
DL� �29.0% US 100.0
FL� �2.6% RS 100.0
LR+ 4.1% PF 101.3*
AP+ 48.0% PF 100.2*
US+ 87.6% PF 94.5 DL 5.5
RS+ 41.1% PF 99.1 FL 0.6 LR 0.3
CL+ 511.8% PF 100.0
Note: � conversion loss to, + conversion gain from, * ‘‘conversion loss’’ occurred even the net change was ‘‘conversion gain.’’
PF ¼ paddy fields, DL ¼ dryland, FL ¼ forested land, LR ¼ lakes and rivers, AP ¼ artificial ponds, US ¼ urban settlements, RS ¼ rural settlements,
CL ¼ construction land.
Table 6
Internal conversions between LULC types from 1994 to 2000 and the percentages taken by corresponding types in such loss or gain conversions
LULC type Loss or gain
in 2000
Type (1) Percent (%) Type (2) Percent (%) Type (3) Percent (%) Type (4) Percent (%)
PF� �4.1% US 41.4 RS 36.4 CL 13.6 AP 9.1
DL� �7.6% PF 60.0 RS 40.0
FL� �8.0% RS 50.0 CL 50.0
LR� �0.2% RS 100.0
AP+ 3.6% PF 114.5*
US+ 28.1% PF 98.3 AP 1.7
RS+ 23.4% PF 95.5 LR 1.5 FL 1.1 AP 1.1
CL+ 47.1% PF 96.9 FL 3.1
Note: � conversion loss to, + conversion gain from, * ‘‘conversion loss’’ occurred even the net change was ‘‘conversion gain.’’PF ¼ paddy fields,
DL ¼ dryland, FL ¼ forested land, LR ¼ lakes and rivers, AP ¼ artificial ponds, US ¼ urban settlements, RS ¼ rural settlements, CL ¼ construction
land.
H. Long et al. / Journal of Environmental Management 83 (2007) 351–364 357
four major correlates of land-use change in Kunshan overthe period from 1989 to 2000.
3.2.1. Industrialization
According to the analyses by the World Bank (1992) andVerburg et al. (1999), the major land-use change is causedby the increasing demand for non-agricultural land becauseof urban and manufacturing development. Urban-relatedindustrialization is well known to be one of the mostimportant driving forces of land-use changes in China(Zhou and Fischer, 1999; Wu et al., 2004), and it plays animportant role in reducing the quantity of arable land(Chen, 1999). It also may alter the internal structure ofLULC in a region (Chavez, 2004). In Kunshan, indus-trialization increased from 1989 to 2000, as evidencedby the fast increase in the total industrial output value(Table 1). Apparently, rapid industrialization in Kunshanis a very significant factor of land-use change. First, as Linand Ho (2003) pointed out, the expansion of constructionland is largely a result of rural industrialization in China.This also occurred in Kunshan, which can be illustrated bythe strong positive relationship between industrial outputvalue and construction land (Fig. 3).
In addition, industrialization in Kunshan has apparentlytriggered massive farmland loss for the benefits of market-oriented farming and non-agricultural development. Ac-cording to Fig. 3, there was a strong positive relationshipbetween industrial output value and aquatic products; andalso between industrial output value and residential areasper capita. For the former, the correlation coefficient was0.94 and for the latter it was 0.92 (Table 7). However, therewas a strong negative relationship between industrialoutput value and crop yield (coefficient ¼ �0.87). Thenegative relationship indicates that industrialization inKunshan has triggered a large amount of cultivated land tobe converted into market-oriented land used for built-upareas. For example, construction land (mainly used formining and transportation) increased from 1987 to 1994 by511.8%, which was totally (100%) at the expense of paddyfields (Table 5). Likewise, it increased by 47.1% from 1994to 2000, of which 96.9% was reallocated from what wasformerly paddy fields (Table 6).The economic reforms in China encouraged the devel-
opment of household and township enterprises, which gaverise to a booming rural industry of TVEs in Kunshan. Theincrease in TVEs can be seen as a spatial and temporal
ARTICLE IN PRESS
Fig. 3. Bivariate plot matrix for variables: population, industrial output value, crop yield, aquatic products, residential areas per capita, agricultural land,
and construction land.
Table 7
Correlation coefficients between different socio-economic variables
Population Industry Crop yield Aqu_products Residential areas Agri_land
Population 1.00 0.94 �0.81 0.92 0.85 �0.94
Industry 1.00 �0.87 0.94 0.92 �0.90
Crop yield 1.00 �0.71 �0.84 0.72
Aqu_products 1.00 0.83 �0.92
Residential areas 1.00 �0.80
Agri_land 1.00
Note: industry ¼ industrial output value, aqu_products ¼ aquatic products, residential areas ¼ residential areas per capita, agri_land ¼ agricultural land.
Due to missing construction land data before 1994, the calculation of coefficients does not count it here.
H. Long et al. / Journal of Environmental Management 83 (2007) 351–364358
extension of urban industrialization (Zhou and Fischer,1999). In Kunshan, the impact of rapid rural developmenton land-use changes mainly resulted from the developmentof TVEs and rural housing. The growth of TVEs and thedevelopment of an export-oriented economy have trans-
formed the industrial pattern of Kunshan radically sincethe early 1980s. For example, the shares of agriculture,industry and other professions (mainly service and trade) inGDP were 44.2%, 42.3%, and 13.5%, respectively, in 1980;however, they were 5.6%, 59.4%, and 35.0%, respectively,

ARTICLE IN PRESS
0%
10%
20%
30%
40%
50%
60%
70%
80%
90%
100%
1980 1990 1993 1994 1995 1996 1997 1998 1999 2000
Agriculture Industry Other professions
Fig. 4. Change of the shares of agriculture, industry, and other professions (In China, agriculture is also called primary industry (including farming,
forestry, animal husbandry and fishery), industry called secondary industry (including mining and quarrying, manufacturing, production and supply of
electricity, water and gas, and construction), and other professions called tertiary industry (all other industries not included in primary or secondary
industry)) in Kunshan’s GDP from 1980 to 2000. Source: Data for 1980 and 1990 are from Liu, 1995; Data for 1993–2000 are from JSB, 1994–2001.
H. Long et al. / Journal of Environmental Management 83 (2007) 351–364 359
in 2000 (Fig. 4). The output value of TVEs in Kunshanamounted to 1.97 million yuan in 1994, which wasequivalent to 78.22% of the local total output value ofindustry.1 With the development of industry and servicetrade, farmers’ income increased quickly, and it resulted ina fast development of rural housing. Between 1987 and1994, the area used for rural housing increased by about110 ha in Kunshan.2
3.2.2. Urbanization
Urbanization greatly contributed to the loss of agricul-tural land in China (Zhang et al., 2000; Xu, 2004; Liu et al.,2005), and is generally seen as one of the most importantfactors of land-use change (Heilig 1997; Ho and Lin, 2004).In China, two forms of urbanization have occurred: thegrowth of cities following urban economic developmentand population concentration, and rural urbanizationbased on the growth of smaller towns in rural areas (Cuiand Ma, 1999). In Kunshan, the first trend was typical. Thedirect result of urbanization was the reduction ofagricultural land by increasing urban settlements. The areaof urban settlements in Kunshan increased by 87.6% from1987 to 1994, and 28.1% from 1994 to 2000 (Tables 2 and3). Compared to the average area (59.5 ha) of urbansettlements in 1987, it was enlarged greatly to 231.6 ha in1994 and 155.9 ha in 2000 (Table 4).
The construction of a special development zone has alsoplayed a very important role in Kunshan’s urbanization.The Kunshan development zone originated in 1985 with an
1People’s Government of Kunshan City, 2002. Socio-Economic Year-
book of Kunshan in 2000.2Kunshan Land Administration Bureau, 1995. Study on the Practices of
Land Use and Conservation in Kunshan City.
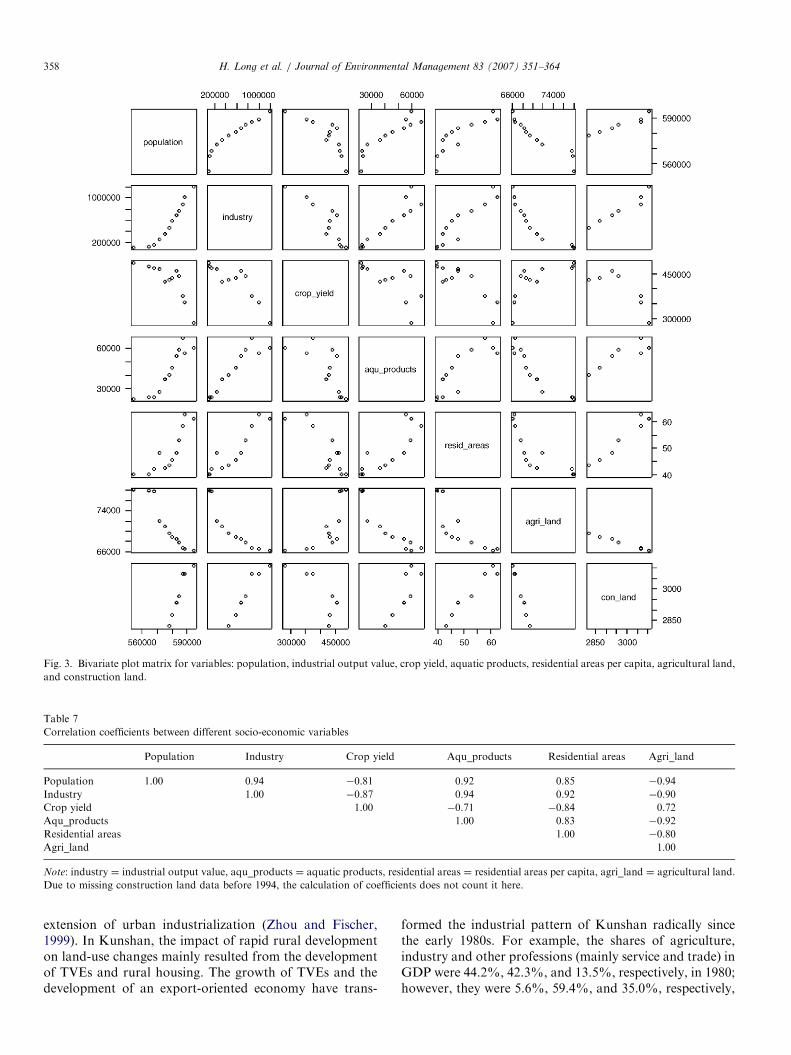
area of 375 ha, and was officially named the ETDZ in 1987with the area expanded to 618 ha. In 1992, ETDZ wasdesignated as one of the state development zones in China,and its planning area was enlarged to 2000 ha (Long andMeng, 2004). The construction and development of ETDZconsolidated the role of Kunshan’s urban area (the biggestred coverage in Fig. 2) as an urban center (Liu, 1995).ETDZ has been the most active area of economic growth inKunshan, which clearly accelerated Kunshan’s urbaniza-tion. From 1987 to 1994, Kunshan’s urban settlementsincreased by 87.6% (Table 2). In this period, about 1948 haof cultivated land (2.46% of paddy fields and 29.0% ofdryland) were converted into urban settlements. Althoughthe speed of Kunshan’s urbanization decelerated from1994 to 2000, urban settlements still increased by 1172 ha(Table 3). Most of this expansion was at the expense ofpaddy fields. This certainly happened in Kunshan as shownby the continuous decline in agricultural land and cropyield (Fig. 5).
3.2.3. Population growth and economic reforms
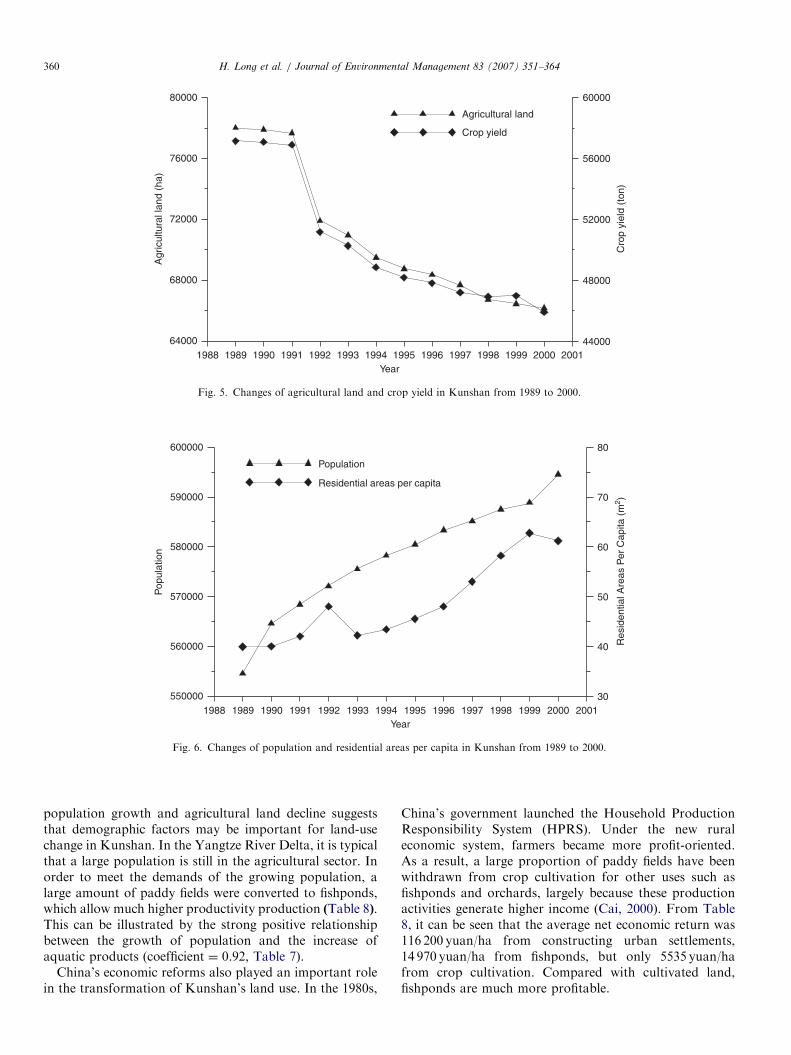
Rapid industrialization and urbanization are oftencorrelated with the increase of population size for thesame periods (Fischer et al., 1997; Jenerette and Wu, 2001;Heilig, 1996). Population growth has long been considereda major factor leading to land-use change (Lin and Ho,2003; Tanrivermis, 2003). In Kunshan, the populationincreased from 1989 to 2000 (Fig. 6). This increase wasstrongly correlated with industrial output value(coefficient ¼ 0.94, Table 7). With the increase of popula-tion, per capita residential areas also grew (Fig. 6). As aresult, large parts of farmland were converted forconstructing (rural) settlements. The strong inverse rela-tionship (Fig. 3; coefficient ¼ �0.94, Table 7) between
ARTICLE IN PRESS
1988 1989 1990 1991 1992 1993 1994 1995 1996 1997 1998 1999 2000 2001Year
64000
68000
72000
76000
80000
Agr
icul
tura
l lan
d (h
a)
44000
48000
52000
56000
60000
Cro
p yi
eld
(ton
)
Agricultural land
Crop yield
Fig. 5. Changes of agricultural land and crop yield in Kunshan from 1989 to 2000.
1988 1989 1990 1991 1992 1993 1994 1995 1996 1997 1998 1999 2000 2001Year
550000
560000
570000
580000
590000
600000
Pop
ulat
ion
30
40
50
60
70
80
Res
iden
tial A
reas
Per
Cap
ita (
m2 )
Population
Residential areas per capita
Fig. 6. Changes of population and residential areas per capita in Kunshan from 1989 to 2000.
H. Long et al. / Journal of Environmental Management 83 (2007) 351–364360
population growth and agricultural land decline suggeststhat demographic factors may be important for land-usechange in Kunshan. In the Yangtze River Delta, it is typicalthat a large population is still in the agricultural sector. Inorder to meet the demands of the growing population, alarge amount of paddy fields were converted to fishponds,which allow much higher productivity production (Table 8).This can be illustrated by the strong positive relationshipbetween the growth of population and the increase ofaquatic products (coefficient ¼ 0.92, Table 7).
China’s economic reforms also played an important rolein the transformation of Kunshan’s land use. In the 1980s,
China’s government launched the Household ProductionResponsibility System (HPRS). Under the new ruraleconomic system, farmers became more profit-oriented.As a result, a large proportion of paddy fields have beenwithdrawn from crop cultivation for other uses such asfishponds and orchards, largely because these productionactivities generate higher income (Cai, 2000). From Table8, it can be seen that the average net economic return was116 200 yuan/ha from constructing urban settlements,14 970 yuan/ha from fishponds, but only 5535 yuan/hafrom crop cultivation. Compared with cultivated land,fishponds are much more profitable.

ARTICLE IN PRESS
Table 8
Economic assessment of land-use change in Kunshan
Land-use type Net economic return (1000
yuan/ha/year)
Land-use change (ha) Total economic value
(million yuan)1987–1994 1994–2000
Urban settlements 116.20a +1948 +1172 +362.54
Fishpondb 14.97c +1980 +220 +32.93
Cultivated land 5.535c �6248 �2804 �50.10
Data source:aWu and Guo (1994).bAccording to authors’ reconnaissance survey, during this time, almost all artificial ponds converted from cultivated land were used for raising fish.cNational Office of the Regional Planning for Agricultural Resources, 1997. ‘‘Analysis and assessment of the 10-year change of China’s agricultural
resources, 1986–1995.’’
3Basic farmland consists of (Ding, 2003): (1) agricultural production
bases (such as crops, cotton, edible oils, and other high quality agricultural
products) approved by government; (2) farmland with high productivity
and a good irrigation system and that has been exploited; (3) vegetation
production bases for large and middle cities; and (4) experimental fields
for science and educational purposes.
H. Long et al. / Journal of Environmental Management 83 (2007) 351–364 361
4. Discussion
Urban sprawl is defined as dispersed and inefficienturban growth and characterized as relatively low-density,non-contiguous, automobile-dependent, and residentialand non-residential development that consumes relativelylarge amounts of farmland and natural areas (Burchell etal., 1998; Fazal, 2000; Hasse and Lathrop, 2003). FromFig. 2, it can be seen that the urban growth of Kunshan issuch a kind of sprawl. Urban sprawl is increasinglyconsidered a significant and growing problem that entailsa wide range of social and environmental costs (Bengstonet al., 2004). Urban sprawl in Kunshan leads to theinefficient utilization of land resources. In addition, theserious loss of cultivated land hampered the developmentof local agriculture, and also affected future development(Long and Meng, 2004). Addressing the growing concernabout the social and environmental costs of sprawlingdevelopment patterns, more effective policies will berequired to manage urban growth and protect cultivatedland.
The concept of an urban growth boundary (UGB) hasplayed an important role in the well-ordered growth of theurban area in Oregon State, US (Pendall et al., 2002). AnUGB is not a physical space but a dividing line drawnaround an urban area to separate it from surrounding ruralareas. Areas outside the boundary are zoned for rural use.Usually, an UGB is drawn to accommodate expectedgrowth for some period of time, and is periodicallyreassessed and expanded as needed. Delineating an UGBcan let the public know where urbanization or industria-lization should occur, where farm and forest should bepreserved, and where infrastructure should be developed.An UGB will minimize urbanization of cultivated land andthereby stop urban sprawl. Also, it is good for minimizingpublic service costs and avoiding the loss of farmland.Innovative incentive-based policies are also necessary tomanage urban growth and protect cultivated land, so asto reduce the social and environmental costs of sprawlingdevelopment patterns. Incentive-based policies such asdevelopment impact fees, location efficient mortgages,and infill and redevelopment incentives are widely adopted
and proved to be practical (Bengston et al., 2004;Ding, 2003).The loss of valuable agricultural land due to rapid urban
sprawl has caught the attention of the Central Govern-ment. The State Council promulgated the Regulations forthe Protection of Basic Agricultural Land on July 4, 1994,and the Protection Rules of Basic Farmland3 on December27, 1998. The two laws both focus on the protection ofbasic agricultural land (Tan et al., 2005). Usually, localgovernments implement the policies from the CentralGovernment in a modified way to get more benefits. Thisusually results in the excessive loss of agricultural land andserious fragmentation of land use, especially in mostcoastal regions of China (Li and Yeh, 2004). As with anypublic policy instrument, the specific details of how growthmanagement is implemented—rather than the general typeof policy—are critical in determining effectiveness andimpacts (Bengston et al., 2004). The impact of urbancontainment policies depends largely on their implementa-tion (Pendall et al., 2002).The data in Table 8 shows that the land-use change in
Kunshan was mainly the outcome of market forces, i.e.,land-use types were being converted from relatively lowvalue use to higher value use. However, little attention hasbeen paid to the social and environmental costs of thesemarket mechanisms. Introducing the idea of UGB andincentive-based policies such as development impact fees,location efficient mortgages, and infill and redevelopmentincentives may be helpful for Kunshan local government tostem the tide of urban sprawl, and to reduce the social andenvironmental costs of sprawling development patterns.Given the rapidity of the observed changes, it is critical thatadditional studies be undertaken to evaluate these alter-native policies such as UGB and incentive-based policies,focusing on what their effects might be in this region andhow these might be implemented.

ARTICLE IN PRESSH. Long et al. / Journal of Environmental Management 83 (2007) 351–364362
5. Conclusions
Land-use change in Kunshan can be characterized bythree major trends: First, the non-agricultural land (urbanand rural settlements, construction land, and artificialponds) increased substantially from 1987 to 2000, thuscausing agricultural land especially paddy fields to decreasecontinuously. Second, a fragmentation of LULC inKunshan was evident over the period from 1987 to 2000,especially for the paddy fields. Third, the conversion ofpaddy fields in Kunshan was a very serious issue. Theexpansion of urban and rural settlements, artificial pondsand construction land was almost completely at theexpense of paddy fields. Compared to the area in 1987,paddy fields in Kunshan decreased by about 8924 ha(or 11.9%) in 2000.
Industrialization, urbanization, population growth, andChina’s economic reforms are four major driving forcescontributing to land-use change in Kunshan. The rapidindustrialization in Kunshan increased the demand fornon-agricultural land, which diminished cultivated landand the resulting crop production. The industrializationpushed forward the development of TVEs, which led theexpansion of rural housing areas. The direct outcome ofurbanization in Kunshan was the expansion of urbansettlement areas and construction land. Urban settlementsin Kunshan increased by 87.6% from 1987 to 1994, and by28.1% from 1994 to 2000. Most of these increases occurredat the cost of paddy fields. Population growth furtherincreased the demand for rural housing land. The adoptionof HPRS and introduction of profit-oriented farming led tothe conversion of cropland into more profitable forms ofproduction, such as fishponds.
In contemporary China, local governments are emergingas major players in translating the land policy establishedby Chinese Central Government into local patterns of landuse (Skinner et al., 2001). The concept of an UGB andincentive-based policies such as development impact fees,location efficient mortgages, and infill and redevelopmentincentives may be helpful for local government to stem thetide of urban sprawl. Given the rapidity of the observedchanges, it is critical that additional studies be undertakento evaluate these alternative policies, focusing on whattheir effects might be in this region and how these might beimplemented.
Acknowledgements
This work is supported by the funding from the NationalNatural Science Foundation of China (Grant no. 40201001and 40271010) and Program of Excellent Young Scientistsof the Ministry of Land and Resources of China. Thisproject was mainly carried out at the IIASA ResearchActivity on Sustainable Rural Development (SRD). One ofthe authors, Hualou Long, is grateful to China–USSustainable Land Use Training Program. The insightful
and constructive comments of three anonymous reviewersare appreciated.
References
Alig, R.J., Kline, J.D., Lichtenstein, M., 2004. Urbanization on the US
landscape: looking ahead in the 21st century. Landscape and Urban
Planning 69, 219–234.
Alphan, H., 2003. Land-use change and urbanization of Adana, Turkey.
Land Degradation and Development 14, 575–586.
Aspinall, R., 2004. Modelling land use change with generalized linear
models—a multi-model analysis of change between 1860 and 2000 in
Gallatin Valley, Montana. Journal of Environmental Management 72,
91–103.
Bengston, D.N., Fletcher, J.O., Nelson, K.C., 2004. Public policies for
managing urban growth and protecting open space: policy instruments
and lessons learned in the United States. Landscape and Urban
Planning 69, 271–286.
Brown, D.G., Pijanowski, B.C., Duh, J.D., 2000. Modeling the relation-
ships between land use and land cover on private lands in the Upper
Midwest, USA. Journal of Environmental Management 59, 247–263.
Burchell, R.W., Shad, N.A., Listokin, D., Phillips, H., Downs, A., Seskin,
S., Davis, J.S., Moore, T., Helton, D., Gall, M., 1998. The Costs of
Sprawl—Revisited. Report 39. Transit Cooperative Research Pro-
gram, Transportation Research Board, National Research Council.
National Academy Press, Washington, DC.
Burgi, M., Turner, M.G., 2002. Factors and processes shaping land cover
and land cover changes along the Wisconsin River. Ecosystems 5,
184–201.
Burgi, M., Hersperger, A.M., Schneeberger, N., 2004. Driving forces of
landscape change—current and new directions. Landscape Ecology 19,
857–868.
Cai, Y.L., 2000. Problems of farmland conservation in the rapid growth of
China’s economy. Resources Science 22, 24–28 (in Chinese).
Cai, Y.L., 2001. A study on land-use/cover change: the need for a new
integrated approach. Geographical Research 20, 645–652 (in Chinese).
Chavez, J., 2004. Localized effects of globalization: the case of Ciudad
Juarez, Chihuahua, Mexico. Urban Geography 25, 120–138.
Chen, B.M., 1999. The existing state, future change trends in land-use and
food production capacities in China. Ambio 28, 682–686.
Chen, J., Gong, P., He, C.Y., Pu, R.L., Shi, P.J., 2003. Land-use/land-
cover change detection using improved change-vector analysis.
Photogrammetric Engineering and Remote Sensing 69, 369–379.
Cui, G., Ma, L.J.C., 1999. Urbanization from below in China: its
development and mechanisms. Acta Geographica Sinica 54, 106–115
(in Chinese).
Ding, C., 2003. Land policy reform in China: assessment and prospects.
Land Use Policy 20, 109–120.
Fazal, S., 2000. Urban expansion and loss of agricultural land—a GIS
based study of Saharanpur City, India. Environment and Urbaniza-
tion 12, 133–149.
Fischer, G., Heilig, G.K., Young, A., Vlek, P., Heilig, G., Tinker, B.,
1997. Population momentum and the demand on land and water
resources. Philosophical Transactions of the Royal Society of London
Series B—Biological Sciences 352, 869–889.
Giri, C., Defourny, P., Shrestha, S., 2003. Land cover characterization and
mapping of continental Southeast Asia using multi-resolution satellite
sensor data. International Journal of Remote Sensing 24, 4181–4196.
Hasse, J.E., Lathrop, R.G., 2003. Land resource impact indicators of
urban sprawl. Applied Geography 23, 159–175.
Hathout, S., 2002. The use of GIS for monitoring and predicting urban
growth in East and West St Paul, Winnipeg, Manitoba, Canada.
Journal of Environmental Management 66, 229–238.
Heilig, G.K., 1996. Who is changing the land? Lifestyles, population, and
global land-use change. In: Ramphal, S., Sinding, S.W. (Eds.),
Population Growth and Environmental Issues. Westport, London
(Praeger), pp. 109–128.
ARTICLE IN PRESSH. Long et al. / Journal of Environmental Management 83 (2007) 351–364 363
Heilig, G.K., 1997. Anthropogenic factors in land-use change in China.
Population and Development Review 23, 139–168.
Heilig, G.K., 1999. China Food: Can China Feed Itself? International
Institute for Applied Systems Analysis (IIASA), Laxenburg, Austria.
Herold, M., Goldstein, N.C., Clarke, K.C., 2003. The spatiotemporal
form of urban growth: measurement, analysis and modeling. Remote
Sensing of Environment 86, 286–302.
Hietel, E., Waldhardt, R., Otte, A., 2004. Analysing land-cover changes in
relation to environmental variables in Hesse, Germany. Landscape
Ecology 19, 473–489.
Himiyama, Y., 1998. Land use cover changes in Japan: from the past to
the future. Hydrological Processes 12, 1995–2001.
Ho, S.P.S., Lin, G.C.S., 2004. Non-agricultural land use in post-reform
China. China Quarterly 179, 758–781.
Imbernon, J., 1999. Pattern and development of land-use changes in the
Kenyan highlands since the 1950s. Agriculture Ecosystems and
Environment 76, 67–73.
Irwin, E.G., Geoghegan, J., 2001. Theory, data, methods: developing
spatially explicit economic models of land use change. Agriculture
Ecosystems and Environment 85, 7–23.
Jenerette, G.D., Wu, J.G., 2001. Analysis and simulation of land-use
change in the central Arizona-Phoenix region, USA. Landscape
Ecology 16, 611–626.
Jiangsu Statistical Bureau (JSB), 1994–2001. Jiangsu Statistical Yearbook.
Chinese Statistical Publishing House, Beijing (in Chinese).
Kaufmann, R.K., Seto, K.C., 2001. Change detection, accuracy, and bias
in a sequential analysis of Landsat imagery in the Pearl River Delta,
China: econometric techniques. Agriculture Ecosystems and Environ-
ment 85, 95–105.
Kelly, P.F., 2003. Urbanization and the politics of land in the Manila
region. Annals of the American Academy of Political and Social
Science 590, 170–187.
Krausmann, F., Haberl, H., Schulz, N.B., Erb, K.H., Darge, E., Gaube,
V., 2003. Land-use change and socio-economic metabolism in
Austria—Part I: driving forces of land-use change: 1950–1995. Land
Use Policy 20, 1–20.
Lambin, E.F., Rounsevell, M.D.A., Geist, H.J., 2000. Are agricultural
land-use models able to predict changes in land-use intensity?
Agriculture Ecosystems and Environment 82, 321–331.
Lambin, E.F., Turner, B.L., Geist, H.J., Agbola, S.B., Angelsen, A.,
Bruce, J.W., Coomes, O.T., Dirzo, R., Fischer, G., Folke, C., George,
P.S., Homewood, K., Imbernon, J., Leemans, R., Li, X.B., Moran,
E.F., Mortimore, M., Ramakrishnan, P.S., Richards, J.F., Skanes, H.,
Steffen, W., Stone, G.D., Svedin, U., Veldkamp, T.A., Vogel, C., Xu,
J., 2001. The causes of land-use and land-cover change: moving
beyond the myths. Global Environmental Change—Human and Policy
Dimensions 11, 261–269.
Lambin, E.F., Geist, H.J., Lepers, E., 2003. Dynamics of land-use and
land-cover change in tropical regions. Annual Review of Environment
and Resources 28, 205–241.
Li, X.B., 1999. Change of arable land area in China during the past 20
years and its policy implications. Journal of Natural Resources 14,
329–333 (in Chinese).
Li, X., Yeh, A.G.O., 2004. Analyzing spatial restructuring of land use
patterns in a fast growing region using remote sensing and GIS.
Landscape and Urban Planning 69, 335–354.
Lin, G.C.S., Ho, S.P.S., 2003. China’s land resources and land-use change:
insights from the 1996 land survey. Land Use Policy 20, 87–107.
Liu, W. (Ed.), 1995. The Spring up and Sustainable Development of
Kunshan City, China. Science Press, Beijing (Chapters 6–8, in
Chinese).
Liu, Y.S., Gao, J., Yang, Y.F., 2003a. A holistic approach towards
assessment of severity of land degradation along the Greatwall in
northern Shaanxi province, China. Environmental Monitoring and
Assessment 82, 187–202.
Liu, J.Y., Liu, M.L., Zhuang, D.F., Zhang, Z.X., Deng, X.Z., 2003b.
Study on spatial pattern of land-use change in China during
1995–2000. Sciences in China (Series D) 46, 373–378.
Liu, J.Y., Zhan, J.Y., Deng, X.Z., 2005. Spatio-temporal patterns and
driving forces of urban land expansion in China during the economic
reform era. Ambio 34, 450–455.
Lo, C.P., Yang, X.J., 2002. Drivers of land-use/land-cover changes
and dynamic modeling for the Atlanta, Georgia Metropolitan
Area. Photogrammetric Engineering and Remote Sensing 68,
1073–1082.
Long, H.L., 2003. Land use transition: a new integrated approach of land-
use/cover change study. Geography and Geo-information Science 19,
87–90 (in Chinese).
Long, H.L., Li, X.B., 2005. Rural housing land transition in transect of
the Yangtze River. Acta Geographica Sinica 60, 179–188 (in Chinese).
Long, H.L., Meng, J.J., 2004. Optimal Allocation of Land Resources in
China’s Development Zones. Jilin People’s Press, Changchun (Chap-
ters 1–2, in Chinese).
Long, H.L., Cai, Y.L., Wan, J., 2000. Sustainability evaluation of land use
in development zones: the case of Kunshan. Acta Geographica Sinica
55, 719–728 (in Chinese).
Mapedza, E., Wright, J., Fawcett, R., 2003. An investigation of land cover
change in Mafungautsi Forest, Zimbabwe, using GIS and participa-
tory mapping. Applied Geography 23, 1–21.
Moglen, G.E., Beighley, R.E., 2002. Spatially explicit hydrologic modeling
of land use change. Journal of the American Water Resources
Association 38, 241–253.
Muller, M.R., Middleton, J., 1994. A Markov model of land-use change
dynamics in the Niagara Region, Ontario, Canada. Landscape
Ecology 9, 151–157.
Nagendra, H., Munroe, D.K., Southworth, J., 2004. From pattern to
process: landscape fragmentation and the analysis of land use/land
cover change. Agriculture Ecosystems and Environment 101, 111–115.
Pendall, R., Martin, J., Fulton, W., 2002. Holding the line: urban
containment in the United States. Discussion Paper. Center on
Urban and Metropolitan Policy, The Brookings Institution, Washing-
ton, DC (http://www.brook.edu/dybdocroot/es/urban/publications/
pendallfultoncontainment.pdf).
Poyatos, R., Latron, J., Liorens, P., 2003. Land use and land cover change
after agricultural abandonment—the case of a Mediterranean Moun-
tain Area (Catalan Pre-Pyrenees). Mountain Research and Develop-
ment 23, 362–368.
Seto, K.C., Kaufmann, R.K., 2003. Modeling the drivers of urban land
use change in the Pearl River Delta, China: integrating remote sensing
with socio-economic data. Land Economics 79, 106–121.
Shoshany, M., Goldshleger, N., 2002. Land-use and population density
changes in Israel—1950 to 1990: analysis of regional and local trends.
Land Use Policy 19, 123–133.
Skinner, M.W., Kuhn, R.G., Joseph, A.E., 2001. Agricultural land
protection in China: a case study of local governance in Zhejiang
Province. Land Use Policy 18, 329–340.
Sleeman, J.C., Kendrick, G.A., Boggs, G.S., Hegge, B.J., 2005. Measuring
fragmentation of seagrass landscapes: which indices are most appro-
priate for detecting change? Marine and Freshwater Research 56,
851–864.
Tan, M.H., Li, X.B., Xie, H., Lu, C.H., 2005. Urban land expansion and
arable land loss in China—a case study of Beijing–Tianjin–Hebei
region. Land Use Policy 22, 187–196.
Tanrivermis, H., 2003. Agricultural land use change and sustainable use of
land resources in the mediterranean region of Turkey. Journal of Arid
Environments 54, 553–564.
Theobald, D.M., 2001. Land-use dynamics beyond the American urban
fringes. Geographical Review 91, 544–564.
Veldkamp, A., Lambin, E.F., 2001. Predicting land-use change. Agricul-
ture Ecosystems and Environment 85, 1–6.
Veldkamp, A., Verburg, P.H., 2004. Modelling land use change and
environmental impact. Journal of Environmental Management 72,
1–3.
Verburg, P.H., Veldkamp, A., 2001. The role of spatially explicit models in
land-use change research: a case study for cropping patterns in China.
Agriculture Ecosystems and Environment 85, 177–190.

ARTICLE IN PRESSH. Long et al. / Journal of Environmental Management 83 (2007) 351–364364
Verburg, P.H., Veldkamp, A., Fresco, L.O., 1999. Simulation of changes in
the spatial pattern of land use in China. Applied Geography 19, 211–233.
Walker, R., 2003. Mapping process to pattern in the landscape change of
the Amazonian frontier. Annals of the Association of American
Geographers 93, 376–398.
Wang, Y.Q., Tobey, J., Bonynge, G., Nugrandad, J., Makota, V.,
Ngusaru, A., Traber, M., 2005. Involving geospatial information in the
analysis of land-cover change along the Tanzania coast. Coastal
Management 33, 87–99.
Weng, Q.H., 2002. Land use change analysis in the Zhujiang Delta of
China using satellite remote sensing, GIS and stochastic modelling.
Journal of Environmental Management 64, 273–284.
World Bank, 1992. Indonesia: agricultural transformation challenges and
opportunities. Report No. 1054-IND, Washington.
Wu, C., Guo, H., 1994. Land Use in China. Science Press, Beijing
(Chapters 6–7, in Chinese).
Wu, L.X., Sun, B., Zhou, S.L., Huang, S.E., Zhao, Q.G., 2004. A new
fusion technique of remote sensing images for land use/cover.
Pedosphere 14, 187–194.
Xu, W., 2004. The changing dynamics of land-use change in rural China: a
case study of Yuhang, Zhejiang Province. Environment and Planning
A 36, 1595–1615.
Yang, H., Li, X.B., 2000. Cultivated land and food supply in China. Land
Use Policy 17, 73–88.
Yildirim, H., Ozel, M.E., Divan, N.J., Akca, A., 2002. Satellite monitoring
of land cover/land use change over 15 years and its impact on the
environment in Gebze/Kocaeli—Turkey. Turkish Journal of Agricul-
ture and Forestry 26, 161–170.
Zhang, B.P., Yao, Y.H., Cheng, W.M., Zhou, C.H., Lu, Z., Chen, X.D.,
2002. Human-induced changes to biodiversity and alpine pastureland
in the Bayanbulak Region of the East Tianshan Mountains. Mountain
Research and Development 22, 1–7.
Zhang, Y.L., Li, X.B., Fu, X.F., Xie, G.D., Zheng, D., 2000. Urban
land use change in Lhasa. Acta Geographica Sinica 55, 395–406
(in Chinese).
Zhou, Y., Fischer, G., 1999. Cultivated land-use change in the east region
of China. IIASA Interim Report IR-99-055, Laxenburg.