Embed Size (px)
Citation preview

I REPORT NO. R-37
SOCIO-ECONOMIC BASELINE SURVEY FOR A PILOT PROJECT ON
WATER USERS ORGANIZATIONS IN THE HAKRA 4-R DISTRIBUTARY
COMMAND AREA, PUNJAB l
ZAFAR IQBAL MIRZA MEHMOOD UL HASSAN
DON JAYATISSA BANDARAGODA
!
December 1997 PAKISTAN NATIONAL PROGRAM
INTERNATIONAL IRRIGATION MANAGEMENT INSTITUTE

TABLE OF CONTENTS
Contents . . . . . . . . . . . . . . . . . . . . . . . . . . . . . . . . . . . . . . . . . . . . . . . . . . . . . . i
Tables and Figures iv Foreword . . . . . . . . . . . . . . . . . . . . . . . . . . . . . . . . . . . . . . . . . . . . . . . . . . . . . vii Acknowledgements . . . . . . . . . . . . . . . . . . . . . . . . . . . . . . . . . . . . . . . . . . . . . . viii
Annexes . . . . . . . . . . . . . . . . . . . . . . . . . . . . . . . . . . . . . . . . . . . . . . . . . . . . . . iii . . . . . . . . . . . . . . . . . . . . . . . . . . . . . . . . . . . . . . . . . . . . . .
CHAPTER 1
INTRODUCTION . . . . . . . . . . . . . . . . . . . . . . . . . . . . . . . . . . . . . . . . . . . . . . . . . 1
Objectives of the Study . . . . . . . . . . . . . . . . . . . . . . . . . . . . . . . . . . . . . . . . . . . . 3
Sampling Procedure and Sampling Design . . . . . . . . . . . . . . . . . . . . . . . . . . . . . . 5
Organization of the Report . . . . . . . . . . . . . . . . . . . . . . . . . . . . . . . . . . . . . . . . . 10
Background . . . . . . . . . . . . . . . . . . . . . . . . . . . . . . . . . . . . . . . . . . . . . . . . . . . . . 1
Methodology . . . . . . . . . . . . . . . . . . . . . . . . . . . . . . . . . . . . . . . . . . . . . . . . . . . . 3
Study Area . . . . . . . . . . . . . . . . . . . . . . . . . . . . . . . . . . . . . . . . . . . . . . . . . . . . . 6
CHAPTER 2
GENERAL CHARACTERISTICS OF THE RESPONDENTS . . . . . . . . . . . . . . . . . 11 Family Size . . . . . . . . . . . . . . . . . . . . . . . . . . . . . . . . . . . . . . . . . . . . . . . . . . . . 11 Residential Status of the Sample Farmers . . . . . . . . . . . . . . . . . . . . . . . . . . . . . 13 Castes of Sample Farmers . . . . . . . . . . . . . . . . . . . . . . . . . . . . . . . . . . . . . . . . 14 Educational Level of Sample Farmers . . . . . . . . . . . . . . . . . . . . . . . . . . . . . . . . . 15 On-Farm Family Employment . . . . . . . . . . . . . . . . . . . . . . . . . . . . . . . . . . . . . . . 17 Characteristics of the Farmholdings . . . . . . . . . . . . . . . . . . . . . . . . . . . . . . . . . . 18 Farm Machinery . . . . . . . . . . . . . . . . . . . . . . . . . . . . . . . . . . . . . . . . . . . . . . . . 21
CHAPTER 3
IRRIGATION PRACTICES AND WATER MANAGEMENT . . . . . . . . . . . . . . . . . . 22 Source of Irrigation . . . . . . . . . . . . . . . . . . . . . . . . . . . . . . . . . . . . . . . . . . . . . . 22 Fulfillment of Crop Water Requirements . . . . . . . . . . . . . . . . . . . . . . . . . . . . . . . 22 Overcoming Crop Water Deficiency . . . . . . . . . . . . . . . . . . . . . . . . . . . . . . . . . . 24 Irrigation Methods . . . . . . . : . . . . . . . . . . . . . . . . . . . . . . . . . . . . . . . . . . . . . . . 24 Time Allocated and Required per Acre . . . . . . . . : . . . . . . . . . . . . . . . . . . . . . . . 24 Adequacy of Canal Water During Kharif . . . . . . . . . . . . . . . . . . . . . . . . . . . . . . . . 26 Adequacy of Canal Water During Rabi . . . . . . . . . . . . . . . . . . . . . . . . . . . . . . . . 26 Extent of Satisfaction . . . . . . . . . . . . . . . . . . . . . . . . . . . . . . . . . . . . . . . . . . . . . 28 Improvement in the Distribution System . . . . . . . . . . . . . . . . . . . . . . . . . . . . . . . . 29
i
i

CHAPTER 4
IRRIGATION SYSTEM PERFORMANCE . . . . . . . . . . . . . . . . . . . . . . . . . . . . . . 30 Equity Between the Distributaries . . . . . . . . . . . . . . . . . . . . . . . . . . . . . . . . . . . . 30 Equity Within the Distributary . . . . . . . . . . . . . . . . . . . . . . . . . . . . . . . . . . . . . . . 32
Equity in Irrigation Water Delivery . . . . . . . . . . . . . . . . . . . . . . . . . . . . . . . . . . . . 35 Functional Condition of the Canal System . . . . . . . . . . . . . . . . . . . . . . . . . . . . . . 38 Functional Condition of the Watercourse . . . . . . . . . . . . . . . . . . . . . . . . . . . . . . . 38
Reliability in Water Supply . . . . . . . . . . . . . . . . . . . . . . . . . . . . . . . . . . . . . . . . . 40 Water Transactions . . . . . . . . . . . . . . . . . . . . . . . . . . . . . . . . . . . . . . . . . . . . . . 42 Exchange of Water Turns . . . . . . . . . . . . . . . . . . . . . . . . . . . . . . . . . . . . . . . . . 42 Purchase of Water Turns . . . . . . . . . . . . . . . . . . . . . . . . . . . . . . . . . . . . . . . . . . 44 Sale of Water Turns . . . . . . . . . . . . . . . . . . . . . . . . . . . . . . . . . . . . . . . . . . . . . 44 Stealing of Water During Water Turns . . . . . . . . . . . . . . . . . . . . . . . . . . . . . . . . 47
Equity Within the Watercourse . . . . . . . . . . . . . . . . . . . . . . . . . . . . . . . . . . . . . . 34
Functional Condition of the Distributary . . . . . . . . . . . . . . . . . . . . . . . . . . . . . . . . 39
CHAPTER 5
INSTITUTIONAL DEVELOPMENT . . . . . . . . . . . . . . . . . . . . . . . . . . . . . . . . . . . 48 Existence of Water Users Associations . . . . . . . . . . . . . . . . . . . . . . . . . . . . . . . . 48 Membership of the WUAs . . . . . . . . . . . . . . . . . . . . . . . . . . . . . . . . . . . . . . . . . 48 Member of the Executive Committee . . . . . . . . . . . . . . . . . . . . . . . . . . . . . . . . . 49 Usefulness of the WUA . . . . . . . . . . . . . . . . . . . . . . . . . . . . . . . . . . . . . . . . . . . 51 Benefits From Various Government Agencies . . . . . . . . . . . . . . . . . . . . . . . . . . . 52 Waterlogging and Salinity . . . . . . . . . . . . . . . . . . . . . . . . . . . . . . . . . . . . . . . . . 56 Organizational Behavior . . . . . . . . . . . . . . . . . . . . . . . . . . . . . . . . . . . . . . . . . . . 58
CHAPTER 6
AGRONOMIC PRACTICES. FARM OUTPUT. LIVESTOCK AND INCOME . . . . . . 60 Cotton Crop . . . . . . . . . . . . . . . . . . . . . . . . . . . . . . . . . . . . . . . . . . . . . . . . . . . 60 WheatCrop . . . . . . . . . . . . . . . . . . . . . . . . . . . . . . . . . . . . . . . . . . . . . . . . . . . 61 RiceCrop . . . . . . . . . . . . . . . . . . . . . . . . . . . . . . . . . . . . . . . . . . . . . . . . . . . . . 62 Sugarcane Crop . . . . . . . . . . . . . . . . . . . . . . . . . . . . . . . . . . . . . . . . . . . . . . . . . 64 Kharif Fodder . . . . . . . . . . . . . . . . . . . . . . . . . . . . . . . . . . . . . . . . . . . . . . . . . . . 65 Rabi Fodder . . . . . . . . . . . . . . . . . . . . . . . . . . . . . . . . . . . . . . . . . . . . . . . . . . . 55 Cropping Intensity . . . . . . . . . . . . . . . . . . . . . . . . . . . . . . . . . . . . . . . . . . . . . . . 67 Factors Affecting Increased Crop Production . . . . . . . . . . . . . . . . . . . . . . . . . . . . 67 Livestock . . . . . . . . . . . . . . . . . . . . . . . . . . . . . . . . . . . . . . . . . . . . . . . . . . . . . 68
Income Levels . . . . . . . . . . . . . . . . . . . . . . . . . . . . . . . . . . . . . . . . . . . . . . . . . 70 Watercharges . . . . . . . . . . . . . . . . . . . . . . . . . . . . . . . . . . . . . . . . . . . . . . . . . 69
I
ii

CHAPTER 7
SUMMARY . . . . . . . . . . . . . . . . . . . . . . . . . . . . . . . . . . . . . . . . . . . . . . . . . . . . 71 Background . . . . . . . . . . . . . . . . . . . . . . . . . . . . . . . . . . . . . . . . . . . . . . . . . . . 71 General Characteristics of the Sample Farmers and Farms . . . . . . . . . . . . . . . . . 71 Irrigation Practices and Water Management . . . . . . . . . . . . . . . . . . . . . . . . . . . . 73 Irrigation System Performance . . . . . . . . . . . . . . . . . . . . . . . . . . . . . . . . . . . . . . 75 Institutional Development . . . . . . . . . . . . . . . . . . . . . . . . . . . . . . . . . . . . . . . . . . 78 Agronomic Practices, Farm Output, Livestock and Income . . . . . . . . . . . . . . . . . . 81
I
REFERENCES . . . . . . . . . . . . . . . . . . . . . . . . . . . . . . . . . . . . . . . . . . . . . . . . . 84
ANNEXES
Annex-I Questionnaire . . . . . . . . . . . . . . . . . . . . . . . . . . . . . . . . . . . . . . . . 85 Annex-2 Additional Information not Discussed in the Report . . . . . . . . . . . . . . 98
iii

TABLES
Distribution of Respondents by Watercourse . . . . . . . . . . . . . . . . . . . 6 Mean Number of Family Members, Age, Experience in Irrigation Agriculture, Landholding and Land Operating of the Respondents . . . . . . . . . . . . . . . . . . . . . . . . . . . . 12 Mean Number of Family Members in the Household at Hakra 4-R, Distributary . . . . . . . . . . . . . . . . . . . . . . . . . . . . . . . . 13 Mean Number of Family Members in the Household at Hakra 3-R Distributary . . . . . . . . . . . . . . . . . . . . . . . . . . . . . . . . 13 Residential Status of Respondents . . . . . . . . . . . . . . . . . . . . . . . . . 14 Castes of Respondents . . . . . . . . . . . . . . . . . . . . . . . . . . . . . . . . . 14 Educational Level of Respondents . . . . . . . . . . . . . . . . . . , . . . . . , 15 Mean Number of Children in School in the Households at Hakra 4-R Distributary . . . . . . . . . . . . . . . . . . . , 16 Mean Number of Children in School in the Households at Hakra 3-R, Distributary . . . . . . . . . . . . . . . . , . . . . . . 16 Mean Number of Family Members Involved Full-time in Agriculture in the Households at Hakra 4-R Distributary . . . . . . , . 16 Mean Number of Family Members Involved full-time in Agriculture in the Households at Hakra 3-R Distributary . . . . . . . . . . . . . . . . . . . . . . . . . . . . . . . . 17 Mean Number of Family Members Involved Part-time in Agriculture in the Households at Hakra 4-R Distributary . . . . . . . . . . . . . , . . . . . . . . . . . . . . . . . . . . . . . . . 18 Mean Number of Family Members Involved Part-time in Agriculture in the Households at Hakra 3-R Distributary . . . . . . . . . . . . . . . . . . . . . . . . . . . . . . . . . . . . . . . 18 Landholdings of Respondents . . . . . . . . . . . . . . . . . . . . . . . . . . . . . 19 Tenancy Status of Respondents . . . . . . . . . . . . . . . . . . . . . . . . . , . 20 Farmers Owning Machinery . . . . . . . . . . . . . . . . . . . . . , . . . . . . . , 20 Source of Irrigation . . . . . . . . . . . . . . . . . . . . . . . . . . . . . . . . . . . . 23 Extent of Fulfillment of the Crop Requirement . . . . . . . . . . . . . . . . . 23 Methods of Overcoming Crop Water Deficiency . . . . . . . . . . . . . . . . 25 Irrigation Methods . . . . . . . . . . . . . . . . . . . . . . . . . . . . . . . . . . . . . 25 Mean Time Allocated and Required per Acre . . . . . . . . . . . . . . . . . . 25 Adequacy of Canal Water for Crops During Kharif1994 . . . . . . . . . . . . . . . . . . . . . . . . . . . . . . . . . . . . . . . . . . 26 Months of Acute Shortage of Water During Last Kharif (1994) . . . . . . . . . . , . . . . . . . . . . . . . . . . . . . . . . . . . . 27 Adequacy of Canal Water for Crops During the Rabi 1994-95 Season . . . . . . . . . . . . . . . . . . . . . . . . . . . . . , , . 28
1.1 2.1
2.2a
2.2b
2.3 2.4 2.5 2.6a
2.6b
2.7a
2.7b
2.8a
2.8b
2.9 2.10 2.1 1 3.1 3.2 3.3 3.4 3.5 3.6
3.7
3.8
iv
I I

3.9
3.10
3.1 1 4.1
4.2
4.3 4.4
4.5 4.6a
4.6b
4.7 4.8 4.9a 4.9b 4.10a
4.10b
4.1 l a
4.11b
4.12a
4.12b
4.13a
4.13b
4.14a
4.14b
5.1 5.2
Months of Acute Shortage of Canal Water During the Rabi 1994-95 Season . . . . . . . . . . . . . . . . . . . . . . . . . . 28 Extent of Satisfaction With the Present Distribution of Water . . . . . . . . . . . . . . . . . . . . . . . . . . . . . . . . . . . 29 Agency Able to Improve Water Distribution . . . . . . . . . . . . . . . . . . . 29 Equal Distribution of irrigation Water Between the Distributaries . . . . . . . . . . . . . . . . . . . . . . . . . . . . . . . 30 Reasons for Unequal Distribution of Water Between the Distributaries . . . . . . . . . . . . . . . . . . . . . . . . . . . . . . . 31 Equity WIthin the Distributary . . . . . . . . . . . . . . . . . . . . . . . . . . . . . 32 Reasons for Inequity Within the Distributary Command Area . . . . . . . . . . . . . . . . . . . . . . . . . . . . . . . . . . . . . . . 33 Equity Among the Watercourses . . . . . . . . . . . . . . . . . . . . . . . . . . . 34 Equity in Water Distribution in Various Subsystems of the Hakra 4-R Distributary. October1995 . . . . . . . . . . . . . . . . . . . . . . . . . . . . . . . . . . . . . . . . 36 Equity Indicators of Water Distribution at Harka 4-R Irrigation System . . . . . . . . . . . . . . . . . . . . . . . . . . . . . . 37 Functional Condition of the Watercourses . . . . . . . . . . . . . . . . . . . . 38 Functional Condition of the Distributaries . . . . . . . . . . . . . . . . . . . . . 39 Missed Water Turns During the Kharif 1994 Season . . . . . . . . . . . . 40 Missed Water Turns During Rabi 1994-95 Season . . . . . . . . . . . . . . 40 Reasons for Water Turns Missed During the Kharif 1994 Season . . . . . . . . . . . . . . . . . . . . . . . . . . . . . . . . . . . . 41 Reasons for Water Turns Missed During the Rabi 1994-95 Season . . . . . . . . . . . . . . . . . . . . . . . . . . . . . . . . 42 Reasons for Water Turns Exchanged During the Kharif 1994 Season . . . . . . . . . . . . . . . . . . . . . . . . . . . . . . . . . . . . 43 Reasons for Water Turns Exchanged During the Rabi 1994-95 Season . . . . . . . . . . . . . . . . . . . . . . . . . . . . . . . . . . 43 Reasons for Water Turns Purchased During the Kharif 1994 Season . . . . . . . . . . . . . . . . . . . . . . . . . . . . . . . . . 45 Reasons for Water Turns Purchased During the Rabi 1994-95 Season . . . . . . . . . . . . . . . . . . . . . . . . . . . . . . . . 45 Reasons for Water Turns Sold During the Kharif 1994 Season . . . . . . . . . . . . . . . . . . . . . . . . . . . . . . . . . 46 Reasons for Water Turns Sold During the Rabi 1994-95 Season . . . . . . . . . . . . . . . . . . . . . . . . . . . . . . . . 46 Reasons for Water Turns Stolen During the Kharif 1994 'Season . . . . . . . . . . . . . . . . . . . . . . . . . . . . . . . . . 47 Reasons for Water Turns Stolen During The Rabi 1994-95 Season . . . . . . . . . . . . . . . . . . . . . . . . . . . . . . . 47 Existence of WUAs At the Watercourse Level . . . . . . . . . . . . . . . . . 48 Member of WUA at Your Watercourse . . . . . . . . . . . . . . . . . . . . . . . 49
V

5.3 5.4 5.5 5.6 5.7
5.9 5.10 5.11 5.12 5.13
5.8
5.14 5.15 5.16 5.17 6.1 6.2 6.3 6.4 6.5
6.6 6.7 6.8 6.9 6.10 6.1 1
FIGURES
1.1 1.2 1.3 1.4
Number of Members of WUA at Your Watercourse . . . . . . . . . . . . . 49 Number of WUA Executive Committee Members . . . . . . . . . . . . . . . 50 Selection of the WUA Executive Committee Members . . . . . . . . . . . 50 Usefulness of WUAs . . . . . . . . . . . . . . . . . . . . . . . . . . . . . . . . . . . 51 How a Water Users Association is Useful . . . . . . . . . . . . . . . . . . . . 51 Benefits From the Agricultural Extension Agent . . . . . . . . . . . . . . . . 52 Benefits From the Fertilizer Company Agent . . . . . . . . . . . . . . . . . . 53 Benefits From the Pesticide Company Agent . . . . . . . . . . . . . . . . . . 54 Benefits From the OFWM Representative . . . . . . . . . . . . . . . . . . . . 54 Benefits From the Mobile Credit Officer . . . . . . . . . . . . . . . . . . . . . . 55 Benefits From the Punjab Irrigation Department Representative . . . . . . . . . . . . . . . . . . . . . . . . . . . . . . 55 Quality of Groundwater . . . . . . . . . . . . . . . . . . . . . . . . . . . . . . . . . 56 Measures to Control Waterlogging . . . . . . . . . . . . . . . . . . . . . . . . . 57 Measures to Control Salinity . . . . . . . . . . . . . . . . . . . . . . . . . . . . . . 57 Existing Status of Organizational Behavior . . . . . . . . . . . . . . . . . . . . 59 Agronomic Practices and Cotton Yields . . . . . . . . . . . . . . . . . . . . . . 61 Agronomic Practices and Wheat Yields . . . . . . . . . . . . . . . . . . . . . . 62 Agronomic Practices and Rice Yields . . . . . . . . . . . . . . . . . . . . . . . 63 Agronomic Practices and Yields for Sugarcane . . . . . . . . . . . . . . . . 64 Agronomic Practices and Values for KharifFodder' . . . . . . . . . . . . . . . . . . . . . . . . . . . . . . . . . . . . . . . . 66 Agronomic Practices and Values for Rabi Fodder . . . . . . . . . . . . . . . 66 Cropping Intensity . . . . . . . . . . . . . . . . . . . . . . . . . . . . . . . . . . . . . 67 Ranking of Factors That Help in increasing Crop Production . . . . . . . 68 Mean Number of Respondents for Livestock . . . . . . . . . . . . . . . . . . 68 Mean Total Water ChargedAbiana Paid per Acre . . . . . . . . . . . . . . 69 Mean Income of the Respondents from Farm. Livestock. Off-farm Labor. Remittances and from other Jobs . . . . . . . . . . . . . . 69
Location Map of Fordwah Eastern Sadiqia (South) Project . . . . . . . . . 2 Location Map of the Hakra 4-R Distributary . . . . . . . . . . . . . . . . . . . . 4 Schematic Diagram of the Hakra 4-R Distributary . . . . . . . . . . . . . . . . 7 Map of Bahawalnagar District . . . . . . . . . . . . . . . . . . . . . . . . . . . . . . 9
vi
I

FOREWORD
This report is one of three socio-economic baseline surveys undertaken at the pilot sites where IlMl is learning how to organize farmers into water users organizations. The other two reports cover: (1) the three pilot distributaries under the Left Bank Outfall Drain Stage I Project; and (2) the two command areas served by Shahpur and Mirwal Dam in northwestern Punjab. Thus, llMl has six pilot sites where water users organizations are being created, of which Hakra 4-R Distributary represents the largest command area (nearly 18,000 hectares or 45,000 acres) and more than 4,600 farmers.
The field work for this socio-economic survey was done during the latter part of 1995 and a draft report was completed in early 1996 that could be used to guide some of the social organization activities. Then, all of the staff concentrated their efforts and establishing the five subsystem water users organizations, which culminated on 5 March 1997 with the farmers' selection of leaders for the Hakra 4-R Water Users Federation. After documenting this experience, the staff then finalized this report.
I would like to commend the authors, as well as the staff at our Haroonabad Field Station, for not only this study, but also their tremendous effort in establishing the various levels of water users organizations. They continue working hard to strengthen these organizations so that the Hakra 4-R Water Users Federation will become sustainable.
Then, this socio-economic survey will be repeated so that before-and-after comparisons can be made. That becomes the real value of this report.
Gaylord V. Skogerboe Director, Pakistan National Program International Irrigation Management Institute
vii

ACKNOWLEDGEMENTS
The authors wish to thank Professor Gaylord V. Skogerboe, Director IlMl Pakistan, whose guidance and critical reviews helped greatly in completing this report. The authors are indebted to Ms. Asirna Bashir and Mr. Sameeullah for spending time in data feeding and processing. The authors also thank the staff at the IlMl Field Station, Haroonabad, and the survey team, who cooperated with each other in collecting field data under very hot and humid conditions of the 1995 summer in the Southern Punjab.
Special thanks go to Mr. Manzoor Hussain for his excellent work in formatting the report and incorporating the changes. Finally, the financial assistance for this work from the Royal Netherlands Government is gratefully appreciated.
viii
__ -

Chapter 1
INTRODUCTION
BACKGROUND
The Fordwah Eastern Sadiqia (South) (FESS) Phase I Irrigation and Drainage Project covers an area of approximately 105,000 hectares (260,000 acres) in the southeastern part of the Punjab Province. The location of this project in Pakistan is shown in Figure 1 .I. The overall objective envisaged in the Fordwah Eastern Sadiqia (South) Project is to raise the level of agricultural production.
The rise of the groundwater level and the upward movement of sodic salts render the soil unproductive or under-productive in much of the command area. The FESS Project envisages to remedy this situation through reducing the groundwater recharge by improved on-farm water management practices and reduced inequity in water delivery by introducing rational water distribution and improved canal water management. In addition, the groundwater levels will be lowered by a combination of interceptor, subsurface and surface drains (Government of the Punjab. 1994).
To achieve the objectives of the FESS Project, an amount of Rs 2,296.36 million was earmarked with the financial assistance of the World Bank (Government of Pakistan, 1994). Most of these funds are associated with the infrastructure development work, but a reasonable amount has been set apart for the related research activities being conducted by a number of national research institutes.
The pilot project on water users organizations conducted by the International Irrigation Management Institute (IIMI) is located in the FESS Project area, but is supported by a different funding source, the Royal Netherlands Government. Keeping in view the difficulties faced by the farmers and the condition of the affected soils in the area, the Hakra 4-R (Haroonabad) Distributary was selected for this pilot project, which will study the social and economic viability of the participation of farmers' organizations in operation and maintenance (O&M) of the irrigation system.
A baseline survey was designed as a starting point of an action research program for this pilot study. The major emphasis of the survey was to obtain first hand information about the socioeconomic conditions of the water users in order to devise a basis for planning, as well as defining directions and strategies for the future. Surveys of this nature serve the dual purpose of determining and appraising the existing conditions and of prescribing necessary development measures. This report presents the findings of the baseline survey.
1

Figure 1 . I . Location Map of the Fordwah Eastern Sadiqia (South) Project.
I AH.
2

OBJECTIVES OF THE STUDY
The following objectives were established for this socioeconomic baseline survey:
1. To collect information on the socioeconomic conditions of the water users on the 4-R Haroonabad Distributary;
To examine the existing conditions of irrigation practices, water management, water transactions, cropping patterns and cropping intensities; and
To investigate the existing conditions of water distribution (e.g., equity, reliability and variability of water supply).
2.
3.
METHODOLOGY
A baseline survey was proposed during the IIMI-Pakistan in-house seminar held in Lahore on April 24, 1995, as a starting point for this action research program on the selected pilot site. The basic reason for selecting the Hakra 4-R Distributary (Figure 1.2) at Haroonabad as the pilot study site was that it was located in the Fordwah Eastern Sadiqia (South) (FESS) Project area, where some of IIMl’s other research activities are already in progress. Further, the distributary’s four drop structures could be calibrated and used to effectively monitor the flows of water, once the water users organizations started functioning.
To collect information from farmers at the Hakra 4-R Distributary, a detailed questionnaire was prepared and discussed with senior research staff, and later modified on the basis of suggestions received. It was then pretested by a research team near Bhai Pharo, about 50 km from IIMl’s Lahore office on the Multan Road. During pretesting, it was found that some questions in the questionnaire needed further clarification and it was, therefore, modified again.
Once the questionnaire was reconstructed, it was again pretested at the actual site (i.e., the Hakra 4-R Distributary) by the same team of researchers who pretested the earlier version. Then, the questionnaire was given a final shape for actual data collection.
3

Figure 1.2. Location Map of the Hakra 4-R Distributary. I
4

I SAMPLING PROCEDURE AND SAMPLING DESIGN
A list of the watercourses at the 4-R Distributary was received from the On-Farm Water Management (OFWM) office, Bahawalnagar. The list had been prepared from the record of the Irrigation Department, Bahawalnagar. A sample of 13 watercourses was selected out of a total of 123 watercourses using a stratified random sampling procedure (Parel et al., 1973; and Shahid, Haq and Khan, 1992). with the distributary command area being stratified into head, middle and tail sections (reaches).
The Hakra 3-R Distributary, adjacent to the pilot distributary command area, was selected as a control site. Four watercourses were randomly selected for the study, two each on the left and right sides of the control distributary,
Along with the finalization of the questionnaire, a team of seven enumerators was selected [the enumerators had a master's degrees, except one who had a BSc. (Hons.) in Agriculture]. The enumerators were given a training on field interactions with farmers, emphasizing the need to create and maintain a rapport between the two groups before actually collecting the data. The enumerators were given a briefing on the objectives of the survey and the items in the questionnaire.
The decision was made that the farmers who had started cultivation during the current year for the first time should not be interviewed. The omission of new cultivators and the non-availability of a few farmers led to the decision to interview all the remaining farmers within the selected sample watercourse command areas. The warabandi' list for each sample watercourse was reconstructed by IIMl's field team in Haroonabad.
Initially, the enumerators faced many difficulties because of some discrepancies in the warabandi lists, but later on, all of the warabandi lists were reviewed by revisiting the farmers at the sampled watercourses. Overall, there were 465 respondents to be interviewed, 367 at the Hakra 4-R Distributary and 98 at the Hakra 3-R Distributary. The watercourses and the number of respondents per watercourse are given in Table 1.1.
In addition to conducting the survey related to socio-economic aspects, the water flow of the watercourses and the distributary were measured for the purpose of evaluating equity and variability of the water supply. To assess the actual water supply situation, data about water flow were also collected at the head of other distributaries off-taking
1. A rotational method for equitable distribution of the available water in an irrigation system by turns fixed according lo a predetermined schedule specifying the day, time and duration of supply to each irrigator in proportion to the size of the irrigator's landholding in the watercourse command (Bandaragoda and Rehman, 1995).
5

from the Hakra Branch Canal. This would heip avoid any doubts at the end of the pilot study that interventions in the pilot distributary were at the cost of the other distributaries.
Data collected were then processed and analyzed by using Dbase and SPSSPC+ software packages. Various statistical methods were employed to describe and analyze data and to derive inferences about phenomena represented by the data.
TABLE 1 .I. Distribution of respondents by watercourse. lr II
I I
I I STUDY AREA
As mentioned above, the Hakra 4-R Distributary (Location Map in Figure 1.2 and Schematic Diagram in Figure 1.3) was selected as the first site for the action research pilot project on the basis of a number reasons. Due consideration was given to factors such as distribution layout of the irrigation system, prevailing socioeconomic conditions of the farming community, and other water-related research in the area.
I
I
I
I l i I
I I
6
I I

I I

The canal system for the study area begins with the diversion from the left bank of the Sulemanki Headworks on the Sutlej River to the Eastern Sadiqia Canal (see Figures 1.1 and 1.2) which runs for a distance of 74 km and then trifurcates into the Hakra and Malik Branch canals and the Sirajwah Distributary. The Main Hakra Branch from the Jalwala Head Regulator runs for about 29 km up to the Gulab Ali Head Regulator, where three distributaries offtake (1-L, 3-R and 4-R). while the Main Hakra Branch continues to serve other distributaries in the downstream region.
The study area is located in the southeastern part of the Punjab Province. It covers part of the TehsillSubdivision of Haroonabad and Bahawalnayar, District Bahawalnagar (Figure 1.4). The study area is bordered on the northeast by the command area of the 3-R Distributary, on the south by land served by the 5-R and 6-R distributaries of the Hakra Branch and on the east by the Main Hakra Branch Canal. The climate in the study area is hot and arid. The average annual rainfall ranges from 125 mm to 250 mm. The hot and dry climate, low rainfall and unfit underground water necessitate ensured and regular irrigation canal water supplies.
Hakra 4-R Distributary at Haroonabad
Overall, the Hakra 4-R Distributary system has 123 irrigation outlets, serving a total canal commanded area of 44,307 acres with a design discharge of 193 cusecs. The total length of the main distributary is about 36 km. The culturable command area of the main distributary is 27.609 acres and it is being irrigated by 73 outlets, supplying water to about 2,675 shareholders along the main distributary, which has five drop structures at RD 24,46,72,82 and 107. About 16 culvertslbridges have been constructed on the main distributary at different places to facilitate easy crossing. Two minors, 1-RA Labsingh and 1-R Badruwala, off-take from the main distributary stream at RD 232001R and 72100/R, respectively.
Minor 1-RA Labsingh
The 1-RA Labsingh Minor consists of 15 irrigation outlets with a design discharge of 22 cusecs, covering a canal command area of 6,077 acres. The total length of the minor is 22,000 ft (7 km) and is supplying irrigation water to about 565 shareholders.
Minor 1-R Badruwala
The 1-R Minor is the larger minor of the Hakra 4-R Distributary. This minor is 50,623 ft. long and is unlined, and comprises 32 irrigation outlets with a design discharge of 43 cusecs, covering a canal command area of 10,217 acres. Direct beneficiaries are about 1,393 shareholders receiving their water supply from the minor.
8

Figure 1.4. Map of Bahawalnagar District.
9

Villages and Population
The rural life of this part of the Punjab Province is very tedious due to scarce canal irrigation resources, unfit (saline) underground water and the "twin menace" of waterlogging and salinity. The Hakra 4-R Distributary system is supplying irrigation water to about 40 villages (including small deras'), which had an approximate population of 101,888 during 19953 as estimated against the 1981 census (Government of Pakistan, 1984) population of 66,945. The majority of the people are settlers who came to this area along with the irrigation development in the area. The major castes are Rajput, Arian. Joya and Watto.
ORGANIZATION OF THE REPORT
In the next chapter, information about the general characteristics of the respondents is presented. Chapter 3 discusses the irrigation practices and water management. Chapter 4 presents irrigation system performance in detail, while Chapter 5 contains information about institutional development. Chapter 6 has details about the cropping patterns, cultural practices, and yields of various crops grown in the study area, while the last chapter contains the summary and main findings of the study.
2.
3.
A house or couple of contiguous houses mainly built on a farmer's landholding,
Calculated by using the demographic formula, P1995=P1981 e,, where, PI981 is population in 1981, r is Ihe rate of population growth (3%) and t is the period (14 years).
10

Chapter 2
GENERAL CHARACTERISTICS OF THE RESPONDENTS
The general characteristics of the respondents (the sampled farmers in the study area) are discussed in this chapter.
FAMILY SIZE
Generally, there has been a trend toward nuclear families; however, many joint families can still be found. The family comprises household members pooling their incomes together and eating from the same kitchen, while the family members living outside the household, or outside the village, contribute to the family income in some form or the other. Table 2.1 indicates that the overall mean number of family members per household at the sampled watercourses was 8.78 at Hakra 4-R Distributary4. The mean numbers of family members were 9.27, 8.62 and 8.67 at the head, the middle, and the tail reaches, respectively, of the 4-R Distributary. The mean numbers of males and females were also calculated among various age categories. In the working-age group, between age 15 and less than 65, the mean numbers of males and females of 4-R were 5.28, 4.87 and 5.08 at the head, the middle, and the tail reaches, respectively. This showed that the mean number of males and females in the working-age group was higher than the mean number of males and females in the dependent group (that is, below 15 and above 65 years) at every reach of the 4-R. For details, see Table 2.2a. The overall mean numbers of family members of the household were 9.67,6.78 and 7.42 at the head, the middle and the tail reaches, respectively, of the 3-R, giving an overall mean number of household members at 7.79 (Table 2.2b).
Age Distribution
The age of a person has a bearing on the employment pattern, mobility and quality of work done. No substantial difference in the mean age of the respondents from different groups was observed during the survey. Overall, the mean age of the respondents at 4- R was found to be 48.7 years. Table 2.1 shows that the mean ages of sample farmers were about 47 years at the head, 49 years at the middle and a little over 49 years at the tail of the 4-R Distributary, while the mean age of the sampled farmers was calculated as 44.8 years at the 3-R Distributary.
4. In the following sections, the Hakra 4-R Distributary will be referred to as simply 4-R, and the Hakra 3-R Distributary as 3-R.
11

Table 2.1. Mean number of family members, age, experience in irrigation agriculture, landholding and land operating of the respondents.
Distributarv
4-R 3-R
Family members
Age of the respondents (years)
Years of experience in irrigation agriculture (years)
Area owned at the same W/C (acres)
Head Head Middle Tail Overall (75) (94) (198) (367)
9.27 8.62 8.67 8.78
46.95 49.0 49.20 48.69
27.33 28.27 28.5 28.20
4.14 5.32 6.51 5.71
(21)
Area owned at other WIC (acres)
9.67
40.62 - -
20.14
7.10 2.97 0.96 2.73 15.26 3.42 1.95 5.07
- 6.79
Total area owned (acres)
Area operated at the same WIC (acres)
Area operated at other W/C (acres)
Total area operated (acres)
6.78
45.20
24.94
11 2 4 7.82 7.49 8.34
8.44 10.82 10.28 10.05
4.63 3.38 1.72 2.74
14.51 14.90 11.97 13.24
5.08
22.00
15.86
15.19
31.02
Tail Overall
8.5 10.11 12.36
12.67 11.28 12.52
6.19 1.76 5.45
18.86 13.04 17.96
Irrigated Agriculture Experience
Experience is an important element in the context of human capital and it is expected to exert a positive influence on earnings. The mean number of years of experience in irrigated agriculture of the sample farmers was also calculated. On average, respondents at 4-R were having an experience of 28.2 years in irrigated agriculture. In case of various reaches of the 4-R Distributary, the mean number of years of experience in irrigated agriculture of sampled farmers was 27.3 years at the head reach, 28.3 years at the middle and 28.5 years at the tail reach. At the 3-R Distributary, the mean number of years of irrigation experience was found as 23.4 years. For details see Table 2.1.
12

65 years and above
Overall
Table 2.2b. Mean number of family members in the household at Hakra 3-R Distributary.
0.19 0.19 0.38 0.13 0.13 0.26 0.14 0.11 0.25
9.27 8.62 8.67
8.78
RESIDENTIAL STATUS OF THE SAMPLE FARMERS
Residential status refers to respondent's place of origin, that is, whether the respondent belonged to the local area (called "local"). or came from other parts of Pakistan (called "settler"). or migrated from India afler partition during 1947 (called "migrant"). Residential status is believed to be having a strong association with the adoption of new farm technologies. On an overall basis, the local respondents were found to be about 20 percent, while the rest of the sample farmers were either settlers or migrants at the 4-R Distributary. For details see Table 2.3. Migrants were in the majority at both distributaries. 61.3% at 4-R and 54.2% at 3-R.
13

Residential status
Local
Settler
Migrant
Total
CASTES OF SAMPLE FARMERS
Distributary
4-R 3-R
Head Middle Tail Overall Head Middle Tail Overall (75) (94) (198) (367) (21) (18) (59) (98)
1.3 17.0 28.8 20.2 23.0 11.1 32.2 26.5
4.0 18.1 24.2 18.5 4.8 0.0 30.5 19.4
94.7 64.9 47.0 61.3 71.4 88.9 37.3 54.1
100.0 100.0 100.0 100.0 100 0 100.0 100.0 100.0
The caste of sample farmers refers to different sects or tribes in the farming community. Table 2.4 indicates that Jat, Rajput and Arian respondents were about 80 percent at the 4-R Distributary, when combinbd together. These are the castes which were generally known to be engaged in farming. There also existed some other castes like Awan, Malik and others, but they were in small numbers. Jat and Arian respondents were mainly found at the tail reach of 4-R, while Rajput were found concentrated at the head and middle reaches of the distributary. At the 3-R Distributary, Arian families were commonly found and were concentrated at the head and tail reaches of the distributary.
Table 2.4. Castes of respondents.
14
I

EDUCATIONAL LEVEL OF SAMPLE FARMERS
The educational level of a person represents the development of character or mental power. It helps the farmers in raising their understanding and the level of acceptance of, or receptivity to, new farming techniques. According to Table 2.5, the majority of the respondents were found to be illiterate at the 4-R Distributary. Overall, the percentage of illiterates was 61.6 at 4-R. About 77 percent of the sample farmers were found illiterate at the head, 67 percent at the middle and 53 percent at the tail reach of the 4-R Distributary. Sample farmers educated below matriculation were about 34 percent, whereas there were just 5 percent of the respondents educated above matriculation. Almost the same kind of situation was found prevailing at the 3-R Distributary.
Table 2.5. Educational level of respondents.
Data presented in Tables 2.6a and 2.6b show that the overall mean number of school going childiren of the respondents at 4-R was 1.92. The mean number of school going children was 1.67 at the head, 1.83 at the middle and 2.06 at the tail reach. It is interesting that the mean number of male school children was higher than that of the female school children at the 4-R Distributary. At the 3-R Distributary, the mean number of schoolchildren was found to be 1.65.
15

Table 2.6a. Mean number of children in school in the households at Hakra 4-R Distriburtary.
Table 2.6b. Mean number of children in school in the households at Hakra 3-R Distributary.
Table 2.7a. Mean number of family members involved full-time in agriculture in the households at Hakra 4-R Distributary.
16

Table 2.7b. Mean number of family members involved full-time in agriculture in the households at Hakra 3-R Distributary.
65 years and 0.05 0.0 0.05 0.0 0.0 0.0 0.07 0.0 0.07 above
Overall I .a1 1.50 I .49
1.56 F value=10.249 Significant at ,005 level.
ON-FARM FAMILY EMPLOYMENT
Respondents were asked for basic information about all of the family members and about their extent of involvement in agriculture. As expected, a higher mean number was found for males than females in full-time agriculture (Tables 2.7a and 2.7b). They were mostly found in the working-age category, that is, from 15 to 65 years. The mean number of male family members was 1.96 on average at the head, 1.72 at the middle and 1.62 at the tail reaches of the 4-R Distributary. At this distributary, the overall mean number of family members in the respondents’ households working full-time in agriculture was found to be 1.97, whereas the corresponding number was 1.56 at the 3-R Distributary. The F-value is 10.25, which is significant at the 0.005 level, indicating a highly significant difference between means of family members involved in agriculture at the 4-R and 3-R distributaries.
Tables 2.8a and 2.8b present results about the mean number of family members who were involved part-time in agriculture at the 4-R Distributary. Here, females of the working-age group were commonly found partially involved in agriculture. As they had to do other chores in their houses, they were found partly sharing in farm work. Besides women of the working-age group, males of age group 5 to 15 years were also found engaged part-time in agriculture. The reason for this may be that they studied in school, while after school time, they helped their elders by doing petty work related to the farm. A little higher mean number of family members engaged part-time in farming was observed at 4-R than at the 3-R Distributary.
17

I Age Head Middle
I up to 5
Tail
0.53 0.16 0.69 0.39 0.32 0.72
0.37' 0.89 1.27 0.50 0.93 1.47
Overall
0.01 0.01 0.02 0.01 0.0 0.01
2.01 2.18 1.86
1.98 I
-
(198)
I I
0.35 I 0.23 I 0.58 0.51 I 0.71 I 1.22
0.05 I 0.005 I ,055
Table 2.8b. Mean number of family members involved part-time in agriculture in the households at Hakra 3-R Distributary.
1.53 F value+4.8827 Significant at .05 level.
CHARACTERISTICS OF THE FARMHOLDINGS
Land is a major determinant of the farm income and control over land has a strong association with the adoption of new farming techniques. Farm productivity is closely related to the size of the farm (Sharif et al. 1986). Data presented in Table 2.9 indicate that the majority of the sample farmers (55.9%) owned up to 5 acres of land on the 4-R Distributary. Overall, about 83 percent of the respondents had landholdings below 12.5
18

acres in size. This shows that a large majority of the sample farmers had holdings which would just meet their family food needs. About 12 percent of the respondents had land holdings between 12.6 acres to 25 acres, while 6 percent of the total sample farmers had 25.1 acres of land and above at 4-R. This indicates that, at 4-R, the majority of farmers are small landholders.
This is the result of fragmentation of land among the family members of this generation. The respondents who owned landholdings up to 5 acres, at 3-R, were found to be about 44 percent. In all of the other categories of landholdings, the percentages of respondents were higher at 3-R than at the 4-R Distributary.
The mean total area operated by a respondent was about 13 acres at 4-R, while the correspondling figure for the 3-R Distributary was 18 acres. The mean area owned by the sample farmers was 8.34 acres at 4-R while it was 12.36 acres at the 3-R Distributary. This confirms the findings that the percentage of respondents having landholdings above 5 acres was higher at 3-R than at the 4-R Distributary (see Table 2.1). Interestingly. in both of the cases, the mean total operated area was found higher at the head reach than at the tail reach of the 4-R Distributary.
Table 2.9. Landholdings of respondents.
Distributary Landholdings
4-R 1 3-R
Head Middle Tail I (75) I (94) I (198)
Up to 5 acres 64.0 60.6 50.5
5.1 to 12.5 acres 16.0 21.3 32.8
12.6 to 25 acres 9.3 10.6 13.1
25.1 acres and 10.7 7.4 3.5 above
Total 100.0 100.0 100.0
55.9
26.4
11.7
6.0
100.0
Head (21)
42.9
33.3
9.5
14.3 -
100.0 -
' 72.2 35.6 43.9
5.6 40.7 32.7
11.1 18.6 15.3
11.1 5.1 8.2
100.0 100.0 100.0

Tenancy Status
Table 2.10 shows that the majority of the respondents (about 51 percent) were owners of land at the 4-R Distributary. The number of tenants was about 16 percent, while the number of owners-cum-tenants came to around 33 percent. Table 2.10 also shows a similar picture for owners, tenants and owners-cum-tenants at the 3-R Distributary.
Distributary
4-R 3-R
Table 2.1 1. Farmers owning machinery. lr il
JI 11 Machinery I Distributary
20

FARM MACHINERY
Farm machinery helps in timely completion of various operations at farm, which ultimately contributes positively towards farm income. Table 2.1 1 indicates that quite a few of the sample farmers owned tractors, threshers, seed drills, rotavaters, tubewells, ridgers, boom sprayers and trolleys. It was observed that percentage of respondents, who had tractors, were about 17 percent on 4-R Distributary. And in case of various reaches of the 4-R Distributary, 16 percent at the head reach, 21.3 percent at the middle and about 16 of the respondents at the tail reach owned tractors. As indicated earlier in the report, groundwater in this area is not suitable for irrigation, and the percentage of tubewell owners was found to be low, i.e., 11.7 percent. It was observed during the survey that, because of unfit groundwater, these tubewells were mostly installed near the bank of the 4-R Distributary. Because of water seepage, underground water near the distributary seems fit for drinking and also for irrigation purposes. The percentage of sample farmers who owned tractors and other implements were found higher at 3-R than at 4-R. This may be due to the fact that the percentage of big landowners was less at 4-R compared with the 3-R Distributary.

Chapter 3
IRRIGATION PRACTICES AND WATER MANAGEMENT
This chapter focuses mainly on sources of irrigation, irrigation methods, and adequacy of canal water in the pilot study area.
SOURCE OF IRRIGATION
Data presented in Table 3.1 indicate various sources of irrigation. The main source of water supply for irrigation in the study area was found to be canal water. Besides the canal, tubewells were another source of water supply for crop irrigation. Table 3.1 shows that the majority of the farmers were having canal water as a source of irrigation at the 4-R. A large majority (90.7%) of the farmers at the head compared to less than half (44.9%) of those at the tail of the distributary said that canal water was their main source of irrigation. About 22 percent of the respondents at the middle and about 12 percent at the tail reaches of 4-R said that they used tubewell water to supplement canal water to irrigate their crops. This confirms the fact that farmers at the tail reach of 4-R were not receiving sufficient canal water and often used tubewell water to fulfill crop water requirements. Further, about 43 percent of the sample farmers, at each of the middle and tail reaches of 4-R, were using some other water sources, such as public tubewells. purchase of canal water from others who had surplus water, or canal water allocated to them for some other purposes (e.g., for gardening, drinking water ponds or drinking water ponds for animals, etc.). Because of insufficient canal water, sample farmers flad to rely on other sources of water besides their allotted canal water through warabandi. A similar type of situation was found at the 3-R Distributary.
FULFILLMENT OF CROP WATER REQUIREMENTS
As canal water was short, particularly at the middle and tail reaches of the distributary, it was logical to ask the sample farmers about the extent to which the canal water fulfilled their crop water requirements. Table 3.2 gives this information.
A large majority of the farmers (80.1%) at the 4-R Distributary were of the view that canal water was sufficient to some extent to meet the crop requirements. About 4 percent of the sample farmers at the 4-R Distributary (5.6 percent at the tail, 2.1 percent at the middle and 2.7 percent at the head reaches) said that canal water did not fulfill crop requirements at all. About 16 percent of the sample farmers said that canal water fulfilled crop requirements to a large extent. Interestingly, the middle reach farmers had the highest percentage who were satisfied with canal water.
22
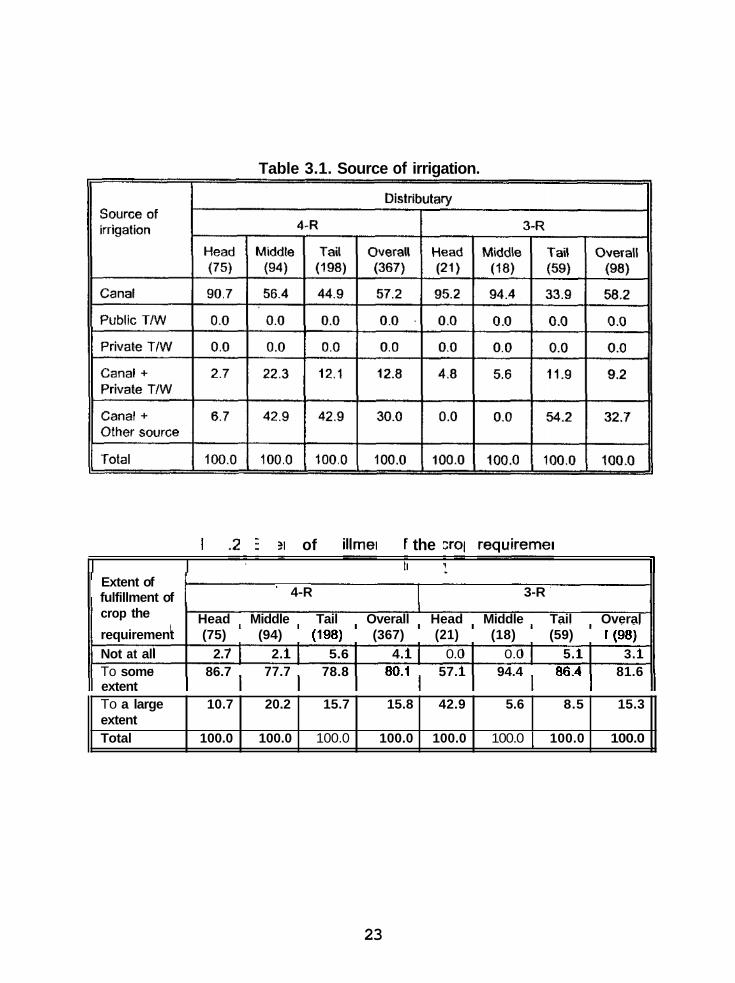
Table 3.1. Source of irrigation.
To a large extent Total
Table 3.2. Extent of fulfillment of the crop requirement. I I Distributary II
10.7 20.2 15.7 15.8 42.9 5.6 8.5 15.3
100.0 100.0 100.0 100.0 100.0 100.0 I 100.0 100.0 -
Extent of fulfillment of ' 4-R 3-R
Head Middle Tail Overall Head Middle Tail Overal crop the
requirement (75) (94) (198) (367) (21) (18) (59) I(98) Not at all 2.7 2.1 5.6 4.1 0.0 0.0 5.1 3.1 To some 86.7 77.7 78.8 80.1 57.1 94.4 86.4 81.6 extent
23

OVERCOMING CROP WATER DEFICIENCY
Afler having gathered information about the extent of fulfillment of the water requirement for crops, the sample farmers were asked about the methods used to overcome crop water deficiency. Table 3.3 contains information about these methods. According to this information, 54 percent of the sample farmers at the 4-R Distributary said that they would keep part of their land fallow when they anticipated canal water deficiency. About 28 percent of the respondents .were of the view that they would apply "less number of irrigations" as one of the methods to overcome the deficiency of water supply. It was interesting to note that the percentage of sample farmers who applied "less number of irrigations" as a method to overcome deficiency of canal water, gradually increased from 14.7 percent at the head reach to 26.6 percent at the middle, to 33.8 percent at the tail reaches of the distributary. This indicates the gravity of water shortage at the tail reach of the 4-R. Overall, about 7 percent of the sample farmers said that they would wait for rain before starting any cultivation as there was not sufficient water for irrigation. Similar methods were followed by sample farmers at the 3-R Distributary.
IRRIGATION METHODS
Table 3.4 gives information about the irrigation methods used by sample farmers. Here, the basin method of irrigation seemed very popular among sample farmers in the study area; over 93 percent of the sample farmers used the basin method to irrigate their crops.
TIME ALLOCATED AND REQUIRED PER ACRE
Information about the time allocated and time required to irrigate one acre of land is shown in Table 3.5, which indicates that, on average, about 26 minutes were allocated to irrigate one acre of land on the 4-R Distributary. Surprisingly, along the distributary, the time allocated for irrigation per acre gradually decreased. At the head reach, the mean durations allocated for irrigation were 32.1 minutes at the head, 24.7 minutes at the middle and 24.2 minutes at the tail reach of the 4-R Distributary. This seems a good research issue for further investigation. The average duration allocated (as reported by the sample farmers) for irrigation was found significantly higher at 4-R (25.9 minutes) than at the 3-R Distributary (23.9 minutes).
The sample farmers were also asked about the time required to irrigate one acre of land. Table 3.5 shows that, on average, about 132 minutes were required to irrigate one acre on the 4-R Distributary. Not much difference was found in the time required for irrigation of one acre at different reaches of 4-R. At 3-R, the time required to irrigate one acre ranged from about 100 minutes at the head reach to 130 minutes at the middle and to about 134 minutes at the tail. When Analysis of Variance (ANOVA) was run, the F-value was not significant.
I
24

water Do nothing Total
9 3 1 1 3 5 5 2 0 0 0 0 0 0 0 0 1000 1000 1000 1000 1000 1000 1000 100 0
Irrigation methods Distributary
4-R I 3-R
Basin Furrow
25
Head Middle Tail Overall Head Middle Tail Overall
97.3 94.7 94.9 95.4 95.2 100.0 91.5 93.9 1.3 0.0 1 .o 0.8 0.0 0.0 1.7 1 .o
(75) (94) (198) (367) (21) (18) (59) (98)
Basin + Furrow 1.3 Wild flooding 0.0 Others 0.0 Total 100.0
5.3 4.1 3.8 0.0 0.0 1.7 1 .o 0.0 0.0 0.0 0.0 0.0 3.4 2.0 0.0 0 0 0.0 4.8 0.0 1.7 2.1
100.0 100.0 100.0 100.0 100.0 100.0 100.0
Time
Time allocated to irrigate one acre (minutes) Time required to irrigate one acre (minutes)
Distributary
Head Middle Tail Overall Head Middle Tail Overall
32.1 24.7 24.2 -25.9 25.6 28.5 21.8 23.9'
4-R 3-R
(75) (94) (198) (367) (75) (94) (198) (98)
129.1 137.6 130.2 131.8 99.8 130.0 133.9 125.9

ADEQUACY OF CANAL WATER DURING KHARIF
Perceptions of the sample farmers about canal water deficiency have already been discussed in the previous section. Table 3.6 indicates that a large majority (93.2%) of the sample farmers at 4-R were of the view that canal water was not sufficient for crops. No difference was observed in the percentage of sample farmers, who declared inadequacy of water, in the different reaches of the 4-R Distributary; it was around 93 percent. The same trend was observed among the sample farmers at 3-R.
II Sufficiency of water for crops
No Yes
Total
4-R 3-R
Head Middle Tail Overall Head Middle Tail Overall
93.3 92.6 93.4 93.2 57.1 94.4 94.9 86.7 6.7 7.4 6.6 6.8 42.9 5.6 5.1 13.3
100.0 100.0 100.0 100.0 100.0 100.0 100.0 100.0
(75) (94) (198) (367) (21) (18) (59) (98)
Respondents were asked about the months of acute shortage of water in the distributary during the last kharif and rabi seasons. Data presented in Table 3.7 reveal that during Kharif 1994, water availability was highly deficient at the time of sowing and harvesting. About 30 percent of the sample farmers at the 4-R Distributary said that water was acutely short in June, during Kharif 1994. It was found that 28 percent at the head, about 40 percent at the middle, and about 30 percent at the tail reaches of the distributary were of the view that water was acutely short in June, the month of sowing rice, or cotton, or any other crop. Canal water was also found highly insufficient in July, as was stated by the sample farmers. Overall, about 22 percent of the sample farmers were of the view that the acute shortage of water was experienced in July during the last kharif. And again, canal water was acutely short at the time of harvesting of the kharif crop, i.e., September. A little higher percentage of the sample farmers at 3-R than at the 4-R Distributary were of the opinion that canal water was in acute shortage in June during the Kharif 1994 season.
ADEQUACY OF CANAL WATER DURING RABI
Data presented in Table 3.8 reveal that around 84 percent of the sample farmers at the 4-R Distributary were of the view that canal water was in acute shortage during the Rabi 1994-95 season . As for different reaches of the 4-R Distributary, about 83 percent at the head, 91.5 percent at the middle and about 80 percent at the tail reaches claimed
26

the head, 91.5 percent at the middle and about 80 percent at the tail reaches claimed that water was not sufficient during the last rabi season. About 80 percent of the sample farmers at the 3-R Distributary claimed that water in the distributary was not sufficient for crops during the last rabi season.
Months of acute shortage of water
Distributary
Head I M iddle I T ail I 0 verall I H ead I m l e I T ail ' I 0 verall 4-R I 3-K
Regarding months of acute shortage, Table 3.9 indicates that about 22 percent of the sample farmers were of the view that distributary water was in acute shortage in December, during the last rabi season (1994-95). In case of different reaches of the distributary, 22.7 percent of the sample farmers at the head, 26.6 percent at the middle and about 20 percent at the tail reaches of the 4-R Distributary, claimed that water in the distributary was acutely short in December, during the last rabi season. Over 17 percent of the respondents at the 4-R Distributary were of the view that water in the distributary was in acute shortage in January, during the last rabi season. Insufficiency of water was also noticed by 13.1 percent of the sample farmers in November, and about 11 percent of them claimed that water in the distributary was in acute shortage in February. At the 3-R Distributary, a higher percentage of the sample farmers (25.5%) claimed that water was acutely short in January, during the last rabi season.

Table 3.8. Adequacy of canal water for crops during the Rabi 1994-1995 season.
Table 3.9. Months of acute shortage of canal water during the Rabi 1994-1995 season.
I Distributarv II Months of acute shortage of water
January
February March April October November December Jan-Feb Jan-March Feb-March March-April Dec-Jan Oct-Nov Nov-Dec Not related Total
EXTENT OF SATISFACTION
Data presented in Table 3.10 reveal that, overall, about 26 percent of the sample farmers at the 4-R Distributary were of the opinion that the present distribution system of canal water was not satisfactory at all. In the case of different reaches of the distributary, the number of respondents who were not satisfied at all increased gradually from the head reach to the middle to the tail reaches of the distributary. They ranged from 9.3 percent at the head to 31.8 at the tail reach. Those who showed dissatisfaction with the present distribution system of canal water at the 3-R Distributary ranged from zero percent at the middle to 28.8 percent at the tail reach of the distributary.
28

Table 3.10. Extent of satisfaction with the present distribution of water. Dislributary
Exlent of satisfaction 4-R I 3-R
Not at all
Head Middle Tail Overall Head M' iddle Tail Overall (75) (94) (198) (367) (21) (18) (59) (98)
9.3 I 27.7 I 31.8 I 26.2 9.5 I 0.0 I 2 8.8 I 19.4 To some extent To a large extent Total
IMPROVEMENT IN THE DISTRIBUTION SYSTEM
Following the question on the extent of satisfaction with the present distribution system of canal water, it was logical to ask the sample farmers about the agency which could possibly improve the present distribution system. Table 3.1 1 reveals that among those who were not satisfied with the present distribution of water at all, the majority (68.8%) at the 4-R Distributary were of the opinion that the government agency was the one that could improve the present distribution system of canal water. In the case of different reaches of the distributary, all of the sample farmers at the head, 69.2 percent at the middle and about 65 percent at the tail reach, were of the view that the government agency had the ability to improve the present distribution system of canal water, because it had the power and resources to implement its decision and to punish the violators and the free riders. Overall, 12.5 percent of the sample farmers, amongst those who were not satisfied at all with the present system of distribution of canal water, opined differently and claimed that a farmers' organization at the distributary level, if formed, had the ability to improve the present system of distribution of canal water. Overall, a lesser percentage (5.3%) of the sample farmers at 3-R not satisfied with the present system of water distribution, had the opinion that farmers' organization had the ability to improve the present distribution system of canal water.
82.7 1 69.1 64.1 69.2 52.4 94.4 71.2 71.4 8.0 3.2 4.0 4.6 38.1 5.6 0.0 9.2
100.0 100.0 100.0 100.0 100.0 100.0 100.0 100.0
Table 3.1 1 , Agency able to improve water distribution.
29
_____
Chapter 4
IRRIGATION SYSTEM PERFORMANCE
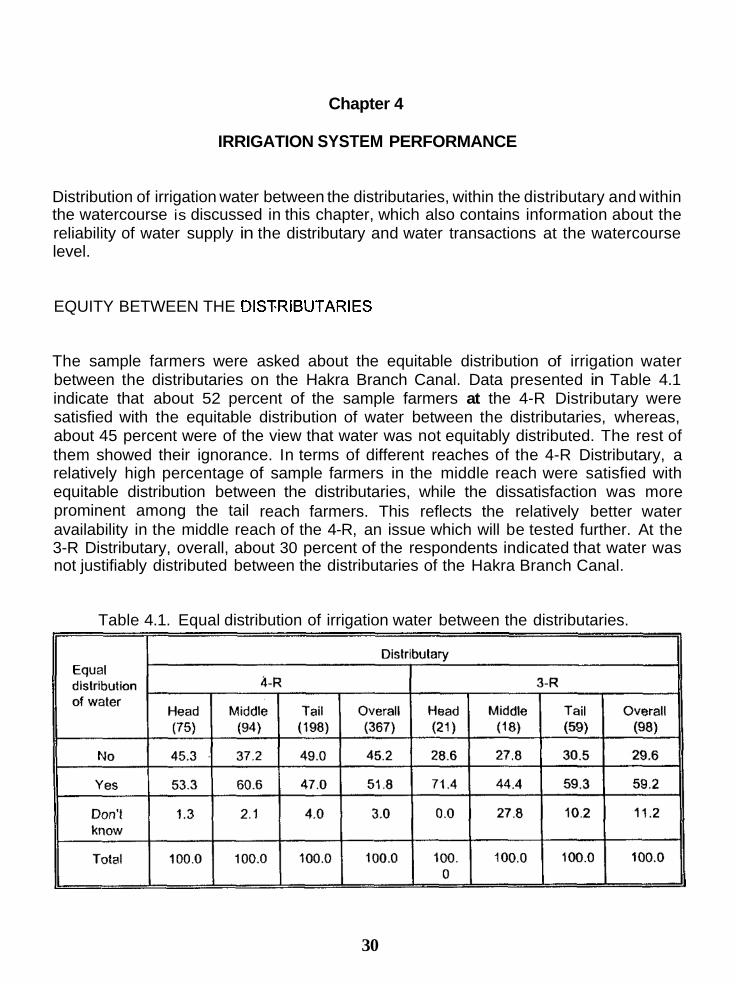
Distribution of irrigation water between the distributaries, within the distributary and within the watercourse is discussed in this chapter, which also contains information about the reliability of water supply in the distributary and water transactions at the watercourse level.
EQUITY BETWEEN THE DIS%RIBUTARIES
The sample farmers were asked about the equitable distribution of irrigation water between the distributaries on the Hakra Branch Canal. Data presented in Table 4.1 indicate that about 52 percent of the sample farmers at the 4-R Distributary were satisfied with the equitable distribution of water between the distributaries, whereas, about 45 percent were of the view that water was not equitably distributed. The rest of them showed their ignorance. In terms of different reaches of the 4-R Distributary, a relatively high percentage of sample farmers in the middle reach were satisfied with equitable distribution between the distributaries, while the dissatisfaction was more prominent among the tail reach farmers. This reflects the relatively better water availability in the middle reach of the 4-R, an issue which will be tested further. At the 3-R Distributary, overall, about 30 percent of the respondents indicated that water was not justifiably distributed between the distributaries of the Hakra Branch Canal.
Table 4.1. Equal distribution of irrigation water between the distributaries.
30

Information provided in Table 4.2 shows that a high percentage of the sample farmers (about 52%) are indifferent about the manner in which water is distributed between the distributaries. In the next highest category, 23.2 percent (about 51 percent of those who stated there was unequal distribution of irrigation water) were of the view that influential persons (usually big landlords), through their political pressure, always received more water in their distributaries and lefl other farmers at the mercy of PID officials, or at the mercy of nature. In terms of various reaches of the 4-R Distributary, a higher percentage (25.3%) of sample farmers at the tail reach than that at the head (12.0%) and middle reaches (24.5%) were of the same opinion.
Influential persondPolitical
Table 4.2. Reasons for unequal distribution of water between the distributaries. Distributary
Reasons 4-R I 3-R
Head Middle Tail Overall Head Middle Tail Overall (75) (94) (198) (367) (21) (18) (59) (98) 16.0 24.5 25.3 23.2 23.8 22.2 13.6 17.3
pressure
Influential Dersons + I 6.7 PID officials I 8.0 7.4 7.6 7.6 4.8 5.6 10.2 8.2
4.3 6.6 5.7 0.0 0.0 3.4 2.0
Besides the influential persons, the "role of PID officials" was another reason for unequal distribution of irrigation water between the distributaries. According to Table 4.2, about 8 percent (about 17 percent of those who said there was unequal distribution of water between the distributaries) of the respondents revealed that PID officials were mainly responsible for inequitable distribution of water, though they did it under political pressure or for unfair means of gratification. The weak banks of some distributaries and the low demand of water were also quoted as the reasons for unequal distribution of irrigation water between the distributaries, but the percentages were negligible. A smaller percentage of the respondents at the 3-R Distributary, than at the 4-R Distributary, said that the influential persons were the main source leading to unequal distribution of irrigation water between the distributaries.
31

EQUITY WITHIN THE DISTRIBUTARY
Information about equity within the distributary is presented in Table 4.3. Overall, about 80 percent of the sample farmers at the 4-R Distributary confirmed the existence of inequity of water distribution within their distributary. To many of them, big landlords on the distributary have got their watercourse outlets tampered in collusion with the PID employees. In terms of different reaches of the 4-R Distributary, the percentage of respondents who acknowledged the inequity of water distribution within the distributary gradually increased from 66.7 percent at the head reach to 79.8 percent at the middle and to 84.3 percent at the tail reach. This reflects an increasing level of farmer mistrust about the existing distribution system in the lower sections of the distributary. Those at the tail reach often complained about the tampering of watercourse outlets in the head and middle reaches, resulting in relatively less water reaching the tail end. A similar situation was reported by the sample farmers at the 3-R Distributary.
Table 4.3. Equity within the distributary. I I 1
Because of this high level of inequity in the distribution of irrigation water within the distributary, the reasons associated with this inequity were explored. Table 4.4 reveals that, overall, 42 percent of the sample farmers (about 53 percent of those respondents who confirmed the existence of inequity of water distribution within the distributary) were of the view that PID officials were playing a significant role in unequal distribution of irrigation water within the 4-R Distributary. This category of sample farmers increased from 32
32

percent at the head reach to about 43.6 percent at the middle, and to 45 percent at the tail reach. The second main reason, as stated by the sample farmers, was the politically influential persons, who exerted political pressure on PID officials. They either arranged to have their outlets tampered, or used other unfair means, like diverting distributary water through motor pumps or by syphoning. By using unfair means, some of the farmers were receiving more water at the cost of the other farmers, particularly at the tail reach. The situation regarding inequity within the 3-R Distributary was not different from that in the 4-R Distributary.
Table 4.4. Reasons for inequity within the distributary command area.
33

Table 4.5. Equity among the watercourses. li I II
Equity 4-R 3-R
watercourses
No
Yes
Total
EQUITY WITHIN THE WATERCOURSE
Head Middle Tail Overall Head Middle Tail Overall (75) (94) (198) (367) (21) (18) (59) (98)
9.3 4.3 11.6 9.3 0.0 0.0 16.9 10.2
90.7 95.7 88.4 90.7 100.0 100.0 83.1 89.8
100.0 100.0 100.0 100.0 100.0 100.0 100.0 100.0
The distribution of water among the watercourses seemed to be reasonably equitable. At the watercourse level, every farmer appeared satisfied as he was getting his due share of water according to warabandi. Farmers reported that they received their water turn for a specified period afler every week. Data presented in Table 4.5 indicate that a large majority of the sample farmers (about 91%) were satisfied with the water distribution within the watercourse. In terms of different reaches of the 4-R Distributary, no significant difference was observed. Equity within the watercourse at the 3-R Distributary was observed to be similar.
As part of the Socioeconomic Baseline Survey for the command area of the Hakra 4-R irrigation system, equity in water distribution was also studied through some physical measurements, such as discharges at various outlets. This experiment was conducted during one of the peak seasons, since during the slack seasons, many outlets, especially in the head reach, were tampered by the farmers, affecting the overall distribution of water in the system.
The water measurements for studying equity were taken from an inflow-outflow test conducted during the middle of the sowing season for wheat (i.e., in the fourth week of October, 1995) in the area characterized by a high demand for water. On the day of the experiment, against a sanctioned discharge of 193 cusecs established in the 1930 for the distributary, an actual amount of 233 cusecs of water was flowing in the distributary, around 20.56 per cent more than the authorized amount, which should be expected afler construction of Mangla and Tarbela dams.
34

EQUITY IN IRRIGATION WATER DELIVERY
Equity, as related to water-delivery systems, can be defined as the delivery of a fair share of water to users throughout a system. A share of water represents a right to use a specified amount. The fair share of water may be based on a legal right for water, as in a prior appropriation system, or may be set as a fixed proportion of a water supply, as is done in many rotational delivery schemes. Equity of water delivery is a difficult objective to measure because there are many factors that determine the meaning of a "fair share," and because a fair share is oflen interpreted subjectively. Nonetheless, it is important to define measures relating to equity so that systems can be designed and rehabilitated to deliver water in an impartial manner to users served by the system. Several alternative definitions of water delivery equity have been suggested (Sampath 1988; Levine and Coward 1989).
In the present study, equity is defined as being attained when the ratio of water delivery through outlets at the head reach of the distributary to that at the tail reach equals one, i.e., when the outlets at the head and the tail are drawing water from the distributary proportionate to the designed (authorized) discharges. The greater the deviation from one, the more inequitable is the distribution. Mathematically, equity of water distribution (a,) can be expressed as:
QJQ, at Head
QJQ, at Tail Q, = -
where.
Q, is equity in water delivery Q, is observed (actual) water supply in cusecs Q, is sanctioned water supply in cusecs
Since the Hakra 4-R system is fairly large, it was divided into three subsystems for the sake of having a more representative data set. Each minor was studied as an independent subsystem, while the main 4-R Distributary was considered as another subsystem. Table 4.6a entails the detailed data set regarding equity on various subsystems of the Hakra 4-R irrigation system.
The ratio of irrigation water delivery through the outlets at the head reach to that at the tail reach at the 1 RA Minor was the highest; it was lowest for the 1R Minor indicating that at the IRA Minor, the distribution between the head and tail reaches is inequitable (up to 91 percent) while the distribution is close to unity at Minor IR. indicating approximately equitable distribution between the two reaches.
35

During the experiment, it was observed that the actual discharge of water in the distributary was 20 percent higher than the sanctioned value. Relative increases or decreases in water supply also affect the water distribution to various reaches of the distributary. The literature suggests that the equity experiment must be conducted at three different flow levels, i.e., low flow, designed flow and high flow to improve the accuracy of the results. Therefore, when the results are interpreted, this limitation should be kept in mind.
Table 4.6a. Equity in water distribution in various subsvstems of the Hakra 4-R Distributarv. October 1995.
Main 4-R
QJQ, at Head Reach Tail Reach
I ' QdQ, at 1 Q ratio (34) 1 Subsystem I 0.8846 0.7378 1.20
L II
1 R Minor I 0.97 0.5826 0.5994
An alternative method of equity measurement has been suggested by Molden and Gates (1990). They defined equity of water distribution, irrespective of the average level of supply, by dividing the standard deviation of the water delivery of a sample (i.e watercour&s) by the mean. The,deliveries are corrected for the intended discharges by dividing the actual discharge by the authorized discharge. Mathematically, the equity ratio, P,, is defined as
P, = CV, QJQ,
where
P, is the equity ratio;
CV, is the coefficient of variation of actual discharge Qo divided by designed discharge Qs.
,Molden and Gates regard a value of 0 to 0.1 for P, to represent good performance, while a value from 0.1 to 0.2 is considered fair, and any score above this indicates poor performance or inequitable distribution.
The Modified Inter-quartile Range (MIQR) was proposed by Abernethy (1986). who defined it as the ratio of average depth of water received by all lands in the highest quarter of the command area and the average depth of water supplied to the lowest
36

(poorest) quarter. In the case of 4-R Distributary, the target would be the ratio of actual discharge over authorized discharge or
MlQR = (average DPRl)/(average DPR4)
in which,
DPR = QJQ,
- Sub-system DPR,,, CV(DPR) MlQR
Main 4-R 1.21 36 .87
1 RA minor 1.26 .45 1.75
1 R Minor 1.42 .24 1.15
Since both of the indicators do not reflect the level of supplies to the distributary, an extra supply indicator is added, which will help evaluate the results of the application of the two equity indicators i.e., Delivery Performance Ratio (DPR). The Delivery Performance Ratio can be defined as the ratio of actually delivered discharge divided by the water demand or the target. In this case, the target is the sanctioned discharge. Thus,
DPR = QJQ,
The results of the calculation of these indicators are presented in Table 4.6b. It appears from the value of CV (DPR) that the equity performance of all the three sub-systems according to Molden and Gates is poor. The value of MlRQ suggests that there is high inequity along Minor IRA. The reasons for inequitable distribution could be many, including deposition of silt in the distributary. Nevertheless. relative increases or decreases in water supply also affect the water distribution to various reaches of the distributary. It is advised in the literature that the equity experiment(s) should be conducted at three different flow levels (i.e, low flow, designed flow and high flow) to improve the accuracy of the results. Therefore, the results must be interpreted keeping in view these limitations.
37

FUNCTIONAL CONDITION OF THE CANAL SYSTEM
The respondents were asked about the present functional condition of their respective watercourses and the distributarylminor, relative to their condition 10 years ago. A 10- year period was thought to be sufficient for any change occurring at the watercourse or the distributary to be quite conspicuous. Any change in the functional condition may seem positive or deteriorated or unchanged.
Functional Condition of the Watercourse
Table 4.7 contains information about the functional condition of the watercourses at the 4-R Distributary. About 70 percent of the sample farmers claimed that their watercourses were in a better condition than they were 10 years earlier. The number of the sample farmers, who stated that their watercourses had improved, gradually increased from 36 percent at the head reach to 57 percent at the middle, and to 69.5 percent at the tail reaches. Overall, about 18 percent of the respondents were of the view that their watercourses were still in the same functional condition as they were 10 years earlier, while 12 percent of them revealed that their watercourses were in.a worse shape compared with their condition 10 years before. At the 3-R Distributary, overall about 85 percent of the sample farmers were of the opinion that their watercourses were in a much better shape than they were 10 years earlier.
Table 4.7. Functional condition of the watercourses.
condition of the
38
This seems to be a plausible response, and it may be attributed to the fact that an Ordinance was promulgated by the Government of the Punjab, whereby the Ministry of Agriculture was assigned the duty of improving the functional condition of the watercourses throughout the Punjab Province. Watercourse improvement was done by organizing farmers at the watercourse level who shared a portion of the improvement cost.
Functional
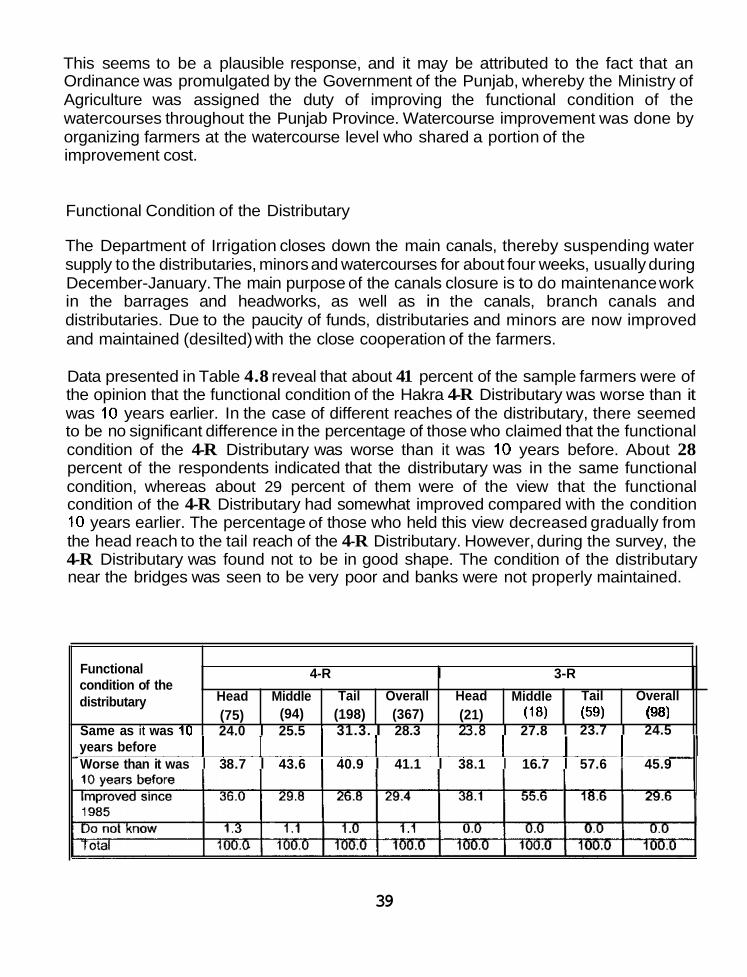
Functional Condition of the Distributary
The Department of Irrigation closes down the main canals, thereby suspending water supply to the distributaries, minors and watercourses for about four weeks, usually during December-January. The main purpose of the canals closure is to do maintenance work in the barrages and headworks, as well as in the canals, branch canals and distributaries. Due to the paucity of funds, distributaries and minors are now improved and maintained (desilted) with the close cooperation of the farmers.
Data presented in Table 4.8 reveal that about 41 percent of the sample farmers were of the opinion that the functional condition of the Hakra 4-R Distributary was worse than it was 10 years earlier. In the case of different reaches of the distributary, there seemed to be no significant difference in the percentage of those who claimed that the functional condition of the 4-R Distributary was worse than it was 10 years before. About 28 percent of the respondents indicated that the distributary was in the same functional condition, whereas about 29 percent of them were of the view that the functional condition of the 4-R Distributary had somewhat improved compared with the condition 10 years earlier. The percentage of those who held this view decreased gradually from the head reach to the tail reach of the 4-R Distributary. However, during the survey, the 4-R Distributary was found not to be in good shape. The condition of the distributary near the bridges was seen to be very poor and banks were not properly maintained.
4-R I 3-R condition of the distributary
Same as it was 10
Head Middle Tail Overall Head Middle Tail Overall (75) (94) (198) (367) (21) (18) (59) (98) 24.0 I 25.5 I 31.3. I 28.3 23.8 I 27.8 I 23.7 I 24.5
I I years before Worse than it was I 3 8.7 I 43.6 I 4 0.9 I 41.1 I 3 8.1 I 16.7 I 57.6 I 45.9
39

RELIABILITY IN WATER SUPPLY
Reliability in water supply means a regular or uninterrupted flow of water to the farmers. The sample farmers were asked about their missed water turns during the last two seasons, i.e.. Kharif 1994 and Rabi 1994-95.
Missed water turn(s)
Data presented in Tables 4.9'a and 4.9b indicate that over 98 percent of the sample farmers at the 4-R Distributary, were of the view that they missed some of their water turns during the Kharif 1994 season. In the case of different reaches of the distributary, no significant difference was found among those who stated about missing their water turns. For details, see also Tables 1 and 2 in the annexes.
Distributary
4-R 3-R
Head Middle Tail Overall Head Middle Tail Overall (75) (94) (198) (367) (21) (18) (59) (98)
Table 4.9a. Missed water turns during the Kharif 1994 Season.
No
Yes
Total
Table 4.9b. Missed water turns during the Rabi 1994-95 Season. I, ,
4.0 6.4 9.1 7.4 0.0 0.0 3.4 2.0
96.0 93.6 90.9 92.6 100.0 100.0 96.6 98.0
100.0 100.0 100.0 100.0 100.0 100.0 100.0 100.0
40

Tables 4.10a and 4.10b indicate that the reason for water turns missed by a large majority of the respondents during last Kharif was "distributary warabandi" or the rotation of distributaries. The same kind of situation was seen at the 3-R Distributary. Different
distributaries receive water supply, in the study area, according to some rotational schedule. During one week, if a distributary is running at full flow, it is because the distributary has been placed in category A, or First Preference. And during next week, the distributary may be at 70 percent of the full flow, where it will be treated in category B, the Second Preference. Sometimes, the same distributary may receive 25 percent or less than the full supply when it will be considered in category C, the Third Preference.V During this fluctuation in water supply, it may happen that certain farmers do not receive distributary water at all and thus miss their water turns. Also, during the desiltation period of three to four weeks, farmers always missed three to four of their water turns. But during this practice, like keeping a certain distributary in category 6 or C over a period may create difficulties for the farmers in the form of missing their water turns continuously.
41

canal/distributary/ minor Distributary warabandi + less water in the distributary Distributary warabandi + Breach in canal/distributary/ minor Not relevant Total
WATER TRANSACT1 ONS
0.0 2.1 0.0 4.8 4.8 0.0 1.7 1 .o
0.0 0.0 0.0 0.0 0.0 11.1 3.4 4.1
4 .O 6.4 9.6 7.6 0.0 0 .o 3.4 2.0 100.0 10010 100.0 100.0 100.0 100.0 100.0 100.0
This section covers a discussion about the exchange of water turns by the sample farmers during the last two seabons, that is, Kharif 1994 and Rabi 1994-95. Besides, it discusses the purchase and sale of water turns by the sample farmers in the study area. The last part of this section covers a discussion about stealing of water.
EXCHANGE OF WATER TURNS
Data presented in Table 4 I l i B indicate that a large majority of the farmers did not engage in exchange of water turns. Only 11.4 percent of the sample farmers, at the 4-R Distributary, stated that they exdhanged their water turns during the Kharif 1994 season. Just 8 percent of the respondents at the 3-R Distributary did exchange their water turns. Table 4.1 l a reveals that 4.6 peltcent of the sample farmers, at the 4-R Distributary, were of the view that they exchangedlwater turns because the crop needed water at that time. It is strange to note that a mudh higher percentage (12.0 "A) of the sample farmers at the head reach than that at thelmiddle (3.2 %) and at the tail reach (2.5 %) exchanged water turns because their crop needed water. About 5 percent of the respondents at 4-R Distributary indicated that they Qsed to exchange water turns to fulfill their mutual need of irrigation water. That is, if faitmer A required water at one time, farmer B, if he had
42

surplus water, or the need of water was not that acute, would sacrifice part of his water turn and in exchange would use farmer As water turn next time. About 2 percent of the sample farmers exchanged water turns because they had some surplus water as some of their fields were badly waterlogged. A similar kind of picture was revealed by the sample farmers at the 3-R Distributary.
Reasons 4-R
Head Middle Tail Overall (75) (94) (198) (367)
Table 4.1 la. Reasons for water turns exchanged during the Kharif 1994 season.
II I niftrihi itarv II 3-R
Head Middle Tail Overall (21) (18) (59) (98)
Crop needed water
Surplus due to waterlogged area
Mutual need
12.0 3.2 2.5 4.6 14.3 0.0 3.4 5.1
2.7 2.1 1.5 1.9 4.8 0.0 0.0 1 .o
6.7 4.3 4.0 4.6 0.0 5.6 1.7 2.0
No reason 0.0 0.0 0.5 0.3 0.0 0.0 0.0
Table 4.1 1 b. Reasons for water turns exchanged during the Rabi 1994-95 season.
Not relevant 78.7 90.4 91.4 I 88.6 81.0 I 94.4 I 94.9
Total
43
100.0 100.0 100.0 100.0 100.0 100.0 100.0 100.0
No reason
Not relevant
0.0 0.0 1 .o 0.6 0.0 0.0 0.0 0.0
84.0 93.6 91.4 90.5 85.7 88.9 94.9 91.8
Total 100.0 100.0 100.0 100.0 100.0 100.0 100.0 100.0

Sample farmers exchanged water turns during the Rabi 1994-95 season. According to Table 4.1 1 b. overall, 9.5 percent of the respondents at the 4-R Distributary exchanged water turns during the Rabi 1994-95 season. When checked about the reason for exchange of water turns, almost the same type of reasons were mentioned by the sample farmers as given in Table 4.1 la .
PURCHASE OF WATER TURNS
Besides water transactions that exist in the form of exchange of farmers' water turns, water transactions also take place in the form of purchase and sale of water turns. Table 4.12a indicates that 29.5 percent of the sample farmers, at the 4-R Distributary, purchased water turns from other farmers. A majority of those sample respondents, who purchased water turns, stated that they had to purchase water turns because of the closure of the 4-R Distributary. As farmers at the tail reach of the distributary were badly affected by the closure of the distributary, the percentage of the sample farmers, who mentioned this as a reason, gradually increased from 2.6 percent at the head reach to 9.6 percent at the middle and to 18.7 percent at the tail reach.
About 7.4 percent of the sample farmers stated "the crop needed water" as one of the reasons for purchasing water turns during Kharif 1994. Due to the saline underground water, very few farmers had installed tubewells in the study area and, therefore, a majority of the farmers had to rely on canal water, whatever quantity of water was available. Information provided by the respondents at the 3-R Distributary was similar.
Data presented in Table 4.12b indicate that about 18 percent of the sample farmers purchased water turns during the Rabi 1994-95 season. Again, a majority of those sample farmers, who purchased water turns during the rabi season, stated that they purchased water because the 4-R Distributary was closed for some period. The number of such sample farmers increased from 2.7 percent at the head reach to 6.4 percent at the middle and to 14.6 percent at the tail. At the 3-R Distributary, a much lesser percentage (2%) of sample farmers than those at the 4-R gave "closure of the distributary" as the reason for the purchase of water turns.
According to Table 4.12b, about 4 percent of the sample farmers at 4-R stated "the crop needed water" as one of the reasons for purchasing water turns, whereas about 2 percent of respondents pointed out "less water in the distributary" as the reason that forced them to purchase water turns during the Rabi 1994-95 season.
SALE OF WATER TURNS
After checking the purchase of water turns, it was found appropriate to enquire about the sale of water turns and the reasons. Data presented in Table 4.13a indicate that, overall 1.4 percent of the sample farmers at the 4-R Distributary sold their water turns to other
44

farmers during the Kharif 1994 season. Though the percentage of such farmers was quite low. water transactions, in the form of sale and purchase of water turns, existed in the study area. All of those who sold their water turns, stated “surplus/enough water” for their crops as the only reason for selling their water turns. In other words, they did less cultivation due to waterlogging and salinity. An almost similar situation was found at the 3-R Distributary. Information presented in Table 4.13b reveals almost the same picture during the Rabi 1994-95 season as was observed during the Kharif season, regarding the sale of water turns at the 4-R and 3-R distributaries.
Table 4.12a. Reasons for water turns purchased during the Kharif 1994 season.
Table 4.12b. Reasons for water turns purchased during the Rabi 1994-95 season.
45

Table 4.13a. Reasons for water turns sold during the Kharif 1994 season.
Reasons
Table 4.13a. Reasons for water turns sold during the Kharif 1994 season.
Enough water
Less area sown
Brings more money
Not relevant
I Distributary
4-R 3-R 11 Reasons
Head Middle Tail Overall Head Middle (75) (94) (198) (367) (21) (18)
0.0 2.1 0.5 0.8 0 .o 0 .o 0.0 0.0 0.0 0.0 0.0 0.0
0.0 0.0 0.0 0.0 0.0 0.0
100.0 97.9 99.5 99.2 100.0 100.0
Table 4.13b. Reasons for water turns sold during the Rabi 1994-95 season. I
Total 100.0 100.0 100.0 100.0 100.0 100.0 100.0 100.0
Tail (59)
1.7
0.0
0.0
98.3
Overall
99.0
The above discussion, regarding water transactions, indicated that there existed exchanging, buying and selling of irrigation water turns among farmers in the study area, during both the kharif and rabi seasons. Though the percentage of those farmers who took part in water transactions was low, it was there. Therefore, a well-designed comprehensive research on this topic is suggested to reveal the true picture as to how it affects crop production in the study area.
46

STEALING OF WATER DURING WATER TURNS
Distributary
4-R 3-R (1 Reasons 1
Sample farmers were asked to respond to the question of water stealing during their water turns. The practice of stealing water from the watercourse during somebody's water turn is not common in the study area. Yet, 2.5 percent of the sample farmers, at the 4-R Distributary, claimed that water was stolen during their water turns during the Kharif 1994 season. And the only stated reason was "dishonesty on the part of other farmers." For details see Table 4.14a. A similar type of picture is seen in Table 4.14b, according to which, during the Rabi 1994-95 season, just 1.4 percent of the sample farmers, at the 4-R Distributary, stated to have had the experience of their water being stolen.
I Table 4.14a. Reasons for water turns stolen during the Kharif 1994 season.
I, I
Influential uersons
Head Middle Tail Overall Head Middle Tail Overall (75) (94) (198) (367) (21 1 (18) (59) (98)
1.3 0.0 0.0 0.3 0.0 5.6 0.0 1 .o
II II 1 I .
NO^ relevant I 97.3 1 95.7 98.5 I 97.5 I 100.0 I 88.9 96.6 95.9
Total 100.0 100.0 100.0 100.0 100.0 100.0 100.0 100.0
Reasons
Influential persons
Dishonesty
Not relevant
Total
47
Distributary
4-R 3-R
Head Middle Tail Overall Head Middle Tail Overall (75) (94) (198) (367) (21) (18) (59) (98)
0.0' 0.0 0.0 0.0 0.0 0.0 0.0 0.0
0.0 3.2 1 .o 1.4 0.0 0 .o 1.7 1 .o
98.7 96.8 99.0 98.6 100.0 100.0 98.3 99.0
100.0 100.0 100.0 100.0 100.0 100.0 100.0 100.0

Chapter 5
INSTITUTIONAL DEVELOPMENT
No Yes
This chapter presents a discussion on the formation of Water Users’ Associations (WUAs) at the watercourse level in the study area, and the benefits, if any, drawn by respondents from various agencies, like the Agricultural Extension, the fertilizer company, the pesticide company, On Farm Water Management, the Agricultural Development Bank and the Punjab Irrigation Department. Besides, this chapter also looks into the existing status regarding organizational behavior of sample farmers.
Head Middle Tail Overall Head Middle Tail Overall (75) (94) (198) (367) (21) (18) (59) (98) 77.3 54.3 23.7 42.5 0.0 0.0 0.0 0.0 22.7 45.7 76.3 57.5 100.0 100.0 100.0 100.0
EXISTENCE OF WATER USERS ASSOCIATIONS
Data presented in Table 5.1 indicate that the majority of the sample farmers (57.5%), at the 4-R Distributary, informed about the existence of WUAs at their watercourses. It is interesting to note that the percentage of sample farmers, who informed about the existence of WUAs at their watercourses, gradually increased at the 4-R Distributary from 45.7 percent at the head reach to 76.3 percent at the tail reach. It seems that the sample farmers at the tail reach of the distributary were more organized than those at the middle and head reaches. This may be attributed of the fact that they were receiving less water and whatever quantities they received were managed efficiently. At the 3-R Distributary, WUAs were found to exist at 100 percent of the sample watercourses.
Table 5.1. Existence of WUAs at the watercourse level
4-R I 3-R II Distributary
MEMBERSHIP OF THE WUAS
To ask sample farmers about their membership in WUAs at their watercourses was quite logical. Table 5.2 reveals that, overall, 42.2 percent of the sample farmers were members of the WUAs. In the case of different reaches of the 4-R Distributary, 14.7 percent at the head, 35.1 percent at the middle and over 56 percent of the sample farmers at the tail reaches of the distributary reported their membership in WUAs at their
48

watercourse. Overall, 63.3 percent of the sample farmers indicated that they were a member of the WUA for their watercourse at the 3-R Distributary.
Table 5.2. Member of WUA at your watercourse.
Table 5.3 indicates that according to 9 percent of the sample farmers, there were up to 15 WUA members at their watercourse. About 12 percent of the sample farmers said that there were 51, or over 51, WUA members at their watercourse. Of the respondents, 16 percent pointed out that there were 16 to 30 members and 16.3 percent said there were 31 to 50 members at their watercourse in the Hakra 4-R Distributary command area. There were just a handful of sample farmers at 3-R who said that there were 51 members and above at their watercourses (1 percent). Clearly, this reflects that land at the 4-R Distributary has been fragmented into many small holdings.
Table 5.3. Number of members of WUA at your watercourse. Number of members Distributary of WUA 4-R I 3-R I
Up to 15
16 to 30 31 to 50 51 and above Do not know Not applicable
Head Middle Tail ($98)
31.9 12.7 14.6 24.7 0.0 0.0 22.2 2.7 0.0 77.3 54.3 23.7
Overall Head Middle Tail
9.3 23.9 38.9
16.0 52.3 0.0 22.1 16.3 4.8 11.2 52.6 12.0 0.0 0.0 1.7 3.8 19.0 50.0 20.3 42.5 0.0 0.0 0.0
Overall
14.2
25.5
MEMBER OF THE EXECUTIVE COMMITTEE
Table 5.4 indicates that according to 7 percent of the sample farmers at the 4-R Distributary, there were up to 3 WUA executive committee members at their watercourses. A higher percentage (37 %) of the respondents indicated that there were 4 to 6 executive committee members, whereas about 10 percent of the sample farmers pointed out that they had 7 executive committee members and above at their
49

watercourses. The same position was reflected at 3-R where 51 percent of the sample farmers said there were about 4 to 6 executive committee members at their watercourse.
Table 5.4. Number of WUA executive committee members.
executive committee
The selection of members of the executive committee is very important to run the WUA efficiently over an extended period. Different methods of selection are used here. Data presented in Table 5.5 indicate that the majority of the executive committee members were selected with consensus. A large number of WUA members (42.2%) pointed out that executive committee members were selected with consensus. About 9 percent of the sample farmers at the 4-R Distributary said the On-Farm Water Management (OFWM) nominated executive committee members. About 4 percent of them claimed that the membership of the executive committee was forced upon them by big farmers. An almost identical situation was reported by the sample farmers at the 3-R Distributary,
Table 5.5. Selection of the WUA executive committee members.
50

Usefulness of the WUA
- No
Table 5.6 gives information about the usefulness of the WUA institution. Information presented in the table indicates that the majority of the sample farmers at the 4-R Distributary found WUAs to be very useful. In the case of different reaches of the distributary, the number of respondents gradually increased from 16 percent at the head reach to 52.6 percent at the middle and to 68.7 percent at tail reach of 4-R, who affirmed that WUAs were very useful.
Table 5.6. Usefulness of WUAs.
Head M tddle Tail Overall Head M iddte Tail Overall (75) (94) (198) (367) (21) (18) (59) (98) 5.3 I 3.2 I 6.1 I 5.2 0.0 I 38.9 I 3.4 I 9.2
4-R I 3-R
~~ ~~~
Disfributary
When checked about "how WUAs were useful?" many of them were of the view that they were useful for purposes such as lining of the watercourses, reducing water losses and improving maintenance of the watercourses. Table 5.7 reveals that about 32 percent of the sample farmers at the 4-R Distributary were of the view that WUAs were useful in lining their watercourse, while 6.5 percent were of the opinion that WUAs were helpful in reducing water losses. About 11 percent of the respondents were of the opinion that WUAs were useful in lining of watercourses and reducing water losses as well. Of those who pointed out the usefulness of WUAs at 3-R, 50 percent said that WUAs were very useful in lining of their watercourses, whereas about 17 percent pointed out that WUAs were quite useful in reducing water losses.
Table 5.7. How a water users association is useful.
reduce losses
51
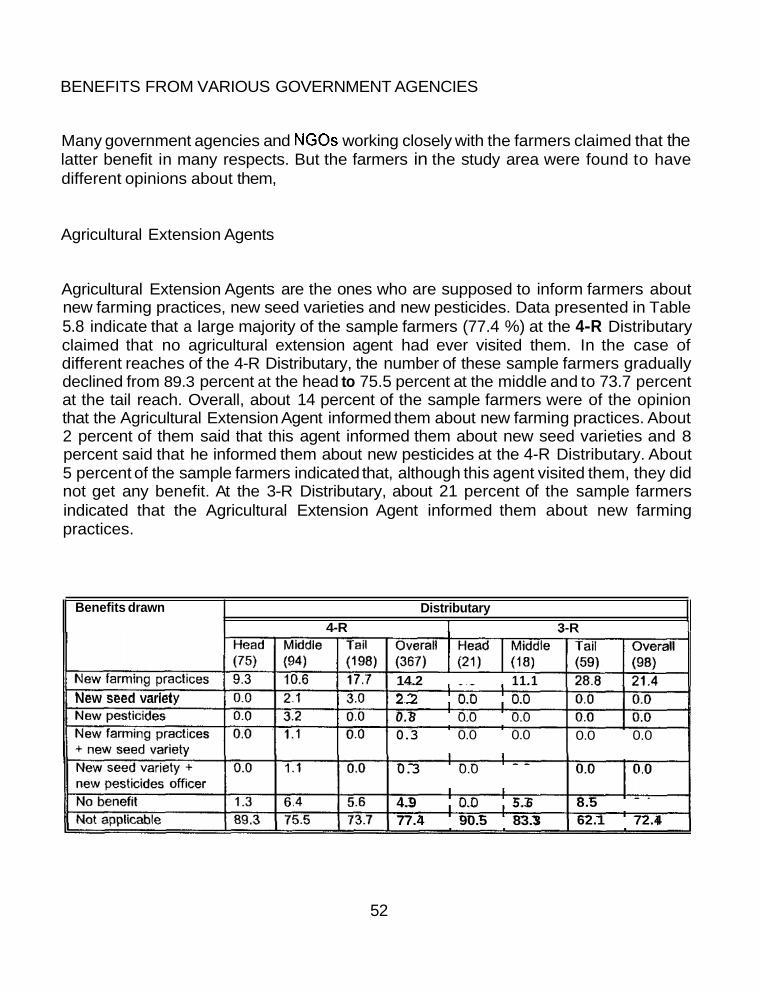
BENEFITS FROM VARIOUS GOVERNMENT AGENCIES
Benefits drawn
Many government agencies and NGOs working closely with the farmers claimed that the latter benefit in many respects. But the farmers in the study area were found to have different opinions about them,
Distributary 4-R I 3-R I
Agricultural Extension Agents
Agricultural Extension Agents are the ones who are supposed to inform farmers about new farming practices, new seed varieties and new pesticides. Data presented in Table 5.8 indicate that a large majority of the sample farmers (77.4 %) at the 4-R Distributary claimed that no agricultural extension agent had ever visited them. In the case of different reaches of the 4-R Distributary, the number of these sample farmers gradually declined from 89.3 percent at the head to 75.5 percent at the middle and to 73.7 percent at the tail reach. Overall, about 14 percent of the sample farmers were of the opinion that the Agricultural Extension Agent informed them about new farming practices. About 2 percent of them said that this agent informed them about new seed varieties and 8 percent said that he informed them about new pesticides at the 4-R Distributary. About 5 percent of the sample farmers indicated that, although this agent visited them, they did not get any benefit. At the 3-R Distributary, about 21 percent of the sample farmers indicated that the Agricultural Extension Agent informed them about new farming practices.
New seed variet 14.2 11.1 2.2 0.0 0.0 0.8 0.0 0.0 0.3 0.0 0.0
0.3 0.0
4.9 0.0 5.6 77.4 90.5 83.3
0.0 0.0
8.5 62.1 72.4
52

Fertilizer Company Agent
Benefits drawn
Table 5.9 indicates that a large majority (about 98%) of the sample farmers had no contact with the fertilizer company agent. Just 0.5 percent of the respondents at 4-R said that the fertilizer company agent visited and informed them about their land fertility and recommended a particular type of fertilizer best suited to their land. The same percentage of them indicated that they were informed about a new fertilizer. The situation seemed very poor when talking about the fertilizer company agent with the respondents. The other side of the picture is that the fertilizer company agents seem very active in the area and claimed that they were visiting farmers and disseminating information about new fertilizers to boost agricultural production in the area.
Distributary 4-R I 3-R
Land fertility New fertilizer
Head Middle Tail Overall Head Middle Tail Overall
1.3 0.0 0.5 0.5 0.0 0.0 0.0 0.0 2.7 0.0 0.0 0.5 4.8 0.0 0.0 1 .o
(75) (94) (198) (367) (21) (18) (59) (98)
No benefit I 4.0 1 0.0 1 0.5 I 1.1 I 0.0 I 5.6 I 0.0 I 1.0 Not applicable I 92.0 1 100.0 I 99.0 I 97.8 I 95.2 I 94.4 1 100.0 I 98.0
Pesticides Company Agent
The study area is famous for growing cotton. That is why many pesticide company agents are commonly seen at the dealer's shop and frequently visiting the farmer community. Yet, the majority of the sample farmers (78.5 %) at the 4-R Distributary claimed that no company agent had ever visited them till the beginning of this survey. According to Table 5.10, 12 percent of the sample farmers said that the pesticide company agent visited them and made them aware of the pest attacks. For the last three years, this cotton belt in southern Punjab has been badly affected by a virus attack adversely affecting the cotton crop. Some farmers have shifted to other alternatives. But those who still persisted in growing cotton were unable to earn even what they had invested. About 10 percent of the respondents pointed out that they were benefited by the pesticide company agents as they introduced better pesticides to control pests. Almost the same kind of response was received from sample farmers at the 3-R Distributary.
53

Table 5.10. Benefits from the pesticide company agent.
Benefits drawn
On-Farm Water Management Representative
The Punjab Agriculture Department started a project called "On-Farm Water Management" (OFWM) for the purpose of lining of watercourses in the Punjab Province to arrest water losses and increase crop production. The organization functions under a Director General and the representatives are found all over the Punjab Province. In the study area, though they have managed to reach many farmers, a large majority (85.2 %) of the sample farmers were found waiting for the OFWM representative at the 4-R Distributary. Table 5.1 1 indicates that 12.5 percent of the sample farmers said that their watercourses were lined by the OFWM team. About 2 percent of the respondents pointed out that the OFWM officials did visit them but that they did not get any kind of benefit from them. A higher percentage of sample farmers (18.4 %) at 3-R than at 4-R indicated that their watercourses have been lined by the OFWM officials. This looks somewhat contrary, as 100 percent of the sample farmers are said to be members of a WUA.
Table 5.1 1. Benefits from the OFWM representative.
Mobile Credit Officer
The presence of mobile credit officers (MCO) was found negligible in the study area. Data presented in Table 5.12 indicate that, overall, 97 percent of the sample farmers had
54

said that no MCO had ever visited them at the 4-R Distributary. According to the table, 2.5 percent of the respondents pointed out that a MCO did visit them and offered them loans. A similar kind of information was conveyed by the sample farmers at the 3-R Distributary.
Benefits drawn Distributary A-R L %I2
Good advice Got loan
I
No benefit I 0.0 I 1 . 1 I 0.5 I 0.5 I 0.0 I 0.0 I 1.7 I 1.0 Not applicable I 100.0 I 93.6 I 97.5 I 97.0 I 95.2 I 100.0 I 94.9 I 95.9
., .. . .. Head Middle Tail Overall Head Middle Tail Overall
0.0 0.0 0.0 0.0 0.0 0.0 0.0 0.0 0.0 5.3 2.0 2.5 4.8 0.0 3.4 3.1
(75) (94) (198) (367) (21) (18) (59) (98)
The Punjab Irrigation Department (PID) Representative
Data presented in Table 5.13 reveal that about 20 percent of the sample farmers at the 4-R Distributary indicated that the PID representative often visited them. But the pity was that he did not offer any benefit to them; on the other hand, whenever such a situation arose, they (sample farmers) had to offer them good food and fulfilled their demand regarding an undue share from their crop produce. They supplied more canal water through outlet tampering because of these unfair deals. The situation at 3-R was not different from that at 4-R at all.
Benefits drawn Distributary
55

WATERLOGGING AND SALINITY
Two menaces, waterlogging and salinity. responsible for low crop yields and production, were observed in the study area. Besides, local groundwater was noticed as unfit both for drinking and for irrigation purposes. In this section, the quality of groundwater and measures to check waterlogging and salinity are discussed.
Data presented in Table 5.14 contain information about the quality of underground water. Overall, about 26 percent of the sample farmers claimed that groundwater was found fit for irrigation purposes. Over 28 percent of the respondents at the 4-R Distributary indicated that groundwater was marginally fit for irrigation. whereas a little less than half of the sample farmers (46 %) pointed out that groundwater, in their area, was absolutely unfit for irrigation purposes. It was observed during the survey that where groundwater was unfit for drinking and irrigation purposes, villagers stored canal water in a big pond and then pumped the water when needed. In these areas, special warabandi times have been sanctioned to supply canal water for drinking and for other petty purposes. This stored water is also used by the animals of the villagers. To keep human beings in good health and for them to be productive, it is necessary that villagers are provided with water free of salts and germs which are injurious to health.
Table 5.14. Quality of groundwater.
Table 5.15 contains information about the measures adopted by the sample farmers to control waterlogging. According to Table 5.15, the use of gypsum, tree plantation, rice cultivation, field leveling and farm yard manure (FYM) were the main methods used by the sample farmers. Overall, at 4-R Distributary, about 32 percent of the respondents used gypsum, about 19 percent used tree plantation as a method, and about 25 percent indicated that they cultivated rice crops to control waterlogging and salinity as well. About 55 percent of the sample farmers pointed out that they leveled their fields and still about 25 percent of the respondents claimed that they used FYM as a measure to control waterlogging. As measures for controlling waterlogging, sample farmers at the 3-R planted trees (38.7 %) and cultivated rice crops (32.3 %) in their fields.
56
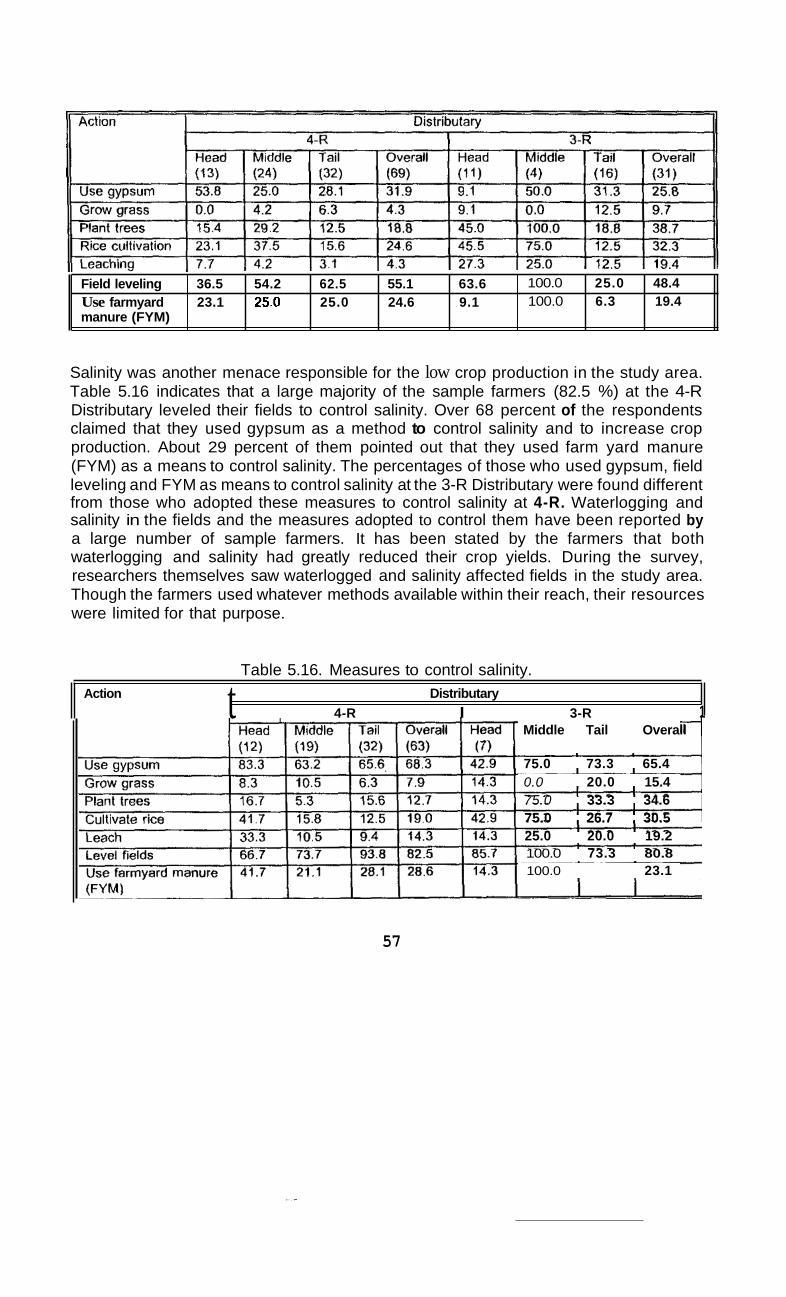
Field leveling 36.5 54.2 62.5 55.1 63.6
manure (FYM) Use farmyard 23.1 25.0 25.0 24.6 9.1
Salinity was another menace responsible for the low crop production in the study area. Table 5.16 indicates that a large majority of the sample farmers (82.5 %) at the 4-R Distributary leveled their fields to control salinity. Over 68 percent of the respondents claimed that they used gypsum as a method to control salinity and to increase crop production. About 29 percent of them pointed out that they used farm yard manure (FYM) as a means to control salinity. The percentages of those who used gypsum, field leveling and FYM as means to control salinity at the 3-R Distributary were found different from those who adopted these measures to control salinity at 4-R. Waterlogging and salinity in the fields and the measures adopted to control them have been reported by a large number of sample farmers. It has been stated by the farmers that both waterlogging and salinity had greatly reduced their crop yields. During the survey, researchers themselves saw waterlogged and salinity affected fields in the study area. Though the farmers used whatever methods available within their reach, their resources were limited for that purpose.
100.0 25.0 48.4 100.0 6.3 19.4
Table 5.16. Measures to control salinity. Action Distributary t 4-R I 3-R 1
Middle Tail Overall
75.0 73.3 65.4 0.0 20.0 15.4 75.0 33.3 34.6 75.0 26.7 30.5 25.0 20.0 19.2 100.0 73.3 80.8 100.0 23.1
57

ORGANIZATIONAL BEHAVIOR
This section covers the existing organizational behavior of the sample farmers in the study area. Specifically, respondents' organizational behavior regarding the following has been examined: maintenance or construction of the village mosque, the school, the streets, the drinking water ponds for people and animals, and the attitude toward solving land and water disputes,' marketing of crop produce, purchase of inputs, and maintenance of the watercourse and the distributary.
The organizational behavior literally means the tendency of farmers to organize themselves on certain issues, whether it is the construction of the village mosque, or the maintenance of the watercourse, or the purchase of inputs collectively. Exploration of organizational behavior of farmers seems, therefore, very important, if farmers could organize on an issue beneficial to them.
Data presented in Table 5.17 reveal that there existed an organizational behavior among the sample farmers. This behavior was quite obvious at 4-R on two issues (i.e., the maintenancelconstruction of the mosque and the maintenance of the watercourse). Ninety four percent of the farmers were of the view that they participated in the maintenance or construction of the village mosque. To them, they participated by sharing either the funds, according to their resources, or provided labor for that purpose. The next important issue was that of maintenance of the watercourse. Table 5.17 indicates that about 90 percent of the respondents affirmed that they participated in watercourse maintenance, mostly through sharing labor. Here, the role of On Farm Water Management (OFWM) officials appeared very important.
The other important issue was maintenance or construction of a village drinking water pond. This was very important as it related to people's health. About 41 percent of the sample farmers were of the view that they participated in the maintenance or construction of the village drinking pond.
The sample farmers also cooperated in the maintenance or construction of the village school. Village schools beyond primary level were hardly noticed in the study area, during the survey, particularly for girls. Boys, as well as, girls traveled long distances if they wanted to have an education beyond the primary level. So, whatever the school standard, the farmers used to participate in the construction of the school, either providing funds or donating a piece of land, or sharing labor. About 42 percent of the sample farmers at the 4-R Distributary stated that they participated in the maintenance or construction of the village school.
Regarding land and water disputes, about 35 percent of the sample farmers agreed that most of the disputes were settled within the premises of their village by the intervention
58

of the village elders. It was rare to find villagers having recourse to the police or to the courts of law. It only happened when things got beyond the village elders’ control.
As far as maintenance of the distributary was concerned, Table 5.17 indicates that about 20 percent of the sample farmers participated in the maintenance of the distributary, 4-R Haroonabad. Here, they shared labor with other farmers to desilt the 4-R Distributary, whenever they were called by the government agency. They also participated by sharing labor whenever there was a cut or breach in the distributary.
A very low percentage of sample farmers (1.9%) claimed that they purchased inputs collectively, such as fertilizers, pesticides, etc. Collective marketing of crop produce was rarely reported. Just 0.3 percent of the sample farmers at the 4-R Distributary pointed out that they sold their crop produce collectively. An almost similar situation was noticed at 3-R, when organizational behavior of the sample farmers was explored.
Table 5.1 7. Existing status of organizational behavior.
From the findings, it seems that there exists an organizational behavior among the sample farmers in the study area. Issues like maintenance of the watercourse and maintenance or construction of the village mosque seem very important; in both of the cases, over 90 percent of the sample farmers participated, either by way of providing funds, or by sharing labor, or both. They seem to treat water, a scarce resource in the project area, as important as a sacred place like the mosque. Looking at other issues, like the maintenance of the village school, the drinking water pond, and solving land and water disputes, one gets the impression that a definite organizational behavior had existed among the farmers in the study area. They can again be united on an issue, e.g., at the distributary level, if they feel it to be in their own interest.
59

I Chapter 6
I AGRONOMIC PRACTICES, FARM OUTPUT, LIVESTOCK AND INCOME
, This chapter deals with crops, livestock and production activities of the farmers in the study area. Farm output (yield), livestock inventory, abiana (water charges) and mean approximate income of sample farmers, from all sources, are also given in detail in this chapter.
I The main crops grown in the study area are cotton, wheat, sugarcane and rice, as well as fodder during the kharif and rabi seasons. Information about crops, farm production and input use is discussed in the following subsections. i
I COTTON CROP
Cotton is a very well-known cash crop and a major source of foreign exchange earnings through export. Being situated in the arid zone of the southern Punjab, the study area is best known as the cotton belt and the majority of the farmers grow cotton on a large area during the kharif season! Table 6.1 presents agronomic practices of the sample farmers and yields for cotton. It has already been reported that a large majority of the sample farmers were small farmers who owned less than 12.5 acres of land and depended upon a subsistence level of farming. Overall, the mean area sown under cotton, as reported by the sample farmers, was 6.79 acres at the 4-R Distributary. The mean area under cotton decreased gradually from 9.1 1 acres at the head reach to 6.99 acres at the middle and to 5.94 acres at the tail reach of the distributary. The significant difference in the area under cotton in the various reaches of the distributary clearly reflects that sample farmers at the head reach of the distributary, somehow, managed to obtain more irrigation water for their cotton crop, whereas those at the tail reach resorted to keeping their land fallow after putting some fields under crops.
At the 4-R Distributary, the mean area destroyed due to pest attack was reported as 0.69 acre. On average, about 5 kg of the cotton seed was used per acre by the sample farmer, whereas the average price received by the farmers, per 40 kg of cotton, was reported to be around Rs 843.
Including expenditures on important inputs like fertilizers and plant protection (the main portion of total expenditures), sample farmers at the 4-R Distributary reported an average expenditure of Rs 2,629 per acre. The main outlay was reported on pesticide sprays. It was reported that, on average, Rs 1,290 has been spent on pesticide sprays for crop protection by the sample farmers.
60

Table 6.1 indicates that, overall, the average cotton yield, as reported by the farmers at the 4-R Distributary, was 9.24 maunds (37.5 kg) per acre. In the case of different reaches, sample farmers are reported to have a higher yield at the tail reach (1 1.36 maunds) compared to 6.4 maunds per acre at the head reach. This means that the sample farmers at the tail of the distributary looked more progressive, hard working and receptive to new farming practices than those at the head reach.
Table 6.1. Agronomic practices and cotton yields.
Cotton
ii) Values in the boxes are averages. 1 rnaund=37.5 kg.
WHEAT CROP
The second main crop grown in the study area is wheat during the rabi season. Being the main staple food, the wheat crop is always grown on a large area in Pakistan compared to any other crop. In the study area, overall, the mean acreage under wheat was reported as 7.48 acres. Table 6.2 reveals a higher mean acreage under wheat at the head reach (9.10 acres) which decreased to 6.5 acres at the tail reach. Again, it is the shortage of irrigation water at the tail reach that forced farmers to sow wheat on a lesser area than the farmers at the head reach, who were able to manage obtaining irrigation water for their crops.
Though the seeds used and expenditures per acre by the sample farmers at different reaches seemed the same, the yields for wheat per acre was again found higher at the
61

tail reach than at the head and middle reaches. Wheat yields gradually increased from 19.7 maunds per acre at the head reach to 27.9 maunds per acre at the tail reach. Clearly, this shows and confirms that farmers at the tail reach worked hard and were progressive.
At the 3-R Distributary, the mean area under wheat at the tail reach was 6 acres, which was less than 50 percent of the mean area sown under wheat at the head reach (14.39 acres). But the sample farmers at the head reach invested more per acre and had 32.4 maunds of wheat yield per acre, much more than that at the tail reach (25.9 maunds). This reflects that farmers at the head reach of the 3-R Distributary seemed better workers than those at the tail reach or could better afford agricultural inputs, or because of better access to water it w p more worthwhile to invest in additional inputs.
Table 6.2. Agronomic practices and wheat yields.
ii) Values in the boxes are averages. 1 rnaund = 37.5 kg.
RICE CROP
Rice is another staple food of the Pakistani people, but it is grown in areas where underground water is fit for irrigation and is abundantly available. The best area for rice, a kharif crop, is the central Punjab, in the districts of Gujranwala. Sheikhupura, Hafizabad, Sialkot and Lahore. Rice is also grown in large parts of the upper Sindh Province where there is no shortage of water.
62

Table 6.3. Agronomic practices and rice yields. Distributary
Rice 4-R I 3-R
Yield/acre (rnaund)
Area destroyed 0.13 0.09 0.68 (acres) Seed usedlacre 4.58 4.27 4.67 (kg) Price per40 kg 161.4 155.8 174.3 (Rs)
expenditure/ Total 1505 2299 2013
23.63 18.65 32.60 25.03 30.38 30.62 14.75 26.58
(Rs) Pesticides 350 444 expenditure/ acre (Rs) I I
- 904
- 414
163.7 161.0
1360
643
314
3 166.9
In the study area, as irrigation water is deficient compared to the crop requirement, while underground water is saline, rice crops were reported by only a few farmers. According to Table 6.3, overall, 57 sample farmers from the 4-R Distributary reported that they have grown rice crops during the Kharif 1994 season. Overall, more than double the number of farmers at the head reach (31 farmers) of the 4-R Distributary reported rice crops on their fields than those at the tail reach (1 5 farmers). Also, the mean area under rice gradually decreased from the head reach (3.69 acres) to the tail reach (2.18 acres) of the 4-R Distributary. It was interesting to note that whatever crops the farmers at the tail reach of the 4-R Distributary cultivated, they spent more on fertilizer and pesticides per acre and received rewards in the form of a higher crop yield than those at the head reach.
Information presented in Table 6.3 reveals a different picture at the 3-R Distributary. The sample farmers at the head reach of the distributary had an outlay per acre much more than those at the tail reach and, therefore, received a higher rice yield.
,
63

SUGARCANECROP
Besides cotton, sugarcane is 'also considered as another cash crop. Although better known as the cotton belt, sugarcane is also grown on a limited area. In most of the cases, using indigenous technology, farmers manufactured gur or brown sugar from sugarcane and many farmers supplied sugarcane to the nearby sugar mills. Data presented in Table 6.4 indicate that, overall, the mean area under sugarcane reported by the sample farmers at the 4-R Distributary was 2.90 acres. A larger number of sample farmers at the tail reach (41 farmers) than that at the head reach (8 sample farmers) reported growing sugarcane. The total outlay per acre of sugarcane by the sample farmers at all reaches was found almost identical, but farmers at the tail were getting a significantly higher sugarcane yield (498 maunds per acre) than those at the head reach (230 maunds per acre).
At the 3-R Distributary, 19 sample farmers reported having grown sugarcane in their fields, 11 farmers at the head, 6 at the middle and just 2 at the tail reach. The sample farmers at the tail reach, though in very small numbers, invested more and then received a higher sugarcane yield per acre than those at the head reach. Overall, sample farmers at the 4-R Distributary had a higher sugarcane yield (430 maunds per acre) than those at the 3-R Distributary (387 maunds per acre).
Table 6.4. Agronomic practices and yields for sugarcane.
Sugarcane 4-R I ?.R
Distributary
I I I I I I I I Fertilizer expenditure/ 795 1012 902 928 1334 973 890 1173 acre fRs\ Pesticides 344 159 231 219 444 125 438 343 expenditurelacre (Rs) Yieldlacre (maund) 1422 772 866 894 324 1131 800 629
Note: i) Values in parentheses are the number of reporting respondents. ii) Values in boxes are averages.
1 rnaund = 37 5 kg.
64

KHARIF FODDER
Farmers have to set aside some area to grow fodder in order to feed their animals. During the kharif season, fodder crops such as sorghum and millet are commonly grown. Besides, farmers also grow maize as a fodder crop, which is also now treated as a staple food and is commonly eaten by people in the northern areas of Pakistan and in the Azad State of Jammu and Kashmir. Table 6.5 indicates that, overall, the mean area under kharif fodder as reported by the sample farmers at the 4-R Distributary was 2.04 acres. In the case of different reaches of the 4-R Distributary, the area under kharif fodder increased from a mean of 1.46 acres at the head reach to a mean of 2.19 acres at the tail reach. Though the sample farmers at the head reach of the 4-R Distributary were making more investments that those at the tail reach, sample farmers at the tail reach are reported to have a higher mean value (Rs 3,896) than the farmers at the head reach (Rs 3,590) per acres. Overall, no significant difference was observed in the reported kharif fodder value by the sample farmers at the 4-R and 3-R Distributaries.
RABl FODDER
During the rabi season, berseem is commonly grown in the study area. Farmers reported 4 to 5 cuttings of berseem in the winter season, as it multiplies itself. Farmers use fertilizer that helps in growing berseem fodder rapidly. According to Table 6.6, on average, about 1 acre was earmarked for rabi fodder by the sample farmers at the 4-R Distributary. The total expenditure was calculated as Rs 1,029 per acre, whereas a major portion of the expenditure was on fertilizer use. The mean value per acre, as reported by the sample farmers at the 4-R Distributary, increased from Rs 6.008 at the head reach to Rs 7.026 at the tail reach.
In the case of the 3-R Distributary, the mean value per acre of rabi fodder was found different from the mean value of rabi fodder at the 4-R Distributary. It decreased from Rs 14,343 per acre at the head reach to Rs 7,390 at the tail reach of the 3-R Distributary.
65

Table 6.5. Agronomic practices and values for kharif fodder.
,?xpendilure acre
ii) Values in boxes are averages.
Table 6.6. Agronomic practices and values for rabi fodder.
ii) Values in boxes are averages.
66

CROPPING INTENSITY
Head Middle
Tail
Cropping intensity is the ratio of the area under crops for each season during the year to the cultivable area operated by the farmer. It is presented as a percentage. Information given in Table 6.7 reveals that, overall, the cropping intensity was 122 percent at the 4-R Distributary. In the case of different reaches of the distributary, the cropping intensity was found higher at the head reach (147 %) compared to the middle (144 %) and the tail (97 %) reaches. Where the water supply was reported sufficient and reliable, the cropping intensity was also found higher. This is true for both of the distributaries. The cropping intensity was found higher at the head reach and it gradually decreased at the middle and tail reaches. Overall, the cropping intensity was found higher at 3-R (135 %) than at to 4-R (122 %).
--.-, -~
4-R 3-R CI % CI %
147 (75) 167 (21)
97 (198) 1 1 1 (59) 144 (94) 128 (18) -
Table 6.7. Cropping intensity. It Location I Distrihiitarv II
. , . ~ - , Overall I 122 (367) I 135 (98)
Note: Values in parentheses are the number of respondents.
FACTORS AFFECTING INCREASED CROP PRODUCTION
There are many factors responsible for increases in crop production (Table 6.8). More water and ensured water supply were reported to be the most important of these factors. The sample farmers were asked to rank factors they considered important for increasing crop production. Sixty four percent of the respondents at the 4-R Distributary and about 65 percent of the sampled farmers at the 3-R Distributary ranked "more canal water supply" as the most important factor that can help in increasing crop production. About 23 percent of the respondents at 4-R ranked "ensured canal water su~pply" as the most important factor. A large number of respondents ranked "availability of good quality seed" and "timely availability of chemical fertilizer" as second and third priorities in order of importance. A good number of the sample farmers ranked "availability of quality pesticideslinsecticides" as the third priority factor that would help increase crop production.
67

LIVESTOCK
Livestock is an important source of power and income for the farmers. Bullocks, camels, horses, and donkeys are considered as the prime sources of power, while cows, buffaloes, sheep, goats and poultry are the good sources of farmers' income. Among livestock, bullocks, cows, camels, buffaloes, sheep, goats, donkeys, horses and poultry were reported at the sample farm households. Data presented in Table 6.9 indicate the mean number of bullocks as 1.14 at the 4-R Distributary. Cows and buffaloes were raised for milk production. The mean number of cows reported was 0.89 at 4-R. The mean number of buffaloes were found to be around 3 at both distributaries, The mean number of goats ranged from 2.93 at 4-R to 3.52 at 3-R. Overall, the mean number of poultry birds was found as 8.37 at the 4-R Distributary.
Table 6.9. Mean number of respondents for livestock.
** Shows Analysis of Variance (ANOVA) significant at 0.002 level.
68

WATER CHARGES
Mean total abiana paid (Rs) Mean total area operated (acres) Mean per acre total abiana (Rs)
Table 6.10 contains information about mean abiana (water charges) per acre as well as mean total abiana in the study area. The mean total abiana was calculated to be about Rs 860 at 4-R, while for 3-R, it was calculated to be about Rs 1,060. As far as mean abiana per acre was concerned, it was found to be R s 65 per acre at 4-R and about Rs 57 per acre at 3-R. That seemed very close to the actual abiana paid by the farmers per acre on average. Information collected from the Irrigation Department seems enough for raising one's eyebrows. To them, water charges when compared to the maintenance cost of the water channels was very nominal. Since independence, the raise in abiana may not have been more than 10 times, but the maintenance cost had gone up by more than 100 times as reported by the officials of Irrigation Department. This meager amount, collected in the form of water charges, was not sufficient to maintain the water channels properly, these officials said.
4-R (348) 3-R (93) 860.4 1060.2 13.25 18.52 65.0 57.3
Income Distributary ._
I 3-R
Farm income I 77554 I 83583
Livestock income (Rs) Off-farm labor income (Rs) Remittances Income from 5575 2923 other job I Total income I 212027 I 100524 from all I I sources I
Note: Values in parentheses a
-
Tail Overall Head Middle Tail Overall (198) (367) (21) (18) (59) (98) 77303 78963 261009 131016 50197 110216
69

INCOME LEVELS
Asking questions about income is very simple and easy, but to get the correct answers is very tedious, particularly from illiterate respondents. What was obtained serves only as an approximation. Overall, as shown in Table 6.11, the mean farm income of the respondents at the 4-R Distributary was Rs. 78,963, which was found lower than the mean farm income of the respondents at the 3-R Distributary. The mean income from livestock and remittances of the respondents at the 4-R Distributary were Rs 4,497 and Rs 2,698, respectively. Overall, the mean income of the sample farmers at the 4-R Distributary, from all sources, was estimated as Rs 120,817, whereas it was Rs 135,995 at the 3-R Distributary. The overall mean incomes from any source and the total income from all sources showed no significant difference, when Analysis of Variance (ANOVA) was run.
70

Chapter 7
SUMMARY
BACKGROUND
The Fordwah Eastern Sadiqia (South) (FESS) Phase I Irrigation and Drainage Project envisages raising agricultural production by a two-pronged approach. First of all, improved irrigation management practices will be employed to reduce the inequitable distribution of irrigation water by all of the actors (including the users), followed by providing more reliable water supplies to farmers. Secondly, the grouindwater levels will be lowered, using a combination of subsurface, intercepter and surface drains so that salts can be more readily leached from the root zone.
IIMI-Pakistan designed a pilot study to be undertaken in the FESS Project area at Hakra 4-R Haroonabad Distributary: on the participation of farmers’ organizations in the operation and maintenance of the irrigation system to support project activities related to improved irrigation water management. The baseline survey was conducted by the IIMI-Pakistan research team, as a starting point of an action research program of the pilot study, to obtain firsthand information about the socio-economic conditions of the water users to devise a base for planning, as well as define directions and strategies for the future.
For this purpose, the watercourse sample sites were selected by applying a stratified random sampling technique. Hakra 4-R Distributary was stratified into head, middle and tail sections. Then by using the simple random sample technique, 13 watercourses were selected. For control purposes, on an adjoining distributary (i.e., Hakra 3-R), four watercourses were selected, also, using the simple random sample technique. Overall, 465 farmers were interviewed, 367 at Hakra 4-R Distributary and 98 at Hakra 3-R Distributary.
GENERAL CHARACTERISTICS OF THE SAMPLE FARMERS AND FARMS’
Overall, the mean number of family members per household at the sample watercourses was found to be 8.8 at Hakra 4-R; in the working-age group (i.e., between 15 years and less than 65 years of age) the mean number of both males and females at the head, middle and tail reaches were 5.3, 4.9 and 5.1, respectively. The overall mean numbers of family members of the Hakra 3-R Distributary was 7.8.
+
’ Many of the numbers listed in this chapter have been rounded off compared with the values listed in the previous chapters.
71

*
t
*
*
t
Overall, the mean age of the respondents at 4-R was found to be 49 years, while the mean age of the sample farmers was calculated as 45 years at the 3-R Distributary.
On average, respondents at 4-R had an irrigation agriculture experience of 28 years. At the 3-R Distributary, the corresponding mean value was found to be 23 years.
Overall, the local respondents were found to be about 20 percent while the rest of the sample farmers were either settlers or migrants at the 4-R Distributary. Migrants were in the majority at both the distributaries, but the percentage (61%) of migrant respondents .was higher at 4-R than at the 3-R Distributary (54 %).
Overall, Jat, Rajput and Arian respondents were about 80 percent at the 4-R Distributary, when combined together. There existed some other castes, like Awan, Malik and others, but they were in small numbers. At the 3-R Distributary, Arain families were commonly found and were concentrated at the head and tail reaches of the distributary.
The majority of the respondents were found illiterate at the 4-R Distributary (62 percent). Sample farmers, having an education below matricuilation constituted about 34 percent, whereas there were just 5 percent who were educated above matriculation. Almost the same situation was found prevailing at the 3-R Distributary.
The mean number of school-going children of the respondents at 4-R was 1.9, At the 3-R Distributary, the corresponding number was 1.6. The mean number of males engaged full-time in agriculture was higher than that of females. Overall, the mean number of family members, in respondents’ households, working full-time in agriculture at the 4-R Distributary was found to be 2.0, whereas the corresponding number at the 3-R Distributary was 1.6.
Females of the working-age group were commonly involved in agriculture on a part-time basis as they have to do other chores in their houses. Males of age group 5 years and less than 15 years were also found engaged part-time in agriculture. The mean number of family members engaged part-time in farming at 4-R (1.98) was a little higher than at the 3-R Distributary (1.78).
The majority of the sample farmers (56%) owned up to 5 acres of land on the 4-R Distributary. Overall, there were about 83 percent having landholdings below the subsistence level. About 12 percent had landholdings from 12.6 acres to 25 acres, while 6 percent of the total sample farmers owned 25.1 acres and above at 4-R. The respondents who owned holdings up to 5 acres at 3-R were found to be about 44 percent.
72

The mean total area operated was about 13 acres at 4-R and about 18 acres at the 3-R Distributary. The mean area owned by the sample farmers was 8.3 acres at 4-R while it was 12.4 acres at the 3-R Distributary. In both cases, the mean total operated area was found higher at the head reach than at the tail reach.
The majority of the respondents (51%) were the owners of land at the 4-R Distributary. The number of tenants constituted about 16 percent, while the number of owners-cum-tenants was around 33 percent. An almost identical picture of owners, tenants and owners-cum-tenants was observed at the 3-R Distributary.
The number of respondents who had tractors was about 17 percent on the 4-R Distributary. The number of tubewell owners was only 11.7 percent. The percentage of sample farmers who owned tractors and the allied implements was found higher at 3-R than at the 4-R Distributary. This may be because the percentage of landowners with large landholdings was less at 4-R than at 3-R.
*
*
IRRIGATION PRACTICES AND WATER MANAGEMENT
t The majority of the farmers had canal water as a source of irrigation at the 4-R Distributary. About 43 percent of the sample farmers, each at the middle and tail reach of 4-R, used some other water sources like a tubewell or they purchased canal water from others, who had surplus water or canal water allocated to them for some other purposes (for gardening, drinking water ponds, or drinking water ponds for animals, etc.). An almost identical situation was found at the 3-R Distributary.
A large majority of the farmers (80%) at the 4-R Distributary were of the view that canal water fulfilled the crop water requirements only to some extent. About 4 percent of sample farmers, at the 4-R Distributary, pointed out that canal water did not fulfill their crop water requirements at all.
*
About 15 percent of the sample farmers said that canal water fulfilled the crop requirement to a large extent. It seems that farmers at the head of the distributaries, particularly at 3-R. are making up any canal water deficiency, while a majority of the farmers at the middle and tail reaches were fulfilling the water requirement through supplementing water from tubewells (owned) or purchased water from others.
*
'1
Overall, 54 percent of the sample farmers at the 4-R Distributary kept their land fallow, in case of canal water deficiency. About 28 percent of the respondents were of the view that they used "less number of irrigations" as one of the methods to overcome water deficiencies. Overall, about 7 percent of the sample farmers
73

t
*
said that once they cultivated the soil, they started waiting for rain as there was not enough water for irrigation. A similar trend was observed at the 3-R Distributary.
Over 93 percent of thd sample farmers used the basin method to irrigate their crops.
On average, about 26 minutes were allocated to sample farmers to irrigate one acre of land on the 4-R Distributary. The average time allocated (as reported by the sample farmers) for irrigation was found higher (24 minutes) at 4-R than at the 3-R Distributary (24 minutes). On average, about 132 minutes were required to irrigate one acre on the 4-R Distributary. Not much difference was found in the time required for irrigating one acre at different reaches of 4-R. At 3-R, the time required to irrigate one acre ranged from about 100 minutes at the head reach to 130 minutes at the middle and to about 134 minutes at the tail reach.
When comparing the time allocated to irrigate one acre (about 25 minutes) with the time required to irrigate one acre (about 130 minutes), the implication is that farmers can only irrigate each bunded unit (basin) once in every five warabandis, which would be once every five weeks. Farmers’ perceptions on this issue appear to be unrealistic.
Over 93 percent of the sample farmers at 4-R were of the view that canal water was not sufficient for crops. In terms of different reaches of the 4-R Distributary, no difference was observed in this view. The same trend was observed among the sample farmers at 3-R.
During the Kharif 1994 season, water was deficient at the time of sowing and harvesting. About 30 percent of the sample farmers at the 4-R Distributary said that water was in acute shortage in June of Kharif 1994. and about 22 percent of the sample farmers were of the view that distributary water was in acute shortage in July. And again, canal water was in acute shortage at the time of harvesting the kharif crop (i.e., September). The number of those who were of the opinion that canal water was in acute shortage in June during Kharif 1994 season was a little higher at 3-R than at the 4-R Distributary,
Around 84 percent of the sample farmers at the 4-R Distributary, as against about 80 percent of the sample farmers at 3-R, were of the view that canal water was in acute shortage during the Rabi 1994-95 season.
About 22 percent of the sample farmers at 4-R were of the view that distributary water was in acute shortage in December, during the Rabi 1994-95 season. Over 17 percent had the same view about January. Insufficiency of water was also
74

noticed by 13 percent of the sample farmers during November, and about 11 percent of them claimed that water was in acute shortage in February. At the 3-R Distributary, a higher percentage of the sample farmers (25%) claimed that water was in acute shortage during January.
About 26 percent of the sample farmers at the 4-R Distributary were of the opinion that the present distribution system of canal water was not satisfactory at all. Those who showed dissatisfaction with the present distribution system of canal water at the 3-R Distributary ranged from zero percent at the middle to 28.8 percent at the tail reach.
The majority of the sample farmers (69Y0) at the 4-R Distributary were of the opinion that the government agency was the one that could improve the present distribution system of canal water. About 12.5% of the respondents who were not satisfied with the present system of water distribution reported that farmers organizations at the distributary level could improve this situation.
*
IRRIGATION SYSTEM PERFORMANCE
t About 45 percent of the sample farmers at the 4-R Distributary were of the view that water between the distributaries was not equally distributed, while about 52 percent of the respondents answered the other way. At the 3-R Distributary, about 30 percent of the respondents indicated that water was not equally distributed between the distributaries of the Hakra Branch Canal.
About 23 percent of the sample farmers (about half of those who stated that unequal distribution of irrigation water existed) were of the view that influential persons always received more water in their distributaries. A lesser percentage of the respondents at the 3-R Distributary than at the 4-R Distributary indicated influential persons as the main reason for inequity.
Besides influential persons, "the role of PID official" was another stated reason for unequal distribution of irrigation water between the distributaries. About 8 percent (about 17 percent of those who stated that unequal distribution of water between the distributaries existed) of the respondents revealed that corrupt PID officials were one of the main reasons for unequal distribution of water, though they did it under political pressure or through unfair means.
*
*
. Overall, about 80 percent of the sample farmers at the 4-R Distributary indicated inequity in water distribution within the 4-R Distributary command area. To many of them, big landlords on the distributary have got their watercourses tampered with by the PID employees, either through political influence or through using
75
I

other unfair means. A similar situation was reported by the sample farmers at the 3-R Distributary.
Overall, 42 percent of the sample farmers were of the view that PID officials were playing an important role in unequal distribution of irrigation water within the 4-R Distributary command area.
A large majority of the sample farmers at both distributaries were found satisfied with water distribution within the watercourse command areas (91 percent of the sample farmers at the 4-R Distributary).
The ratio of irrigation water delivery through the outlets at the head reach and tail reach at the 1-RA Minor was the highest and contrarily, lowest for 1-R Minor, indicating that at 1-RA Minor, the distribution between the head and tail reaches is inequitable, while this distribution ratio is close to unity at Minor 1-R (indicating equitable distribution between the two reaches).
About 70 percent of the sample farmers claimed that their watercourses had improved compared with the situation 10 years ago. Overall, about 18 percent of the respondents were of the view that their watercourses were still in the same functional condition as they were 10 years earlier; 12 percent of them revealed that their watercourses were in worse shape than 10 years ago. At the 3-R Distributary, overall, about 85 percent of the sample farmers were of the opinion that their watercourses were in a much more improved condition than they were 10 years ago.
About 41 percent of the sample farmers were of the opinion that the functional condition of the 4-R Distributary was in a worse condition than it was 10 years earlier, whereas 28 percent indicated the same functional condition, while about 29 percent were of the view that the functional condition has somewhat improved. The percentage of those who held this view decreased gradually from the head to the tail reach of the 4-R Distributary.
*
*
*
t
*
Reliability in water supply means a regular or uninterrupted water supply to the farmers. Over 98 percent of the sample farmers at the Hakra 4-R Distributary were of the view that they had missed some water turns during the Kharif 1994 season. A large majority stated "distributary warabandi" or the distribution rotation as the main reason for missing their water turns. The same situation was observed at the 3-R Distributary.
A large majority of the farmers did not engage in exchange of water turns. Only 11 percent of the sample farmers at the 4-R Distributary said that they exchanged their water turns. Of these, the percentage was higher at the head reach (12%) than at the middle (3%) and the tail reaches (2.5%).
76
At the 3-R Distributary, only 8 percent of the respondents exchanged their Water turns.
About 5 percent of the sample farmers at the 4-R Distributary, exchanged water turns because the crop needed water at that time. They exchanged water turns to fulfil their mutual need for irrigation water. About 2 percent exchanged water turns because they had some surplus water due to some fields becoming waterlogged. A similar kind of picture was revealed at the 3-R Distributary.
About 10 percent of the respondents at the 4-R Distributary exchanged water turns during the Rabi 1994-95 season. Almost the same reasons were mentioned as for the Kharif 1994 season.
*
t About 30 percent of the sample farmers at the 4-R Distributary purchased water turns from other farmers. The majority stated that they had to purchase water turns because of the disruption of the flow in the 4-R Distributary. The number of sample farmers who mentioned this as a reason gradually increased from 3 percent at the head reach to 10 percent at the middle and to 19 percent at the tail reach.
About 7 percent of the sample farmers stated as one of the reasons for purchased water turns, "because the crop needed water". Due to saline underground water, very few farmers have installed tubewells in the study area. The majority of the farmers have to rely on canal water. Similar information was provided by the respondents at the 3-R Distributary.
About 18 percent of the sample farmers purchased water turns during the Rabi 1994-95 season. The majority purchased water turns because the 4-R Distributary was partially closed for some periods. At the 3-R Distributary, only 2 percent of sample farmers stated "partial closure of the distributary" as the reason for purchasing of water turns.
About 4 percent of the sample farmers at 4-R stated the "crop needed water" as one of the reasons for purchasing water turns whereas about 2 percent of the respondents pointed out "less water in the distributary" as the reason that forced them to purchase water turns during the Rabi 1994-95 season.
Overall, 1.4 percent of the sample farmers at the 4-R Distributary sold their water turns to other farmers during the Kharif 1994 season. All of them stated "surpluslenough water for their crops" as the only reason for selling their water turns. An almost similar situation was found at the 3-R Distributary. Similar results occurred during the Rabi 1994-95 season.
*
*
t
77

t Overall, 2.5 percent of the sample farmers at the 4-R Distributary claimed that water was stolen during their water turns during the Kharif 1994 season. The only stated reason was "dishonesty on the part of other farmers." During the Rabi 1994-95 season, just 1.4 percent of the sample farmers at the 4-R Distributary had their water stolen.
INSTITUTIONAL DEVELOPMENT
t The majority of the sample farmers (58%) at the 4-R Distributary mentioned the existence of WUAs at their watercourses. At the 3-R Distributary, the existence of WUAs was found at 100 percent of the sample watercourses.
Overall, 42 percent of the sample farmers were found to be members of WUAs. Over 63 percent of the sample farmers indicated their membership in a WUA at their watercourse at the 3-R Distributary.
About 9 percent of the sample farmers of the 4-R Distributary said that there were up to 15 members of the WUA at their watercourse, while 16 percent said there were 16-30 members, and another 16 percent said that there were 31-50 members. About 12 percent of the sample farmers said that there were 51, or more, WUA members at their watercourse. The number of sample farmers at 3-R who said that there were 51 or more members at their watercourses was quite low (only 1 percent).
A higher percentage (37 %) of the respondents indicated that there were 4 to 6 executive committee members, whereas about 10 percent of the sample farmers pointed out that they had 7 executive committee members and above at their watercourses. The sanie position was observed at 3-R where 51 percent of the sample farmers indicated about 4 to 6 executive committee members at their watercourse.
*
*
*
I A large number (42%) of those who were WUA members pointed out that the executive committee members were selected by consensus. About 9 percent of the sample farmers, at the 4-R Distributary, were of the view that the On-Farm Water Management (OFWM) Project nominated the executive committee members.
The majority of the sample farmers at the 4-R Distributary found WUAs to be very useful. For different reaches, the number of respondents who affirmed the usefulness of WUAs increased from 16 percent at the head reach lo 53 percent at the middle and 69 percent at the tail reach.
t
78

t
*
t
A large majority of the sample farmers (77%) at the 4-R Distributary claimed that no agricultural extension agent had ever visited them. About 14 percent of the sample farmers said the extension agent informed them about new farming practices. About 5 percent of the sample farmers indicated that the extension agent did visit them, but that they did not get any benefits. At the 3-R Distributary, about 21 percent of the sample farmers indicated that the extension agent informed them about new farming practices.
A large majority (about 98%) of the sample farmers had no contact with the fertilizer company agent. Just 0.5 percent of the respondents at 4-R said that the fertilizer company agent visited them and informed them about land fertility and recommended a particular type of fertilizer, best suited to their land. The same percentage of them indicated that they were informed about a new fertilizer.
The study area is famous for growing cotton. The majority of the sample farmers (78%), at the 4-R Distributary claimed that no company agent had ever visited them. Twelve percent of the sample farmers said that the pesticide company agent visited them and made them aware of the dangers of pest attacks. Almost the same kind of response was received from sample farmers at the 3-R Distributary.
A large majority (85%) of the sample farmers were found waiting for the OFWM representative at the 4-R Distributary. About 13 percent said that their watercourses were lined by the OFWM team. About 2 percent stated that the OFWM officials did visit them, but they did not get any benefit from them. A higher percentage of sample farmers (18%) at 3-R indicated that their watercourses were lined by OFWM officials.
Overall, 97 percent of the sample farmers said that no mobile credit officer (MCO) had ever visited them at the 4-R Distributary. About 3 percent pointed out that the MCO did visit them and offered them loans. Similar information was conveyed by the sample farmers at the 3-R Distributary.
About 20 percent of the sample farmers at the 4-R Distributary indicated that the PID representative often visited them. But the pity was that he did not offer any benefit to them. The situation at 3-R was similar.
About 26 percent of the sample farmers claimed that groundwater was found fit for irrigation purposes. Over 28 percent at the 4-R Distributary indicated that groundwater was marginally fit for irrigation, whereas a little less than half (46 %) stated that groundwater, in their area, was absolutely unfit for irrigation purposes.
At the 4-R Distributary, about 32 percent of the respondents used gypsum, about 19 percent planted trees, and about 25 percent indicated that they cultivated a
79

rice crop to control both waterlogging and salinity. About 55 percent of the sample farmers pointed out that they leveled their fields while about 25 percent claimed that they used farm yard manure (FYM) as a measure to control waterlogging. The number of sample farmers at 3-R who planted trees in their fields was 39 percent, while the number who planted a rice crop to control waterlogging was 32 percent.
t A large majority of the sample farmers (82%) at the 4-R Distributary leveled their fields to control salinity. Over 68 percent claimed that they used gypsum as a method to control salinity and increase crop production. About 29 percent of them used FYM as a means to control salinity.
The organizational behavior of sample farmers at 4-R was quite obvious on two issues: maintenance or construction of the mosque; and maintenance of the watercourse. Ninety four percent of the farmers were of the view that they participated in the maintenance or construction of the village mosque. They participated by sharing either funds, according to their resources, or providing labor for that purpose.
The next important issue was regarding maintenance of the watercourse. About 90 percent of the respondents affirmed that they participated in their watercourse maintenance, mostly through sharing labor. Here, the role of the OFWM official seems very important.
About 41 percent of the sample farmers were of the view that they used to participate in the maintenance or construction of the village drinking pond. The sample farmers also participated in the maintenance or construction of the village school. About 42 percent of the sample farmers at the 4-R Distributary said that they participated in the maintenance or construction of the village school.
Regarding land and water disputes, about 35 percent of the sample farmers agreed that most of the disputes were settled within the premises of their village by the intervention of the village elders. Rarely do villagers have recourse to the police or courts of law. which only happens when the situation gets beyond the village elders’ control.
For maintenance of the 4-R Distributary, about 20 percent of the sample farmers participated. They shared labor with other farmers for desilting whenever called by the government agency. They also participated by sharing labor whenever there was a cut or breach in the distributary.
*
*
*
t
A very low percentage of sample farmers (2%) claimed that they purchased inputs collectively, such as fertilizers, pesticides, etc. Collective marketing of crop produce was rarely reported. Just 0.3 percent of the sample farmers at the 4-R
80

Distributary said that they sold their crop produce collectively. An almost similar situation was noticed at 3-R.
AGRONOMIC PRACTICES, FARM OUTPUT, LIVESTOCK AND INCOME
The main crops grown in the study area were cotton, wheat, sugarcane, and rice, with fodder being grown during both the kharif and rabi seasons.
The mean area under cotton, as reported by the sample farmers, was 6.8 acres at the 4-R Distributary, which varied from 9 acres at the head reach to 7 acres at the middle and 6 acres at the tail reach.
At the 4-R Distributary, the mean area destroyed due to pest attack was reported as 0.7 acre. On average, about 5 kg of cotton seed was used per acre by the sample farmers. The average price received by the farmers, per 40 kg of cotton, was reported to be around Rs 843.
The sample farmers at the 4-R Distributary reported an average expenditure of Rs 2,629 per acre including expenditures on important inputs like fertilizers and plant protection. On average, Rs 1,290 was spent on pesticide sprays for the protection of the cotton plants. The total expenditure increased gradually from Rs 2,475 per acre at the head to Rs 2,670 per acre at the tail reach.
Overall, the average cotton yield, as reported by the farmers at the 4-R Distributary, was 9.2 maunds per acre. For different reaches, a higher average per acre yield was achieved at the tail reach (11.4 maunds) compared with the head reach (6.4 maunds).
The mean area under wheat was reported as 7.5 acres with the head reach figure being 9.1 acres and the tail reach 6.5 acres at Hakra 4-R Distributary.
Though the amount of seed used and the expenditures per acre by the sample farmers at 4-R Distributary seemed the same, the wheat yields gradually increased from 120 maunds per acre at the head reach to 28 maunds per acre at the tail reach.
At the 3-R Distributary, the mean wheat area at the tail reach was 6 acres, which was less than 50 percent of the mean wheat area at the head reach (14 acres). But the sample farmers at the head reach invested more per acre and had a higher wheat yield per acre (32 maunds), which was much more than the corresponding value (26 maunds) at the tail reach.
t
*
*
*
t
*
81
I
I

I I
I I *
*
*
*
f
As irrigation water is deficient for satisfying crop water requirements, and the underground water is saline, the rice crop was reported by orily 57 farmers from the 4-R Distributary during Kharif 1994. The mean area under rice gradually decreased from 3.7 acres at the head reach to 2.2 acres at the tail reach.
The rice yield per acre reported in the 4-R Distributary was higher at the tail reach (33 maunds) than at the head reach (24 maunds) and at the middle (19 maunds). A different picture was observed at the 3-R Distributary. where the sample farmers at the head reach had a much higher outlay per acre than those at the tail reach.
The mean area under sugarcane reported by the sample farmers at the 4-R Distributary was 3 acres. The total outlay per acre of sugarcane at all reaches was found to be almost identical, but farmers at the tail received a higher sugarcane yield (498 maunds per acre) than those at the head reach (230 maunds per acre).
At the 3-R Distributary. 19 sample farmers reported growing sugarcane in their fields. The sample farmers at the tail reach, though in very small numbers, invested more and then received a higher sugarcane yield per acre than those at the head reach. Overall, sample farmers at the 4-R Distributary had a higher sugarcane yield (430 maunds per acre) than farmers at the 3-R Distributary (387 maunds per acre).
The mean area under kharif fodder reported by the sample farmers, at the 4-R Distributary, was two acres. Though sample farmers at the head reach of the 4-R Distributary were making more investment than those at the tail reach, the latter had a higher mean value per acre (Rs 3,900) than the former (Rs 3,600). No significant difference was observed between the 4-R and 3-R distributaries.
On average, about 1 acre was earmarked for rabi fodder by the sample farmers at the 4-R Distributary. The total expenditure per acre was calculated as Rs 1,029 per acre with a major portion being on fertilizers. The mean value per acre, at the 4-R Distributary, increased from Rs 6,000 at the head reach to Rs 7,000 at the tail reach.
In the case of the 3-R Distributary, the mean value per acre of rabi fodder decreased from Rs 14,300 per acre at the head reach to Rs 7,400 at the tail reach.
The cropping intensity was 122 percent at the 4-R Distributary. However, the cropping intensity was found higher at the head reach (147 %) compared with the middle reach (144 %) and tail reach (97 %). The cropping intensity on average was found higher at 3-R (135 %).
' I
82

. I ..
* The number of respondents who ranked 'more canal water supply" as the major factor that would increase crop production at the 4-R and 3-R distributaries was 64 percent and 65 percent, respectively. About 23 percent of the respondents at 4-R ranked "ensured canal water supply" as the major factor. A large number of respondents ranked "availability of good quality seed" and "timely availability of chemical fertilizer" as the second and third factors in order of importance. A good number of the sample farmers ranked "availability of quality pesticideslinsecticides" as the third factor for increasing crop production.
While the mean number of bullocks was found as 1.1, the mean number of cows was reported as 0.9 at the 4-R Distributary. The mean number of buffaloes was found to be around 3 at both of the distributaries, whereas the mean number of goats ranged from 2.9 at 4-R to 3.5 at 3-R. Overall, the mean number of poultry birds found was 8.4 at the 4-R Distrihutary.
The mean total abiana (water charges) was calculated to be Rs 860 per farmer at 4-R, and Rs 1,060 at 3-R. The mean abiana per acre was Rs 65 at 4-R and about Rs 60 at 3-R.
The mean farm income of the respondents at the 4-R Distributary was Rs 79,000. The mean income from livestock and remittances of the respondents at the 4-R Distributary were Rs 4,500 and Rs 2.700, respectively. From all sources, the mean income of the sample farmers at the 4-R Distributary was estimated as Rs 121,000, whereas it was Rs 130,000 at the 3-R Distributary.
t
t
t
83

References
Bandaragoda, D. J. and S. U. Rehman. 1995. Warabandi in Pakistan's canal irrigation system: Widening gap between theory and practice. IlMl Country Paper, Pakistan No. 7. international Irrigation Management Institute, Colombo.
Government of Pakistan. 1994. Integrated research plan for Fordwah Eastern Sadiqia (South) Irrigation and Drainage Project. Pakistan Water and Power Development Authority, Lahore.
Government of the Punjab. 1994. Integrated irrigated agriculture management research component, Work Plan 1994-95. Directorate General Agriculture (Water Management) Punjab, Lahore.
Haque, M. 1988. Baseline survey of Command Water Management Project-Punjab: A socio-economic study. Publication No. 204, Punjab Economic Research Institute, Lahore.
Levine, G. and E.W. Coward, Jr. 1989. Equity considerations in the modernization of irrigation systems. Paper 89/2b, ODllllMl Irrigation Network, Overseas Development- Institute, London.
Parel, P.C., C.G. Caldito, L.P. Ferrer, G.W. De Guzman, S.C. Sinsioco and H.R. Tan. 1973. Sampling design and procedure. The Agricultural Development Council, New York.
Sampath, R.K. 1988. Some comments on measures of inequity in irrigation distribution. Paper 88/2f ODllllMl Irrigation Network, Overseas Development Institute, London.
Shahid, AS, M. Haq and J.M. Khan. 1992. Benchmark survey of Irrigation Systems Management and Rehabilitation Project4 in Punjab. Publication No. 279. Punjab Economic Research Institute, Lahore.
Sharif. M.; M.J. Khan and M. Sarwar. 1986. Constraints facing small farmers in Punjab. Publication No. 224. Punjab Economic Research Institute, Lahore.
84
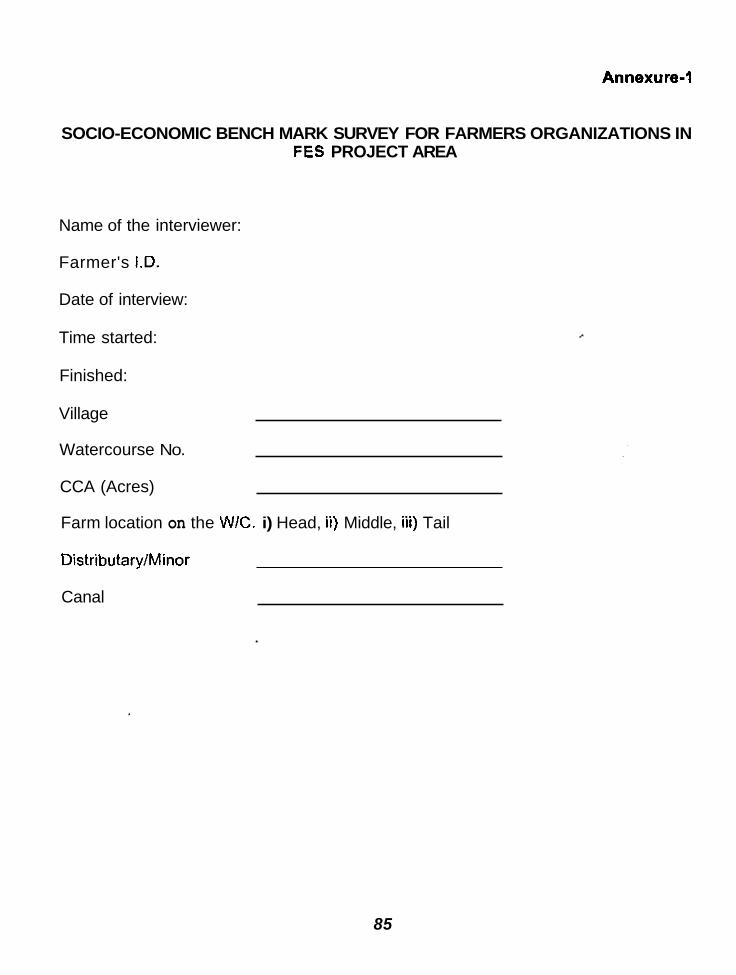
Annexure-l
SOCIO-ECONOMIC BENCH MARK SURVEY FOR FARMERS ORGANIZATIONS IN FES PROJECT AREA
Name of the interviewer:
Farmer's 1.D.
Date of interview:
Time started:
Finished:
Village
Watercourse No.
CCA (Acres)
Farm location on the WIC. i) Head, ii) Middle, iii) Tail
Distributary/Minor
Canal
85

llMl SURVEY 1995
Characteristics of the Respondent
1. Name of the respondent:
2. Father's name:
How many are working at farm?
a. Full time
b. Part time - -
3. Age (years): [ I
[Resident=l , Migrant=P] [ I 4. Resident settler or a migrant?
5. Castelsub-caste [Jat=l , Rajput=2, Arian=3, Gujar=4, Awan=5, Any other=6] [ I
6. Marital status [Married=l , Single=2, Widower=3] [ I
7. Father's occupation [Same as respondent=l, Other=2] [ I
a. Educational level
1. Illiterate ii. Primary iii. Middle iv. Matric V. F.AIF.Sc vi. 0.AIB.Sc vii. M.AIM.Sc viii. Any other (Sp) [ I
9. Household size and composition 9. Household size and composition
How many are at
86
Particulars

lrriqation Practices
10.
11. Source of irrigation.
i. Canal ii . Public tubewell iii. Private tubewell iv. Canal + private tubewell v. Any other (Sp)
To what extent this source fulfills your crop water requirement?
I. Not at all ii, To some extent iii. To large extent
If answer is i or ii, then ask how do you overcome this crop water deficiency?
Years of experience with irrigated agriculture-years.
12.
[ I
13. Irrigation me!hod
I. Basin ii. Furrow iii. Basin + Furrow iv. Wild flooding v. Any other (Sp)
Water Manaqement
14. Kind of warabandi.
I . Kacha II. Pakka
15. Who determine warabandi.
I. Irrigation Department ii. Mutual arrangement by farmers iii. Any other (Sp)
[ I
[ I
87

16. How much time is allocated to you per acre?
17. What is the timing of your water turn at this watercourse ?
From to Day
18. How much time it takes to irrigate one acre of land at your watercourse? minuteslacre
lrriaation System Performance
A. Equity in Water Distribution
19. Do you think that irrigation water is equally distributed between distributaries ? YeslNo [Yes=2, No=l J [ I If no, why?
20. Do you think that irrigation water is equally distributed within the distributary command area? Yes/No [Yes=2, No=l] [ I If no. why?
21. Do you think that water is equally distributed at your watercourse? YeslNo [Yes=2, No=l] [ I If no, rank the following factors responsible for unequal distribution of water?
1. Location of farm (H - M - T) 2. Farm size 3. Tenancy status 4. Influential person 5. Poor maintenance 6. Any other (sp)
88

B. Adequacy, Reliability and Variation in the SUDD~Y of Canal Water
22. Was canal water sufficient for the crops you cultivated in last Kharif season? YeslNo [Yes=2, N o 4 1 [ I
If no, month of the most acute shortage of water.
[ I 23. Was canal water sufficient for the crop you cultivated in last
Rabi season ? YeslNo [Yes=2, No=l j [ I
[ I If no, month of the acute shortage of water.
24. To what extent are you satisfied with the present distribution of water ?
I. Not all ii. To some extent iii. To large extent
If not at all, who can improved water distribution?
i Government agency ii Farmers organizations iii Both iv Any other (sp)
I 1
[ I
89

- Statement YeslNo
(Yes=2. No=l]
1. Did you miss your water turn(s) during last kharif season?
I Did you exchange irrigation turn durino last kharif season?
Kharif (No.) Reason
3. Did you purchase water during last kharif season?
Did you sell water during last kharif season?
4.
5. Was water stolen from your turn during last kharif season?
Statement YeslNo Rabi (No.) Reason [Yes=2. No=l]
1. Did you miss your water turnfs) during last Rabi season?
Did you exchange irrigation turn during last Rabi season?
Did you purchase water during last Rabi season?
Did you sell waler during last Rabi season?
Was water stolen from your turn during last Rabi season?
2.
3.
4.
5.
Institutional development
26. Is WUA formed at your watercourse ? YeslNo [Yes=2. No=l]
If no, ask Q. 34
27. If yes, are you a member of this WUA ? YeslNo [Yes=2, No=l]
[ I
[ I
90

State reason(s) to support your answer.
~- ~
28.
29.
How many are the members of this WUA? - How many are the members of the Executive Committee?
30. How the members of the Executive Committee are selected ?
[ I
[ I
31. Number of persons Who did not contributed for improvement of WIC ?
Why ?
32. Has the WUA been useful to you ? YeslNo [Yes=2, No=l] [ I If yes, how ?
If no, what in your view is lacking in WUA ?
33. What activities has the WUA undertaken? i. ii. iii.
34. Is there any WUA in your village or outside village? YeslNolNot applicable [Yes=2, No=l, Not applicable=99]
If yes, how that WUA is useful to its members?
[ I
91

If no, would you like to have WUA at your WIC? Yes/No/Not applicable [Yes=2, No=l, Not applicable=99] State reason(s) to support your answer.
I.
Areas of Collective Action
a. Maintenance/construction of village mosque
school b. Maintenancelconstruction of village
I l .
iii.
YeslNo If yes, how do you perform [Yes=Z.No=l] this action?
35. Existinq Status of Orqanizational Behavior
[ I
II c. Land and water disDutes I I II d. Purchase of inputs
e. Marketing of crop produce
f . Maintenance of watercourse
I1 g. Maintenance of distributarylminor I I II
I Maintenancelconstruction of village streetlroad
I Maintenancelconstruclion of village drinkina water Dond
1 Any other (sp)
36. Has the distributary which delivers water to your farm:
1 ) remained in about the same functional condition as it was 10 years 2) deteriorated to worse condition than 10 years ago. 3) improved to a better condition than 10 years ago.
ago.
4) do not know. [ I
State reason(s) to support your answer.
92

36 a. Has the watercourse which delivers water to your farm: 1 ) remained in about the same functional condition as it was 10 years ago. 2) deteriorated to worse condition than 10 years ago. 3) improved to a better condition than 10 years ago. 4) do not know. [ I
State reason(s) to support your answer.
Agent
37. Identify the problems related with operation and maintenance of irrigation system and the institutions responsible for the problems?
Times What Benefit did you gel? [0 or other number]
II a. Watercourse I I
Agriculture Extension agent
2. Fertilizer company agent
3. Pesticides company agent
4. OFWM rewesentalive
II 5. Mobile credit officer I I I1 6 . PID representative
7. Other (sp) I 93

39. Tenancy status
I . Owner ii. Owner-cum-tenant
iii. Tenant
I 2. Do you own following modern equipments?
a. Thresher b. Seeddrill c. Rotavator d. Reaper e. Tuhewell f. Ridger g. Boom sprayer h. Any other (sp)
-
[ I
40. Land Holdinq
Share produce
4 . Area operated (1 +2c-3c) c. Total
* A = On that particular walercourse B = On other watercourse
41. Machinery
I 1. Stalemenl I YeslNo [Yes=l, No=2]
Do YOU own Iractor? I
Soil and Water Status
42. Quality of ground water. [ I I. Fit for irrigation ii. Marginal fit for irrigation iii. Unfit for irrigation
94

43. A. Waterlogging I
i
Action
a. No action
Waterlogging Salinity Yes/No/N.A. Yes1NolN.A.
[Yes=l. No=O. N.A.=99] [Yes=l. No=O, N.A.=99]
I I It b. Use gypsum II d Plant trees e Rice cliltivation
Leaching ield levelling i h Any other (sp)
5. Croppinq pattern. production and marketina:
95

Factors
1. More canal water supply
2. Ensured canal water supply
3. Improved water management practices
4. Better extension services
5 .
6.
7 .
Availability of good quality seed
Timely availability of chemical fertilizer
Easy availability of credit facility
11 8. Availability of machinerv on subsidized rates ~~ I
Priority
1 1
Livestock
II 9. Availability of aualitv Desticides/insecticides I
Number
~~ ~~
10 Availability of quality weedictdes
9. Poultry I
47. Livestock inventory I, I
1 Bullocks
2 cows
3 Camels
4 Buffaloes
5 Sheep
6 Goats
7 Donkeys
8 Horses
96

48. Estimated Familv Income IDer year)
Income from crop
Income from livestock
Income from labor (from outside farm)
Remittances
Any other
Total family income
49. Existing Abiana (Irrigation Water Rate) recovery status:
W n t billed Amount Daid
Kharif 1994
Rabi 1994
I ~
97

Annexure-2
Niirnher nf
Question No. 25 C-I . Number of water turn(s) missed during last kharif (1994). I, I
Distributary I
water turn(s)
No
, I
Head Middle Tail Overall Head Middle Tail Overall (75) (94) (198) (367) (21) (18) (59) (98) 78.7 I 91.5 I 91.4 I e 8.8 76.2 I 94.4 I 94 .9 I 9 0.8
Question No. 25 C-I . Number of water turn(s) missed during last rabi (1994-95).
Question No. 25 C-2. Exchanged water turn(s) during last kharif (1994). Distributary
4-R I 3-R Exchanged
I I I I I I Yes I 22.7 I 8.5 1 8.6 I 1 1.2 1 23.8 I 5.6 I 5.1 I 9.2
Total I 100.0 1 00.0 I 1 00.0 I 100.0 I 1 00.0 1 100.0 I 1 00.0 I 100.0
I I ! 98

Number of water
Distributary 4-R I 2-R
turn(s) ~ ~ ~ h ~ ~ ~ ~ d
up to 2
- . . Head I Middle I Tail I 0 verall Head Middle Tail Overall
(75) (94) (198) (367) 9.0 I 5.3 I 4.5 I 5.4
T 0.0 3.0 4.0
3 - 4 5 and above
Do not know
Not relevant Total
I I I 76.2 I 94.4 I 94.9 1 90.8 100.0 I 100.0 I I 00.0 I 1 00.0
I 8.0 3.2 2.5 3.9 5.3 0.0 1.5 1.9 0.0 0.0 0.0 0.0
78.7 91.5 91.4 88.8 100.0 100.0 100.0 100.0
Question No. 25 C-2. Exchanged water turn(s) during last rabi (1994-95). I1 Distributary
Exchanged 4-R i 3-R Water Turn(s)
Total 100.0
Question No. 25 C-2. Number of water turn(s) exchanged during last rabi (1994-95).
99

Question No. 25 C-3. Purchased water turn(s) during last kharif (1994).
Question No. 25 C-3. Number of water turn(s) purchased during last kharif (1994).
I Distributary 1 4-R 3-R
Number of Water
Question No. 25 C-3. Purchased water turn(s) during last rabi (1994-95).
100

Question No. 25 C-3. Number of water turn(s) purchased during last rabi (1994-95).
Question No..25 C-4. Sold water turn(s) during last kharif (1994).
Question No. 25 C-4. Number of water turn@) sold during last kharif (1994).
lr Distrtbutarv
101

Question No. 25 C-4. Sold water turn(s) during last rabi (1994-95).
I I Distributaw II
water turn(s)
Sold I A.R - , \
Head Middle Tail Overall (75) (94) f.198) (3671 (21)
100.0 0.0
~~
(18) (59) (98) 100.0 90.3 99.0 0.0 1.7 1 .o
3-R II
No Yes
Total
Head I M iddle I .Tail I Overall II . , . , . . . .
100.0 97.9 99.5 99.2 0.0 2.1 0.5 0.8
100.0 100.0 100.0 100.0
know Not
relevant Total
I I
1000 1 100.0 I 1000 I 100.0
100.0 97.9 99.5 99.2 100.0 100.0 98.3 99.0
100.0 100.0 100.0 100.0 100.0 100.0 100.0 100.0
Question No. 25 C-5. Water turn(s) stolen last kharif (1994).
102

Question No. 25 C-5. Number of water turn(s) stolen during last kharif (1994).
I I Distributary 1 4-R I 3-H
Number of II Water Turn(s) Stolen
uo to 2 3 - 4
5 and above Do not know Not relevant
Total
Question No. 25 C-5. Water turn(s) stolen during last rabi (1994-95).
Question No. 25 C-5. Number of water turn@) stolen during last rabi (1994-95).
103

Question No. 35a. Perceptions of respondents regarding maintenancelconstruction of village mosque.
h I Distributaw 1
Question No. 35b. Perceptions of respondents regarding maintenancelconstruction of village school.
Maintenance1
104

Question No. 35c. Perceptions of respondents regarding settlement of land and water disputes.
and water disputes
Police decide
Question No. 35d. Perceptions of respondents regarding purchase of inputs.
Purchase of inputs
Question No. 35e. Perceptions of respondents regarding marketing of crop produce.
Marketing of crop Produce
Total I 100.0 I 100.0 I 100.0 I 100.0 I 100.0 I 100.0 II
105

Questioi n
Maintenance of watercourse
Share labour Share funds Both share labour and
funds Own share
maintenance WUA
Not relevant Total
No. 35f. Perceptions of respondents regarding maintenance of watercourse.
Distributary 4-R I 3-R
Question No. 359. Perceptions of respondents regarding maintenance of disributarylminor.
106

Question No. 35h. Perceptions of respondents regarding maintenancelconstruction of village streetslroads.
construction
Question No. 3% Perceptions of respondents regarding maintenancelconstruction of village drinking water pond.
107

Question No. 35j. Perceptions of respondents regarding maintenance/ construction of village drinking water pond for animals.
i Maintenance/
108

IIMI-PAKISTAN PUBLICATIONS
S. No.
1.
Title Author Year - IlMl Working Paper No. 8 Robert Hecht 1988 Land and Water Rights and the Design of Scale lrriaation Proiects: The Case of Baluchislan
2 IlMl Working Paper No. 21 Tubewells in Pakistan Distributary Canal Commands: Lagar Distributary, Lower Chenab Canal Svstem. Puniab
E.J. Vander Velde 1992 R.L. Johnson
3.
- 1995
IlMl Working Paper No. 26 Changes in Water Duties and their Impact on Agricultural Production
P. Strosser Ranal Afaq C. Garces
S. Malik P. Strosser
4.
5 .
6.
D.J. Bandaragoda Saeed ur Rehman
IlMl Working Paper No. 27 Management of Private Tubewells in Conjunctive Use Environment
IlMl Working Paper No. 28 Institutional Perspectives of Land Reclamation Operations in Punjab A case Study of the Lower Chenab Canal (East) Circle Area
llMl Working Paper No. 29 Farmer-Managed Irrigation Systems in Chitral
A. Hakeem Khan Abdul Majid Maliha H.Hussain E.J. Vander Velde
9.
10.
1993
IlMl Working Paper No. 39 Saleem M. Malik 1996 Farmers' Organized Behavior in Irrigated Agriculture in Pakistan's Punjab-A Case Study of Six Watercourse Command Areas in Junejwala Minor, Lower Chenab Canal System
An Investigation of the Relationship between Depth to Groundwaker and Malaria Prevalence, Punjab. Pakistan
Waheed-uz-Zaman Marcel Kuper
IlMl Working Paper No. 40 M.J. Donnelly 1997 M.H. Birley F. Konradsen
1993
1994
1994
IlMi Working Paper No. 30 Water Markets in the FordwahlEastern Sadiqia Area ~ An Answer to Perceived Deficiencies in Canal Water Supplies?
IlMl Working Paper No. 38 Participatory Rural Appraisal for Irrigation Manaaement Research
Pierre Strosser Marcel Kuper
Paul Gosselink Pierre Strosser
1994

I I M I-PAKISTAN PUB LlCATlONS
S.No.
1
Title Author Year
IMI Country Paper-Pakistan No.1 Robert Johnson 1989 Private Tube Well Development in' Pakistan's Punjab: Review of Past Public Proaramsl Policies and Relevent Research.
2.
3.
4
~
1989 IlMl Country Paper-Pakistan No. 2 Irrigation Management in Relation to Waterlogging and Salinity.
IlMl Country Paper-Pakistan No. 3 Irrigation Management in Pakistan Mountain Environments.
IlMl Country Paper-Pakistan No. 4 Institutional Factors Affecting Irrigation Performance in Pakistan: Research and Polictv Priorities.
Jacob W.Kijne
Edward J. Vander Velde
D.J. Bandaragoda G.R. Firdousi
1989
5
1992
IlMl Country Paper-Pakistan No. 5 Moving Towards Demand-Based Operations in Modernized Irrigation Systems in Pakistan.
D.J. Bandaragoda M. Badruddin
6
1992
IlMl Country Paper-Pakistan No.6 D.J. Bandaragoda 1993 The Role of Research-Supported Irrigation Policv in Sustainable lrriaated Aariculture.
7 IlMl Country Paper-Pakistan No. 7 D.J. Bandaragoda 1995 Warabandi in Pakistan's Canal Irrigation Systems, Widening Gap between Theory and Practice.
Saeed ur Rehman

IIMI-PAKISTAN PUBLICATIONS
R-6
R-7
RESEARCH REPORTS
Farmers Ability to Cope with Salinity and Sodicity: Farmers' perceptions. strategies and practices for dealing with salinity and sodicily in their larming systems
Salinily and Sodicity Effects on Soils and Crops in the Chishtian Sub-Division: Documenlation of a Restitution Process
Title Author
Carlos Garces-R O.J. B a n d a r w a
Pierre Strosser
Carlos Garces-R Ms. Zaigham Habib
Pierre Strosser Tissa Bandaragoda
Rana M. Afaq Saeed ur Rehman Abdul Hakim Khan
Rana M. Aiaq Pierre Slrosser
Saeed ur Rehman Abdul Hakim Khan Carlos Garces-R
Crop-Based Irrigation Operallons Study In the North West Frontier Province of Pakistan Volume 1: Synthesis of Findings and Recanmendations
Volume II: Research Approach and lnterprelation
Volume \I(: Data Collectiin Prccedures and Data Sets
Neeltje Kielen Muhammad Aslam
Rafique Khan Marcel Kuoer
I R-2
-PI 1996
Salinity and Sodicity Research in Pakistan - Proceedings of a one- day Workshop
R-8
R-9
R-3 Farmers' Perceptions on Salinity and Sodicity: A case study inlo farmers' knowledge of salinity and sodicity. and their strategies and practices to deal with salinily and sodicity in their farming systems
Modelling b e Effects of Irrigation Management on Sol1 Salinity and Crop Transpiration at the Field Level ( M S c Thesis - published as Research Reoori)
R-4
Tertiary Sub-System Management: Khaiid Rlaz Sept (Workshop proceedings) Robina Wahaj 1996
Mobilizing Social Organization Volunleers: An Initial Methodological Mehmwdul Hassan Oct Step Towards Establishing Effeclive Water Users Organization Zafar lqbal Mirra 1996
D.J. Bandaraaoda
J.W. Kijne Marcel Kuper
Muhammad Aslam
R-10
R-1%
J.W. Kijne Marcel Kuper
Muhammad Aslam
Canal Waler Distribution at the Sewndary Level in the Punjab.
Development of Sediment Transpwt Technology in Pakistan: An
Steven Visser OCl 1996
M. Hasnain Khan oct Annotated Bibliography 1996
Pakistan (M.Sc Thesis published as Research Report)
Neeltie Kieien Neeltie Kieien
S.M.P. Smeh S.M.P. Smeh
Mar 1995
May 1996
- June 1996
3 1996
Water Distribulion at the Secondary Level in the Chishtian Sub- divisim ll R-5 I M. Amin K. Tareen
Khaiid MahmOOd Anwar hbal
Mushtaq Khan Marcel Kuper
Neeitje Kielen
July 1996
- Aug 1996

Report Title Author Year No. -
R-12 Modeling of Sediment Transport in Irrigation Canals of Pakitan: Gilles Betaud Od Examples of Application 1996 (M.Sc Thesis published as Research Report)
R-13 Melhodolcgies for Design, Operation and Maintenance of irrigation Aiexandre Vabre Oct Canals subject to Sedimenl Problems: Application lo Pakistan (M.Sc 1996
R-14 Government Intervenlions in Social Organization for Water Waheed uz Zaman Oct Resource Management: Experience of a Ccanmand Water D.J.Bandaragcda 1996 Management Project in the Punjab. Pakistan
(RAAKS) for Building Inter-Agency Collaboration Mushlaq A. Khan 1996
Thesis published as Research Report)
I
R-15 Applying Rapid Appraisal of Agricullural Knowkid@ Systems Derk Kuiper Nov
Jos van Oostrum M. RaAque Khan Nathalie Roovers
Mehmood UI Hassan
R-16 Hydraulic Characteristics of Chishtian Sub-division. Fordwah Canal Anwar lqbal Nov
R-I7 Hydraulic Characteristics of Irrigation Channels in the Malik Sub- Khalid Mahmocd NOV 1996
Division 1996
Division Sadiqia Division. Fordwah Eastern Sadiqia Irrigation and Drainage Project -
R-18 Proceedings of Natlonal Conference on Managing Irrigation for M. Badruddin NOV
Environmentally Sustainable Agriculture in Pakistan Gaylord V. Skogerboe 1996
volume-l: Inauguration and Deliberations (Editors for all volumes) M.S. ShaOque
R-18.1
R-18.2 Volume-tl: Papers rn the Theme: Managing Canal Operations
R-18.3 Voiume-lll: Papers on the Theme: Water Management Below the Mogha
R-18.4 Volume-IV Papers on the Theme: Environmenlal Management of Irrigated Lands
R-18.5 Voiume-v: Papers on the Theme: Institutional Development
R-19 Detailed Soil Survey of Eight Sample Watermurse Command Areas Soil Survey of Pakistan Nov in Chishtian and Hasilpur Tehsils iIMI-Pakistan 1996
R-20 Unsteady Flow Simulation of the Designed Pehur High-Level Canal Zaigham Habib D.3C and Proposed Remodeling of Machai and Miara Branch Canals, Kobkiat Pongput 1996 North West Frontier Province, Pakistan Gaylord V. Skogerboe
R-21 Salinity Management Alternatives for the Rechna Doab. Punjab, Gauhar Rehman May Pakistan Waqar A. Jehangir 1997
Abdul Rehman
Gayiord V. Skcgerboe R-21.1 Volume One: Prindpal Findings and Implications for Muhammad Aslam
R-21.2 Volume Two: Histwy of Irrigated Agriculture: A Select Gauhar Rehman Jan
Sustainable Irrigated Agriculture
Appraisal Hassan Zia Munawwar 1997 Asahar Hussain

R-28 Hydraulic Characteristics of Pilot Distributaries in the Mirpurkhas. Sanghar and Nawabshah Districts. Sindh. Pakistan
Bakhshal Lashari Gaylord V. Skogerboa
Rubina S i i u i
Author I Year II Title
Volume Three: Development of Procedural and Analytical Llniks Jail 1997
Gauhar Rehman Muhammad Astam Waqar A. Jehangir
Abdul Rehman Aschar Hussain
Nazim Ali Hassan Zia Munawwar
Gauhar Rehman Muhammad Aslam Waqar A. Jehangir
Mobin Ud Din Ahmed HaSSan Zia Munawwar
Asghar Hussain Nazim Aii Falzan Ali Samia Ali
Volume Four: Field Data Collection and Pracesslw Jan 1997
R-21.4
R-21.5 I Volume Five: Predicting Future Tubewell Salinity Discharges I Muhammad Aslam Jan 1997 - Feb 1997
R-21.6
R-21.7
~- Waqar A Jehangir
Nazim Ail
Gauhar Rehman Asghar Hussain
Hassan Zia Munawar
Abdui Rehman Gauhar Rehman
Hassan Zia Munawar
Niwias Cmdom
Volume Six: Resource Use and Prcductlvity Potential in the Irrigated Agriculture
InIUative for Upscaling: trrigatbn Subdivisjon as the Building Block
Volume Seven: npr 1997
- Apr
1997 R-21.6 Volume Eight: Options for Sustainabiiily: Sector-Level
Allocations and Investments
R-22 Salinisation. Alkaiinisation and Sodification on Irrigated Areas in Pakistan: Characterisallon of the geochemical and physical processes and the impact of irrigation water on these processes by the use 01 a hydro-geochemical model (M.Sc Thesk published as Research Reonrll
March 1997
- March 1997
R-23 Xavier Lilriw Alternative Scenarios for Improved Operations at the Main Canal Level: A Study of Fadwah Branch. Chishtian Sub-Division Using A Mathematical Flow Simulation Model(M.Sc Thesis published as Research Report)
Surface Irrigation Methods and Practices: Field Evaluation of the Irrigation Processes for Selected Basin irrigation Systems during Rabi 1995-96 Snasnn
- March 1997
- R-24 lneke Margot Kalwij
R-25 ~
Organizing Water Users lor Distributary. Management: Preliminary Results from a Pilot Study in the Hakra 4-R Distributaly 01 the Eastern Sadiqia Canal System of Pakistan’s Punjab Province
~
D.J. Bandaragoda Mehmwd UI Hassan
Zafar lqbal Mrza M. Asahar Cheema Waheed uz Zaman
April 1997
R-26 I Moving Towards Participatory Irrigation Management I D.J. Bandaragoda Yameen Meman
M Y 1997
June 1997
- R-27 Shahld Sarwar
H.M. Nafees I M.S. Shafioue
Fluctuations in Canal Waier Supplies: A Case Sludy
June 1997
L

Rewrt TiUe Author Year
R-32
R-29
R-30
R-31
R-33
lnlegratim of Agricultural Commodity Markets in the Sou& Punjab. July Pakislan 1997
Zubair Tahir
Impact of Irrigation. Salinity and Cultural Practices on Wheat Yields
Relating Farmers' Practices lo Colion Yields in Souheastern
Florence Pinlus Aug
P.D.B.J. Meerbach AUg
in Southeastern Punjab. Pakislan 1997
Punlab. Pakistan 1997
R-34
An Evaluation of Outlet Calibration Methods: A ccmtribution to me study on Collective Action f~ Water Management below the Outlet. Hakra 6-R Distributary
Arjen During 1997
Farmers' use of Basin, Furrow and Bed-and-Furrow. Irrigation Nanda M. Berkhout Sep Systems and the possibilities for traditional farmers to adopt the Farhat Yasmeen 1997
ineke M. Kalwij Bed-and-Furrow Irrigation Melhod. Rakhshanda MaqsoOd
Financial Feasiblity Analysis of Operation and Maintenance Costs Amin Sohani Sep for Water Users Federations on lhree distributaries in Province of Slndh. Pakistan.
1997
lneke Margot Kalwij oct Assessing the Field Irrigation Performance and Alternative Management Options for Basin Sulface Irrigation Systems through Hydrodynamic Modelling.
Socio-Economic Baseline Survey for Three Pilot Distributaries in Y a w n Memon Nov Sindh Province, Pakislan. Mehmood UI Hassan 1997
1997
Don Jayatissa Bandaragoda
Muhammad Asghar Cheema Dec Zafar lqbal Mirza 1997
Socio-Economic Basline SUNey for a Pilot Pmject on Waler Users Organizallons in Ihe Hakra 4-R Distribulary Command Area, Punjab. 1 . . .
M e h m d Ui Hassan Don Jayatissa Bandaragoda
R-35
Baseline SJrvey for Farmers Organuasons of Snanpur and M.mal Srna.1 Dams, PLniab. Padistan
R-36
MLhammdd Asghar Cheema Dec Don JayatlssD Bandaragoda 1997
R-37
JR1B

IIMI-PAKISTAN PUBLICATIONS
%No.
C-1
C-2
CONSULTANCY REPORTS
TiUe Author
Consultancy inputs for the preparation of project inception report on sodai organization in irrigation management
Regional Salinity - Sodicity Issues in Punjab. Pakistan
P. Ganewatle P. Pradhan
Or. James' W. Biggar COnsUllanCV ReDOrt
II I I 4 1 W R
C-3 Study of Water and Salt Balances fw Eight Sample Watercwrse Commands in Chishtian Sub-division. Punjab. Pakistan . Consul!ancy Rep&
E.G. van Wayjen
Or. Kobkial Pongput I Unsteady Flow Simulation of Pehur High-Level Canal Including Automatic II c-4 I Downsweam Water Level Control Gates - Consuitancv ReoMt
C-5 Distributary Level Water Users Assodations in Pltot Projects for Farmer- Managed irrigated Agriculture, Punjab and Sindh Provinms. Pakistan
Water Users Organization Program in IIMl's Pilot Projects in lhe Punjab and Sindh Provinces. Pakistan
Dr. P. Pradhan
C-8 Piyasena Ganewane
J.C. van Dam M. Aslam
C-7 Soil Salinity and Sodicity in Relation to lrriiation Water Quality, Soil Type and Farmer Management - Consultancy Repwt
C-8 Mainlenance of Water Management Systems for Irrigation in Pakistan: A Study Report Ltd
MM Pakistan (pvt) I 11 C-9 I Salinization of the Irrigated Soils in the Punjab (Pakistan) I SergeMarlet
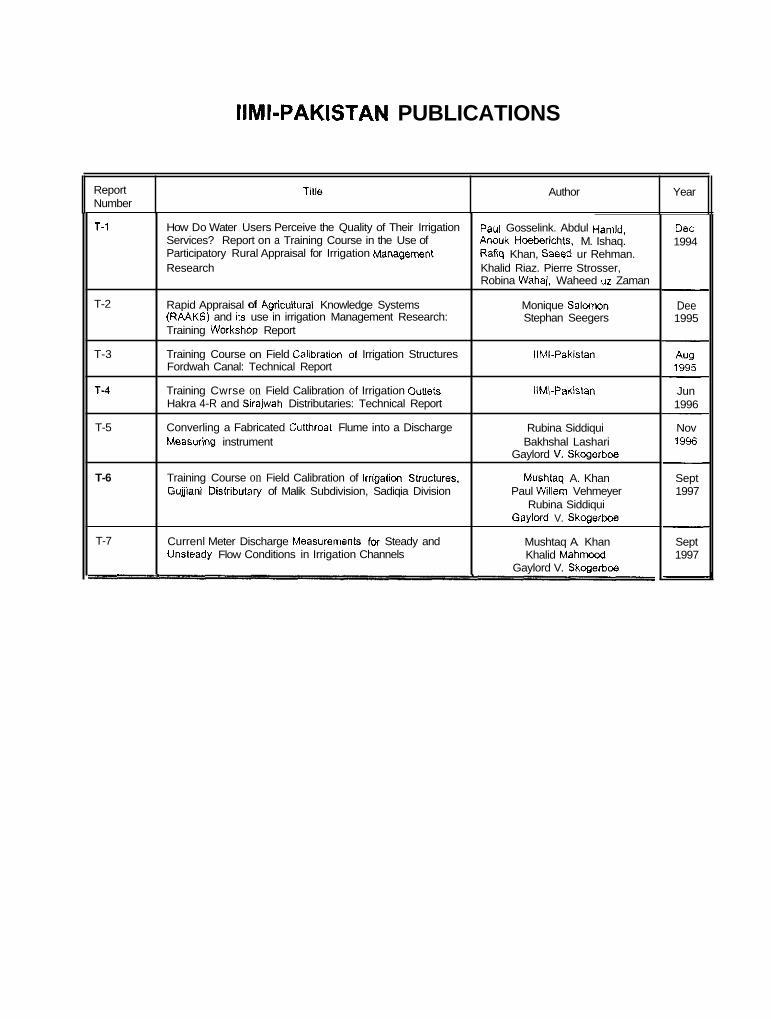
IIMI-PAKISTAN PUBLICATIONS
Report Number
Tille Author Year
T-1
T-2
T-3
T-4
T-5
T-6
T-7
~~~
How Do Water Users Perceive the Quality of Their Irrigation Services? Report on a Training Course in the Use of Participatory Rural Appraisal for Irrigation Management Research Khalid Riaz. Pierre Strosser,
Rapid Appraisal of Agricunural Knowledge Systems (RAAKS) and its use in irrigation Management Research: Training Wwkshop Report
Training Course on Field Calibralion of Irrigation Structures Fordwah Canal: Technical Report
Training Cwrse on Field Calibration of Irrigation Outlets Hakra 4-R and Sirajwah Distributaries: Technical Report
Converling a Fabricated Cutlhroal Flume into a Discharge Measurino instrument Bakhshal Lashari
Paul Gosselink. Abdul Hamid, Anouk Haeberichts. M. Ishaq. Rafiq Khan, Saeed ur Rehman.
Robina Wahaj. Waheed uz Zaman
Monique Salomon Stephan Seegers
IIMI-Pakistan
iIMI-Pakistan
Rubina Siddiqui
Gaylord V. Skogerboe
Mushlaq A. Khan Paul Willem Vehmeyer
Rubina Siddiqui Gayiwd V. Skcgerboe
Mushtaq A. Khan Khalid Mahmmd
Gaylord V. Skogerbm
Training Course on Field Calibration of Irrigalion Slruclures. Gufliani Distributaw of Malik Subdivision, Sadiqia Division
Currenl Meter Discharge Measuremenls fw Steady and Unsleady Flow Conditions in Irrigation Channels
Dec 1994
- Dee 1995
- Auo 1995
Jun 1996
Nov 1996
-
-
- Sept 1997
- Sept 1997
L

I I MI -PAKISTAN PUB L I CAT1 0 N S
Reporl Number
P-1
P-2
TiUe AUlhw
IIMI-PAKISTAN (Project Leader
DJ.Bandaragoda)
M. Shabbir Haider Mushtaq Khan
Pilot ProJect for Farmer-Managed Irrigated Agriculture under the Left Bank Oulfail Drain Stage I Project. Pakistan: inception Report and lrnpiementation Plan
Research Opportunities in Canal Irrigation Management in Malik Subdivision, Sadiqia Canal Division. Bahawalnagar: incepli i Repoil
71 March
IiMI-PAKISTAN (Proiect Leader
D.J.Bandaraac&\
Social Organizabon for Improved System Management and Sustainable Irrigated Agriculture In Small Dams: Inception 11 p-5 1 RePOd

S No Titie Auumor
Niels Biaauw Reconnaissance Study into Waterlogging and Salinity Research I Paill HeinshroPk
Year
5-2.
5.3.
Hydraulic Pedormance of Fordwah Branch Irrigation Canal in Punjab, Pakistand (During Rabi Season)
John Jambs
S-4.
Alternative Water Managemenl Systems in Vle,Punjab
Development of Watercourse-based model to assess the
Calibration and application of a hydraulic model for the
canal water supply at the farm level.
operation of an irrigation canal - A study in the Chistian Subdivision, Fordwah/Eastern Sadiqia Area, Punjab - Pakistan.
s-5.
A.T. van Essen 1992
J. Barral 1994
Nicoias Rwille 1994
Development 01 a twi to assess the impact of water markets on agricultural production in Pakistan.
Setting up a database for analysis the relatiaship k lween various irrigation related variables and soil salinity.
Impact of irrigation and cultural practices on wheal yields: A studv of FordwahIEaslern Sadiaia area. Punaib-Pakistan.
S-6.
5-7.
~~ ~
Jean-Daniel Rinaudo 1994
Nicolas CONDOM 1995
Flwence Pintus 1995 S-8.
s-9,
s-10.
Impact of irrigation and witural Practices on wheat yields: A study of FordwahIEastern Sadiqia Area, Punjab-Pakistan lAlso oublished as Research Reoortb.
Suspended sediment behavior modeling in ikrigation canals of Pakistan Operation, Malntenance and sedimentation in irrigation canals - A joint research project by ISRIP, IlMl and Cemagref
Florence Pintus
Alexandre VABRE
1995
- 1995
s-11. I- s-12.
Monitoring Soil salinity in irrigation schemes by the use of remote sensing and GiS - Study case: Fordwah irrigation scheme - Pakistan. A brief synthesis of the final version in French.
Alternative scenaries for improved operations at the main canal ievei: A Study of Fordwah Branch, Chistian subdivision using a mathematical flow simulation model.
in search of Water Users. Perspectives of irrigation pelformance - a participatory research approach.
I
5-13,
:
I"'" Research into the relationship between maintenance and water distribution at the distributwy level in the Punjab (Final report)
S-15. Modelling the Effects of Irrigation Management on Sdl Salinity and Crop Transpiration at the Field Level
S-16.
Dunia TABET 1995
----tGT Xavier LlTRlCO
Anouk Hceberichb
W.W.H. Hart
S.M.P. Smets
Antoine Rozenknop 1995 Cyril Loisel

I
S.No. Title Author Year
II Punjab, Pakistan (also published as Research Report) I/
S-17. Canal Waler Distribution at the Secondary Level in the Steven Visser
/I s-18'
1996
Gilles Belaud I Modeling of Sediment Transport in Irrigation Canals of Pakistan: Examples of application (also oublished as Research Reoortl
Water Markets in Pakistan: Qualitative and Quantitative Analysis Using an Economic Modelling TwI
Relating Farmers' Practices to Cotton Yields in Sotheaslern
GiS in an intengrated approach to study irrigation system
Punjab, Pakistan (also published as Research Report)
I Igg6 II
Sophie E. Richard 1996
P.D.E.J. Meerbach Aug
F.J. Schonenmakers Aug
1997
s-19
s-20
5-21
5-22.
5-23
Alexandre Vabre I Methodologies for Design. Operation and Maintenance of Irrigation Canals Subject lo Sediment Problems Application I 11 I/ lo fakistan (Final Riport): (also published as Research Report)
Methodolouies for Desiqn. ODeration and Maintenance of I Alexandre Vabre I 1996 11 Irrigation canals Subjecl to Sediment Problems Application to Pakistan (Literature Review on Practices in Pakislan)
performance I 1997 I I