Embed Size (px)
Citation preview
Guide and Walkthrough
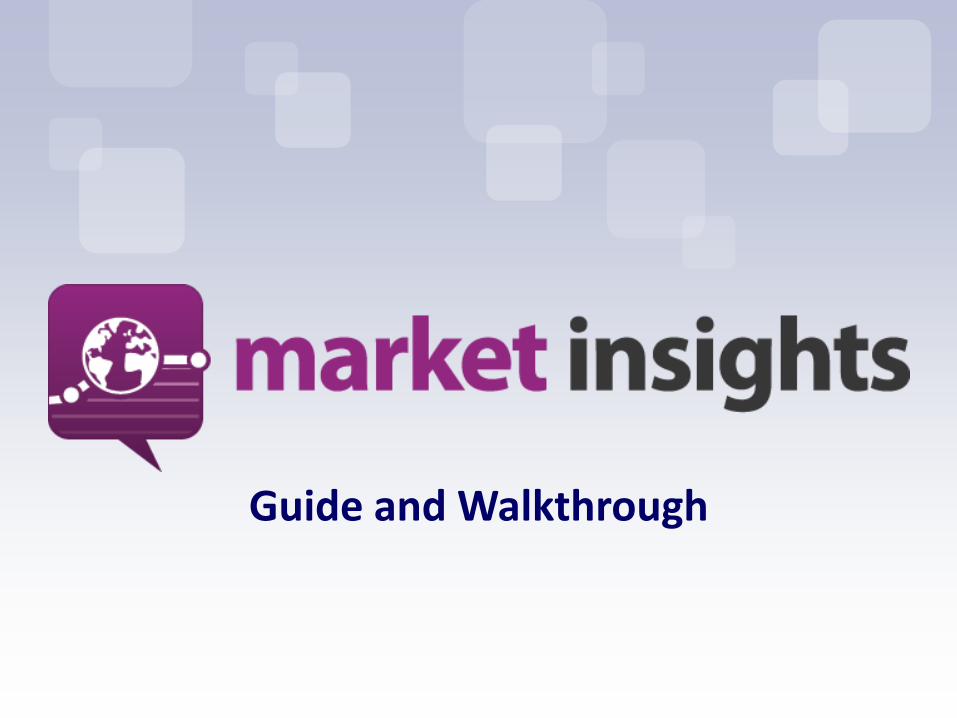
Getting Started
› Once you log in to the
Market Insights a
welcome screen will
appear.
› To get started, click on
Choose a Market and
select the desired market
that you want to know
more about.
› You can select as many markets as your product plan allows.
› If you choose a market by accident, you can easily remove it by
clicking on the X sign located next to it.
› Once you are satisfied with your selection. Confirm the selected
markets by clicking on the Confirm selection button.
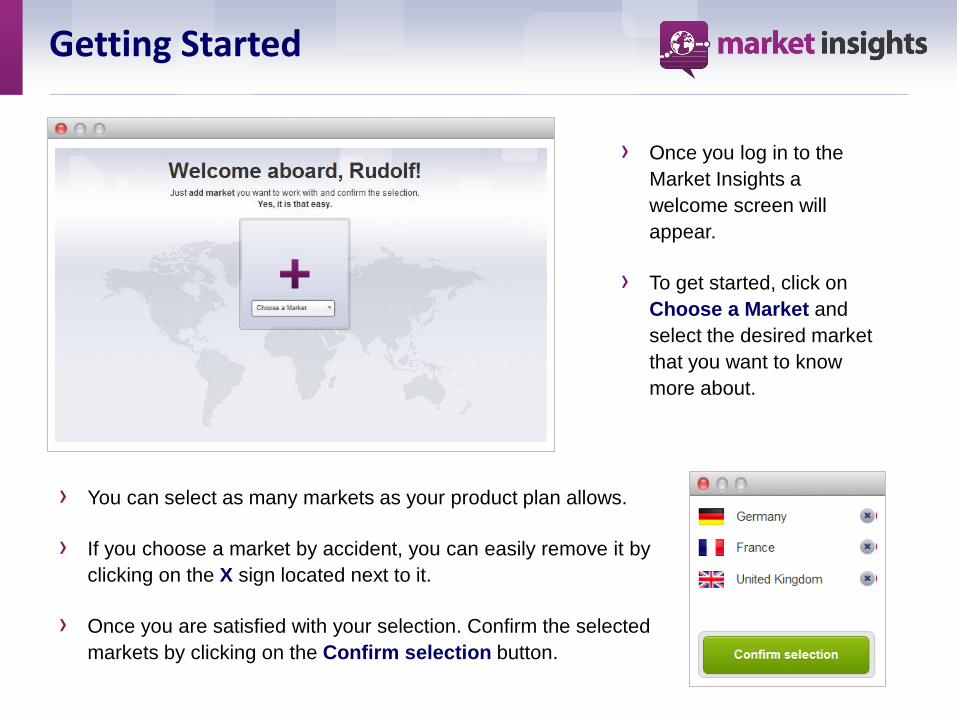
› You can select a particular market by ticking the box at the bottom.
› You can easily delete a market by clicking on the Delete Market button on the top right side.
Selected Markets
Once you have chosen the markets they will appear in the main dashboard in separate
boxes. You will be able to see basic information about the markets such as the Number
of Facebook users, Gender Demographics as well as overall Facebook Penetration.
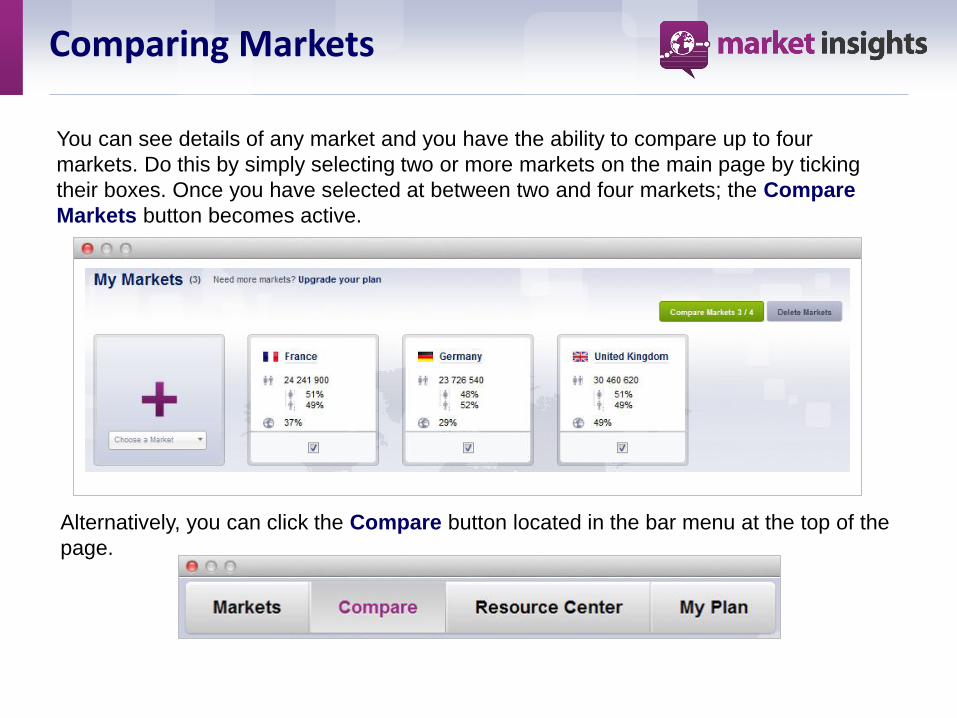
Comparing Markets
You can see details of any market and you have the ability to compare up to four
markets. Do this by simply selecting two or more markets on the main page by ticking
their boxes. Once you have selected at between two and four markets; the Compare
Markets button becomes active.
Alternatively, you can click the Compare button located in the bar menu at the top of the
page.
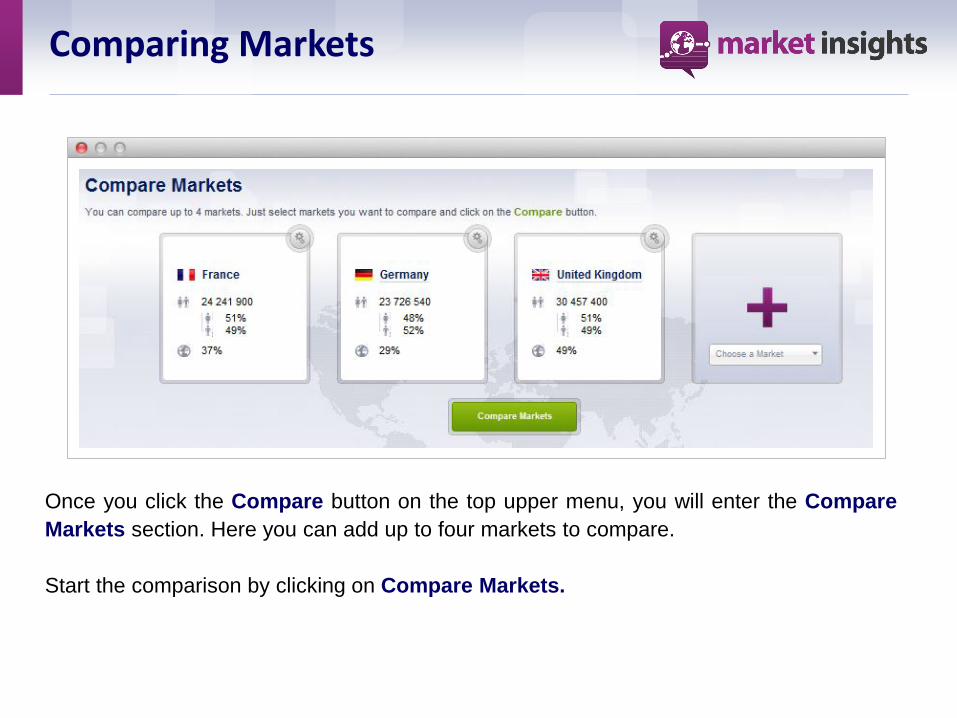
Comparing Markets
Once you click the Compare button on the top upper menu, you will enter the Compare
Markets section. Here you can add up to four markets to compare.
Start the comparison by clicking on Compare Markets.
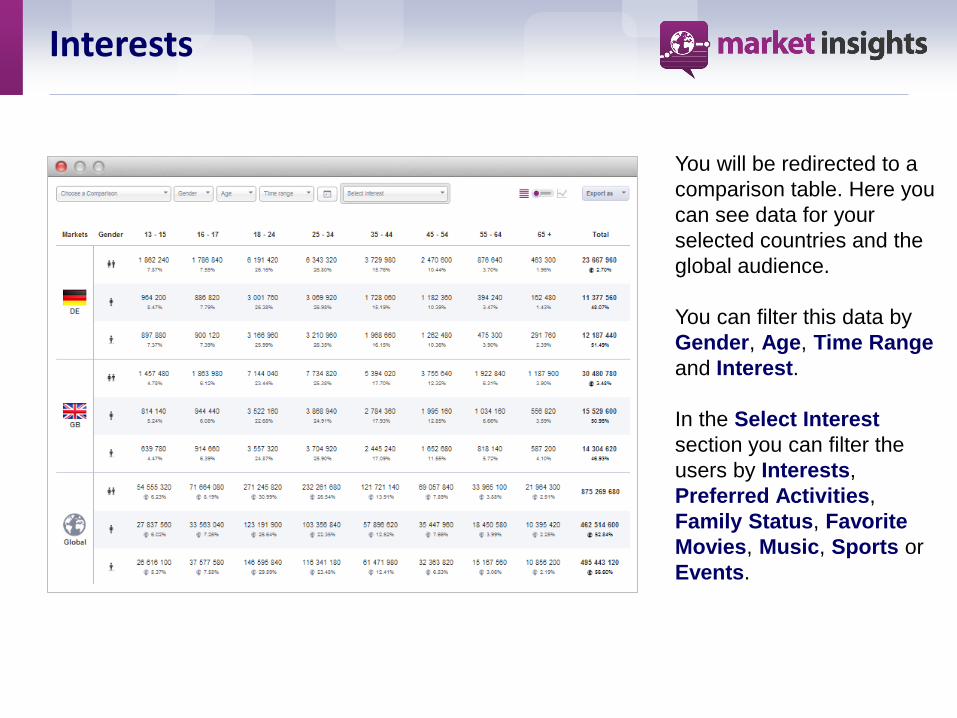
Interests
You will be redirected to a
comparison table. Here you
can see data for your
selected countries and the
global audience.
You can filter this data by
Gender, Age, Time Range
and Interest.
In the Select Interest
section you can filter the
users by Interests,
Preferred Activities,
Family Status, Favorite
Movies, Music, Sports or
Events.
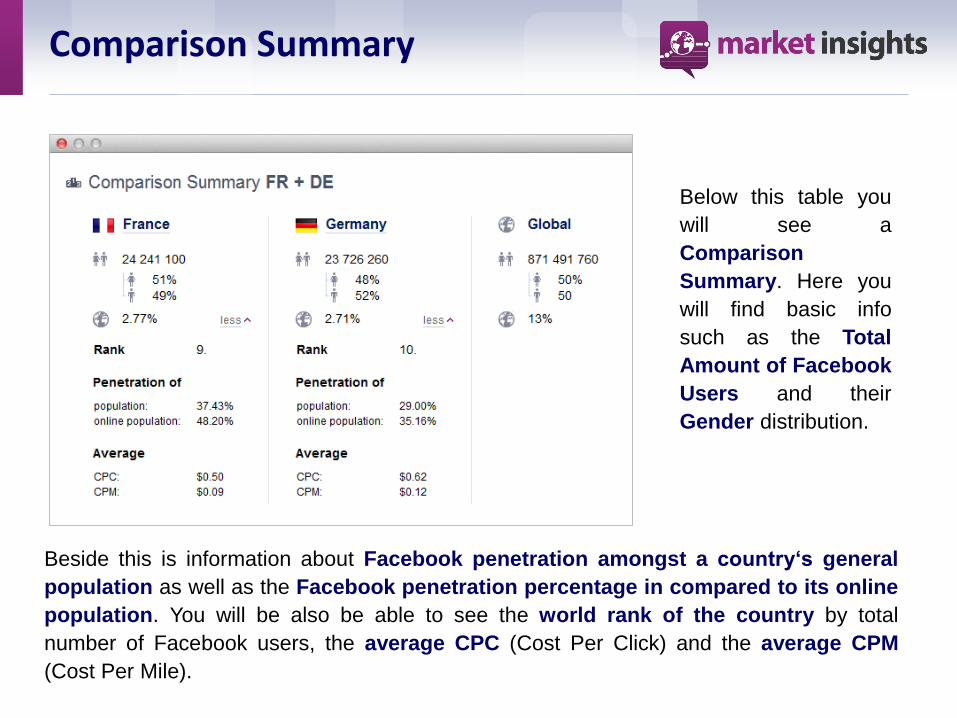
Below this table you
will see a
Comparison
Summary. Here you
will find basic info
such as the Total
Amount of Facebook
Users and their
Gender distribution.
Comparison Summary
Beside this is information about Facebook penetration amongst a country‘s general
population as well as the Facebook penetration percentage in compared to its online
population. You will be also be able to see the world rank of the country by total
number of Facebook users, the average CPC (Cost Per Click) and the average CPM
(Cost Per Mile).
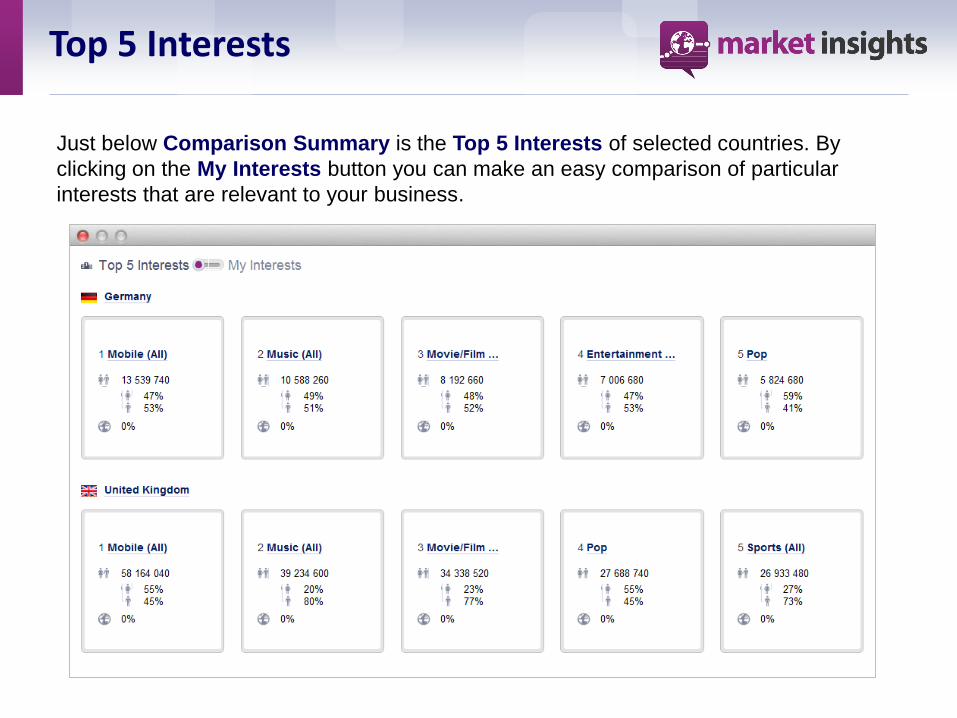
Top 5 Interests
Just below Comparison Summary is the Top 5 Interests of selected countries. By
clicking on the My Interests button you can make an easy comparison of particular
interests that are relevant to your business.
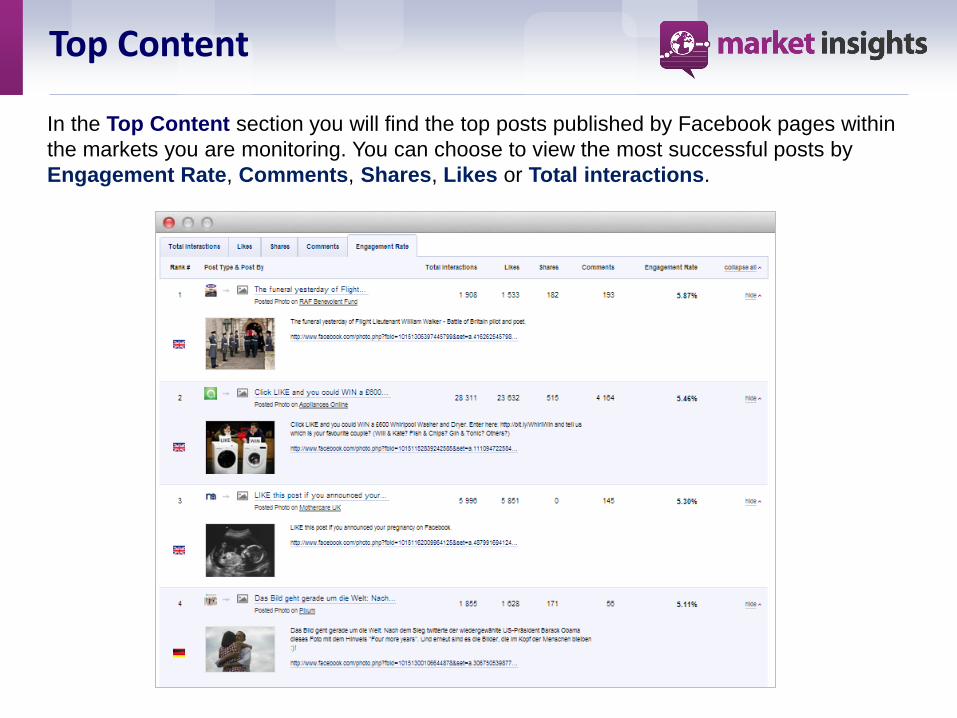
Top Content
In the Top Content section you will find the top posts published by Facebook pages within
the markets you are monitoring. You can choose to view the most successful posts by
Engagement Rate, Comments, Shares, Likes or Total interactions.
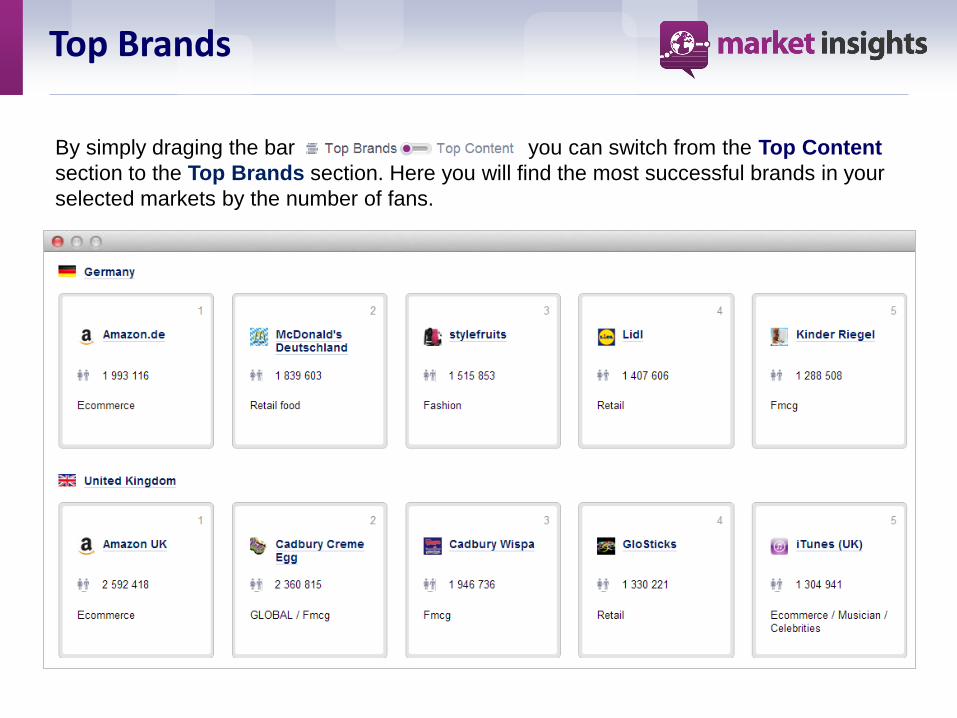
Top Brands
By simply draging the bar you can switch from the Top Content
section to the Top Brands section. Here you will find the most successful brands in your
selected markets by the number of fans.
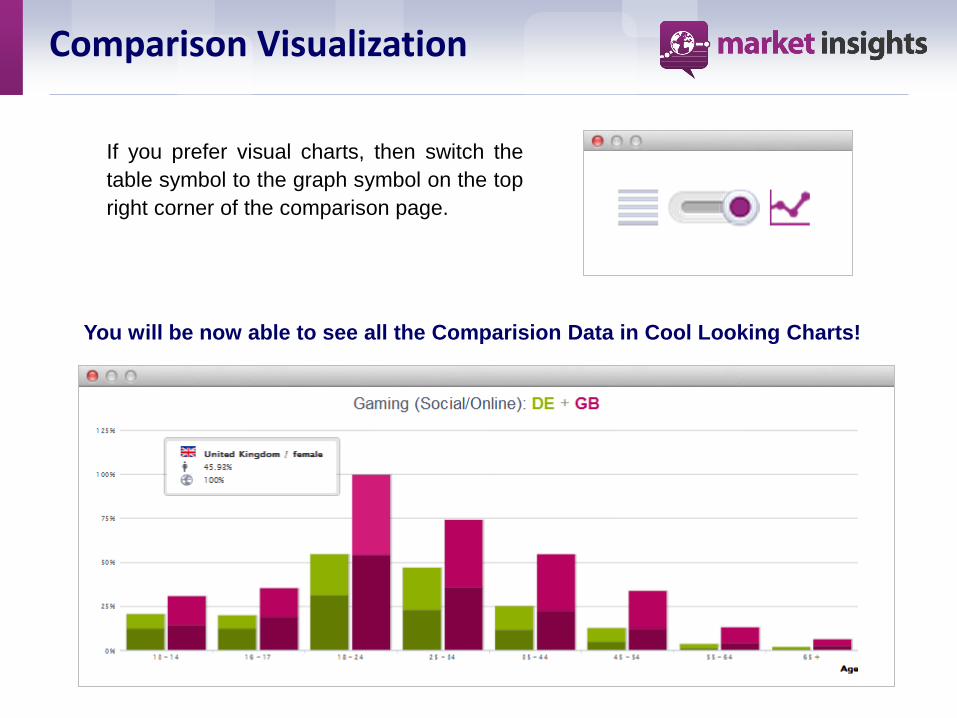
If you prefer visual charts, then switch the
table symbol to the graph symbol on the top
right corner of the comparison page.
Comparison Visualization
You will be now able to see all the Comparision Data in Cool Looking Charts!
Comparision Visualization
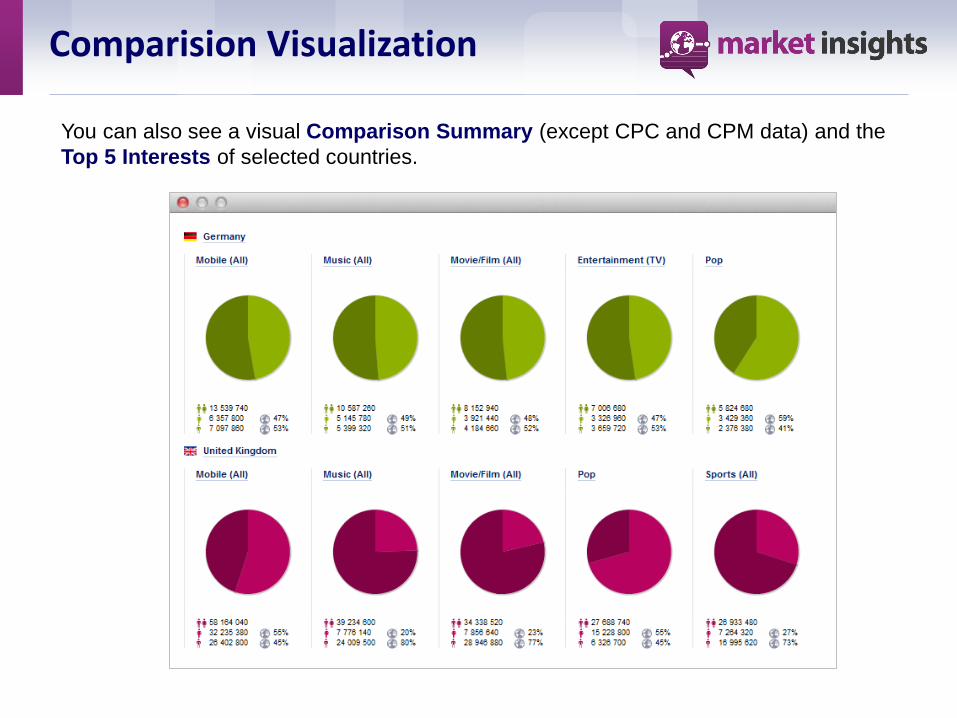
You can also see a visual Comparison Summary (except CPC and CPM data) and the
Top 5 Interests of selected countries.
Adding and Saving Comparision
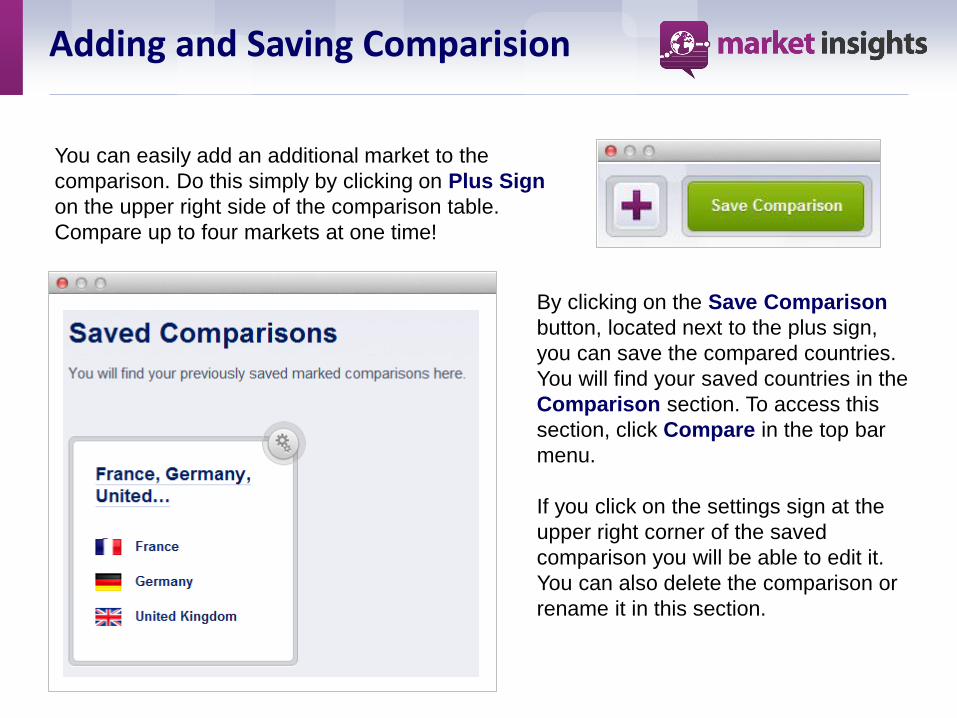
You can easily add an additional market to the
comparison. Do this simply by clicking on Plus Sign
on the upper right side of the comparison table.
Compare up to four markets at one time!
By clicking on the Save Comparison
button, located next to the plus sign,
you can save the compared countries.
You will find your saved countries in the
Comparison section. To access this
section, click Compare in the top bar
menu.
If you click on the settings sign at the
upper right corner of the saved
comparison you will be able to edit it.
You can also delete the comparison or
rename it in this section.
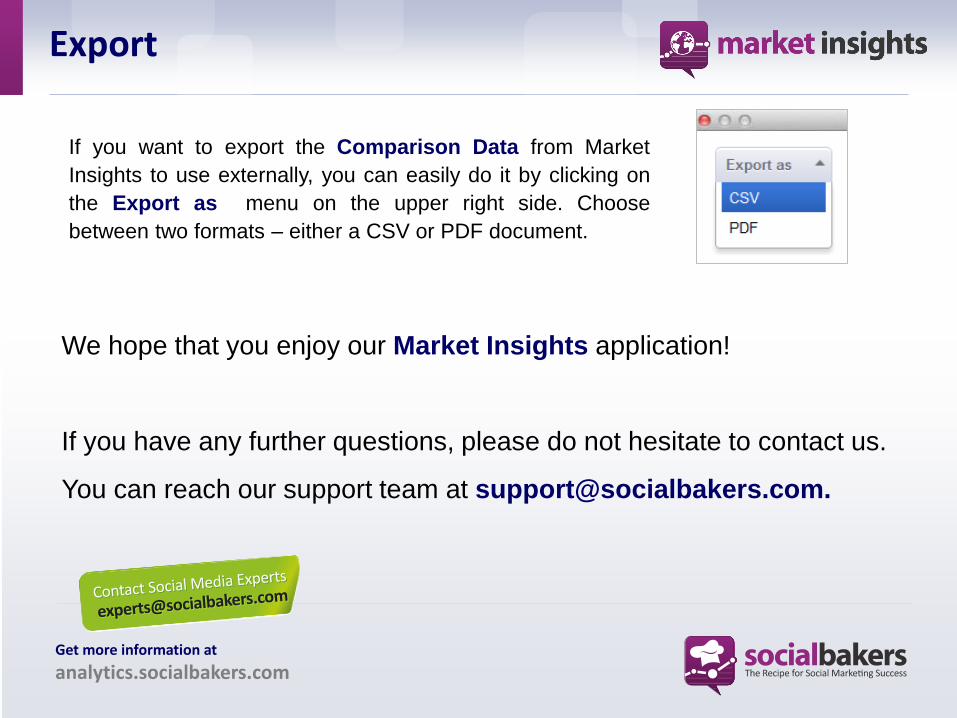
If you want to export the Comparison Data from Market
Insights to use externally, you can easily do it by clicking on
the Export as menu on the upper right side. Choose
between two formats – either a CSV or PDF document.
Export
We hope that you enjoy our Market Insights application!
If you have any further questions, please do not hesitate to contact us.
You can reach our support team at [email protected].
Get more information at
analytics.socialbakers.com