Embed Size (px)
Citation preview

Social Welfare and Policy Analysis
Measuring the Gains from Trade
• Whenever an exchange (or trade) takes place between a consumer and a producer, both parties gain from that exchange (or trade)
• The consumer’s gain from the trade is termed as– The consumer’s surplus
• The producer’s gain from the trade is termed as– The producer’s surplus
• The sum of the consumer’s and producer’s surplus is the total gains from a particular trade (or exchange).
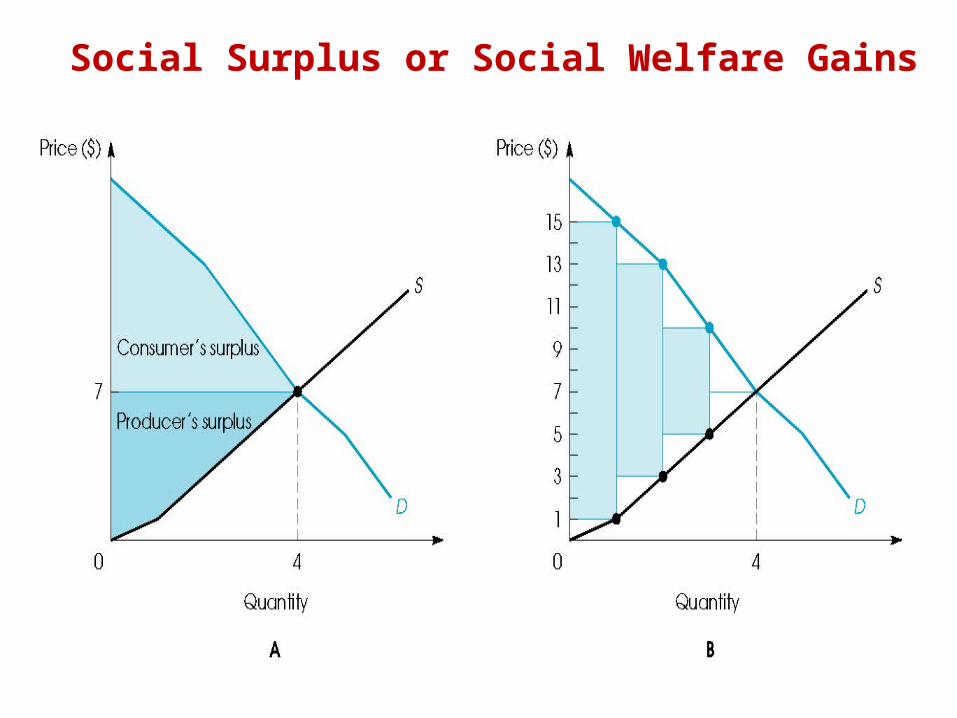
Social Surplus or Social Welfare Gains
• Social Surplus or Social Welfare Gains: The sum of the surpluses from trade of a commodity or service to all participants (all consumers and producers)
• Social surplus from all exchanges of a commodity occurred at a particular point in time can be calculated in the same way, using the aggregate (market) demand and supply functions (curves)– Consumers’ surplus is the area of the triangle between the
equilibrium price line and the market demand curve– Producers’ surplus is the area of the triangle between the
equilibrium price line and the market supply curve
• Social Surplus Gain= Consumers’ Surplus + Producers’ Surplus
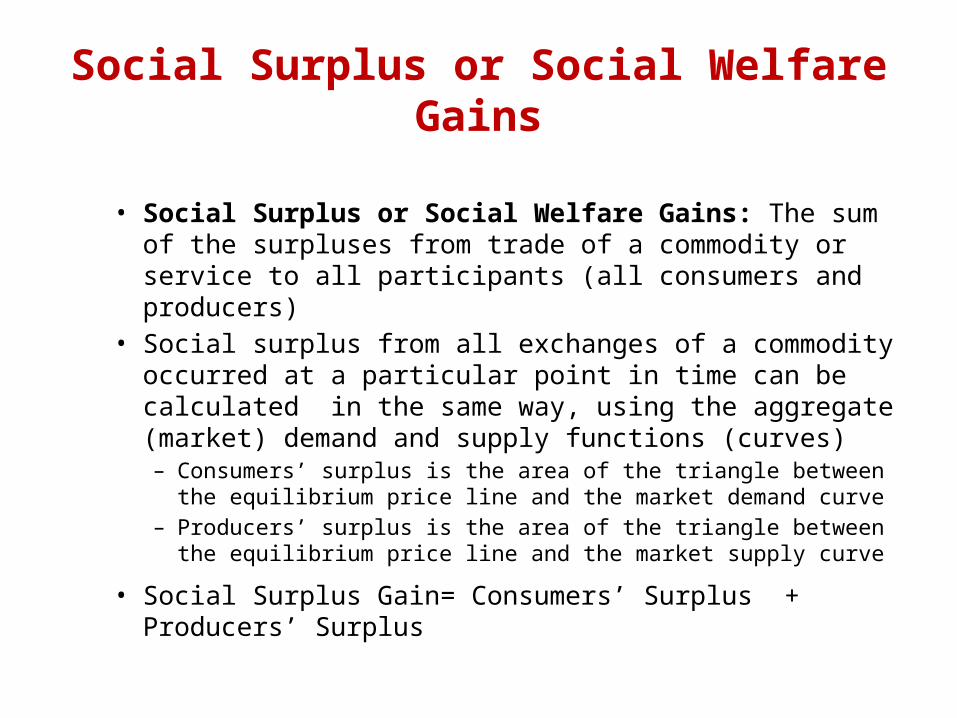
Consumers’ Surplus in the Market
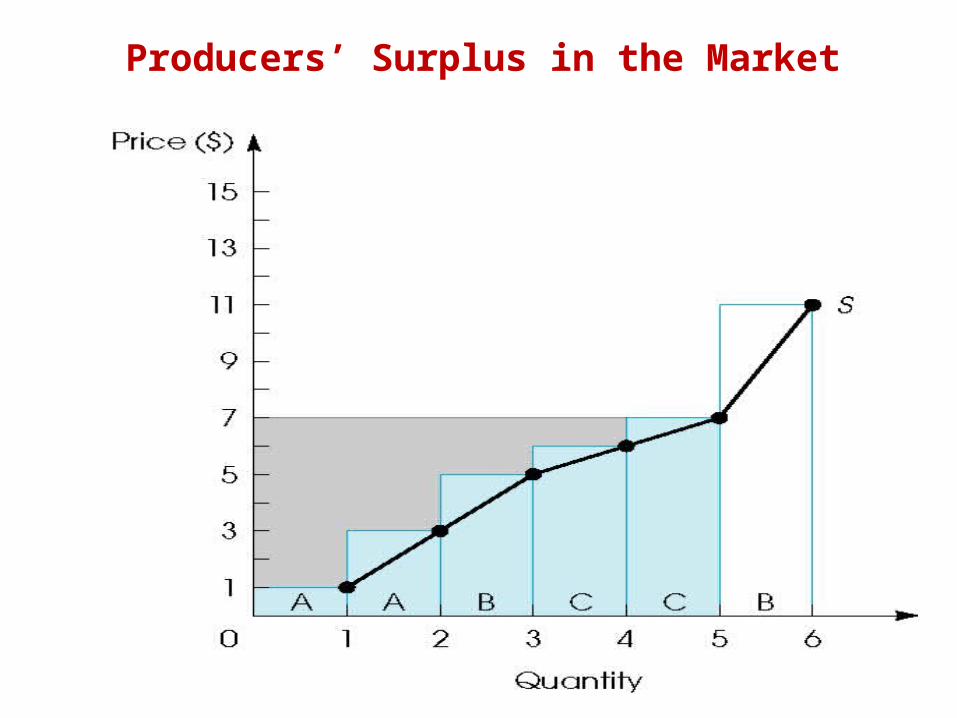
Producers’ Surplus in the Market
Social Surplus or Social Welfare Gains
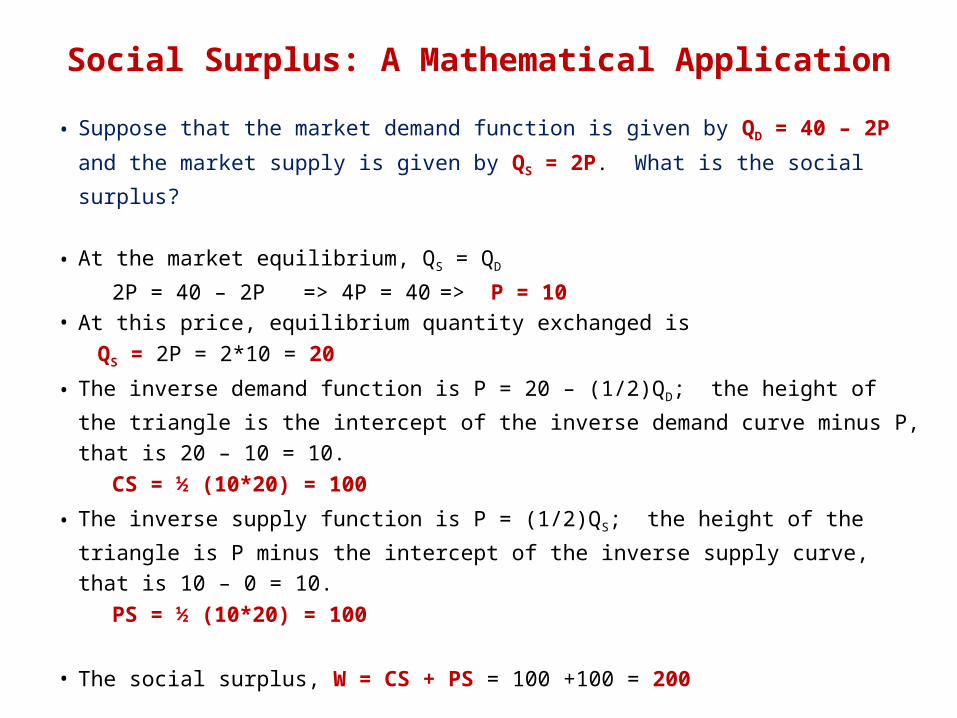
Social Surplus: A Mathematical Application
• Suppose that the market demand function is given by QD = 40 – 2P and the
market supply is given by QS = 2P. What is the social surplus?
• At the market equilibrium, QS = QD
2P = 40 – 2P => 4P = 40 => P = 10• At this price, equilibrium quantity exchanged is
QS = 2P = 2*10 = 20
• The inverse demand function is P = 20 – (1/2)QD; the height of the triangle is
the intercept of the inverse demand curve minus P, that is 20 – 10 = 10. CS = ½ (10*20) = 100
• The inverse supply function is P = (1/2)QS; the height of the triangle is P minus
the intercept of the inverse supply curve, that is 10 – 0 = 10. PS = ½ (10*20) = 100
• The social surplus, W = CS + PS = 100 +100 = 200
Competition Maximizes Welfare
• How should we measure society’s welfare?• If we agree to weighting the well-being of consumers and
producers equally, then welfare can be measured W = CS + PS
• Producing the competitive quantity maximizes welfare.• Put another way, producing less than the competitive level of
output lowers total welfare.• Deadweight Loss (DWL) is the name for the net reduction in
welfare from the loss of surplus by one group that is not offset by a gain to another group.
How Competition Maximizes Welfare
• The reason that competition maximizes welfare is that price equals marginal cost at the competitive equilibrium.• Consumers value the last unit of output by exactly the
amount that it costs to produce it.
• A market failure is inefficient production or consumption, often because a prices exceeds marginal cost.• Example: Deadweight loss of Christmas presents
How Competition Maximizes Welfare
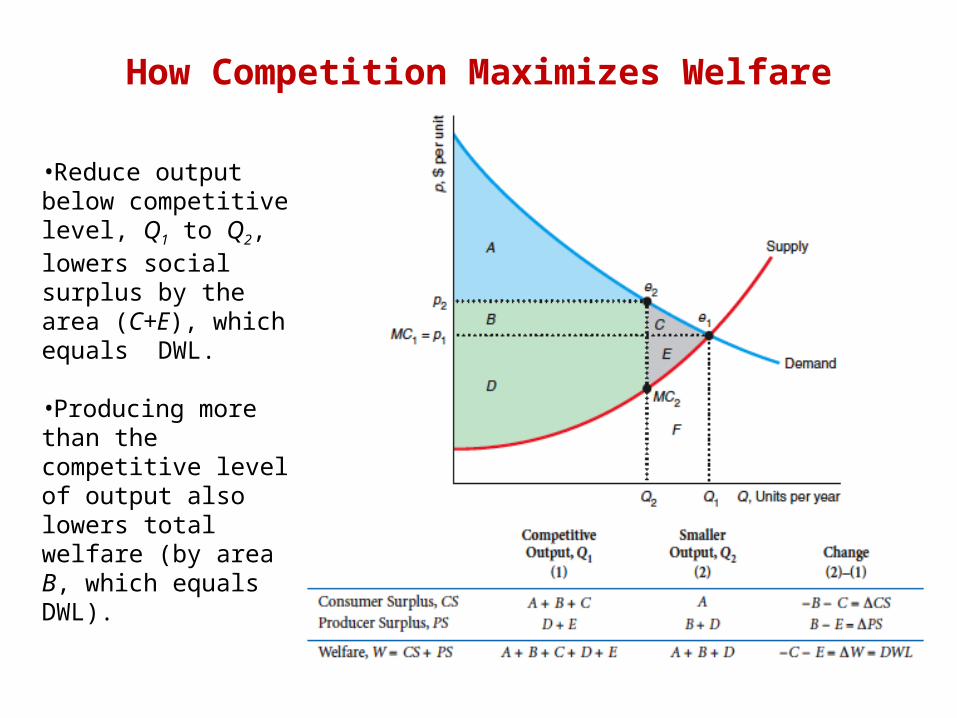
•Reduce output below competitive level, Q1 to Q2, lowers social surplus by the area (C+E), which equals DWL.
•Producing more than the competitive level of output also lowers total welfare (by area B, which equals DWL).

Policies That Shift Demand and Supply Curves
• Welfare is maximized at the competitive equilibrium • Government actions can move us away from that competitive
equilibrium• Thus, welfare analysis can help us predict the impact of various
government programs• We will examine several policies that shift market demand:
– Change in consumers’ income– Sales tax collected from the consumers– Price subsidy
• We will examine several policies that shift supply:1. Restricting the number of firms2. Raising entry and exit costs
Policies That Shift Demand CurvesIncrease in Consumers’ Income
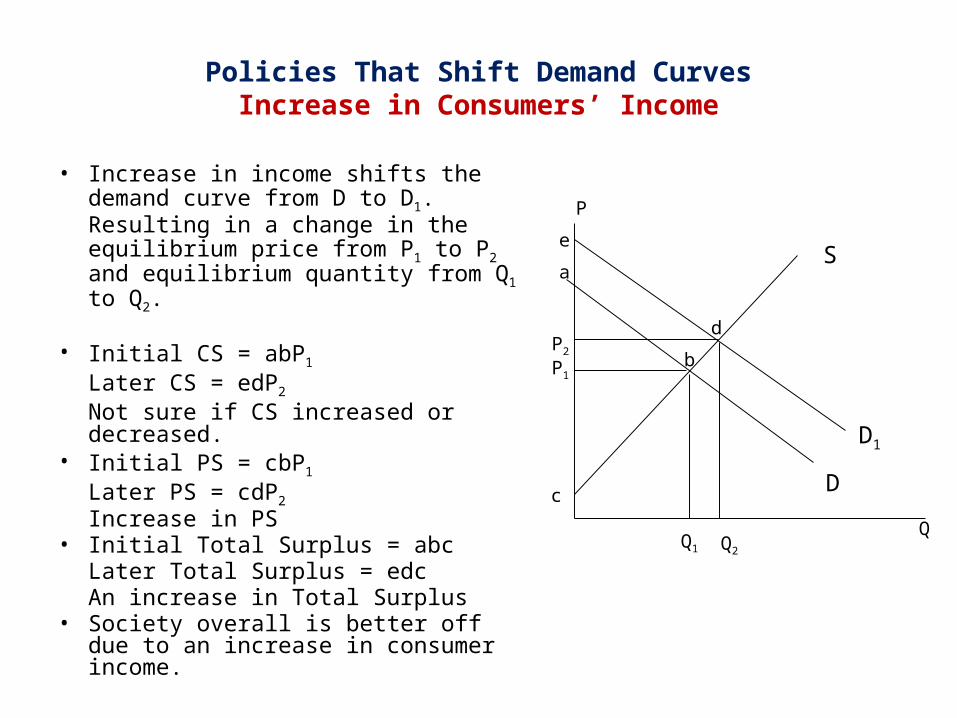
• Increase in income shifts the demand curve from D to D1.Resulting in a change in the equilibrium price from P1 to P2 and equilibrium quantity from Q1 to Q2.
• Initial CS = abP1
Later CS = edP2
Not sure if CS increased or decreased.• Initial PS = cbP1
Later PS = cdP2
Increase in PS• Initial Total Surplus = abc
Later Total Surplus = edcAn increase in Total Surplus
• Society overall is better off due to an increase in consumer income.
Q
P
D
S
Q1
P1
a
b
c
D1
Q2
P2
d
e
Policies That Shift Demand CurvesSales Tax Collected from the Consumers
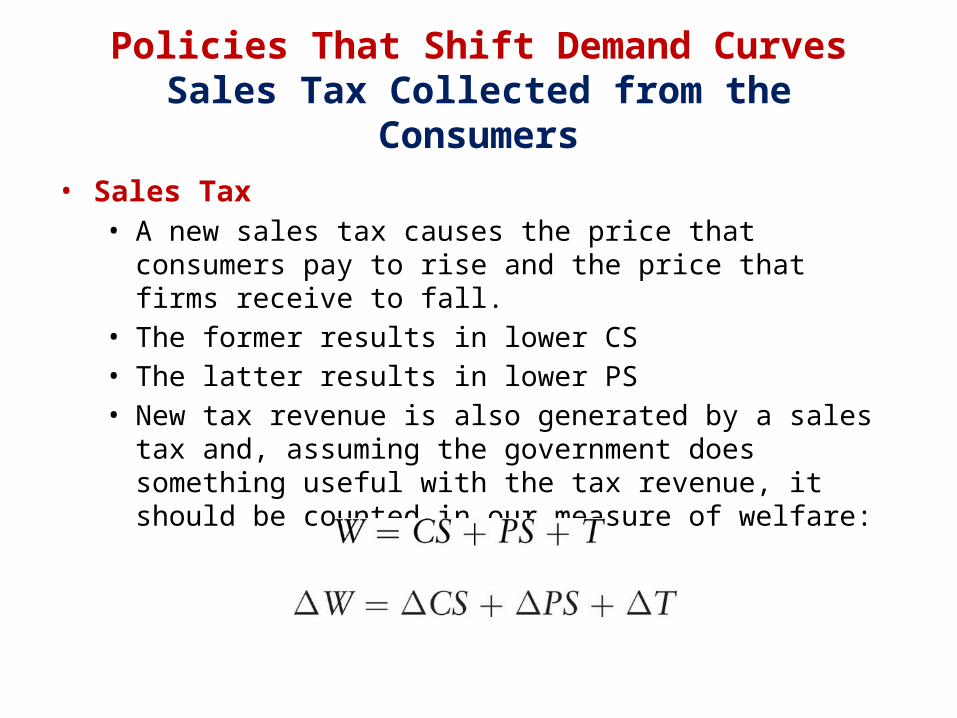
• Sales Tax• A new sales tax causes the price that consumers pay to rise and the
price that firms receive to fall.• The former results in lower CS• The latter results in lower PS• New tax revenue is also generated by a sales tax and, assuming the
government does something useful with the tax revenue, it should be counted in our measure of welfare:
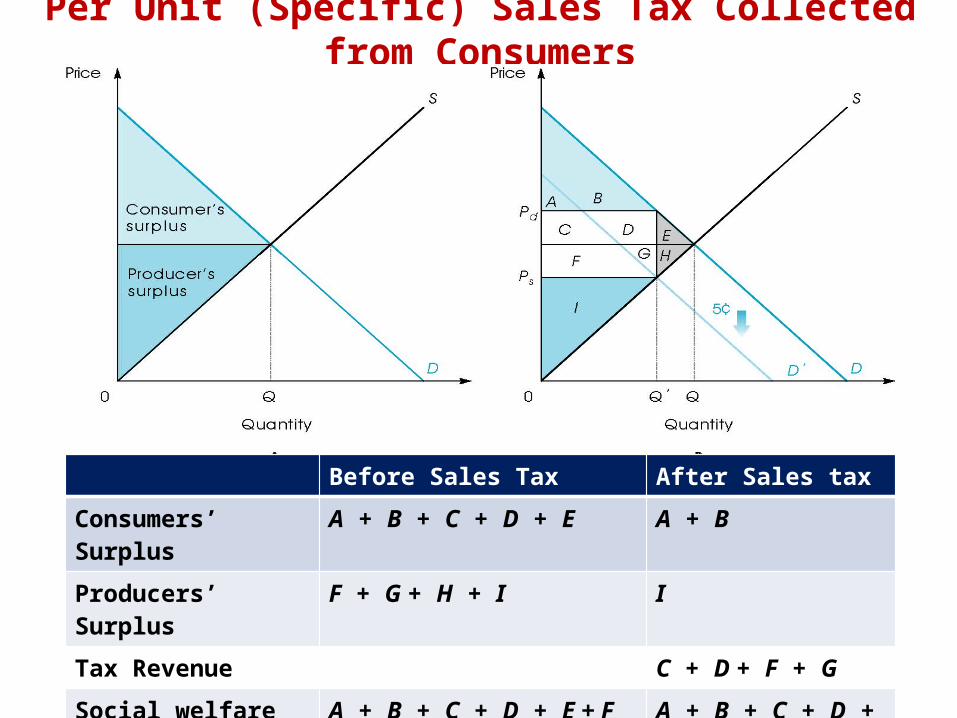
Per Unit (Specific) Sales Tax Collected from Consumers
Before Sales Tax After Sales taxConsumers’ Surplus A + B + C + D + E A + BProducers’ Surplus F + G + H + I ITax Revenue C + D + F + G Social welfare Gain A + B + C + D + E + F + G + H + I A + B + C + D + F + G + I Deadweight Loss E + H
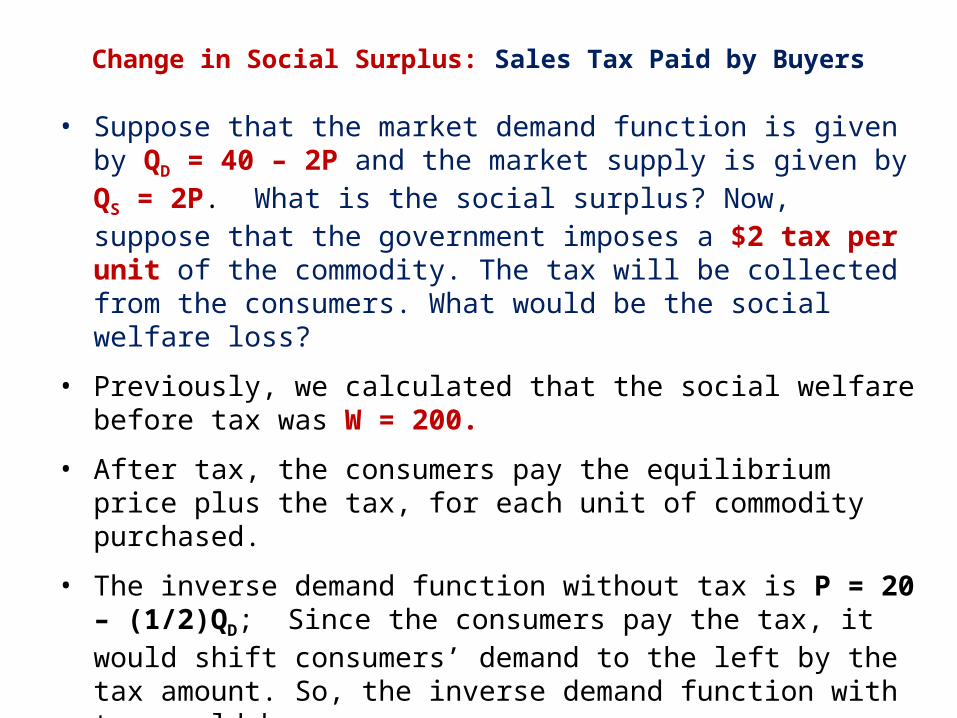
Change in Social Surplus: Sales Tax Paid by Buyers
• Suppose that the market demand function is given by QD = 40 – 2P and the market supply is given by QS = 2P. What is the social surplus? Now, suppose that the government imposes a $2 tax per unit of the commodity. The tax will be collected from the consumers. What would be the social welfare loss?
• Previously, we calculated that the social welfare before tax was W = 200.
• After tax, the consumers pay the equilibrium price plus the tax, for each unit of commodity purchased.
• The inverse demand function without tax is P = 20 – (1/2)QD; Since the consumers pay the tax, it would shift consumers’ demand to the left by the tax amount. So, the inverse demand function with tax would be
P + 2 = 20 – (1/2)QD
=> P = 18 – (1/2)QD
=> (1/2)QD = 18 – P=> QD = 36 – 2P
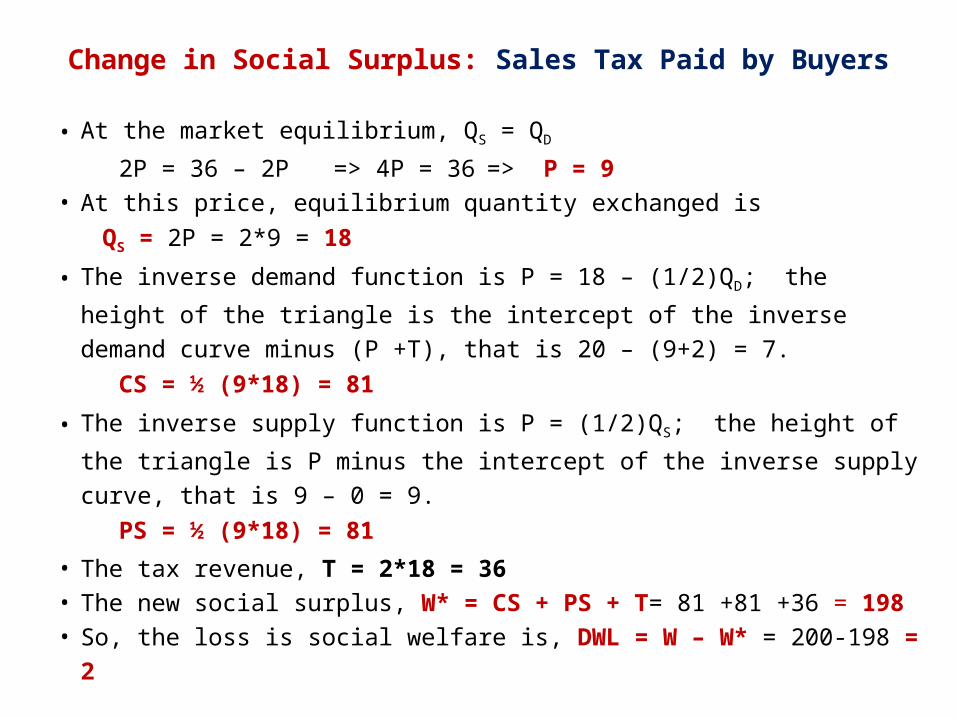
• At the market equilibrium, QS = QD
2P = 36 – 2P => 4P = 36 => P = 9• At this price, equilibrium quantity exchanged is
QS = 2P = 2*9 = 18
• The inverse demand function is P = 18 – (1/2)QD; the height of the
triangle is the intercept of the inverse demand curve minus (P +T), that is 20 – (9+2) = 7.
CS = ½ (9*18) = 81
• The inverse supply function is P = (1/2)QS; the height of the triangle is P
minus the intercept of the inverse supply curve, that is 9 – 0 = 9. PS = ½ (9*18) = 81
• The tax revenue, T = 2*18 = 36• The new social surplus, W* = CS + PS + T= 81 +81 +36 = 198• So, the loss is social welfare is, DWL = W – W* = 200-198 = 2
Change in Social Surplus: Sales Tax Paid by Buyers
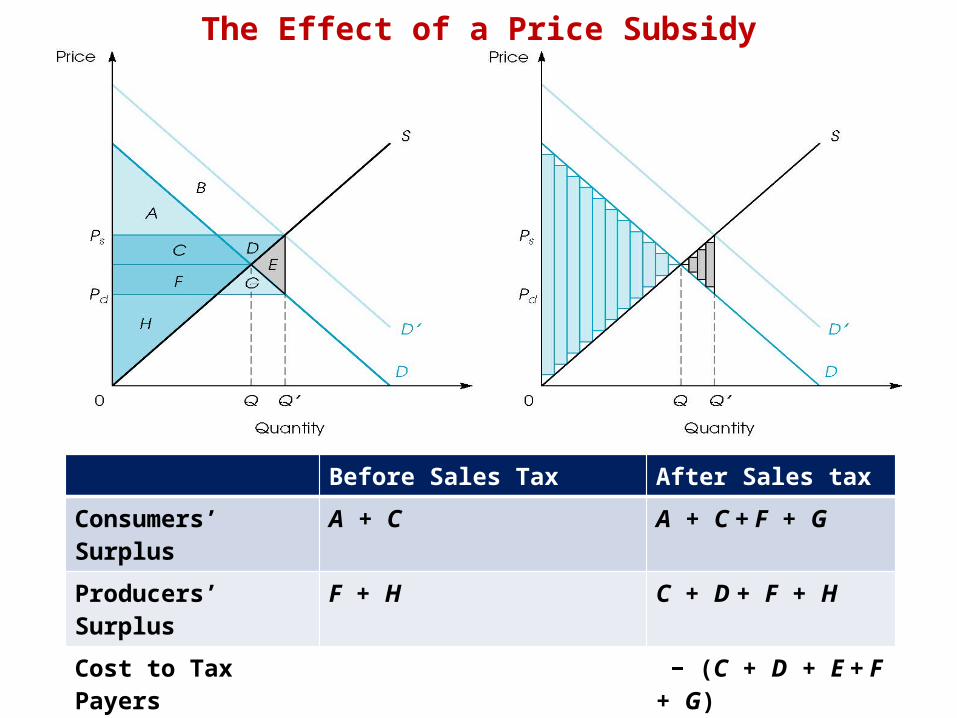
The Effect of a Price Subsidy
Before Sales Tax After Sales taxConsumers’ Surplus A + C A + C + F + GProducers’ Surplus F + H C + D + F + H Cost to Tax Payers − (C + D + E + F + G)Social welfare Gain A + C + F + H A + C + F + H − E Deadweight Loss E
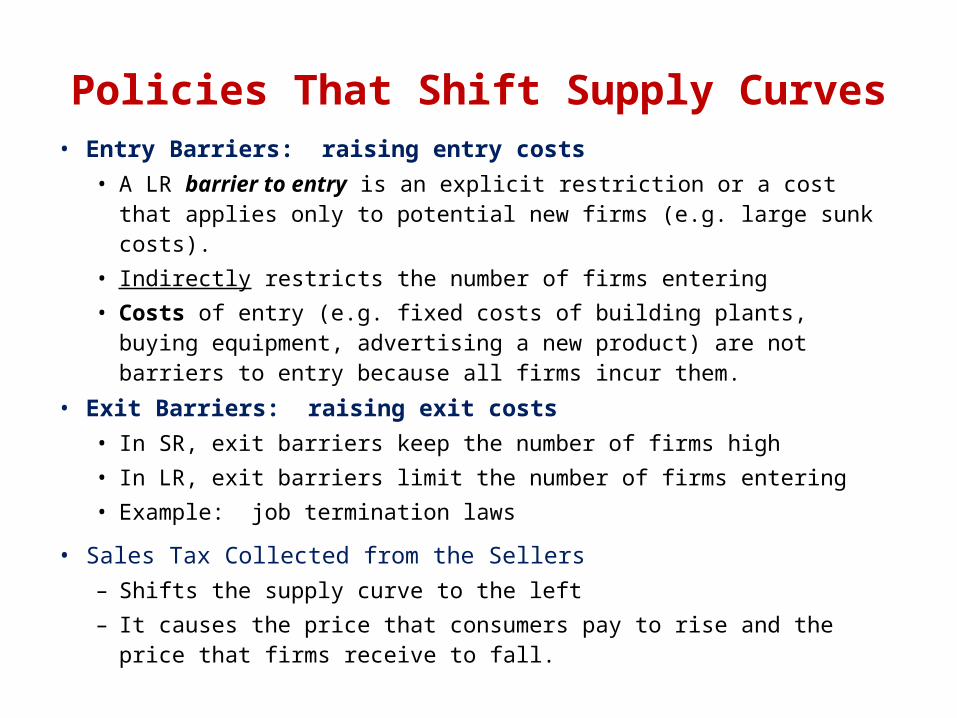
Policies That Shift Supply Curves• Entry Barriers: raising entry costs
• A LR barrier to entry is an explicit restriction or a cost that applies only to potential new firms (e.g. large sunk costs).
• Indirectly restricts the number of firms entering• Costs of entry (e.g. fixed costs of building plants, buying equipment,
advertising a new product) are not barriers to entry because all firms incur them.
• Exit Barriers: raising exit costs• In SR, exit barriers keep the number of firms high• In LR, exit barriers limit the number of firms entering• Example: job termination laws
• Sales Tax Collected from the Sellers– Shifts the supply curve to the left– It causes the price that consumers pay to rise and the price that
firms receive to fall.
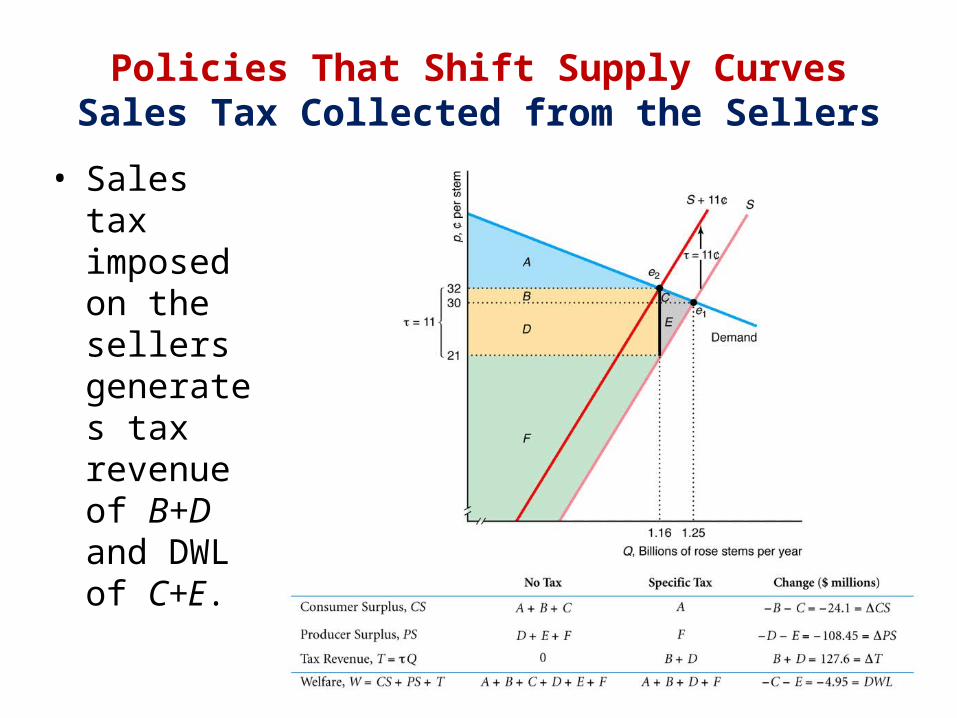
• Sales tax imposed on the sellers generates tax revenue of B+D and DWL of C+E.
Policies That Shift Supply CurvesSales Tax Collected from the Sellers
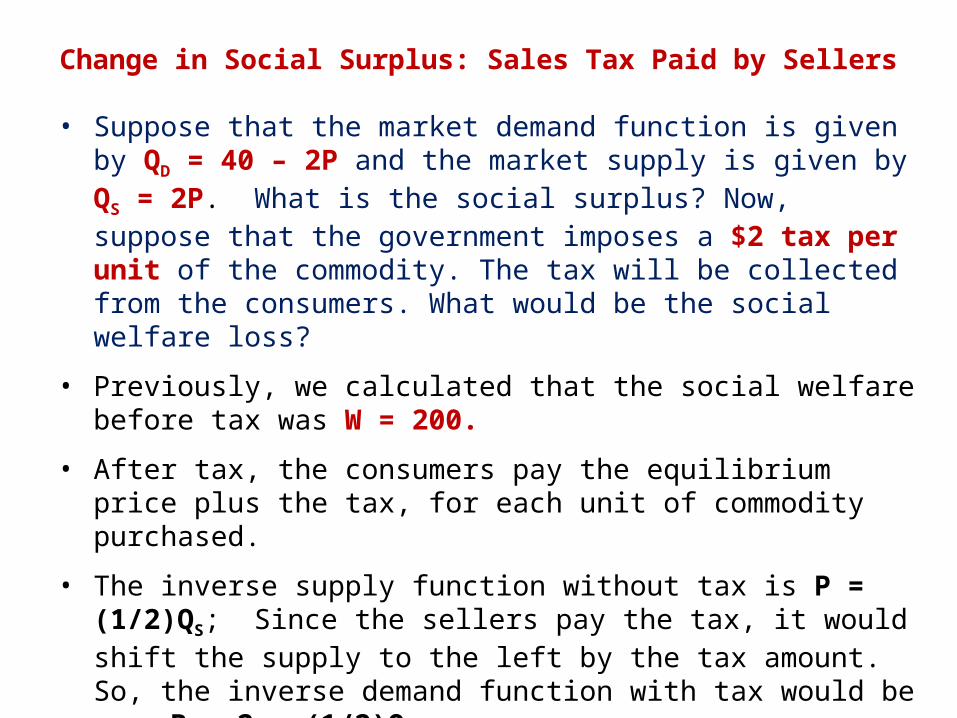
Change in Social Surplus: Sales Tax Paid by Sellers
• Suppose that the market demand function is given by QD = 40 – 2P and the market supply is given by QS = 2P. What is the social surplus? Now, suppose that the government imposes a $2 tax per unit of the commodity. The tax will be collected from the consumers. What would be the social welfare loss?
• Previously, we calculated that the social welfare before tax was W = 200.
• After tax, the consumers pay the equilibrium price plus the tax, for each unit of commodity purchased.
• The inverse supply function without tax is P = (1/2)QS; Since the sellers pay the tax, it would shift the supply to the left by the tax amount. So, the inverse demand function with tax would be
P – 2 = (1/2)QS
=> P = 2 + (1/2)QS
=> (1/2)QS = – 2 + P=> QS = – 4 + 2P

• At the market equilibrium, QS = QD
– 4 + 2P = 40 – 2P => 4P = 44 => P = 11• At this price, equilibrium quantity exchanged is
QS = – 4 + 2P = – 4 + 2*11 = 18
• The inverse demand function is P = 20 – (1/2)QD; the height of the
triangle is the intercept of the inverse demand curve minus (P), that is 20 – 11= 9.
CS = ½ (9*18) = 81
• The producer price received P = 11 – 2 = 9; PS = ½ (9*18) = 81
• The tax revenue, T = 2*18 = 36• The new social surplus, W* = CS + PS + T= 81 +81 +36 = 198• So, the loss is social welfare is, DWL = W – W* = 200-198 = 2
Change in Social Surplus: Sales Tax Paid by Sellers
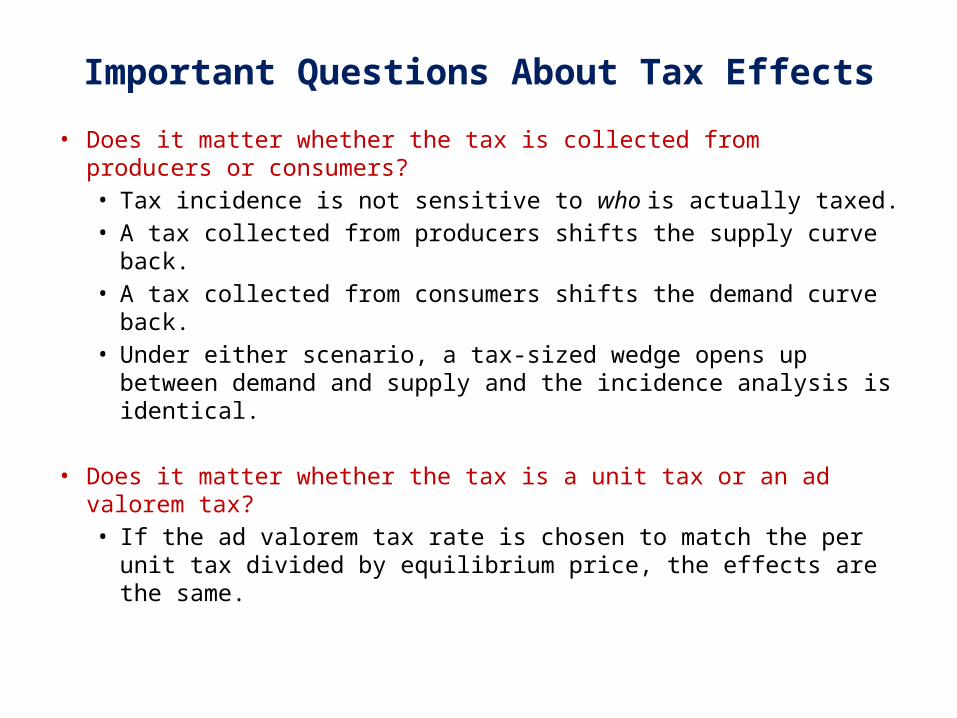
Important Questions About Tax Effects
• Does it matter whether the tax is collected from producers or consumers?• Tax incidence is not sensitive to who is actually taxed.• A tax collected from producers shifts the supply curve back.• A tax collected from consumers shifts the demand curve back.• Under either scenario, a tax-sized wedge opens up between
demand and supply and the incidence analysis is identical.
• Does it matter whether the tax is a unit tax or an ad valorem tax?• If the ad valorem tax rate is chosen to match the per unit tax
divided by equilibrium price, the effects are the same.

Policies That Create a Wedge Between Supply and Demand Curves
• Welfare is maximized at the competitive equilibrium • Government actions can move us away from that
competitive equilibrium• Thus, welfare analysis can help us predict the impact of
various government programs• We will examine several policies that create a wedge
between S and D:1. Price floor2. Price ceiling
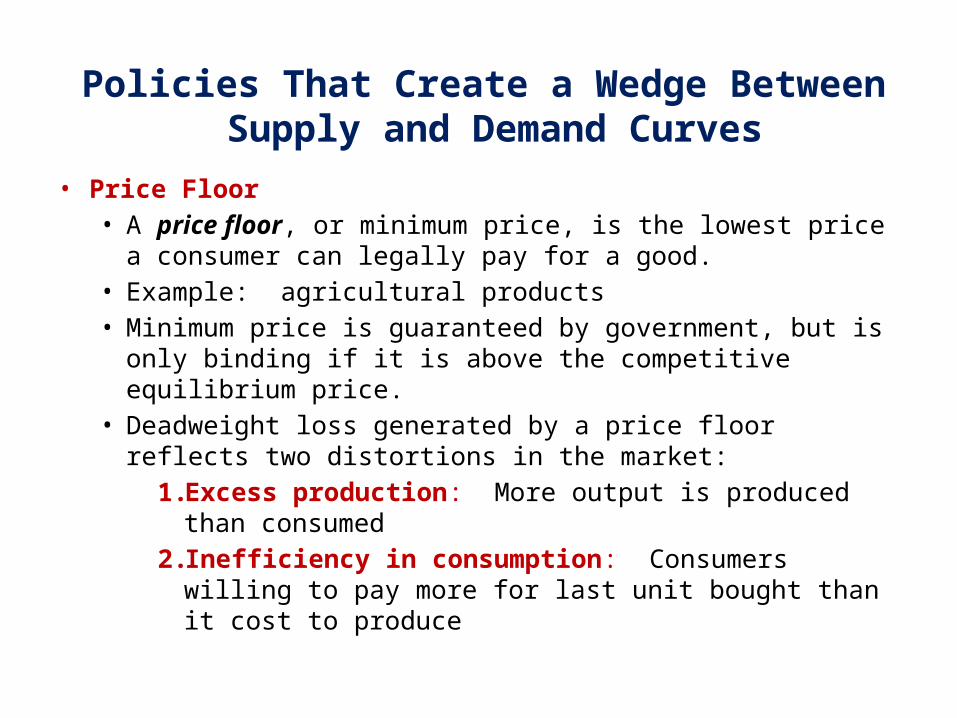
• Price Floor• A price floor, or minimum price, is the lowest price a consumer
can legally pay for a good.• Example: agricultural products • Minimum price is guaranteed by government, but is only
binding if it is above the competitive equilibrium price.• Deadweight loss generated by a price floor reflects two
distortions in the market:1. Excess production: More output is produced than
consumed2. Inefficiency in consumption: Consumers willing to pay
more for last unit bought than it cost to produce
Policies That Create a Wedge Between Supply and Demand Curves
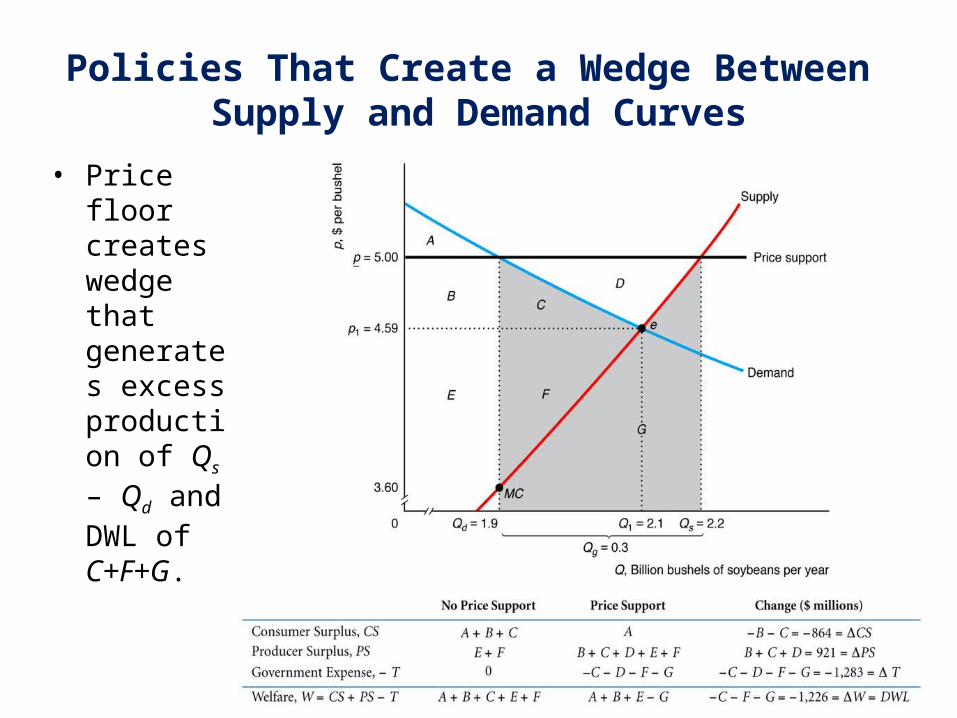
• Price floor creates wedge that generates excess production of Qs – Qd and DWL of C+F+G.
Policies That Create a Wedge Between Supply and Demand Curves
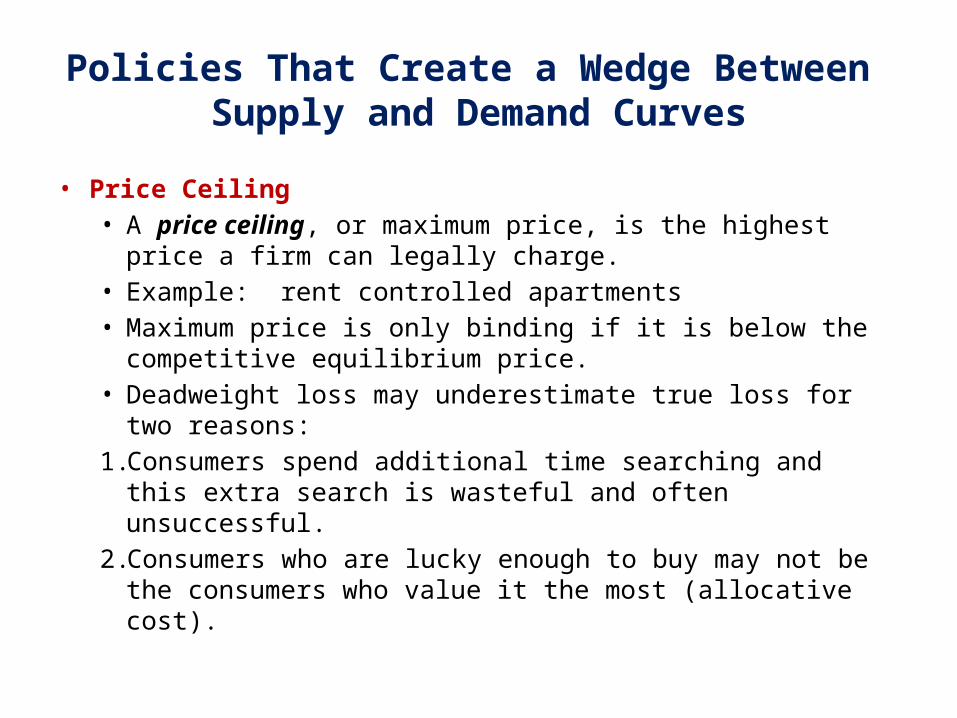
• Price Ceiling• A price ceiling, or maximum price, is the highest price a firm can
legally charge.• Example: rent controlled apartments• Maximum price is only binding if it is below the competitive
equilibrium price.• Deadweight loss may underestimate true loss for two reasons:1. Consumers spend additional time searching and this extra
search is wasteful and often unsuccessful.2. Consumers who are lucky enough to buy may not be the
consumers who value it the most (allocative cost).
Policies That Create a Wedge Between Supply and Demand Curves
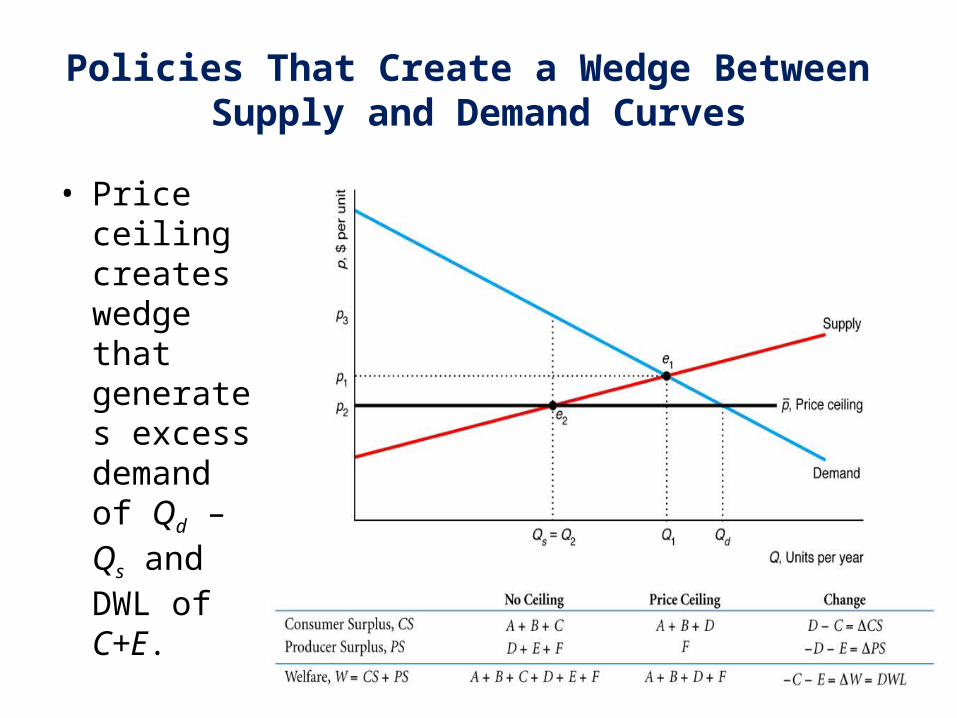
• Price ceiling creates wedge that generates excess demand of Qd – Qs and DWL of C+E.
Policies That Create a Wedge Between Supply and Demand Curves
International Trade Policies
• Finally, we use welfare analysis to examine government policies that are used to control international trade:1. Free trade2. Ban on imports (no trade)3. Set a tariff4. Set a quota
• Welfare under free trade serves as the baseline for comparison to effects of no trade, quotas and tariffs.• Assume zero transportation costs and horizontal supply curve
for the potentially imported good• Assumptions imply U.S. can import as much as it wants at p* per
unit.
Free Trade vs. No Trade
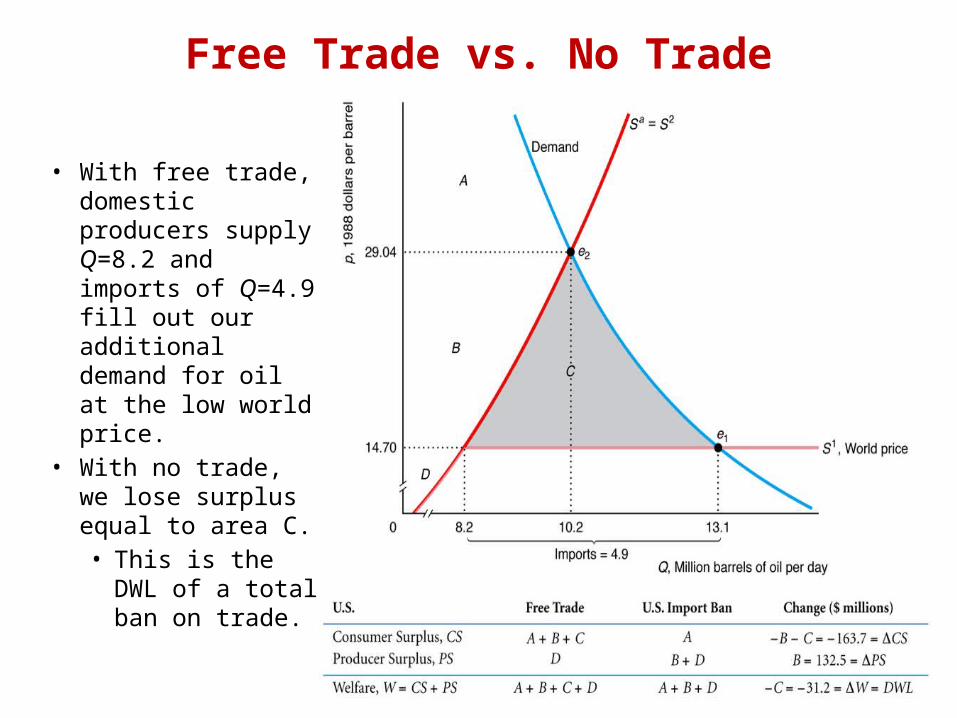
• With free trade, domestic producers supply Q=8.2 and imports of Q=4.9 fill out our additional demand for oil at the low world price.
• With no trade, we lose surplus equal to area C.• This is the DWL
of a total ban on trade.
Tariffs
• A tariff is essentially a tax on imports and there are two common types:• Specific tariff is a per unit tax• Ad valorem tariff is a percent of the sales price
• Assuming the U.S. government institutes a tariff on foreign crude oil:1. Tariffs protect American producers of crude oil from foreign
competition.2. Tariffs also distort American consumers’ consumption by
inflating the price of crude oil.
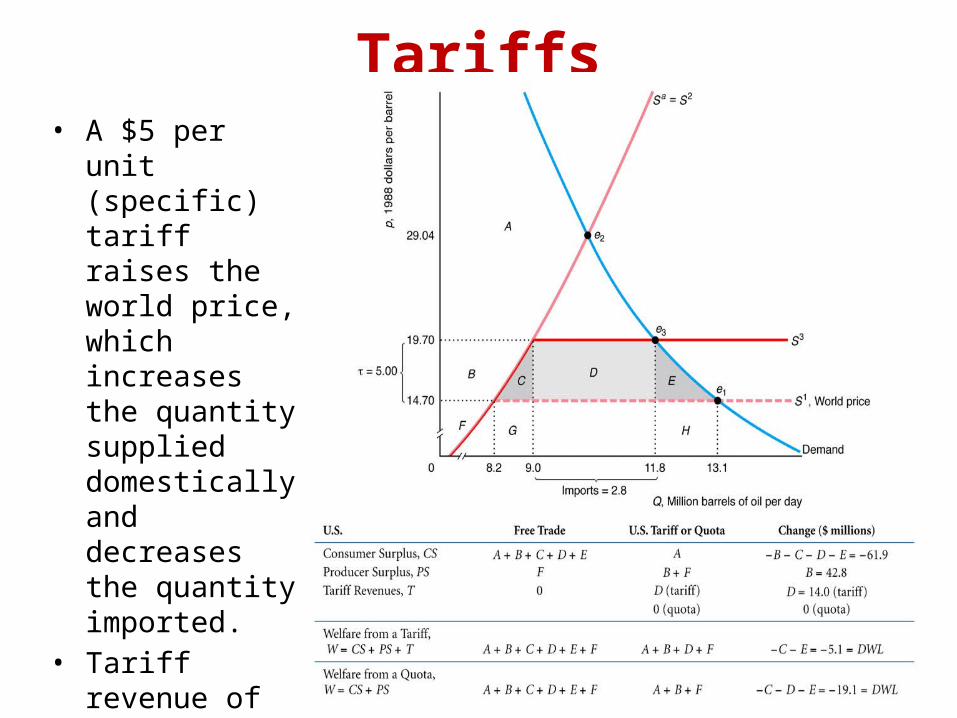
Tariffs• A $5 per unit
(specific) tariff raises the world price, which increases the quantity supplied domestically and decreases the quantity imported.
• Tariff revenue of area D is generated by the U.S.
• DWL is equal to C+E.
Quotas
• A quota is a restriction on the amount of a good that can be imported.
• When analyzed graphically, a quota looks very similar to a tariff. • A tariff is a restriction on price• A quota is a restriction on quantity• One can find a tariff and a quota that generate the same
equilibrium• The only difference is that quotas do not generate any
additional revenue for the domestic government.
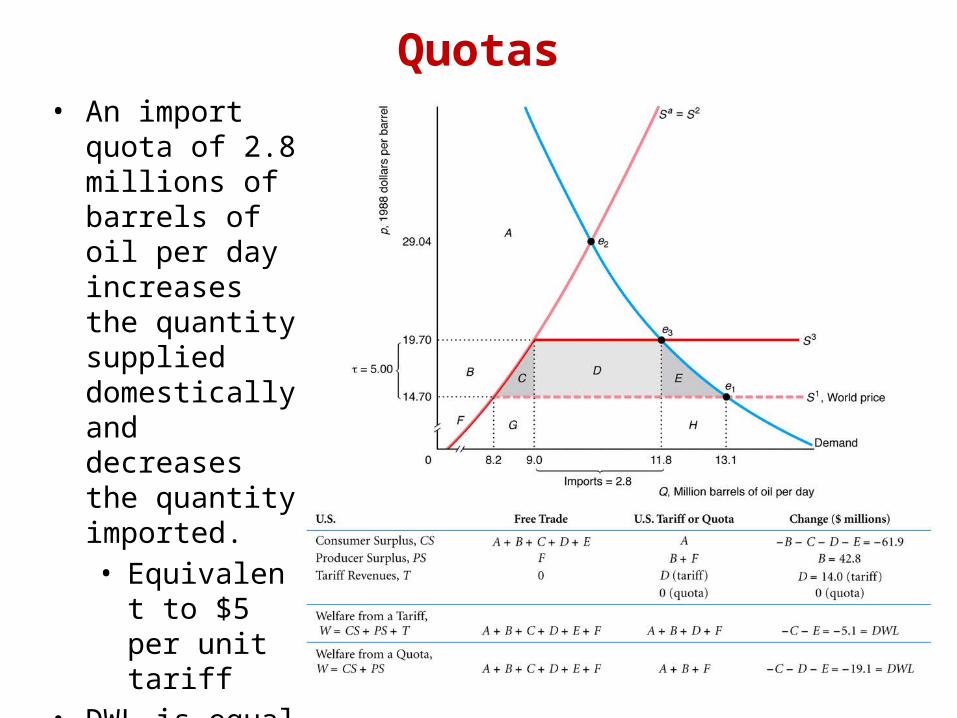
Quotas• An import quota
of 2.8 millions of barrels of oil per day increases the quantity supplied domestically and decreases the quantity imported.• Equivalent to
$5 per unit tariff
• DWL is equal to C+D+E because no tariff revenue is generated.