Embed Size (px)
Citation preview

Social Watch Philippines Monitoring Initiatives
by
Rene Raya
Ma. Luz Anigan Social Watch Philippines

Objectives of Workshop on Monitoring system/initiative focused on the MDGs
To be able to appreciate/learn about the monitoring initiatives applied in the Philippines by Social Watch PhilippinesTo be able to reflect on national monitoring in the different countries and identify the gaps (the weak areas) and possible intervention of CSOTo Exchange/Present ideas for possible coordinated piloting of local monitoring in the participating countries

What is SWP doing in monitoring
1. Social Watch monitoring system
(with the five modules)
2. Quality of life monitoring
3. Tracking the MDGs at different levels
4. MDG local monitoring system
The SWP Local Monitoring System

OBJECTIVES
LOCALIZING the “MDG Plus”
1. To establish benchmarks for tracking accomplishments in key development indicators
2. To assess the operationalization of the Millennium Development Goals and Targets and other international commitments at the level of provinces and municipalities
3. To strengthen advocacy for adopting the “MDG Plus” as framework for local development planning and fiscal management
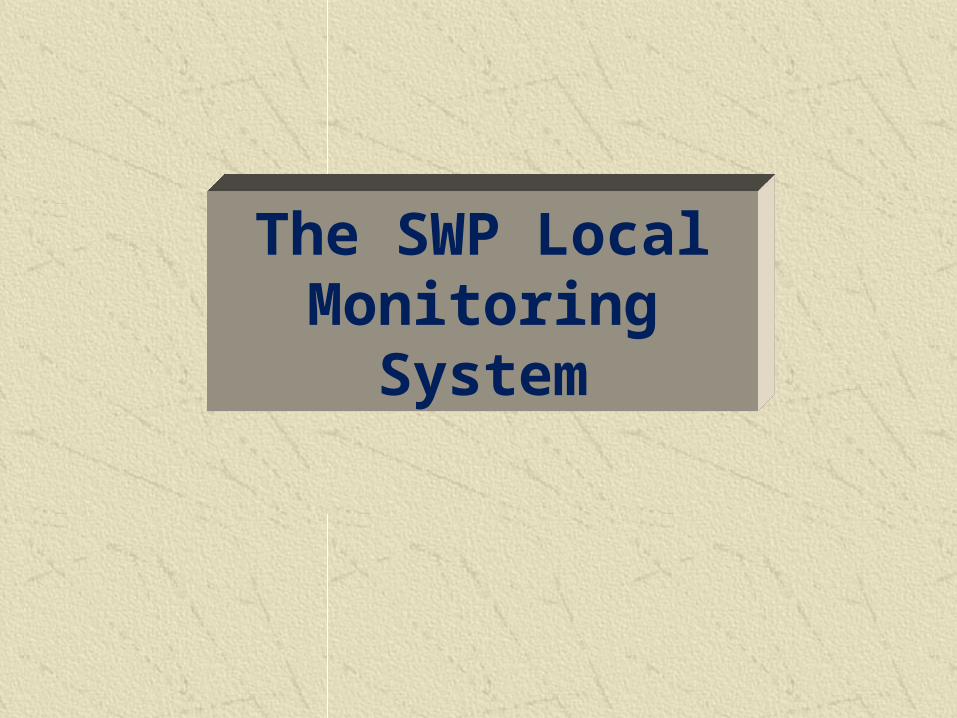
Social Watch Local Monitoring System
Content of the “MDG Plus”
Module 1: SWP Monitoring Template of Key Social
Indicators
Module 2: Assessment of Special Concerns (Thru Quantitative and Case Analysis)
Module 3: Quality of Life Index - Trends
Module 4: Review of Development Plan
Module 5: Analysis of Budget/Expenditure Program
Social Watch Local Monitoring System
Indicators Social Analysis Planning BudgetingIndicators Social Analysis Planning Budgeting

A. Basic Social Indicators
1. Demographics2. Income & Employment3. Health4. Education5. Infrastructure6. Shelter7. Personal Security8. Women/Children
B. Special Concerns
• Social Integration• Gender Equity• Quality of Employment• Disaster• Asset Reform• Industry Profiling• Partnership with CSOs• Environment and
Sustainable Development
The SWP Local Monitoring System

C. Quality of Life Index (QLI)Three component indicators used to generate QLI:
1. Under-Five Nutrition2. Attended Births3. Elementary Cohort Survival Rate
QLI is used for local poverty and capability mapping
SWP Monitoring Template
E. Analysis of Budget/Expenditure ProgramAnalysis of sectoral allocation Assessment of investment plan, budget and actual expenditure in terms of responsiveness
to MDG and WSSD concerns.
D. Review of Local Development Plan Clarity of framework and strategies Use of indicators as planning guide; clear targetsComprehensiveness of situation analysisPoverty reduction strategy; identification of vulnerable sectorsInclusion of MDG and WSSD commitments; Gender content


ETC…

ETC…
SOCIAL WATCH LOCAL MONITORING SYSTEM Module III– Quality of Life Index (Rate of Malnutrition)

ETC…

ETC…

The Quality of Life Index (QLI)/ Basic Capabilities Index (BCI)
Gender Equity Index
Social Watch use of composite index to measure overall poverty and well-being

Quality of Life Index
QLI is an alternative measure of people’s well-being It is a derivative of the pure capability-based measure as
proposed and popularized by Amartya Sen. It complements HDI and Income-based poverty measures
Index is composed of 3 Indicators with equal weights:1. 1) Capability to be well-nourished
2. Under-five nutrition status
3. 2) Capability for healthy and safe reproduction
Births attended by trained health personnel
3) Capability to be educated & be knowledgeable
Elementary Cohort Survival Rate

Quality of Life Index
Philippines, 1999
0.479 - 0.600
0.601 - 0.700
0.701 - 0.800
0.801 - 0.908
Missing data
National Level

Quality of Life Index (QLI) Basic Capabilities Index (BCI)
QLI was adopted by Social Watch International with a slight modification of the Component Indicators
1) Under-five child mortality
2) Births attended by trained health personnel 3) Cohort Survival to Grade 5
Applied Globally and found to be applicable for significant number of countries and highly correlated to HDI, Food Security, overall Health and Educational Attainment.

Tracking the MDGs
From National…
to Local Areas…
down to Households.
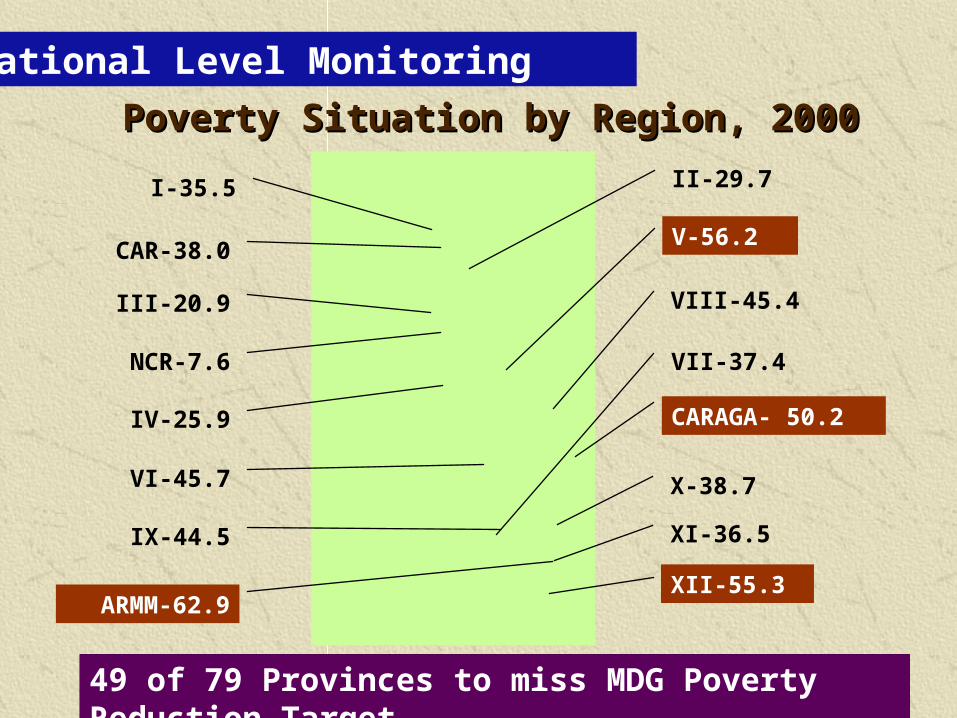
Poverty Situation by Region, 2000Poverty Situation by Region, 2000
II-29.7
V-56.2
VIII-45.4
VII-37.4
CARAGA- 50.2
X-38.7
XII-55.3
XI-36.5
I-35.5
CAR-38.0
III-20.9
NCR-7.6
IV-25.9
VI-45.7
IX-44.5
ARMM-62.9
National Level Monitoring
No improvement in Rural Poverty Situation since 1988Poverty actually rising in ARMM, Central Mindanao and Bicol49 of 79 Provinces to miss MDG Poverty Reduction Target

MDG TargetsPerspective of the Poor, Vulnerable and Powerless
Poverty Unlikely
Hunger/Nutrition
Very Unlikely!
Safe water Unlikely
Educ: Participation
Less Likely
Educ: Survival Unlikely
Educ: Gender ? Parity Equality, No!
Child Mortality/IMR
Unlikely
Maternal Health Very
Unlikely!
HIV / AIDS ? Growing Threat
Environment Unlikely
On Slum Dwellers
Unlikely
THE MDG SCOREBOARD – Social THE MDG SCOREBOARD – Social WatchWatch

Sorsogon
Camarines Norte
Camarines SurCatanduanes
Albay
Masbate
0.532 - 0.600
0.601 - 0.700
0.701 - 0.800
0.801 - 0.642
Missing data
Bicol Region, 1999
Quality of Life Index
Regional Level Monitoring
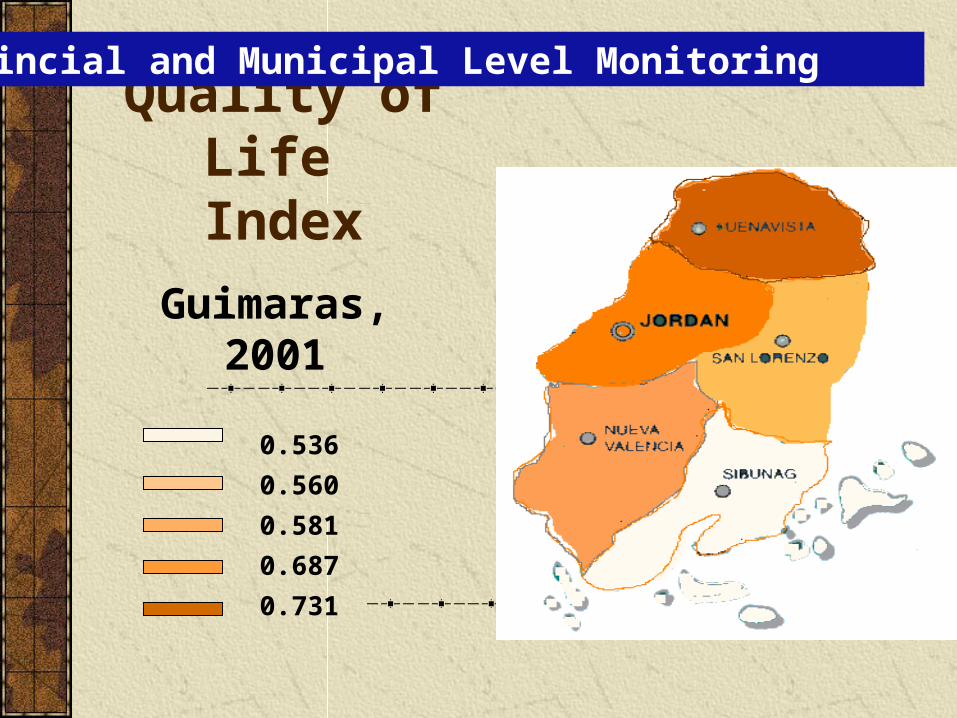
0.536
0.560
0.581
0.687
0.731
Guimaras, 2001
Quality of Life Index
Provincial and Municipal Level Monitoring

Elementary School Participation Rate in Palawan, 2002

Elementary School Participation Rate in Brookespoint, Southern Palawan, 2002

Barangay Level Monitoring

Elementary School Participation Rate in Bgy. Oring-Oring, Brookespoint,Southern Palawan, 2002
Back

A total of 76 children
(6-16 year old) do not attend school
Sample MDG Mapping at the Household Level
Household Level Monitoring

Proportion of population with access to improved sanitation
Percent
Indonesia 55%
Thailand 96%
Tubigon 72.9%
Bohol
Ubojan 40.64%
Proportion of population with access To Sanitary Toilets
International Comparison

Peru
71%
Ghana 72%
Burkina Faso 29%
International Comparison

MDG Local Monitoring System

Insert on GIS
Social Watch Philippines MDG Indicators
MDG Local Monitoring System
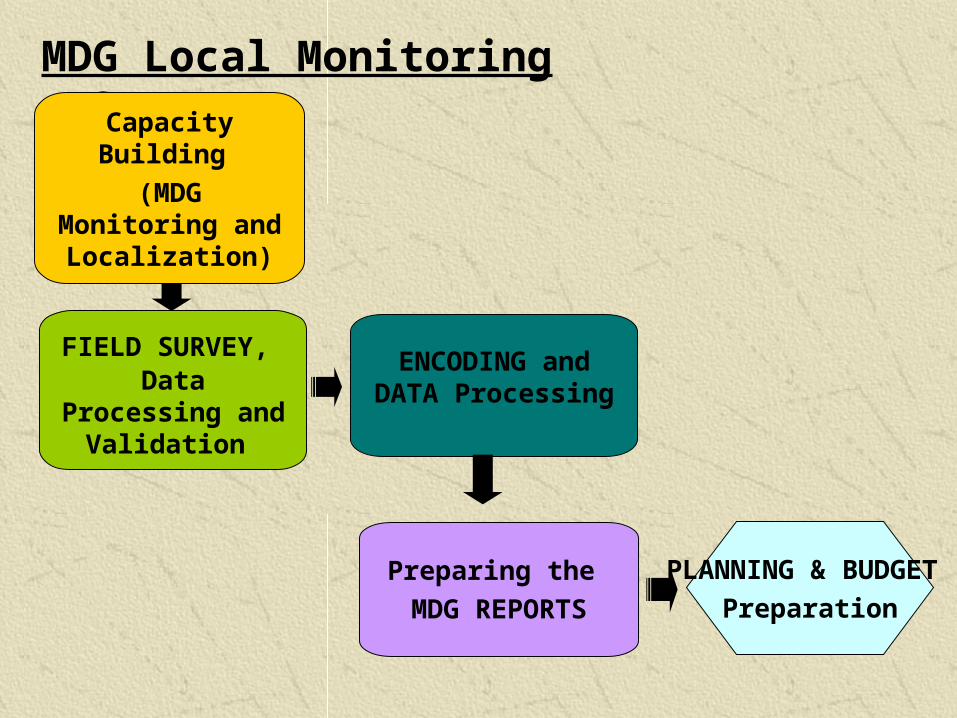
FIELD SURVEY, Data Processing and
Validation
MDG Local Monitoring System
PLANNING & BUDGET
Preparation
Capacity Building
(MDG Monitoring and Localization)
Preparing the
MDG REPORTS
ENCODING and DATA Processing

TWG: Selecting the indicators

TWG: Information System


Enumerators’ Training for the MDG Survey in Kiangan

Enumerators’ Training for the MDG Survey in Kiangan

Monitoring Tools Software Packages
1. DevInfo Database Software2. GIS (Geographic Information System)
Free and Open Software
3. MDG Planning Matrix 4. SPSS and CSPro
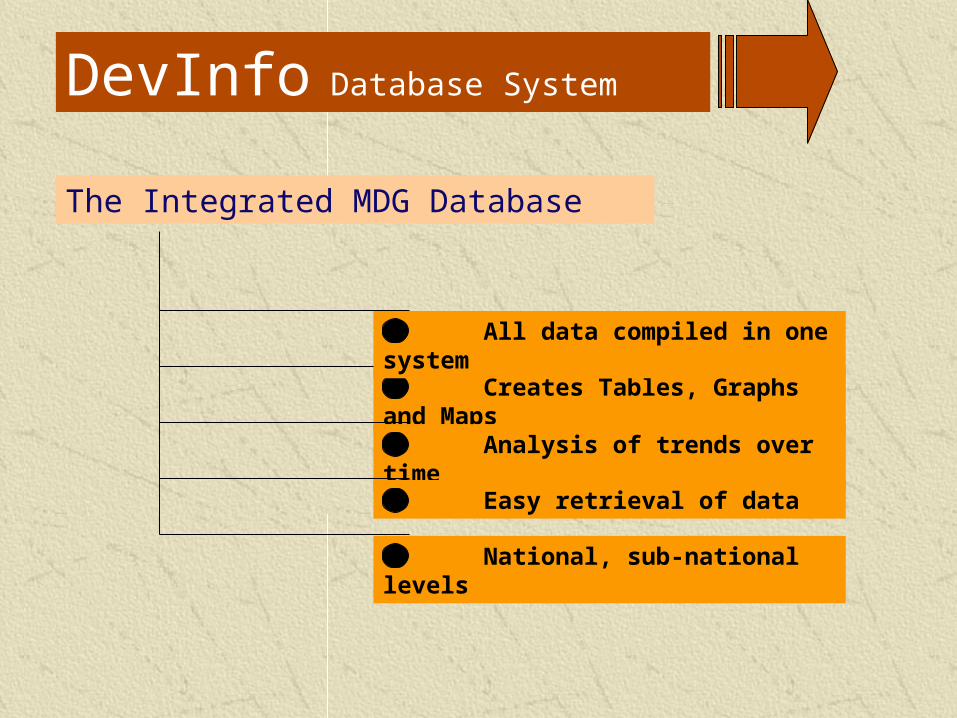
The Integrated MDG Database
Creates Tables, Graphs and Maps
Analysis of trends over time
Easy retrieval of data
National, sub-national levels
All data compiled in one system
DevInfo Database System

DevInfo Database System

JagnaInfo A Customized Variant of the UN’s DevInfo
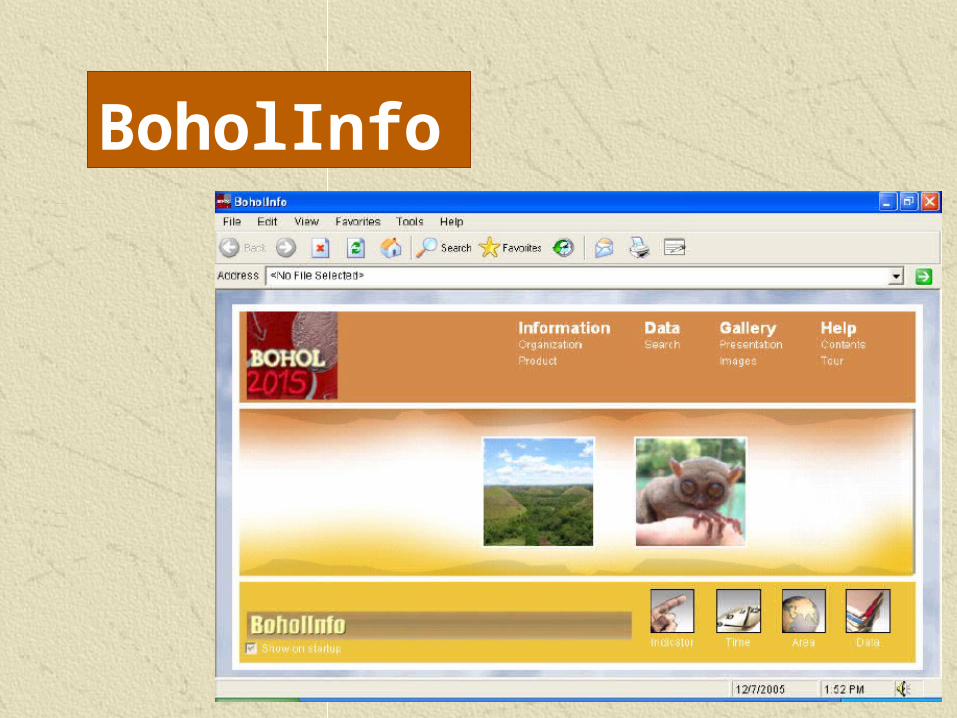
BoholInfo

Used also in NEPAL

Used also in AFRICA
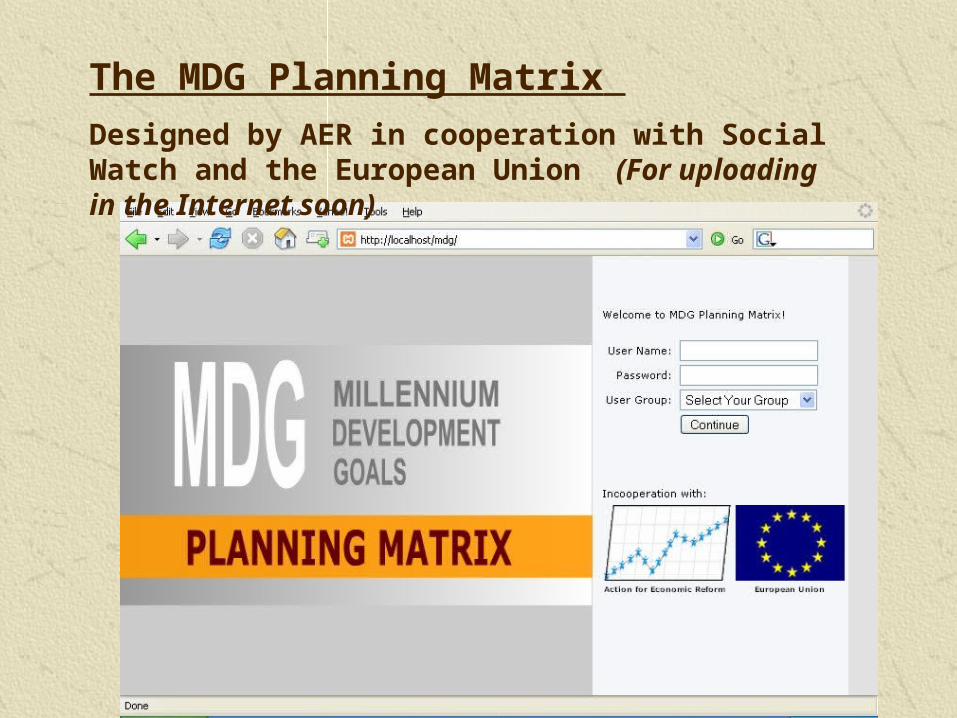
The MDG Planning Matrix
Designed by AER in cooperation with Social Watch and the European Union (For uploading in the Internet soon)

Municipality:
Goal 1 : Eradicate Extreme Poverty And Hunger INDICATORS BASELINE PROGRAM TARGET
1.1 Poverty Incidence (Proportion of households with income less than the poverty threshold)
1.2 Subsistence Poverty (Proportion of households with income less than the food threshold)
In 2003
24% of families were
considered income poor
15% were living below
the subsistence levelSee more poverty statistics…[PDF]
See NEDA report on Goal 1…
P r o p o r t i o n o f f a m i l i e s b e l o w p o v e r t y t h r e s h o l d
3 9 . 9
2 7 . 62 4 . 7
1 9 . 9 52 0 . 4
1 2 . 3 1 0 . 4 1 0 . 2
0
10
2 0
3 0
4 0
5 0
19 9 1 2 0 0 0 2 0 0 3 2 0 15
The MDG Planning Matrix Software


CSPro Encoding Software

Thank You!

Monitoring Workshop Guide Questions
1. What monitoring initiatives have your group/s undertaken? (Share monitoring experiences)
2. What is the existing monitoring system of the government? What are its strong and weak points? What are the gaps?

Monitoring Workshop Guide Questions
3. How do we design our own monitoring system--1. Select the indicators which you think are
relevant, applicable and practical2. Given the current programs and concerns of
your organization, what monitoring initiatives could be put/set in place at the local/national or even provincial level
3. What are the capacities and skills needed to implement this monitoring initiative