Embed Size (px)
Citation preview

Social Sustainability of Alternate Transportation Modes at
The University of British Columbia
Prepared By
Nathan Cato
For
Geoff Atkins
Associate Vice President, Land and Building Services
The University of British Columbia
August 3, 2006

2

3
1.0 Introduction
1.1 The student U-Pass program at UBC
Following a successful student referendum, the University of British
Columbia, in partnership with the Alma Mater Society (Student Union), and
the Greater Vancouver Transportation Authority (TransLink), implemented
the student U-Pass program in September 2003. Specific to UBC, the U-
Pass program was developed as the cornerstone of its “made at UBC”
Strategic Transportation Plan. In recognition of the many growing problems
surrounding transportation at UBC, the U-Pass program was developed as a
comprehensive transportation demand management (TDM) strategy. In
developing the U-Pass program, several objectives were identified, including
the following:
� Increase transit ridership;
� Reduce single occupant vehicle travel to, from and within campus;
� Reduce greenhouse gas emissions;
� Provide a cost savings for students who choose to use transit;
� Increase the accessibility of transit; and
� Establish and enhance partnerships between TransLink, agencies and
organizations throughout the region.
Overall, the U-Pass program has been successful in achieving these stated
objectives; however, there are still many opportunities to enhance the
program to better meet the needs of all parties involved. According to the 18-
month review of the U-Pass program conducted in May 2005, there are
currently more than fourteen percent (5300) of UBC students who do not use
their U-Pass, despite paying the mandatory fee for participation in the
program.1 Ten percent (3800) of those indicate they have no intention of
1 Urban Systems U-Pass Review: Final Report (2005): 12. 27 July 2006
<http://trek.ubc.ca/research/pdf/U-Pass%20Review%20Final%20Report.pdf>

4
using their U-pass in the future.2 There are a variety of barriers that can
contribute to the resistance of the U-Pass program and other sustainable
transportation behaviours, which will be discussed in section 3.0.
1.2 Objectives
The economic and environmental benefits of the student U-Pass program at
UBC have been well established and documented. As a result of the U-pass
program, students enjoy a collective transportation cost savings of more than
$3 million per month; the need to build 1,500 more parking stalls over the
next two years has been deferred, producing a cost-savings of $20 million;
and greenhouse gas emissions have been reduced by 16,000 tonnes per
year.3
The social implications of the program have been afforded less attention.
Therefore, the primary objective of this research study is to examine the
social sustainability of the U-Pass program at the University of British
Columbia. A secondary objective is to examine the social sustainability of
other alternate transportation modes, including cycling, pedestrians,
carpooling and telecommuting. This report will serve as a preliminary
qualitative investigation on social sustainability and how it relates to
transportation at UBC. Furthermore, it will make recommendations for future
quantitative research, and is intended as the preliminary step towards further
enhancing the full potential of the U-Pass program.
The research objective of this study is to determine the social influences of
transportation choice. This will include:
� Identification of the social factors that cause students at UBC to resist
embracing alternate transportation modes;
2 Ibid.: 12
3 UBC TREK Program Centre Homepage. 31 July 2006. <http://www.trek.ubc.ca/>

5
� Evaluation of those factors to determine what changes may be made
to encourage more sustainable transportation choices; and
� Recommendations to improve the attraction of alternate transportation
modes among the UBC community, thereby reducing single occupant
vehicle travel to, from and within campus.
A clear understanding of the social factors that influence transportation
choice will enable the University of British Columbia to improve the existing
portfolio of demand management strategies, including the student U-Pass
program. It will also ensure that the faculty/staff U-Pass and Community
Pass programs are implemented with the highest possible rate of
participation. Furthermore, the University will be able to package the overall
U-Pass system as a comprehensive program that can serve as a template
from which other institutions can use to implement similar initiatives.
1.3 Social Sustainability and Public Transit
Sustainability, as broadly defined by the Brundtland Report, is the ability of a
community to meet the needs of the present without compromising the ability
of future generations to meet their own needs.4 A sustainable community is
one that has the ability to maintain and build on its resources, and, at the
same time, has the resiliency to prevent and/or address problems in the
future.5 Within the context of public transportation, sustainability refers to a
society’s ability to move freely, gain access, communicate and trade without
sacrificing other essential human or ecological values, today or in the future.6
Sustainability is typically divided into three pillars. For the purposes of this
study, the three pillars of sustainability will be defined as follows:
4 World Commission on Environment and Development “The Brundtland Report”
(1987). 27 July 2006 <http://www.are.admin.ch/are/en/nachhaltig/international_uno/> 5 City of Vancouver “Policy Report Social Development” 27 July 2006 <http://www.city.vancouver.bc.ca/ctyclerk/cclerk/20050524/documents/p1.pdf>
6 Centre for Sustainable Transportation Homepage. 27 July 2006 <http://cst.uwinnipeg.ca/>

6
� Economic and Financial Sustainability: To be economically and
financially sustainable, transport must be cost-effective and
continuously responsive to changing demands.7 In Addition, UBC has
expanded this definition to include the life-cycle costs of total
infrastructure as an important indicator of economic and financial
sustainability.
� Environmental Sustainability: Transport has significant effects on
the environment that should be addressed explicitly in the design of
programs. Making better use of readily available and cost-effective
technology is necessary, but not in itself sufficient. More strategic
action is also required in the form of better-directed planning of land
use and stricter management of demand, including the use of pollution
and congestion charges to correct the relative prices of private and
public transport.8 At UBC, indicators such as greenhouse gas
emissions and the ecological footprint, which is a measurement of the
ecological impact of an organization’s practices, are used to determine
the extent to which UBC is environmentally sustainable.
� Social Sustainability: Transport that is affordable, accessible,
operates efficiently, offers choice of transport mode, and supports a
vibrant economy. In addition, customer satisfaction is a key ingredient
in creating a socially sustainable transport system. Social sustainability
is also significantly affected by psychological factors that influence
transportation behavior. This includes factors such as comfort level,
personal safety and security, interpretation of one’s own social status
and convenience.9
7 World Bank. “Social and Economic Policy” 27 July 2006. <http://web.worldbank.org>
8 Ibid.
9 Centre for Sustainable Transportation Homepage. 27 July 2006 <http://cst.uwinnipeg.ca/>

7
Social sustainability is often granted much less attention than the economic
and environmental elements likely because it is intangible and hard to define.
Unlike the economic and environmental aspects, social sustainability cannot
be easily reduced to quantitative indicators that are easy to measure; rather,
social sustainability is subjective, qualitative and political.
It is nonetheless essential to consider the element of social sustainability in
any evaluation of transportation modes. The social implications of
transportation affect behavioral choices, which are ultimately responsible for
the success or failure of any transportation strategy. Therefore, the focus of
this study will be the social component of sustainable transportation.
1.4 Methodology
The relevant literature from local and international studies will first be
reviewed and evaluated to determine the primary areas of the topic that
require further investigation. The extent of the research conducted will be
limited to qualitative observation and evaluation, with an emphasis on the
analysis of the transit system for commuters to and from the UBC campus.

8
2.0 Transportation at UBC since U-Pass
This section discusses the current mode share of transportation at UBC
since the implementation of the student U-Pass program in September 2003.
2.1 Changes in travel patterns
Since the implementation of the U-Pass program in 2003, there has been a
significant shift in travel patterns from automobiles to transit at UBC. The U-
Pass program has been a resounding success, the results often exceeding
expectations. The following will describe some of the changes in transit
ridership and travel by other alternative modes at UBC since the program
was implemented.
Transit Ridership
During the first year of the U-Pass program, transit ridership to and from the
UBC campus increased by 53%. During the second year of the program,
transit ridership increased by a further 15% to a combined net increase of
68%. These results are summarized in Table 2.1.
Table 2.1
Weekday Transit Ridership at UBC
Public Transit Ridership
Fall 2002 29,700 Fall 2003
Increase from Fall 2002 45,400 53%
Fall 2004 Increase from Fall 2002 Increase from Fall 2003
49,900 68% 10%
Fall 2005 Increase from Fall 2002 Decrease from Fall 2004
45,600 53% -9%
Source: TransLink, CMBC and UBC
Transit service improvements during the first year of the program were
planned for a 30% ridership increase. The actual ridership increase was 53%

9
Fall 2002
Transit
26%Bicycles
3%
SOV
43%
HOV
26%
Pedestrians
1%
Other
1%
Fall 2005
Transit
42%
Pedestrians
1%
Other
1%
Bicycles
2%
HOV
20%
SOV
34%
- considerably higher than expected. Not surprisingly, this caused a
significant supply deficit on most bus routes bound for UBC. Today, demand
is continuing to increase faster than service improvements can
accommodate, which is leading to overcrowding on most UBC bus routes
during peak travel periods. However, TransLink and UBC continue to work
together to address these issues through regular service improvements as
resources allow, and other creative methods such as shifting class start
times to broaden the morning arrival peak.
Other Alternative Travel Modes
Table 2.2 and Figure 2.1 provide a comparison of travel modes for trips to
and from UBC, before and after implementation of the U-Pass program.
Table 2.2
Travel mode trips at UBC (weekday person trips across UBC/UEL)
Before U-Pass After U-Pass
Mode Fall 2002 Fall 2004 Fall 2005 % Change (02-05)
Single-occupant vehicles 48,400 43,800 37,700 -11% Carpools & Vanpools 29,100 22,400 21,600 -26%
Transit 29,700 49,900 45,600 +54% Bicycles 3,300 1,600 2,400 -27%
Pedestrians 1,600 600 900 -44% Motorcycles, trucks 1,400 1,400 1,200 -14%
Total 113,500 119,700 109,400 -4% Source: UBC
Figure 2.1
Travel mode trips at UBC (weekday person trips across UBC/UEL)
Source: UBC

10
Key observations regarding the changes in travel patterns at UBC include:
� Transit: The transit mode share at UBC in fall 2005 accounted for
42%, more than any other mode, including single occupant vehicles.
Transit is now the most commonly used mode of travel to and from
UBC.
� Carpools: The number of carpool trips at UBC has been steadily
declining since 1997, as transit service levels have increased. In fall
2005, carpools had decreased 26% compared with fall 2002, the year
before the implementation of the U-Pass. This indicates that carpoolers
are the most likely group to shift to transit if transit service levels
provide a similar level of convenience when compared to carpooling.
� Automobile traffic: Following the implementation of the U-pass
program, overall automobile traffic (single occupant vehicles, carpools)
to and from UBC decreased 23%.
� Bicycles: The total number of bicycle trips to and from UBC
decreased 15% in the first year following the implementation of the U-
Pass program. In fall 2005, bicycle trips increased by 50% when
compared to the previous year. Bicycle infrastructure, such as bicycle
lanes on roadways and bicycle racks on buses, has also increased.
� Parking: The overall demand for parking at UBC decreased 10% in fall
2003, as compared with fall 2002. It is also noteworthy that the supply
of parking on campus decreased by several hundred parking stalls
during the same time period.
� Total trips to UBC decreased by 4% in fall 2005 when compared to
the previous year. This is likely a result of more students and faculty
living on campus, thereby eliminating the need to commute.

11
� Transit corridors: As a result of the increased volume on UBC bound
routes, there has been a dramatic increase in the usability of transit
corridors for other commuters who are not UBC students. For example,
residents living within close proximity to the 99 B-Line Broadway
corridor benefit from the increased frequency of buses caused by the
service improvements implemented to accommodate the U-Pass
program.
3.0 Barriers to Alternate Transportation Modes
There is widespread acknowledgement that air quality is getting worse, traffic
congestion is increasing, and there are many limitations to increasing road
capacity (fiscal, environmental, land use). These conditions mean that it is
costing much more – both economically and environmentally – to commute in
single occupant vehicles. Travel times for commuters have also increased in all
major Canadian cities except Vancouver, when compared to ten years ago.10
The reality is that single occupant vehicle travel is not sustainable and therefore
the dependency on them must decrease. This implies a meaningful shift in
transportation behavior.
Transportation behavior is often assumed to be dependent on the objective
service levels of the public transportation system. This is a misconception.
Conversely, travel mode choice is dependent on the psychological factors such
as beliefs, attitudes and habits that are influenced by the service levels of public
transportation.11 This is an important distinction because it indicates that a
change in service level will only influence travel choice if and only if it influences
the psychological factors that the behaviour depends on. 10
Statistics Canada. “General Social Survey” 12 July 2006. <http://www.statcan.ca/Daily/English/060712/d060712b.htm> 11
Satoshi Fujii & Ryuichi Kitamura. “An experimental analysis of habit and attitude change.” 31 July 2006. <http://www.springerlink.com/media/bn4gvmxvur3ha4k2ux4g/contributions/p/7/3/6/p736732033370222.pdf>

12
Most drivers living in urban areas would prefer to dive their vehicles less and use
alternatives (such as public transportation, carpools/vanpools, bicycling, etc.)
more, provided they are convenient, comfortable and affordable (Litman
2006). The automobile has been the preferred transportation mode in North
America over the last century largely because it has had the ability to meet these
criteria. Therefore, if any alternative mode of transportation is going to be viable
to commuters, it is essential that it meet these three fundamental criteria.
3.1 ‘Unfreezing the habit’
Habits are formed after the repeated engagement of a given behaviour.
Therefore, any discussion about inducing automobile drivers’ behavioural
changes to public transportation must focus on habits because they
inherently impede behaviour change. Habits are perhaps the greatest
barrier to alternative transportation modes.
In their 2001 study at Kyoto University in Japan, researchers Satoshi Fujii
and Ryuichi Kitamura determined that habitual drivers often had negative
beliefs about the travel times offered by public transport. They proposed
that a temporary structural change would correct this negative belief about
the transit system, and thereby induce a lasting behavioural change.
A temporary structural change means any change that forces drivers to
temporarily use public transportation. This could include highway closures
or offering free public transit on select days. The idea is to ‘unfreeze’ the
habit of commuting in an automobile by forcing a change in habit.
Temporary structural changes are often more feasible than permanent
structural changes because they do not require a large monetary budget for
implementation.

13
For this study, the researchers chose a one-month free bus pass as the
method of intervention. An experiment consisting of 43 drivers was carried
out, in which a one-month free bus pass was given to 23 drivers in an
experimental group but not to 20 drivers in a control group. Attitudes
towards, habits of, and frequency of using automobile and bus were
measured immediately before, immediately after, and one month after the
one-month long intervention. The results of this study confirmed that a one-
month free bus pass weakens the habit of using an automobile rather than
public transportation and that the effect was sustained one month after the
intervention. 12
The temporary structural change of offering automobile drivers a one-month
free bus pass seems to have the potential to change habit, attitude, and
travel mode choice. Therefore, it would be wise to consider temporary
structural change as a possible TDM strategy aimed at increasing the
demand for alternate transportation modes, such as public transportation,
carpools and vanpools, cycling and telecommuting.
3.2 Convenience
The private automobile is the most popular mode of transportation for
Canadians and people around the world. In 2004 more than 17.7 million
light vehicles traveled a total of 283.4 billion kilometers on Canadian
roads.13 The automobile has proven to be so popular largely because it is
convenient. Contemporary society often places such an overwhelming
demand on people’s time that most discretionary users will not choose
public transit over the automobile under any circumstances if the travel time
is significantly greater. This is evidenced by a relatively insignificant shift in
demand for automobile travel in recent months despite rising fuel costs. The
opportunity cost of time is simply too great for many people to spent a
significantly longer period of time commuting by public transportation.
12
Ibid. 13
Centre for Sustainable Transportation Homepage. 27 July 2006 <http://cst.uwinnipeg.ca/>

14
Therefore, the convenience feature is critical to the social sustainability of
any public transit system.
The following factors are important for the evaluation of a transit system’s
level of convenience:
� Availability – when and where public transit is available. Transit
service must be offered when the commuter needs to travel in a
location close in proximity to their point of departure and their
destination.
� Frequency – the amount of trips made each hour or each day.
� Travel Speed – The total amount of time required to commute by
automobile compared to transit. Several cities in North America have
employed transit priority measures (such as HOV lanes), which give
buses preferential treatment over other vehicles, minimizing the
delay impacts of congestion and traffic signals, thereby increasing
the travel speed of transit. A 2000 study in Shoreline, Washington
revealed that transit travel speeds could be nearly doubled by
implementing effective transit priority measures.14
� Reliability – the extent to which actual transit service follows
published schedules.
� Integration – ease of transferring between transit and other
transportation modes. This includes transferring between buses or
rapid transit lines as well as park and ride options.
14
Evaluating Arterial Street Transit Preferential Treatment. 31 July 2006. <http://www.ptv-ag.com/download/traffic/library.pdf>

15
� Accessibility – ease of reaching transit stations and stops. How far
does a commuter have to walk to the transit stop or station? How
difficult is it to reach the stop or station? What is the quality of the
local street design?
� Information – the extent to which transit information is easy to
obtain and understand.
� Customer service – how helpful and friendly are the transit
employees? Not only can the level of customer service affect the
convenience for commuters, but it also can contribute to the
formation of positive or negative feelings and beliefs towards public
transit. If a discretionary transit user has a bad experience using the
transit system, they may be deterred permanently; conversely, a
positive experience could lead to a habitual user.
� Payment options – A variety of payment options for all types of
fares is necessary to ensure convenience for transit users.
3.3 Comfort
The automobile has also been a popular mode of transportation because of
its relative level of comfort compared to other modes. A sustainable
transportation system that is a viable alternative to the automobile must be
comfortable for commuters. Factors to consider when evaluating the
comfort level of a transit system include:
� Seating capacity: the most obvious comfort factor is the amount of
available seating on routes. Overcrowding necessitates standing for
many passengers. It can be very uncomfortable for commuters to
stand for long periods of time in a crowded area. Additionally, the
material and padding on the seats as well as legroom contribute to
the comfort of a commuter.

16
� Aesthetics – the appearance of transit vehicles, stations, waiting
areas and signs must look clean and well maintained. The aesthetic
factors of a transit system can have a significant psychological affect
on people, as they contribute to the formation of impressions and
attitudes towards the general concept of public transit.
3.4 Affordability
The affordability of a transit system is an important social sustainability
factor. It is also a critical equity objective, since it affects the cost burdens
and opportunities available to disadvantaged users.
Transit Fare Pricing
There has been considerable research conducted on the behavioral affects
of transit pricing over the last several decades. To the extent that transit
operations result in less congestion and cleaner air, a compelling argument
can be made to keep fares low by subsidizing services as a way of
rewarding socially sustainable behavior. However, the results of extensive
research conducted on the behavioral affects of transit pricing over the last
several decades indicates that this is not the most effective pricing strategy
to increase ridership. 15
Most research on transit fares has focused on the measurable effects of
price increases or decreases on ridership, using price elasticity of demand
for transit as the chief indicator.16 The one limitation to these studies is the
need for analysts to invoke the ceteris paribus (other things being equal)
assumption when measuring price elasticity from two points in time, as price
changes are often implemented in tandem with other service revisions.
15
Robert Cervero. “Transit pricing research” 31 July 2006. <http://www.springerlink.com/media/bec6unwuuhcvh16pxgfy/contributions.pdf> 16
Ibid.

17
According to 77 research studies over a 20-year period, the demand for
transit service declines by one-third of a percent for every one percent
increase in fare.17 Therefore, this rate of decline corresponds with a -0.33
fare elasticity. This is now considered the industry standard and referred to
as the Simpson-Curtin rule. These studies also indicate that riders are
typically more sensitive to fare increases than decreases.18 Additionally,
there is often an immediate drop-off in ridership following a fare increase;
within a year or so, ridership typically readjusts, returning close to its prior
levels, all other things being equal.
Empirical research reveals that the elasticity of service quality is roughly
twice as high as fares. Mode choice studies in Chicago, San Francisco and
Boston found that travel-time elasticities are in the range of -0.59 to -1.16,
with the high end of the range representing peak travel times. Commuters
are especially sensitive to out-of-vehicle travel time; waiting time, in
particular, is perceived as the most onerous by most transit users. This
suggests that riders are more sensitive to reliability, availability and
frequency compared to any other service feature.
The fact that transit users have consistently reacted more strongly to
service than fare changes leads the inescapable conclusion that transit will
be able to best compete with the automobile through introducing significant
service improvements rather than subsidizing fares. Emphasis should be
placed on providing speedy, on-time connections rather than maintaining
low fares.
Fare price Structure
There are a number of fare structure options, each with different
advantages and disadvantages relating to social sustainability. The most
common fare structure in North America is a flat fare, which charges a
17
Ibid. 18
Ibid.

18
constant price regardless of the length of trip or time period.19 Flat fare
structures are easiest for users to understand. Zonal fares are the second
most popular fare structure in North America.20 Under this system, exact
surcharges are collected from long distance travelers. This structure is
complicated to collect and enforce, and it also gives rise to inequities (i.e.
short distance users paying a surcharge for crossing a zone boundary). The
third option is graduated pricing, whereby users pay a fare on a per-
kilometer basis.21 This structure requires on board fare readers and
distance monitors, which are often seen as too expensive and cumbersome
for conventional transit systems. 22
19
Ibid. 20
Ibid. 21
Ibid. 22
Ibid.

19
4.0 Current Transportation at UBC
4.1 U-Pass Usage
According to the 18-Month U-Pass review, there were 38,000 students at
UBC eligible to receive a U-Pass in fall 2004, as reflected by the number of
eligible students during the September-to-April academic year when
enrollment is the highest.
Most students indicate they use their U-Pass. Between September and
November 2004 86% of students at UBC reported they used their U-Pass.
Furthermore, nearly half of those students who use their U-Pass make 10 or
more trips per week, which indicates that transit is their primary mode of
travel to and from UBC every day of the week. Table 2.3 provides a
summary of U-Pass usage.
Table 2.3
U-Pass Usage
UBC students
Students included in U-Pass program 38,000 U-Pass Usage (Sept-Nov 2004):
� Have used: � Intend to use:
86% 4%
U-Pass trips per week: � To/from university � To/from other destinations
6.0 1.2
U-Pass trips per week: � 10 or more trips � 4-9 trips � 1-3 trips � 0 trips
45% 26% 10% 19%
Source: TransLink
Most students support the U-Pass program. In a referendum in February
2005, UBC students voted overwhelmingly in favor (93%) of continuing the
U-Pass program with a $2 per month price increase. Students who use their
U-Pass strongly support the program.

20
4.2 U-Pass Non-Users
Despite the overall success of the U-Pass program, there are still a
significant number of students who are eligible to receive a U-Pass and do
not use transit. At UBC, approximately 6,000 students of the 38,000
students eligible in fall 2004 did not pick up their U-Passes.
To evaluate the student U-Pass program for the 18-Month Review in May
2005, Qualitative Research Associates Inc. was commissioned to explore,
in greater depth, non-user attitudes towards the U-Pass program, as well as
their opinions of transit service. A total of five focus groups were
assembled. The following summarizes their findings.
In general, there are two categories of non-users – those who choose not to
use transit, and those for whom transit is not a practical travel option
(generally, these students live in outlying areas with low levels of transit
service).
Students indicate the following key reasons why they do not use transit:
� Travel times by transit are longer than by automobile, particularly
for those students traveling long distances. For example, the trip
from Richmond to UBC is a 20-minute automobile drive, compared
to a 60-minute commute by transit, including a transfer at
Richmond Centre. The travel times by transit for many areas of the
lower-mainland are significantly higher than travel times by
automobile.
� Service Frequencies, particularly in evenings and weekends.
Many students note that the bus they would often take during these
time periods only runs every 30 minutes or less, and they did not
see this as an attractive frequency of service.

21
� Service hours: Students living in outlying areas indicated that
limited hours of service on the routes they would use are a barrier
to using transit.
� Pass-bys: Some students who drive to campus reported that they
have seen buses pass by waiting passengers because the bus is
already beyond capacity. If the student is traveling at night or on the
weekend on a route with a service frequency of 30 minutes, it is
especially frustrating to see a bus pass by waiting passengers.
This re-affirmed their choice to drive.
� Service reliability: Some students indicated that they perceived
transit services as unreliable, and could not depend on transit to
arrive to campus on time.
Table 2.4 summarizes the reasons why students at UBC do not use their U-
Pass. The two principal reasons are: existing access to an automobile; and
poor transit service from where the student lives.
Table 2.4
Most Common Reasons for not using the U-Pass
Have access to automobile 51% Transit is slower than automobile 30% Poor transit service where students lives 6% Student does not travel to campus frequently 4% Waiting times for buses are too long 9%
Source: TransLink
A large majority of non-users support the U-Pass program even though they
do not use transit. Reasons for supporting the program include benefits to
their fellow students, benefits to the environment, and benefits to
themselves, such as reduced competition for parking spaces and less traffic

22
congestion on routes to and from UBC. This suggests a positive shift in
support for the program from non-users since the initial student referendum.
4.3 Transit system qualitative evaluation
Using the indicators described in section 3.0, this section will evaluate the
social sustainability factors of the current transit service to and from UBC.
The evidence provided herein is primarily qualitative and anecdotal in
nature.
Convenience
� Availability and Accessibility: Although TransLink has been fairly
successful in expanding transit service availability to most areas in
Vancouver, students point out that availability in the outlining areas
is poor. Furthermore, long walking distances are often required to
reach transit stops. Students (especially those living in residence)
indicate that the bus loop on campus is not centrally located; the
walk from the bus loop to many of the residences can take up to 15
minutes.
Students living in the Marine Drive residence, for example, find it
especially difficult to carry groceries from the bus loop, especially if
the weather is poor. The existing campus shuttle service is often not
considered as an option, as its frequency is only every 30 minutes.
If a student gets off the bus at the bus loop and just misses the
campus shuttle, they would have to wait an additional 30 minutes;
walking would almost certainly require less time. Moreover, the
campus shuttle service is not well advertised; many students are
not aware that such a service even exists. This perception may
change with the implementation of the TransLink Community
Shuttle program (September 2006), as it will provide a higher profile
service that is compatible with TransLink’s regional network of

23
buses. Although the service will operate on 30 minute frequencies,
students may become more inclined to time their trips in order to
ensure minimal wait times between transfer points from
conventional buses to the Community Shuttles.
� Frequency: On many routes to UBC the frequency level is
inadequate. Many students relate having to wait two or three
busses before getting picked up during peak periods. Some
students have experienced being late for class or even missing
exams because of bus delays. At best, there is standing room only
for commuters on UBC routes during peak periods.
� Travel speed: For those students living in outlying, poorly serviced
or unserviced areas of Greater Vancouver, the time it takes to
commute is a significant barrier to transit. The commute by transit is
simply far too long compared to the automobile.
� Reliability: For the most part, transit service in the Greater
Vancouver area is exceptionally reliable. Actual service is generally
consistent with published schedules.
� Interlining: Much of the travel speed issues are caused by poor
interlining of transit services. Often, there are difficulties when
transferring from one bus to another. This is caused by stops that
are separated by very busy roads or other impediments (such as
Granville & W70th Avenue). Commuters often have to practically
run from one bay to the next to make the transfer in time.
Additionally, transfer times are sometimes excessively long, caused
by one bus arriving minutes after the connecting bus has left the
transfer point. Better interlining of bus stops and transfer points
could dramatically decrease travel times.
24
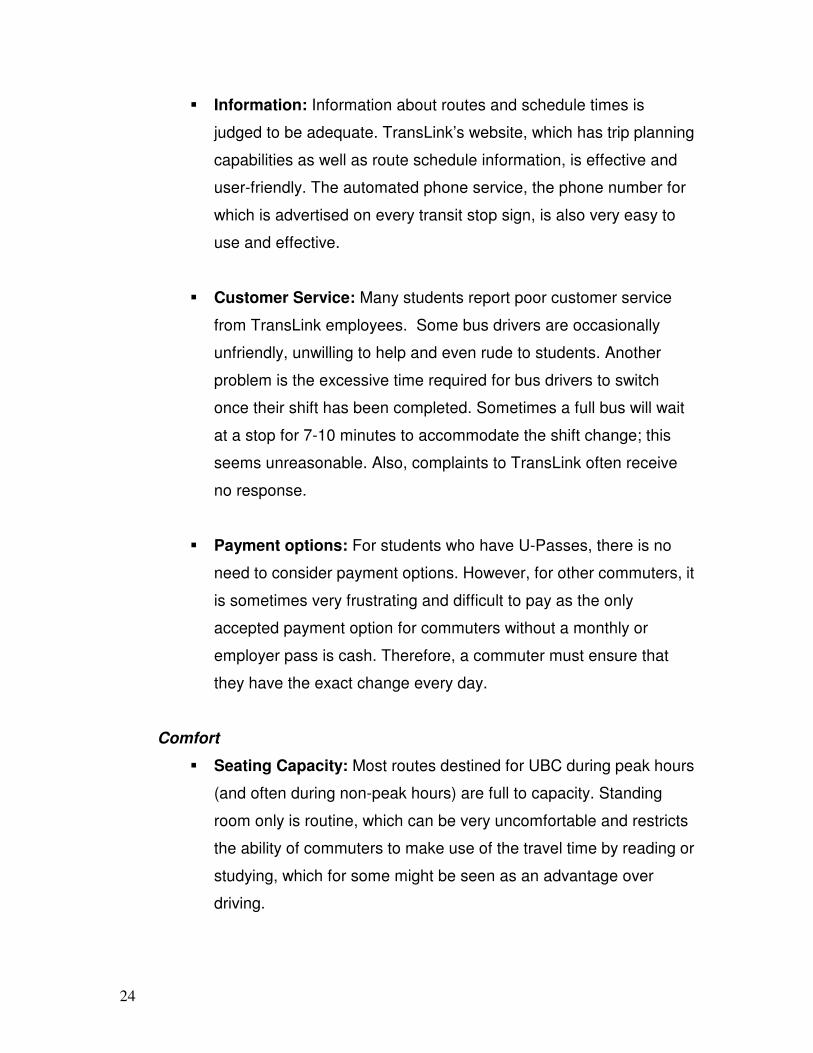
� Information: Information about routes and schedule times is
judged to be adequate. TransLink’s website, which has trip planning
capabilities as well as route schedule information, is effective and
user-friendly. The automated phone service, the phone number for
which is advertised on every transit stop sign, is also very easy to
use and effective.
� Customer Service: Many students report poor customer service
from TransLink employees. Some bus drivers are occasionally
unfriendly, unwilling to help and even rude to students. Another
problem is the excessive time required for bus drivers to switch
once their shift has been completed. Sometimes a full bus will wait
at a stop for 7-10 minutes to accommodate the shift change; this
seems unreasonable. Also, complaints to TransLink often receive
no response.
� Payment options: For students who have U-Passes, there is no
need to consider payment options. However, for other commuters, it
is sometimes very frustrating and difficult to pay as the only
accepted payment option for commuters without a monthly or
employer pass is cash. Therefore, a commuter must ensure that
they have the exact change every day.
Comfort
� Seating Capacity: Most routes destined for UBC during peak hours
(and often during non-peak hours) are full to capacity. Standing
room only is routine, which can be very uncomfortable and restricts
the ability of commuters to make use of the travel time by reading or
studying, which for some might be seen as an advantage over
driving.

25
� Seats: The seats that are available on the standard buses provide
adequate comfort. However, the seats on the old trolley buses are
uncomfortable as they are hard surfaces. All buses have very little
legroom. It is noteworthy, however, that the new buses in service on
the 480 route have individual coach bucket seating with excellent
padding and material, which are considerably more comfortable.
� Aesthetics: Many of the busses in the current trolley fleet are old
and are considered eye-sores. The standard buses in use on most
UBC routes appear acceptable. However, the seats in the rear of
buses are often vandalized and garbage can be found on the floor.
� Other considerations: The newer coach buses in use on the 480
route are considerably more comfortable for a number of reasons.
First, as previously mentioned, the seats are far more comfortable
than other buses. Second, they are air-conditioned, which provides
an extremely refreshing climate. Not only does the air conditioning
help when the weather is warm, but it also helps to redress the odor
problems that arise in overcrowded areas. Third, these buses have
overhead luggage compartments and overhead directional lighting,
both of which make significant contributions to better comfort.
Affordability
Students generally feel that the U-Pass is affordable and provides
exceptional value for money. For the average student, the pass generally
pays for itself very quickly, usually within weeks.
26
5.0 Recommendations for more socially sustainable transportation
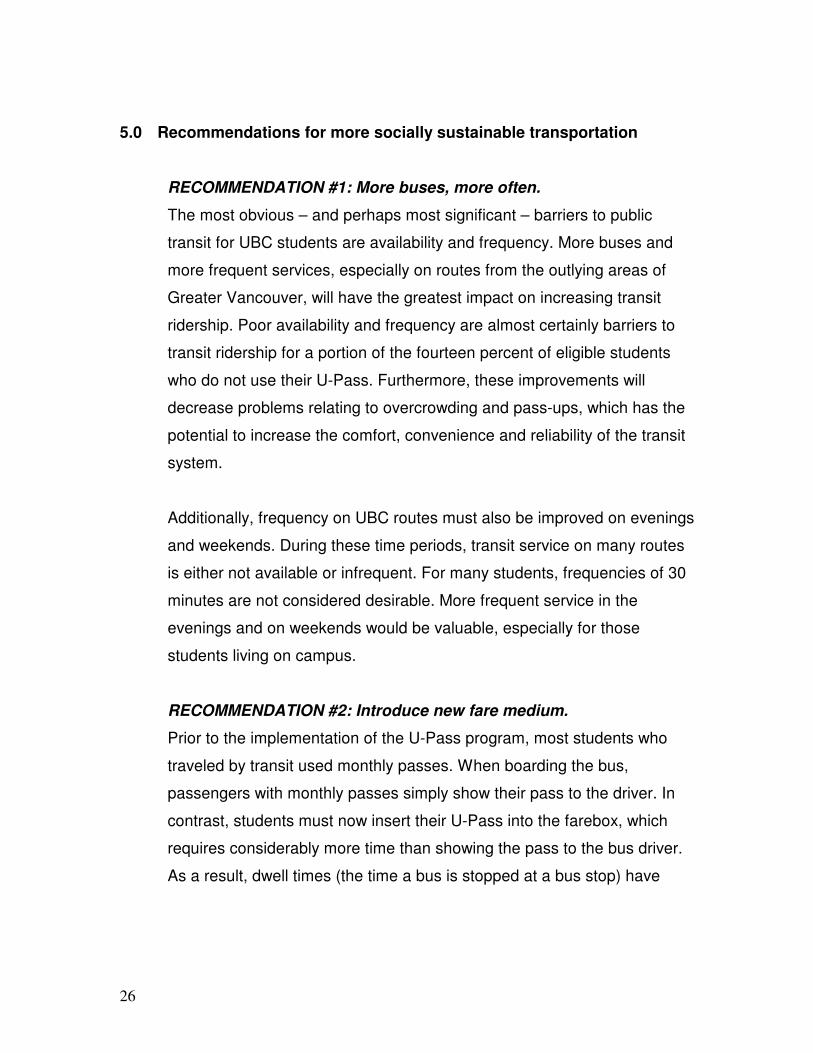
RECOMMENDATION #1: More buses, more often.
The most obvious – and perhaps most significant – barriers to public
transit for UBC students are availability and frequency. More buses and
more frequent services, especially on routes from the outlying areas of
Greater Vancouver, will have the greatest impact on increasing transit
ridership. Poor availability and frequency are almost certainly barriers to
transit ridership for a portion of the fourteen percent of eligible students
who do not use their U-Pass. Furthermore, these improvements will
decrease problems relating to overcrowding and pass-ups, which has the
potential to increase the comfort, convenience and reliability of the transit
system.
Additionally, frequency on UBC routes must also be improved on evenings
and weekends. During these time periods, transit service on many routes
is either not available or infrequent. For many students, frequencies of 30
minutes are not considered desirable. More frequent service in the
evenings and on weekends would be valuable, especially for those
students living on campus.
RECOMMENDATION #2: Introduce new fare medium.
Prior to the implementation of the U-Pass program, most students who
traveled by transit used monthly passes. When boarding the bus,
passengers with monthly passes simply show their pass to the driver. In
contrast, students must now insert their U-Pass into the farebox, which
requires considerably more time than showing the pass to the bus driver.
As a result, dwell times (the time a bus is stopped at a bus stop) have

27
increased substantially on routes serving UBC.23 Not only does this cause
an increase in round-trip travel time, which then creates a need for more
buses, but it also adversely affects schedule reliability. TransLink and
UBC should study the feasibility of introducing a new fare medium that
does not need to be inserted into the farebox to be verified for authenticity.
Possible examples include the smartcard or a proximity card.
RECOMMENDATION #3: Expand all-door Boarding.
Currently, all-door boarding is permitted at the UBC bus loop and the
Commercial Drive/Broadway Skytrain station. The expansion of all-door
boarding to all stops on high volume routes, such as the 99 B-Line, would
help to reduce travel times.
Another possibility would be to render all buses on high-volume UBC
routes ‘fair paid’ zones, which would eliminate the need for the driver to
verify the authenticity of transit passes, thereby increasing travel speed.
This would function the same way as the Skytrain and Seabus proof-of-
payment systems currently operate. Commuters would have to produce a
valid pass for inspection upon request from a transit authority employee
and violators would be subject to fines. Given the majority of commuters
on the high-volume UBC routes are students that automatically have a U-
Pass, fare evasion would likely not be a major problem.
RECOMMENDATION #4: Study the feasibility of additional transit
priority measures. Transit priority measures, such as dedicated bus
lanes, have the potential to dramatically decrease travel times. To that
end, further transit priority measures should be investigated for high
volume routes to UBC, such as the 99 B-Line route along Broadway.
23
Urban Systems U-Pass Review: Final Report (2005): 12. 27 July 2006 <http://trek.ubc.ca/research/pdf/U-Pass%20Review%20Final%20Report.pdf>

28
RECOMMENDATION #5: Improve the comfort and aesthetic
conditions of all buses. More comfortable seats, air conditioning,
overhead baggage compartments and reading lights, as observed on
many of the buses currently in use on the 480 route between UBC and
Richmond Centre, should be introduced on all bus routes. These factors
noticeably improve the comfort experienced by commuters.
RECOMMENDATION #6: Improve integration of transit routes. As one
of the greatest impediments to travel speed, the integration of bus routes
must be improved. For many students commuting from the outlying areas
of Greater Vancouver, the lack of integration of bus routes is the primary
cause of drastically increased travel times when compared to the
automobile.
RECOMMENDATION #7: Introduce more effective ways of
communicating schedule and route information. Some bus stops have
route schedules posted on plastic devices located on the polls of transit
signs. Presumably, this would be relatively inexpensive and simple to
expand to all routes and stops within the system, which would make
schedule time inquiries much easier than having to call the automated
TransLink information line.
Some transit systems in North America, such the San Francisco Bay Area
Rapid Transit Authority, have developed software for pocket PCs, iPods
and blackberries that allows the user to plan trips, look up departure times,
view route maps and station information. The application can be easily
downloaded for free from the transit authority’s website. Additionally, users
can request automatic text message and email notifications that are sent
to a mobile device directly from the website. These measures would likely
be very popular and effective with students. TransLink and UBC should
investigate how similar information services can be implemented.

29
RECOMMENDATION #8: Study the feasibility of expanding the U-
Pass program to students who are not registered for courses during
the summer months. Many students who work during the summer
months depend on the transit system for transportation and are required to
purchase regular monthly passes at $69/month for one zone. Even at an
increased cost over the Winter Term fee, a U-Pass for the summer
months would be desirable for non-registered students.
RECOMMENDATION #9: Improve customer service and relations.
TransLink employees should be helpful and be well-informed about the U-
Pass program, which would enable them to provide consistent answers to
inquiries. Furthermore, TransLink employees should always be respectful,
genuinely interested in making the transit experience enjoyable for
commuters, and generally willing to provide quality service.
RECOMMENDATION #10: In the long-term, TransLink and UBC
should study the feasibility of extending Skytrain to the UBC Point
Grey campus. Research indicates that rapid rail transit is considerably
more desirable when compared with the bus.24 Cities in North America
with large rail transit services have significantly higher per capita transit
ridership.25 This is largely because rapid rail transit is more convenient.
Rapid transit tends to provide better service quality that attracts more
riders, particularly discretionary users. It can carry more passengers per
vehicle and causes less noise and air pollution compared with diesel
buses.
Essentially, rapid rail transit can be compared to a luxury vehicle: it costs
more initially but provides higher quality service and greater long-run
value. Rapid rail transit offers more legroom, comfortable seats, a
smoother and quieter ride, which therefore increases the comfort level and
24
Centre for Sustainable Transportation Homepage. 27 July 2006 <http://cst.uwinnipeg.ca/> 25
Ibid.

30
provides a greater ability to read, converse, etc. Rail transit also has
greater travel speed and schedule reliability, which is associated with
grade-separated transit.
UBC is the second largest commuter destination in the Greater Vancouver
area next to the Downtown core; therefore, the demand for transit would
almost certainly sustain the expansion of Skytrain to campus.
RECOMMENDATION #11: Aggressively explore other sectors of the
market where the U-Pass philosophy can be expanded. The success of
the student U-Pass program proves that a targeted demographic will use
transit when the infrastructure and service is implemented; other sectors of
the market would likely react similarly. As the transit system is continuously
improved to render it more socially attractive, more commuters will begin to
engage in sustainable transportation behaviour. The first areas to explore
the feasibility of this concept should be UBC’s University Town, Point Grey
and Kitsilano, because of their relatively close proximity to UBC. TransLink
would benefit from the increased revenue stability generated from these
programs.
RECOMMENDATION 12: Adopt Effective Advertising Campaigns to
promote socially sustainable service improvements. Once service
improvements have been implemented, effective advertising campaigns
must be employed to highlight how the transit system is more socially
attractive.

31
6.0 Recommendations for future research
Future research on the social sustainability of public transportation should
focus on the psychological and sociological factors that affect the decision-
making process. There is a distinct possibility that issues such as social
class and self image have profound effects on transportation behaviour;
however, relatively little research in this area is available. Both quantitative
(surveys) and qualitative (focus groups) research should be conducted on
these topics.
7.0 Conclusions
There is no doubt that the student U-Pass program at the University of
British Columbia has had a significant impact on students’ transportation
choice. While the U-Pass program has been extremely successful, there will
always be room for more improvements.
Since its inception in September 2003, the U-Pass program has led to
increased transit ridership and decreased single-occupant vehicle travel on
campus, thereby facilitating more sustainable transportation behaviour.
Perhaps the most significant achievement of the U-Pass program is that it
has created a ‘transit culture’ among UBC students. UBC students are now
conscious of their transportation behaviour and are actively thinking about
alternatives to the single occupant vehicle. This effect has the potential to
last a lifetime.
Given these incredible benefits, the U-Pass program can be used as a
framework for other institutions and communities in the Greater Vancouver
region and around the world who are looking to develop more sustainable
transportation choices for commuters.

32
The possibility of attracting additional ridership – from students currently not
using the U-Pass and faculty/staff and community members – is achievable,
providing that the suggestions stated herein are employed. If transit is going
to be a real alternative to the automobile, then it is absolutely essential that
it be convenient, comfortable and affordable.

33
References
The Brundtland Report. World Commission on Environment and Development. 1987. <http://www.are.admin.ch/are/en/nachhaltig/international_uno/>.
Campus Transit Plan. University of British Columbia. Vancouver, 2003. Cervero, Robert. "Transit Pricing Reasearch: a Review and Synthesis." Kluwer Academic
Publishers (1990). 31 July 2006 <http://www.springerlink.com/media/bec6unwuuhcvh16pxgfy/contributions.pdf>.
Evaluating Arterial Street Transit Preferential Treatment. 31 July 2006 <http://www.ptv-
ag.com/download/traffic/library.pdf>. Fujii, Satoshi, and Ryuichi Kitamura. "What Does a One-Month Free Bus Ticket Do to
Habitual Drivers?" Kluwer Academic Publishers (2003). 31 July 2006. General Social Survey. Statistics Canada. Toronto, 2006. "Homepage." Centre for Sustainable Transportation. 31 July 2006 <http://cst.uwinnipeg.ca/>. "Homepage." UBC TREK Program Centre. 31 July 2006 <http://www.trek.ubc.ca>. Policy Report - Social Development. City of Vancouver. Vancouver, 2005. The Social Components of Community Sustainability: a Framework User's Guide. Greater
Vancouver Regional District. Vancouver, 2004. "Social Economic Policy." World Bank. 31 July 2006 <http://web.worldbank.org>. U-Pass Review Final Report. University of British Columbia. Vancouver: Urban Systems,
2005.


![Draft Goal 1 [LM] – Places Where People Want to Live ......safety, and wellbeing efficiently, effectively, and equitably. ... The same attention will be given to alternate modes](https://img.pdfslide.us/doc/110x75/604459c41b1b524b4c359d5c/draft-goal-1-lm-a-places-where-people-want-to-live-safety-and-wellbeing.jpg)