Embed Size (px)
Citation preview

Social Security Financing and Benefits:Myths vs Facts
Steve GossChief Actuary
Social Security Administration
The New School, NYCMay 9, 2019

2
Three Legged Stool: Basis for Retirement Planning
Common wisdom—aim for 75-80 percent replacement rate
Retirement Income
Social Security

First, A Few Facts…
3

4
Social Security: Who Pays, Who Benefits
WHO PAYS?• 95 percent of workers contribute—177 million in 2019
– 12.4% of earnings up to $132,900 (6 percent of workers earn more)
WHO BENEFITS?• 64 million retirement, survivor, disability beneficiaries in 2019
– 45 million retirees, plus another 3 million of their spouses and children– Plus 6 million survivors– Plus over 10 million disabled workers and their dependents
• And 155 million workers are insured against disability or death

5
Social Security Financing• Basically “pay-as-you-go”
– Current workers provide for current beneficiaries– Social Security cannot borrow– Trust Fund assets provide a “contingency reserve”
• Current OASDI reserves (excess income) = $2.9 trillion– Available to augment tax income as needed– About 3 times the annual cost of the program
• Reserves projected to deplete in 2035 under current law– Expect Congress to act—as it always has

Now, a Few Common Myths1) Social Security is bankrupt, insolvent, running out
of money2) Increasing longevity and disability are the problem3) The money in the trust funds has been spent4) I should start benefits as soon as I can5) My tax contributions have been saved up for me6) Benefits scheduled in the law would be all I need7) Social Security is responsible for Federal debt8) “Fixing” the Social Security shortfall will be hard
6

Myth 1: Social Security Is Bankrupt, Insolvent, Running Out of Money
Facts: a) Social Security cannot run out of moneyb) Even if Congress allowed trust fund reserves to
deplete…• Continuing income would cover 80% of scheduled benefits in 2035• And 75% of scheduled benefits in 2093
c) Over 84 years, Congress has always acted timely• Scheduled benefits have always been paid in full
7

SOLVENCY: OASDI Trust Fund Reserve Depletion in 2035 (one year later than last year)o Reserve depletion date varied from 2029 to 2042 in reports over the past 27 years (1992-2019) o DI Trust Fund — reserve depletion in 2052, twenty years later than last year
o Due largely to lower recent and near-term disability applications and awards.
8
0%
50%
100%
150%
200%
250%
300%
350%
400%
450%
1990 1995 2000 2005 2010 2015 2020 2025 2030 2035 2040 2045 2050 2055
Social Security Trust Fund RatiosAssets as Percent of Annual Cost
Trustees Report Intermediate Projections
OASDI 2019TROASI 2019TRDI 2019TROASDI 2018TROASI 2018TRDI 2018TR
Historical
DI
OASDI
OASI
Tax RateReallocation
Estimated

Myth 2: Increasing Longevity and Disability Are the Problem
Facts:
a) The age distribution of the population is the most important factor in Social Security cost
b) Population “aging” over the next 20 years is due to birth rates
c) Disability costs have matured, and are dropping
9

10
Social Security Cost as Percent of GDP Rises thru 2039 Rises from a 4.2-percent average in 1990-2008, to about 5.9% by 2039, then
declines to 5.8% by 2052, and generally increases to 6.0% by 2093
0%
2%
4%
6%
8%
10%
1990 2000 2010 2020 2030 2040 2050 2060 2070 2080 2090
Calendar year
Non-interest Income
Historical Estimated
Cost
Aging (Change in Age Distribution) Is the CauseMainly due to drop in birth rates
11
0.00
0.05
0.10
0.15
0.20
0.25
0.30
0.35
0.40
0.45
0.50
1940 1950 1960 1970 1980 1990 2000 2010 2020 2030 2040 2050 2060 2070 2080 2090 2100
Aged Dependency Ratio 2019 TRPopulation 65+/(20-64)
Actual and TR Intermediate
TFR remains at 3.0 after 1964
TFR remains at 3.3 after 1964

Birth Rates Have Dropped: Malthus Was WrongAverage Total Fertility Rate falls from 3 to 2
12
0
1
2
3
4
5
6
1865 1875 1885 1895 1905 1915 1925 1935 1945 1955 1965 1975 1985 1995 2005 2015
U.S. Total Fertility Rate: With and Without Adjustment for Survival to Age 10
TFR Adjusted TFR
Notes: TFRs prior to 1917 are for whites only and survival rates prior to 1900 use Massachusetts
1865-1895 4.44 3.091896-1925 3.36 2.801926-1965 2.86 2.711966-1990 1.99 1.951991-2017 1.98 1.96
Average AverageTFR Adjusted TFR

Disability Incidence Rate Falls to Historic LowsDI disabled worker incidence rate rose sharply in the recession, and has
declined since the peak in 2010 to extraordinarily low levels for 2016, 2017 and 2018
13
4.0
4.5
5.0
5.5
6.0
6.5
1990 1995 2000 2005 2010 2015 2020 2025 2030
DI Age-Sex-Adjusted Incidence Rates:Historical and Intermediate Assumptions for 2012 through 2019 Trustees
Report
2012TR
2013TR
2014TR
2015TR
2016TR
2017TR
Average 1990-2018 5.19Ultimate Assumption 5.20
2018TR2019TR

So, Disability Prevalence Is Dropping RemarkablyFewer now and in near term based on recent applications and incidence rates
14
6,000
7,000
8,000
9,000
10,000
11,000
2006 2007 2008 2009 2010 2011 2012 2013 2014 2015 2016 2017 2018 2019 2020 2021 2022 2023 2024 2025 2026 2027 2028
Disabled Worker BeneficiariesIn Current Payment Status at End of Year (in thousands)
2008 TR (no recession)
2019 TR
2018 TR
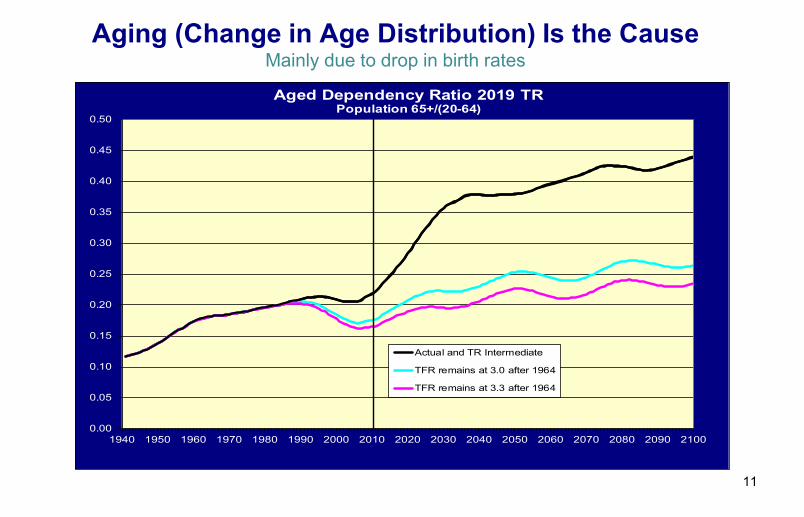
Myth 3: The Money in the Trust Funds Has Been Spent
Facts: a) Every dollar of income is invested by law in interest-
bearing securities backed by the full faith and credit of the United States• These are not “worthless IOUs”!
b) Securities are issued at market yield ratesc) Securities held by the Trust Funds have always been
honored, as have all other Treasury issues
15

Myth 4: I Should Start Benefits As Soon As I Can
Facts: a) Social Security retirement benefits are designed to
provide about the same lifetime value regardless of when you start, on average
b) When to start is personal—you might want to wait if you are in average or better health
c) If you delay by working or using other assets, Social Security increases your life annuity at terms available nowhere else
16

Myth 5: My Tax Contributions Have Been Saved Up for ME
Facts: a) Social Security is a “social contract”b) Basically, benefits paid today are financed from
contributions by recent workersc) This is why the age distribution of the population is
fundamental–the workers of the day share with the retirees, survivors, and disabled of the day
d) This is true for advance funded systems as well
17

Myth 6: Benefits Scheduled in the Law Would Be All I Need
Facts: a) Recall the 3-legged stool: 75-80% in retirementb) Social Security provides about 40% of career-
average earnings (varies from 25% to over 80%)c) So the other legs of the stool—personal savings and
private pensions—are neededd) But increasingly, Social Security is the primary source
of lifetime income
18

Replacement Rates Based on the 2019TR
Source: Annual Recurring Actuarial Note #9 at www.ssa.gov/oact/NOTES/ran9/index.html19
0
10
20
30
40
50
60
70
1940 1960 1980 2000 2020 2040 2060 2080
Scheduled Monthly Benefit Levels as Percent of Career-Average Earnings by Year of Retirement at age 65
Low Earner ($24,239 for 2019; 25th percentile)
Medium Earner ($53,864 for 2019; 56th percentile)
High Earner ($86,182 for 2019; 82nd percentile)
Max Earner ($132,900 for 2019; 100th percentile)

How About at Age 62, Where Almost 1 in 4 Start Benefits?
Source: Annual Recurring Actuarial Note #9 at www.ssa.gov/oact/NOTES/ran9/index.html20
0
10
20
30
40
50
60
70
1960 1980 2000 2020 2040 2060 2080
Scheduled Monthly Benefit Levels as Percent of Career-Average Earnings by Year of Retirement at age 62
Low Earner ($24,239 in 2019; 25th percentile)
Medium Earner ($53,864 in 2019; 56th percentile)
High Earner ($86,182 in 2019; 82nd percentile)
Max Earner ($132,900 in 2019; 100th percentile)

Defined Benefit Plans Replaced by DC Plans And lump sum options increasing for DB plans
21
0%
10%
20%
30%
40%
50%
60%
1979
1980
1981
1982
1983
1984
1985
1986
1987
1988
1989
1990
1991
1992
1993
1994
1995
1996
1997
1998
1999
2000
2001
2002
2003
2004
2005
2006
2007
2008
2009
2010
2011
2012
2013
2014
Private-Sector Workers Participating in Employment-Based Retirement Plans, by Plan Type, 1979-2014
Defined Benefit Total Defined Contribution Total
Both Either
Source: U.S. Department of Labor Form 5500 Summaries 1979-1998, Pension Benefit Guaranty Corporation,Current Population Survey 1999-2013, EBRI estimates 1999-2014.

Myth 7: Social Security Is Responsible for Federal Debt
Facts: a) OASI, DI, HI Trust Funds do not add to the debtb) In fact, these trust funds finance part of the debtc) If trust fund reserves ever depleted, the programs
cannot borrowd) Thus, the common “budget scoring convention” is
misleading and inconsistent with the law
22

23
So—What If We Project Federal Debt Consistent With the Law? Projection to 2090 Back in 2015
0
20
40
60
80
100
120
140
160
180
200
2000 2010 2020 2030 2040 2050 2060 2070 2080 2090
Publi
cly H
eld D
ebt a
s a Pe
rcent
age o
f GDP
Projected Federal Debt Held by the Public: CBO Baseline (Assuming OASDI & HI Unfunded Obligations Are Paid by Borrowing From the Public) vs.
Assuming Current Law
CBO Baseline July 2015
Less OASDI Unfunded Obligations (CBO Dec 2015)
Less OASDI (CBO Dec 2015) and HI (Trustees 2015)Unfunded Obligations

Myth 8: “Fixing” the Social Security Shortfall Will Be Hard
Facts: a) Need to adjust the benefits or revenue given the shift
in the age distributionb) By 2035, lower scheduled benefits by 23%, or raise
revenue by 29%, or some combinationc) Question: what do the American people want?d) Many options are already under consideration
24

25
OASDI Annual Cost and Non-Interest Income as Percent of Taxable Payroll Persistent Negative Annual Cash-Flow Balance Starting in 2010
80% of scheduled benefits still payable at trust fund reserve depletionAnnual deficit in 2093: 4.11 percent of payroll — 0.25 percent smaller than last year
0%
5%
10%
15%
20%
25%
2005 2015 2025 2035 2045 2055 2065 2075 2085 2095
Calendar year
Cost: Scheduled and payable benefits
Non-interest Income
Payable benefits as percentof scheduled benefits:2018-34: 100%2035: 80%2093: 75%
Cost: Scheduled but not fully payable benefits
Expenditures: Payable benefits = income after trust fund depletion in 2035
Historical Estimated

Some Ways to Lower Cost• Lower benefits for retirees—not disabled?
– Increase normal retirement age (lowers OASDI cost, but increases DI cost)
– Can exempt long-career low earners
• Lower benefits mainly for high earners?– Reduce PIA above some level– Often combined with increasing PIA below some level, subject to
work year requirements
• Lower benefits mainly for the oldest old?– Reduce the COLA– But, some say increase it with the CPI-E (based on purchases of
consumers over age 62)26

Some Ways to Increase Revenue• Raise the 12.4 percent OASDI payroll tax rate?
• Raise tax on highest earners?– Increase taxable maximum amount– Some tax on all earnings above the maximum
• Tax employer group health insurance premiums?– Affects only middle class if taxable maximum remains
27

For More Information Go Tohttp://www.ssa.gov/oact/
• There you will find:– All OASDI Trustees Reports: 1941-2019– Detailed single-year tables for recent reports– Our estimates for comprehensive proposals– Our estimates for the individual provisions– Actuarial notes; including replacement rates– Actuarial studies – Extensive databases– Congressional testimonies– Presentations by OCACT employees
28