Embed Size (px)
Citation preview
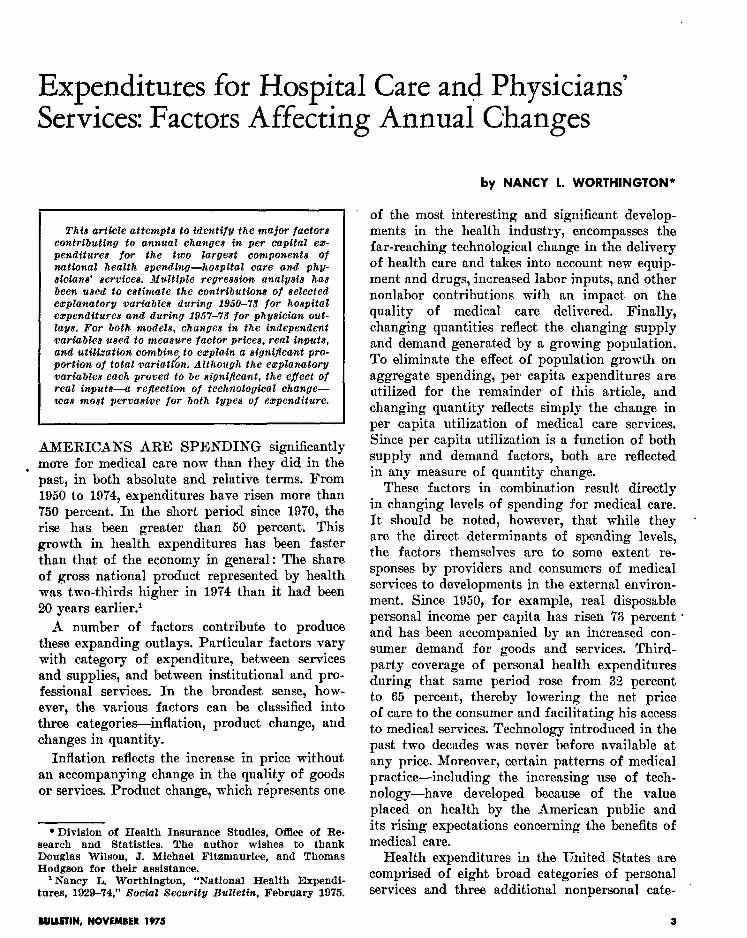
Expenditures for Hospital Care and Physicians’ Services: Factors Affecting Annual Changes
This article attempts to ident4fy the major factor8 contr&ut&g to annual change8 in per capital ex- pendituree for the two largest component8 of nationaz health epending-hosp2taZ care and phy- 8icians’ aervicea. Multiple regression analyeie ha8 been used to estimate the contribution8 of selected explanatory variable8 during 1950-S for hospital expenditures and during 1957-73 for phyeician out- Zaye. For both models, change8 in the independent wariabzes Used to measure factor prices, reUZ inputs, and utiZization combine to expZaBn a significant pro- portion of total variat 2/ on. Although the explanatory VariabZes each proved to be crig?#cant, the effect of real inputs-a reflection of technoZogZcaZ change- was most pervasive for both types of eapenditure.
AMERICANS ARE SPENDING significantly . more for medical care now than they did in the
past, in both absolute and relative terms. From 1950 to 1974, expenditures have risen more than 750 percent. In the short period since 1970, the rise has been greater than 50 percent. This growth in health expenditures has been faster than that of the economy in general: The share of gross national product represented by health was two-thirds higher in 1974 than it had been 20 years ear1ier.l
A number of factors contribute to produce these expanding outlays. Particular factors vary with category of expenditure, between services and supplies, and between institutional and pro- fessional services. In the broadest sense, how- ever, the various factors can be classified into three categories-inflation, product change, and changes in quantity.
Inflation reflects the increase in price without an accompanying change in the quality of goods or services. Product change, which rkpresents one
* Division of Health Insurance Studies, Oface of Re- search and Statistics. The author wishes to thank Douglas Wilson, J. Michael Fitrmaurice, and Thomas Hodgson for their assistance.
’ Nancy L. Worthington, “National Health Expendi- tures, 1929-74,” BociuZ Security Bulletin, February 1975.
MILLETIN, NOVEMBER 1975
by NANCY 1. WORTHINGTON*
of the most interesting and significant develop- ments in the health industry, encompasses the far-reaching technological change in the delivery of health care and takes into account new equip- ment and drugs, increased labor inputs, and other nonlabor contributions with an impact on the quality of medical care delivered. Finally, changing quantities reflect the changing supply and demand generated by a growing population. To eliminate the effect of population growth on aggregate spending, per capita expenditures are utilized for the remainder of this article, and changing quantity reflects simply the change in per capita utilization of medical care services. Since per capita utilization is a function of both supply and demand factors, both are reflected in any measure of quantity change.
These factors in combination result directly in changing levels of spending for medical care. It should be noted, however, that while they - are the direct determinants of spending levels, the factors themselves are to some extent re- sponses by providers and consumers of medical services to developments in the external environ- ment. Since 1950, for example, real disposable personal income per capita has risen 73 percent * and has been accompanied by an increased con- sumer demand for goods and services. Third- party coverage of personal health expenditures during that same period rose from 32 percent to 65 percent, thereby lowering the net price of care to the consumer and facilitating his access to medical services. Technology introduced in the past two decades was never before available at any price. Moreover, certain patterns of medical practice-including the increasing use of tech- nology-have developed because of the value placed on health by the American public and its rising expectations concerning the benefits of medical care.
Health expenditures in the United States are comprised of eight broad categories of personal services and three additional nonpersonal cate- ’
3
gories. This article attempts to analyze the sources of year-to-year change in expenditures for the two largest of these components-hospital care and physicians’ services. Together, these central providers of medical care account for 57 percent of all outlays and two-thirds of total personal health spending.
HOSPITAL CARE
The hospital has been the scene of many of the most dramatic developments in medical care. It has always had a central role in the health delivery system, but its importance has become increasingly significant in recent years. In 1974, there were 33 million admissions to community hospitals (159 for every 1,000 persons) resulting in 246 million inpatient days of care.* In addi- tion to their traditional role as providers of inpatient care, hospitals have also rapidly ex- panded their outpatient services to the extent that they currently accommodate more than 175 million visits annually. s
What has brought about these significant in- creases? An attempt is made here to track year- to-year variation in hospital expenditures, the product of hospital costs, and quantity of care received. Multiple regression analysis has been used to estimate the contributions of selected explanatory variables during the period 1950-73.
The focus of the analysis is on the annual changes in per capita spending for community hospital care. Community hospitals-defined to include all non-Federal short-term general and other special hospitals-account for the vast majority of total hospital outlays-77 percent in 1973. The remaining Federal and long-term institutions behave somewhat differently than community hospitals, and their inclusion would complicate the attempt to explain expenditure trends. In addition, community hospitals have been the major focus of many of the changes undergone in hospital care in the past two dec- ades, and analysis of their behavior is therefore of most interest to health economists and policy- makers.
The United States hospital system provides
’ “Hospilal Indicators,” Hospitala, Journal of the American Hospital Association, midmonth issues.
some of the most technologically sophisticated medical care available in the world today. Many of the developments in the form of new treat- ment procedures have been beneficial to society,8 but they have also been expensive. The average cost of a day of hospital care is now well over $100. Total spending for hospital care in this country this year will amount to more than $200 for every man, woman, and child. This amount is double the average spent in 1968 and more than eight times that in 1950.
Included in the regression equations, described subsequently, are the major factors that can be expected to affect the level of spending for hospital care. As noted, these factors may in turn be stimulated by exogenous phenomena such :s income and insurance coverage, but in this model the focus has been only on the immediate causes of increased outlays.
Five factors have been included in both re- gression equations : The cost of labor, prices for goods and services, labor inputs, nonlabor inputs, and per capita utilization. All are entered in the form of first differences (or, in one case, annual percentage changes) to minimize the strong time effect generally present in a time series (whereby the magnitude of the observed value in one year is a strong predictor of that observed in the iollowing year). The use of first differences has other advantages.4 A time variable has been inserted in the second equation to capture any remaining unexplained variation attributable to the passage of time. For prediction purposes, the model is a reduced-form equat.ion, combining the interactive effects of supply and demand.
.
There is no consensus among economists on the specific content of the underlying structural equations from which this reduced-form equation is in theory derived. It can be assumed that they are extremely complex, incorporating ele- ments such as the production function, demand
t Within this technology, dramatic examples of life- saving or life-improving developments such as renal dialysis have appeared, but the value of certain treatment procedures is disputed by some (see, for example, A. L Cochrane, EffeCtiVene88 and Eficiency-Random RelZec- lions on Health Bervices, The NuSleld Provincial Hospital Trust, 1072). Analysis of the social or economic benetlts derived from this technology is beyond the present scope, and no value judgments have been included or should be inferred
‘Daniel B Suits, “Forecasting With an Econometric Model,” American Economic Review, March 1962, page 112.
4 SOCIAL SECURITY
for and supply of factor inputs, and consumer demand for health care, with different competi- tive conditions among the markets. The resulting reduced-form coefficients are likely to be biased ,and inconsistent, but they represent an attempt to predict expenditure changes based on changes in a selected set of explanatory variables. As long as the basic structure underlying these variables does not change, the predictions will hold. It is hoped that any biases are small.
Definition of Regression Variables
Factor p&ea.-The prices paid by hospitals for labor, services, and supplies are mainly a function of the state of the economy, although the mix of items purchased and skills of per- sonnel employed reflect specifically the hospital’s function as a provider of medical care and have changed with the passage of time.
The price paid by hospitals for labor mainly reflects prevailing wage levels in the surrounding community, although it can also be affected by other factors such as unionization, minimum-wage legislation, and the relative scarcity of certain skills sought by the hospital. For this model, wage rates were measured by the annual absolute changes in payroll expenses per full-time-equiva- lent hospital employee.
A measure of average wages paid to hospital employees, such as the one used in this model, generally reflects the cost of ltibor to hospitals. It has, however, one significant drawback: It also tends to incorporat,e any changes taking place within hospitals in the skill mix of its personnel. Although not much data are available to document such changes, some evidence indicates that the trend in recent years has been toward an increasing proportion of lower-skilled em- ployees.5 If such is the case, the measure used here will tend to understate the impact of the rising cost of labor.
For nonlabor items such as food, fuel, equip- ment, and supplies, the price paid by hospitals is again mainly a function of the general eco- nomic environment. Inflation in the general economy will have a direct impact on the cost of
’ Martin S. Feldstein, The Rising Cost of Hospital Care, Information Resources Press, 1971.
hospital care. The rapid inflation experienced recently in the price of such essentials as food and fuel has already been felt in increased outlays for’ hospital care. The cost-reimbursement mechanism, through which the majority of hos- pital expenditures are financed, assures that the inflation in both labor and nonlabor prices will be directly reflected in the form of higher outlays for hospital care.
Nonlabor factor prices were measured in this model by percentage changes in the consumer price index (CPI) of the Bureau of Labor Sta- tistics. Although the CPI is made up of a dif- ferent marketbasket of goods and services than that purchased by hospitals, detailed investigation by Martin Feldsteins led to the conclusion that price trends in hospital purchases are more closely related to the CPI than to other price indicators such as the wholesale price index.
ReaZ inputs.--In addition to keeping pace with inflation, hospitals are providing a different product today than they did in the past. In response to a variety of ‘stimuli, hospitals have substantially increased both the labor and non- labor inputs into a day of care. These increased inputs, which often reflect technological changes, have affected both the quality and quantity of care delivered.
Labor inputs in this model are measured by the absolute changes, in the average number of per- sonnel employed for every 100 hospital census. Since 1950, this rate has nearly doubled, rising from 178 in the earlier year to more than 300 in 1973. The types of personnel hired range from trained technicians needed for new types of therapy to professional or clerical workers on the hospital administrative staff. In some cases, they substitute for additional capital equipment; in other cases they accompany it.
Nonlabor inputs encompass a wide variety of services and supplies added to a day of hospital care. Since 1950, hospitals have increased the sheer numbers of facilities and services available _ as well as the relative sophistication of their mix. They have also tended to use new as well as existing services more intensively. One exaiple
‘Martin S. Feldstein, “The Quality of Hospital Serv- ices: An Analysis of Geographic Variation and Inter- temporal Change,” in M. Perlman, ed., The Ecommfc~ of Health and Medical Care, John Wiley & Sons, 1974.
BUURTIN, NOVEMBER 1975 5
of the changing nature of hospital care is the development of intensive care units. In 1960, only 10 percent of community hospitals had in- tensive care units. Thirteen years later, more than 60 percent had them. Since the average charge per bed in an intensive care unit is more than twice that for routine care in a semiprivate room, such changes can have a substantial impact on hospital expenditures.
In the regression equations, real nonlabor in- puts are measured by the yearly increase in nonpayroll expenses per patient day, deflated by the CPI. This figure reflects a broad range of developments, including additional facilities, service intensity, and substitutions of capital for labor-through conversion to the use of disposable products, for example.
Quantity of care.-Inflation and increases in real inputs have helped to increase the cost of a day of hospital care. In addition, however, Americans are receiving relatively more days of hospital care today than they did in the past. In 1950, for example, patient days in community hospitals (adjusted for the volume of outpatient visits) numbered 1 day per capita; in 1973, this rate was more than 1.3 days or one-third more. Although the introduction and widespread use of new drugs during this period reduced some of the need for hospitalization, the almost simul- taneous development of new medical techniques that could only be applied in the hospital in- creased the demand for hospital care for a dif- ferent set of diagnoses, many of them formerly untreatable. Some believe that inpatient, hospital care is overutilized and that, for some patients, less expensive institutional or outpatient services could safely be substituted. Nevertheless, the fact that more care is being used must be taken into account in any analysis of expenditures for hos- pital care.
In this model, patient days per 1,000 popula- tion, adjusted to take into account the volume of outpatient visits, are the measure of utilization. This measure is really a confluence of supply and demand factors, since demand for hospital care is influenced by the existing bed supply. In the past 20 years, the supply of community hospital beds has grown faster than the popula- tion-from 3.3 per 1,000 population in 1950 to 4.2 in 1973. Milton Roemer and others have pre-
6
sented evidence that increases in hospital bed supply lead to greater utilization of hospital care.? Patient days, therefore, measure the yearly levels of hospital use, given an expanding bed supply. Any residual effects of time or of omitted variables correlated with time are captured by the time trend inserted in the second regression equation.
It was expected that each of the foregoing variables would help to account .for year-to-year‘ changes in expenditures for hospital care. The actual input data are presented in tables 1 and 2.
Impact of the Sources of Increase
All variables in the two equations were entered as first differences or percentage changes. The “ordinary least squares” method was used to estimate the coefficients. The equations were linear, with the model in the following form:
where HE = Per capita hospital expenditures FPL = Factor prices (labor)
FPNL = Factor prices (nonlabor items) RIL = Real labor inputs
R1N.L = Real nonlabor inputs PD= Patient days
(Equation 2 includes an additional term bs TIME, where TIME: is a dummy variable representing a time trend )
Changes in per capita hospital expenditures were therefore postulated to be a function of changes in selected contributory factors.
As shown in table 3 and chart 1, the factors included in the equations explained nearly all of the yearly variation in per capita expenditures for hospital care (??* = .94 without the time variable ; ??* = .96 when the time variable is included). As expected, each variable has a sig- nificant, positive impact on annual expenditure changes. In the subsequent discussion of precise impacts, the results of equation 1 will be used.
An increase in factor prices-both labor and nonlabor-produces an increase in per capita
‘These conclusions are summarized in Herbert E. Klarman, The Economac8 of I-lealth, Columbia University Press, 1965, pages 140-l.
K)CIAL SECURITY
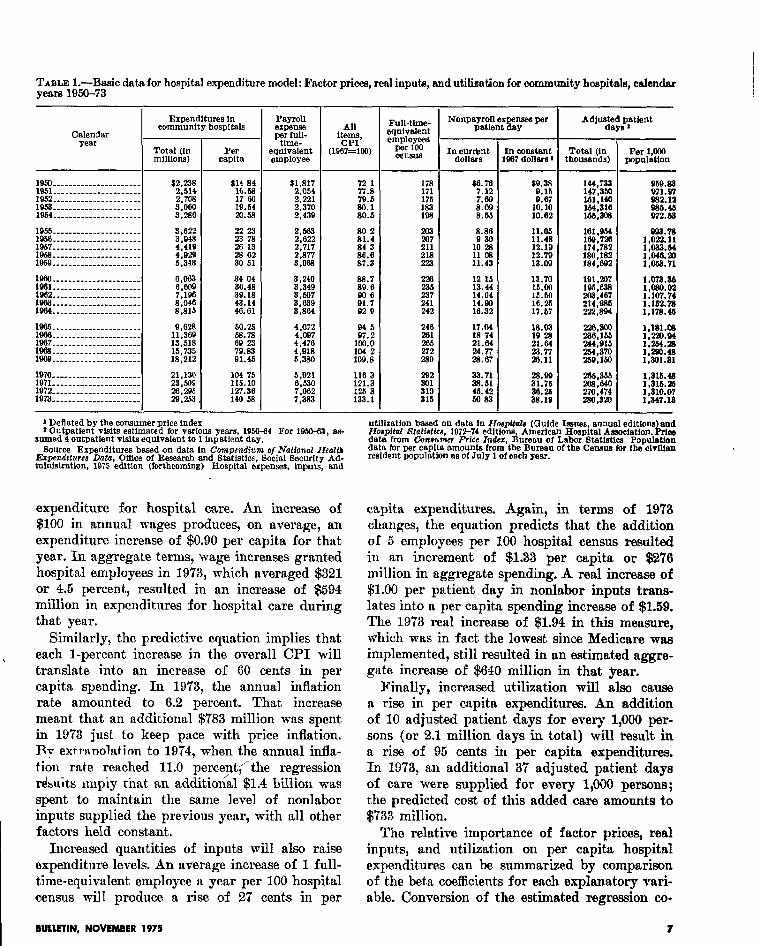
TABLE I.-Basic data for hospital expenditure model: Factor prices, real inputs, and utilization for community hospitals, calendar yefm 1950-73
Expenditures in cmnmunity hospitals
1950 ----____-__ * --____-___ $2,238 lQ51- - - - - - -- -- - -- -_ -_ _ - - - _ 1852 _-__________ _-___-_---
;,;g
19.53 _____ -_ ___ __ _- _ -- _ _- __ 1964... ---__-_ _-----_ _ _ __ _ %r!i
1053 --______--_-______ *___ 1958. _ __ __- -_ _-_ __ -_- -_ _- _
y&
1937 ______________-_-___-- 1969 ____----__ * ____-_-____
::;g
196Q ----------_----------- s:348
1860 -__---_-___--___--____ e,c+J3 1931---________---__ ______ 1932 ---- --___ -__-_-- -_ _ _ _ _ X-i 1963. --_ --_ __ _ _-- ___ _- ___ _ 1964 ---- _-____---___ _-____
1986 - - _ - _ _ _ _ - _ _ - _ _ _ _ _ _ _ _ _ - 8,828 1966. _ _ _ _ _ - - _ _ _ - - _ - _ _ - _ _ _ _ 1887..-.........-.-.------ ::I!: 1888. --- -_ _- __ _-- --_ __ __ _ _ 15:735 1880. - _. - _ _ - _ - _ -_ _ _ _ _ _ _ - _ _ 18,212
1970. ___ _ _ __ _ _ _ _ _ _ __ _ _ __ _ _ 21,130 1971---________.__________ 1972. _______ _____ _______ __
23,509
1973. ----__- -__-__-_---- __ gyg
Per capita
22 23
5 :: 28 02 30 61
33: “4: 39: 18 43.14 46.61
p:;
79.83 91.46
104 7b 115.10 127.36 140 58
PtIyMl
;pi
equivalent employee
$1,817 2,064 2.221 2,370 2,438
2.663 2,022 2,717 2,877 3,088
4,072 4,007 4,470 4,918 6,380
5,921
?Ei 7:383
- 1 Deflated by the consumer price index f OutpatIent visits estlmsted for various years, 1950-84 For 1950-63, as-
sumed 4 outpatient visits equlvslent to 1 inpstient day. Source Expenditures based on data In Compendium o/National Health
Erpmdrfurca Data, Office of Research and Statistics, Social Gecurlty Ad- ministration, 1875 edition (forthwming) Hospital expenses, Inputs, fmd
expenditure for hospital care. An increase of $100 in annual wages produces, on average, an expenditure increase of $0.90 per capita for that year. In aggregate terms, wage increases granted hospital employees in 1973, which averaged $321 or 4.5 percent, resulted in an increase of $594 million in expenditures for hospital care during that year.
Similarly, the predict.ive equation implies that each l-percent increase in the overall CPI will translate into an increase of 60 cents in per capita spending. In 1973, the annual inflation rate amounted to 6.2 percent. That increase meant that an additional $783 million was spent in 19’73 just to keep pace with price inflation. Ry etiranolatinn to 1974, when the annual infla- tion rate reached 11.0 perc.e$‘ihe regression r&u& nrlpiy that an additional $1.4 balion was spent to maintain the same level of nonlabor inputs supplied the previous year, with all other factors held constant.
capita expenditures. Again, in terms of 1973 changes, the equation predicts that the addition of 5 employees per 100 hospital census resulted in an increment of $1.33 per capita or $276 million in aggregate spending. A real increase of $1.00 per patient day in nonlabor inputs trans- lates into a per capita spending increase of $1.59. The 19’73 real increase of $1.94 in this measure, which was in fact the lowest since Medicare was implemented, still resulted in an estimated aggre- gate increase of $640 million in that year.
Finally, increased utilizat.ion will also cause a rise in per capita expenditures. An addition of 10 adjusted patient days for every 1,000 per- sons (or 2.1 million days in total) will result in a rise of 95 cents in per capita expenditures. In 1973, an additional 37 adjusted patient days of care were supplied for every 1,000 persons; the predicted cost of this added care amounts to $733 million.
Increased quantities of inputs will also raise expenditure levels. An average increase of 1 full- time-equivalent employee a year per 100 hospital census will produce a rise of 27 cents in per
The relative importance of factor prices, real inputs, and utilization on per capita hospital expenditures can be summarized by comparison of the beta coefficients for each explanatory vari- able. Conversion of the estimated regression co-
BUUFIIN, NOVEMBER 1975 7
,
--
-
Full-tlme- squivatent employees
per loo censlla
178 171 175
E
203
z 218 223
228
iii 241 242
240 281
E 2.80
- I Nonpayroll expenses per
patient day
12 1s 13.44 14.04 14.80 18.32
17.04 13 74 21.61
E:Z
33.71 33.61 46.42 53.93
fn constant 967 dollars ’
$9.38 9.15 9.67
10.10 10.62
Total (In thousands)
Per 1,ooO population
144,733 958.83 147.350 971.W
:ix 032. la
1.5&:3@3 E:ki
lM.Qbl lee.728 1,E:E 174,782 1,033.M ;;g,g 1,046.20
1,033.7l
iii.?% 1,316.4a
no:474 1,316.25 ;,;p;
280,ml ( .
utlllzstion bawd on data in Jforpftala (Guide Issues, annual editlons and Hospfhrl Statfatfcu, 1072-74 edltlons, American Hospital Amooistlon. k rice data from Conavnn Prfec In&r, Bweeu of Labor Btatistlca Populatfon data for per caplts amounts from the Bureau of the Censure for the cIvIlfan resident population 8s of July 1 of each year.
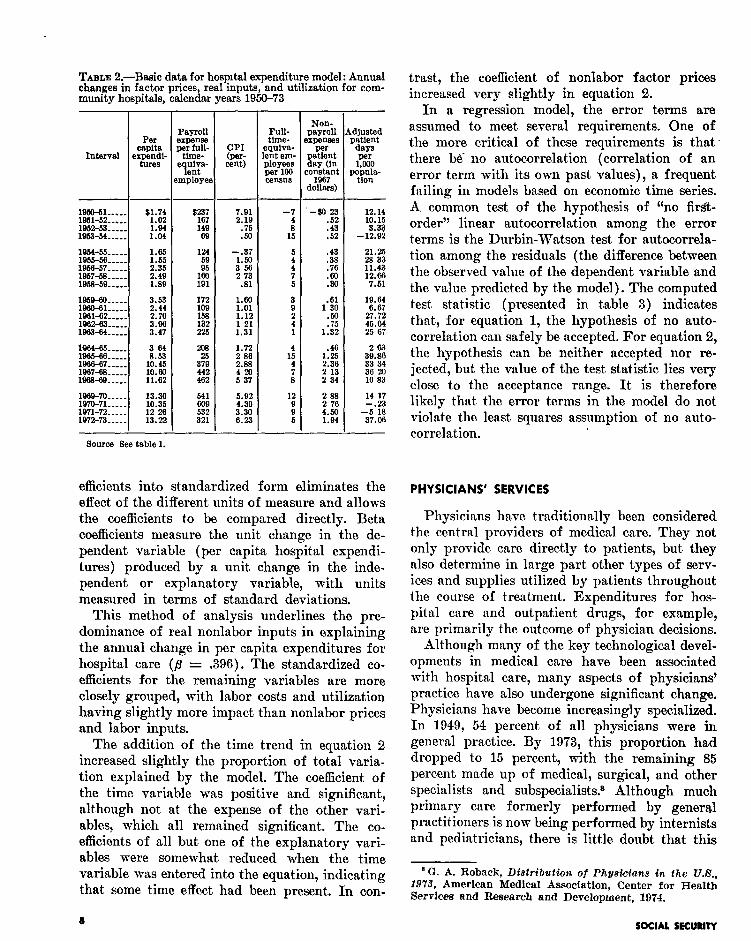
TABLE 2.-B&c data for hospital expenditure model: Annual changes in factor prices real inputs, and utilization for com-
trast, the coefficient of nonlabor factor prices
munity hospitals, calendar years 1950-73 increased very slightly in equation 2. In a regression model, the error terms are
assumed to meet several requirements. One of the more critical of these requirements is that- there be- no autocorrelation (correlation of an error term with its own past values), a frequent failing in models based on economic time series. A common test of the hypothesis of ‘(no first- order” linear autocorrelation among the error terms is the Durbin-Watson test for autocorrela- tion among the residuals (the difference between the observed value of the dependent variable and the value predicted by the model). The computed test statistic (presented in table 3) indicates that, for equation 1, the hypothesis of no auto- correlation can safely be accepted. For equation 2, the hypothesis can be neither accepted nor re- jected, but the value of the test statistic lies very close to the acceptance range. It is therefore likely that the error terms in the model do not violate the least squares assumption of no auto- correlation.
19,Yl-51..... $1.74 V&51-52..... 1952-53..... :*ii 1953~54..-. Loa
1964-56.-.s. 196&k%.-..- :*: 195a-57....- 2135 1957-r-s.-.. 2.49 195869..... 1.89
:=::-:: 3.53
1961-52..:.. 2.44 2.70
1962-&.~.. 1963-64..-. E
~~~~-: 196&67..:..
I! ti [email protected]..
g: g
P&38-69..-.. 11:sz
1969-70-.... 1970-71..-.. :x 1971-72.-.. 12’29 1972~73..-. 13.22
Source Eee table 1.
-
Payroll
;F
B uiva- P - ent
mployet
172 109
:2 225
% 379 442 482
541
k% 321
g: cent)
7.91 2.19
:2
-.37
;*i
.81
:-ii 1: 12 1 21 1.31
1.72 2 86 2.38
54:
~~~ a:30 6.23
Full- time-
,quiva- snt em- P&Ylfg
census
-7
s” 15
:
: 5
;
: 1
1:
: 8
12
ii 6
1 e
1 ,
01
< --
-
Non- payroll KpeWS
per
! atlent
SY un onstant
1967 lollers)
-go23
:z .52
.43
137:
::
.61 1 30
:E 1.32
.48
$5 2’ 13 2 34
i ;: 4.50 1.94
-
12.14
‘E -12:SZ
21.25 28 33 11.43 12.66 7.61
3: zi 33’34 36 !m 10 83
14 17 -.23
-5 18 37.08
efficients into standardized form eliminates the effect of the different units of measure and allows the coefficients to be compared directly. Beta coefficients measure the unit change in the de- pendent variable (per capita hospital expendi- tures) produced by a unit change in the inde- pendent or explanatory variable, with units measured in terms of standard deviations.
This method of analysis underlines the pre- dominance of real nonlabor inputs in explaining the annual change in per capita expenditures for hospital care (a = .396). The standardized co- efficients for the remaining variables are more closely grouped, with labor costs and utilization having slightly more impact than nonlabor prices and labor inputs.
The addition of the time trend in equation 2 increased slightly the proportion of total varia- tion explained by the model. The coefficient of the time variable was positive and significant, although not at the expense of the other vari- ables, which all remained significant. The co- efficients of all but one of t,he explanatory vari- ables were somewhat reduced when the time variable was entered into the equation, indicating that, some time effect had been present. In con-
a
PHYSICIANS’ SERVICES
Physicians have traditionally been considered the central providers of medical care. They not only provide care directly to patients, but they also determine in large part other types of serv- ices and supplies utilized by patients throughout the course of treatment. Expenditures for hos- pital care and outpatient drugs, for example, are primarily the outcome of physician decisions.
Although many of the key technological devel- opments in medical care have been associated with hospital care, many aspects of physicians’ practice have also undergone significant change. Physicians have become increasingly specialized. In 1949, 54 percent of all physicians were in general practice. By 1973, this proportion had dropped to 15 percent, with the remaining 85 percent made up of medical, surgical, and other specialists and subspecialists.* Although much primary care formerly performed by general practitioners is now being performed by internists and pediatricians, there is little doubt that this
a G. A. Roback, Distribution. of Physicians in. the U.B., 197% American Medical Association, Center for Health Services and Research and Development, 1074.
SOCIAL SKUwY
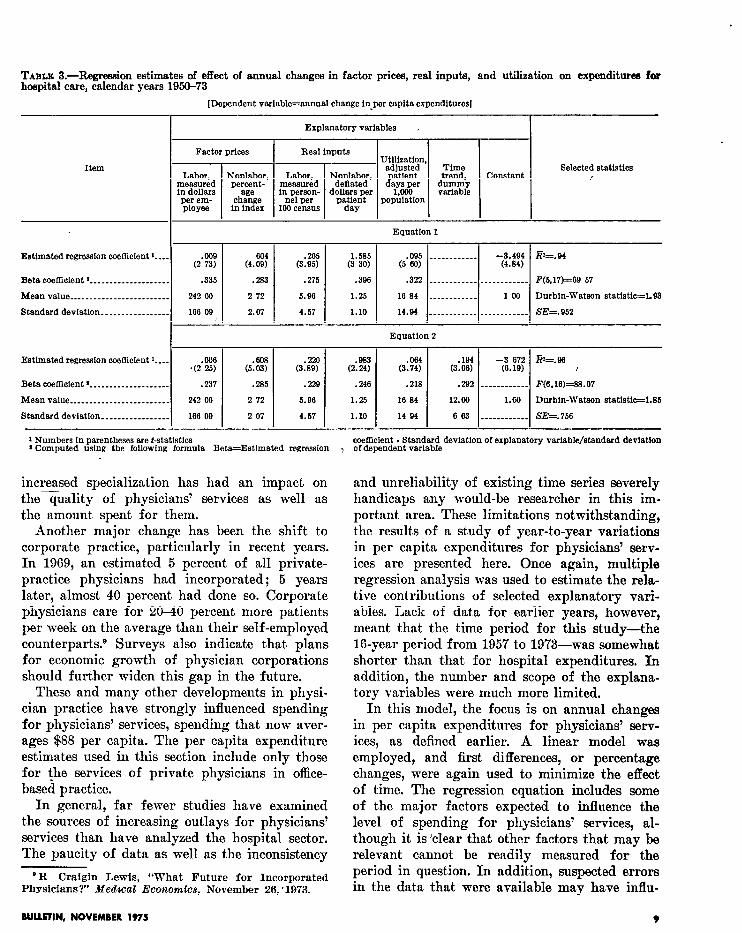
TABLE 3.-Regression estimates of effect of annual changes in factor prices, real inputs, and utilization on expenditurea for hospital care, calendar years 1950-73
[Dependent variable=annual change in-per capita expenditures1
Explanatory variables ,
~ se’ectef statist’cs
Estimated regression coefiicient I--.
Bets coefficient 2 ________________ ___
Mean value ________________________
Standard deviation ________________
Estlmated regression coefficient I---
Beta coefficient 2 _____________ _ _____
Mean value ________________________
Standard deviation ________________
.009 (2 73)
.335
242 00
166 99
Equation I
.275 .396
6.96 1.25
4.57 1.10
.322 ____________ ____________ F(6,17)=69 67
16 84 ____________ 100 Durbin-Watson statistic=193
14.94 ____________ ____________ SE=.952
1 Numbers in parentheses are t-statistics ’ Computed ustng the following formula Beta=Estimated regression
coefficient . Standard deviation of explanatory variable/standard deviation of dependent variable
increased specialization has had an impact on the quality of physicians’ services as well as the amount spent for them.
Another major change has been the shift to corporate practice, particularly in recent years. In 1969, an estimated 5 percent of all private- practice physicians had incorporated; 5 years later, almost 40 percent had done so. Corporate physicians care for 20-40 percent, more patients per week on the average than their self-employed counterparts.D Surveys also indicate that plans for economic growth of physician corporations should further widen this gap in the future.
These and many other developments in physi- cian practice have strongly influenced spending for physicians’ services, spending that now aver- ages $88 per capita. The per capita expenditure estimates used in this section include only those for the services of private physicians in office- based practice.
In general, far fewer studies have examined the sources of increasing outlays for physicians’ services than have analyzed the hospital sector. The paucity of data as well as the inconsistency
‘R Craigin Lewis, “What Future for Incorporated Physicians?’ Medzcal Economics, November 26, ‘1973.
In this model, the focus is on annual changes in per capita expenditures for physicians’ serv- ices, as defined earlier. A linear model was employed, and first differences, or percentage, changes, were again used to minimize the effect of time. The regression equation includes some of the major factors expected to influence the level of spending for physicians’ services, al- though it is ‘clear that other factors that may be relevant cannot be readily measured for the period in question. In addition, suspected errors in the data that were available may have influ-
BULLETIN, NOVEMBER 1975 9
and unreliability of existing time series severely handicaps any would-be researcher in this im- portant area. These limitations notwithstanding, the results of a study of year-to-year variations in per capita expenditures for physicians’ serv- ices are presented here. Once again, multiple regression analysis was used to estimate the rela- tive contributions of selected explanatory vari- ables. Lack of data for earlier years, however, meant that the time period for this study-the 16-year period from 1957 to 19’73-was somewhat shorter than that for hospital expenditures. In addition, the number and scope of the explana- tory variables were much more limited.
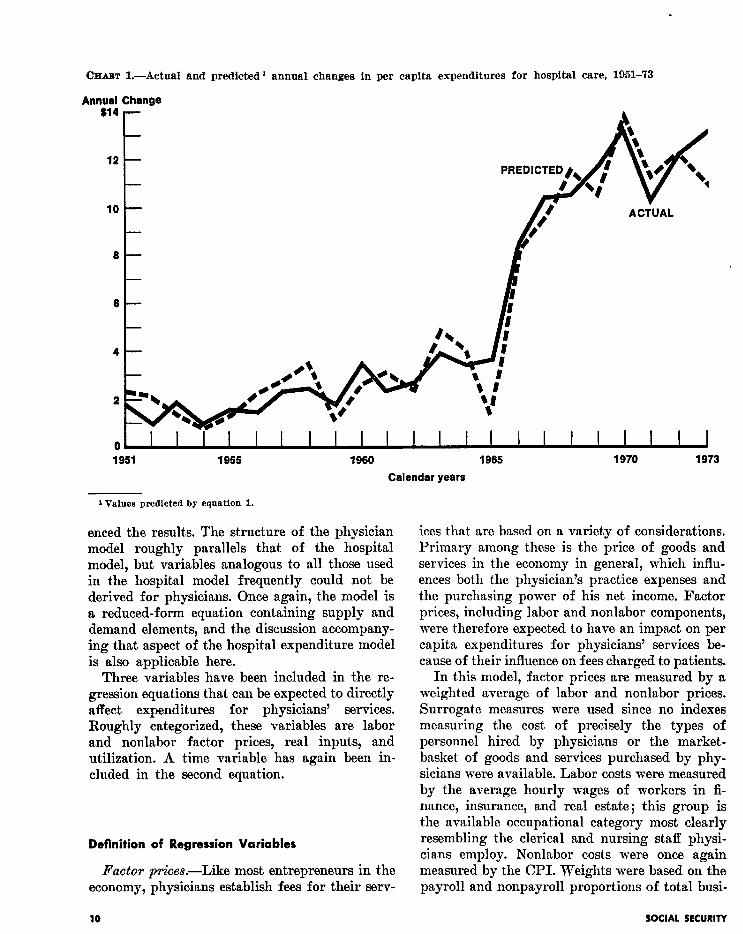
OHAm L-Actual and predicted 1 annual changes in per capita expenditures for hospital care, 1951-73
Annual Change $14
12 t- PREDICTED), I
1980 1985 1970 1973
Calendar years
1 Values predicted by equation 1.
enced the results. The structure of the physician ices that are based on a variety of considerations. model roughly parallels that of the hospital Primary among these is the price of goods and model, but variables analogous to all those used services in the economy in general, which influ- in the hospital model frequently could not be ences both the physician’s practice expenses and derived for physicians. Once again, the model is the purchasing power of his net income. Factor a reduced-form equation containing supply and prices, including labor and nonlabor components, demand elements, and the discussion accompany- were therefore expected to have an impact on per ing that aspect of the hospital expenditure model capita expenditures for physicians’ services be- is also applicable here. cause of their influence on fees charged to patients.
Three variables have been included in the re- gression equations that can be expected to directly affect expenditures for physicians’ services. Roughly categorized, these variables are labor and nonlabor factor prices, real inputs, and utilization. A time variable has again been in- cluded in the second equation.
In this model, factor prices are measured by a weighted average of labor and nonlabor prices. Surrogate measures were used since no indexes measuring the cost of precisely the types of personnel hired by physicians or the market- basket of goods and services purchased by phy- sicians were available. Labor costs were measured by the average hourly wages of workers in fi- nance, insurance, and real estate; this group is the available occupational category most clearly resembling the clerical and nursing staff physi- cians employ. Nonlabor costs were once again measured by the CPI. Weights were based on the payroll and nonpayroll proportions of total busi-
Definition of Regression Variables
Factor prices.-Like most entrepreneurs in the economy, physicians establish fees for their serv-
10 SOCIAL SRCURITY
ness deductions reported by physicians to the Internal Revenue Service. Because it was felt that lags exist between factor-price inflation and the associated fee increases, a 2-year moving average of the percentage increases in the factor- price index was used.
Rest iltputs.-Measurement of real inputs pro- vided the most difficult conceptual and practical problem in the model. Variables directly analo- gous to those used in the hospital model-in- cluding real labor and nonlabor components- were not available on an annual basis for physi- cians’ practices. In addition, this analysis is fur- ther complicated by the fact that the physician’s gross income, in large part, represents payment for his own labor. Changes in the training and experience of the physicians themselves (that is, increased levels of human capital per physician) therefore account for much of the real input.
After adjustment for inflation and utilization, year-to-year increases in expenditures for phy- sicians’ services can result from several factors. These changes can reflect the increased specializa- tion of physicians, a shift that carries with it an increase in both labor and nonlabor costs per unit of service. The increased labor cost results from the higher rate of compensation to a higher quality (that is, better-educated) physician. Higher nonlabor costs result from the rise in the number of auxiliary services, such as laboratory tests and X-rays, which often accompany increas- ingly specialized care.
The expenditure changes can also reflect the higher average price received by physicians per patient visit. It is well known that physicians often make special allowances for patients ac- cording to their ability to pay and that, his- torically, their “customary” charge had generally been higher than the “average” charge received for most services. As privat.e and public insurance coverage has continued to expand, however, phy- sicians’ average fees have moved closer to their customary fees. The additional revenue derived from third-party reimbursement, however, can- not appropriately be considered the results of real inputs.
The changes are also the outcome of real inputs similar to those added to a hospital patient day: more personnel, more equipment and supplies, and other technological changes. Although there is
evidence that these inputs have increased some- what within specialties, the most significant changes seem to have taken place as the specialty mix of physicians has shifted. The change in real inputs in the aggregate may therefore be more a function of changes in specialty mix than in the varying quantities of inputs within individual physician practices.
The variable employed in this model as a meas- ure of real labor and nonlabor inputs is the annual change in gross income per physician visit, deflated by the factor-price index and by a specialist index.
Quantity of care .-Physician visits per capita -including hospital, home, and office visits- are used to measure utilization. Like patient days, per capita visits are the outcome of both supply and demand factors. The number of physicians in relation to population has continued to rise, although not all of this increasing number pro- vide patient care .I0 The addition of practicing physicians will almost certainly increase the aggregate number of visits, and at least one study has pointed to the central importance of the physician supply in determining expendi- tures.l’
Utilization will not necessarily increase in proportion to the changing phj&ian supply, however. The volume of visits will be affected by such supply factors as specialty mix and geographic distribution of the physician popula- tion and such demand factors as morbidity rates and insurance coverage. Any residual effects of time are captured by the time variable inserted in the second regression equation. The input data are presented in tables 4 and 5.
Impact of Sources of Increase
All variables in the two equations were again entered as first differences or percentage changes. Ordinary least squares were again used to esti-
“U.S. Public Health Service, National Center for Health Statistics, Health Resources Btatkdc8, 1974.
“Victor R. Fuchs and Marcia J. Kramer. Delertd- nants of Empenditures for Phyetcians’ Bervdes in the United State.% 19@-68, U.S. Public Health Service, Na- tional Center for Health Services Research and Develop ment, December 1972.
RUURTIN, NOVEMBER 1975 11
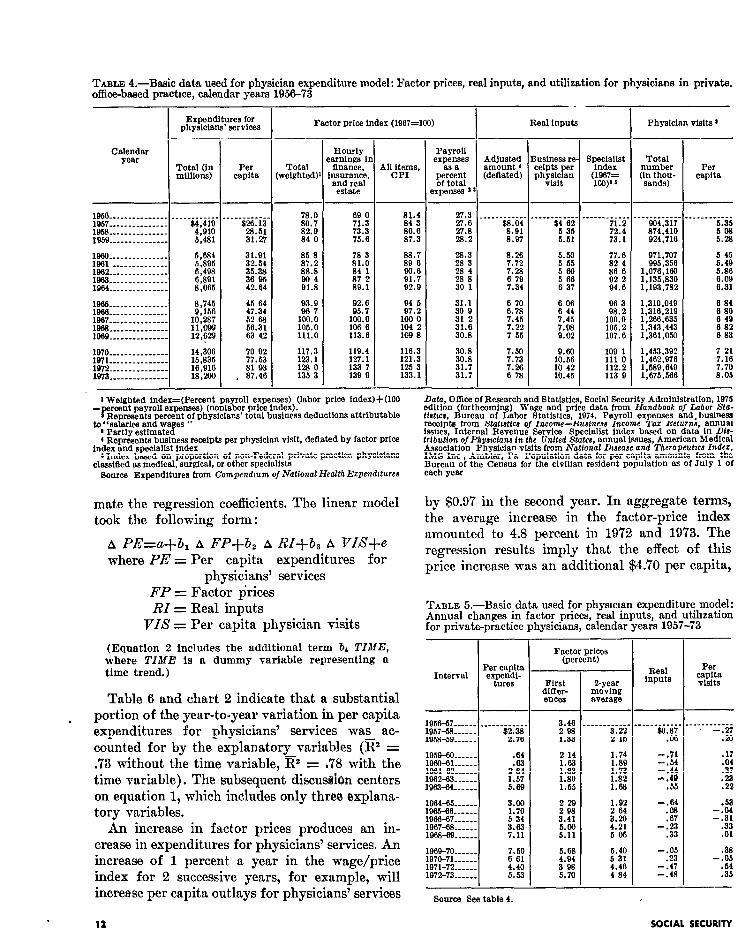
TABLE 4.-B&c data used for physician expenditure model: Factor prices, real inputs, and utilization for physicians in private. office-baaed practice, calendar years 1956-73 -
I .-
Real Inputs Physician visits 1 I Expenditures for physicians’ services Factor price index (1967=100)
-- Calendar
year
-
e
1 I
--
-
--
(
_-
-
Hourly mrnings iI finance,
;murance, and real estate
Payroll expenses
as a
%%Z axpenses ’
usiness re :elpts per ?h;;;;F
Total numbtv (Fa;gy-
Per capita
Total weIghted)
Per capita
1056 __-_-_.________ 1957... _---___---_-
_.___ di?ie’
1956 __-____________ 4:910 1959.~..-.......-. 6.481
1880. --_-_______--- 1961 --__________-- Ei 1962 _--_ _ ________-- ~(498 1963 _-_______ _ ____- 6,891 19+34.-....... __--- 8,065
.___-----_. FE
31127
31.91
33%: 36'95 42.64
1965.--......-.... 8,745 45 84 1966 ---_-- _- _ _----- 9,156 47.34 1967 ________- __ _--- 10,287 52 68 1963 -__ - -- - _ _ - - - - - - 56.31 1969 _____-____-_--- xi ‘, 63 42
1970.-.-...-..-. 14,306 W/l___- __- - _ _ _ _- -- 15,835 1972~~. __ _ __ -- _ __ -- 16.916 1973.-. - _ _ - _ - _ _ _ - - - 18,206
:"7 ii 81'93
. 87.46
78.0 80.7 82.9 84 0
ii*; loo.0 105.0 111.0
117.3 123.1 123 0 135 3
113.6
:E 133'7 139 9
“8:*: 86.6 87.3
27.3
% 28:2
88.7
f&i 91:7 92.9
ii*"3
ii s" 30 1
94 5 97.2
loo 0 104 2 109 8
31.1 30 9
i: ii 30:s
116.3 30.8 121.3 30.8 125 3 31.7 133.1 31.7
.___------ 2%
8:Q7
8.26 7.72 7.28
;.z
6 70 6.78 7.45
E
5.50 5 55 560
: i;
lEl 10'42 10.45
.---- -___- 71.2 72.4 73.1
96 3 93.2
:iE 107k
109 1 1110 112.2 113 9
. - - _ _ _ _ _ _ -. 904.317
Bg:4p:::i
971.707 995,356
1,076,166 ; I ;;3" 3;;
1 ,
:3;;.","1;
1:266:635 1,343,443 1,361,050
; .g;*;;;
1:589:649 1,675,566
______----- %i 5.28
5 45
2:: 6:09 6.31
6 84 6 80 6 49 6 82 6 83
7 21
:*:i 8:05
1 Weighted index=(Perccnt payroll expenses) (labor price inder)+(lOO rcent payroll expenses) (nonlabor price Index).
i%iG~iKages ” rcent of physicians’ total business deductions attributable
* Partly estimated 4 Represents business receipts per physiclan visit, deflated by factor price
index and specialist index I Index based on proportion of non-Federal private-practice physicians
classiEied as medical, surgical, or other speelalists Source Expenditures from Compendtum of National HealthEzpcladtturee
Data, Office of Research and Statistics, Social Securit Administration, 1975 edltion (forthcoming) Wage and price data from d andbook of Labor SLa- tfshcs, Bureau of Labor Statistics, 1974. Payroll expenses and.business receipts from Statrattca of Income-Euaineas Income Taz Returna, annual issues, Internal Revenue Service Specialist index based on data In Dfa- trtbution o/Phyarclanr in the United Statea, annual issues, American Medical Association Physician visits from National Dteease and Therapeutxa Indez, IMS Inc , Ambler, Pa Population data for per capita amounts from the Bureau of the Census for the civilian resident population as of July 1 of each year
mate the regression coefficients. The linear model took the following form :
A P&‘=a+b, A FP+b, A RI+& A vI#+e where PE = Per capita expenditures for
physicians’ services FP = Factor p’rices RI = Real inputs
VI8 = Per capita physician visits
by $0.97 in the second year. In aggregate terms, the average increase in the factor-price index amounted to 4.8 percent in 1972 and 19’73. The regression results imply that the effect of this price increase was an additional $4.70 per capita,
TABLE 5.-Basic data used for physician expenditure model: Annual changes in factor prices, real inputs, and utihzation for private-practice physicians, calendar years 1957-73
(Equation 2 includes the additional term br TIME, where TIME is a dummy variable representing a time trend.) Interval
- I Per capita
Factor prices (percent)
- I
First dlffer-
O-year moving
ences average
Real inputs
Per capita visits
Table 6 and chart 2 indicate that a substantial
. portion of the year-to-year variation in per capita expenditures for physicians’ services was ac- counted for by the explanatory variables (@ = .73 without the time variable, @ = ,78 with the time variable). The subsequent discuseion centers on equation 1, which includes only three, explana- tory variables.
--I-
1958-59..-..
3.46 ___.-____-,
f.E E
-___------. ________-__ $6.87 -.27
.oB .%I
1959-60.-.-.. .64 1960-61...~.~ 1961-432..-- 2.: 1962+x3-..... 1.57 1963-64~..-.. 5.69
:ii 1:83 1.80 1.55
1.74 1.89 1.73 1.82 1.63
-.71
1::: -,49
.55
2: .37 .2z .22
An increase in factor prices produces an in- crease in expenditures for physicians’ services. An increase of 1 percent a year in the wage/price index for 2 successive years, for example, will increase per capita outlays for physicians’ services
1964-65.-e.. 3.00 1%X-66...... 1.70 19+36~7--.. 5 34 1967-88.-m.. 3.63 1968-69...... 7.11
229 2 98 3.41
2:
1.92 2 64
i:g
-1% .67
-2:
196~70.~.... 7.50 197c-7L..... 6 61 1971-72...... 4.40 1972-73--s.. 5.53
5.68 4.94
St
5.40 5 31 4.46 4 84
-2: -.47 -.48
.38
-2: -35
Source See table 4.
12 SOCIAL SECURITY
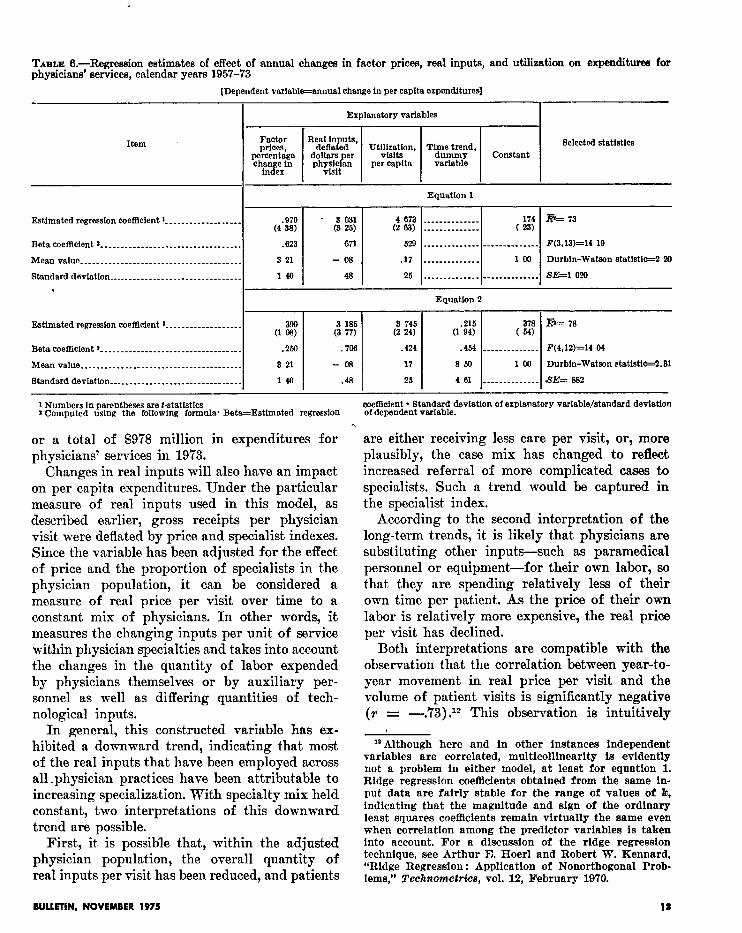
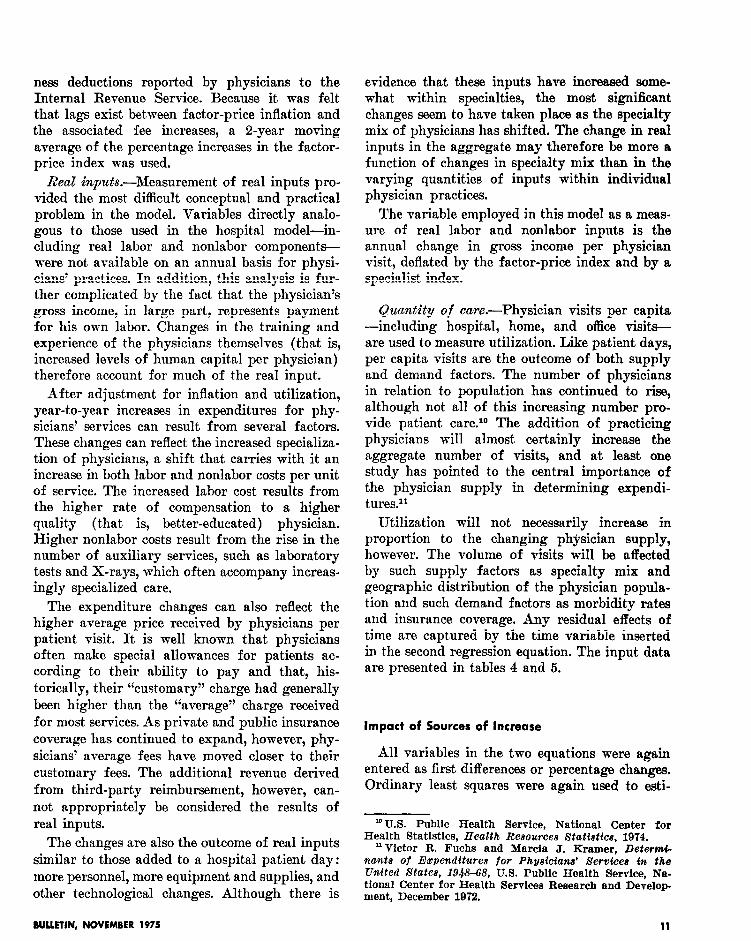
TILE &-Regression estimates of effect of annual changes in factor prices, real inputs, and utilization on expenditurea for physicians’ services, calendar years 1957-73
[Dependent variable=annual change in per capits expenditures]
Explanatory variables
Item - Factor priC.M,
R~;;;~dts, UtMz&on, TTne$;d, selected statistics
percentsge dollars per Constant change In per capita variable
index ph%P
Equation 1
Estimated regression coetlleient I--- ________________
Mean vslue.......-.......------~------------------
Standard deviation _____ _ ___________________________ .
F(3,13)=14 19
Durbin-Watson statistic=2 ‘20
SE=1020
Equation 2
Estimated regression coefficient 1___________________
Beta coefficient ‘-w-e _______________________________
Mesnvalue......._-.-...--------------------------
Standard deviation _____________________ _ ______ _____
1 Numbers in parentheses are t-statistics x Computed using the following formula. Beta=Estimated regression
we!Bcient * Standard deviation of explanatory variable/standard deviation of dependent variable.
1
or a total of $978 million in expenditures for physicians’ services in 1973.
Changes in real inputs will also have an impact on per capita expenditures. Under the particular measure of real inputs used in this model, as described earlier, gross receipts per physician visit were deflated by price and specialist indexes. Since the variable has been adjusted for the effect of price and the proportion of specialists in the physician population, it can be considered a measure of real price per visit over time to a constant mix of physicians. In other words, it measures the changing inputs per unit of service within physician specialties and takes into account the changes in the quantity of labor expended by physicians themselves or by auxiliary per- sonnel as well as differing quantities of tech- nological inputs.
are either receiving less care per visit, or, more plausibly, the case mix has changed to reflect increased referral of more complicated casas to specialists. Such a trend would be captured in the specialist index.
According to the second interpretation of the long-term trends, it is likely that physicians are substituting other inputs---such as paramedical personnel or equipment-for their own labor, so that, they are spending relatively less of their own time per patient. As the price of their own labor is relatively more expensive, the real price per visit has declined.
Both interpretations are compatible with the observat,ion that the correlation between year-to- year movement in real price per visit and the volume of patient visits is significantly negative (r = -.‘73) .I2 This observation is intuitively
In general, this constructed variable has ex- hibited a downward trend, indicating that most of the real inputs that have been employed across all ,physician practices have been attributable to increasing specialization. With specialty mix held constant, two interpretations of this downward trend are possible.
First, it is possible that, within the adjusted physician population, the overall quantity of real inputs per visit has been reduced, and patients
m Although here and in other instances independent variables are correlated, multicollinearity is evidently not a problem in either model, at least for equation 1. Ridge regression coefficients obtained from the same in- put data are fairly stable for the range of values of b, indicating that the magnitude and sign of the ordinary least squares coefficients remain virtually the same even when correlation among the predictor variables is taken into account. For a discussion of the ridge regression technique, see Arthur E. Hoer1 and Robert W. Kennard, “Ridge Regression : Application of Nonorthogonal Prob- lems,” TechnomeMce, vol. 12, February 1970.
BUUAIN, NOVEMBER 1975 111
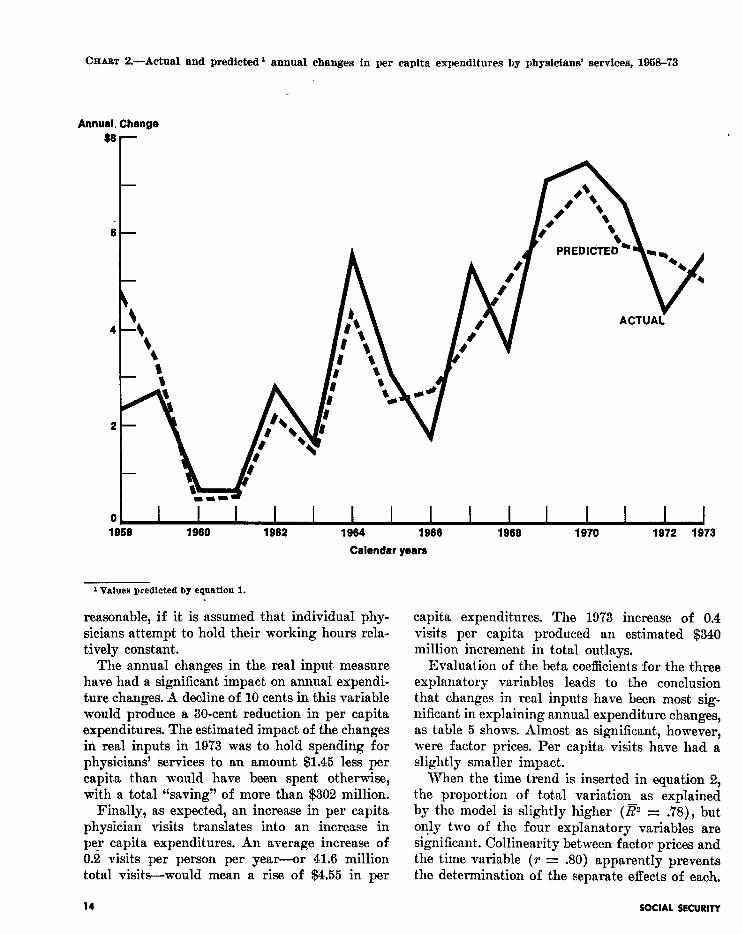
CHABT Z.-Actual and predicted 1 annual changes in per capita expenditures by physicians’ services, 1958-73
Annual, Change
1880 1982 1984 1988
Calendar years
1888 1970 1972 1873
1 Values predlcted by eqoatiou 1.
reasonable, if it is assumed that individual phy- capita expenditures. The 1973 increase of 0.4 sicians attempt to hold their working hours rela- visits per capita produced an estimated $340 tively constant. million increment in total outlays.
The annual changes in the real input measure have had a significant impact on annual expendi- ture changes. A decline of 10 cents in this variable would produce a 30-cent reduction in per capita expenditures. The estimated impact of the changes in real inputs in 1973 was to hold spending for physicians’ services to an amount $1.45 less per capita than would have been spent otherwise, with a total “saving” of more than $302 million.
Evaluation of the beta coefficients for the three explanatory variables leads to the conclusion that changes in real inputIs have been most sig- nificant in explaining annual expenditure changes, as table 5 shows. Almost as significant, however, were factor prices. Per capita visits have had a slightly smaller impact.
Finally, as expected, an increase in per capita physician visits translates into an increase in pe? capita expenditures. An average increase of 0.2 visits per person per year-or 41.6 million total visits-would mean a rise of $4.55 in per
When the time trend is inserted in equation 2, the proportion of total variation as explained by the model is slightly higher (Ez = .78), but only two of the four explanatory variables are significant. Collinearity between factor prices and the time variable (T = JO) apparently prevents the determination of the separate effects of each.
14 SOCIAL SECURITY
Since the original three variables are of more interest in explaining total variation, the first equation can be regarded as the most useful.
The results of the Durbin-Watson test for autocorrelation among the error terms indicates that the hypothesis of no autocorrelation can be accepted for equation 1. For equation 2, the hypothesis can be neither accepted nor rejected, but the value of the test statistic is again close to the acceptance range.
SUMMARY
The analyses for both types of expenditure emphasize the importance of real inputs in ex- plaining year-to-year variation in per capita spending. For hospital care, the effect of real nonlabor inputs has been pervasive, with about 77 percent of the change in annual per capita expenditure correlated with the change in real nonlabor inputs. For physicians’ services, real inputs are as important a contributor to changes in the annual per capita expenditures as are the changes in factor prices paid by physicians.
Labor and nonlabor factor prices are also im- portant in explaining annual expenditure changes. Through either cost-reimbursement or fee-setting mechanisms, increases in wages and prices will be passed on-immediately or eventually-not only to the consumers of medical care but to the popu- lation as a whole in the form of higher taxes and insurance premiums.
Finally, utilization was a significant contributor
to annual expenditure changes. Particularly for physicians’ services, however, its impact was somewhat smaller than that of factor prices and real inputs.
If explanatory variables analogous to those used in the hospital and physician expenditure models were available, they might help to explain some of the year-to-year changes in other insti- tutional and professional medical care services. The results given above, however, cannot reason- ably be extrapolated to other expenditure cate- gories not analyzed here. In addition, factors contributing to the increasing expenditures for medical supplies-drugs, eyeglasses, and appli- ances, for example-are likely to be very different from those affecting the service components. Al- though substantial sums are spent for all the major medical expenditure categories and more knowledge about each would be useful, hospital care and physicians’ services have been and will continue to be the chief focus of health economists.
The various problems encountered in construct- ing these models have underlined once again the need for further research in both areas. The pri- mary need, however, is for improved data collec- tion. The lack of reliable data-particularly on an annual basis-has severely hindered research into the economic behavior of health institutions and professionals. Although t.he availability of data has markedly improved in more recent years, still-existing gaps will continue to inhibit future research efforts and to hinder adequate under- standing of all aspects of our medical care de- livery system.
BULLETIN. NOVEMBER 1975 15