Embed Size (px)
Citation preview
SOCIAL PROTECTION POLICY PAPERS
Social protection for older persons: Key policy trends and statistics
Social Protection Department
International Labour Office
Copyright © International Labour Organization 2014
First published 2014
Publications of the International Labour Office enjoy copyright under Protocol 2 of the Universal Copyright
Convention. Nevertheless, short excerpts from them may be reproduced without authorization, on condition that
the source is indicated. For rights of reproduction or translation, application should be made to ILO Publications
(Rights and Permissions), International Labour Office, CH-1211 Geneva 22, Switzerland, or by email:
[email protected]. The International Labour Office welcomes such applications.
Libraries, institutions and other users registered with reproduction rights organizations may make copies in
accordance with the licences issued to them for this purpose. Visit www.ifrro.org to find the reproduction rights
organization in your country.
ILO Cataloguing in Publication Data Social protection for older persons : key policy trends and statistics / International Labour Office, Social Protection Department. - Geneva: ILO, 2014 (Social protection policy paper ; No. 11, ISSN: 1020-9581; 1020-959X (web pdf) ) ISBN: 9789221292012; 9789221292029 (web pdf) International Labour Office Social Protection Dept. social protection / older people / ageing population / pension scheme / social security reform / social assistance 02.03.1
The designations employed in ILO publications, which are in conformity with United Nations practice, and the
presentation of material therein do not imply the expression of any opinion whatsoever on the part of the
International Labour Office concerning the legal status of any country, area or territory or of its authorities, or
concerning the delimitation of its frontiers.
The responsibility for opinions expressed in signed articles, studies and other contributions rests solely with their
authors, and publication does not constitute an endorsement by the International Labour Office of the opinions
expressed in them.
Reference to names of firms and commercial products and processes does not imply their endorsement by the
International Labour Office, and any failure to mention a particular firm, commercial product or process is not a
sign of disapproval.
ILO publications and electronic products can be obtained through major booksellers or ILO local offices in many
countries, or direct from ILO Publications, International Labour Office, CH-1211 Geneva 22, Switzerland.
Catalogues or lists of new publications are available free of charge from the above address, or by email:
Visit our web site: www.ilo.org/publns
The editor of the series is the Director of the Social Protection Department, ILO. For more information on the
series, or to submit a paper, please contact:
Isabel Ortiz, Director Social Protection Department
International Labour Organization
4 Route des Morillons
CH-1211 Geneva 22 Switzerland
Tel. +41.22.799.6226 • Fax:+41.22.799.79.62
Printed in Switzerland
Social protection for older persons: Key policy trends and statistics iii
Abstract
This policy paper: (i) provides a global overview of the organization of pension
systems, their coverage and benefits, as well as public expenditures on social security, in
178 countries; (ii) analyses trends and recent policies, e.g. extension of coverage in a large
number of low- and middle-income countries; (iii) presents the negative impacts of fiscal
consolidation and adjustment measures in a number of higher-income economies; and (iv)
calls for the expansion of social protection in pursuit of crisis recovery, inclusive
development and social justice.
JEL Classification: H55, J26, J39
Keywords: social security and public pensions, retirement policies, public policy

Social protection for older persons: Key policy trends and statistics v
Table of contents
Page
Abstract ........................................................................................................................................... iii
Preface ............................................................................................................................................. ix
Acknowledgements ......................................................................................................................... xi
Executive Summary ........................................................................................................................ xiii
1. Social protection for older persons: Ensuring rights, dignity
and income security in later life ............................................................................................ 1
2. The crucial role of pensions in ensuring income security
and well-being of older persons ............................................................................................ 2
3. Extent of legal pension coverage .......................................................................................... 11
4. Extent of effective pension coverage .................................................................................... 13
4.1. Income security in old age: A right still unfulfilled for many .................................... 13
4.2. Changes in pension coverage across the world: Progress and regression ................... 16
4.3. Persistent inequalities in access to income security in old age ........................................ 19
5. The adequacy of pensions to provide genuine income security to older persons ................. 23
5.1. Guaranteeing income replacement .............................................................................. 23
5.2. Preventing erosion of the value of pensions over time:
Ensuring regular adjustments ...................................................................................... 25
6. Reforming and re-reforming pension systems ...................................................................... 29
7. Fiscal consolidation: implications for the social protection of older persons ....................... 32
8. Ensuring income security for older persons: The continuing challenge ............................... 37
Bibliography .................................................................................................................................... 41
Annexes
I. Minimum requirements in ILO Social Security Standards: Overview table ......................... 47
II. Statistical tables ..................................................................................................................... 50
vi Social protection for older persons: Key policy trends and statistics
List of tables
1. Indexation methods ............................................................................................................... 26
2. Main adjustment measures by region, 2010–13 .................................................................... 32
3. Selected fiscal consolidation measures recently adopted or under discussion
in high-income countries ....................................................................................................... 33
A.1. Main requirements: ILO social security standards on income security in old age ................ 48
A.2. Main requirements: ILO social security standards on survivors’ benefits ............................ 49
B.1. Ratification of ILO social security Conventions, by region .................................................. 50
B.2. Overview of national social security systems ....................................................................... 55
B.3. Old-age pensions: Key features of main social security programmes .................................. 69
B.4. Non-contributory pension schemes: Main features and indicators ....................................... 105
B.5. Old-age effective coverage: Active contributors................................................................... 111
B.6. Old-age effective coverage: Old-age pension beneficiaries. Proportion of older women
and men (above statutory pensionable age) receiving an old-age pension ........................... 117
B.7. Public social protection expenditure by guarantee, latest available year .............................. 125
List of figures
1. Sources of income of people aged 65 and over, OECD countries ........................................ 2
2. Correlation between greater public pension provision and lower poverty levels,
OECD countries .................................................................................................................... 3
3. Overview of old-age pension schemes anchored in national legislation,
by type of scheme, 2012/13 .................................................................................................. 5
4. Non-health public social expenditure on pensions and other benefits for older persons,
and share of older population (65 and above) in total population, 2010/11 .......................... 6
5. Non-health public social expenditure on pensions and other benefits for older persons,
2010/11 (percentage of GDP) ............................................................................................... 8
6. Long-term care expenditure as a proportion of GDP, 2010 and projections for 2060 .......... 10
7. Old-age pensions: Extent of legal coverage, by region, latest available year ....................... 11
8. Effective pension coverage ratios, by region, latest available year ....................................... 13
9. Old-age pension beneficiaries as a proportion of the population above statutory
pensionable age, latest available year ................................................................................... 15
10. Old-age pension beneficiaries as a proportion of the population above statutory
pensionable age, 2000 and 2010-12 ..................................................................................... 18
Social protection for older persons: Key policy trends and statistics vii
11. Changes in pension coverage across the world: Progress and regression ............................. 19
12. Proportions of women and men in employment contributing to a pension scheme
by area of residence ............................................................................................................... 20
13. Proportions of women and men above statutory pensionable age receiving an old-age
(or survivors’) pension, by area of residence ........................................................................ 20
14. Average replacement rates at retirement in public pension schemes in 2010
and projected for 2060, selected European countries ............................................................ 25
15. Minimum replacement rates necessary to guarantee pension income above
the poverty threshold ............................................................................................................. 25
16. Pensioners’ declining relative standard of living as a result of price indexation
or no indexation (compared to a standard of living with wage indexation = 100) ................ 27
17. The social and economic risks of fiscal consolidation .......................................................... 36
18. Positive impacts of the extension of social protection on inclusive growth ......................... 38
List of boxes
1. International standards on old-age pensions ......................................................................... 7
2. The crisis of the care economy: Risks associated with inattention to long-term
care needs in times of fiscal consolidation ............................................................................ 9
3. Extension of social protection of older persons in China...................................................... 14
4. Universal pension coverage in developing countries ............................................................ 16
5. Trends in replacement rates and adequacy of pension payments .......................................... 24
6. Re-reforms and «un-privatizations» of pension systems in Latin America
and Central and Eastern Europe ............................................................................................ 31
7. Using sovereign pension reserve funds to fund bailouts ....................................................... 34

Social protection for older persons: Key policy trends and statistics ix
Preface
Pensions are essential to ensuring rights, dignity and income security for older
persons. The right to income security in old age, as grounded in human rights instruments
and international labour standards, includes the right to an adequate pension. However,
nearly half of all people over pensionable age do not receive a pension. For many of those
who do receive a pension, pension levels are not adequate. As a result, the majority of the
world’s older women and men have no income security, have no right to retire and have to
continue working as long as they can – often badly paid and in precarious conditions.
In recent years, many middle- and low-income countries have made great efforts to
expand the coverage of contributory pension schemes and to establish non-contributory
pensions to guarantee basic income security in old age to all. At the same time, higher
income countries undertaking fiscal consolidation are reforming their pension systems for
cost savings, by means including raising the retirement age, reducing benefits and
increasing contribution rates. These adjustments are reducing state responsibility for
guaranteeing income security in old age and shifting large parts of the economic risks
associated with pension provision on to individuals, thereby undermining the adequacy of
pension systems and reducing their ability to prevent poverty in old age.
This policy paper is based on the research conducted for the ILO’s World Social
Protection Report 2014/15. It focuses specifically on pensions and other non-health
benefits for older persons. The important role of universal health protection, including for
older persons, is addressed in a separate policy paper in this series. This and the related
papers reflect the principles of ILO Social Protection Floors Recommendation, 2012 (No.
202) on the extension of social security, agreed by 185 countries and further endorsed by
G20 leaders and the United Nations.
The case for social protection is compelling in our times. Social protection is both a
human right and sound economic policy. Social protection powerfully contributes to
reducing poverty, exclusion, and inequality – while enhancing political stability and social
cohesion. Social protection also contributes to economic growth by supporting household
income and thus domestic consumption; this is particularly important during this time of
slow recovery and depressed global demand. Further, social protection enhances human
capital and productivity, so it has become a critical policy tool for transformative national
development. Social protection and specifically social protection floors are essential for
recovery, inclusive development and social justice, and therefore must be an integral part
of the post-2015 development agenda.
Isabel Ortiz
Director
ILO Social Protection Department

Social protection for older persons: Key policy trends and statistics xi
Acknowledgements
As a product of the research conducted for the ILO’s World Social Protection Report
2014/15, this policy paper was drafted by a team supervised by the Director of the ILO
Social Protection Department, Isabel Ortiz, consisting of Krzysztof Hagemejer, formerly
Chief of the Social Policy, Governance and Standards Branch; Anne Drouin, Chief of the
Public Finance, Actuarial and Statistics Services Branch; Florence Bonnet, Social Security
Statistics Coordinator; Christina Behrendt, Senior Social Protection Policy Specialist;
Emmanuelle St-Pierre Guilbault, Legal Specialist; Xenia Scheil-Adlung, Coordinator
Social Health Protection; and John Woodall, formerly Coordinator Pension Policy.
Substantial inputs to the report were received from Matthew Cummins, Social and
Economic Policy Specialist at the United Nations Children’s Fund (UNICEF), and several
colleagues in the ILO Social Protection Department, including James Canonge, Social
Protection Officer; Fabio Durán Valverde, Senior Specialist Social Security; Victoria
Giroud, Information Management Assistant; Aidi Hu, Coordinator Country Operations,
Asia; Cristina Lloret, Junior Social Security Actuary; Valérie Schmitt, Chief, Social
Policy, Governance and Standards Branch; Helmut Schwarzer, Senior Social Security
Specialist for the Americas and the Caribbean; Maya Stern-Plaza, Junior Legal Officer;
Victoire Umuhire, Junior Legal Officer; Veronika Wodsak, Technical Officer Social
Security; Hiroshi Yamabana, Social Security Actuary; and Katharina Diekmann, Zita
Herman, Vinu Parakkal Menon, Jahnavi Sen and Nicholas Teasdale-Boivin.
The report benefited from comments from colleagues in other ILO technical
departments and field offices, including Manuela Tomei, Director of the Conditions of
Work and Equality Department; Michelle Leighton, Chief of the Labour Migration
Branch; Philippe Marcadent, Chief of the Inclusive Labour Markets, Labour Relations and
Working Conditions Branch; Shauna Olney, Chief of the Gender, Equality and Diversity
Branch; Alice Ouedraogo, Chief of the HIV/AIDS and the World of Work Branch; Laura
Addati, Maternity Protection and Work–Family Specialist; Janine Berg, Senior
Development Economist; Fabio Bertranou, Senior Labour Market and Social Protection
Specialist, ILO Buenos Aires; Theopiste Butare, Senior Social Security Technical
Specialist, ILO Yaoundé; Pablo Casalí, Senior Social Security Specialist, ILO Lima; Luis
Casanova, National Officer, ILO Buenos Aires; Raphael Crowe, Senior Gender Specialist;
Adrienne Cruz, Senior Gender Specialist; Loveleen De, Social Security Consultant, ILO
Bangkok; Juan De Laiglesia, Economist and Labour Market Specialist; Maria Gallotti,
Specialist in Migration Policies; Youcef Ghellab, Head Social Dialogue and Tripartism
Unit; Frank Hoffer, Senior Research Officer, ILO Bureau for Workers’ Activities; Lee-
Nah Hsu, Technical Specialist on HIV/AIDS; Kroum Markov, Legal Specialist; Barbara
Murray, Senior Disability Specialist; Susan Maybud, Senior Gender Specialist; Seil Oh,
Social Security Officer, ILO Bangkok; Céline Peyron Bista, Chief Technical Adviser, ILO
Bangkok; Markus Ruck, Senior Social Security Specialist, ILO New Delhi; Catherine
Saget, Senior Economist; Francis Sanzouango, Employer Relations Specialist, Bureau for
Employers’ Activities; Sinta Satriana, Social Security Consultant, ILO Bangkok; Stefan
Trömel, Senior Disability Specialist; Catherine Vaillancourt-Laflamme, Chief Technical
Adviser, ILO Manila. Comments and guidance from the ILO’s Deputy Director-General
for Policy, Sandra Polaski, are especially appreciated.
The ILO is also grateful for the helpful comments received from other United Nations
organizations, including from Diana Barrowclough, Senior Economic Affairs Officer at the
United Nations Conference on Trade and Development (UNCTAD); Michael Clark,
Special Adviser on International Governance at the Food and Agriculture Organization
(FAO); Sarah Cook, Director of the United Nations Research Institute for Social
Development (UNRISD); Christian Courtis, Human Rights Officer at the Office of the UN
High Commissioner for Human Rights (OHCHR); Frédéric Dévé, Governance Adviser,
xii Social protection for older persons: Key policy trends and statistics
FAO; David Evans, Director of the Department of Health Systems Financing, World
Health Organization (WHO); Lynn Gentile, Human Rights Officer, OHCHR; Catalina
Gomez, Social Protection Consultant, UNICEF; Katja Hujo, Research Coordinator,
UNRISD; Alex Izurieta, Senior Economic Affairs Officer, UNCTAD; Gabriele Köhler,
formerly South Asia Regional Adviser on Social Policy, UNICEF; Hans-Horst
Konkolewsky, Secretary-General, International Social Security Association; Joseph
Kutzin, Coordinator, Health Financing Policy, WHO; Daniel Lopez Acuña, Adviser to the
Director General, WHO; Sheila Murthi, Social Protection Consultant, UNICEF; Krista
Orama, Focal Point for the Rights of Persons with Disabilities, OHCHR; Shahra Razavi,
Chief Research and Data Section, UNWOMEN; Stefania Tripodi, Human Rights Officer,
OHCHR; Jenn Yablonski, Social Protection Specialist, UNICEF; Ilcheong Yi, Research
Coordinator, UNRISD; Michael Cichon, former Director of the ILO Social Security
Department and now President of the International Council on Social Welfare; and for the
comments of three anonymous peer reviewers.
Social protection for older persons: Key policy trends and statistics xiii
Executive Summary
■ This policy paper: (i) provides a global overview of the organization of pension
systems, their coverage and benefits, as well as public expenditures on social security,
in 178 countries; (ii) analyses trends and recent policies, e.g. extension of coverage in
a large number of low- and middle-income countries; (iii) presents the negative
impacts of fiscal consolidation and adjustment measures in a number of higher-
income economies; and (iv) calls for the expansion of social protection in pursuit of
crisis recovery, inclusive development and social justice.
■ The right to income security in old age, as grounded in human rights instruments and
international labour standards, includes the right to an adequate social security
pension. In many countries with high shares of informal employment, pensions are
accessible only to a minority, and many older persons can rely only on family
support.
■ Nearly half (48 per cent) of all people over pensionable age do not receive a pension.
For many of those who do receive a pension, pension levels are not adequate. As a
result, the majority of the world’s older women and men have no income security,
have no right to retire and have to continue working as long as they can – often badly
paid and in precarious conditions. This gap will have to be filled to a large extent by
an expansion of non-contributory pensions («social pensions»).
■ Many countries have recently made efforts to expand the coverage of contributory
pension schemes and to establish non-contributory social pensions to guarantee at
least basic income security in old age to all. More than 45 countries have reached
90 per cent pension coverage and more than 20 developing countries have achieved or
nearly achieved universal pension coverage.
■ Public expenditures on pensions range from 0-2 per cent of GDP in low-income
countries, to 11 per cent of GDP in the higher-income Western Europe. As an
average, world countries spend 3.3 per cent on pensions for older persons.
■ As important as expanding pension coverage is guaranteeing adequate income
replacement. Adequacy of pensions is an issue worldwide. Pensioners in most
developing countries receive very low benefits. Preventing the erosion of the value of
pensions over time requires ensuring regular adjustments to account for the effects of
rising wages, inflation or other factors. Countries undertaking fiscal consolidation are
reforming their pension systems for cost savings, by means such as raising the
retirement age, reducing benefits, stopping indexation or increasing contribution
rates, among other measures. These adjustments are undermining the adequacy of
pension systems and reducing their ability to prevent poverty in old age. It is alarming
that future pensioners will receive lower pensions in at least 14 countries of Europe.
■ High-income countries have reduced a range of social protection benefits and limited
access to quality public services. Together with persistent unemployment, lower
wages and higher taxes, these measures have contributed to increases in poverty or
social exclusion, now affecting 123 million people in the European Union, or 24 per
cent of the population. Several European courts have found cuts unconstitutional. The
cost of adjustment has been passed on to populations. Depressed household income
levels are leading to lower domestic consumption and lower demand, slowing down
economic recovery. The achievements of the European social model, which
dramatically reduced poverty and promoted prosperity and social cohesion in the
period following the Second World War, have been eroded by short-term adjustment
reforms.
xiv Social protection for older persons: Key policy trends and statistics
■ A number of countries are reversing the earlier privatizations of pension systems
implemented in the 1980s and 1990s, such as Argentina, Bolivia, Chile, Hungary,
Kazakhstan and Poland. These systems were costly and unable to expand pension
coverage. These processes of «unprivatization» or renationalization of pensions aim
to reduce the fiscal costs of the earlier funded systems, to improve pension coverage
and old-age income security. The lack of access to social protection, including
pensions and other benefits for older persons, constitutes a major obstacle to
economic and social development. Inadequate or absent social protection coverage is
associated with high and persistent levels of poverty and economic insecurity,
growing levels of inequality, insufficient investments in human capital and human
capabilities, and weak aggregate demand in a time of recession and slow growth.
■ The strong positive impacts of social protection have brought the expansion of
old-age pensions to the forefront of the development agenda. Social protection is a
key element of national strategies to promote human development, political stability
and inclusive growth. Most middle-income countries are boldly expanding their social
protection systems, thereby contributing to their domestic demand-led growth
strategies: this presents a powerful development lesson. China, for instance, has
achieved nearly universal coverage of pensions and increased wages.
■ Ensuring rights, dignity and income security of older women and men depends also
on their access to social services, including health care and long-term care.

Social protection for older persons: Key policy trends and statistics 1
1. Social protection for older persons: Ensuring rights, dignity and income security in later life
Social protection plays a particularly important role in realizing the human right to
social security for older persons, in ensuring income security and access to essential
services including health and care services in a way that promotes their rights and dignity.
Reliable sources of income security play a particularly important role for older persons. As
people grow older, they can rely less and less on income from employment for a number of
reasons: while highly educated professionals may often continue well-remunerated
occupations until late in their life, the majority of the population is usually excluded from
access to well-paid jobs at older ages. Private savings and assets (including housing
ownership) make a difference, but for most people are usually not sufficient to guarantee
an adequate level of income security until the end of their lives. Private, intra-family
transfers may be important as an additional source of income security but are very often far
from sufficient and not always reliable, in particular for families already struggling to live
on a low income.
For all these reasons, in many countries public pension systems became a foundation
on which at least basic income security has been built. Income security in old age depends
also on the availability of and access to publicly provided social services – provided free or
at low cost – including health care and long-term care. If secure and affordable access to
such services is not provided, older persons and their families are often pushed into
poverty.
The important role of social protection for older persons is recognized in the Social
Protection Floors Recommendation (No. 202), which was adopted in 2012 by the
governments, employers and workers representatives of the ILO’s 185 member States, and
later endorsed by the G20 and the United Nations.The Recommendation provides guidance
to countries in setting nationally-defined social protection floors which guarantee at least a
basic level of social security for all (ILO, 2012). These basic guarantees include access to
essential health care and income security, both of which are key to a dignified and secure
life for older women and men.
2 Social protection for older persons: Key policy trends and statistics
2. The crucial role of pensions in ensuring income security and well-being of older persons
Public social security pensions have become important institutional solutions to
guarantee income security in old age. Public pensions may be supplemented in that task by
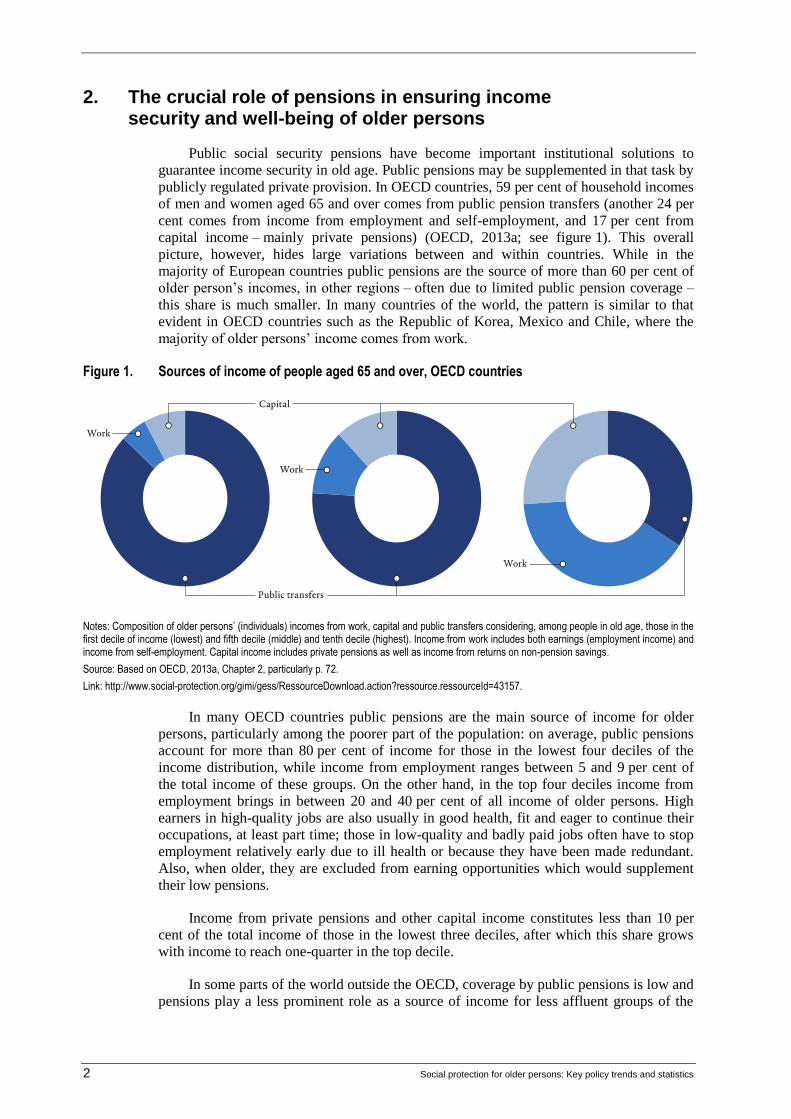
publicly regulated private provision. In OECD countries, 59 per cent of household incomes
of men and women aged 65 and over comes from public pension transfers (another 24 per
cent comes from income from employment and self-employment, and 17 per cent from
capital income – mainly private pensions) (OECD, 2013a; see figure 1). This overall
picture, however, hides large variations between and within countries. While in the
majority of European countries public pensions are the source of more than 60 per cent of
older person’s incomes, in other regions – often due to limited public pension coverage –
this share is much smaller. In many countries of the world, the pattern is similar to that
evident in OECD countries such as the Republic of Korea, Mexico and Chile, where the
majority of older persons’ income comes from work.
Figure 1. Sources of income of people aged 65 and over, OECD countries
Notes: Composition of older persons’ (individuals) incomes from work, capital and public transfers considering, among people in old age, those in the first decile of income (lowest) and fifth decile (middle) and tenth decile (highest). Income from work includes both earnings (employment income) and income from self-employment. Capital income includes private pensions as well as income from returns on non-pension savings.
Source: Based on OECD, 2013a, Chapter 2, particularly p. 72.
Link: http://www.social-protection.org/gimi/gess/RessourceDownload.action?ressource.ressourceId=43157.
In many OECD countries public pensions are the main source of income for older
persons, particularly among the poorer part of the population: on average, public pensions
account for more than 80 per cent of income for those in the lowest four deciles of the
income distribution, while income from employment ranges between 5 and 9 per cent of
the total income of these groups. On the other hand, in the top four deciles income from
employment brings in between 20 and 40 per cent of all income of older persons. High
earners in high-quality jobs are also usually in good health, fit and eager to continue their
occupations, at least part time; those in low-quality and badly paid jobs often have to stop
employment relatively early due to ill health or because they have been made redundant.
Also, when older, they are excluded from earning opportunities which would supplement
their low pensions.
Income from private pensions and other capital income constitutes less than 10 per
cent of the total income of those in the lowest three deciles, after which this share grows
with income to reach one-quarter in the top decile.
In some parts of the world outside the OECD, coverage by public pensions is low and
pensions play a less prominent role as a source of income for less affluent groups of the
Social protection for older persons: Key policy trends and statistics 3
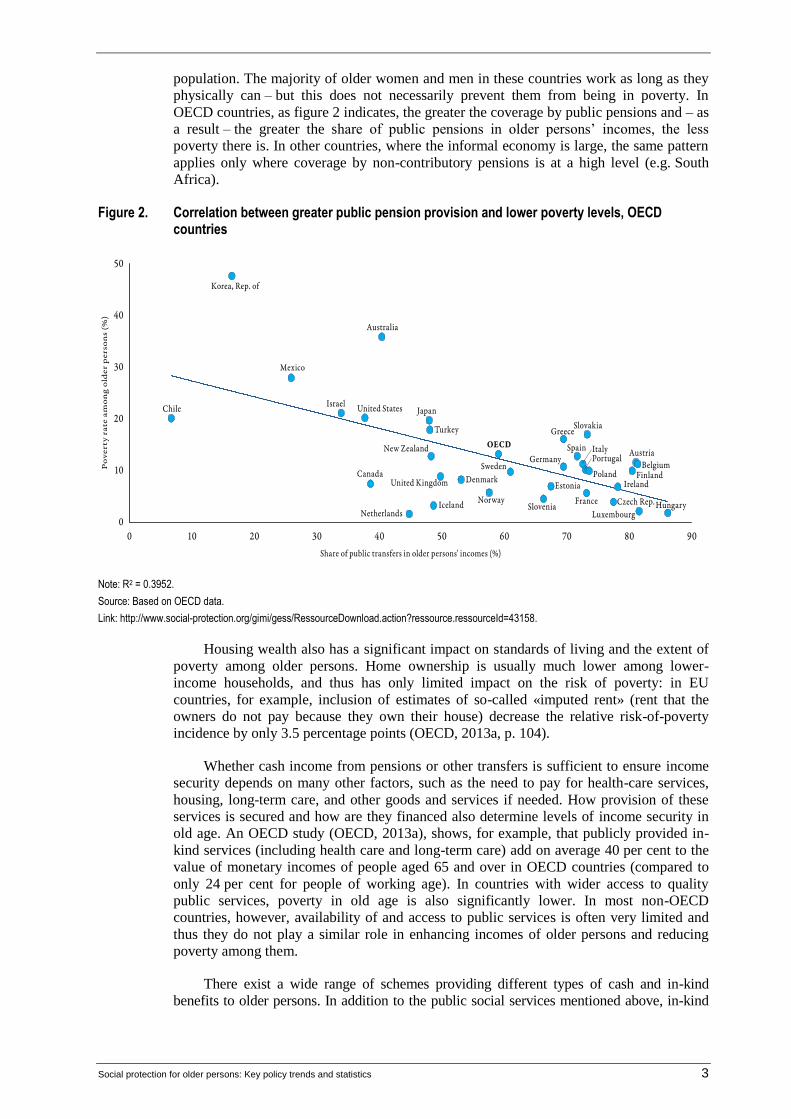
population. The majority of older women and men in these countries work as long as they
physically can – but this does not necessarily prevent them from being in poverty. In
OECD countries, as figure 2 indicates, the greater the coverage by public pensions and – as
a result – the greater the share of public pensions in older persons’ incomes, the less
poverty there is. In other countries, where the informal economy is large, the same pattern
applies only where coverage by non-contributory pensions is at a high level (e.g. South
Africa).
Figure 2. Correlation between greater public pension provision and lower poverty levels, OECD countries
Note: R2 = 0.3952.
Source: Based on OECD data.
Link: http://www.social-protection.org/gimi/gess/RessourceDownload.action?ressource.ressourceId=43158.
Housing wealth also has a significant impact on standards of living and the extent of
poverty among older persons. Home ownership is usually much lower among lower-
income households, and thus has only limited impact on the risk of poverty: in EU
countries, for example, inclusion of estimates of so-called «imputed rent» (rent that the
owners do not pay because they own their house) decrease the relative risk-ofpoverty
incidence by only 3.5 percentage points (OECD, 2013a, p. 104).
Whether cash income from pensions or other transfers is sufficient to ensure income
security depends on many other factors, such as the need to pay for health-care services,
housing, long-term care, and other goods and services if needed. How provision of these
services is secured and how are they financed also determine levels of income security in
old age. An OECD study (OECD, 2013a), shows, for example, that publicly provided in-
kind services (including health care and long-term care) add on average 40 per cent to the
value of monetary incomes of people aged 65 and over in OECD countries (compared to
only 24 per cent for people of working age). In countries with wider access to quality
public services, poverty in old age is also significantly lower. In most non-OECD
countries, however, availability of and access to public services is often very limited and
thus they do not play a similar role in enhancing incomes of older persons and reducing
poverty among them.
There exist a wide range of schemes providing different types of cash and in-kind
benefits to older persons. In addition to the public social services mentioned above, in-kind
4 Social protection for older persons: Key policy trends and statistics
benefits may include housing and energy subsidies, home help and care services, and
residential care.
Cash benefits can be periodic payments awarded upon reaching a specified age (and
also often meeting other prescribed entitlement conditions) which are then paid throughout
the remainder of the beneficiary’s life. Such periodic payments are called pensions (or life
annuities), and can be classified into two main types:
■ Old-age pensions from contributory schemes of mandatory public social insurance
and/or voluntary occupational or other private pension schemes.
■ Old-age pensions from public non-contributory schemes, which can be (a) universal,
covering all people above the eligible age who meet either a citizenship or minimum
duration of residency condition; (b) pension tested 1; or (c) means tested
2. Most non-
contributory schemes are national, but some are limited to certain geographical
areas 3.
Only pensions (that is, periodic payments including means-tested benefits) are
recognized by ILO standards such as Convention No. 102, or the Invalidity, Old-Age and
Survivors’ Benefits Convention, 1967 (No. 128), as benefits potentially able to protect
individuals properly against the risk of outliving their own savings or assets. However,
sometimes contributory pension schemes pay part of the benefit as a lump sum. In such
situations it is important to make sure that the annuity part of the overall benefit is
adequate. In many countries only a lump sum is available, or (as for example in Chile)
people can opt at retirement for so-called «scheduled withdrawal» (under which their
pensions are paid not as a life annuity but only for a limited number of years): such
arrangements do not guarantee the level of security required by international standards.
The benefit expenditure data presented in this policy paper attempt to cover, as far as
evidence is available, all types of benefits provided by mandatory or quasi-mandatory
(voluntary but with very wide coverage) schemes established by legislation, regulations or
collective agreements. The indicators for the scope and extent of coverage take into
account only coverage by any kind of cash periodic benefits (pensions); schemes providing
lump-sum payments alone do not qualify.
The broad majority of countries (166 out of 178 countries for which information is
available) provide pensions through at least one scheme, and often through a combination
of different types of contributory and non-contributory schemes (see figure 3). The
1 Non-contributory pensions of this type are provided to those older persons who do not receive a
contributory pension at all, or whose contributory pension is below a certain minimum threshold;
other types of incomes are not taken into account (as would be the case for means-tested pensions).
Examples of this type of scheme include the Old Age Social Pension in Armenia and similar
pensions in most CIS countries, as well as the “100 a los 70” scheme in Panama, the Old Age
Allowance in Nepal, and the Allowance for Older People in Thailand.
2 Means-tested pensions are provided only to those older persons whose pension and other income
remains below a certain threshold. Means-tested pensions are not, strictly speaking, life annuities.
However, if designed and implemented in a way which includes all in need and at a level “sufficient
to maintain the family of the beneficiary in health and decency”, such pensions comply with the
requirements of ILO standards. The Older Persons’ Grant in South Africa, for example, although
means-tested, effectively covers the majority of older people in the country and effectively prevents
the recipients and their families from falling into poverty.
3 For example, the Programa Colombia Mayor.

Social protection for older persons: Key policy trends and statistics 5
remaining 12 countries provide only lump-sum benefits through provident funds or similar
programmes.
Figure 3. Overview of old-age pension schemes anchored in national legislation, by type of scheme, 2012/13
Sources: Based on SSA and ISSA, 2012; 2013a; 2013b; 2014; European Commission, Mutual Information System on Social Protection (MISSOC).
Link: http://www.social-protection.org/gimi/gess/RessourceDownload.action?ressource.ressourceId=37157.
However, in 77 countries (over 43 per cent of the total number of countries but nearly
70 per cent of low-income countries) there exist schemes covering, on a contributory basis,
only employees in the formal economy and exceptionally also certain groups of self-
employed. In an equal number of countries, such employment-related contributory pension
schemes are complemented by non-contributory schemes, either aimed at all older persons
(27 countries) or at only those below a certain income threshold (50 countries). In only a
small number are pensions provided on a non-contributory basis to all older people (nine
countries) or to all those who pass a means test (three countries).
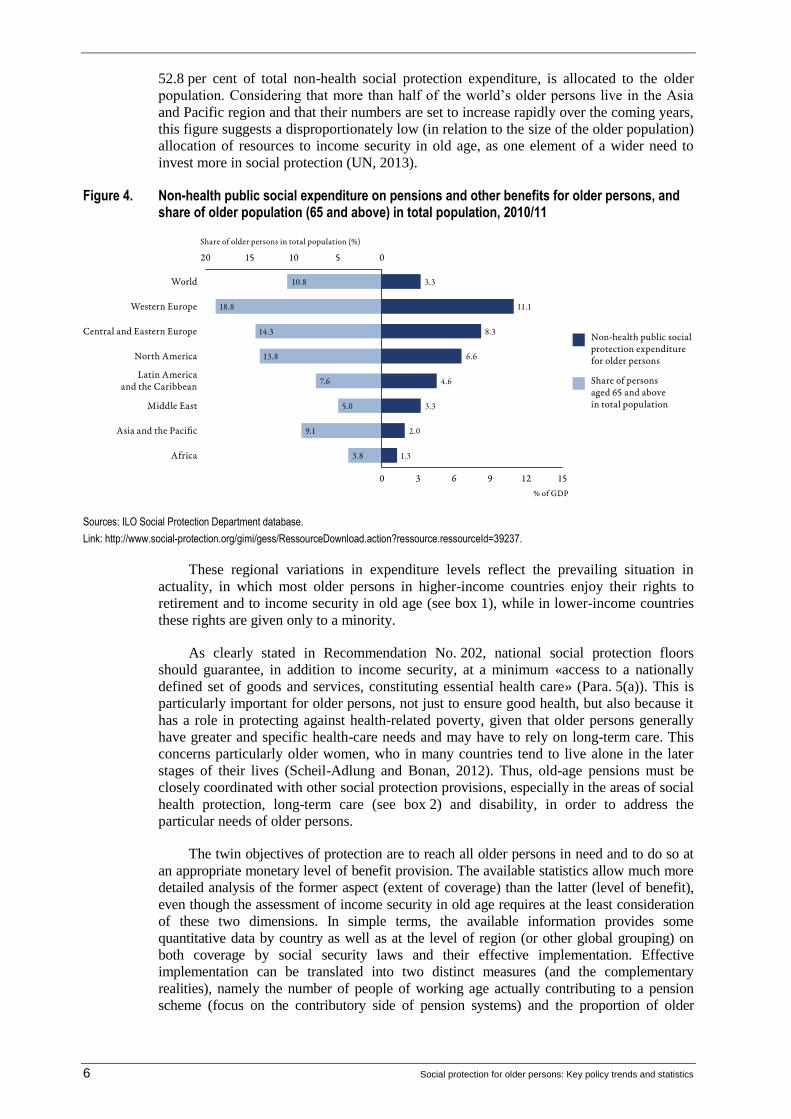
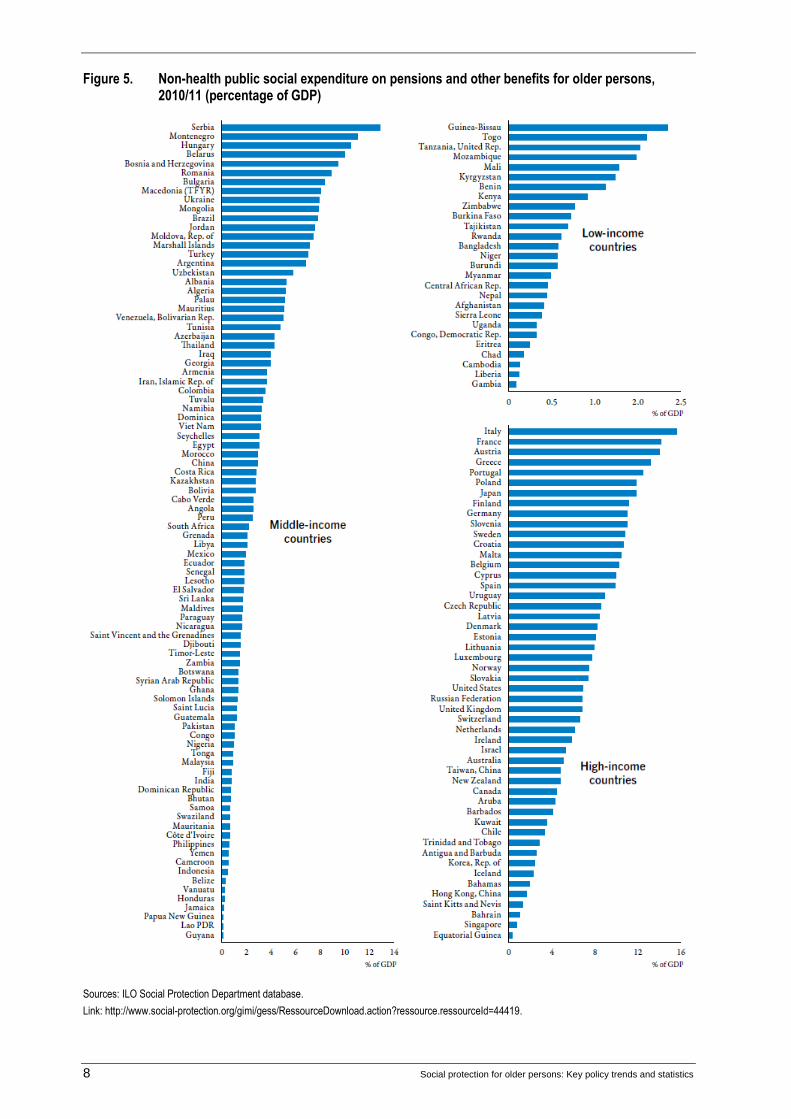
Globally, more than half of total public non-health social security expenditure,
amounting to 3.3 per cent of global GDP, is allocated to income security for older persons
(see figures 4 and 5) 4. Variations among regions are obviously influenced by differences
in the demographic structure of the population, but also by variations in the policy mix
between public and private provision for pensions and social services. Public non-health
social protection expenditure for older persons takes the highest proportion of GDP in
Western Europe, at 11.1 per cent, followed by 8.3 per cent of GDP in Central and Eastern
Europe and 6.6 per cent in North America, yet accounts for only 1.3 per cent of GDP in
Africa, where the share of older persons in the total population is significantly lower. In
Latin America and the Middle East, 4.6 per cent and 2.0 per cent of GDP respectively is
allocated to the income security needs of older persons, while in Asia and the Pacific,
where the share of the older population is significantly higher, only 2.0 per cent of GDP, or
4 While the data include not only pensions but, so far as possible, other cash and in-kind benefits for
older persons, they do not usually include expenditure on long-term care, the cost of which in many
countries is already significant and is likely to increase further in the future due to demographic
change.
6 Social protection for older persons: Key policy trends and statistics
52.8 per cent of total non-health social protection expenditure, is allocated to the older
population. Considering that more than half of the world’s older persons live in the Asia
and Pacific region and that their numbers are set to increase rapidly over the coming years,
this figure suggests a disproportionately low (in relation to the size of the older population)
allocation of resources to income security in old age, as one element of a wider need to
invest more in social protection (UN, 2013).
Figure 4. Non-health public social expenditure on pensions and other benefits for older persons, and share of older population (65 and above) in total population, 2010/11
Sources: ILO Social Protection Department database.
Link: http://www.social-protection.org/gimi/gess/RessourceDownload.action?ressource.ressourceId=39237.
These regional variations in expenditure levels reflect the prevailing situation in
actuality, in which most older persons in higher-income countries enjoy their rights to
retirement and to income security in old age (see box 1), while in lower-income countries
these rights are given only to a minority.
As clearly stated in Recommendation No. 202, national social protection floors
should guarantee, in addition to income security, at a minimum «access to a nationally
defined set of goods and services, constituting essential health care» (Para. 5(a)). This is
particularly important for older persons, not just to ensure good health, but also because it
has a role in protecting against health-related poverty, given that older persons generally
have greater and specific health-care needs and may have to rely on long-term care. This
concerns particularly older women, who in many countries tend to live alone in the later
stages of their lives (Scheil-Adlung and Bonan, 2012). Thus, old-age pensions must be
closely coordinated with other social protection provisions, especially in the areas of social
health protection, long-term care (see box 2) and disability, in order to address the
particular needs of older persons.
The twin objectives of protection are to reach all older persons in need and to do so at
an appropriate monetary level of benefit provision. The available statistics allow much more
detailed analysis of the former aspect (extent of coverage) than the latter (level of benefit),
even though the assessment of income security in old age requires at the least consideration
of these two dimensions. In simple terms, the available information provides some
quantitative data by country as well as at the level of region (or other global grouping) on
both coverage by social security laws and their effective implementation. Effective
implementation can be translated into two distinct measures (and the complementary
realities), namely the number of people of working age actually contributing to a pension
scheme (focus on the contributory side of pension systems) and the proportion of older
Social protection for older persons: Key policy trends and statistics 7
persons receiving a pension – either contributory or not – every month, or at least on a
regular basis.
Box 1
International standards on old-age pensions
The rights of older persons to social security and to an adequate standard of living to support their health and well-being, including medical care and necessary social services, are laid down in the major international human rights instruments, the Universal Declaration of Human Rights (UDHR), 1948, and (in more general terms) the International Covenant on Economic, Social and Cultural Rights (ICESCR), 1966.1 The content of these rights is further specified in the normative body of standards developed by the ILO, which provide concrete guidance to countries for giving effect to the right of older persons to social security, from basic levels to full realization.2
The Social Security (Minimum Standards) Convention, 1952 (No. 102), the Old-Age, Invalidity and Survivors’ Benefits Convention, 1967 (No. 128), and its accompanying Recommendation No. 131, and the Social Protection Floors Recommendation, 2012 (No. 202), provide an international reference framework setting out the range and levels of social security benefits that are necessary and adequate for ensuring income maintenance and income security, as well as access to health care, in old age. The extension of coverage to all older persons is an underlying objective of these standards, with the aim of achieving universality of protection, as explicitly stated in Recommendation No. 202.
Conventions Nos 102 and 128 and Recommendation No. 131 make provision for the payment of pensions in old age, at guaranteed levels, upon completion of a qualifying period, and their regular adjustment to maintain pensioners’ purchasing power. More particularly, Conventions Nos 102 and 128 envisage the provision of income security to people who have reached pensionable age through earnings-related contributory pensions (guaranteeing minimum benefit levels, or replacement rates, corresponding to a prescribed proportion of an individual’s past earnings – in particular to those with lower earnings) and/or by flat-rate non-contributory pensions which can be either universal or means-tested. The guaranteed minimum levels for the latter should be a prescribed proportion of the average earnings of a typical unskilled worker, but the «total of the benefit and other available means … shall be sufficient to maintain the family of the beneficiary in health and decency» (Convention No. 102, Art. 67(a)).
Recommendation No. 202 completes this framework by calling for the guarantee of basic income security to all persons in old age, prioritizing those in need and those not covered by existing arrangements. Such a guarantee would act as a safeguard against poverty, vulnerability and social exclusion in old age, for people not covered by contributory pension schemes. It is also of high relevance to pensioners whose benefits are affected by the financial losses suffered by pension funds, whose pensions are not regularly adjusted to changes in the costs of living, or whose pensions are simply inadequate to secure effective access to necessary goods and services and allow life in dignity. ILO social security standards thus provide a comprehensive set of references and a framework for the establishment, development and maintenance of old-age pension systems at national level.
An important social policy challenge facing ageing societies is to secure an adequate level of income for all people in old age without overstretching the capacities of younger generations. In view of the financing and sustainability challenge faced by social security systems in the context of demographic change, the State has a vital role to play in forecasting the long-term balance between resources and expenditure in order to guarantee that institutions will meet their obligations towards older persons. The principle in ILO social security standards, strongly reaffirmed recently by Recommendation No. 202, of the overall and primary responsibility of the State in this respect will undoubtedly play an important role in how future governments are held accountable for the sustainability of national social security systems in view of, among other factors, demographic change.
1 UDHR, Arts 22 and 25(1), and ICESCR, Art. 9. 2 See UN, 2008, 2012.
8 Social protection for older persons: Key policy trends and statistics
Figure 5. Non-health public social expenditure on pensions and other benefits for older persons, 2010/11 (percentage of GDP)
Sources: ILO Social Protection Department database.
Link: http://www.social-protection.org/gimi/gess/RessourceDownload.action?ressource.ressourceId=44419.

Social protection for older persons: Key policy trends and statistics 9
Box 2
The crisis of the care economy: Risks associated with inattention to long-term care needs in times of fiscal consolidation
The need for long-term care is constantly growing as numbers of older persons everywhere increase. Across the world, at present such care is predominantly provided by relatives, mainly women. However, such work is often not sufficiently valued and frequently unpaid, or not remunerated adequately. Over recent years the situation has become even worse, not only because of demographic ageing, leading to a growing number of older persons with chronic illnesses, but also because younger women are now more likely to participate in the labour market and thus less likely to be available for family care.
In the face of these changes in the health profile and lifestyle patterns of families, social protection provisions for long-term care are in many cases inadequate. However, the problem goes far beyond families and national policies; indeed, it amounts to a global crisis of the care economy. The lack of nurses and other care professionals to meet the growing need has resulted in an ever-increasing pull of labour from developing countries into developed countries. It is based on international «labour supply chains» involving mostly female migrant workers from poor families who provide care services to meet the physical and emotional needs of older persons. Often the wages, conditions of work and social security coverage of caregivers in recipient countries are insufficient, with a negative impact on the quality of care, resulting in discontent on the part of both caregivers and beneficiaries.
Debates are taking place in Thailand, Viet Nam and other countries on how to improve institutional and home care, often in the hope that volunteer caregivers and self-help groups can play a bigger role and that demands on public expenditure can be minimized by shifting the financial impact to the private sector (see e.g. HelpAge International, 2014). Similar approaches are being pursued in India and Singapore, and in China, where legislation has been implemented that imposes on adult children the responsibility to provide the care their parents need, under threat of jail or fines if they do not. In other regions of the world, such as Africa and Latin America, policies are also built on the assumption that private networks – communities or families – can shoulder the burden of care for older persons, sometimes overlooking limitations in the capacities of family carers (most of whom are women) and the impacts of such unpaid work on the quality of care, the income of care families, and the health and future employability of carers. The global inattention to the care needs of older persons reflects broader attitudes towards older persons and can also be observed in other social protection systems that should both prevent and meet long-term care needs. In health care, for example, the number of geriatricians is often insufficient to meet the need.
Only few countries have implemented specific schemes providing benefits for long-term care. Most of these are using tax-based financing, as is the case in Denmark, Norway and Sweden. Only a small number of countries, including Germany, Japan, the Netherlands and Taiwan (China), are using social insurance schemes to cover related costs. Given the complexity of both needs and the schemes in place, significant «long-term care literacy» is required from older persons when applying for the benefits they need. These benefits might be in cash – including those for financial support of family carers – or in kind, such as institutional care and home care. Eligibility criteria vary widely and are frequently means-, age- and needs-tested.
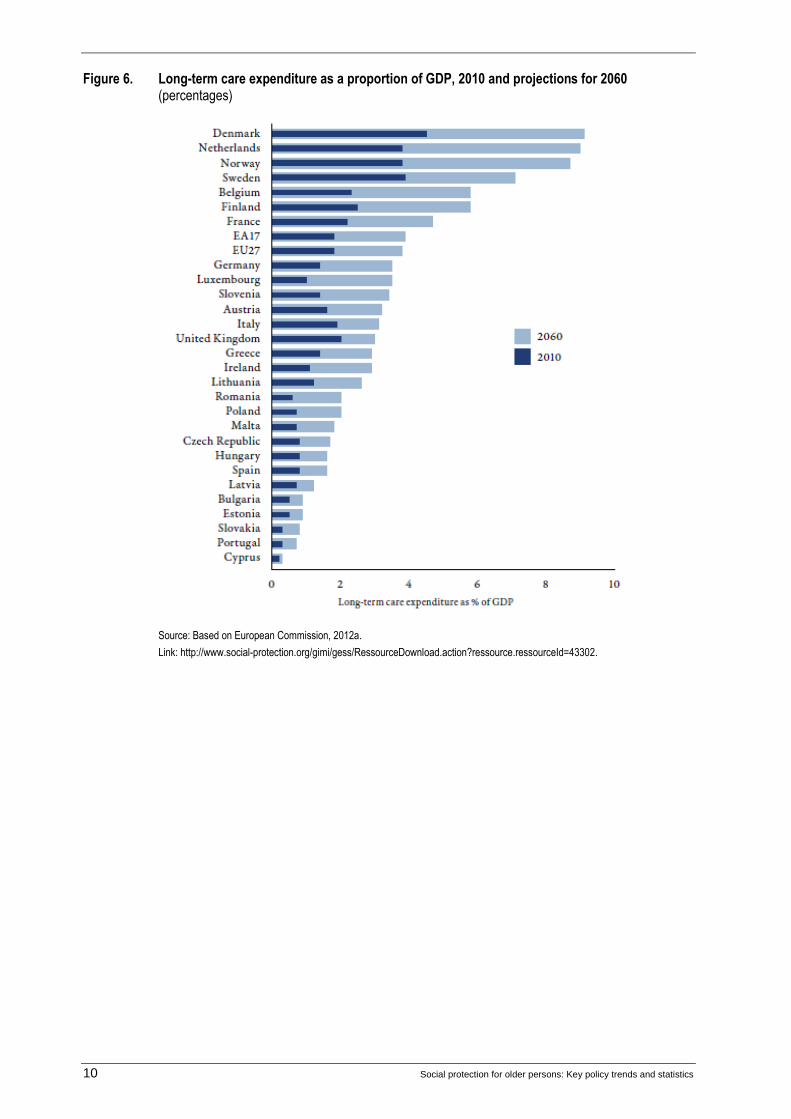
Generally, although public expenditure on long-term care remains very low compared to expenditure on health and old-age pensions, European Union projections – while admitting uncertainty regarding the magnitudes of fiscal consequences and considering a number of alternative scenarios – foresee at least a doubling of current expenditure levels by 2060 (figure 6).
Given the limited availability of public resources, all the existing schemes and systems are characterized by a strong reliance on co-payments from both public and private sources. As a result, out-of-pocket payments (OOP) for long-term care have a significant impact on the disposable income of older persons: recent ILO research (Scheil-Adlung and Bonan, 2012) has found that even in European countries OOP on long-term care amounts on average to 9.6 per cent of older persons’ household income and can be as much as 25 per cent. The poor, women and the very old are particularly affected. In fact, the very old, aged 80 and over, face OOP up to seven times as high as those of beneficiaries aged between 65 and 79 years. In this context, given the variable availability of carers and affordability of services, it should be noted that statistics on OOP include only those who have effective access to such services, and excludes those who are too poor to purchase such services or cannot obtain them due to the lack of care workers.
10 Social protection for older persons: Key policy trends and statistics
Figure 6. Long-term care expenditure as a proportion of GDP, 2010 and projections for 2060 (percentages)
Source: Based on European Commission, 2012a.
Link: http://www.social-protection.org/gimi/gess/RessourceDownload.action?ressource.ressourceId=43302.
Social protection for older persons: Key policy trends and statistics 11
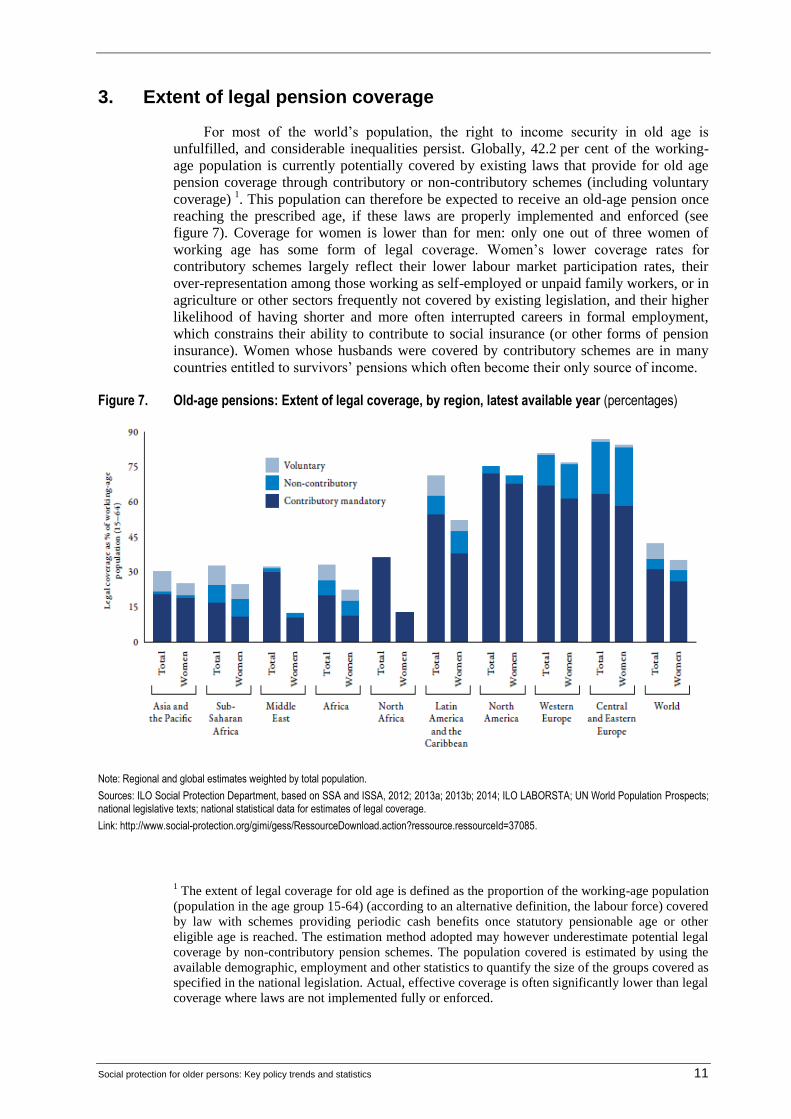
3. Extent of legal pension coverage
For most of the world’s population, the right to income security in old age is
unfulfilled, and considerable inequalities persist. Globally, 42.2 per cent of the working-
age population is currently potentially covered by existing laws that provide for old age
pension coverage through contributory or non-contributory schemes (including voluntary
coverage) 1. This population can therefore be expected to receive an old-age pension once
reaching the prescribed age, if these laws are properly implemented and enforced (see
figure 7). Coverage for women is lower than for men: only one out of three women of
working age has some form of legal coverage. Women’s lower coverage rates for
contributory schemes largely reflect their lower labour market participation rates, their
over-representation among those working as self-employed or unpaid family workers, or in
agriculture or other sectors frequently not covered by existing legislation, and their higher
likelihood of having shorter and more often interrupted careers in formal employment,
which constrains their ability to contribute to social insurance (or other forms of pension
insurance). Women whose husbands were covered by contributory schemes are in many
countries entitled to survivors’ pensions which often become their only source of income.
Figure 7. Old-age pensions: Extent of legal coverage, by region, latest available year (percentages)
Note: Regional and global estimates weighted by total population.
Sources: ILO Social Protection Department, based on SSA and ISSA, 2012; 2013a; 2013b; 2014; ILO LABORSTA; UN World Population Prospects; national legislative texts; national statistical data for estimates of legal coverage.
Link: http://www.social-protection.org/gimi/gess/RessourceDownload.action?ressource.ressourceId=37085.
1 The extent of legal coverage for old age is defined as the proportion of the working-age population
(population in the age group 15-64) (according to an alternative definition, the labour force) covered
by law with schemes providing periodic cash benefits once statutory pensionable age or other
eligible age is reached. The estimation method adopted may however underestimate potential legal
coverage by non-contributory pension schemes. The population covered is estimated by using the
available demographic, employment and other statistics to quantify the size of the groups covered as
specified in the national legislation. Actual, effective coverage is often significantly lower than legal
coverage where laws are not implemented fully or enforced.

12 Social protection for older persons: Key policy trends and statistics
Overall, levels of legal coverage (contributory and non-contributory schemes,
including voluntary coverage) range from about 30 per cent in Asia and the Pacific and
32.8 per cent in Africa – where informality and «unorganized sectors» predominate – to
76.4 per cent in North America and over 80 per cent in both Western and Central and
Eastern Europe.
Since voluntary coverage provided for in the legislation often does not result in actual
coverage for various reasons, a more conservative estimate considers only mandatory
coverage. Globally, 31.5 per cent of the working-age population is mandatorily covered by
law and may receive in future old-age pensions from contributory schemes. In addition,
about 4 per cent may become eligible to receive a non-contributory pension, taking into
consideration that this estimate may underestimate potential legal coverage by non-
contributory pension schemes. The corresponding rates of legal coverage for women are
lower (26.4 per cent being covered by mandatory contributory schemes, and an additional
5 per cent potentially covered by universal or pension-tested non-contributory schemes). In
addition, national laws may provide for voluntary coverage complementing the mandatory
provisions.
Social protection for older persons: Key policy trends and statistics 13
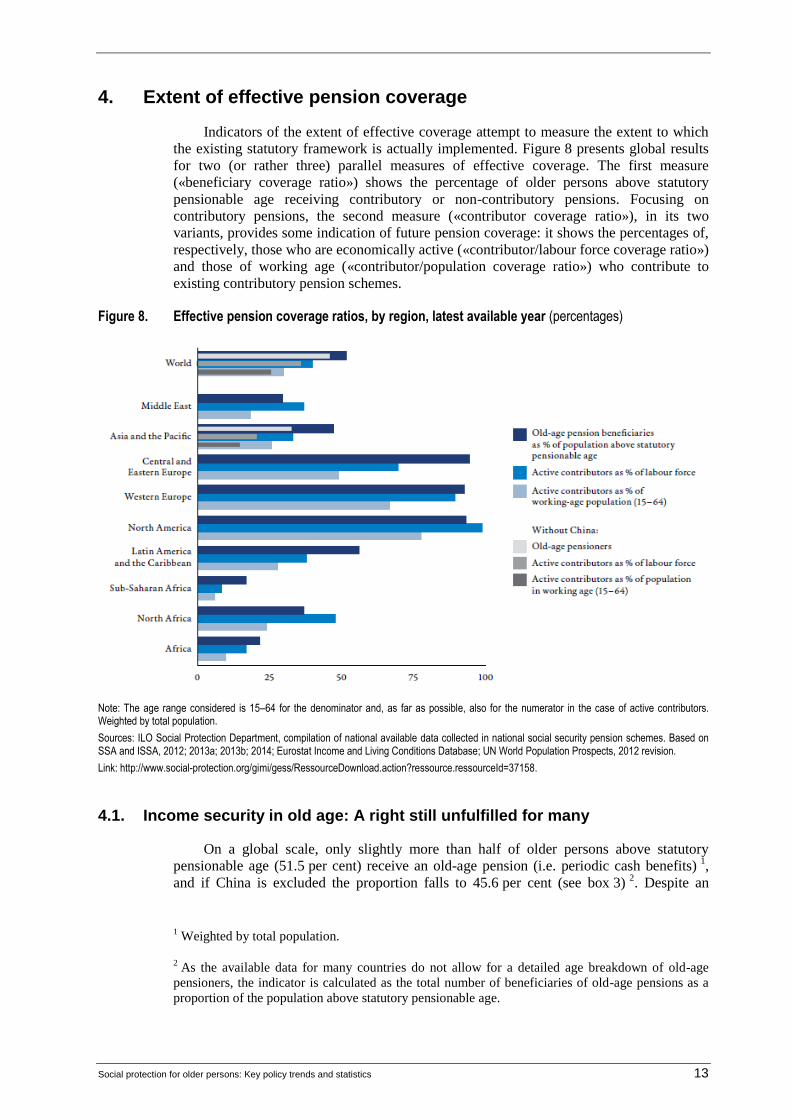
4. Extent of effective pension coverage
Indicators of the extent of effective coverage attempt to measure the extent to which
the existing statutory framework is actually implemented. Figure 8 presents global results
for two (or rather three) parallel measures of effective coverage. The first measure
(«beneficiary coverage ratio») shows the percentage of older persons above statutory
pensionable age receiving contributory or non-contributory pensions. Focusing on
contributory pensions, the second measure («contributor coverage ratio»), in its two
variants, provides some indication of future pension coverage: it shows the percentages of,
respectively, those who are economically active («contributor/labour force coverage ratio»)
and those of working age («contributor/population coverage ratio») who contribute to
existing contributory pension schemes.
Figure 8. Effective pension coverage ratios, by region, latest available year (percentages)
Note: The age range considered is 15–64 for the denominator and, as far as possible, also for the numerator in the case of active contributors. Weighted by total population.
Sources: ILO Social Protection Department, compilation of national available data collected in national social security pension schemes. Based on SSA and ISSA, 2012; 2013a; 2013b; 2014; Eurostat Income and Living Conditions Database; UN World Population Prospects, 2012 revision.
Link: http://www.social-protection.org/gimi/gess/RessourceDownload.action?ressource.ressourceId=37158.
4.1. Income security in old age: A right still unfulfilled for many
On a global scale, only slightly more than half of older persons above statutory
pensionable age (51.5 per cent) receive an old-age pension (i.e. periodic cash benefits) 1,
and if China is excluded the proportion falls to 45.6 per cent (see box 3) 2. Despite an
1 Weighted by total population.
2 As the available data for many countries do not allow for a detailed age breakdown of old-age
pensioners, the indicator is calculated as the total number of beneficiaries of old-age pensions as a
proportion of the population above statutory pensionable age.

14 Social protection for older persons: Key policy trends and statistics
impressive extension of pension coverage in many countries (see below), significant
inequalities persist. In sub-Saharan Africa, less than one in five older persons (16.9 per
cent) receives an old-age pension which would provide him or her with a certain level of
income security during old age. In the Middle East, 29.5 per cent of older persons receive a
pension; the figure is 36.7 per cent in North Africa, 47.0 per cent in Asia and the Pacific
(32.4 per cent excluding China), and 56.1 per cent in Latin America and the Caribbean.
Regional coverage ratios of more than 90 per cent of older persons are achieved only in
North America and Europe.
The contributor coverage ratio gives an indication of the proportion of the
population – or the labour force – which will have access to contributory pensions in the
future. Although this measure does not reflect access to non-contributory pensions, it still
gives an important signal regarding future levels of coverage, taking into account that
benefit levels in contributory pension schemes tend to be higher than those from non-
contributory pension schemes. At the global level, less than one-third of the working-age
population (30.9 per cent), just more than a quarter (25.4 per cent) excluding China, is
contributing to a pension scheme (see figure 8). Effective coverage ratios range from
5.9 per cent of the working-age population in sub-Saharan Africa to 77.5 per cent of the
working-age population in North America.
Box 3
Extension of social protection of older persons in China
Before 2009, only two institutional mechanisms for income security in old age existed in China: one for urban workers, based on social insurance principles, and one for civil servants and others of similar status, based on the employer’s liability approach. Together, they covered under 250 million people (including pensioners), about 23 per cent of the population aged 15 and above in 2008.
In 2009 and 2011, two new old-age pension schemes were introduced for the rural population and urban residents otherwise not covered respectively; participation in the schemes is voluntary. To encourage people to join, the Government employed a number of measures, including contribution subsidies and immediate pension payments to the elderly parents of adults registered with a rural pension scheme. Pensions consist of two components: a social pension paid by the Government, and an individual savings account pension financed jointly by contributions from the insured persons, collective entities (if any) and the Government. A minimum level is set for the social pension, which can be higher if local governments so wish and are able to fund it; this provision partially explains the differences in the levels of pension payments across different regions. For contributions to the individual savings account, a minimum level of subsidy from the Government is fixed, and personal contribution scales are established to allow each of the insured to choose the level of contribution he or she wants to make.
At the end of 2013, 850 million people, nearly 75 per cent of the population aged 15 and above, were covered under the four pension schemes, of which 498 million were covered under the two new schemes, accounting for 59 per cent of the total number covered.
Essential expansion has also been made within the pension system for urban workers, in particular to cover rural-to-urban migrant workers, the overall number of whom exceeded 260 million in 2012.
To consolidate the progress achieved so far and to address issues of adequacy, equality, portability and sustainability in a more coherent, effective and efficient manner, in 2013 China began the process of overhauling the entire old-age pension system, now comprising the four components outlined above. The first outcomes of this review include the policies announced in early 2014 on the merging of the two new pension schemes to equalize their rights and opportunities, the portability of pension entitlements between the merged scheme and others, and the conversion of employers’ liability for civil servants into a social insurance pension scheme.
Sources: Based on ISSA country reforms database and national sources; see also Ringen and Ngok, 2013.
Focusing on those persons who are economically active, 41.4 per cent of the global
labour force contribute to a pension insurance scheme, and can therefore expect to receive a
contributory pension upon retirement. Owing to the high proportion of informal employment
in sub-Saharan Africa, only 8.4 per cent of the labour force contributes to pension insurance
and earns rights to a contributory pension. In Asia and the Pacific, about one-third of the
labour force (34.0 per cent) contributes; coverage ratios are slightly higher in the Middle East

Social protection for older persons: Key policy trends and statistics 15
(37.1 per cent), Latin America and the Caribbean (38 per cent), and North Africa (47.4 per
cent). Western Europe and North America reach coverage rates of 89.2 and 98.5 per cent
respectively, followed by Central and Eastern Europe with 69.7 per cent of the labour force.
Figure 9. Old-age pension beneficiaries as a proportion of the population above statutory pensionable age, latest available year (percentages)
Sources: ILO Social Protection Department, compilation of national available data collected in national social security pension schemes. Based on SSA and ISSA, 2012; 2013a; 2013b; 2014; Eurostat, Income and Living Conditions Database; UN World Population Prospects, 2012 Revision. Link: http://www.social-protection.org/gimi/gess/RessourceDownload.action?ressource.ressourceId=44420.
16 Social protection for older persons: Key policy trends and statistics
In lower-income countries, usually only a very small proportion of those employed
are wage and salary earners with formal employment contracts, and are thus relatively
easily covered by contributory pensions. Informality, evasion and inadequate enforcement
of laws are also more prevalent in lower-income countries. That is why effective pension
coverage seems to be strongly associated with a country’s income level (see figure 9),
although it is in fact labour market structures and law enforcement and governance that
actually exert the crucial influence. While in high-income economies, 90.8 per cent of the
labour force contribute to a pension scheme, this is the case for only 50.7 per cent in upper-
middle-income economies, 15.2 per cent in lower-middle-income economies, and only
5.7 per cent in low-income economies. These low coverage ratios tend to be associated
with a low degree of formality in the labour market. Unless effective non-contributory
pensions are available, coverage gaps also show in the proportion of older persons
effectively benefiting from a pension: beneficiary coverage ratios range from 18.1 per cent
in low-income economies and 24.1 per cent in lower-middle-income economies to 71.0 per
cent in upper-middle-income economies and 89.1 per cent in high-income economies.
With efforts to extend contributory schemes to all with some contributory capacity,
and with the introduction of non-contributory pensions in a larger number of countries,
coverage has been extended significantly to workers in informal employment, providing at
least a minimum of income security in old age. These trends will be assessed in more detail
in the following section.
4.2. Changes in pension coverage across the world: Progress and regression
Although effective pension coverage ratios are still insufficient, significant progress
has been achieved in recent years. Whereas in 2000, only 34 countries reached high
coverage of more than 90 per cent of the population above statutory pensionable age, 45
countries fell into this category in 2010–12 (see figures 10 and 11). At the opposite end of
the scale, those countries where pension provision reaches less than 20 per cent of older
persons numbered 57, according to the more recent data, as compared with 73 countries in
2000. Overall, the data indicate visible improvement in coverage.
Box 4
Universal pension coverage in developing countries
Today, more than 20 developing countries have achieved or nearly achieved universal pension coverage, including Argentina, Belarus, Bolivia, Botswana, Cook Islands, Georgia, Guyana, Kazakhstan, Kiribati, Kyrgyz Republic, Kosovo, Lesotho, Maldives, Mauritius, Namibia, Mongolia, Panama, Seychelles, South Africa, St. Vincent and the Grenadines, Swaziland, Timor-Leste, Ukraine and Uzbekistan. Countries like Brazil and China have universal rural pensions. A few countries in Africa are currently piloting universal old-age social pensions, like Kenya, Uganda and Zambia.
There are many paths towards universal pension coverage. Most developing countries combine contributory systems with a minimum social pension to older persons without a contributory pension (e.g. Lesotho, Thailand), other countries provide a social pension to all (e.g. Botswana, Timor-Leste). Some countries choose gradual and progressive realization (e.g. Brazil, South Africa) and others opt for fast-tracking immediate universal coverage (e.g. Bolivia, China, Kiribati). There are different paths and heterogeneity in the design and implementation of universal schemes and governments have a wide set of options to achieve universal social protection coverage.
Social protection for older persons: Key policy trends and statistics 17
Many countries experienced a significant increase in coverage between 2000 and
2010. Bolivia increased the proportion of older persons receiving a pension from 80.7 to
90.5 per cent between 2000 and 2009, largely due to the reform of its Renta Dignidad
programme, which replaced the Bonosol scheme in 2008. Lesotho’s pension-tested old-age
pension scheme, launched in 2004, now ensures a pension for all people above the age of
70, a benefit available to only 8.4 per cent of older persons in 2000. Timor-Leste’s
universal Support Allowance for the Elderly, introduced in 2008, steeply increased
coverage rates from 0.5 per cent to 100 per cent of people aged 60 and older between 2000
and 2011. The introduction of the pension-tested Old Age Grant in Swaziland in 2005
expanded coverage among people aged 60 and older from 1.8 per cent in 2000 to 96.3 per
cent in 2010. By expanding the old-age allowance (introduced in 1993) to all those not in
receipt of other pensions in 2009, Thailand increased coverage ratios from 5 per cent in
2000 to 81.7 per cent of people aged 60 and above in 2011. By lowering the age threshold
of its Old Age Allowance (introduced in 1995) in 2008, Nepal increased its coverage ratio
from 33 per cent to 62.5 per cent of people aged 58 and over between 2000 and 2010.
China, after increasing potential future pension coverage from 24.4 per cent to 74.4 per
cent of the population over statutory pensionable age between 2000 and 2011, planned to
extend its pension system further towards universal coverage with the decision in 2012 to
expand the «new» rural pension scheme piloted in 2009 and the pilot social pension
insurance for urban residents launched in 2011 to all counties, aiming at nearly doubling
statutory pension insurance coverage by the end of 2015 (see box 3). Tunisia improved
pension coverage for the self-employed, domestic workers, farmers, fishers and other low-
income groups in 2002, helping to increase the proportion of pension beneficiaries among
people aged 60 and over from 33.9 per cent in 2000 to 68.8 per cent in 2006. In many
countries, the extension of coverage was made possible mainly through the establishment
or extension of non-contributory pension schemes which provide at least a basic level of
protection for many older persons, while others have combined the expansion of
contributory schemes to previously uncovered groups of the population with other
measures 3.
3 While the extension of coverage constitutes significant progress towards guaranteeing at least a
basic level of income security for older persons, a remaining challenge is ensuring the adequacy of
pension levels (see below).

18 Social protection for older persons: Key policy trends and statistics
Figure 10. Old-age pension beneficiaries as a proportion of the population above statutory pensionable age, 2000 and 2010-12 (percentages)
Note: Map (a) includes data for 2000 from 159 countries; map (b) includes data for 2010–12 from 175 countries.
Sources: ILO compilation of national available data collected in national social security pension schemes. Based on SSA and ISSA, 2012 2013a; 2013b; 2014; Income and Living Conditions Database; UN World Population Prospects, 2012 revision.
Links: 2000: http://www.social-protection.org/gimi/gess/RessourceDownload.action?ressource.ressourceId=42880; 2010–12: http://www.socialprotection.org/ gimi/gess/RessourceDownload.action?ressource.ressourceId=37159.

Social protection for older persons: Key policy trends and statistics 19
Figure 11. Changes in pension coverage across the world: Progress and regression
Sources: ILO Social Security Inquiry Database; Eurostat (based on national data sources). Link: http://www.social-protection.org/gimi/gess/RessourceDownload.action?ressource.ressourceId=42999.
The impressive extension of pension coverage in some parts of the world contrasts
with a contraction in others between 2000 and 2010 (see figure 11). The latter include
several countries, including Albania, Azerbaijan and Greece, which had previously
achieved coverage rates close to 90 per cent or higher in 2000, and which suffered a
significant decrease thereafter.
4.3. Persistent inequalities in access to income security in old age
Access to income security in old age is closely associated with existing inequalities in
the labour market and in employment. Such inequalities become evident from examination
of a disaggregation of coverage rates by gender and by area of residence (rural/urban),
which are the focus of this section (see figures 12 and 13) 4.
Older women tend to face higher risk of poverty than men. There are many
underlying reasons for this, not least the fact that the greater longevity of women results in
predominance at the oldest ages of women with poor levels of support and livelihood
(UNFPA and HelpAge International, 2012; UNRISD, 2010). This is because pension
systems in many countries fail to meet the needs of men and women equitably:
contributory pension coverage of women tends to be significantly lower than men’s, and
the amounts received by women on average tend to be lower (Razavi et al., 2012). While
these inequities may be partly due to the gender-biased design of pension schemes (e.g.
lower pensionable age for women, or the application of sex-specific mortality tables to
calculate benefit levels which result in women receiving lower pensions than men with the
same contribution record and retirement age), in many cases a more significant driver of
gender inequality is found in the interaction between the results of discrimination against
women in the labour market and the design of pension schemes, which does not
compensate for differences deriving from labour market conditions and sometimes even
magnifies them (Behrendt and Woodall, forthcoming). The fundamental problem is that for
many women it is not possible to accrue pension rights on an equal basis with their male
counterparts. Women’s share in wage employment, particularly in formal wage
4 As part of the research undertaken to prepare this policy paper, the Social Protection Department
of the ILO produced a separate study on social protection for rural women, which includes more
detailed discussion of their pension coverage and will be published separately.
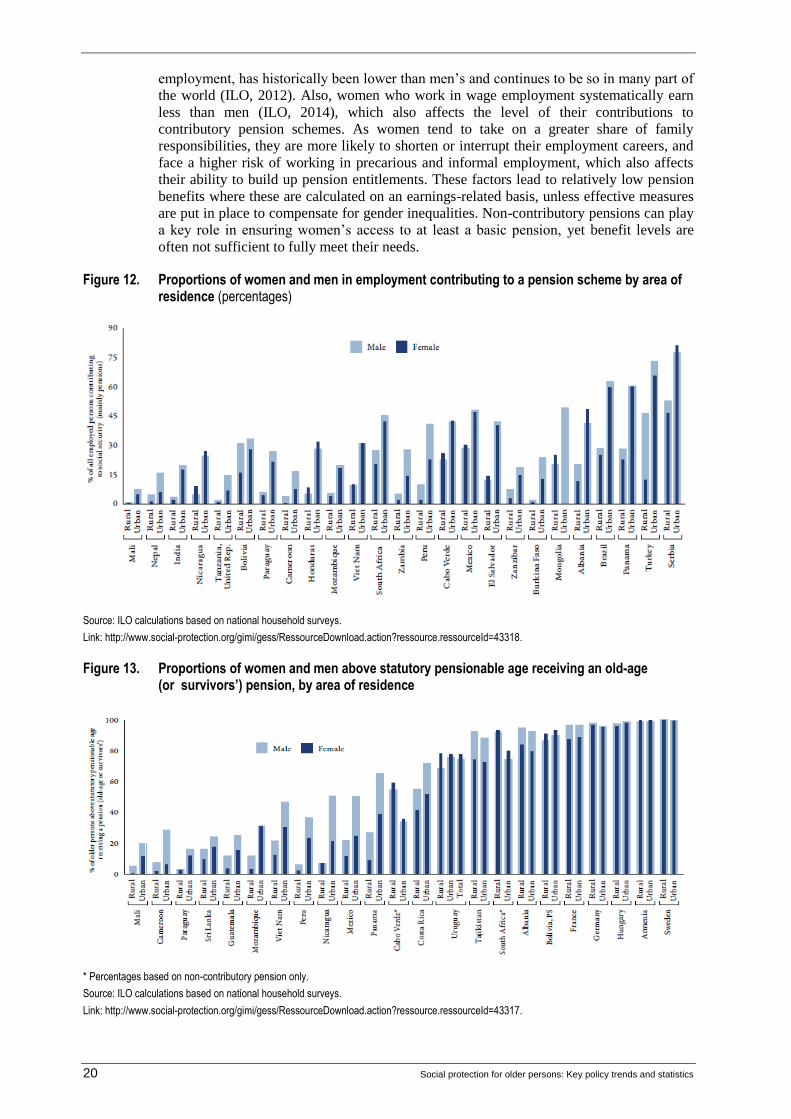
20 Social protection for older persons: Key policy trends and statistics
employment, has historically been lower than men’s and continues to be so in many part of
the world (ILO, 2012). Also, women who work in wage employment systematically earn
less than men (ILO, 2014), which also affects the level of their contributions to
contributory pension schemes. As women tend to take on a greater share of family
responsibilities, they are more likely to shorten or interrupt their employment careers, and
face a higher risk of working in precarious and informal employment, which also affects
their ability to build up pension entitlements. These factors lead to relatively low pension
benefits where these are calculated on an earnings-related basis, unless effective measures
are put in place to compensate for gender inequalities. Non-contributory pensions can play
a key role in ensuring women’s access to at least a basic pension, yet benefit levels are
often not sufficient to fully meet their needs.
Figure 12. Proportions of women and men in employment contributing to a pension scheme by area of residence (percentages)
Source: ILO calculations based on national household surveys.
Link: http://www.social-protection.org/gimi/gess/RessourceDownload.action?ressource.ressourceId=43318.
Figure 13. Proportions of women and men above statutory pensionable age receiving an old-age (or survivors’) pension, by area of residence
* Percentages based on non-contributory pension only.
Source: ILO calculations based on national household surveys.
Link: http://www.social-protection.org/gimi/gess/RessourceDownload.action?ressource.ressourceId=43317.
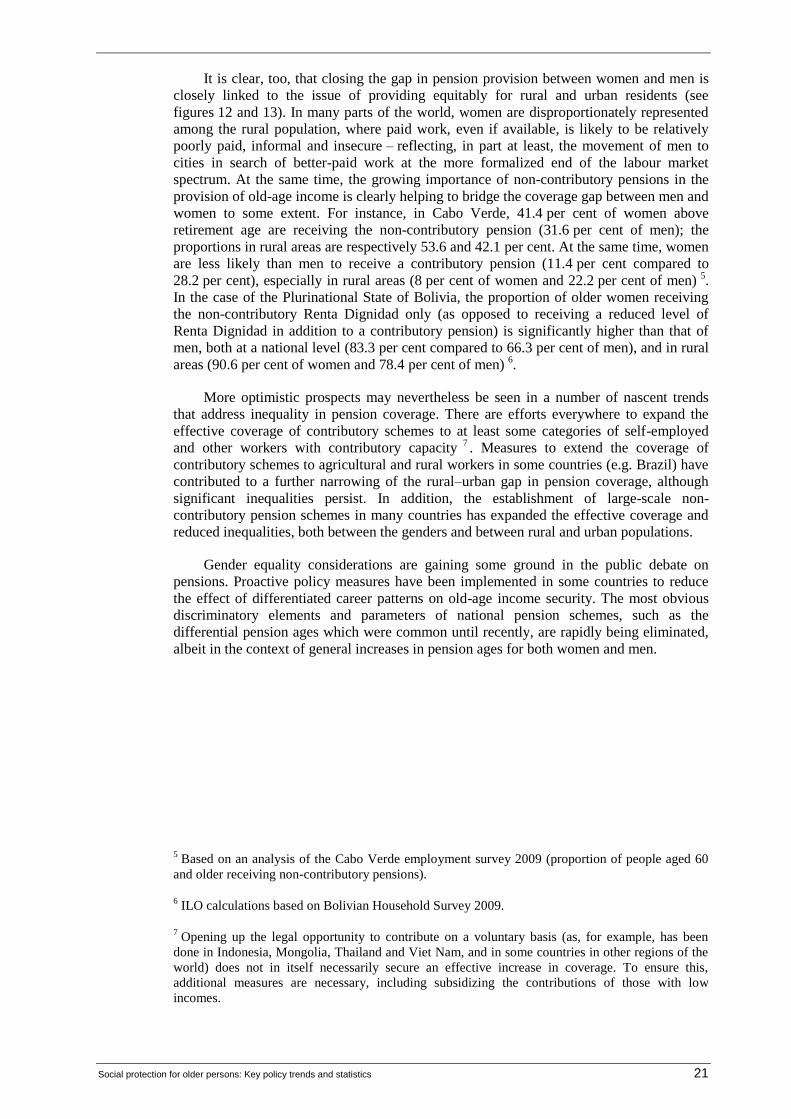
Social protection for older persons: Key policy trends and statistics 21
It is clear, too, that closing the gap in pension provision between women and men is
closely linked to the issue of providing equitably for rural and urban residents (see
figures 12 and 13). In many parts of the world, women are disproportionately represented
among the rural population, where paid work, even if available, is likely to be relatively
poorly paid, informal and insecure – reflecting, in part at least, the movement of men to
cities in search of better-paid work at the more formalized end of the labour market
spectrum. At the same time, the growing importance of non-contributory pensions in the
provision of old-age income is clearly helping to bridge the coverage gap between men and
women to some extent. For instance, in Cabo Verde, 41.4 per cent of women above
retirement age are receiving the non-contributory pension (31.6 per cent of men); the
proportions in rural areas are respectively 53.6 and 42.1 per cent. At the same time, women
are less likely than men to receive a contributory pension (11.4 per cent compared to
28.2 per cent), especially in rural areas (8 per cent of women and 22.2 per cent of men) 5.
In the case of the Plurinational State of Bolivia, the proportion of older women receiving
the non-contributory Renta Dignidad only (as opposed to receiving a reduced level of
Renta Dignidad in addition to a contributory pension) is significantly higher than that of
men, both at a national level (83.3 per cent compared to 66.3 per cent of men), and in rural
areas (90.6 per cent of women and 78.4 per cent of men) 6.
More optimistic prospects may nevertheless be seen in a number of nascent trends
that address inequality in pension coverage. There are efforts everywhere to expand the
effective coverage of contributory schemes to at least some categories of self-employed
and other workers with contributory capacity 7. Measures to extend the coverage of
contributory schemes to agricultural and rural workers in some countries (e.g. Brazil) have
contributed to a further narrowing of the rural–urban gap in pension coverage, although
significant inequalities persist. In addition, the establishment of large-scale non-
contributory pension schemes in many countries has expanded the effective coverage and
reduced inequalities, both between the genders and between rural and urban populations.
Gender equality considerations are gaining some ground in the public debate on
pensions. Proactive policy measures have been implemented in some countries to reduce
the effect of differentiated career patterns on old-age income security. The most obvious
discriminatory elements and parameters of national pension schemes, such as the
differential pension ages which were common until recently, are rapidly being eliminated,
albeit in the context of general increases in pension ages for both women and men.
5 Based on an analysis of the Cabo Verde employment survey 2009 (proportion of people aged 60
and older receiving non-contributory pensions).
6 ILO calculations based on Bolivian Household Survey 2009.
7 Opening up the legal opportunity to contribute on a voluntary basis (as, for example, has been
done in Indonesia, Mongolia, Thailand and Viet Nam, and in some countries in other regions of the
world) does not in itself necessarily secure an effective increase in coverage. To ensure this,
additional measures are necessary, including subsidizing the contributions of those with low
incomes.
22 Social protection for older persons: Key policy trends and statistics
Other steps in the same direction include crediting pension accounts during maternity,
paternity and parental leave, and a better recognition of care work undertaken by both
women and men. Measures to facilitate a more equal sharing of care responsibilities
between women and men contribute to addressing some of the inequalities in the labour
market and in social protection more broadly, and may be reflected in a reduction of
gender inequalities in labour markets and pension systems in the long run 8.
As with so many other aspects of social protection, those relating to the promotion of
equitable treatment of women and men must, if they are to be addressed effectively and in
a spirit of social justice, be dealt with on a basis which fully integrates labour market and
social protection policy-making.
8 For example, in the case of parental leave, measures to encourage a greater engagement of fathers
(e.g. in Sweden or Germany) in sharing care responsibilities can help to reduce discrimination
against women in the labour market, which may have a long-term effect on gender inequalities in
access to adequate pensions.

Social protection for older persons: Key policy trends and statistics 23
5. The adequacy of pensions to provide genuine income security to older persons
In any society, the kind of retirement provisions considered adequate depends on the
prevailing attitudes on matters such as the distribution of responsibility between
individuals and the State, redistribution and the support to be provided to the poor and
vulnerable, and intergenerational solidarity. The age at which retirement happens, the level
of income security that should be guaranteed and to whom, the degree of intergenerational
solidarity that should be expected in financing pensions – these are the issues that are
usually agreed as underpinning partially implicit and partially explicit social contracts.
These social contracts, and the attitudes behind them, evolve over time as social, cultural,
demographic and economic conditions change. They are also reflected in international
labour standards or human rights instruments.
5.1. Guaranteeing income replacement
Any attempt to make a comparative assessment of the performance of national
pension systems in meeting their relevant objectives today is beset by many complications.
The first is that it is very hard to find a comparable benchmark. One possible solution is to
compare the average level of pensions received to the average level of earnings in the
economy, as a national snapshot at a given point in time of the relative income situation of
pensioners compared to the situation of the employed population. Unfortunately, while the
data necessary for such a comparison are available and widely presented in various OECD
and EU reports, it is still practically impossible to replicate the exercise on a wider scale
for countries outside these groups, mainly due to lack of comparable earnings statistics as
well as the limited availability of the household survey data that would enable such
comparisons 1.
Such estimates of income replacement rates provided by pension schemes after
retirement are, however, important measures of the degree to which those schemes provide
adequate benefits for those covered by them (see box 5). Other indicators may relate
pension amounts to average household incomes, to GDP per capita or to poverty lines. The
problem is that, while they may be useful in analysing the adequacy of pension systems
within the respective countries, and in comparing the quality of coverage of different
groups provided by different schemes, they are not comparable between countries with
different extents and patterns of coverage. For this reason, and owing to the limitations
indata availability, this paper does not include global or regional estimates of the
replacement rates and other aspects of quality of pension coverage beyond the OECD 2.
1 Also, such an indicator has a very narrow interpretation in countries where wage earners in the
formal economy form only a minority of the population, and thus average wage levels have a very
weak relationship with the much lower average household income.
2 The OECD in collaboration with the World Bank has made some attempts to calculate
replacement indicators beyond EU and OECD countries, specifically regarding replacement rates
provided by pension systems in different countries for hypothetical individuals with different levels
of earnings and contributory past service (see Whitehouse, 2012); however, these are not yet
included in the World Bank Pension Database. HelpAge’s Global AgeWatch Index (HelpAge
International, 2013) looks at the overall income situation of older people, not specifically at the
levels of protection provided by existing pension systems. Within the AgeWatch Index, income
security of older persons is measured by three indicators: percentage of older persons receiving
24 Social protection for older persons: Key policy trends and statistics
Box 5
Trends in replacement rates and adequacy of pension payments
One of the great achievements of pension policies in many European countries and in some other parts of the world in the years following the Second World War was to dramatically reduce poverty in old age. However, recent developments in the labour market, as well as some policy reforms, increase the risk of a resurgence of old-age poverty.
While most countries protected the income of older persons relatively well during the recent crisis, there are exceptions. Countries that either continuously adjust pensions (including the lowest ones) at a significantly lower rate than the increase in wages or average incomes (e.g. Poland, where pensions are adjusted at only 20 per cent of real wage growth) or suspend pension adjustments (as Sweden did during the crisis as a result of its automatic balancing mechanism) experienced an increase in relative poverty of their older populations. Between 2005 and 2012, poverty rates among retired people increased from 10 to 18 per cent in Sweden and from 7 to 14 per cent in Poland.
This trend may spread in the future to other countries as well. Many pension reforms undertaken to stabilize future costs of pension systems will result in much lower benefits. Figure 14 presents changes in future replacement rates of public pension schemes in EU countries. In some countries the expected decrease in replacement rate is very significant. Simulations show future pensioners receiving lower pensions in at least 14 European countries, with a projected decline by more than 10 percentage points in eight countries (European Commission 2012a, 2012b). In addition, as many reforms removed redistributive mechanisms from contributory schemes, these lower replacement rates will apply also to those with low earnings throughout their working lives.
According to Eurostat, in 2010 17 per cent of employees in the EU (over 21 per cent of women and over 13 per cent of men) had earnings below the «low-earnings» threshold (defined as two-thirds of median earnings). The highest proportions of low-wage-earners were in Latvia (27.8 per cent), Lithuania (27.2 per cent), Romania (25.6 per cent), Poland (24.2 per cent) and Estonia (23.8 per cent), while the lowest were in Sweden (2.5 per cent, Finland (5.9 per cent), France (6.1 per cent), Belgium (6.4 per cent) and Denmark (7.7 per cent).1
What minimum replacement rates would guarantee those low-wage-earners a future pension income above the poverty line? As figure 15 shows, countries would need to provide replacement rates of between 50 and 90 per cent of previous earnings to prevent poverty in old age for those on low-incomes.
In what are often considered «old-fashioned» defined-benefit social security pension schemes, redistributive benefit formulas (usually with a flat rate component or equivalent) used to guarantee such higher replacement rates for low-wage-earners.
Today, many countries have removed those redistributive formulas when introducing either defined-contribution or notional defined contribution (NDC) components or converting defined-benefit schemes into purely earnings-related schemes. In this situation, securing a sufficient level of benefits for low-paid workers would require strengthening minimum benefit provisions, by means including various forms of non-contributory minimum income guarantees.
1 Calculations based on Eurostat Structure of Earnings Survey 2010.
pensions, relative poverty rates of the elderly, and relative income position of the elderly (average
incomes of those over 60 as a proportion of average incomes of the rest of the population).
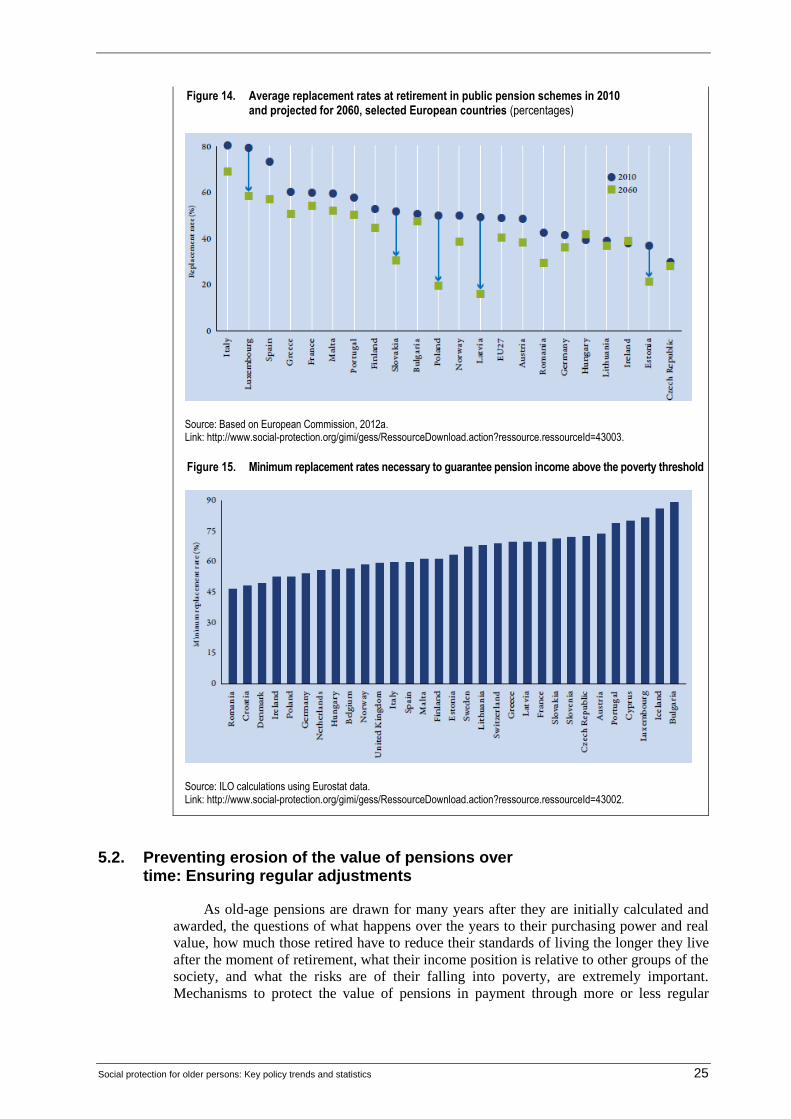
Social protection for older persons: Key policy trends and statistics 25
Figure 14. Average replacement rates at retirement in public pension schemes in 2010 and projected for 2060, selected European countries (percentages)
Source: Based on European Commission, 2012a. Link: http://www.social-protection.org/gimi/gess/RessourceDownload.action?ressource.ressourceId=43003.
Figure 15. Minimum replacement rates necessary to guarantee pension income above the poverty threshold
Source: ILO calculations using Eurostat data. Link: http://www.social-protection.org/gimi/gess/RessourceDownload.action?ressource.ressourceId=43002.
5.2. Preventing erosion of the value of pensions over time: Ensuring regular adjustments
As old-age pensions are drawn for many years after they are initially calculated and
awarded, the questions of what happens over the years to their purchasing power and real
value, how much those retired have to reduce their standards of living the longer they live
after the moment of retirement, what their income position is relative to other groups of the
society, and what the risks are of their falling into poverty, are extremely important.
Mechanisms to protect the value of pensions in payment through more or less regular

26 Social protection for older persons: Key policy trends and statistics
pension increases are sometimes referred to as «cost-of-living» adjustments or indexation,
and how this is done effects greatly the standard of living of long-term pensioners.
Conventions Nos 102 and 128 both call for levels of benefits in payment to be
reviewed following substantial changes in levels of earnings or of costs of living, while
Recommendation No. 131 explicitly stipulates that benefit levels should be periodically
adjusted taking into account changes in the general level of earnings or costs of living.
Recommendation No. 202 requires social protection floor guarantee levels to be reviewed
regularly through a transparent procedure that is established by national laws, regulations
or practice.
The practice of indexation varies across countries and schemes, as shown in table 1.
Table 1. Indexation methods
Indexation method Number of schemes
Price indexation 44
Wage indexation 27
Mixed price/wage 21
Regular, not specified 24
Ad hoc 4
No information 57
Total 177
Note: «No information» in most cases means «no indexation.
Source: ILO Social Protection Department, based on SSA and ISSA (2012, 2013a, 2013b, 2014).
While wage indexation was more popular in the past, nowadays more and more
schemes guarantee at the best only increases in line with cost of living increases. The
choice of an indexation method may appear to be a technical detail, but can have a
significant impact on the level of pensions, and as a consequence, expenditure on pensions.
Where wages increase faster than prices, the change from wage-based indexation to price-
based indexation offers significant reductions in pension expenditure, but also leads to the
decoupling of pensioners’ living standards from those of the working population. The
evolution of indexation in Hungary can be taken as an example of a more general trend: in
the 1990s indexation of pensions moved from wage indexation to a 50:50 mix of price and
wage indices, and recently during the crisis was shifted further to pure wage indexation.
Other countries have changed their indexation policy for pensions in payment in a less
generous direction: Finland (from 50:50 between earnings and prices to 80 per cent prices
and 20 per cent earnings), France (wages to prices), Poland (various changes, most
recently from 20:80 earnings: prices to 100 per cent prices) and Slovakia (100 per cent
wages to 50:50 wages and prices) (OECD, 2012, p. 58). Spain decided in 2013 to delink
pension adjustment from any standard of living indices and will not allow benefit
adjustments higher than 0.25 per cent per annum for a certain time.
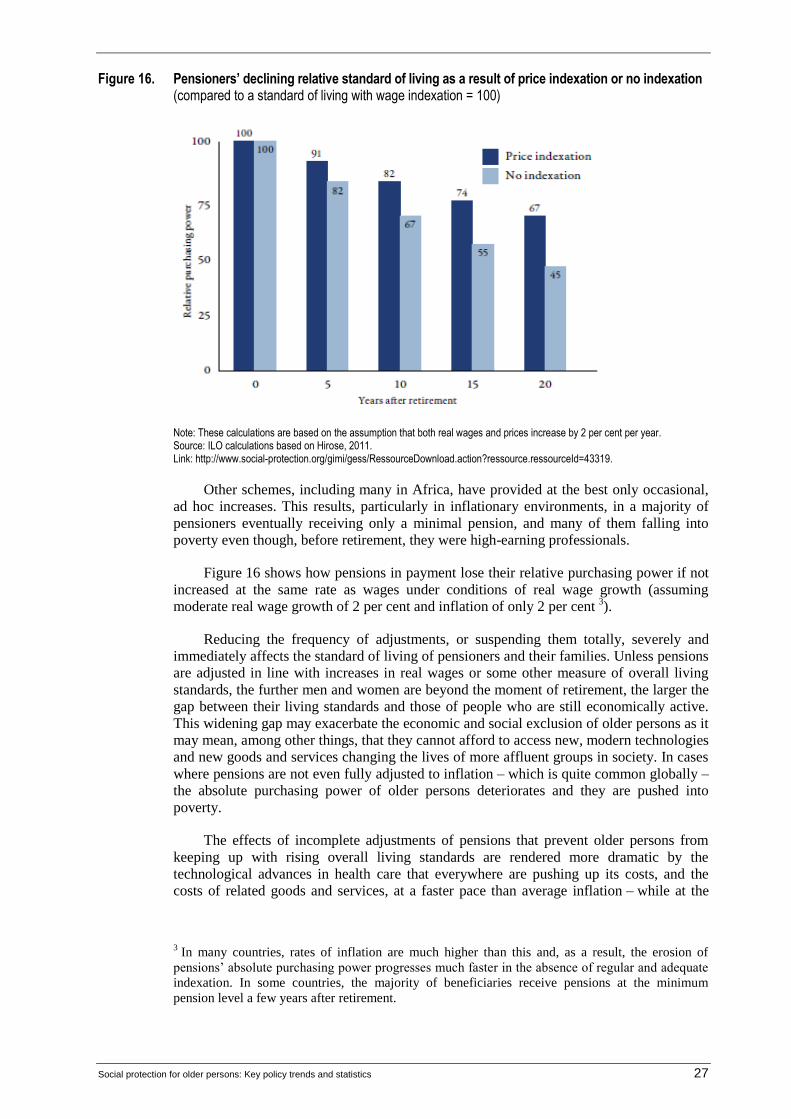
Social protection for older persons: Key policy trends and statistics 27
Figure 16. Pensioners’ declining relative standard of living as a result of price indexation or no indexation (compared to a standard of living with wage indexation = 100)
Note: These calculations are based on the assumption that both real wages and prices increase by 2 per cent per year. Source: ILO calculations based on Hirose, 2011. Link: http://www.social-protection.org/gimi/gess/RessourceDownload.action?ressource.ressourceId=43319.
Other schemes, including many in Africa, have provided at the best only occasional,
ad hoc increases. This results, particularly in inflationary environments, in a majority of
pensioners eventually receiving only a minimal pension, and many of them falling into
poverty even though, before retirement, they were high-earning professionals.
Figure 16 shows how pensions in payment lose their relative purchasing power if not
increased at the same rate as wages under conditions of real wage growth (assuming
moderate real wage growth of 2 per cent and inflation of only 2 per cent 3).
Reducing the frequency of adjustments, or suspending them totally, severely and
immediately affects the standard of living of pensioners and their families. Unless pensions
are adjusted in line with increases in real wages or some other measure of overall living
standards, the further men and women are beyond the moment of retirement, the larger the
gap between their living standards and those of people who are still economically active.
This widening gap may exacerbate the economic and social exclusion of older persons as it
may mean, among other things, that they cannot afford to access new, modern technologies
and new goods and services changing the lives of more affluent groups in society. In cases
where pensions are not even fully adjusted to inflation – which is quite common globally –
the absolute purchasing power of older persons deteriorates and they are pushed into
poverty.
The effects of incomplete adjustments of pensions that prevent older persons from
keeping up with rising overall living standards are rendered more dramatic by the
technological advances in health care that everywhere are pushing up its costs, and the
costs of related goods and services, at a faster pace than average inflation – while at the
3 In many countries, rates of inflation are much higher than this and, as a result, the erosion of
pensions’ absolute purchasing power progresses much faster in the absence of regular and adequate
indexation. In some countries, the majority of beneficiaries receive pensions at the minimum
pension level a few years after retirement.
28 Social protection for older persons: Key policy trends and statistics
same time, with increasing age the need for more (and more sophisticated) health care and
related services increases dramatically. As older persons in many countries have to pay a
substantial proportion of the costs of health care and other care services out of their own
pockets, many of them are at grave risk of either exclusion from access to the health care
they need or financial ruin for themselves and their families.
Nonetheless, as suspending or delaying indexation of benefits brings immediate and
significant reductions in public spending, in particular in demographically «old» countries
with matured pension systems and large numbers of pensioners, it is often seen and used
by governments as one of the instruments to contain public spending. The OECD noted
that «governments frequently override indexation rules … in a pro-cyclical way: pension
increases are larger than the rules require when the public finances are healthy while
increases are postponed or reduced in times of fiscal constraint» (OECD, 2012a,
pp. 59-60). Several countries (including Canada, Germany, Japan, Portugal and Sweden)
have explicitly linked indexation to certain indicators of sustainability. The problem is
that – as became clear during the recent economic and financial crisis – such mechanisms
may result even in absolute benefit cuts in times of crisis.
Social protection for older persons: Key policy trends and statistics 29
6. Reforming and re-reforming pension systems
ILO social security standards provide guidelines respecting different dimensions of
benefit adequacy (age of eligibility and other entitlement conditions, benefit levels and
protection of purchasing power) and at the same time require careful monitoring of the
long-term financial situation of pension schemes through actuarial valuations undertaken
both regularly and whenever any important parameters of the scheme change. Policy
decisions to adjust and reform schemes and systems are, however, left to governments and
their social partners.
Unfortunately, practice in many countries shows that even if actuarial valuations are
undertaken on a regular basis and lead to recommendations for reform, actual reforms are
often significantly delayed or do not happen at all. One of the main reasons for this is that
while decisions on pension systems have a very long-term character and affect not only
living but also future generations, politicians taking these decisions have much shorter time
horizons within the electoral cycle. In addition, there is always the temptation to use
pension fund reserves – both public and private – as a kind of «piggy bank», which can be
raided – as experience in many countries over recent years shows – to repair the public
finances or bail out the private sector (Casey, 2014). Use of pension fund reserves for
purposes other than financing current and future pensions is proof of bad governance and
should not be taking place.
There are, however, many countries where effective solutions were found which
allow the adequacy and sustainability of pension systems to be held in balance through
democratic policy dialogues well informed by independent expertise, and where reforms
are implemented with a broad consensus across the political spectrum and spanning
different interests, guaranteeing long-lasting effects. There is no recipe to be identified
which would work in every country; each country has to find a solution which fits its
specific social and political environment. There are many studies by the ILO and others
analysing different solutions and processes and identifying good practices as well as
problems and challenges (e.g. Eurofound, 2013; Sarfati and Ghellab, 2012; Ghellab,
Varela and Woodall, 2011; Reynaud, 2000).
Conversely, in many countries in Europe and elsewhere over recent decades the
balance between adequacy and sustainability concerns was endangered. Assertions of a
«social security crisis» or «old-age crisis» have been used as a justification to introduce
reforms which substantially reduce the future adequacy of benefits and significantly
increase the risk of poverty in old age for future generations of retirees (see European
Commission, 2012b; OECD, 2013). Pressures of tax competition and global financial
markets limit governments’ ostensibly sovereign power to introduce increases in social
security contributions and taxes where necessary to prevent benefit cuts. Lobbying by the
international financial services sector was successful in pushing for large-scale
privatizations of social security pensions (Hagemejer and Scholz, 2004; Hagemejer,
2005) – though these were reversed in a number of countries in the wake of the financial
and economic crisis (see box 6). Social dialogue mechanisms failed in a number of cases to
reach a consensus with the social partners on how and to what extent to bring about
increases in the (effective average) age at which individuals start to draw pension benefits,
and on how labour markets should be reorganized and regulated so as to better meet the
needs of increasing numbers of those older persons who wish to, or indeed need to,
continue in employment to significantly greater ages than previously considered
appropriate.
These failures to agree on necessary reforms through social dialogue and implement
them through well-informed and deliberate policy-making has led many countries to adopt
too readily a «hands-off» approach to their governance of the pension system (Woodall
30 Social protection for older persons: Key policy trends and statistics
and Hagemejer, 2009), through partial privatization but also through various «automatic
balancing mechanisms». These include linking accrual rates used to calculate pensions in
social security schemes automatically to life expectancy at retirement (as in countries
which introduced NDC schemes, but also in Brazil in the case of early-retirement pensions,
as well as in many other countries), or automatically linking the age of pension eligibility
to life expectancy (as in Denmark, France, Greece and Italy). This took a most extreme
form in Sweden, where changes in value of one indicator («balance ratio») deemed to
reflect the long-term financial position of the pension scheme not only affect the future
pension entitlements of contributors, but may also lead to reductions in the amounts of
pension paid to current pensioners (as happened in the middle of the financial and
economic crisis).
«Solutions» of this kind would automatically, without intervention of policy-makers
and without discussions among the social partners, adjust benefit levels, indexation
formulas, retirement ages and numbers of years of contributions required to receive a full
pension, according to certain selected statistical indicators (linked to life expectancy at
retirement or to certain ratios between revenue or assets of a scheme and its expenditure or
liability). One of the ways to achieve such automatic (downward) adjustments of benefit
levels to the changing demographic and economic conditions is to expand the defined
contribution components of pension systems, as has happened in many countries across the
world. Such «automatic pilots» are however also built in into «notional» defined-
contribution schemes in countries including Italy, Latvia, Norway, Poland and in particular
Sweden, where the «automatic balancing mechanism» in addition regulates the pace of
indexation of benefits and the valorization of past contributions. They are also present in
the form of various «sustainability factors» in different «point» schemes (such as those in
Germany and France, and outside Europe in Canada or Japan). Some countries, including
Denmark, France, Greece and Italy, have linked future increases in the pensionable age to
future changes in life expectancy.
Most of these automatic mechanisms lead ultimately to downward adjustments of
benefit levels to ensure financial sustainability. In only two OECD countries (Canada and
Germany) are there mechanisms that may result in an increase of the effective contribution
rate (Di Addio and Whitehouse, 2012). Apart from minimum pension guarantees – where
they exist – there are no similar automatic mechanisms which would adjust the system to
ensure that benefits are adequate. Even automatic adjustments of benefits in payment to
price changes are reduced or totally eliminated.
These automatic mechanisms focus solely on the objective of ensuring the long-term
financial sustainability of pension systems, while at the same time trying to sidestep open
policy debates and social dialogue, which are seen as obstacles preventing timely adoption
of necessary policy changes. The consequences of this approach are very severe, as the
absence of any corresponding automatic mechanisms to secure desired levels of adequacy
undermines the necessary balance between adequacy and sustainability concerns. In
addition, in the short term some of these mechanisms cause pro-cyclical change in the
amounts of benefits paid. Joseph Stiglitz drew attention to this phenomenon in 2009:
«When the economy gets weaker, spending on social protection and unemployment
schemes should automatically go up, helping to stabilize the economy. However, … one of
the sad facts of the so-called reforms in recent decades is that we have been weakening
these important automatic stabilizers. The extent of progressivity in tax systems has been
lowered, and we have moved from defined benefit systems to defined contribution
retirement systems, again weakening the automatic stabilizers of the economy and in some
cases converting them into automatic destabilizers» (Stiglitz, 2009, pp. 4–5).
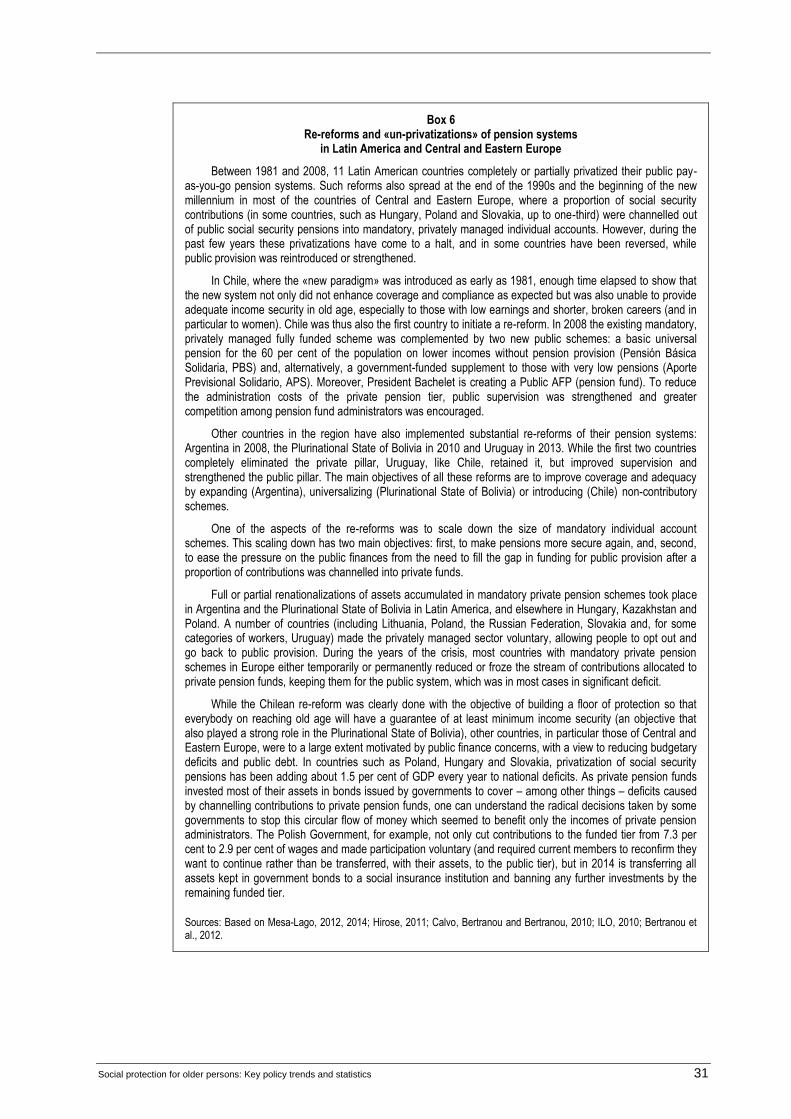
Social protection for older persons: Key policy trends and statistics 31
Box 6
Re-reforms and «un-privatizations» of pension systems in Latin America and Central and Eastern Europe
Between 1981 and 2008, 11 Latin American countries completely or partially privatized their public pay-as-you-go pension systems. Such reforms also spread at the end of the 1990s and the beginning of the new millennium in most of the countries of Central and Eastern Europe, where a proportion of social security contributions (in some countries, such as Hungary, Poland and Slovakia, up to one-third) were channelled out of public social security pensions into mandatory, privately managed individual accounts. However, during the past few years these privatizations have come to a halt, and in some countries have been reversed, while public provision was reintroduced or strengthened.
In Chile, where the «new paradigm» was introduced as early as 1981, enough time elapsed to show that the new system not only did not enhance coverage and compliance as expected but was also unable to provide adequate income security in old age, especially to those with low earnings and shorter, broken careers (and in particular to women). Chile was thus also the first country to initiate a re-reform. In 2008 the existing mandatory, privately managed fully funded scheme was complemented by two new public schemes: a basic universal pension for the 60 per cent of the population on lower incomes without pension provision (Pensión Básica Solidaria, PBS) and, alternatively, a government-funded supplement to those with very low pensions (Aporte Previsional Solidario, APS). Moreover, President Bachelet is creating a Public AFP (pension fund). To reduce the administration costs of the private pension tier, public supervision was strengthened and greater competition among pension fund administrators was encouraged.
Other countries in the region have also implemented substantial re-reforms of their pension systems: Argentina in 2008, the Plurinational State of Bolivia in 2010 and Uruguay in 2013. While the first two countries completely eliminated the private pillar, Uruguay, like Chile, retained it, but improved supervision and strengthened the public pillar. The main objectives of all these reforms are to improve coverage and adequacy by expanding (Argentina), universalizing (Plurinational State of Bolivia) or introducing (Chile) non-contributory schemes.
One of the aspects of the re-reforms was to scale down the size of mandatory individual account schemes. This scaling down has two main objectives: first, to make pensions more secure again, and, second, to ease the pressure on the public finances from the need to fill the gap in funding for public provision after a proportion of contributions was channelled into private funds.
Full or partial renationalizations of assets accumulated in mandatory private pension schemes took place in Argentina and the Plurinational State of Bolivia in Latin America, and elsewhere in Hungary, Kazakhstan and Poland. A number of countries (including Lithuania, Poland, the Russian Federation, Slovakia and, for some categories of workers, Uruguay) made the privately managed sector voluntary, allowing people to opt out and go back to public provision. During the years of the crisis, most countries with mandatory private pension schemes in Europe either temporarily or permanently reduced or froze the stream of contributions allocated to private pension funds, keeping them for the public system, which was in most cases in significant deficit.
While the Chilean re-reform was clearly done with the objective of building a floor of protection so that everybody on reaching old age will have a guarantee of at least minimum income security (an objective that also played a strong role in the Plurinational State of Bolivia), other countries, in particular those of Central and Eastern Europe, were to a large extent motivated by public finance concerns, with a view to reducing budgetary deficits and public debt. In countries such as Poland, Hungary and Slovakia, privatization of social security pensions has been adding about 1.5 per cent of GDP every year to national deficits. As private pension funds invested most of their assets in bonds issued by governments to cover – among other things – deficits caused by channelling contributions to private pension funds, one can understand the radical decisions taken by some governments to stop this circular flow of money which seemed to benefit only the incomes of private pension administrators. The Polish Government, for example, not only cut contributions to the funded tier from 7.3 per cent to 2.9 per cent of wages and made participation voluntary (and required current members to reconfirm they want to continue rather than be transferred, with their assets, to the public tier), but in 2014 is transferring all assets kept in government bonds to a social insurance institution and banning any further investments by the remaining funded tier.
Sources: Based on Mesa-Lago, 2012, 2014; Hirose, 2011; Calvo, Bertranou and Bertranou, 2010; ILO, 2010; Bertranou et al., 2012.

32 Social protection for older persons: Key policy trends and statistics
7. Fiscal consolidation: implications for the social protection of older persons
Fiscal consolidation 1
policies adopted from 2010 onwards have affected older
persons around the world, and may further constrain the policy space for pension policy in
the future. According to IMF fiscal projections, as many as 122 countries are contracting
public expenditures in terms of GDP in 2014, expected to increase to 125 countries in
2015. The latest IMF forecast suggests that governments will continue on this
contractionary trend at least through 2016 (ILO, 2014a).
A review of 314 IMF country reports in 174 countries published between January 2010
and February 2013 (Ortiz and Cummins, 2013) indicates that pension reforms aimed at
reducing the costs of pension systems constitute one of the six main policy options that
governments are considering with a view to curtail government expenditures (table 2; see
also table 3). Older persons are also affected by other policy options that relate strongly to
the social protection of populations: phasing out or eliminating subsidies; cutting or capping
wage bills; increasing taxes on consumption; rationalizing and more narrowly targeting
social assistance and other social protection benefits; and introducing reforms to health-care
systems aimed at cost containment. These fiscal consolidation strategies are not limited to
Europe, and, in fact, are prevalent in developing countries. Many governments are also
considering revenue-side measures that can have adverse impacts on vulnerable populations,
mainly the introduction or extension of consumption taxes such as VAT, on basic products
that are disproportionately consumed by poor households. All of the different adjustment
approaches pose potentially serious consequences for vulnerable populations.
Table 2. Main adjustment measures by region, 2010–13 (number of countries)
Eliminating subsidies
Wage bill cuts/caps
Increasing consumption
taxes
Pension reforms
Rationalizing and targeting
social ssistance
Health reforms
East Asia and the Pacific 12 13 8 4 9 0
Eastern Europe and Central Asia 9 15 13 16 15 9
Latin America and the Caribbean 11 14 13 12 11 0
Middle East and North Africa 9 7 7 5 5 3
South Asia 6 4 4 1 4 0
Sub-Saharan Africa 31 22 18 9 11 0
Developing countries 78 75 63 47 55 12
High-income countries 22 23 31 39 25 25
All countries 100 98 94 86 80 37
Source: Ortiz and Cummins, 2013, based on IMF country reports (Jan. 2010 to Feb. 2013).
Pension reforms affect current and future generations of older persons. Approximately
86 governments in 47 developing and 39 high-income countries have been considering a
variety of changes to their contributory pension systems, by means such as making eligibility
conditions stricter or raising the statutory pensionable age, so that people have to work longer
1 In this policy paper, «fiscal consolidation» refers to the wide array of adjustment measures
adopted to reduce government deficits and debt accumulation. Fiscal consolidation policies are
often referred to as austerity policies.
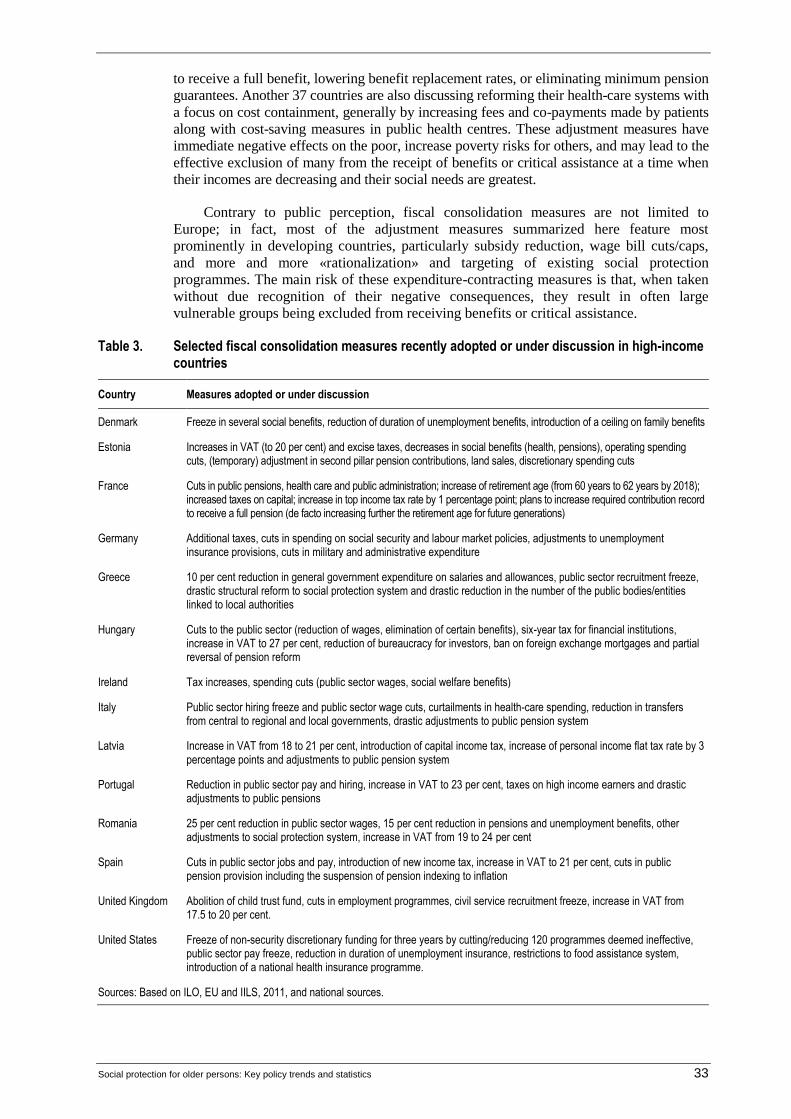
Social protection for older persons: Key policy trends and statistics 33
to receive a full benefit, lowering benefit replacement rates, or eliminating minimum pension
guarantees. Another 37 countries are also discussing reforming their health-care systems with
a focus on cost containment, generally by increasing fees and co-payments made by patients
along with cost-saving measures in public health centres. These adjustment measures have
immediate negative effects on the poor, increase poverty risks for others, and may lead to the
effective exclusion of many from the receipt of benefits or critical assistance at a time when
their incomes are decreasing and their social needs are greatest.
Contrary to public perception, fiscal consolidation measures are not limited to
Europe; in fact, most of the adjustment measures summarized here feature most
prominently in developing countries, particularly subsidy reduction, wage bill cuts/caps,
and more and more «rationalization» and targeting of existing social protection
programmes. The main risk of these expenditure-contracting measures is that, when taken
without due recognition of their negative consequences, they result in often large
vulnerable groups being excluded from receiving benefits or critical assistance.
Table 3. Selected fiscal consolidation measures recently adopted or under discussion in high-income countries
Country Measures adopted or under discussion
Denmark Freeze in several social benefits, reduction of duration of unemployment benefits, introduction of a ceiling on family benefits
Estonia Increases in VAT (to 20 per cent) and excise taxes, decreases in social benefits (health, pensions), operating spending cuts, (temporary) adjustment in second pillar pension contributions, land sales, discretionary spending cuts
France Cuts in public pensions, health care and public administration; increase of retirement age (from 60 years to 62 years by 2018); increased taxes on capital; increase in top income tax rate by 1 percentage point; plans to increase required contribution record to receive a full pension (de facto increasing further the retirement age for future generations)
Germany Additional taxes, cuts in spending on social security and labour market policies, adjustments to unemployment insurance provisions, cuts in military and administrative expenditure
Greece 10 per cent reduction in general government expenditure on salaries and allowances, public sector recruitment freeze, drastic structural reform to social protection system and drastic reduction in the number of the public bodies/entities linked to local authorities
Hungary Cuts to the public sector (reduction of wages, elimination of certain benefits), six-year tax for financial institutions, increase in VAT to 27 per cent, reduction of bureaucracy for investors, ban on foreign exchange mortgages and partial reversal of pension reform
Ireland Tax increases, spending cuts (public sector wages, social welfare benefits)
Italy Public sector hiring freeze and public sector wage cuts, curtailments in health-care spending, reduction in transfers from central to regional and local governments, drastic adjustments to public pension system
Latvia Increase in VAT from 18 to 21 per cent, introduction of capital income tax, increase of personal income flat tax rate by 3 percentage points and adjustments to public pension system
Portugal Reduction in public sector pay and hiring, increase in VAT to 23 per cent, taxes on high income earners and drastic adjustments to public pensions
Romania 25 per cent reduction in public sector wages, 15 per cent reduction in pensions and unemployment benefits, other adjustments to social protection system, increase in VAT from 19 to 24 per cent
Spain Cuts in public sector jobs and pay, introduction of new income tax, increase in VAT to 21 per cent, cuts in public pension provision including the suspension of pension indexing to inflation
United Kingdom Abolition of child trust fund, cuts in employment programmes, civil service recruitment freeze, increase in VAT from 17.5 to 20 per cent.
United States Freeze of non-security discretionary funding for three years by cutting/reducing 120 programmes deemed ineffective, public sector pay freeze, reduction in duration of unemployment insurance, restrictions to food assistance system, introduction of a national health insurance programme.
Sources: Based on ILO, EU and IILS, 2011, and national sources.
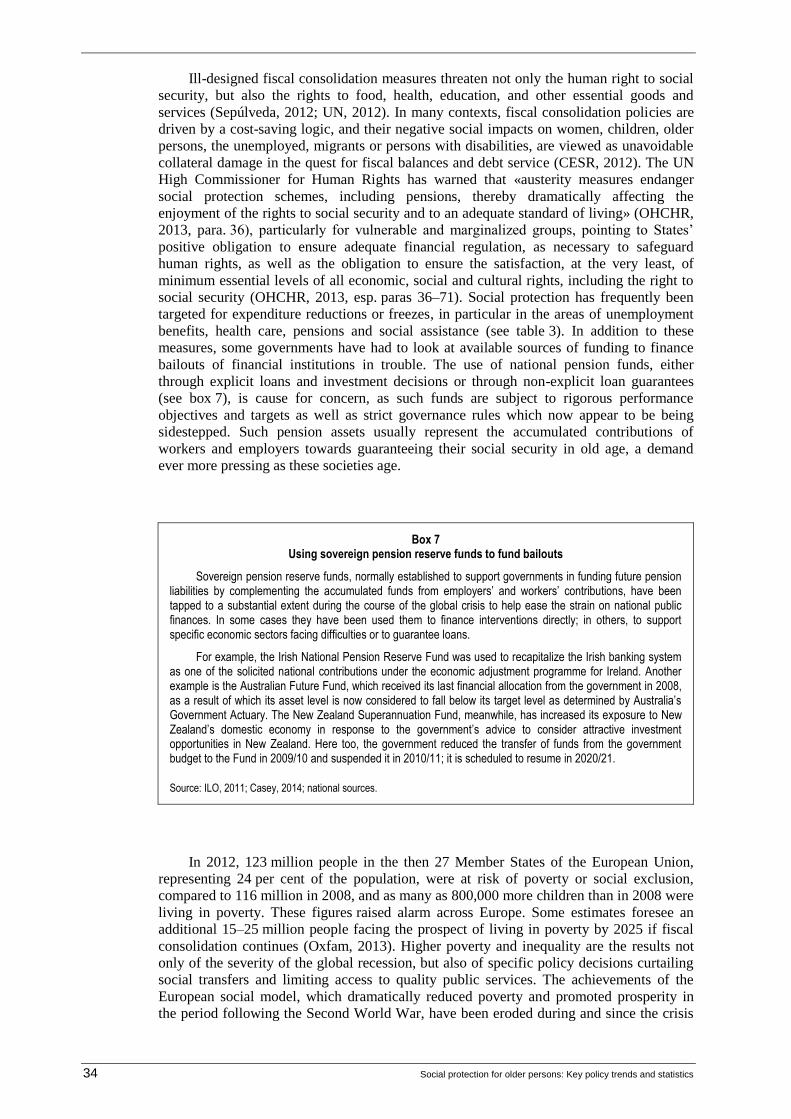
34 Social protection for older persons: Key policy trends and statistics
Ill-designed fiscal consolidation measures threaten not only the human right to social
security, but also the rights to food, health, education, and other essential goods and
services (Sepúlveda, 2012; UN, 2012). In many contexts, fiscal consolidation policies are
driven by a cost-saving logic, and their negative social impacts on women, children, older
persons, the unemployed, migrants or persons with disabilities, are viewed as unavoidable
collateral damage in the quest for fiscal balances and debt service (CESR, 2012). The UN
High Commissioner for Human Rights has warned that «austerity measures endanger
social protection schemes, including pensions, thereby dramatically affecting the
enjoyment of the rights to social security and to an adequate standard of living» (OHCHR,
2013, para. 36), particularly for vulnerable and marginalized groups, pointing to States’
positive obligation to ensure adequate financial regulation, as necessary to safeguard
human rights, as well as the obligation to ensure the satisfaction, at the very least, of
minimum essential levels of all economic, social and cultural rights, including the right to
social security (OHCHR, 2013, esp. paras 36–71). Social protection has frequently been
targeted for expenditure reductions or freezes, in particular in the areas of unemployment
benefits, health care, pensions and social assistance (see table 3). In addition to these
measures, some governments have had to look at available sources of funding to finance
bailouts of financial institutions in trouble. The use of national pension funds, either
through explicit loans and investment decisions or through non-explicit loan guarantees
(see box 7), is cause for concern, as such funds are subject to rigorous performance
objectives and targets as well as strict governance rules which now appear to be being
sidestepped. Such pension assets usually represent the accumulated contributions of
workers and employers towards guaranteeing their social security in old age, a demand
ever more pressing as these societies age.
Box 7
Using sovereign pension reserve funds to fund bailouts
Sovereign pension reserve funds, normally established to support governments in funding future pension liabilities by complementing the accumulated funds from employers’ and workers’ contributions, have been tapped to a substantial extent during the course of the global crisis to help ease the strain on national public finances. In some cases they have been used them to finance interventions directly; in others, to support specific economic sectors facing difficulties or to guarantee loans.
For example, the Irish National Pension Reserve Fund was used to recapitalize the Irish banking system as one of the solicited national contributions under the economic adjustment programme for Ireland. Another example is the Australian Future Fund, which received its last financial allocation from the government in 2008, as a result of which its asset level is now considered to fall below its target level as determined by Australia’s Government Actuary. The New Zealand Superannuation Fund, meanwhile, has increased its exposure to New Zealand’s domestic economy in response to the government’s advice to consider attractive investment opportunities in New Zealand. Here too, the government reduced the transfer of funds from the government budget to the Fund in 2009/10 and suspended it in 2010/11; it is scheduled to resume in 2020/21.
Source: ILO, 2011; Casey, 2014; national sources.
In 2012, 123 million people in the then 27 Member States of the European Union,
representing 24 per cent of the population, were at risk of poverty or social exclusion,
compared to 116 million in 2008, and as many as 800,000 more children than in 2008 were
living in poverty. These figures raised alarm across Europe. Some estimates foresee an
additional 15–25 million people facing the prospect of living in poverty by 2025 if fiscal
consolidation continues (Oxfam, 2013). Higher poverty and inequality are the results not
only of the severity of the global recession, but also of specific policy decisions curtailing
social transfers and limiting access to quality public services. The achievements of the
European social model, which dramatically reduced poverty and promoted prosperity in
the period following the Second World War, have been eroded during and since the crisis

Social protection for older persons: Key policy trends and statistics 35
by a series of adjustment reforms that have led to a resurgence of poverty in Europe and a
loss of prosperity for the middle classes. The long-accepted concept of universal access to
decent living conditions for all citizens has been threatened by a widening gulf between
more narrowly targeted programmes for those at the lower levels of the income distribution
and a stronger emphasis on individual savings for the middle and upper income groups.
This fragmentation of social security systems limits the potential for a collective pooling of
risk, erodes social solidarity, limits the responsibility of the State to the care of only the
extremely poor, and changes the terms of the social contract that has been at the very basis
of the European social model. The weakening of collective bargaining and social dialogue,
along with the deregulation and «flexibilization» of labour markets, has further
compounded this erosion (ILO, 2013; IILS, 2012; Vaughan-Whitehead, 2013).
In some European countries, courts have reviewed the constitutional validity of fiscal
consolidation measures. In 2013, the Portuguese constitutional court ruled that four fiscal
consolidation measures in the budget, mainly affecting civil servants and pensioners, were
unlawful and in breach of the country’s constitution. In Latvia, the 2010 budget proposed
new spending cuts and tax increases, including a 10 per cent cut in pensions and a 70 per
cent decrease for working pensioners; the constitutional court ruled that the pension cuts
were unconstitutional on the grounds that they violated the right to social security, and the
cuts had to be reversed. In Romania, 15 per cent pension cuts proposed in May 2010 were
also declared unconstitutional; although pensions partly funded by worker contributions
are constitutionally protected, the Government had circumvented this protection on the
grounds of a separate constitutional article allowing the temporary limitation of certain
rights in order to defend national security (UNDP and RCPAR, 2011; OHCHR, 2013).
More recently, the European Parliament has launched an inquiry into the democratic
legitimacy of adjustment reforms and their social impacts in Ireland, Cyprus, Spain,
Slovenia, Greece, Portugal and Italy (European Parliament, 2014a; European Parliament,
2014b).
Overall, the deployment of vast public resources to rescue private institutions
considered «too big to fail» and, to a lesser degree, to fund fiscal stimulus plans, caused
sovereign debt to increase, forced taxpayers to absorb the losses and, ultimately, hindered
economic growth (figure 17). Many governments have curtailed government consumption
and investment and also reduced social benefits, thus creating a vicious circle: reductions
in infrastructure investment and public sector wages, as well as cuts in social security,
further depressed aggregate demand in the economy, in consequence reducing the demand
for labour, and thus in turn increasing unemployment, reducing revenues from income
taxation and narrowing the available fiscal envelope, thereby adding pressure to further
reduce social transfers. The cost of adjustment has been passed on to populations, who
have now been attempting to cope with fewer jobs, lower income and reduced access to
public goods and services for more than five years.
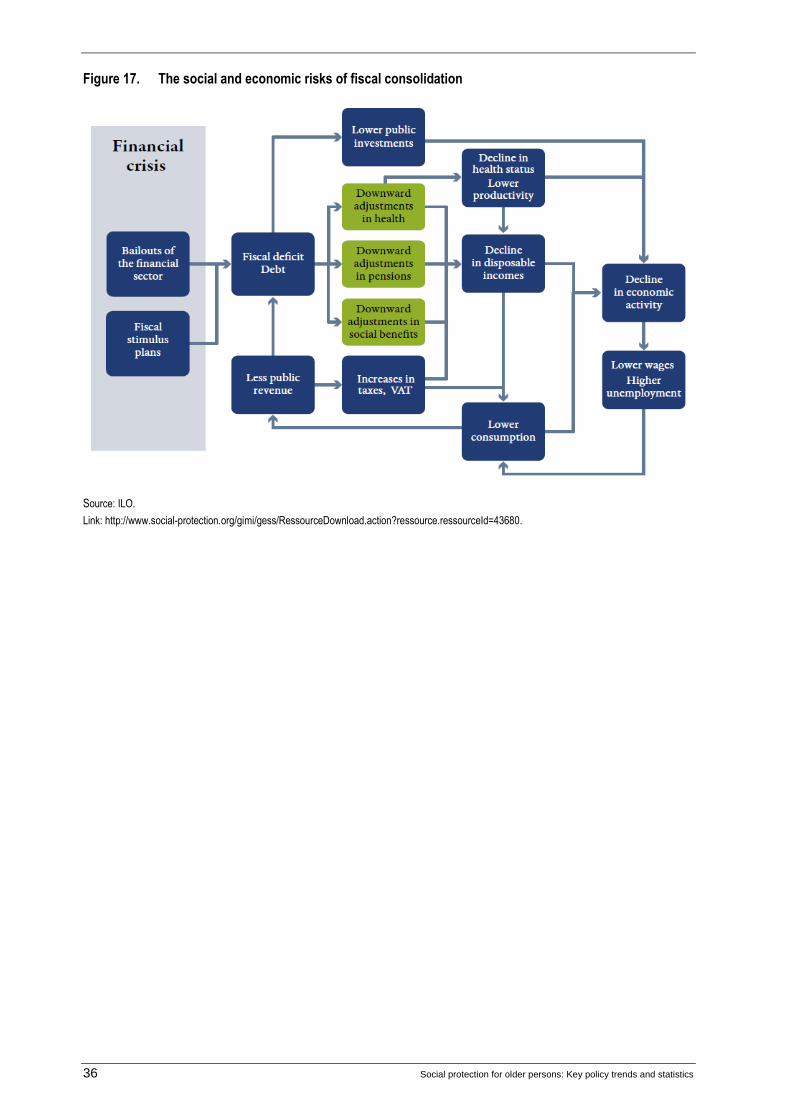
36 Social protection for older persons: Key policy trends and statistics
Figure 17. The social and economic risks of fiscal consolidation
Source: ILO.
Link: http://www.social-protection.org/gimi/gess/RessourceDownload.action?ressource.ressourceId=43680.
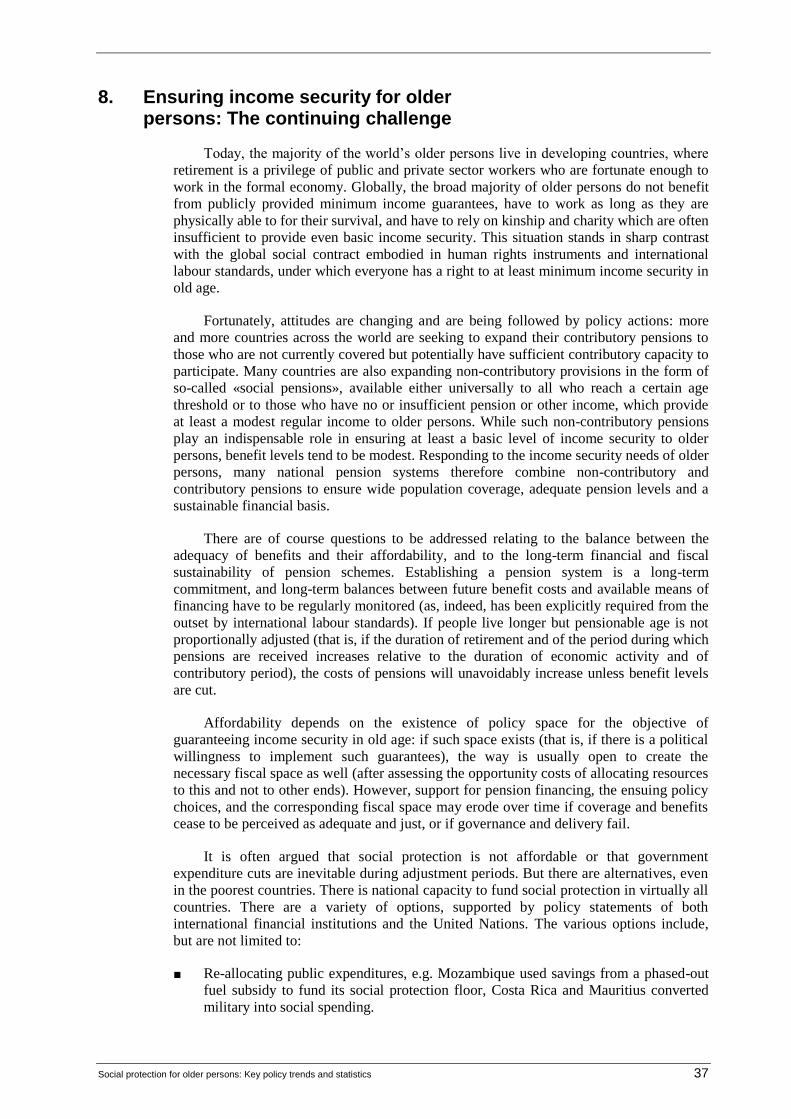
Social protection for older persons: Key policy trends and statistics 37
8. Ensuring income security for older persons: The continuing challenge
Today, the majority of the world’s older persons live in developing countries, where
retirement is a privilege of public and private sector workers who are fortunate enough to
work in the formal economy. Globally, the broad majority of older persons do not benefit
from publicly provided minimum income guarantees, have to work as long as they are
physically able to for their survival, and have to rely on kinship and charity which are often
insufficient to provide even basic income security. This situation stands in sharp contrast
with the global social contract embodied in human rights instruments and international
labour standards, under which everyone has a right to at least minimum income security in
old age.
Fortunately, attitudes are changing and are being followed by policy actions: more
and more countries across the world are seeking to expand their contributory pensions to
those who are not currently covered but potentially have sufficient contributory capacity to
participate. Many countries are also expanding non-contributory provisions in the form of
so-called «social pensions», available either universally to all who reach a certain age
threshold or to those who have no or insufficient pension or other income, which provide
at least a modest regular income to older persons. While such non-contributory pensions
play an indispensable role in ensuring at least a basic level of income security to older
persons, benefit levels tend to be modest. Responding to the income security needs of older
persons, many national pension systems therefore combine non-contributory and
contributory pensions to ensure wide population coverage, adequate pension levels and a
sustainable financial basis.
There are of course questions to be addressed relating to the balance between the
adequacy of benefits and their affordability, and to the long-term financial and fiscal
sustainability of pension schemes. Establishing a pension system is a long-term
commitment, and long-term balances between future benefit costs and available means of
financing have to be regularly monitored (as, indeed, has been explicitly required from the
outset by international labour standards). If people live longer but pensionable age is not
proportionally adjusted (that is, if the duration of retirement and of the period during which
pensions are received increases relative to the duration of economic activity and of
contributory period), the costs of pensions will unavoidably increase unless benefit levels
are cut.
Affordability depends on the existence of policy space for the objective of
guaranteeing income security in old age: if such space exists (that is, if there is a political
willingness to implement such guarantees), the way is usually open to create the
necessary fiscal space as well (after assessing the opportunity costs of allocating resources
to this and not to other ends). However, support for pension financing, the ensuing policy
choices, and the corresponding fiscal space may erode over time if coverage and benefits
cease to be perceived as adequate and just, or if governance and delivery fail.
It is often argued that social protection is not affordable or that government
expenditure cuts are inevitable during adjustment periods. But there are alternatives, even
in the poorest countries. There is national capacity to fund social protection in virtually all
countries. There are a variety of options, supported by policy statements of both
international financial institutions and the United Nations. The various options include,
but are not limited to:
■ Re-allocating public expenditures, e.g. Mozambique used savings from a phased-out
fuel subsidy to fund its social protection floor, Costa Rica and Mauritius converted
military into social spending.
38 Social protection for older persons: Key policy trends and statistics
■ Increasing tax revenues, e.g. Mongolia is financing a universal child benefit from a
tax on copper exports, Bolivia funds a universal old age pension out of a tax on gas
exploitation, Brazil and China expanded rural pensions by increasing resorting to
general taxation.
■ Reductions of debt or debt servicing, e.g. Ecuador, Iceland, Costa Rica, Argentina,
and Botswana.
■ Adopting a more accommodative macroeconomic framework and fighting illicit
financial flows, which amount to more than ten times the total aid received by
developing countries.
■ Increasing social security contributions/revenues, e.g. Brazil, China, Lesotho,
Namibia, South Africa, and Thailand (ILO 2014a; Ortiz and Cummins 2012; Duran-
Valverde and Pacheco 2012).
In many middle-income countries, the dominant trend of recent years has been that of
an expansion of social protection coverage. The experience of crises of the late 1990s in
Asia and Latin America as well as the current ongoing crisis, prompted many countries to
reconsider their development models. The new policies recognize a more active role of the
State in fostering social and economic development and strengthening domestic demand.
In particular, the current crisis has triggered a shift in the way developing countries see the
relationship between growth and social protection. When emerging economies found
demand for their exports falling, policy-makers started questioning unsustainable export-
led growth models and began moving instead towards recovery strategies centred on
building up domestic consumption and internal markets. One way to raise household
income and thereby domestic consumption is through improved social protection systems.
Adequate social protection also enhances productivity and human development (figure 18).
Figure 18. Positive impacts of the extension of social protection on inclusive growth
Source ILO, 2014a.
Social protection policies have proven effective in reducing poverty and inequalities.
They facilitate access to health and education, promote decent work and gender equality
and contribute to strengthening people’s rights and dignity. The evidence presented in this
Social protection for older persons: Key policy trends and statistics 39
paper demonstrates that social protection does not only enhance older persons’ material
well-being through pensions and effective access to health care, but has a much wider
impact. Social protection also contributes to reducing vulnerability to exclusion,
marginalization and discrimination, and can enable older persons to participate more fully
in the lives of their families, communities and societies.
Social protection systems contribute to results under several MDGs, accelerating
advancements in education and achieving better health and more equitable gender
outcomes. Social protection also has the potential to shield people from multiple risks and
stresses associated with climate change and degraded ecosystems and to help them cope
with structural transitions to more sustainable development patterns.
Last, but not least, social protection contributes indispensably to political and social
stability. Well-designed social protection systems, and in particular social protection floors
defined and developed in line with ILO Recommendation No. 202, can strengthen social
contracts, enhance social inclusion and contribute to more equitable societies.
As the global community debates a new set of development goals intended to bring
about greater, more inclusive and sustainable development, it is clear that the post-2015
agenda will require an explicit call to ensure adequate social protection for all, including
for older persons.

Social protection for older persons: Key policy trends and statistics 41
Bibliography
Behrendt, C.; Woodall, J. Forthcoming. «Pensions and other social security income
transfer systems», in J. Berg (ed.): Labour market institutions and inequality:
Building just societies in the 21st century (Cheltenham, Edward Elgar).
Bertranou, F.; Cetrángolo, O.; Grushka, C.; Casanova, L. 2012. Beyond the privatization
and re-nationalisation of the Argentine pension system: Coverage, fragmentation, and
sustainability, Social Science Research Network Working Paper, Nov. Available at:
http://ssrn.com/abstract=2191202 [16 Apr. 2014].
Calvo, E.; Bertranou, F.; Bertranou, E. 2010. «Are old-age pension system reforms moving
away from individual retirement accounts in Latin America?», in Journal of Social
Policy, Vol. 39, No. 2, pp. 223–234.
Casey, B.H. 2014. «From pension funds to piggy banks: (Perverse) consequences of the
Stability and Growth Pact since the crisis», in International Social Security Review,
Vol. 67, No. 1, pp. 27–48.
CESR (Center for Economic and Social Rights). 2012. Fiscal fallacies: Eight myths about
the age of austerity and human rights responses (New York).
Di Addio, A. C. and Whitehouse, E., 2012. Towards financial sustainability of pension
systems: the role of automatic adjustment mechanisms in OECD and EU countries,
Beiträge zur sozialen Sicherheit - Forschungsbericht No. 8/12 (Berne: Swiss Federal
Office for Social Insurance).
Durán-Valverde, F. Pacheco, J.F. 2012. Fiscal space and the extension of social protection:
Lessons learnt from developing countries. Extension of Social Security ESS Paper
No. 33 (Geneva, ILO). Available at: http://www.ilo.org/gimi/gess/
RessFileDownload.do?ressourceId=34168 [16 Apr. 2014].
Eurofound (European Foundation for the Improvement of Living and Working
Conditions). 2013. Social partners’ involvement in pension reform in the EU
(Dublin). Available at: http://www.eurofound.europa.eu/docs/eiro/tn1304032s/
tn1304032s.pdf [16 Apr. 2014].
European Commission. 2012a. The 2012 ageing report: Economic and budgetary
projections for the 27 EU Member States (2010–2060) (Brussels). Available at:
http://ec.europa.eu/economy_finance/publications/european_economy/2012/2012-
ageing-report_en.htm [16 Apr. 2014].
European Commission. 2012b. Pension adequacy in the European Union 2010–2050
(Brussels). Available at: http://ec.europa.eu/social/BlobServlet?docId=7805&langId=en
[16 Apr. 2014].
European Parliament. 2014a. «Inquiry: how Parliament evaluated the impact of Troika
measures», in European Parliament News, 13 Jan. (Strasbourg). Available at:
http://www.europarl.europa.eu/news/en/news-room/content/20140110STO32308/html/
Inquiryhow-Parliament-evaluated-the-impact-of-Troika-measures [16 Apr. 2014].
European Parliament. 2014b. «Parliamentarians call for more legitimacy in economic
policymaking in the EU», in European Parliament News, 23 Jan. (Strasbourg). Available
at: http://www.europarl.europa.eu/news/en/news-room/content/20140122STO33435/html/
Parliamentarians-call-for-more-legitimacy-in-economic-policy-making-in-the-EU
[16 Apr. 2014].
42 Social protection for older persons: Key policy trends and statistics
Ghellab, Y.; Varela, N.; Woodall, J. 2011. «Social dialogue and social security
governance: A topical ILO perspective», in International Social Security Review,
Vol. 64, No. 4, pp. 39–56.
Hagemejer, K. 2005. «Sustainable, safe and adequate pensions in the ageing society:
Policy dilemmas», in Polityka Społeczna, Vol. 1, No. 1, pp. 11–17. Available at:
http://www.social-protection.org/gimi/gess/RessourceDownload.action?ressource.
ressourceId=32290 [16 Apr. 2014].
Hagemejer, K.; Scholz, W. 2004. «Nachhaltig, sicher und angemessen? Die
Reformstrategie der Weltbank und die Rentenreformen in Polen, Ungarn, Tschechien
und anderen osteuroäischen Ländern», in Deutsche Rentenversicherung, Nos 11–12,
pp. 778–789.
HelpAge International. 2013. Global AgeWatch Index 2013: Insight report (London).
Available at: http://www.helpage.org/global-agewatch/ [16 Apr. 2014].
HelpAge International. 2014. Home care for older people: The experience of ASEAN
countries (London). Available at: http://www.eldis.org/go/home&id
=66957&type=Document#.Uz8FHq15PSk [16 Apr. 2014].
Hirose, K. (ed.). 2011. Pension reform in Central and Eastern Europe in times of crisis,
austerity and beyond (Budapest, ILO Regional Office for Central and Eastern
Europe).
IILS. 2012. World of Work Report 2012: Better jobs for a better economy (Geneva).
Available at: http://www.ilo.org/global/research/global-reports/world-of-
work/WCMS_179453/lang--nl/index.htm [16 Apr. 2014].
ILO. 2010. ILO contribution to the pension reform in Chile (Santiago de Chile).
ILO. 2011. Social security for social justice and a fair globalization: Recurrent discussion
on social protection (social security) under the ILO Declaration on Social Justice for
a Fair Globalization, 2011, Report VI, International Labour Conference,
100th Session, Geneva, 2011 (Geneva). Available at:
http://ilo.org/ilc/ILCSessions/100thSession/on-the-agenda/social-protection/lang--
en/index.htm [16 Apr. 2014].
ILO. 2012a. Social Security for All: Building social protection floors and comprehensive
social security systems. The strategy of the International Labour Organization (Geneva:
International Labour Office), Available at: http://www.socialsecurityextension.org/
gimi/gess/RessFileDownload.do?ressourceId=34188.
ILO. 2012b. Global Employment Trends for Women 2012 (Geneva). Available at:
http://www.ilo.org/global/research/global-reports/global-employment-trends/WCMS_
195447/lang--en/index.htm [16 Apr. 2014].
ILO. 2013. Global Wage Report 2012/13: Wages and equitable growth (Geneva).
Available at: http://www.ilo.org/global/research/global-reports/global-wage-
report/2012/WCMS_194843/lang--de/index.htm [16 Apr. 2014].
ILO, 2014a. World Social Protection Report 2014/15: Building economic recovery,
inclusive development and social justice (Geneva: International Labour Office),
Available at: http://www.ilo.org/wcmsp5/groups/public/---dgreports/---dcomm/
documents/publication/wcms_245201.pdf.

Social protection for older persons: Key policy trends and statistics 43
ILO, 2014b. Universal health protection: progress to date and the way forward. Social
Protection Policy Papers No. 10 (Geneva: International Labour Office). Available at:
http://www.ilo.org/secsoc/information-resources/publications-and-tools/policy-
papers/WCMS_305947/lang--en/index.htm.
Mesa-Lago, C. 2012. «Re-reforms of privatized pension systems in the world: A
comparative study of Chile, Argentina, Bolivia and Hungary», in Zeitschrift für
ausländisches und internationales Arbeits- und Sozialrecht, Vol. 26, No. 3,
pp. 189-314.
Mesa-Lago, C., 2014: Reversing pension privatization: The experience of Argentina,
Bolivia, Chile and Hungary, ESS Extension of Social Security Paper No. 44 (Geneva:
International Labour Office). Available at: http://www.social-protection.org/
gimi/gess/RessourcePDF.action?ressource.ressourceId=43277.
OECD. 2012. Pensions Outlook 2012 (Paris). Available at: http://www.oecd.org/
finance/private-pensions/oecdpensionsoutlook2012.htm [20 Apr. 2014].
OECD. 2013. Pensions at a Glance 2013: Retirement-income systems in OECD and G20
countries (Paris). Available at: http://www.oecd.org/pensions/pensionsataglance.htm
[20 Apr. 2014].
OHCHR. 2013. Report on austerity measures and economic and social rights (Geneva:
United Nations High Commissioner for Human Rights). Available at:
http://www.ohchr.org/Documents/Issues/Development/RightsCrisis/E-2013-82_en.pdf.
Ortiz, I.; Cummins, M. (eds). 2012. A recovery for all: Rethinking socio-economic policies
for children and poor households (New York, UNICEF, Division of Policy and
Practice).
Ortiz, I.; Cummins, M. 2013. The age of austerity: A review of public expenditures and
adjustment measures in 181 countries, Working Paper (New York and Geneva,
Initiative for Policy Dialogue and the South Centre). Available at:
http://policydialogue.org/files/publications/Age_of_Austerity_Ortiz_and_Cummins.p
df [20 Apr. 2014].
Oxfam. 2013. A cautionary tale: The true cost of austerity and inequality in Europe,
Briefing Paper (London). Available at: http://policy-practice.oxfam.org.uk/
publications/acautionary-tale-the-true-cost-of-austerity-and-inequality-in-europe-
301384 [20 Apr. 2014].
Razavi, S.; Arza, C.; Braunstein, E.; Cook, S.; Goulding, K. 2012. Gendered impacts
of globalization: Employment and social protection, Gender and Development
Paper No. 16 (Geneva, United Nations Research Institute for Social Development).
Available at: http://www.unrisd.org/80256B3C005BCCF9/search/6E16D1DC33F5
D82BC12579D000478859?OpenDocument [20 Apr. 2014].
Reynaud, E. (ed.). 2000. Social dialogue and pension reform (Geneva, ILO).
Ringen, S.; Ngok, K. 2013. What kind of welfare state is emerging in China?, UNRISD
Working Paper No. 2013-2 (Geneva, United Nations Research Institute for Social
Development). Available at: http://www.unrisd.org/80256B3C005BCCF9/search/
28BCE0F59BDD3738C1257BE30053EBAC?OpenDocument [20 Apr. 2014].
44 Social protection for older persons: Key policy trends and statistics
Sarfati, H.; Ghellab, Y. 2012. The political economy of pension reforms in times of global
crisis: State unilateralism or social dialogue?, Working Paper No. 37 (Geneva, ILO).
Available at: http://www.ilo.org/ifpdial/information-resources/publications/WCMS_
176346/lang--en/index.htm [20 Apr. 2014].
Scheil-Adlung, X.; Bonan, J. 2012. Can the European elderly afford the financial burden
of health and long-term care? Assessing impacts and policy implications, Extension
of Social Security ESS Paper No. 31 (Geneva, ILO). Available at:
http://www.ilo.org/gimi/gess/ShowRessource.action?ressource.ressourceId=30228
[20 Apr. 2014].
Sepúlveda, M. 2012. The human rights based approach to recovery from the global
economic and financial crises, with a focus on those living in poverty, Report of the
Independent Expert on the Question of Human Rights and Extreme Poverty,
Magdalena Sepúlveda Carmona, Human Rights Council (A/HRC/17/34). Available
at: http://www2.ohchr.org/english/bodies/hrcouncil/docs/17session/A-HRC-17-34.pdf
[20 Apr. 2014].
SSA (Social Security Administration of the United States); ISSA (International Social
Security Association). 2012. Social security programs throughout the world: Europe,
2012 (Washington, DC and Geneva). Available at: http://www.ssa.gov/
policy/docs/progdesc/ssptw/2012-2013/europe/ [20 Apr. 2014].
SSA (Social Security Administration of the United States); ISSA (International Social
Security Association). 2013a. Social security programs throughout the world: Asia
and Pacific, 2012 (Washington, DC and Geneva). Available at:
http://www.ssa.gov/policy/docs/progdesc/ssptw/2012-2013/asia/ [20 Apr. 2014].
SSA (Social Security Administration of the United States); ISSA (International Social
Security Association). 2013b. Social security programs throughout the World: Africa,
2013 (Washington, DC and Geneva). Available at:
http://www.socialsecurity.gov/policy/docs/progdesc/ssptw/2012-2013/africa/ [20 Apr.
2014].
SSA (Social Security Administration of the United States); ISSA (International Social
Security Association). 2014. Social security programs throughout the world: The
Americas, 2011 (Washington, DC and Geneva). Available at:
http://www.socialsecurity.gov/policy/docs/progdesc/ssptw/2010-2011/americas/
[20 Apr. 2014].
Stiglitz, J. 2009. «The global crisis, social protection and jobs», in International Labour
Review, Vol. 148, Nos 1–2, pp. 1–13. Available at: http://dx.doi.org/10.1111/j.1564-
913X.2009.00046.x [20 Apr. 2014].
UN. 2008. General comment No. 19: The right to social security (Art. 9). Doc.
E/C.12/GC/19 (Geneva, United Nations Economic and Social Council, Committee on
Economic, Social and Cultural Rights). Available at:
http://tbinternet.ohchr.org/_layouts/treatybodyexternal/Download.aspx?symbolno=E
%2fC.12%2fGC%2f19&Lang=en [20 Apr. 2014].
UN. 2012. Guiding principles on extreme poverty and human rights, submitted by the
Special Rapporteur on extreme poverty and human rights, Magdalena Sepúlveda
Carmona (New York). Available at: http://www.ohchr.org/Documents/Issues/
Poverty/A-HRC-21-39_en.pdf, http://www.ohchr.org/Documents/Publications/
OHCHR_ExtremePovertyandHumanRights_EN.pdf.
Social protection for older persons: Key policy trends and statistics 45
UN. 2013. Economic and social survey of Asia and the Pacific 2013: Forward-looking
macroeconomic policies for inclusive and sustainable development (Bangkok, UN
Economic and Social Commission for Asia and the Pacific). Available at:
http://www.unescap.org/publications/survey/surveys/survey2013.pdf [20 Apr. 2014].
UNDP; RCPAR (Regional Centre for Public Administration Reform). 2011. Economic
crisis responses from a governance perspective in Eastern Europe and Central Asia:
Regional report (New York and Bratislava). Available at:
http://www.rcpar.org/contents_en.asp?id=475 [20 Apr. 2014].
UNFPA (United Nations Population Fund); HelpAge International. 2012. Ageing in the
twenty-first century: A celebration and a challenge (New York and London).
Available at: http://www.helpage.org/resources/ageing-in-the-21st-century-a-
celebration-and-achallenge/ [20 Apr. 2014].
UNRISD (United Nations Research Institute for Social Development). 2010. Combating
poverty and inequality: Structural change, social policy and politics (Geneva).
Available at: http://www.unrisd.org/publications/cpi [20 Apr. 2014].
Vaughan-Whitehead, D. 2013. Public sector shock: The impact of policy retrenchment in
Europe (Geneva and Cheltenham, ILO and Edward Elgar).
Whitehouse, E. 2012. Adequacy (1): Pension entitlements, replacement rates and pension
wealth, World Bank Pension Indicators and Database Briefing No. 3 (Washington,
DC, World Bank). Available at: http://www-wds.worldbank.org/external/
default/WDSContentServer/WDSP/IB/2012/06/30/000426104_20120630145406/Ren
dered/PDF/703490BRI0P109070036B00PUBLIC00NC03.pdf [20 Apr. 2014].
Woodall, J.; Hagemejer, K. 2009. How can we maintain pension levels in pay-as-you-go
schemes? Maintaining pension levels in PAYG schemes in ageing societies: Rules
versus discretion, International Social Security Association Technical Seminar on
Pensions, Paris, 1–2 Oct. 2009. Available at: http://www.ilo.org/secsoc/information-
resources/publications-andtools/articles/WCMS_SECSOC_32289/lang--en/index.htm
[20 Apr. 2014].

Social protection for older persons: Key policy trends and statistics 47
Annex I
Minimum requirements in ILO Social Security Standards: Overview table
ILO social security standards serve as key references, guiding all ILO policy and technical
advice in the field of social security. They also give meaning and definition to the content of the
right to social security as laid down in international human rights instruments (notably the Universal
Declaration of Human Rights, 1948, and the International Covenant on Economic, Social and
Cultural Rights, 1966), thereby constituting essential tools for the realization of this right and the
effective implementation of a rights-based approach to social protection.
The ILO’s normative social security framework consists of eight up-to-date Conventions and
Recommendations. The most prominent of these are the Social Security (Minimum Standards)
Convention, 1952 (No. 102), and the Social Protection Floors Recommendation, 2012 (No. 202).1
Convention No. 102 is unique among international standards in regrouping the nine classical social
security contingencies (medical care, sickness, unemployment, old age, employment injury, family
responsibilities, maternity, invalidity, survivorship) into a single comprehensive and legally binding
instrument. It sets qualitative and quantitative benchmarks for each of these contingencies, which
together determine the minimum standards of social security protection to be provided by social
security schemes with regard, inter alia, to:
■ definition of the contingency (what must be covered?)
■ persons protected (who must be covered?)
■ type and rate of benefits (what should be provided?)
■ entitlement conditions, including qualifying period (what should a person do to get the right to
a benefit?)
■ duration of benefit and waiting period (how long must the benefit be paid/provided for?)
In addition, it establishes common rules of collective organization, financing and
management, and lays down principles for good governance, including the general responsibility of
the State for the due provision of benefits and proper administration of social security systems,
participatory management, guarantee of defined benefits, adjustment of pensions, right of appeal
and complaint, collective financing and risk-pooling, and periodical actuarial valuations.
Convention No. 102 continues to serve as a yardstick and reference in the gradual development of
comprehensive social security coverage at the national level and as a means to prevent the levelling
down of social security systems worldwide, as confirmed by the International Labour Conference in
2011 (ILO, 2012a).
1 Convention No. 102 has been ratified to date by 50 countries, most recently by Brazil (2009),
Bulgaria (2008), Honduras (2012), Jordan (2014), Romania (2009) and Uruguay (2010), and
provides guidance for all 185 ILO member States. ILO Recommendations are not open for
ratification.
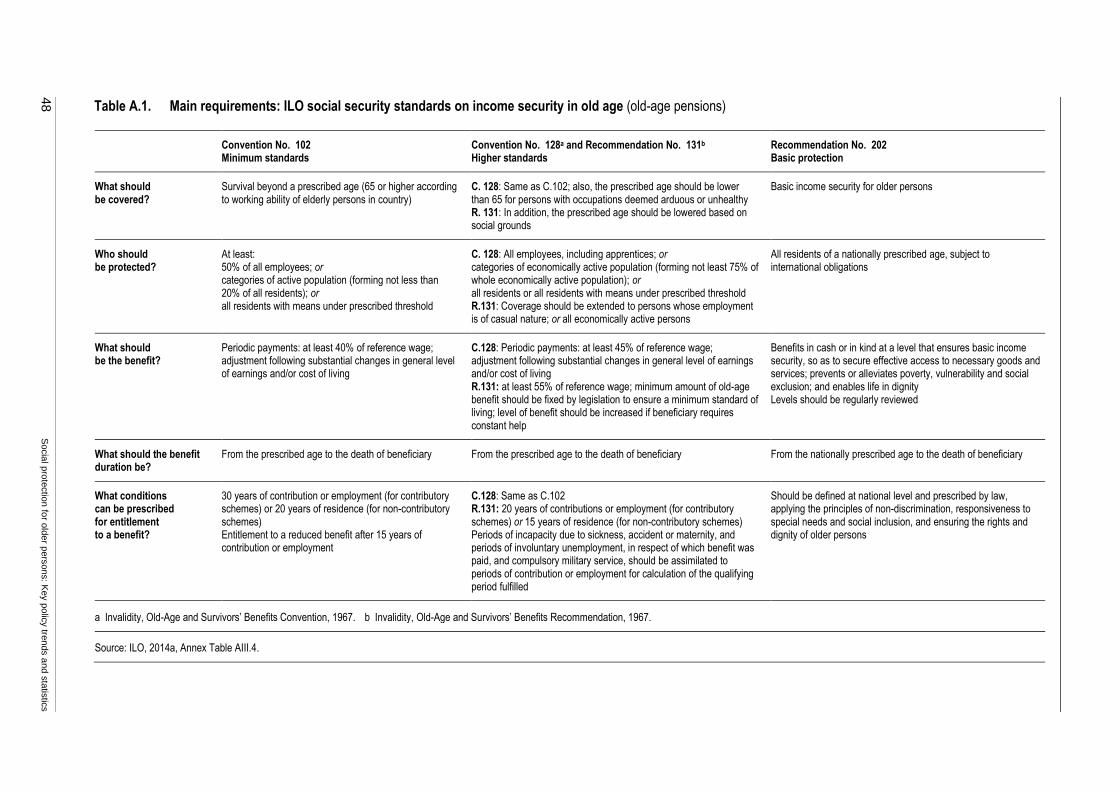
48
S
ocia
l pro
tectio
n fo
r old
er p
ers
ons: K
ey p
olic
y tre
nds a
nd s
tatis
tics
Table A.1. Main requirements: ILO social security standards on income security in old age (old-age pensions)
Convention No. 102 Minimum standards
Convention No. 128a and Recommendation No. 131b Higher standards
Recommendation No. 202 Basic protection
What should be covered?
Survival beyond a prescribed age (65 or higher according to working ability of elderly persons in country)
C. 128: Same as C.102; also, the prescribed age should be lower than 65 for persons with occupations deemed arduous or unhealthy R. 131: In addition, the prescribed age should be lowered based on social grounds
Basic income security for older persons
Who should be protected?
At least: 50% of all employees; or categories of active population (forming not less than 20% of all residents); or all residents with means under prescribed threshold
C. 128: All employees, including apprentices; or categories of economically active population (forming not least 75% of whole economically active population); or all residents or all residents with means under prescribed threshold R.131: Coverage should be extended to persons whose employment is of casual nature; or all economically active persons
All residents of a nationally prescribed age, subject to international obligations
What should be the benefit?
Periodic payments: at least 40% of reference wage; adjustment following substantial changes in general level of earnings and/or cost of living
C.128: Periodic payments: at least 45% of reference wage; adjustment following substantial changes in general level of earnings and/or cost of living R.131: at least 55% of reference wage; minimum amount of old-age benefit should be fixed by legislation to ensure a minimum standard of living; level of benefit should be increased if beneficiary requires constant help
Benefits in cash or in kind at a level that ensures basic income security, so as to secure effective access to necessary goods and services; prevents or alleviates poverty, vulnerability and social exclusion; and enables life in dignity Levels should be regularly reviewed
What should the benefit duration be?
From the prescribed age to the death of beneficiary From the prescribed age to the death of beneficiary From the nationally prescribed age to the death of beneficiary
What conditions can be prescribed for entitlement to a benefit?
30 years of contribution or employment (for contributory schemes) or 20 years of residence (for non-contributory schemes) Entitlement to a reduced benefit after 15 years of contribution or employment
C.128: Same as C.102 R.131: 20 years of contributions or employment (for contributory schemes) or 15 years of residence (for non-contributory schemes) Periods of incapacity due to sickness, accident or maternity, and periods of involuntary unemployment, in respect of which benefit was paid, and compulsory military service, should be assimilated to periods of contribution or employment for calculation of the qualifying period fulfilled
Should be defined at national level and prescribed by law, applying the principles of non-discrimination, responsiveness to special needs and social inclusion, and ensuring the rights and dignity of older persons
a Invalidity, Old-Age and Survivors’ Benefits Convention, 1967. b Invalidity, Old-Age and Survivors’ Benefits Recommendation, 1967.
Source: ILO, 2014a, Annex Table AIII.4.
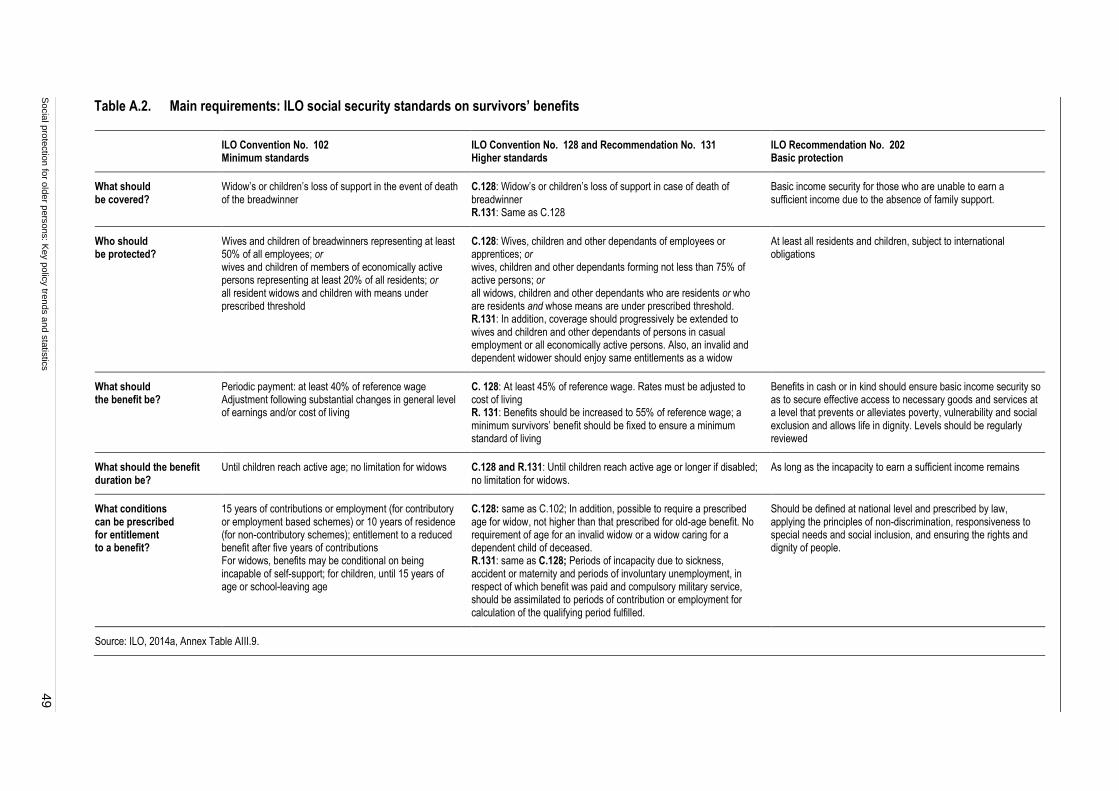
Socia
l pro
tectio
n fo
r old
er p
ers
ons: K
ey p
olic
y tre
nds a
nd s
tatis
tics
49
Table A.2. Main requirements: ILO social security standards on survivors’ benefits
ILO Convention No. 102 Minimum standards
ILO Convention No. 128 and Recommendation No. 131 Higher standards
ILO Recommendation No. 202 Basic protection
What should be covered?
Widow’s or children’s loss of support in the event of death of the breadwinner
C.128: Widow’s or children’s loss of support in case of death of breadwinner R.131: Same as C.128
Basic income security for those who are unable to earn a sufficient income due to the absence of family support.
Who should be protected?
Wives and children of breadwinners representing at least 50% of all employees; or wives and children of members of economically active persons representing at least 20% of all residents; or all resident widows and children with means under prescribed threshold
C.128: Wives, children and other dependants of employees or apprentices; or wives, children and other dependants forming not less than 75% of active persons; or all widows, children and other dependants who are residents or who are residents and whose means are under prescribed threshold. R.131: In addition, coverage should progressively be extended to wives and children and other dependants of persons in casual employment or all economically active persons. Also, an invalid and dependent widower should enjoy same entitlements as a widow
At least all residents and children, subject to international obligations
What should the benefit be?
Periodic payment: at least 40% of reference wage Adjustment following substantial changes in general level of earnings and/or cost of living
C. 128: At least 45% of reference wage. Rates must be adjusted to cost of living R. 131: Benefits should be increased to 55% of reference wage; a minimum survivors’ benefit should be fixed to ensure a minimum standard of living
Benefits in cash or in kind should ensure basic income security so as to secure effective access to necessary goods and services at a level that prevents or alleviates poverty, vulnerability and social exclusion and allows life in dignity. Levels should be regularly reviewed
What should the benefit duration be?
Until children reach active age; no limitation for widows C.128 and R.131: Until children reach active age or longer if disabled; no limitation for widows.
As long as the incapacity to earn a sufficient income remains
What conditions can be prescribed for entitlement to a benefit?
15 years of contributions or employment (for contributory or employment based schemes) or 10 years of residence (for non-contributory schemes); entitlement to a reduced benefit after five years of contributions For widows, benefits may be conditional on being incapable of self-support; for children, until 15 years of age or school-leaving age
C.128: same as C.102; In addition, possible to require a prescribed age for widow, not higher than that prescribed for old-age benefit. No requirement of age for an invalid widow or a widow caring for a dependent child of deceased. R.131: same as C.128; Periods of incapacity due to sickness, accident or maternity and periods of involuntary unemployment, in respect of which benefit was paid and compulsory military service, should be assimilated to periods of contribution or employment for calculation of the qualifying period fulfilled.
Should be defined at national level and prescribed by law, applying the principles of non-discrimination, responsiveness to special needs and social inclusion, and ensuring the rights and dignity of people.
Source: ILO, 2014a, Annex Table AIII.9.
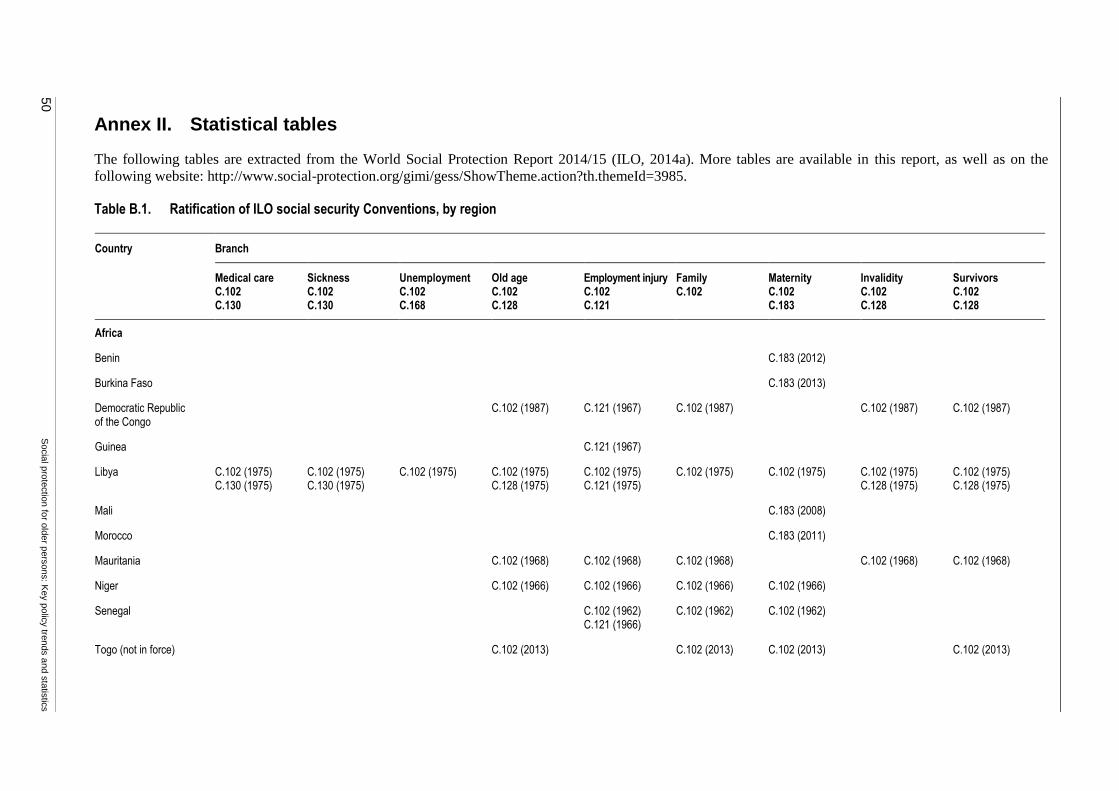
50
S
ocia
l pro
tectio
n fo
r old
er p
ers
ons: K
ey p
olic
y tre
nds a
nd s
tatis
tics
Annex II. Statistical tables
The following tables are extracted from the World Social Protection Report 2014/15 (ILO, 2014a). More tables are available in this report, as well as on the
following website: http://www.social-protection.org/gimi/gess/ShowTheme.action?th.themeId=3985.
Table B.1. Ratification of ILO social security Conventions, by region
Country Branch
Medical care C.102 C.130
Sickness C.102 C.130
Unemployment C.102 C.168
Old age C.102 C.128
Employment injury C.102 C.121
Family C.102
Maternity C.102 C.183
Invalidity C.102 C.128
Survivors C.102 C.128
Africa
Benin C.183 (2012)
Burkina Faso C.183 (2013)
Democratic Republic of the Congo
C.102 (1987) C.121 (1967) C.102 (1987) C.102 (1987) C.102 (1987)
Guinea C.121 (1967)
Libya C.102 (1975) C.130 (1975)
C.102 (1975) C.130 (1975)
C.102 (1975) C.102 (1975) C.128 (1975)
C.102 (1975) C.121 (1975)
C.102 (1975) C.102 (1975) C.102 (1975) C.128 (1975)
C.102 (1975) C.128 (1975)
Mali C.183 (2008)
Morocco C.183 (2011)
Mauritania C.102 (1968) C.102 (1968) C.102 (1968) C.102 (1968) C.102 (1968)
Niger C.102 (1966) C.102 (1966) C.102 (1966) C.102 (1966)
Senegal C.102 (1962) C.121 (1966)
C.102 (1962) C.102 (1962)
Togo (not in force) C.102 (2013) C.102 (2013) C.102 (2013) C.102 (2013)
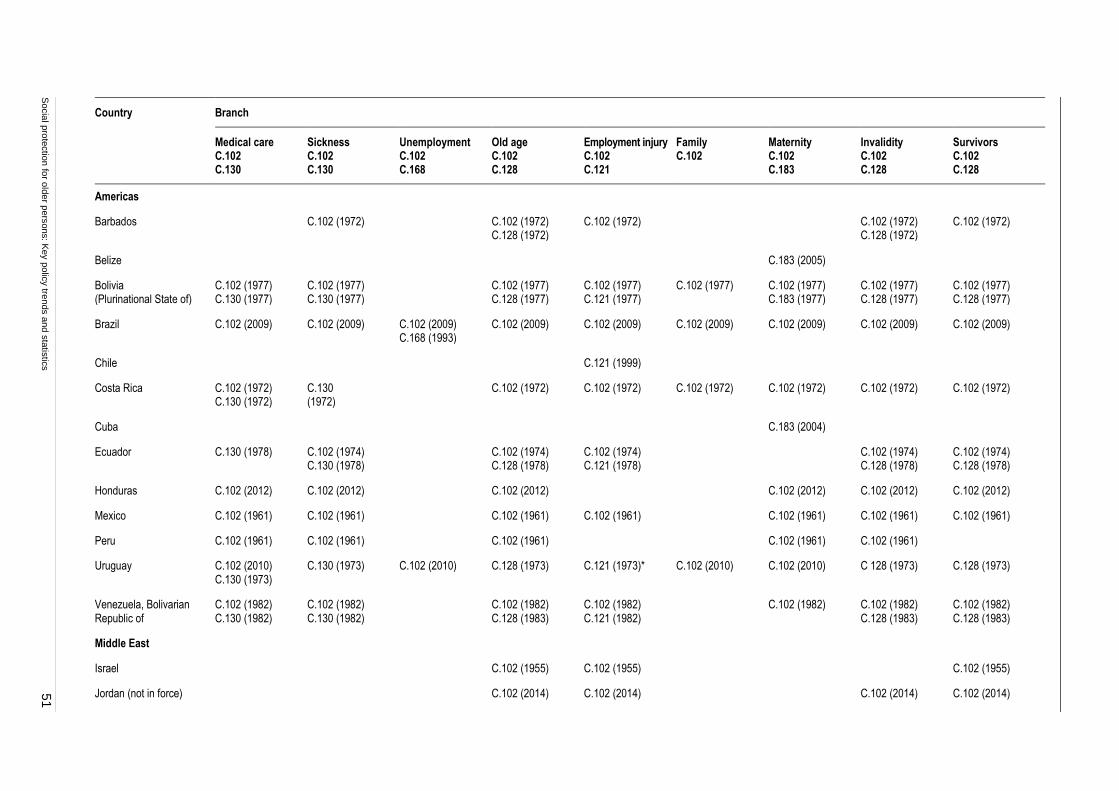
Socia
l pro
tectio
n fo
r old
er p
ers
ons: K
ey p
olic
y tre
nds a
nd s
tatis
tics
51
Country Branch
Medical care C.102 C.130
Sickness C.102 C.130
Unemployment C.102 C.168
Old age C.102 C.128
Employment injury C.102 C.121
Family C.102
Maternity C.102 C.183
Invalidity C.102 C.128
Survivors C.102 C.128
Americas
Barbados C.102 (1972) C.102 (1972) C.128 (1972)
C.102 (1972) C.102 (1972) C.128 (1972)
C.102 (1972)
Belize C.183 (2005)
Bolivia (Plurinational State of)
C.102 (1977) C.130 (1977)
C.102 (1977) C.130 (1977)
C.102 (1977) C.128 (1977)
C.102 (1977) C.121 (1977)
C.102 (1977) C.102 (1977) C.183 (1977)
C.102 (1977) C.128 (1977)
C.102 (1977) C.128 (1977)
Brazil C.102 (2009) C.102 (2009) C.102 (2009) C.168 (1993)
C.102 (2009) C.102 (2009) C.102 (2009) C.102 (2009) C.102 (2009) C.102 (2009)
Chile C.121 (1999)
Costa Rica C.102 (1972) C.130 (1972)
C.130 (1972)
C.102 (1972) C.102 (1972) C.102 (1972) C.102 (1972) C.102 (1972) C.102 (1972)
Cuba C.183 (2004)
Ecuador C.130 (1978) C.102 (1974) C.130 (1978)
C.102 (1974) C.128 (1978)
C.102 (1974) C.121 (1978)
C.102 (1974) C.128 (1978)
C.102 (1974) C.128 (1978)
Honduras C.102 (2012) C.102 (2012) C.102 (2012) C.102 (2012) C.102 (2012) C.102 (2012)
Mexico C.102 (1961) C.102 (1961) C.102 (1961) C.102 (1961) C.102 (1961) C.102 (1961) C.102 (1961)
Peru C.102 (1961) C.102 (1961) C.102 (1961) C.102 (1961) C.102 (1961)
Uruguay C.102 (2010) C.130 (1973)
C.130 (1973) C.102 (2010) C.128 (1973) C.121 (1973)* C.102 (2010) C.102 (2010) C 128 (1973) C.128 (1973)
Venezuela, Bolivarian Republic of
C.102 (1982) C.130 (1982)
C.102 (1982) C.130 (1982)
C.102 (1982) C.128 (1983)
C.102 (1982) C.121 (1982)
C.102 (1982) C.102 (1982) C.128 (1983)
C.102 (1982) C.128 (1983)
Middle East
Israel C.102 (1955) C.102 (1955) C.102 (1955)
Jordan (not in force) C.102 (2014) C.102 (2014) C.102 (2014) C.102 (2014)
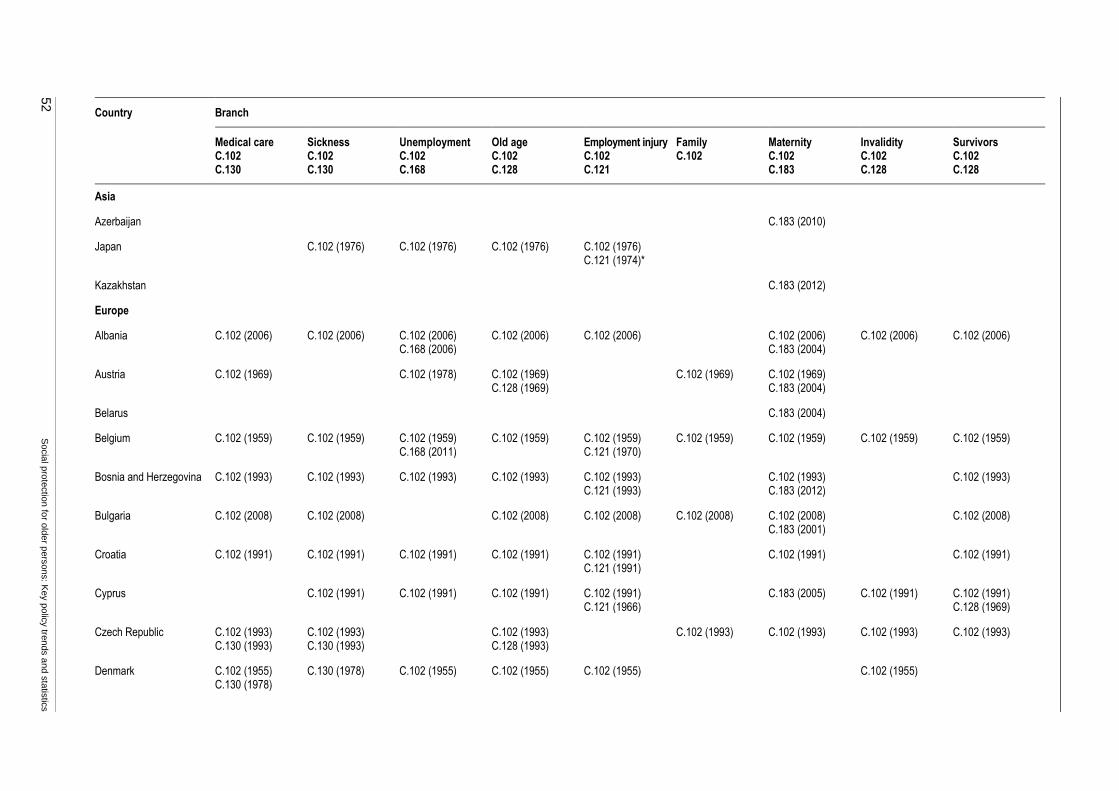
52
S
ocia
l pro
tectio
n fo
r old
er p
ers
ons: K
ey p
olic
y tre
nds a
nd s
tatis
tics
Country Branch
Medical care C.102 C.130
Sickness C.102 C.130
Unemployment C.102 C.168
Old age C.102 C.128
Employment injury C.102 C.121
Family C.102
Maternity C.102 C.183
Invalidity C.102 C.128
Survivors C.102 C.128
Asia
Azerbaijan C.183 (2010)
Japan C.102 (1976) C.102 (1976) C.102 (1976) C.102 (1976) C.121 (1974)*
Kazakhstan C.183 (2012)
Europe
Albania C.102 (2006) C.102 (2006) C.102 (2006) C.168 (2006)
C.102 (2006) C.102 (2006) C.102 (2006) C.183 (2004)
C.102 (2006) C.102 (2006)
Austria C.102 (1969) C.102 (1978) C.102 (1969) C.128 (1969)
C.102 (1969) C.102 (1969) C.183 (2004)
Belarus C.183 (2004)
Belgium C.102 (1959) C.102 (1959) C.102 (1959) C.168 (2011)
C.102 (1959) C.102 (1959) C.121 (1970)
C.102 (1959) C.102 (1959) C.102 (1959) C.102 (1959)
Bosnia and Herzegovina C.102 (1993) C.102 (1993) C.102 (1993) C.102 (1993) C.102 (1993) C.121 (1993)
C.102 (1993) C.183 (2012)
C.102 (1993)
Bulgaria C.102 (2008) C.102 (2008) C.102 (2008) C.102 (2008) C.102 (2008) C.102 (2008) C.183 (2001)
C.102 (2008)
Croatia C.102 (1991) C.102 (1991) C.102 (1991) C.102 (1991) C.102 (1991) C.121 (1991)
C.102 (1991) C.102 (1991)
Cyprus C.102 (1991) C.102 (1991) C.102 (1991) C.102 (1991) C.121 (1966)
C.183 (2005) C.102 (1991) C.102 (1991) C.128 (1969)
Czech Republic C.102 (1993) C.130 (1993)
C.102 (1993) C.130 (1993)
C.102 (1993) C.128 (1993)
C.102 (1993) C.102 (1993) C.102 (1993)
C.102 (1993)
Denmark C.102 (1955) C.130 (1978)
C.130 (1978) C.102 (1955) C.102 (1955) C.102 (1955) C.102 (1955)
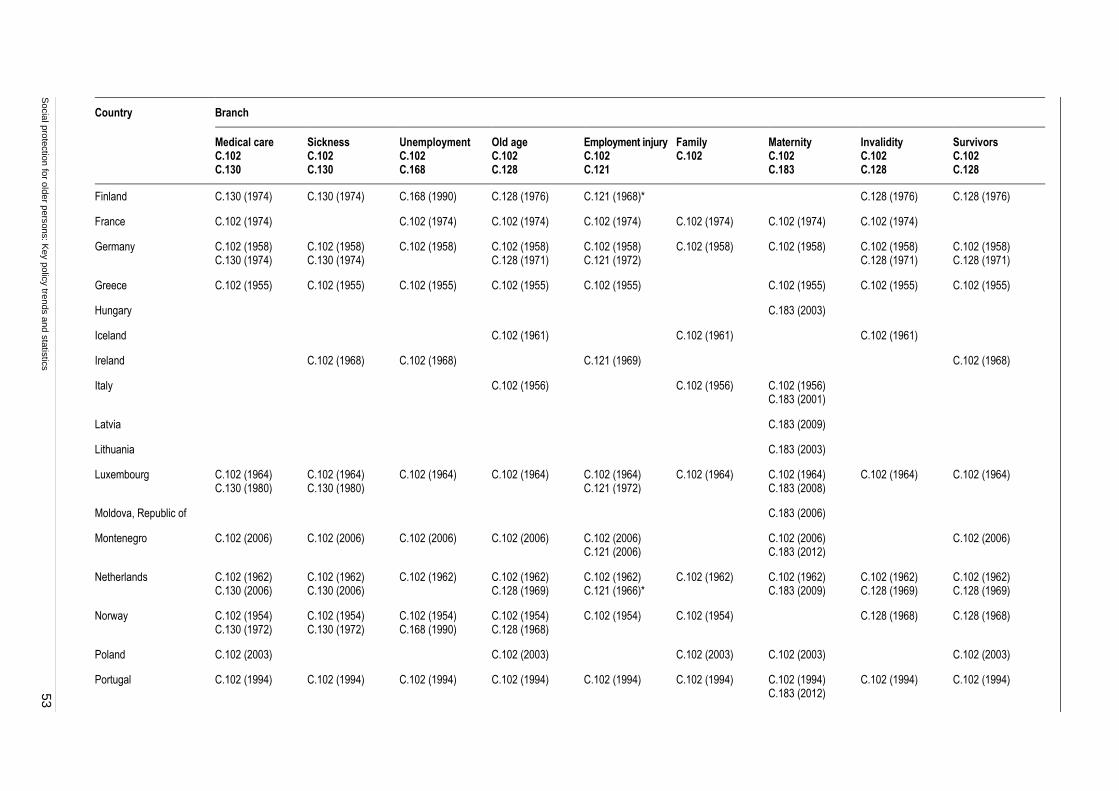
Socia
l pro
tectio
n fo
r old
er p
ers
ons: K
ey p
olic
y tre
nds a
nd s
tatis
tics
53
Country Branch
Medical care C.102 C.130
Sickness C.102 C.130
Unemployment C.102 C.168
Old age C.102 C.128
Employment injury C.102 C.121
Family C.102
Maternity C.102 C.183
Invalidity C.102 C.128
Survivors C.102 C.128
Finland C.130 (1974) C.130 (1974) C.168 (1990) C.128 (1976) C.121 (1968)* C.128 (1976) C.128 (1976)
France C.102 (1974) C.102 (1974) C.102 (1974) C.102 (1974) C.102 (1974) C.102 (1974) C.102 (1974)
Germany C.102 (1958) C.130 (1974)
C.102 (1958) C.130 (1974)
C.102 (1958) C.102 (1958) C.128 (1971)
C.102 (1958) C.121 (1972)
C.102 (1958) C.102 (1958) C.102 (1958) C.128 (1971)
C.102 (1958) C.128 (1971)
Greece C.102 (1955) C.102 (1955) C.102 (1955) C.102 (1955) C.102 (1955) C.102 (1955) C.102 (1955) C.102 (1955)
Hungary C.183 (2003)
Iceland C.102 (1961) C.102 (1961) C.102 (1961)
Ireland C.102 (1968) C.102 (1968) C.121 (1969) C.102 (1968)
Italy C.102 (1956) C.102 (1956) C.102 (1956) C.183 (2001)
Latvia C.183 (2009)
Lithuania C.183 (2003)
Luxembourg C.102 (1964) C.130 (1980)
C.102 (1964) C.130 (1980)
C.102 (1964) C.102 (1964) C.102 (1964) C.121 (1972)
C.102 (1964) C.102 (1964) C.183 (2008)
C.102 (1964) C.102 (1964)
Moldova, Republic of C.183 (2006)
Montenegro C.102 (2006) C.102 (2006) C.102 (2006) C.102 (2006) C.102 (2006) C.121 (2006)
C.102 (2006) C.183 (2012)
C.102 (2006)
Netherlands C.102 (1962) C.130 (2006)
C.102 (1962) C.130 (2006)
C.102 (1962) C.102 (1962) C.128 (1969)
C.102 (1962) C.121 (1966)*
C.102 (1962) C.102 (1962) C.183 (2009)
C.102 (1962) C.128 (1969)
C.102 (1962) C.128 (1969)
Norway C.102 (1954) C.130 (1972)
C.102 (1954) C.130 (1972)
C.102 (1954) C.168 (1990)
C.102 (1954) C.128 (1968)
C.102 (1954) C.102 (1954) C.128 (1968) C.128 (1968)
Poland C.102 (2003) C.102 (2003) C.102 (2003) C.102 (2003) C.102 (2003)
Portugal C.102 (1994) C.102 (1994) C.102 (1994) C.102 (1994) C.102 (1994) C.102 (1994) C.102 (1994) C.183 (2012)
C.102 (1994) C.102 (1994)
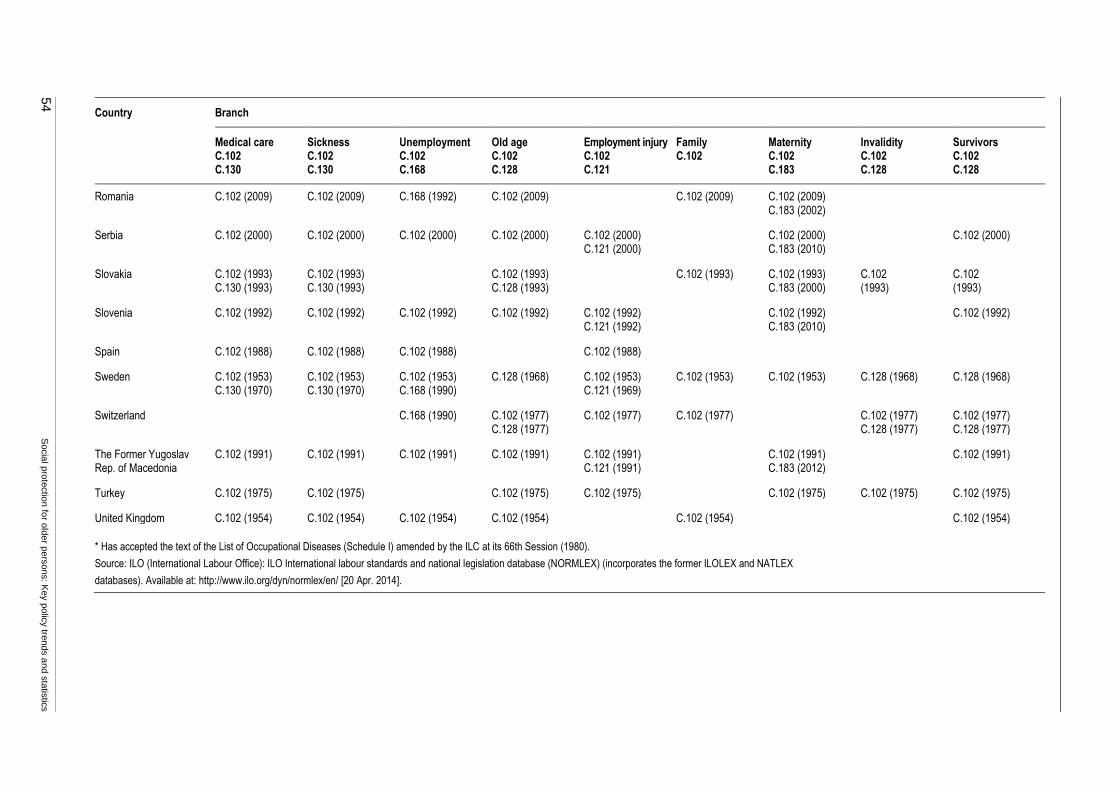
54
S
ocia
l pro
tectio
n fo
r old
er p
ers
ons: K
ey p
olic
y tre
nds a
nd s
tatis
tics
Country Branch
Medical care C.102 C.130
Sickness C.102 C.130
Unemployment C.102 C.168
Old age C.102 C.128
Employment injury C.102 C.121
Family C.102
Maternity C.102 C.183
Invalidity C.102 C.128
Survivors C.102 C.128
Romania C.102 (2009) C.102 (2009) C.168 (1992) C.102 (2009) C.102 (2009) C.102 (2009) C.183 (2002)
Serbia C.102 (2000) C.102 (2000) C.102 (2000) C.102 (2000) C.102 (2000) C.121 (2000)
C.102 (2000) C.183 (2010)
C.102 (2000)
Slovakia C.102 (1993) C.130 (1993)
C.102 (1993) C.130 (1993)
C.102 (1993) C.128 (1993)
C.102 (1993) C.102 (1993) C.183 (2000)
C.102 (1993)
C.102 (1993)
Slovenia C.102 (1992) C.102 (1992) C.102 (1992) C.102 (1992) C.102 (1992) C.121 (1992)
C.102 (1992) C.183 (2010)
C.102 (1992)
Spain C.102 (1988) C.102 (1988) C.102 (1988) C.102 (1988)
Sweden C.102 (1953) C.130 (1970)
C.102 (1953) C.130 (1970)
C.102 (1953) C.168 (1990)
C.128 (1968) C.102 (1953) C.121 (1969)
C.102 (1953) C.102 (1953) C.128 (1968) C.128 (1968)
Switzerland C.168 (1990) C.102 (1977) C.128 (1977)
C.102 (1977) C.102 (1977) C.102 (1977) C.128 (1977)
C.102 (1977) C.128 (1977)
The Former Yugoslav Rep. of Macedonia
C.102 (1991) C.102 (1991) C.102 (1991) C.102 (1991) C.102 (1991) C.121 (1991)
C.102 (1991) C.183 (2012)
C.102 (1991)
Turkey C.102 (1975) C.102 (1975) C.102 (1975) C.102 (1975) C.102 (1975) C.102 (1975) C.102 (1975)
United Kingdom C.102 (1954) C.102 (1954) C.102 (1954) C.102 (1954) C.102 (1954) C.102 (1954)
* Has accepted the text of the List of Occupational Diseases (Schedule I) amended by the ILC at its 66th Session (1980).
Source: ILO (International Labour Office): ILO International labour standards and national legislation database (NORMLEX) (incorporates the former ILOLEX and NATLEX
databases). Available at: http://www.ilo.org/dyn/normlex/en/ [20 Apr. 2014].
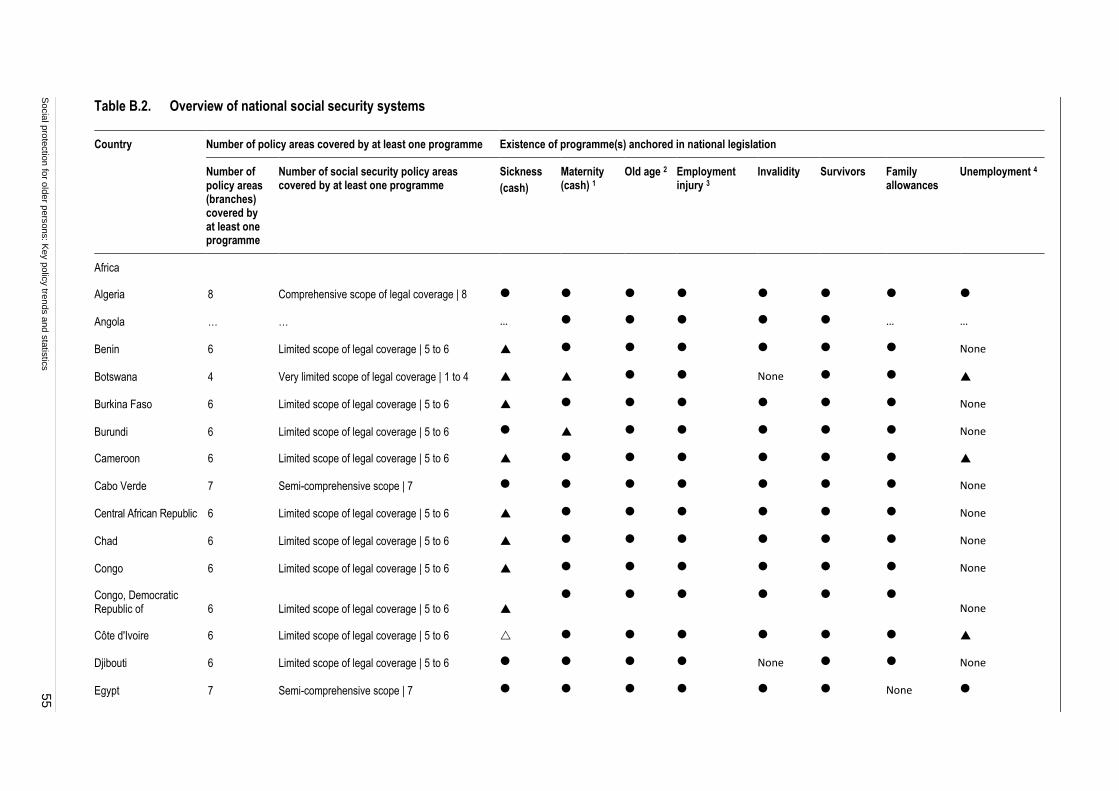
Socia
l pro
tectio
n fo
r old
er p
ers
ons: K
ey p
olic
y tre
nds a
nd s
tatis
tics
55
Table B.2. Overview of national social security systems
Country Number of policy areas covered by at least one programme Existence of programme(s) anchored in national legislation
Number of policy areas (branches) covered by at least one programme
Number of social security policy areas covered by at least one programme
Sickness
(cash)
Maternity (cash) 1
Old age 2 Employment injury 3
Invalidity Survivors Family allowances
Unemployment 4
Africa
Algeria 8 Comprehensive scope of legal coverage | 8
Angola … … … … …
Benin 6 Limited scope of legal coverage | 5 to 6 None
Botswana 4 Very limited scope of legal coverage | 1 to 4 None
Burkina Faso 6 Limited scope of legal coverage | 5 to 6 None
Burundi 6 Limited scope of legal coverage | 5 to 6 None
Cameroon 6 Limited scope of legal coverage | 5 to 6
Cabo Verde 7 Semi-comprehensive scope | 7 None
Central African Republic 6 Limited scope of legal coverage | 5 to 6 None
Chad 6 Limited scope of legal coverage | 5 to 6 None
Congo 6 Limited scope of legal coverage | 5 to 6 None
Congo, Democratic Republic of 6 Limited scope of legal coverage | 5 to 6
None
Côte d'Ivoire 6 Limited scope of legal coverage | 5 to 6
Djibouti 6 Limited scope of legal coverage | 5 to 6 None None
Egypt 7 Semi-comprehensive scope | 7 None
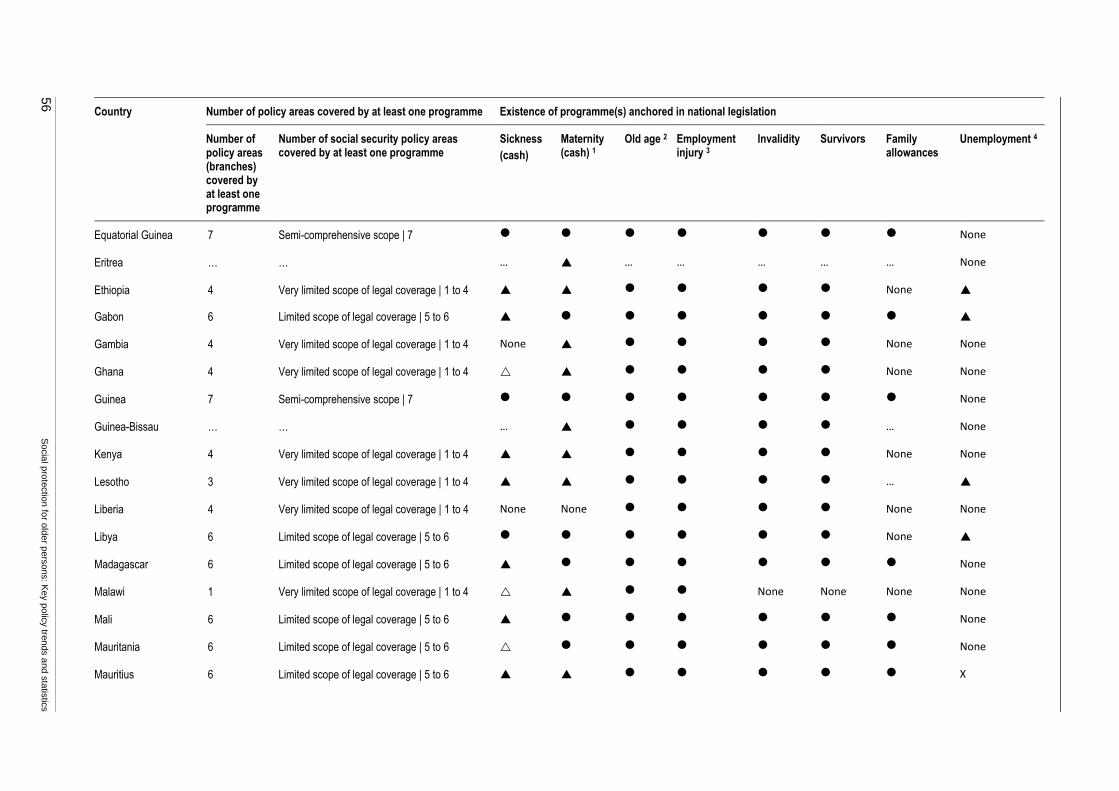
56
S
ocia
l pro
tectio
n fo
r old
er p
ers
ons: K
ey p
olic
y tre
nds a
nd s
tatis
tics
Country Number of policy areas covered by at least one programme Existence of programme(s) anchored in national legislation
Number of policy areas (branches) covered by at least one programme
Number of social security policy areas covered by at least one programme
Sickness
(cash)
Maternity (cash) 1
Old age 2 Employment injury 3
Invalidity Survivors Family allowances
Unemployment 4
Equatorial Guinea 7 Semi-comprehensive scope | 7 None
Eritrea … … … … … … … … None
Ethiopia 4 Very limited scope of legal coverage | 1 to 4 None
Gabon 6 Limited scope of legal coverage | 5 to 6
Gambia 4 Very limited scope of legal coverage | 1 to 4 None None None
Ghana 4 Very limited scope of legal coverage | 1 to 4 None None
Guinea 7 Semi-comprehensive scope | 7 None
Guinea-Bissau … … … … None
Kenya 4 Very limited scope of legal coverage | 1 to 4 None None
Lesotho 3 Very limited scope of legal coverage | 1 to 4 …
Liberia 4 Very limited scope of legal coverage | 1 to 4 None None None None
Libya 6 Limited scope of legal coverage | 5 to 6 None
Madagascar 6 Limited scope of legal coverage | 5 to 6 None
Malawi 1 Very limited scope of legal coverage | 1 to 4 None None None None
Mali 6 Limited scope of legal coverage | 5 to 6 None
Mauritania 6 Limited scope of legal coverage | 5 to 6 None
Mauritius 6 Limited scope of legal coverage | 5 to 6 X
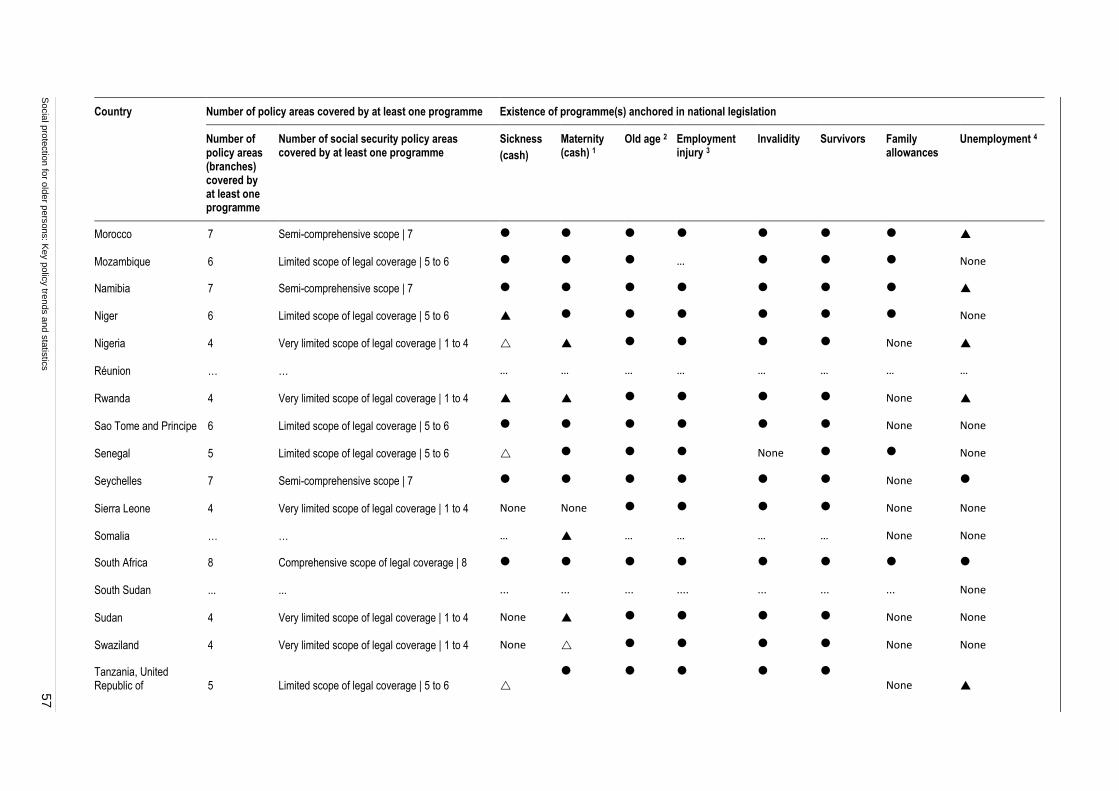
Socia
l pro
tectio
n fo
r old
er p
ers
ons: K
ey p
olic
y tre
nds a
nd s
tatis
tics
57
Country Number of policy areas covered by at least one programme Existence of programme(s) anchored in national legislation
Number of policy areas (branches) covered by at least one programme
Number of social security policy areas covered by at least one programme
Sickness
(cash)
Maternity (cash) 1
Old age 2 Employment injury 3
Invalidity Survivors Family allowances
Unemployment 4
Morocco 7 Semi-comprehensive scope | 7
Mozambique 6 Limited scope of legal coverage | 5 to 6 … None
Namibia 7 Semi-comprehensive scope | 7
Niger 6 Limited scope of legal coverage | 5 to 6 None
Nigeria 4 Very limited scope of legal coverage | 1 to 4 None
Réunion … … … … … … … … … …
Rwanda 4 Very limited scope of legal coverage | 1 to 4 None
Sao Tome and Principe 6 Limited scope of legal coverage | 5 to 6 None None
Senegal 5 Limited scope of legal coverage | 5 to 6 None None
Seychelles 7 Semi-comprehensive scope | 7 None
Sierra Leone 4 Very limited scope of legal coverage | 1 to 4 None None None None
Somalia … … … … … … … None None
South Africa 8 Comprehensive scope of legal coverage | 8
South Sudan ... ... ... ... ... .... ... ... ... None
Sudan 4 Very limited scope of legal coverage | 1 to 4 None None None
Swaziland 4 Very limited scope of legal coverage | 1 to 4 None None None
Tanzania, United Republic of 5 Limited scope of legal coverage | 5 to 6
None

58
S
ocia
l pro
tectio
n fo
r old
er p
ers
ons: K
ey p
olic
y tre
nds a
nd s
tatis
tics
Country Number of policy areas covered by at least one programme Existence of programme(s) anchored in national legislation
Number of policy areas (branches) covered by at least one programme
Number of social security policy areas covered by at least one programme
Sickness
(cash)
Maternity (cash) 1
Old age 2 Employment injury 3
Invalidity Survivors Family allowances
Unemployment 4
Togo 6 Limited scope of legal coverage | 5 to 6 None
Tunisia 8 Comprehensive scope of legal coverage | 8
Uganda 4 Very limited scope of legal coverage | 1 to 4 None
Zambia 4 Very limited scope of legal coverage | 1 to 4 None None None
Zimbabwe 4 Very limited scope of legal coverage | 1 to 4 None None None
Asia
Afghanistan … … … … … … … … None
Armenia 8 Comprehensive scope of legal coverage | 8
Azerbaijan 8 Comprehensive scope of legal coverage | 8
Bahrain 5 Limited statutory provision | 5 to 6 None None
Bangladesh 4 Very limited scope of legal coverage | 1 to 4 None None None
Bhutan … … … … … None
Brunei Darussalam 4 Very limited scope of legal coverage | 1 to 4 None None
Cambodia … … … … … … … …
China 8 Comprehensive scope of legal coverage | 8
Georgia 7 Semi-comprehensive scope | 7
Hong Kong, China 8 Comprehensive scope of legal coverage | 8
India 7 Semi-comprehensive scope | 7 None

Socia
l pro
tectio
n fo
r old
er p
ers
ons: K
ey p
olic
y tre
nds a
nd s
tatis
tics
59
Country Number of policy areas covered by at least one programme Existence of programme(s) anchored in national legislation
Number of policy areas (branches) covered by at least one programme
Number of social security policy areas covered by at least one programme
Sickness
(cash)
Maternity (cash) 1
Old age 2 Employment injury 3
Invalidity Survivors Family allowances
Unemployment 4
Indonesia 4 Very limited scope of legal coverage | 1 to 4 None
Iran, Islamic Rep. of 8 Comprehensive scope of legal coverage | 8
Iraq … … … … … … … … None
Israel 8 Comprehensive scope of legal coverage | 8
Japan 8 Comprehensive scope of legal coverage | 8
Jordan 6 Limited scope of legal coverage | 5 to 6 None
Kazakhstan 8 Comprehensive scope of legal coverage | 8
Korea, Dem. People's Rep. of … … … … … … … … … None
Korea, Republic of 5 Limited scope of legal coverage | 5 to 6 None
Kuwait 4 Very limited scope of legal coverage | 1 to 4 . None None
Kyrgyzstan 8 Comprehensive scope of legal coverage | 8
Lao People's Dem. Rep. 6 Limited scope of legal coverage | 5 to 6 None None
Lebanon 6 Limited scope of legal coverage | 5 to 6 None
Macau, China … … … … … … … … … …
Malaysia 4 Very limited scope of legal coverage | 1 to 4 None
Maldives … … … … … None
Mongolia 8 Comprehensive scope of legal coverage | 8
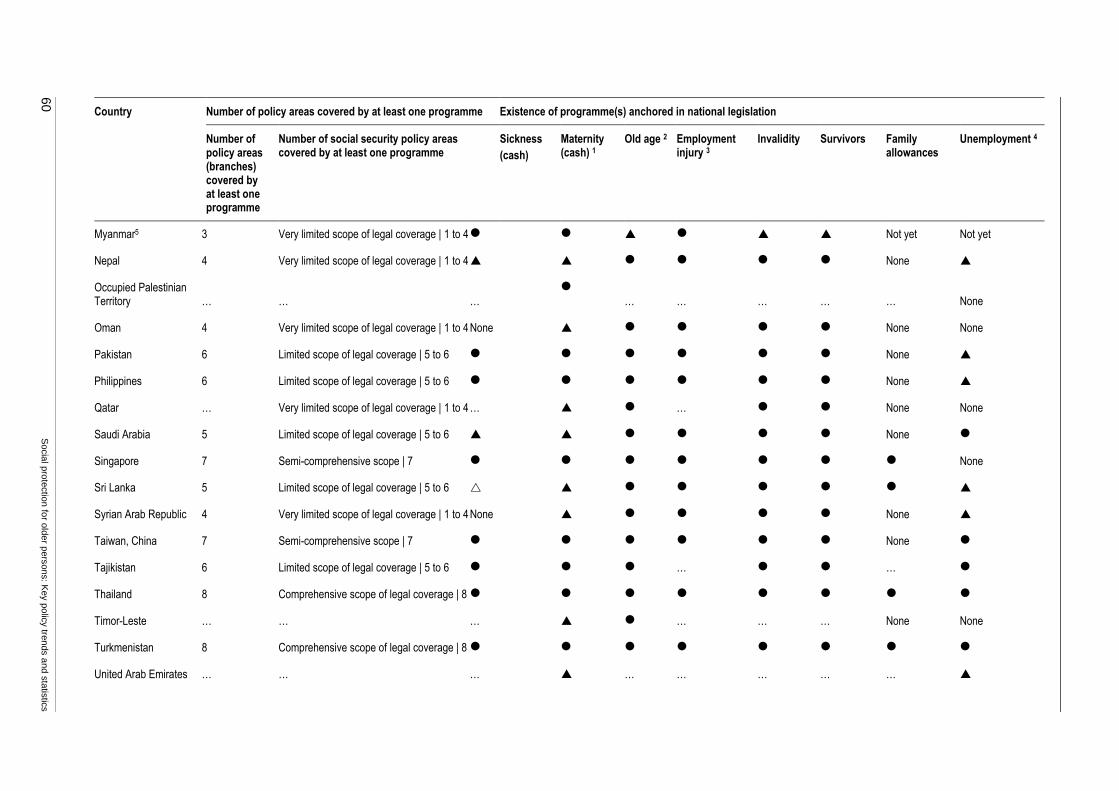
60
S
ocia
l pro
tectio
n fo
r old
er p
ers
ons: K
ey p
olic
y tre
nds a
nd s
tatis
tics
Country Number of policy areas covered by at least one programme Existence of programme(s) anchored in national legislation
Number of policy areas (branches) covered by at least one programme
Number of social security policy areas covered by at least one programme
Sickness
(cash)
Maternity (cash) 1
Old age 2 Employment injury 3
Invalidity Survivors Family allowances
Unemployment 4
Myanmar5 3 Very limited scope of legal coverage | 1 to 4 Not yet Not yet
Nepal 4 Very limited scope of legal coverage | 1 to 4 None
Occupied Palestinian Territory … … …
… … … … … None
Oman 4 Very limited scope of legal coverage | 1 to 4 None None None
Pakistan 6 Limited scope of legal coverage | 5 to 6 None
Philippines 6 Limited scope of legal coverage | 5 to 6 None
Qatar … Very limited scope of legal coverage | 1 to 4 … … None None
Saudi Arabia 5 Limited scope of legal coverage | 5 to 6 None
Singapore 7 Semi-comprehensive scope | 7 None
Sri Lanka 5 Limited scope of legal coverage | 5 to 6
Syrian Arab Republic 4 Very limited scope of legal coverage | 1 to 4 None None
Taiwan, China 7 Semi-comprehensive scope | 7 None
Tajikistan 6 Limited scope of legal coverage | 5 to 6 … …
Thailand 8 Comprehensive scope of legal coverage | 8
Timor-Leste … … … … … … None None
Turkmenistan 8 Comprehensive scope of legal coverage | 8
United Arab Emirates … … … … … … … …
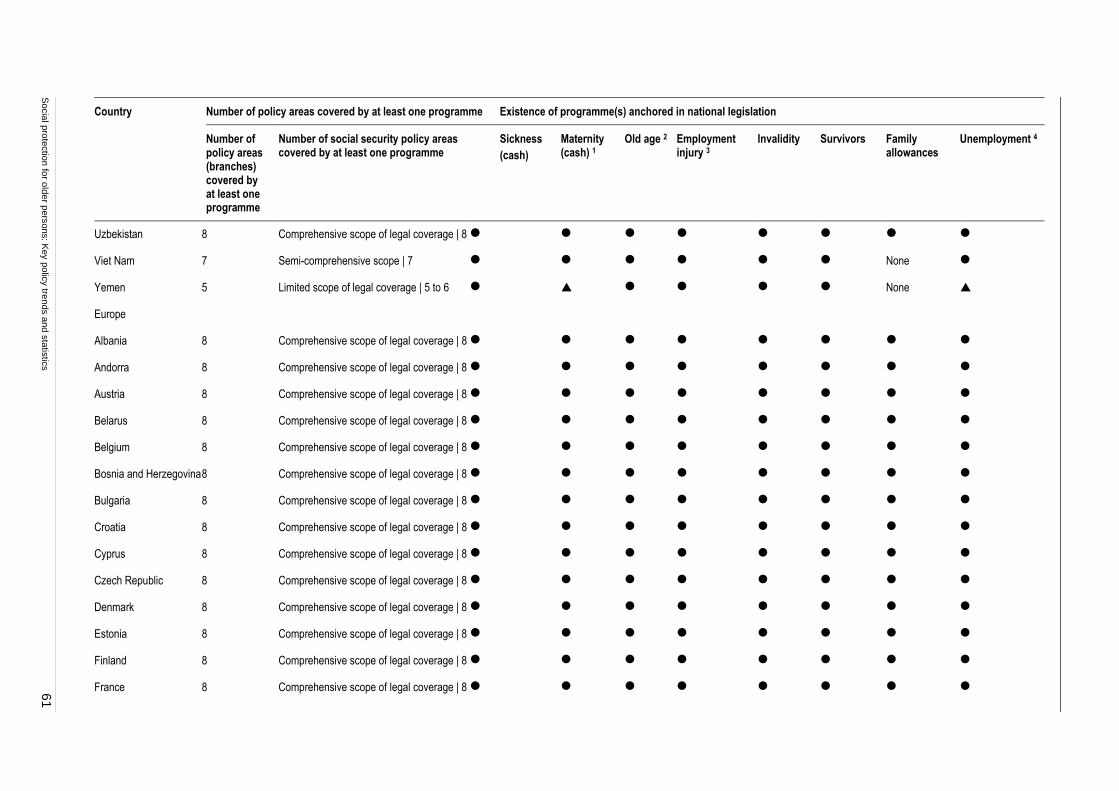
Socia
l pro
tectio
n fo
r old
er p
ers
ons: K
ey p
olic
y tre
nds a
nd s
tatis
tics
61
Country Number of policy areas covered by at least one programme Existence of programme(s) anchored in national legislation
Number of policy areas (branches) covered by at least one programme
Number of social security policy areas covered by at least one programme
Sickness
(cash)
Maternity (cash) 1
Old age 2 Employment injury 3
Invalidity Survivors Family allowances
Unemployment 4
Uzbekistan 8 Comprehensive scope of legal coverage | 8
Viet Nam 7 Semi-comprehensive scope | 7 None
Yemen 5 Limited scope of legal coverage | 5 to 6 None
Europe
Albania 8 Comprehensive scope of legal coverage | 8
Andorra 8 Comprehensive scope of legal coverage | 8
Austria 8 Comprehensive scope of legal coverage | 8
Belarus 8 Comprehensive scope of legal coverage | 8
Belgium 8 Comprehensive scope of legal coverage | 8
Bosnia and Herzegovina 8 Comprehensive scope of legal coverage | 8
Bulgaria 8 Comprehensive scope of legal coverage | 8
Croatia 8 Comprehensive scope of legal coverage | 8
Cyprus 8 Comprehensive scope of legal coverage | 8
Czech Republic 8 Comprehensive scope of legal coverage | 8
Denmark 8 Comprehensive scope of legal coverage | 8
Estonia 8 Comprehensive scope of legal coverage | 8
Finland 8 Comprehensive scope of legal coverage | 8
France 8 Comprehensive scope of legal coverage | 8

62
S
ocia
l pro
tectio
n fo
r old
er p
ers
ons: K
ey p
olic
y tre
nds a
nd s
tatis
tics
Country Number of policy areas covered by at least one programme Existence of programme(s) anchored in national legislation
Number of policy areas (branches) covered by at least one programme
Number of social security policy areas covered by at least one programme
Sickness
(cash)
Maternity (cash) 1
Old age 2 Employment injury 3
Invalidity Survivors Family allowances
Unemployment 4
Germany 8 Comprehensive scope of legal coverage | 8
Greece 8 Comprehensive scope of legal coverage | 8
Guernsey 8 Comprehensive scope of legal coverage | 8
Hungary 8 Comprehensive scope of legal coverage | 8
Iceland 8 Comprehensive scope of legal coverage | 8
Ireland 8 Comprehensive scope of legal coverage | 8
Isle of Man 8 Comprehensive scope of legal coverage | 8
Italy 8 Comprehensive scope of legal coverage | 8
Jersey 8 Comprehensive scope of legal coverage | 8
Kosovo 8 Comprehensive scope of legal coverage | 8
Latvia 8 Comprehensive scope of legal coverage | 8
Liechtenstein 8 Comprehensive scope of legal coverage | 8
Lithuania 8 Comprehensive scope of legal coverage | 8
Luxembourg 8 Comprehensive scope of legal coverage | 8
Malta 8 Comprehensive scope of legal coverage | 8
Moldova, Republic of 8 Comprehensive scope of legal coverage | 8
Monaco … …
Montenegro 8 Comprehensive scope of legal coverage | 8
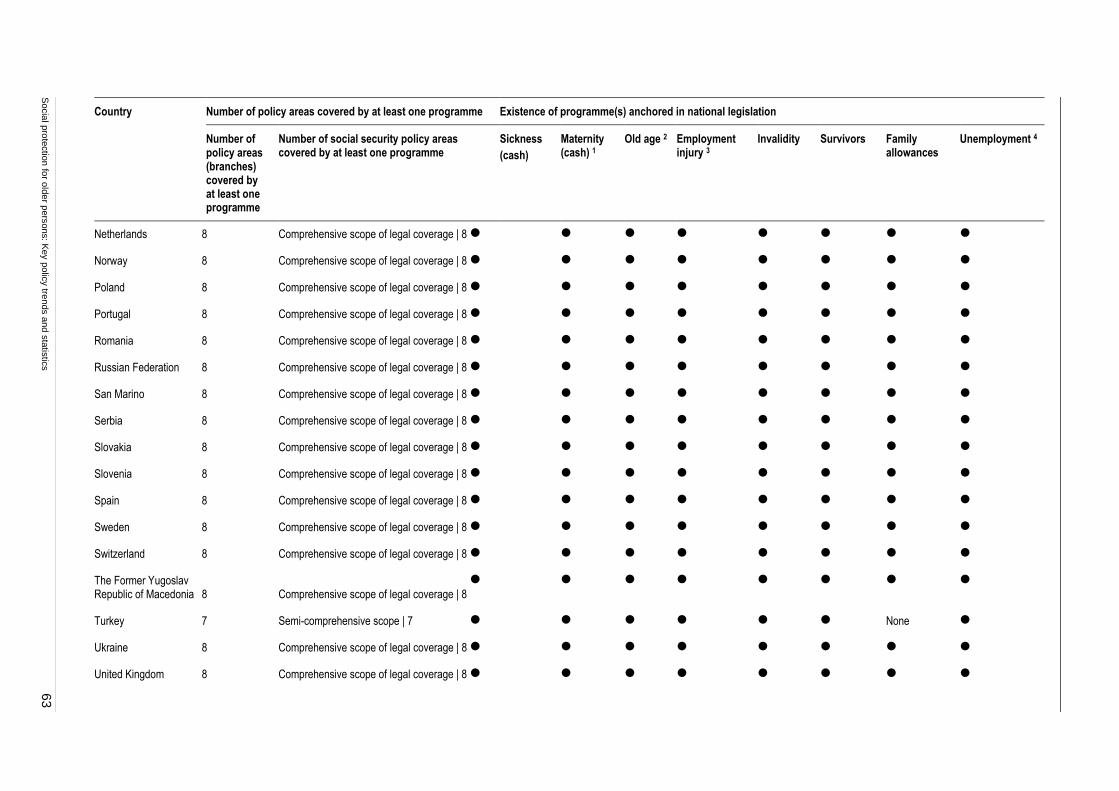
Socia
l pro
tectio
n fo
r old
er p
ers
ons: K
ey p
olic
y tre
nds a
nd s
tatis
tics
63
Country Number of policy areas covered by at least one programme Existence of programme(s) anchored in national legislation
Number of policy areas (branches) covered by at least one programme
Number of social security policy areas covered by at least one programme
Sickness
(cash)
Maternity (cash) 1
Old age 2 Employment injury 3
Invalidity Survivors Family allowances
Unemployment 4
Netherlands 8 Comprehensive scope of legal coverage | 8
Norway 8 Comprehensive scope of legal coverage | 8
Poland 8 Comprehensive scope of legal coverage | 8
Portugal 8 Comprehensive scope of legal coverage | 8
Romania 8 Comprehensive scope of legal coverage | 8
Russian Federation 8 Comprehensive scope of legal coverage | 8
San Marino 8 Comprehensive scope of legal coverage | 8
Serbia 8 Comprehensive scope of legal coverage | 8
Slovakia 8 Comprehensive scope of legal coverage | 8
Slovenia 8 Comprehensive scope of legal coverage | 8
Spain 8 Comprehensive scope of legal coverage | 8
Sweden 8 Comprehensive scope of legal coverage | 8
Switzerland 8 Comprehensive scope of legal coverage | 8
The Former Yugoslav Republic of Macedonia 8 Comprehensive scope of legal coverage | 8
Turkey 7 Semi-comprehensive scope | 7 None
Ukraine 8 Comprehensive scope of legal coverage | 8
United Kingdom 8 Comprehensive scope of legal coverage | 8
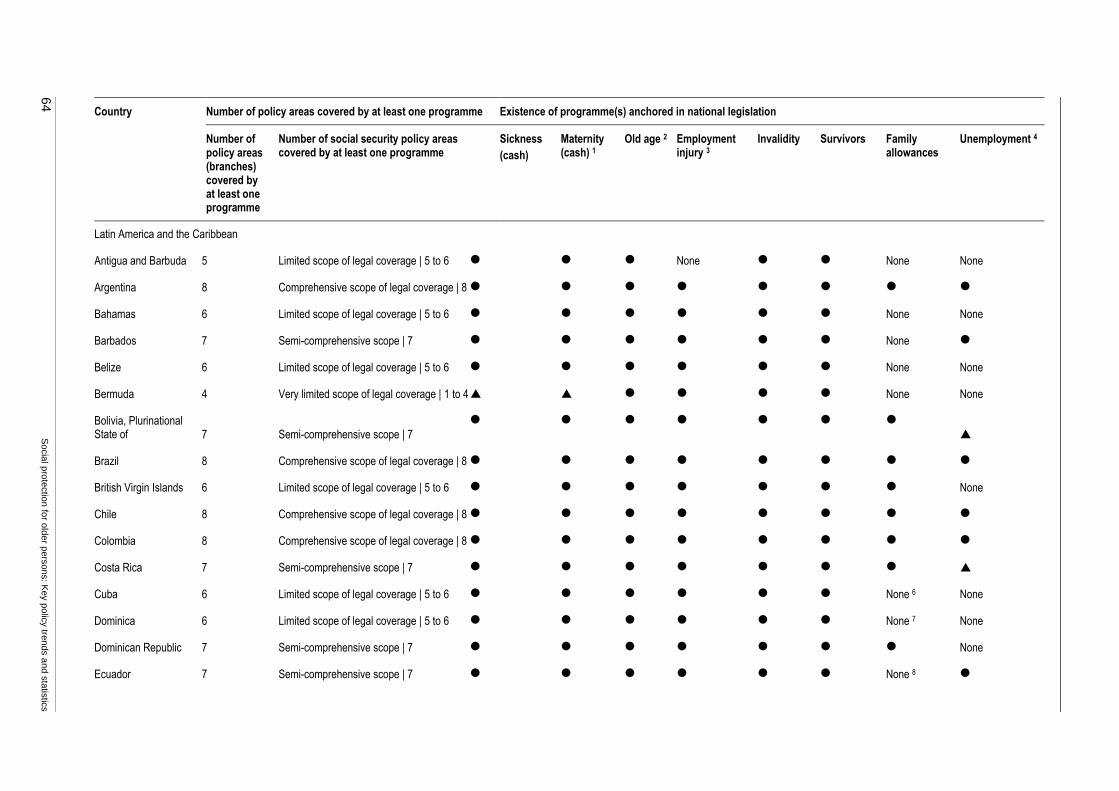
64
S
ocia
l pro
tectio
n fo
r old
er p
ers
ons: K
ey p
olic
y tre
nds a
nd s
tatis
tics
Country Number of policy areas covered by at least one programme Existence of programme(s) anchored in national legislation
Number of policy areas (branches) covered by at least one programme
Number of social security policy areas covered by at least one programme
Sickness
(cash)
Maternity (cash) 1
Old age 2 Employment injury 3
Invalidity Survivors Family allowances
Unemployment 4
Latin America and the Caribbean
Antigua and Barbuda 5 Limited scope of legal coverage | 5 to 6 None None None
Argentina 8 Comprehensive scope of legal coverage | 8
Bahamas 6 Limited scope of legal coverage | 5 to 6 None None
Barbados 7 Semi-comprehensive scope | 7 None
Belize 6 Limited scope of legal coverage | 5 to 6 None None
Bermuda 4 Very limited scope of legal coverage | 1 to 4 None None
Bolivia, Plurinational State of 7 Semi-comprehensive scope | 7
Brazil 8 Comprehensive scope of legal coverage | 8
British Virgin Islands 6 Limited scope of legal coverage | 5 to 6 None
Chile 8 Comprehensive scope of legal coverage | 8
Colombia 8 Comprehensive scope of legal coverage | 8
Costa Rica 7 Semi-comprehensive scope | 7
Cuba 6 Limited scope of legal coverage | 5 to 6 None 6 None
Dominica 6 Limited scope of legal coverage | 5 to 6 None 7 None
Dominican Republic 7 Semi-comprehensive scope | 7 None
Ecuador 7 Semi-comprehensive scope | 7 None 8
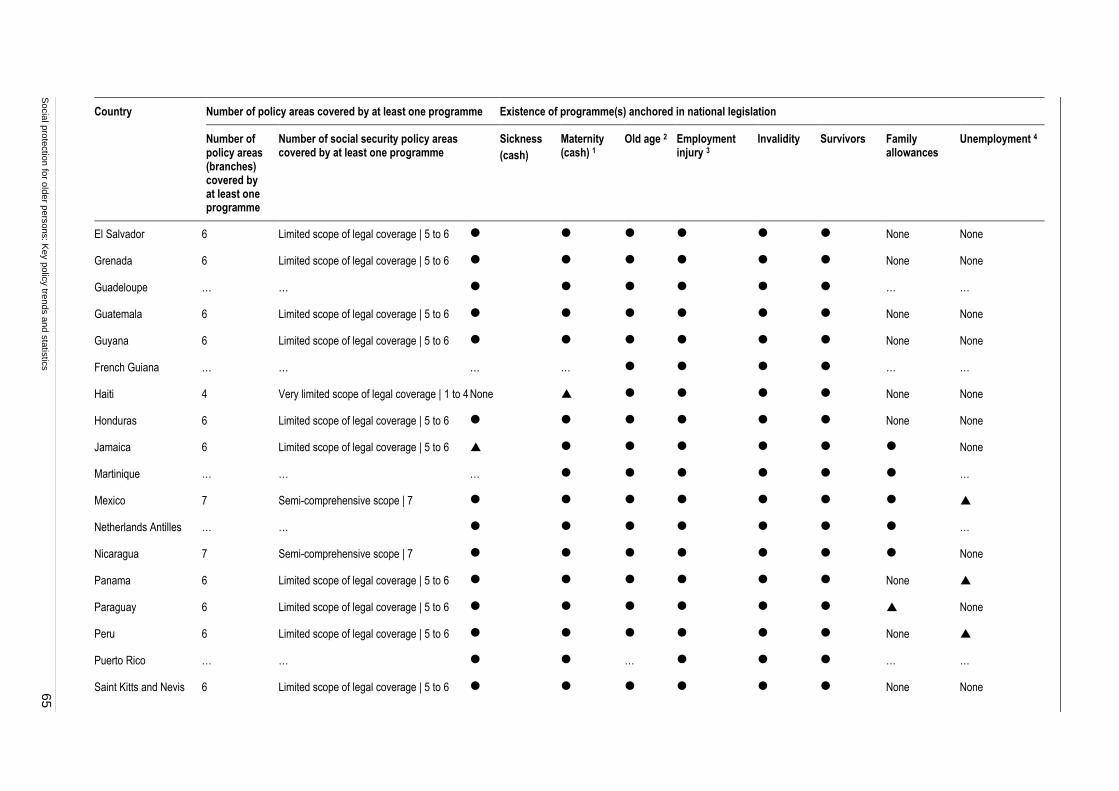
Socia
l pro
tectio
n fo
r old
er p
ers
ons: K
ey p
olic
y tre
nds a
nd s
tatis
tics
65
Country Number of policy areas covered by at least one programme Existence of programme(s) anchored in national legislation
Number of policy areas (branches) covered by at least one programme
Number of social security policy areas covered by at least one programme
Sickness
(cash)
Maternity (cash) 1
Old age 2 Employment injury 3
Invalidity Survivors Family allowances
Unemployment 4
El Salvador 6 Limited scope of legal coverage | 5 to 6 None None
Grenada 6 Limited scope of legal coverage | 5 to 6 None None
Guadeloupe … … … …
Guatemala 6 Limited scope of legal coverage | 5 to 6 None None
Guyana 6 Limited scope of legal coverage | 5 to 6 None None
French Guiana … … … … … …
Haiti 4 Very limited scope of legal coverage | 1 to 4 None None None
Honduras 6 Limited scope of legal coverage | 5 to 6 None None
Jamaica 6 Limited scope of legal coverage | 5 to 6 None
Martinique … … … …
Mexico 7 Semi-comprehensive scope | 7
Netherlands Antilles … … …
Nicaragua 7 Semi-comprehensive scope | 7 None
Panama 6 Limited scope of legal coverage | 5 to 6 None
Paraguay 6 Limited scope of legal coverage | 5 to 6 None
Peru 6 Limited scope of legal coverage | 5 to 6 None
Puerto Rico … … … … …
Saint Kitts and Nevis 6 Limited scope of legal coverage | 5 to 6 None None

66
S
ocia
l pro
tectio
n fo
r old
er p
ers
ons: K
ey p
olic
y tre
nds a
nd s
tatis
tics
Country Number of policy areas covered by at least one programme Existence of programme(s) anchored in national legislation
Number of policy areas (branches) covered by at least one programme
Number of social security policy areas covered by at least one programme
Sickness
(cash)
Maternity (cash) 1
Old age 2 Employment injury 3
Invalidity Survivors Family allowances
Unemployment 4
Saint Lucia 6 Limited scope of legal coverage | 5 to 6 None None
Saint Vincent and the Grenadines 6 Limited scope of legal coverage | 5 to 6
None None
Suriname … … … … … … … … … None
Trinidad and Tobago 7 Semi-comprehensive scope | 7 None
Uruguay 8 Comprehensive scope of legal coverage | 8
Venezuela, Bolivarian Rep. of 7 Semi-comprehensive scope | 7
None
North America
Canada 8 Comprehensive scope of legal coverage | 8
United tates 8 Comprehensive scope of legal coverage | 8
Oceania
Australia 8 Comprehensive scope of legal coverage | 8
Fiji 5 Limited scope of legal coverage | 5 to 6 None None
Kiribati 4 Very limited scope of legal coverage | 1 to 4 None None None
Marshall Islands 3 Very limited scope of legal coverage | 1 to 4 None None None
Micronesia, Fed. States 3 Very limited scope of legal coverage | 1 to 4 None None None None None
Nauru … … ... .... ... .... ... ... ... None
New Zealand 8 Comprehensive scope of legal coverage | 8
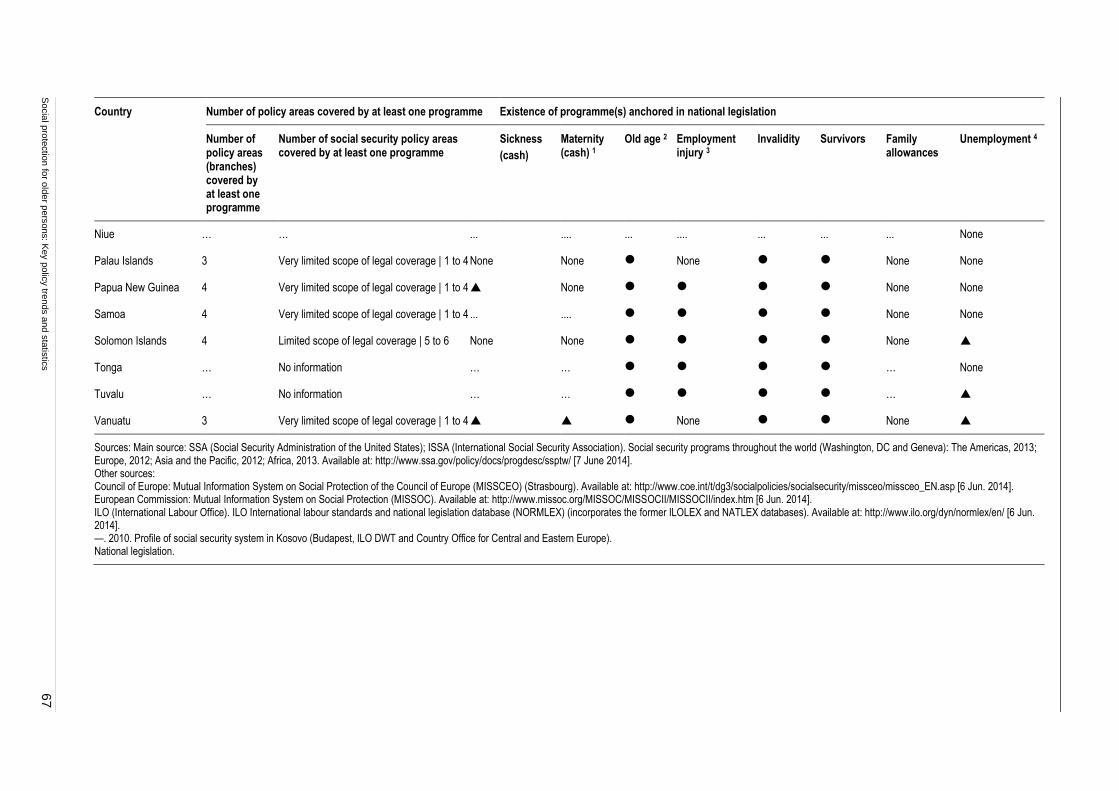
Socia
l pro
tectio
n fo
r old
er p
ers
ons: K
ey p
olic
y tre
nds a
nd s
tatis
tics
67
Country Number of policy areas covered by at least one programme Existence of programme(s) anchored in national legislation
Number of policy areas (branches) covered by at least one programme
Number of social security policy areas covered by at least one programme
Sickness
(cash)
Maternity (cash) 1
Old age 2 Employment injury 3
Invalidity Survivors Family allowances
Unemployment 4
Niue … … ... .... ... .... ... ... ... None
Palau Islands 3 Very limited scope of legal coverage | 1 to 4 None None None None None
Papua New Guinea 4 Very limited scope of legal coverage | 1 to 4 None None None
Samoa 4 Very limited scope of legal coverage | 1 to 4 ... .... None None
Solomon Islands 4 Limited scope of legal coverage | 5 to 6 None None None
Tonga … No information … … … None
Tuvalu … No information … … …
Vanuatu 3 Very limited scope of legal coverage | 1 to 4 None None
Sources: Main source: SSA (Social Security Administration of the United States); ISSA (International Social Security Association). Social security programs throughout the world (Washington, DC and Geneva): The Americas, 2013; Europe, 2012; Asia and the Pacific, 2012; Africa, 2013. Available at: http://www.ssa.gov/policy/docs/progdesc/ssptw/ [7 June 2014]. Other sources: Council of Europe: Mutual Information System on Social Protection of the Council of Europe (MISSCEO) (Strasbourg). Available at: http://www.coe.int/t/dg3/socialpolicies/socialsecurity/missceo/missceo_EN.asp [6 Jun. 2014]. European Commission: Mutual Information System on Social Protection (MISSOC). Available at: http://www.missoc.org/MISSOC/MISSOCII/MISSOCII/index.htm [6 Jun. 2014]. ILO (International Labour Office). ILO International labour standards and national legislation database (NORMLEX) (incorporates the former ILOLEX and NATLEX databases). Available at: http://www.ilo.org/dyn/normlex/en/ [6 Jun. 2014]. —. 2010. Profile of social security system in Kosovo (Budapest, ILO DWT and Country Office for Central and Eastern Europe). National legislation.
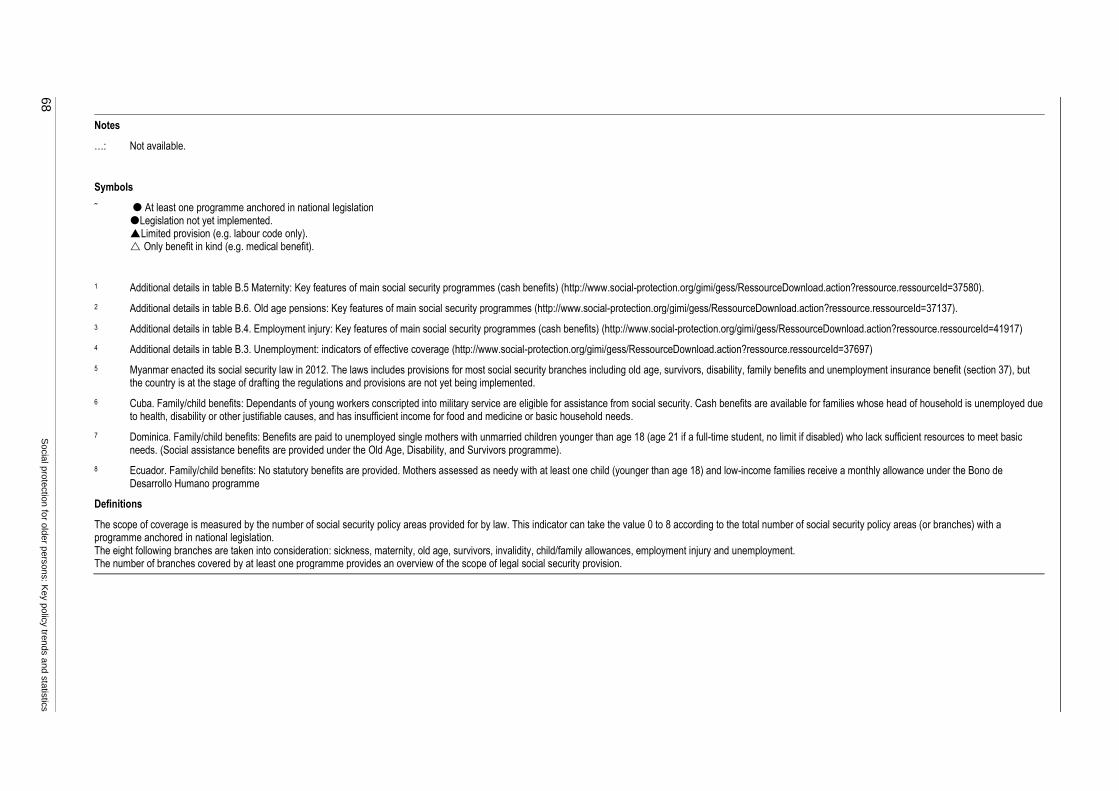
68
S
ocia
l pro
tectio
n fo
r old
er p
ers
ons: K
ey p
olic
y tre
nds a
nd s
tatis
tics
Notes
…: Not available.
Symbols
˜ At least one programme anchored in national legislation Legislation not yet implemented. Limited provision (e.g. labour code only). Only benefit in kind (e.g. medical benefit).
1 Additional details in table B.5 Maternity: Key features of main social security programmes (cash benefits) (http://www.social-protection.org/gimi/gess/RessourceDownload.action?ressource.ressourceId=37580).
2 Additional details in table B.6. Old age pensions: Key features of main social security programmes (http://www.social-protection.org/gimi/gess/RessourceDownload.action?ressource.ressourceId=37137).
3 Additional details in table B.4. Employment injury: Key features of main social security programmes (cash benefits) (http://www.social-protection.org/gimi/gess/RessourceDownload.action?ressource.ressourceId=41917)
4 Additional details in table B.3. Unemployment: indicators of effective coverage (http://www.social-protection.org/gimi/gess/RessourceDownload.action?ressource.ressourceId=37697)
5 Myanmar enacted its social security law in 2012. The laws includes provisions for most social security branches including old age, survivors, disability, family benefits and unemployment insurance benefit (section 37), but the country is at the stage of drafting the regulations and provisions are not yet being implemented.
6 Cuba. Family/child benefits: Dependants of young workers conscripted into military service are eligible for assistance from social security. Cash benefits are available for families whose head of household is unemployed due to health, disability or other justifiable causes, and has insufficient income for food and medicine or basic household needs.
7 Dominica. Family/child benefits: Benefits are paid to unemployed single mothers with unmarried children younger than age 18 (age 21 if a full-time student, no limit if disabled) who lack sufficient resources to meet basic needs. (Social assistance benefits are provided under the Old Age, Disability, and Survivors programme).
8 Ecuador. Family/child benefits: No statutory benefits are provided. Mothers assessed as needy with at least one child (younger than age 18) and low-income families receive a monthly allowance under the Bono de Desarrollo Humano programme
Definitions
The scope of coverage is measured by the number of social security policy areas provided for by law. This indicator can take the value 0 to 8 according to the total number of social security policy areas (or branches) with a programme anchored in national legislation. The eight following branches are taken into consideration: sickness, maternity, old age, survivors, invalidity, child/family allowances, employment injury and unemployment. The number of branches covered by at least one programme provides an overview of the scope of legal social security provision.
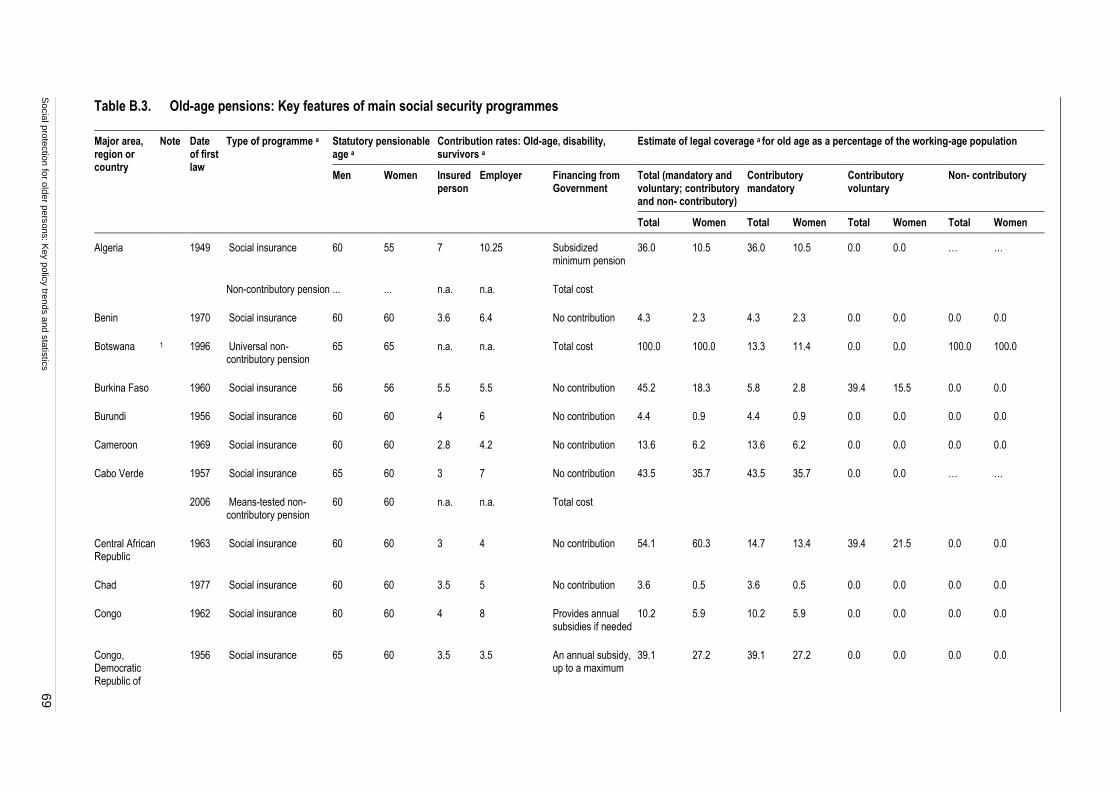
Socia
l pro
tectio
n fo
r old
er p
ers
ons: K
ey p
olic
y tre
nds a
nd s
tatis
tics
69
Table B.3. Old-age pensions: Key features of main social security programmes
Major area, region or country
Note Date of first law
Type of programme a Statutory pensionable age a
Contribution rates: Old-age, disability, survivors a
Estimate of legal coverage a for old age as a percentage of the working-age population
Men Women Insured person
Employer Financing from Government
Total (mandatory and voluntary; contributory and non- contributory)
Contributory mandatory
Contributory voluntary
Non- contributory
Total Women Total Women Total Women Total Women
Algeria
1949
Social insurance 60 55 7 10.25 Subsidized minimum pension
36.0 10.5 36.0 10.5 0.0 0.0 … …
Non-contributory pension ... ... n.a. n.a. Total cost
Benin 1970 Social insurance 60 60 3.6 6.4 No contribution 4.3 2.3 4.3 2.3 0.0 0.0 0.0 0.0
Botswana 1 1996 Universal non-contributory pension
65 65 n.a. n.a. Total cost 100.0 100.0 13.3 11.4 0.0 0.0 100.0 100.0
Burkina Faso 1960 Social insurance 56 56 5.5 5.5 No contribution 45.2 18.3 5.8 2.8 39.4 15.5 0.0 0.0
Burundi 1956 Social insurance 60 60 4 6 No contribution 4.4 0.9 4.4 0.9 0.0 0.0 0.0 0.0
Cameroon 1969 Social insurance 60 60 2.8 4.2 No contribution 13.6 6.2 13.6 6.2 0.0 0.0 0.0 0.0
Cabo Verde
1957 Social insurance 65 60 3 7 No contribution 43.5 35.7 43.5 35.7 0.0 0.0 … …
2006 Means-tested non-contributory pension
60 60 n.a. n.a. Total cost
Central African Republic
1963 Social insurance 60 60 3 4 No contribution 54.1 60.3 14.7 13.4 39.4 21.5 0.0 0.0
Chad 1977 Social insurance 60 60 3.5 5 No contribution 3.6 0.5 3.6 0.5 0.0 0.0 0.0 0.0
Congo 1962 Social insurance 60 60 4 8 Provides annual subsidies if needed
10.2 5.9 10.2 5.9 0.0 0.0 0.0 0.0
Congo, Democratic Republic of
1956 Social insurance 65 60 3.5 3.5 An annual subsidy, up to a maximum
39.1 27.2 39.1 27.2 0.0 0.0 0.0 0.0
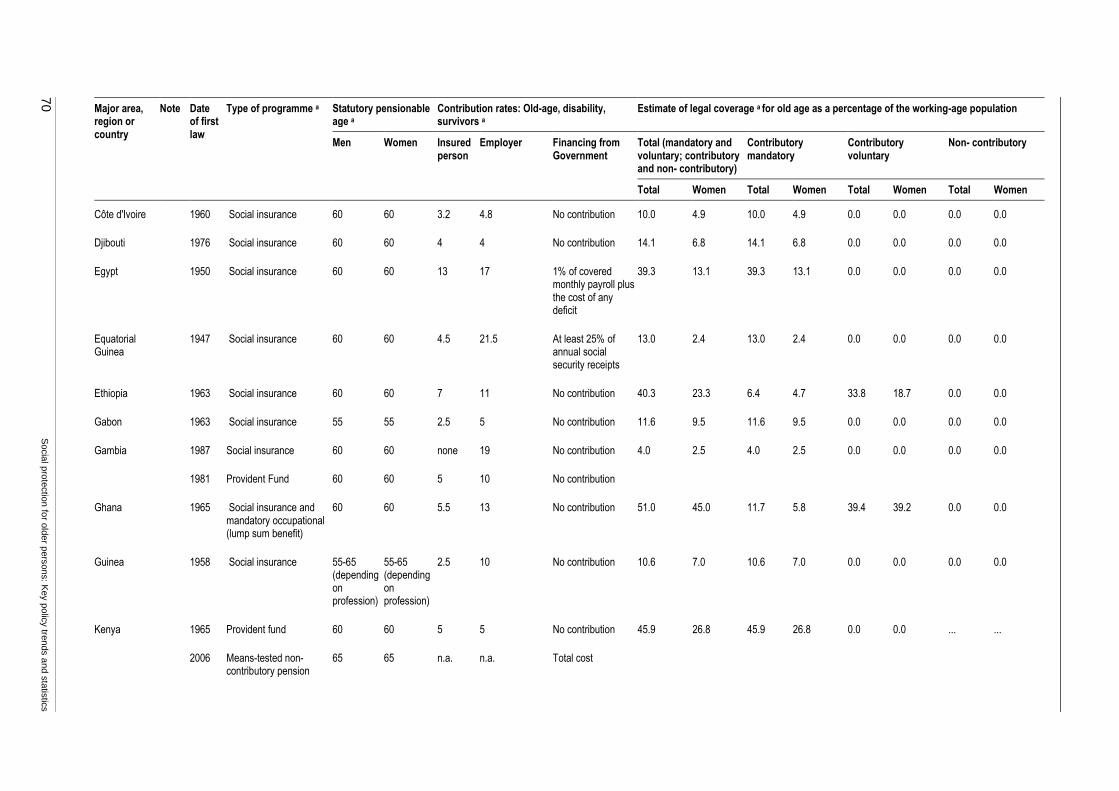
70
S
ocia
l pro
tectio
n fo
r old
er p
ers
ons: K
ey p
olic
y tre
nds a
nd s
tatis
tics
Major area, region or country
Note Date of first law
Type of programme a Statutory pensionable age a
Contribution rates: Old-age, disability, survivors a
Estimate of legal coverage a for old age as a percentage of the working-age population
Men Women Insured person
Employer Financing from Government
Total (mandatory and voluntary; contributory and non- contributory)
Contributory mandatory
Contributory voluntary
Non- contributory
Total Women Total Women Total Women Total Women
Côte d'Ivoire 1960 Social insurance 60 60 3.2 4.8 No contribution 10.0 4.9 10.0 4.9 0.0 0.0 0.0 0.0
Djibouti 1976 Social insurance 60 60 4 4 No contribution 14.1 6.8 14.1 6.8 0.0 0.0 0.0 0.0
Egypt 1950 Social insurance 60 60 13 17 1% of covered monthly payroll plus the cost of any deficit
39.3 13.1 39.3 13.1 0.0 0.0 0.0 0.0
Equatorial Guinea
1947 Social insurance 60 60 4.5 21.5 At least 25% of annual social security receipts
13.0 2.4 13.0 2.4 0.0 0.0 0.0 0.0
Ethiopia 1963 Social insurance 60 60 7 11 No contribution 40.3 23.3 6.4 4.7 33.8 18.7 0.0 0.0
Gabon 1963 Social insurance 55 55 2.5 5 No contribution 11.6 9.5 11.6 9.5 0.0 0.0 0.0 0.0
Gambia
1987 Social insurance 60 60 none 19 No contribution 4.0 2.5 4.0 2.5 0.0 0.0 0.0 0.0
1981 Provident Fund 60 60 5 10 No contribution
Ghana 1965 Social insurance and mandatory occupational (lump sum benefit)
60 60 5.5 13 No contribution 51.0 45.0 11.7 5.8 39.4 39.2 0.0 0.0
Guinea 1958 Social insurance 55-65 (depending on profession)
55-65 (depending on profession)
2.5 10 No contribution 10.6 7.0 10.6 7.0 0.0 0.0 0.0 0.0
Kenya
1965 Provident fund 60 60 5 5 No contribution 45.9
26.8
45.9
26.8
0.0
0.0
...
...
2006 Means-tested non-
contributory pension 65 65 n.a. n.a. Total cost
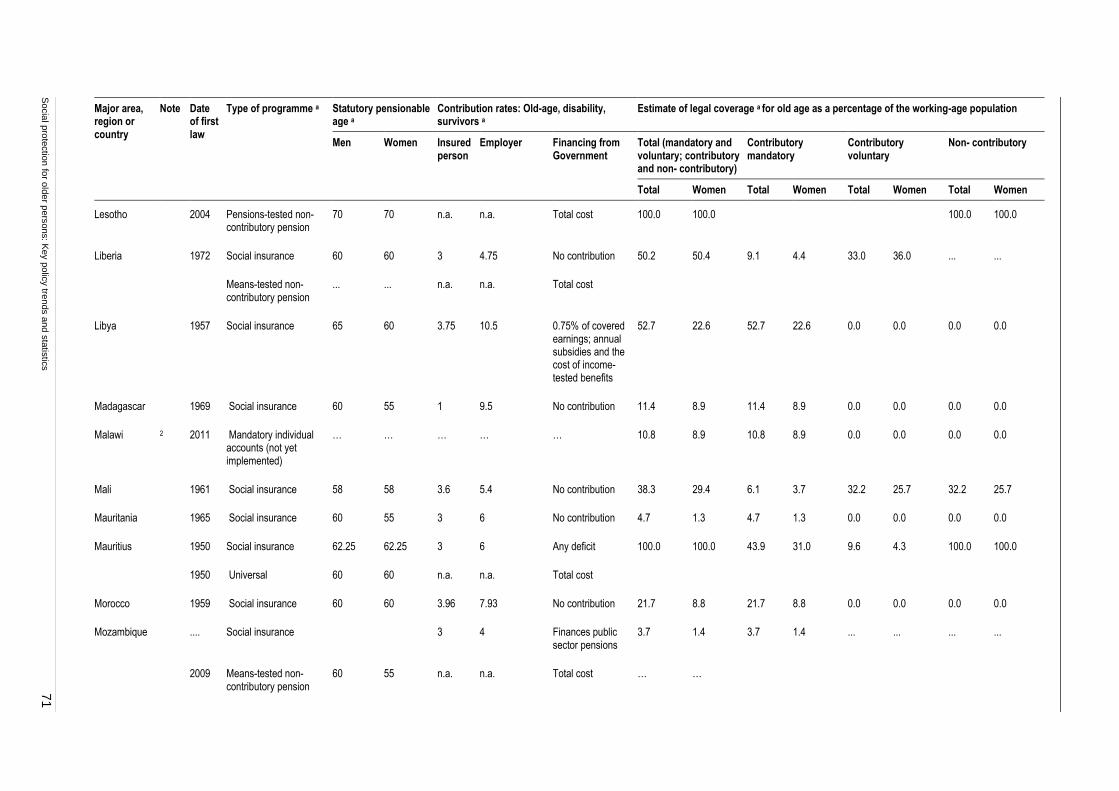
Socia
l pro
tectio
n fo
r old
er p
ers
ons: K
ey p
olic
y tre
nds a
nd s
tatis
tics
71
Major area, region or country
Note Date of first law
Type of programme a Statutory pensionable age a
Contribution rates: Old-age, disability, survivors a
Estimate of legal coverage a for old age as a percentage of the working-age population
Men Women Insured person
Employer Financing from Government
Total (mandatory and voluntary; contributory and non- contributory)
Contributory mandatory
Contributory voluntary
Non- contributory
Total Women Total Women Total Women Total Women
Lesotho 2004 Pensions-tested non-contributory pension
70 70 n.a. n.a. Total cost 100.0 100.0 100.0 100.0
Liberia
1972
Social insurance 60 60 3 4.75 No contribution 50.2 50.4 9.1 4.4 33.0 36.0 ... ...
Means-tested non-contributory pension
... ... n.a. n.a. Total cost
Libya 1957 Social insurance 65 60 3.75 10.5 0.75% of covered earnings; annual subsidies and the cost of income-tested benefits
52.7 22.6 52.7 22.6 0.0 0.0 0.0 0.0
Madagascar 1969 Social insurance 60 55 1 9.5 No contribution 11.4 8.9 11.4 8.9 0.0 0.0 0.0 0.0
Malawi 2 2011 Mandatory individual accounts (not yet implemented)
… … … … … 10.8 8.9 10.8 8.9 0.0 0.0 0.0 0.0
Mali 1961 Social insurance 58 58 3.6 5.4 No contribution 38.3 29.4 6.1 3.7 32.2 25.7 32.2 25.7
Mauritania 1965 Social insurance 60 55 3 6 No contribution 4.7 1.3 4.7 1.3 0.0 0.0 0.0 0.0
Mauritius
1950 Social insurance 62.25 62.25 3 6 Any deficit 100.0
100.0
43.9
31.0
9.6
4.3
100.0
100.0
1950 Universal 60 60 n.a. n.a. Total cost
Morocco 1959 Social insurance 60 60 3.96 7.93 No contribution 21.7 8.8 21.7 8.8 0.0 0.0 0.0 0.0
Mozambique
.... Social insurance 3 4 Finances public sector pensions
3.7 1.4 3.7
1.4
...
...
...
...
2009 Means-tested non-contributory pension
60 55 n.a. n.a. Total cost … …
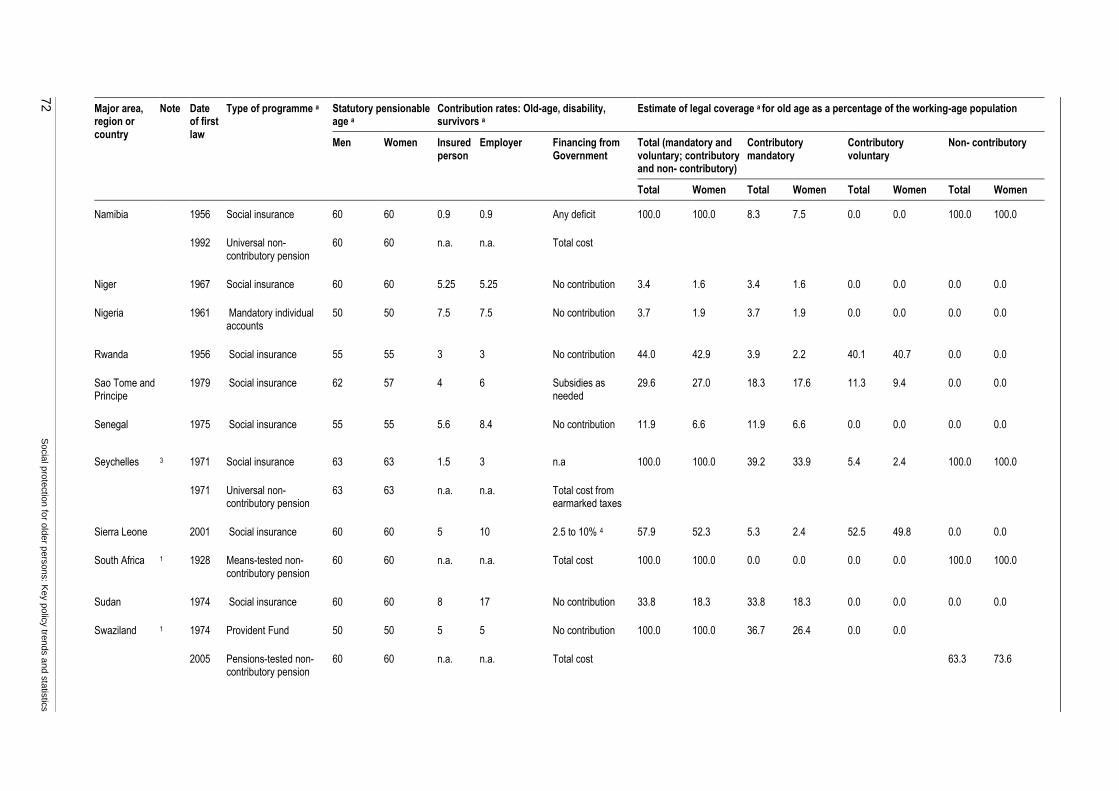
72
S
ocia
l pro
tectio
n fo
r old
er p
ers
ons: K
ey p
olic
y tre
nds a
nd s
tatis
tics
Major area, region or country
Note Date of first law
Type of programme a Statutory pensionable age a
Contribution rates: Old-age, disability, survivors a
Estimate of legal coverage a for old age as a percentage of the working-age population
Men Women Insured person
Employer Financing from Government
Total (mandatory and voluntary; contributory and non- contributory)
Contributory mandatory
Contributory voluntary
Non- contributory
Total Women Total Women Total Women Total Women
Namibia
1956 Social insurance 60 60 0.9 0.9 Any deficit 100.0 100.0 8.3 7.5 0.0 0.0 100.0 100.0
1992 Universal non-contributory pension
60 60 n.a. n.a. Total cost
Niger 1967 Social insurance 60 60 5.25 5.25 No contribution 3.4 1.6 3.4 1.6 0.0 0.0 0.0 0.0
Nigeria 1961 Mandatory individual accounts
50 50 7.5 7.5 No contribution 3.7 1.9 3.7 1.9 0.0 0.0 0.0 0.0
Rwanda 1956 Social insurance 55 55 3 3 No contribution 44.0 42.9 3.9 2.2 40.1 40.7 0.0 0.0
Sao Tome and Principe
1979 Social insurance 62 57 4 6 Subsidies as needed
29.6 27.0 18.3 17.6 11.3 9.4 0.0 0.0
Senegal 1975 Social insurance 55 55 5.6 8.4 No contribution 11.9 6.6 11.9 6.6 0.0 0.0 0.0 0.0
Seychelles 3
1971 Social insurance 63 63 1.5 3 n.a 100.0
100.0
39.2
33.9
5.4
2.4
100.0
100.0
1971 Universal non-
contributory pension 63 63 n.a. n.a. Total cost from
earmarked taxes
Sierra Leone 2001 Social insurance 60 60 5 10 2.5 to 10% 4 57.9 52.3 5.3 2.4 52.5 49.8 0.0 0.0
South Africa 1 1928 Means-tested non-contributory pension
60 60 n.a. n.a. Total cost 100.0 100.0 0.0 0.0 0.0 0.0 100.0 100.0
Sudan 1974 Social insurance 60 60 8 17 No contribution 33.8 18.3 33.8 18.3 0.0 0.0 0.0 0.0
Swaziland 1
1974 Provident Fund 50 50 5 5 No contribution 100.0 100.0 36.7 26.4 0.0 0.0
2005 Pensions-tested non-contributory pension
60 60 n.a. n.a. Total cost 63.3 73.6
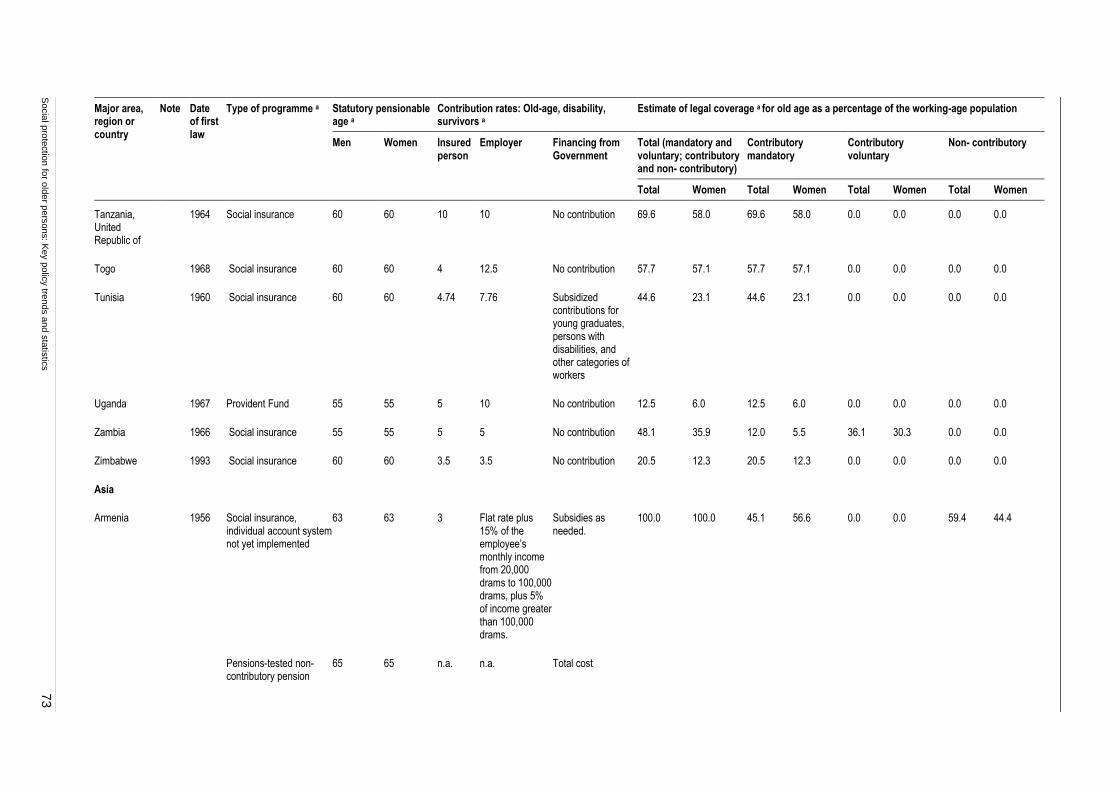
Socia
l pro
tectio
n fo
r old
er p
ers
ons: K
ey p
olic
y tre
nds a
nd s
tatis
tics
73
Major area, region or country
Note Date of first law
Type of programme a Statutory pensionable age a
Contribution rates: Old-age, disability, survivors a
Estimate of legal coverage a for old age as a percentage of the working-age population
Men Women Insured person
Employer Financing from Government
Total (mandatory and voluntary; contributory and non- contributory)
Contributory mandatory
Contributory voluntary
Non- contributory
Total Women Total Women Total Women Total Women
Tanzania, United Republic of
1964 Social insurance 60 60 10 10 No contribution 69.6 58.0 69.6 58.0 0.0 0.0 0.0 0.0
Togo 1968 Social insurance 60 60 4 12.5 No contribution 57.7 57.1 57.7 57.1 0.0 0.0 0.0 0.0
Tunisia 1960 Social insurance 60 60 4.74 7.76 Subsidized contributions for young graduates, persons with disabilities, and other categories of workers
44.6 23.1 44.6 23.1 0.0 0.0 0.0 0.0
Uganda 1967 Provident Fund 55 55 5 10 No contribution 12.5 6.0 12.5 6.0 0.0 0.0 0.0 0.0
Zambia 1966 Social insurance 55 55 5 5 No contribution 48.1 35.9 12.0 5.5 36.1 30.3 0.0 0.0
Zimbabwe 1993 Social insurance 60 60 3.5 3.5 No contribution 20.5 12.3 20.5 12.3 0.0 0.0 0.0 0.0
Asia
Armenia
1956
Social insurance, individual account system not yet implemented
63 63 3 Flat rate plus 15% of the employee’s monthly income from 20,000 drams to 100,000 drams, plus 5% of income greater than 100,000 drams.
Subsidies as needed.
100.0
100.0
45.1
56.6
0.0
0.0
59.4
44.4
Pensions-tested non-contributory pension
65 65 n.a. n.a. Total cost
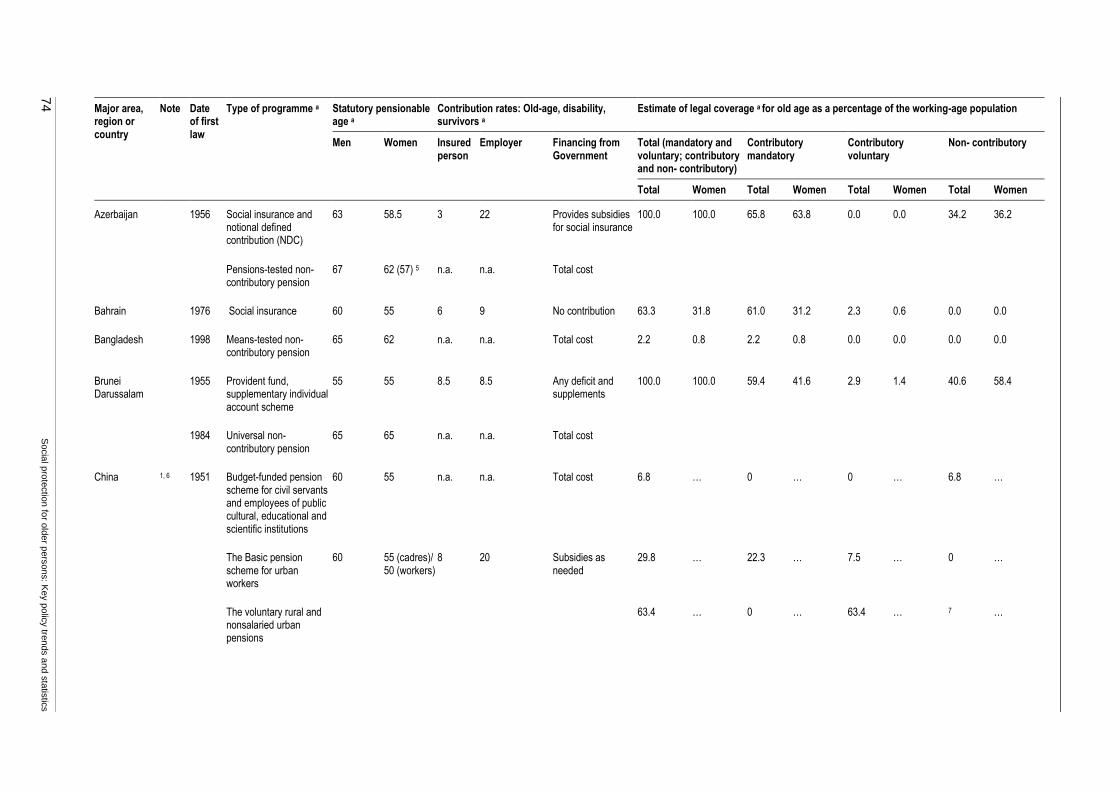
74
S
ocia
l pro
tectio
n fo
r old
er p
ers
ons: K
ey p
olic
y tre
nds a
nd s
tatis
tics
Major area, region or country
Note Date of first law
Type of programme a Statutory pensionable age a
Contribution rates: Old-age, disability, survivors a
Estimate of legal coverage a for old age as a percentage of the working-age population
Men Women Insured person
Employer Financing from Government
Total (mandatory and voluntary; contributory and non- contributory)
Contributory mandatory
Contributory voluntary
Non- contributory
Total Women Total Women Total Women Total Women
Azerbaijan
1956
Social insurance and notional defined contribution (NDC)
63 58.5 3 22 Provides subsidies for social insurance
100.0 100.0 65.8 63.8 0.0 0.0 34.2 36.2
Pensions-tested non-contributory pension
67 62 (57) 5 n.a. n.a. Total cost
Bahrain 1976 Social insurance 60 55 6 9 No contribution 63.3 31.8 61.0 31.2 2.3 0.6 0.0 0.0
Bangladesh 1998 Means-tested non-contributory pension
65 62 n.a. n.a. Total cost 2.2 0.8 2.2 0.8 0.0 0.0 0.0 0.0
Brunei Darussalam
1955 Provident fund, supplementary individual account scheme
55 55 8.5 8.5 Any deficit and supplements
100.0
100.0
59.4
41.6
2.9
1.4
40.6
58.4
1984 Universal non-contributory pension
65 65 n.a. n.a. Total cost
China
1, 6 1951 Budget-funded pension scheme for civil servants and employees of public cultural, educational and scientific institutions
60 55 n.a. n.a. Total cost 6.8 … 0 … 0 … 6.8 …
The Basic pension scheme for urban workers
60 55 (cadres)/ 50 (workers)
8 20 Subsidies as needed
29.8 … 22.3 … 7.5 … 0 …
The voluntary rural and nonsalaried urban pensions
63.4 … 0 … 63.4 … 7 …
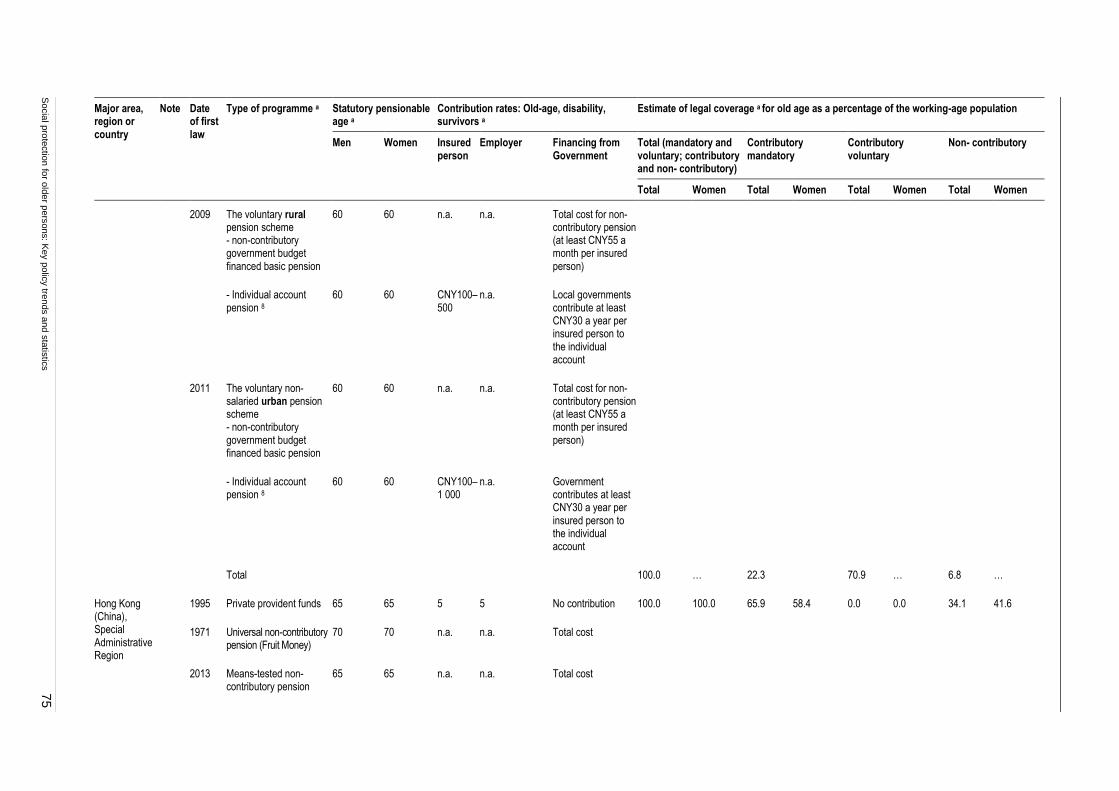
Socia
l pro
tectio
n fo
r old
er p
ers
ons: K
ey p
olic
y tre
nds a
nd s
tatis
tics
75
Major area, region or country
Note Date of first law
Type of programme a Statutory pensionable age a
Contribution rates: Old-age, disability, survivors a
Estimate of legal coverage a for old age as a percentage of the working-age population
Men Women Insured person
Employer Financing from Government
Total (mandatory and voluntary; contributory and non- contributory)
Contributory mandatory
Contributory voluntary
Non- contributory
Total Women Total Women Total Women Total Women
2009
The voluntary rural pension scheme - non-contributory government budget financed basic pension
60 60 n.a. n.a. Total cost for non-contributory pension (at least CNY55 a month per insured person)
- Individual account pension 8
60 60 CNY100–500
n.a. Local governments contribute at least CNY30 a year per insured person to the individual account
2011
The voluntary non-salaried urban pension scheme - non-contributory government budget financed basic pension
60 60 n.a. n.a. Total cost for non-contributory pension (at least CNY55 a month per insured person)
- Individual account pension 8
60 60 CNY100–1 000
n.a. Government contributes at least CNY30 a year per insured person to the individual account
Total 100.0 … 22.3 70.9 … 6.8 …
Hong Kong (China), Special Administrative Region
1995 Private provident funds 65 65 5 5 No contribution 100.0 100.0 65.9 58.4 0.0 0.0 34.1 41.6
1971 Universal non-contributory pension (Fruit Money)
70 70 n.a. n.a. Total cost
2013 Means-tested non-contributory pension
65 65 n.a. n.a. Total cost
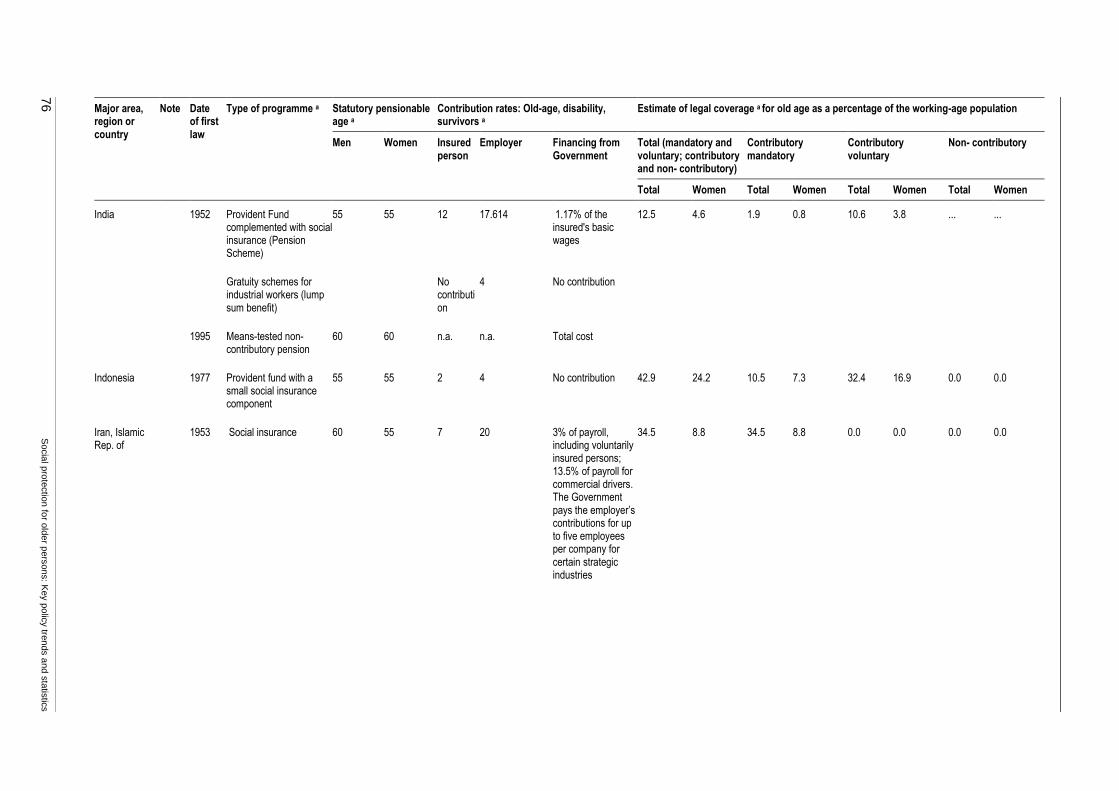
76
S
ocia
l pro
tectio
n fo
r old
er p
ers
ons: K
ey p
olic
y tre
nds a
nd s
tatis
tics
Major area, region or country
Note Date of first law
Type of programme a Statutory pensionable age a
Contribution rates: Old-age, disability, survivors a
Estimate of legal coverage a for old age as a percentage of the working-age population
Men Women Insured person
Employer Financing from Government
Total (mandatory and voluntary; contributory and non- contributory)
Contributory mandatory
Contributory voluntary
Non- contributory
Total Women Total Women Total Women Total Women
India
1952
Provident Fund complemented with social insurance (Pension Scheme)
55 55 12 17.614 1.17% of the insured's basic wages
12.5 4.6 1.9 0.8 10.6 3.8 ... ...
Gratuity schemes for industrial workers (lump sum benefit)
No contribution
4 No contribution
1995 Means-tested non-contributory pension
60 60 n.a. n.a. Total cost
Indonesia 1977 Provident fund with a small social insurance component
55 55 2 4 No contribution 42.9 24.2 10.5 7.3 32.4 16.9 0.0 0.0
Iran, Islamic Rep. of
1953 Social insurance 60 55 7 20 3% of payroll, including voluntarily insured persons; 13.5% of payroll for commercial drivers. The Government pays the employer’s contributions for up to five employees per company for certain strategic industries
34.5 8.8 34.5 8.8 0.0 0.0 0.0 0.0

Socia
l pro
tectio
n fo
r old
er p
ers
ons: K
ey p
olic
y tre
nds a
nd s
tatis
tics
77
Major area, region or country
Note Date of first law
Type of programme a Statutory pensionable age a
Contribution rates: Old-age, disability, survivors a
Estimate of legal coverage a for old age as a percentage of the working-age population
Men Women Insured person
Employer Financing from Government
Total (mandatory and voluntary; contributory and non- contributory)
Contributory mandatory
Contributory voluntary
Non- contributory
Total Women Total Women Total Women Total Women
Israel
9
1953
Social insurance 70 67.33 0.34-3.85 1.3-2.04 0.25% of insured persons’ earnings
100.0
100.0
61.5
56.6
0.0
0.0
38.5
43.4
Means-tested non-contributory pension
65-67 60-64 n.a. n.a. Total cost
Japan 10 1941 Social insurance: flat rate benefit and earning related benefit
65 65 8.338 8.338 50% of the cost of benefits for the National pension programme and 100% of administrative costs for both national pension and employees' pension insurance financed by the national tax
100.0 100.0 100.0 100.0 0.0 0.0 0.0 0.0
Jordan 1978 Social insurance 60 55 5.5 9 Discretionary/irregular contribution
41.7 12.7 33.3 12.0 8.4 0.7 0.0 0.0
Kazakhstan
1991 Social insurance: DC based on individual accounts
63 58 10 11 Cost of State basic pension. Old-age solidarity pension: Subsidies as needed
100.0
100.0
73.3
69.2
0.0
0.0
26.7
30.8
1991 Pensions-tested non-contributory pension
63 58 n.a. n.a. Total cost
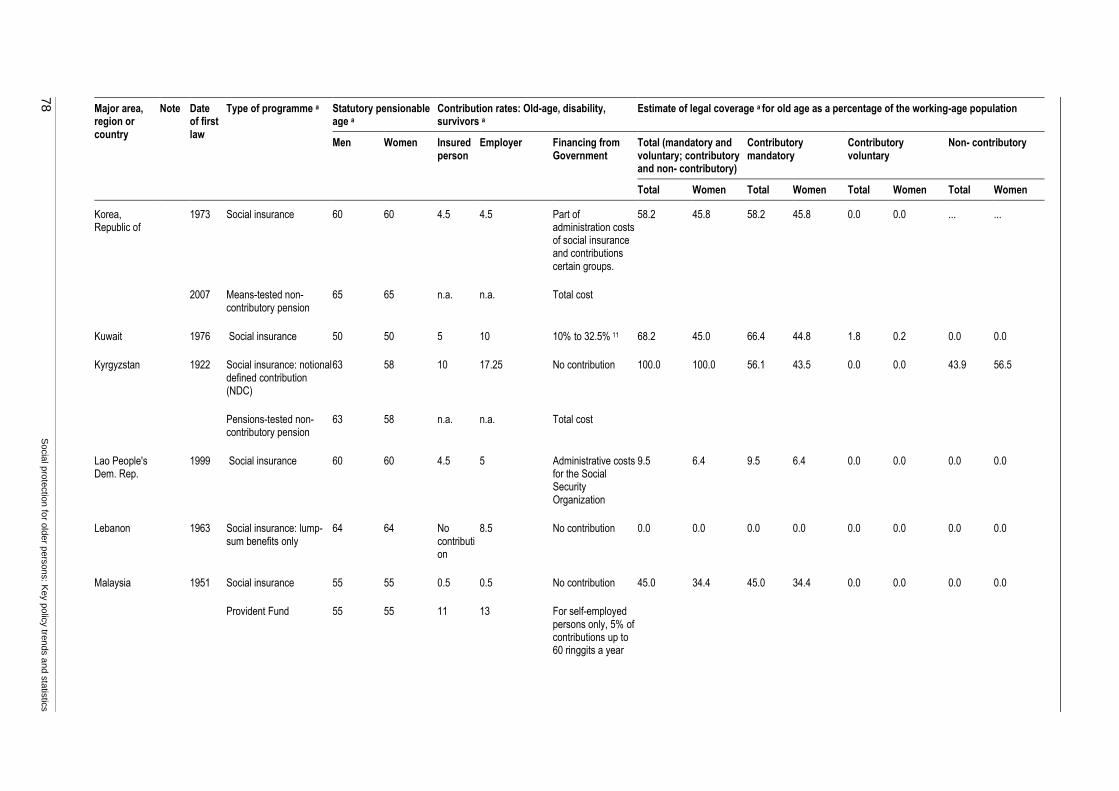
78
S
ocia
l pro
tectio
n fo
r old
er p
ers
ons: K
ey p
olic
y tre
nds a
nd s
tatis
tics
Major area, region or country
Note Date of first law
Type of programme a Statutory pensionable age a
Contribution rates: Old-age, disability, survivors a
Estimate of legal coverage a for old age as a percentage of the working-age population
Men Women Insured person
Employer Financing from Government
Total (mandatory and voluntary; contributory and non- contributory)
Contributory mandatory
Contributory voluntary
Non- contributory
Total Women Total Women Total Women Total Women
Korea, Republic of
1973 Social insurance 60 60 4.5 4.5 Part of administration costs of social insurance and contributions certain groups.
58.2 45.8 58.2 45.8 0.0 0.0 ... ...
2007 Means-tested non-contributory pension
65 65 n.a. n.a. Total cost
Kuwait 1976 Social insurance 50 50 5 10 10% to 32.5% 11 68.2 45.0 66.4 44.8 1.8 0.2 0.0 0.0
Kyrgyzstan
1922
Social insurance: notional defined contribution (NDC)
63 58 10 17.25 No contribution 100.0
100.0
56.1
43.5
0.0
0.0
43.9
56.5
Pensions-tested non-contributory pension
63 58 n.a. n.a. Total cost
Lao People's Dem. Rep.
1999 Social insurance 60 60 4.5 5 Administrative costs for the Social Security Organization
9.5 6.4 9.5 6.4 0.0 0.0 0.0 0.0
Lebanon 1963 Social insurance: lump-sum benefits only
64 64 No contribution
8.5 No contribution 0.0 0.0 0.0 0.0 0.0 0.0 0.0 0.0
Malaysia
1951
Social insurance 55 55 0.5 0.5 No contribution 45.0
34.4
45.0
34.4
0.0
0.0
0.0
0.0
Provident Fund 55 55 11 13 For self-employed
persons only, 5% of contributions up to 60 ringgits a year

Socia
l pro
tectio
n fo
r old
er p
ers
ons: K
ey p
olic
y tre
nds a
nd s
tatis
tics
79
Major area, region or country
Note Date of first law
Type of programme a Statutory pensionable age a
Contribution rates: Old-age, disability, survivors a
Estimate of legal coverage a for old age as a percentage of the working-age population
Men Women Insured person
Employer Financing from Government
Total (mandatory and voluntary; contributory and non- contributory)
Contributory mandatory
Contributory voluntary
Non- contributory
Total Women Total Women Total Women Total Women
Mongolia
Social insurance: NDC (for those born after 1960)
60 55 5.5 13.5 n.a. 100.0 100.0 23.2 24.0 18.6 9.7 58.2 66.3
Means-tested non-contributory pension
60 55 n.a. n.a. Total cost
Nepal
1962 Provident Fund 58 58 10 10 29.1 29.6 2.0 0.8 0.0 0.0 27.1 28.8
1995 Pensions-tested non-contributory pension
70 (60 in some areas)
70 (60 in some areas)
n.a. n.a. Total cost
Oman 1991 Social insurance 60 55 6.5 9.5 4% of monthly salary
26.3 0.0 26.3 0.0 0.0 0.0 0.0 0.0
Pakistan 1976 Social insurance 60 55 1 5 No contribution 17.5 4.4 17.5 4.4 0.0 0.0 0.0 0.0
Philippines
1954 Social insurance 60 60 3.33 7.07 Any deficit 53.2 39.0 53.2 39.0 0.0 0.0 ... ...
2011 Means-tested non-contributory pension
77 77 n.a. n.a. Total cost
Qatar 2002 Social insurance 60 55 5 10 Covers administrative costs and any deficit
... ... ... ... ... ... ... ...
Saudi Arabia 1969 Social insurance 60 55 9 9 Any operating deficit 18.8 6.3 18.8 6.3 0.0 0.0 0.0 0.0
Singapore 1953 Provident Fund 55 55 20 16 No contribution 53.5 47.9 53.5 47.9 0.0 0.0 0.0 0.0
Sri Lanka 1958 Provident Fund 55 50 8 12 No contribution 31.5 20.6 31.5 20.6 0.0 0.0 0.0 0.0
Syrian Arab Republic
1959 Social insurance 60 55 7 14 No contribution 23.8 7.9 23.8 7.9 0.0 0.0 0.0 0.0

80
S
ocia
l pro
tectio
n fo
r old
er p
ers
ons: K
ey p
olic
y tre
nds a
nd s
tatis
tics
Major area, region or country
Note Date of first law
Type of programme a Statutory pensionable age a
Contribution rates: Old-age, disability, survivors a
Estimate of legal coverage a for old age as a percentage of the working-age population
Men Women Insured person
Employer Financing from Government
Total (mandatory and voluntary; contributory and non- contributory)
Contributory mandatory
Contributory voluntary
Non- contributory
Total Women Total Women Total Women Total Women
Taiwan, China
1950 Social insurance and mandatory individual account system
60 60 5.7 11.25 Various contribution rates 12
100.0 100.0 41.7 36.0 58.3 64.0 ... ...
2008 Means-tested non-contributory pension
65 65 n.a. n.a. Total cost
Tajikistan
1993 Social insurance. A notional defined contribution system is scheduled to be introduced in 2013.
63 58 1 25 Subsidies as needed
... ... ... ... ... ... ... ...
Pensions-tested non-contributory pension
65 60 n.a. n.a. Provides partial subsidies; local authorities may provide supplementary benefits from their own budgets
Thailand
1990 New social insurance system 13
55 55 3 3 1% and THN30+K1048576 14
100.0 100.0 35.9 29.4 25.9 19.3 38.2 51.3
1993 Pensions-tested non-contributory pension
60 60 n.a. n.a. Total cost
Timor Leste 2008 Pensions-tested non-contributory pension
60 60 n.a. n.a. Total cost 100.0 100.0 0.0 0.0 0.0 0.0 100.0 100.0
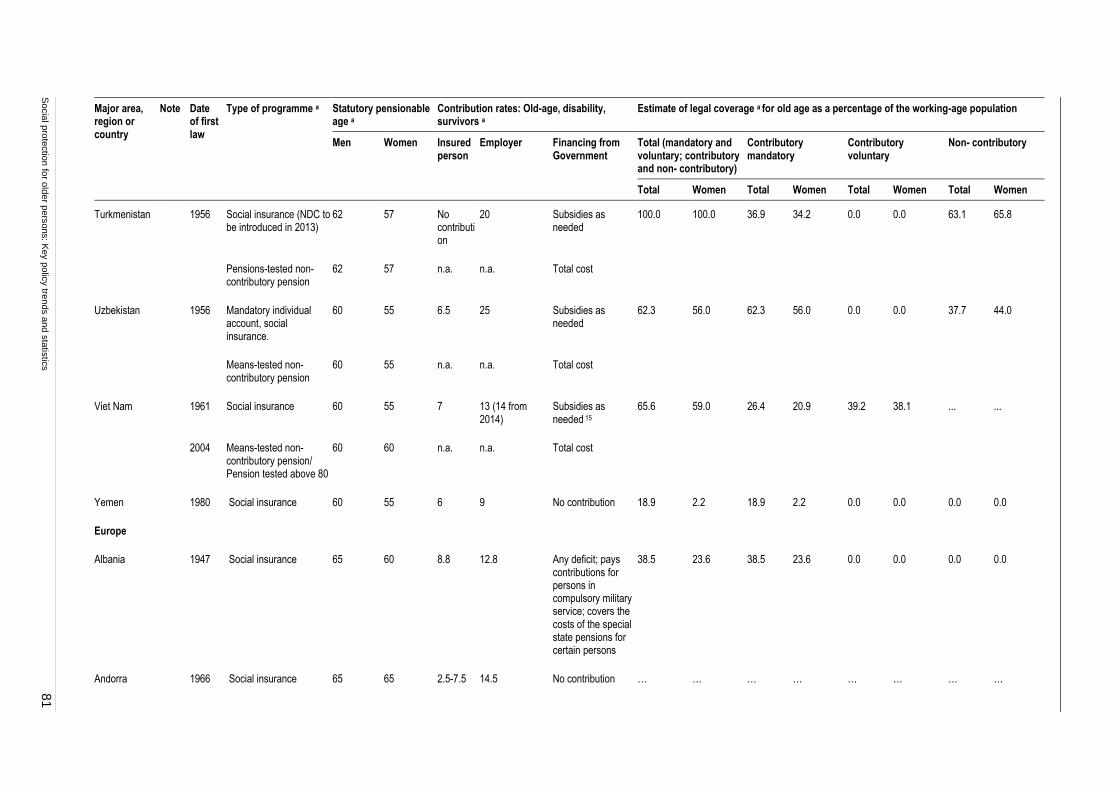
Socia
l pro
tectio
n fo
r old
er p
ers
ons: K
ey p
olic
y tre
nds a
nd s
tatis
tics
81
Major area, region or country
Note Date of first law
Type of programme a Statutory pensionable age a
Contribution rates: Old-age, disability, survivors a
Estimate of legal coverage a for old age as a percentage of the working-age population
Men Women Insured person
Employer Financing from Government
Total (mandatory and voluntary; contributory and non- contributory)
Contributory mandatory
Contributory voluntary
Non- contributory
Total Women Total Women Total Women Total Women
Turkmenistan
1956
Social insurance (NDC to be introduced in 2013)
62 57 No contribution
20 Subsidies as needed
100.0 100.0 36.9 34.2 0.0 0.0 63.1 65.8
Pensions-tested non-contributory pension
62 57 n.a. n.a. Total cost
Uzbekistan
1956
Mandatory individual account, social insurance.
60 55 6.5 25 Subsidies as needed
62.3 56.0 62.3 56.0 0.0 0.0 37.7 44.0
Means-tested non-contributory pension
60 55 n.a. n.a. Total cost
Viet Nam
1961 Social insurance 60 55 7 13 (14 from 2014)
Subsidies as needed 15
65.6 59.0 26.4 20.9 39.2 38.1 ... ...
2004 Means-tested non-contributory pension/ Pension tested above 80
60 60 n.a. n.a. Total cost
Yemen 1980 Social insurance 60 55 6 9 No contribution 18.9 2.2 18.9 2.2 0.0 0.0 0.0 0.0
Europe
Albania 1947 Social insurance 65 60 8.8 12.8 Any deficit; pays contributions for persons in compulsory military service; covers the costs of the special state pensions for certain persons
38.5 23.6 38.5 23.6 0.0 0.0 0.0 0.0
Andorra 1966 Social insurance 65 65 2.5-7.5 14.5 No contribution … … … … … … … …
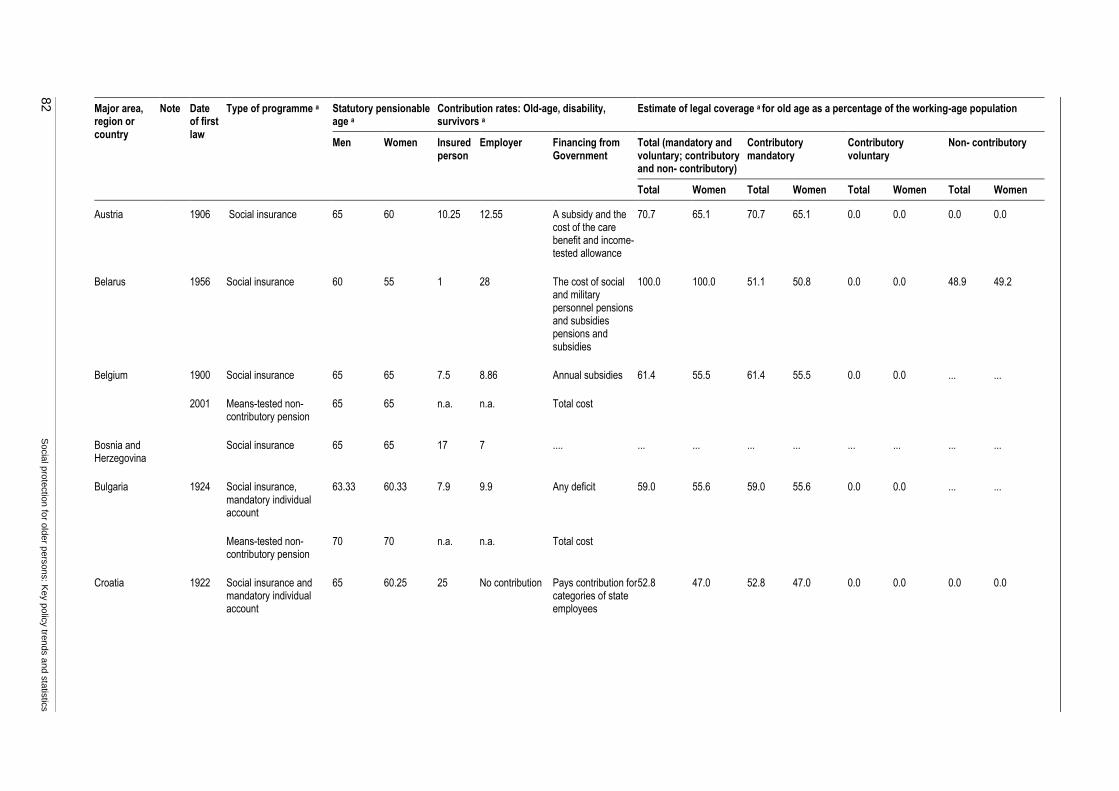
82
S
ocia
l pro
tectio
n fo
r old
er p
ers
ons: K
ey p
olic
y tre
nds a
nd s
tatis
tics
Major area, region or country
Note Date of first law
Type of programme a Statutory pensionable age a
Contribution rates: Old-age, disability, survivors a
Estimate of legal coverage a for old age as a percentage of the working-age population
Men Women Insured person
Employer Financing from Government
Total (mandatory and voluntary; contributory and non- contributory)
Contributory mandatory
Contributory voluntary
Non- contributory
Total Women Total Women Total Women Total Women
Austria 1906 Social insurance 65 60 10.25 12.55 A subsidy and the cost of the care benefit and income-tested allowance
70.7 65.1 70.7 65.1 0.0 0.0 0.0 0.0
Belarus 1956 Social insurance 60 55 1 28 The cost of social and military personnel pensions and subsidies pensions and subsidies
100.0 100.0 51.1 50.8 0.0 0.0 48.9 49.2
Belgium
1900 Social insurance 65 65 7.5 8.86 Annual subsidies 61.4 55.5 61.4 55.5 0.0 0.0 ... ...
2001 Means-tested non-contributory pension
65 65 n.a. n.a. Total cost
Bosnia and Herzegovina
Social insurance 65 65 17 7 .... ... ... ... ... ... ... ... ...
Bulgaria
1924 Social insurance, mandatory individual account
63.33 60.33 7.9 9.9 Any deficit 59.0 55.6 59.0 55.6 0.0 0.0 ... ...
Means-tested non-contributory pension
70 70 n.a. n.a. Total cost
Croatia 1922 Social insurance and mandatory individual account
65 60.25 25 No contribution Pays contribution for categories of state employees
52.8 47.0 52.8 47.0 0.0 0.0 0.0 0.0
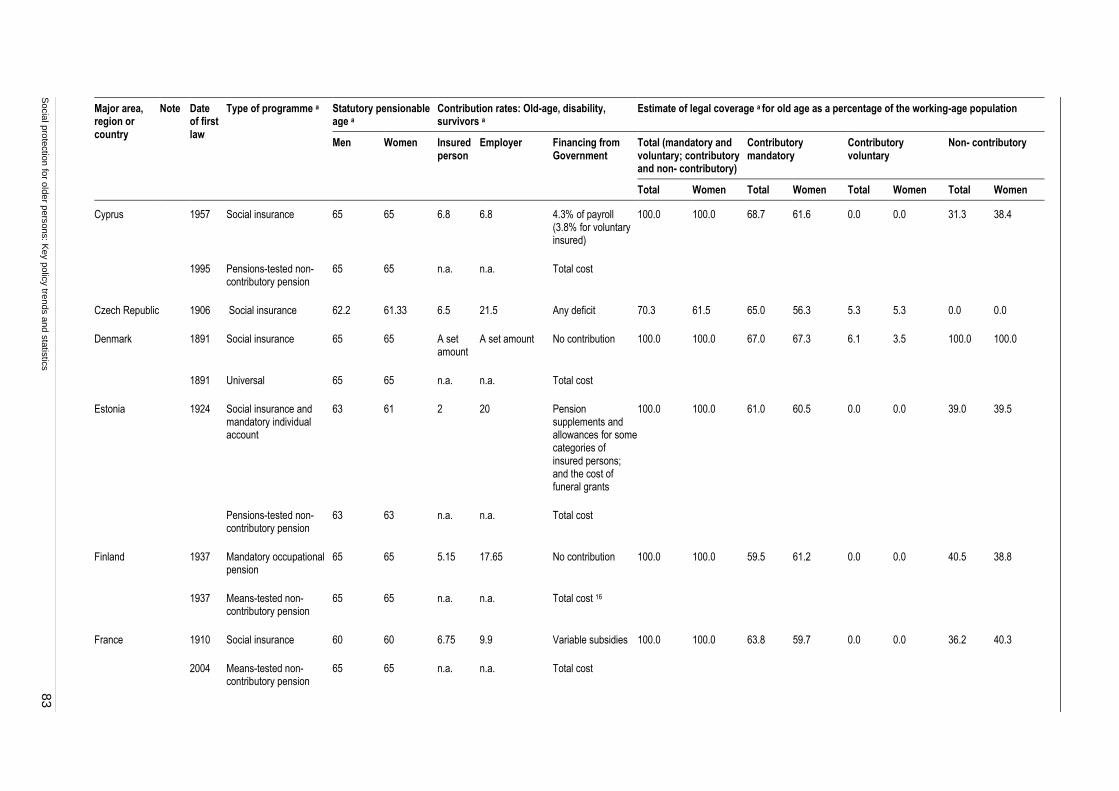
Socia
l pro
tectio
n fo
r old
er p
ers
ons: K
ey p
olic
y tre
nds a
nd s
tatis
tics
83
Major area, region or country
Note Date of first law
Type of programme a Statutory pensionable age a
Contribution rates: Old-age, disability, survivors a
Estimate of legal coverage a for old age as a percentage of the working-age population
Men Women Insured person
Employer Financing from Government
Total (mandatory and voluntary; contributory and non- contributory)
Contributory mandatory
Contributory voluntary
Non- contributory
Total Women Total Women Total Women Total Women
Cyprus
1957 Social insurance 65 65 6.8 6.8 4.3% of payroll (3.8% for voluntary insured)
100.0 100.0 68.7 61.6 0.0 0.0 31.3 38.4
1995 Pensions-tested non-contributory pension
65 65 n.a. n.a. Total cost
Czech Republic 1906 Social insurance 62.2 61.33 6.5 21.5 Any deficit 70.3 61.5 65.0 56.3 5.3 5.3 0.0 0.0
Denmark
1891 Social insurance 65 65 A set amount
A set amount No contribution 100.0 100.0 67.0 67.3 6.1 3.5 100.0 100.0
1891 Universal 65 65 n.a. n.a. Total cost
Estonia
1924
Social insurance and mandatory individual account
63 61 2 20 Pension supplements and allowances for some categories of insured persons; and the cost of funeral grants
100.0
100.0
61.0
60.5
0.0
0.0
39.0
39.5
Pensions-tested non-contributory pension
63 63 n.a. n.a. Total cost
Finland
1937 Mandatory occupational pension
65 65 5.15 17.65 No contribution 100.0 100.0 59.5 61.2 0.0 0.0 40.5 38.8
1937 Means-tested non-contributory pension
65 65 n.a. n.a. Total cost 16
France
1910 Social insurance 60 60 6.75 9.9 Variable subsidies 100.0 100.0 63.8 59.7 0.0 0.0 36.2 40.3
2004 Means-tested non-contributory pension
65 65 n.a. n.a. Total cost
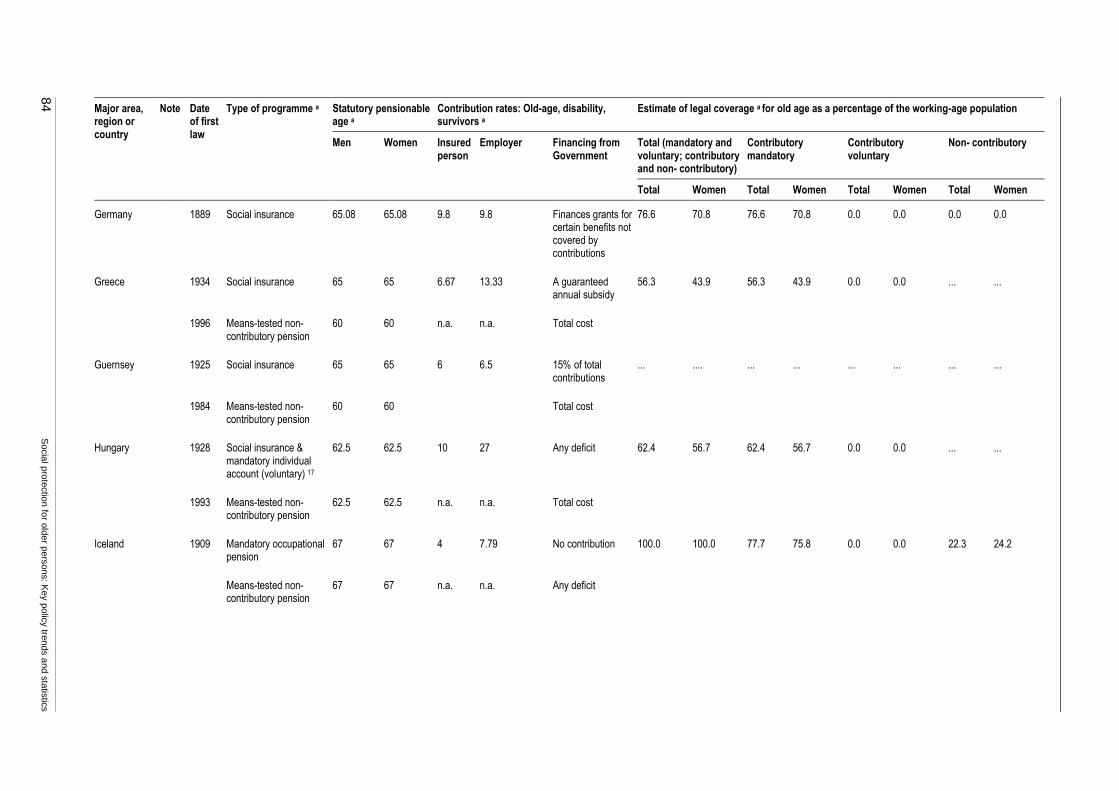
84
S
ocia
l pro
tectio
n fo
r old
er p
ers
ons: K
ey p
olic
y tre
nds a
nd s
tatis
tics
Major area, region or country
Note Date of first law
Type of programme a Statutory pensionable age a
Contribution rates: Old-age, disability, survivors a
Estimate of legal coverage a for old age as a percentage of the working-age population
Men Women Insured person
Employer Financing from Government
Total (mandatory and voluntary; contributory and non- contributory)
Contributory mandatory
Contributory voluntary
Non- contributory
Total Women Total Women Total Women Total Women
Germany 1889 Social insurance 65.08 65.08 9.8 9.8 Finances grants for certain benefits not covered by contributions
76.6 70.8 76.6 70.8 0.0 0.0 0.0 0.0
Greece
1934 Social insurance 65 65 6.67 13.33 A guaranteed annual subsidy
56.3 43.9 56.3 43.9 0.0 0.0 ... ...
1996 Means-tested non-contributory pension
60 60 n.a. n.a. Total cost
Guernsey
1925 Social insurance 65 65 6 6.5 15% of total contributions
... .... ... ... ... ... ... ...
1984 Means-tested non-contributory pension
60 60 Total cost
Hungary
1928 Social insurance & mandatory individual account (voluntary) 17
62.5 62.5 10 27 Any deficit 62.4 56.7 62.4 56.7 0.0 0.0 ... ...
1993 Means-tested non-contributory pension
62.5 62.5 n.a. n.a. Total cost
Iceland
1909
Mandatory occupational pension
67 67 4 7.79 No contribution 100.0 100.0 77.7 75.8 0.0 0.0 22.3 24.2
Means-tested non-contributory pension
67 67 n.a. n.a. Any deficit
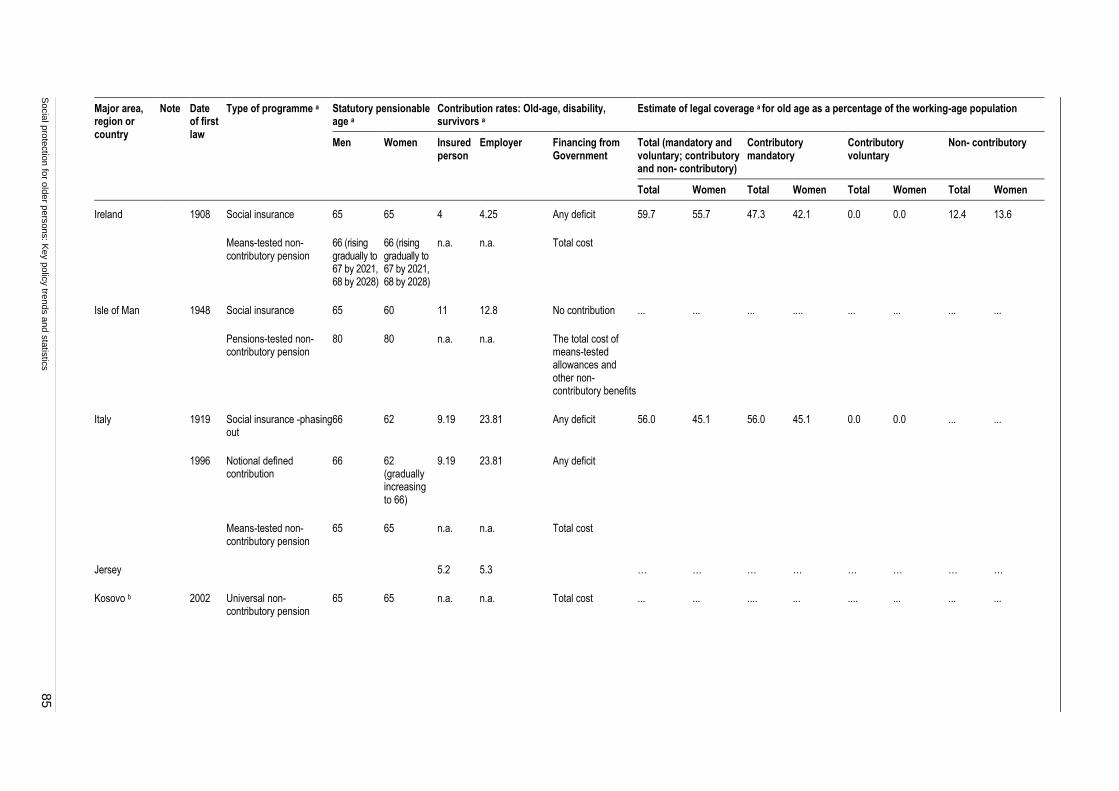
Socia
l pro
tectio
n fo
r old
er p
ers
ons: K
ey p
olic
y tre
nds a
nd s
tatis
tics
85
Major area, region or country
Note Date of first law
Type of programme a Statutory pensionable age a
Contribution rates: Old-age, disability, survivors a
Estimate of legal coverage a for old age as a percentage of the working-age population
Men Women Insured person
Employer Financing from Government
Total (mandatory and voluntary; contributory and non- contributory)
Contributory mandatory
Contributory voluntary
Non- contributory
Total Women Total Women Total Women Total Women
Ireland
1908
Social insurance 65 65 4 4.25 Any deficit 59.7 55.7 47.3 42.1 0.0 0.0 12.4 13.6
Means-tested non-contributory pension
66 (rising gradually to 67 by 2021, 68 by 2028)
66 (rising gradually to 67 by 2021, 68 by 2028)
n.a. n.a. Total cost
Isle of Man
1948
Social insurance 65 60 11 12.8 No contribution ... ... ... .... ... ... ... ...
Pensions-tested non-contributory pension
80 80 n.a. n.a. The total cost of means-tested allowances and other non-contributory benefits
Italy
1919 Social insurance -phasing out
66 62 9.19 23.81 Any deficit 56.0
45.1
56.0
45.1
0.0
0.0
...
...
1996
Notional defined contribution
66 62 (gradually increasing to 66)
9.19 23.81 Any deficit
Means-tested non-contributory pension
65 65 n.a. n.a. Total cost
Jersey 5.2 5.3 … … … … … … … …
Kosovo b 2002 Universal non-contributory pension
65 65 n.a. n.a. Total cost ... ... .... ... .... ... ... ...

86
S
ocia
l pro
tectio
n fo
r old
er p
ers
ons: K
ey p
olic
y tre
nds a
nd s
tatis
tics
Major area, region or country
Note Date of first law
Type of programme a Statutory pensionable age a
Contribution rates: Old-age, disability, survivors a
Estimate of legal coverage a for old age as a percentage of the working-age population
Men Women Insured person
Employer Financing from Government
Total (mandatory and voluntary; contributory and non- contributory)
Contributory mandatory
Contributory voluntary
Non- contributory
Total Women Total Women Total Women Total Women
Latvia
1922
Social insurance: notional defined contribution 18
62 62 11 24.09 Contributes for persons residing in Latvia caring for a child younger than 18 months and receiving child-care benefits, unemployed persons with disabilities, and certain social insurance beneficiaries
100.0 100.0 59.3 59.4 40.7 40.6 ... ...
Pensions-tested non-contributory pension
67 67 n.a. n.a. Total cost
Liechtenstein 1952 Social insurance and mandatory occupational pension
64 64 10.55 12.75 Contributes 50 million francs annually, adjusted according to changes in prices for social insurance
… … … … … … … …
Lithuania
1922 Social insurance 62.5 60 3 23.3 Any deficit 100.0 100.0 57.8 58.7 0.0 0.0 42.2 41.3
1994 Pensions-tested non-contributory pension
62.5 60 n.a. n.a. Total cost
Luxembourg 1911 Social insurance 65 65 8 8 8 63.6 60.3 68.2 60.3 0.0 0.0 0.0 0.0
Malta
1956
Social insurance 61 60 10 10 50% of the value of total contributions
56.1 39.2 56.1 39.2 0.0 0.0 ... ...
Means-tested non-contributory pension
60 60 n.a. n.a. Total cost
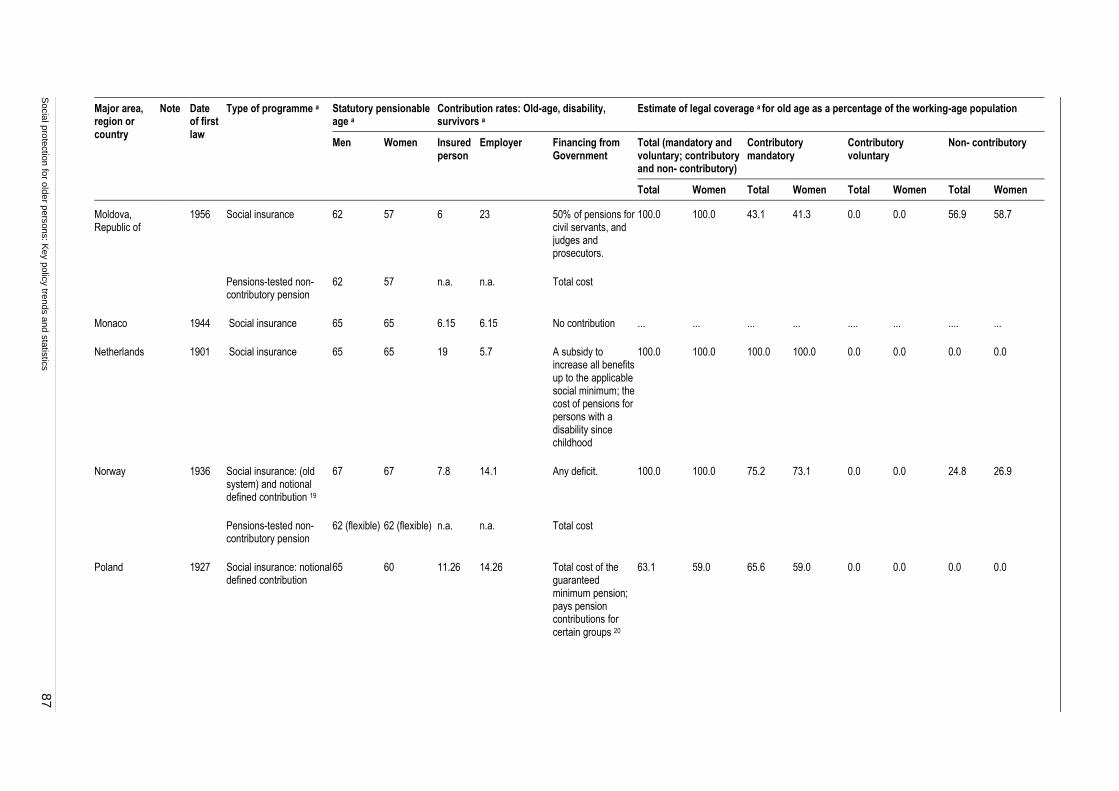
Socia
l pro
tectio
n fo
r old
er p
ers
ons: K
ey p
olic
y tre
nds a
nd s
tatis
tics
87
Major area, region or country
Note Date of first law
Type of programme a Statutory pensionable age a
Contribution rates: Old-age, disability, survivors a
Estimate of legal coverage a for old age as a percentage of the working-age population
Men Women Insured person
Employer Financing from Government
Total (mandatory and voluntary; contributory and non- contributory)
Contributory mandatory
Contributory voluntary
Non- contributory
Total Women Total Women Total Women Total Women
Moldova, Republic of
1956
Social insurance 62 57 6 23 50% of pensions for civil servants, and judges and prosecutors.
100.0 100.0 43.1 41.3 0.0 0.0 56.9 58.7
Pensions-tested non-contributory pension
62 57 n.a. n.a. Total cost
Monaco 1944 Social insurance 65 65 6.15 6.15 No contribution ... ... ... ... .... ... .... ...
Netherlands 1901 Social insurance 65 65 19 5.7 A subsidy to increase all benefits up to the applicable social minimum; the cost of pensions for persons with a disability since childhood
100.0 100.0 100.0 100.0 0.0 0.0 0.0 0.0
Norway
1936
Social insurance: (old system) and notional defined contribution 19
67 67 7.8 14.1 Any deficit. 100.0 100.0 75.2 73.1 0.0 0.0 24.8 26.9
Pensions-tested non-contributory pension
62 (flexible) 62 (flexible) n.a. n.a. Total cost
Poland 1927 Social insurance: notional defined contribution
65 60 11.26 14.26 Total cost of the guaranteed minimum pension; pays pension contributions for certain groups 20
63.1 59.0 65.6 59.0 0.0 0.0 0.0 0.0

88
S
ocia
l pro
tectio
n fo
r old
er p
ers
ons: K
ey p
olic
y tre
nds a
nd s
tatis
tics
Major area, region or country
Note Date of first law
Type of programme a Statutory pensionable age a
Contribution rates: Old-age, disability, survivors a
Estimate of legal coverage a for old age as a percentage of the working-age population
Men Women Insured person
Employer Financing from Government
Total (mandatory and voluntary; contributory and non- contributory)
Contributory mandatory
Contributory voluntary
Non- contributory
Total Women Total Women Total Women Total Women
Portugal
1935
Social insurance 65 65 11 23.25 No contribution 100.0 100.0 59.3 55.9 5.7 4.5 35.0 39.5
Means-tested non-contributory pension
65 65 n.a. n.a. Total cost
Romania 1912 Social insurance and individual account
64.25 59.25 10.5 31.3 Any deficit 65.9 55.4 63.0 55.4 0.0 0.0 0.0 0.0
Russian Federation
1922 Social insurance: notional defined contribution (NDC)
60 55 0 22 No contribution 100.0 100.0 66.2 62.7 0.0 0.0 33.8 37.3
2002 Pensions-tested non-contributory pension
65 60 n.a. n.a. The total cost of social pensions. Regional and local governments may finance supplementary benefits out of their own budgets
San Marino 1955 Social insurance and mandatory individual accounts 21
65 65 4.2 16.1 10% of total contributions (higher contributions are made for agricultural workers) or up to 25% to cover any deficit
68.9 59.5 65.7 57.5 0.0 0.0 0.0 0.0
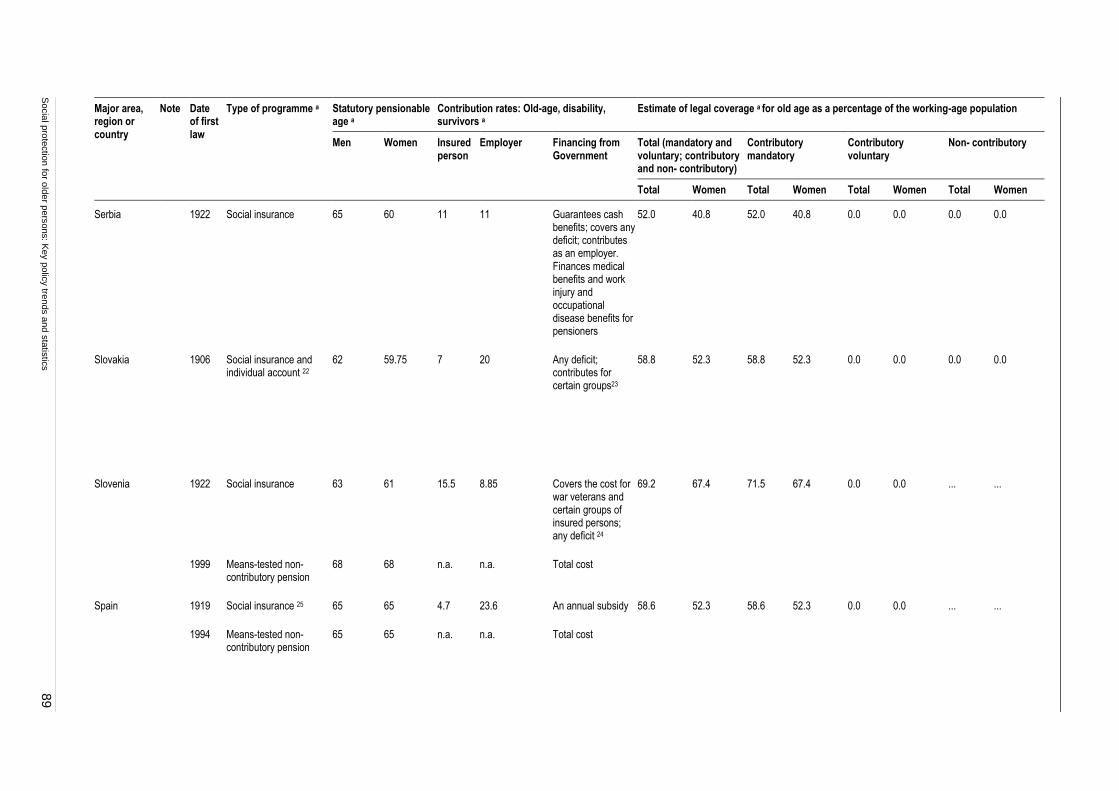
Socia
l pro
tectio
n fo
r old
er p
ers
ons: K
ey p
olic
y tre
nds a
nd s
tatis
tics
89
Major area, region or country
Note Date of first law
Type of programme a Statutory pensionable age a
Contribution rates: Old-age, disability, survivors a
Estimate of legal coverage a for old age as a percentage of the working-age population
Men Women Insured person
Employer Financing from Government
Total (mandatory and voluntary; contributory and non- contributory)
Contributory mandatory
Contributory voluntary
Non- contributory
Total Women Total Women Total Women Total Women
Serbia 1922 Social insurance 65 60 11 11 Guarantees cash benefits; covers any deficit; contributes as an employer. Finances medical benefits and work injury and occupational disease benefits for pensioners
52.0 40.8 52.0 40.8 0.0 0.0 0.0 0.0
Slovakia 1906 Social insurance and individual account 22
62 59.75 7 20 Any deficit; contributes for certain groups23
58.8 52.3 58.8 52.3 0.0 0.0 0.0 0.0
Slovenia
1922 Social insurance 63 61 15.5 8.85 Covers the cost for war veterans and certain groups of insured persons; any deficit 24
69.2 67.4 71.5 67.4 0.0 0.0 ... ...
1999 Means-tested non-contributory pension
68 68 n.a. n.a. Total cost
Spain
1919 Social insurance 25 65 65 4.7 23.6 An annual subsidy 58.6 52.3 58.6 52.3 0.0 0.0 ... ...
1994 Means-tested non-contributory pension
65 65 n.a. n.a. Total cost

90
S
ocia
l pro
tectio
n fo
r old
er p
ers
ons: K
ey p
olic
y tre
nds a
nd s
tatis
tics
Major area, region or country
Note Date of first law
Type of programme a Statutory pensionable age a
Contribution rates: Old-age, disability, survivors a
Estimate of legal coverage a for old age as a percentage of the working-age population
Men Women Insured person
Employer Financing from Government
Total (mandatory and voluntary; contributory and non- contributory)
Contributory mandatory
Contributory voluntary
Non- contributory
Total Women Total Women Total Women Total Women
Sweden
1913
Social insurance, notional defined contribution (NDC) and mandatory individual account.
65 65 7 10.21 The total cost of the guarantee pension and guaranteed disability pension (sickness compensation). The government pays earnings-related contributions for central government civil servants
100.0 100.0 69.0 68.1 0.0 0.0 31.0 31.9
Pensions-tested non-contributory pension
65 65 n.a. n.a. Total cost
Switzerland
1946
Social insurance and mandatory occupational pension
65 64 11.9 11.9 Base pension: Annual federal subsidies cover 19.55% of the cost of old-age and survivors benefits and 37.7% of the cost of disability benefits.
100.0 100.0 100.0 100.0 0.0 0.0 0.0 0.0
Pensions-tested non-contributory pension
65 64 n.a. n.a. Provided by the cantons
... ...
Turkey 1949 Social insurance 26 60 58 9 11 25% of total contributions collected by the Social Security Institution.
40.1 17.2 40.1 17.2 0.0 0.0 0.0 0.0

Socia
l pro
tectio
n fo
r old
er p
ers
ons: K
ey p
olic
y tre
nds a
nd s
tatis
tics
91
Major area, region or country
Note Date of first law
Type of programme a Statutory pensionable age a
Contribution rates: Old-age, disability, survivors a
Estimate of legal coverage a for old age as a percentage of the working-age population
Men Women Insured person
Employer Financing from Government
Total (mandatory and voluntary; contributory and non- contributory)
Contributory mandatory
Contributory voluntary
Non- contributory
Total Women Total Women Total Women Total Women
Ukraine
1922
Social insurance 60 55.5 2 33.2 Subsidies as needed for central and local governments
100.0 100.0 64.9 60.1 0.0 0.0 35.1 39.9
Means-tested non-contributory pension
63 58 n.a. n.a. The cost of state social benefits.
United Kingdom
1908
Social insurance 65 61 9.95 11.9 Treasury grant to contributory programmes for any deficit.
100.0 100.0 69.1 64.2 0.0 0.0 30.9 35.8
Means-tested non-contributory pension
60 60 n.a. n.a. The total cost of means-tested old-age pension and other non-contributory benefits
Latin America and the Caribbean
Antigua and Barbuda
1972 Social insurance 60 60 3 5 No contribution 59.8 56.9 59.8 56.9 0.0 0.0 ... ...
1993 Means-tested non-contributory pension
77 77 n.a. n.a. Total cost
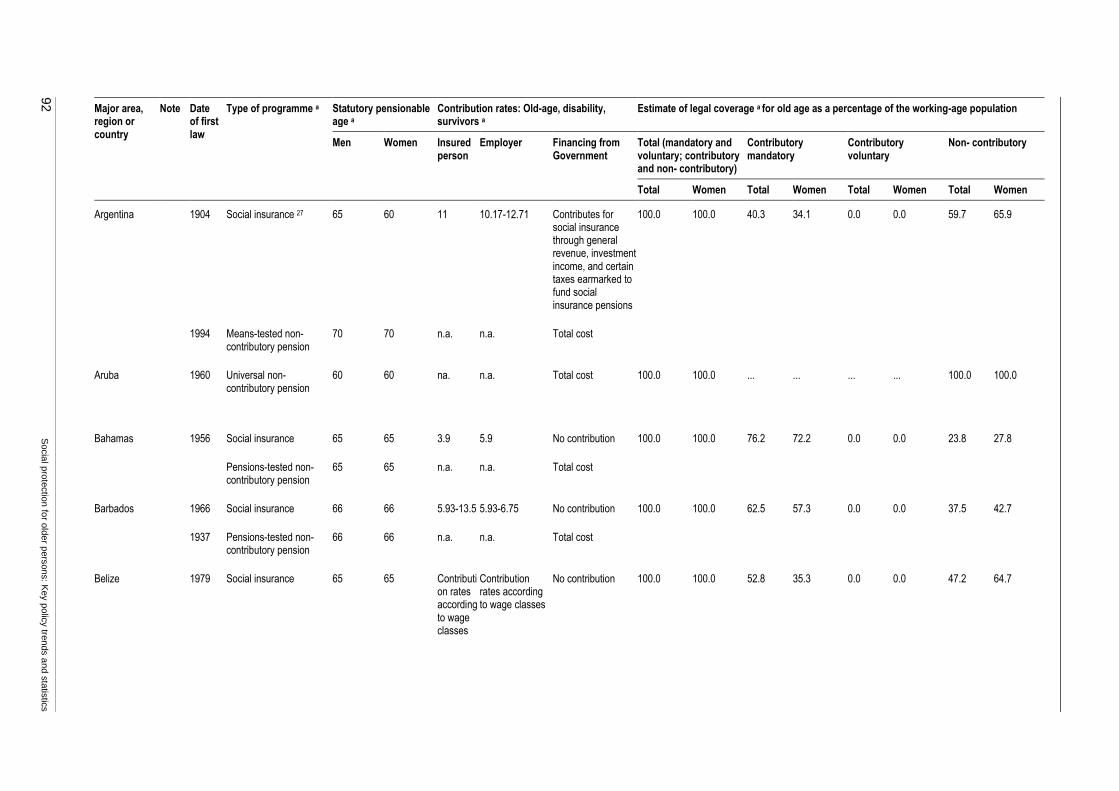
92
S
ocia
l pro
tectio
n fo
r old
er p
ers
ons: K
ey p
olic
y tre
nds a
nd s
tatis
tics
Major area, region or country
Note Date of first law
Type of programme a Statutory pensionable age a
Contribution rates: Old-age, disability, survivors a
Estimate of legal coverage a for old age as a percentage of the working-age population
Men Women Insured person
Employer Financing from Government
Total (mandatory and voluntary; contributory and non- contributory)
Contributory mandatory
Contributory voluntary
Non- contributory
Total Women Total Women Total Women Total Women
Argentina
1904 Social insurance 27 65 60 11 10.17-12.71 Contributes for social insurance through general revenue, investment income, and certain taxes earmarked to fund social insurance pensions
100.0 100.0 40.3 34.1 0.0 0.0 59.7 65.9
1994 Means-tested non-contributory pension
70 70 n.a. n.a. Total cost
Aruba 1960 Universal non-contributory pension
60 60 na. n.a. Total cost 100.0 100.0 ... ... ... ... 100.0 100.0
Bahamas
1956
Social insurance 65 65 3.9 5.9 No contribution 100.0 100.0 76.2 72.2 0.0 0.0 23.8 27.8
Pensions-tested non-contributory pension
65 65 n.a. n.a. Total cost
Barbados
1966 Social insurance 66 66 5.93-13.5 5.93-6.75 No contribution 100.0 100.0 62.5 57.3 0.0 0.0 37.5 42.7
1937 Pensions-tested non-contributory pension
66 66 n.a. n.a. Total cost
Belize
1979 Social insurance 65 65 Contribution rates according to wage classes
Contribution rates according to wage classes
No contribution 100.0 100.0 52.8 35.3 0.0 0.0 47.2 64.7

Socia
l pro
tectio
n fo
r old
er p
ers
ons: K
ey p
olic
y tre
nds a
nd s
tatis
tics
93
Major area, region or country
Note Date of first law
Type of programme a Statutory pensionable age a
Contribution rates: Old-age, disability, survivors a
Estimate of legal coverage a for old age as a percentage of the working-age population
Men Women Insured person
Employer Financing from Government
Total (mandatory and voluntary; contributory and non- contributory)
Contributory mandatory
Contributory voluntary
Non- contributory
Total Women Total Women Total Women Total Women
2003 Means-tested non-contributory pension
67 65 n.a. n.a. The total cost of non-contributory pension is met by the Social Security Board
Bermuda
1967 Social insurance 65 65 Flat rate Flat rate No contribution ... ... ... ... ... ... ... ...
1998
Mandatory occupational pension
65 65 5 5 No contribution
Pensions-tested non-contributory pension
65 65 n.a. n.a. Total cost
Bolivia (Plurinational State of)
1949 Mandatory individual account with solidarity pensions 28
58 58 (minus one per child, for a maximum of three children)
12.71 2 or 3 Finances the value of accrued rights under the social insurance system and the funeral grant. There is solidarity in the system through the Basic Pension Account (financing the additional cost of the minimum pension)
100.0 100.0 24.7 13.9 28.4 21.9 46.9 64.2
1996 Universal non-contributory pension
60 60 n.a. n.a. Total cost: special earmarked sources in the budget (carbohydrate taxes)
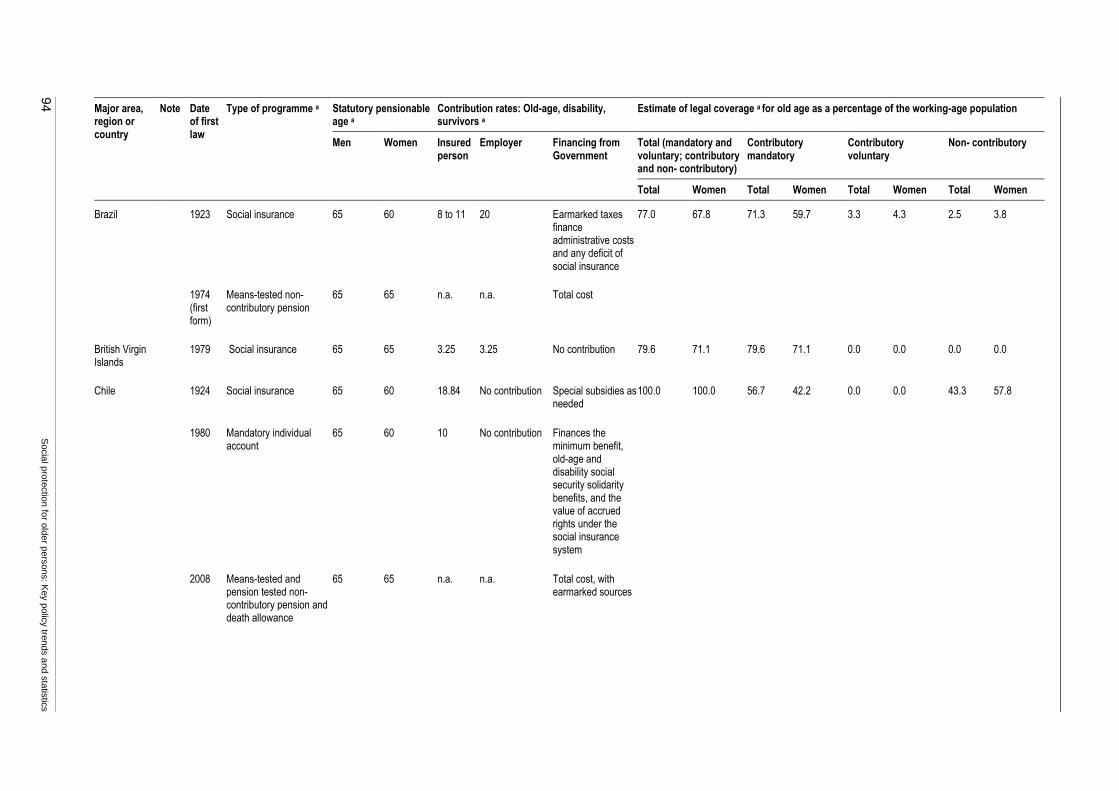
94
S
ocia
l pro
tectio
n fo
r old
er p
ers
ons: K
ey p
olic
y tre
nds a
nd s
tatis
tics
Major area, region or country
Note Date of first law
Type of programme a Statutory pensionable age a
Contribution rates: Old-age, disability, survivors a
Estimate of legal coverage a for old age as a percentage of the working-age population
Men Women Insured person
Employer Financing from Government
Total (mandatory and voluntary; contributory and non- contributory)
Contributory mandatory
Contributory voluntary
Non- contributory
Total Women Total Women Total Women Total Women
Brazil
1923 Social insurance 65 60 8 to 11 20 Earmarked taxes finance administrative costs and any deficit of social insurance
77.0 67.8 71.3 59.7 3.3 4.3 2.5 3.8
1974 (first form)
Means-tested non-contributory pension
65 65 n.a. n.a. Total cost
British Virgin Islands
1979 Social insurance 65 65 3.25 3.25 No contribution 79.6 71.1 79.6 71.1 0.0 0.0 0.0 0.0
Chile
1924 Social insurance 65 60 18.84 No contribution Special subsidies as needed
100.0 100.0 56.7 42.2 0.0 0.0 43.3 57.8
1980 Mandatory individual account
65 60 10 No contribution Finances the minimum benefit, old-age and disability social security solidarity benefits, and the value of accrued rights under the social insurance system
2008 Means-tested and pension tested non-contributory pension and death allowance
65 65 n.a. n.a. Total cost, with earmarked sources

Socia
l pro
tectio
n fo
r old
er p
ers
ons: K
ey p
olic
y tre
nds a
nd s
tatis
tics
95
Major area, region or country
Note Date of first law
Type of programme a Statutory pensionable age a
Contribution rates: Old-age, disability, survivors a
Estimate of legal coverage a for old age as a percentage of the working-age population
Men Women Insured person
Employer Financing from Government
Total (mandatory and voluntary; contributory and non- contributory)
Contributory mandatory
Contributory voluntary
Non- contributory
Total Women Total Women Total Women Total Women
Colombia
1946 Social insurance and individual account
60 55 4 12 Partially finances the Solidarity and Guarantee Fund
60.0 46.4 60.0 46.4 0.0 0.0 ... ...
2003 Means-tested non-contributory pension
57 52 n.a. n.a. Mainly funded from state budget with dedicated contribution of high earners is also.
Costa Rica 29
1941 Social insurance and individual account
65 65 3.67 8.17 0.41% of the gross income of all workers and self-employed persons for social insurance
61.1 44.2 61.1 44.2 0.0 0.0 0.0 0.0
1974 Means-tested non-contributory pension
65 65 n.a. n.a. 20% of the total income of the Social Development and Family Allowances Fund and earmarked taxes (tabacoo and alcohol)
Cuba
1963
Social insurance 65 60 1 to 5 12.5- 14.5 Any deficit 100.0 100.0 53.7 46.6 0.0 0.0 46.3 53.4
Means-tested non-contributory pension
65 60 n.a. n.a. n.a.
Dominica 1970 Social insurance 60 60 4 6.75 No contribution 50.2 39.8 50.2 39.8 0.0 0.0 0.0 0.0

96
S
ocia
l pro
tectio
n fo
r old
er p
ers
ons: K
ey p
olic
y tre
nds a
nd s
tatis
tics
Major area, region or country
Note Date of first law
Type of programme a Statutory pensionable age a
Contribution rates: Old-age, disability, survivors a
Estimate of legal coverage a for old age as a percentage of the working-age population
Men Women Insured person
Employer Financing from Government
Total (mandatory and voluntary; contributory and non- contributory)
Contributory mandatory
Contributory voluntary
Non- contributory
Total Women Total Women Total Women Total Women
Dominican Republic
1947
Mandatory individual accounts
60 60 2.87 7.1 Finances the the guaranteed minimum pension and other subsidies as needed
... ... ... ... ... ... ... ...
Means-tested non-contributory pension
60 60 n.a. n.a. Total cost
Ecuador
1928 Social insurance 60 60 6.64- 8.64 1 to 3.1 40% of the cost of old-age, disability, and survivor social insurance pensions
60.2 44.0 62.0 44.0 0.0 0.0 ... ...
2003 Means-tested non-contributory pension
65 65 n.a. n.a.
El Salvador
1953 Social insurance and mandatory individual account.
60 55 6.25 4.05 Finances the guaranteed minimum pension of mandatory individual account and special subsidies as needed to finance social insurance. Finances the value of accrued rights under the social insurance system
55.1 43.6 55.1 43.6 0.0 0.0 0.0 0.0
2009 Means-tested and geographically targeted non-contributory pension
70 70 n.a. n.a. Total cost from general revenue
Grenada 1969 Social insurance 60 60 4 5 No contribution 51.9 41.8 51.9 41.8 0.0 0.0 0.0 0.0

Socia
l pro
tectio
n fo
r old
er p
ers
ons: K
ey p
olic
y tre
nds a
nd s
tatis
tics
97
Major area, region or country
Note Date of first law
Type of programme a Statutory pensionable age a
Contribution rates: Old-age, disability, survivors a
Estimate of legal coverage a for old age as a percentage of the working-age population
Men Women Insured person
Employer Financing from Government
Total (mandatory and voluntary; contributory and non- contributory)
Contributory mandatory
Contributory voluntary
Non- contributory
Total Women Total Women Total Women Total Women
Guatemala 1977 Social insurance 60 60 1.83 3.67 25% of total contributions paid (not yet implemented)
55.4 38.4 51.1 0.0 22.8 0.0 0.0 0.0
Guyana
1944 Social insurance 60 60 5.2 7.8 Provides loans to cover any deficit
100.0 100.0 47.6 27.5 0.0 0.0 100.0 100.0
2003 Universal non-contributory pension
65 65 n.a. n.a. Total cost
Haiti 1965 Social insurance 55 55 6 6 Subsidies as needed
10.5 10.3 10.5 10.3 0.0 0.0 0.0 0.0
Honduras 1959 Social insurance 65 60 1 2 0.5% of covered payroll
55.3 37.4 30.0 18.4 25.3 19.0 0.0 0.0
Jamaica
1965 Social insurance 65 60 2.5 2.5 No contribution 68.1 57.9 68.1 57.9 0.0 0.0 ... ...
Means-tested non-contributory pension
60 60 n.a. n.a. Total cost
Mexico
1943
Social insurance and mandatory individual account
65 65 1.75 6.9 0.225% of covered earnings and a contribution from Government finances the guaranteed minimum pension. 30
53.7 37.5 37.8 26.8 16.0 10.7 0.0 0.0
Pensions-tested non-contributory pension
65 65 n.a. n.a. Total cost 100.0 100.0 46.3 62.5
Nicaragua 1956 Social insurance 60 60 4 7 No contribution 55.9 41.9 55.9 0.0 23.9 0.0 0.0 0.0

98
S
ocia
l pro
tectio
n fo
r old
er p
ers
ons: K
ey p
olic
y tre
nds a
nd s
tatis
tics
Major area, region or country
Note Date of first law
Type of programme a Statutory pensionable age a
Contribution rates: Old-age, disability, survivors a
Estimate of legal coverage a for old age as a percentage of the working-age population
Men Women Insured person
Employer Financing from Government
Total (mandatory and voluntary; contributory and non- contributory)
Contributory mandatory
Contributory voluntary
Non- contributory
Total Women Total Women Total Women Total Women
Panama 1941 Social insurance and individual account.
62 57 9.25 4.25 A deposit of 140 million balboas a year to a reserve fund for old-age, disability, and survivors' social insurance benefits yearly until 2060
65.6 47.3 56.3 41.8 9.3 5.5 0.0 0.0
Paraguay 1943 Social insurance 60 60 9 14 1.5% of gross earnings.
38.2 47.4 38.2 47.4 0.0 0.0 0.0 0.0
Peru
1936 Social insurance and individual account 31
65 65 13 13 Cost of minimum pension and subsidies as needed for social insurance
67.0 61.2 67.0 ... 27.0 ... 0.0 0.0
2011 Means-tested non-contributory pension
65 65 n.a. n.a. Total cost
Saint Kitts and Nevis
1968 Social insurance 62 62 5 5 No contribution 56.9 35.1 56.9 35.1 0.0 0.0 ... ...
1998 Means-tested non-contributory pension
62 62 n.a. n.a. Total cost
Saint Lucia 1970 Social insurance 63 63 5 5 No contribution 65.7 56.6 65.7 56.6 0.0 0.0 0.0 0.0
Saint Vincent and the Grenadines
1970 Social insurance 60 60 3.5 4.5 No contribution 56.8 46.2 56.8 46.2 0.0 0.0 ... ...
2010 Means-tested non-contributory pension
65 65 n.a. n.a. Total cost
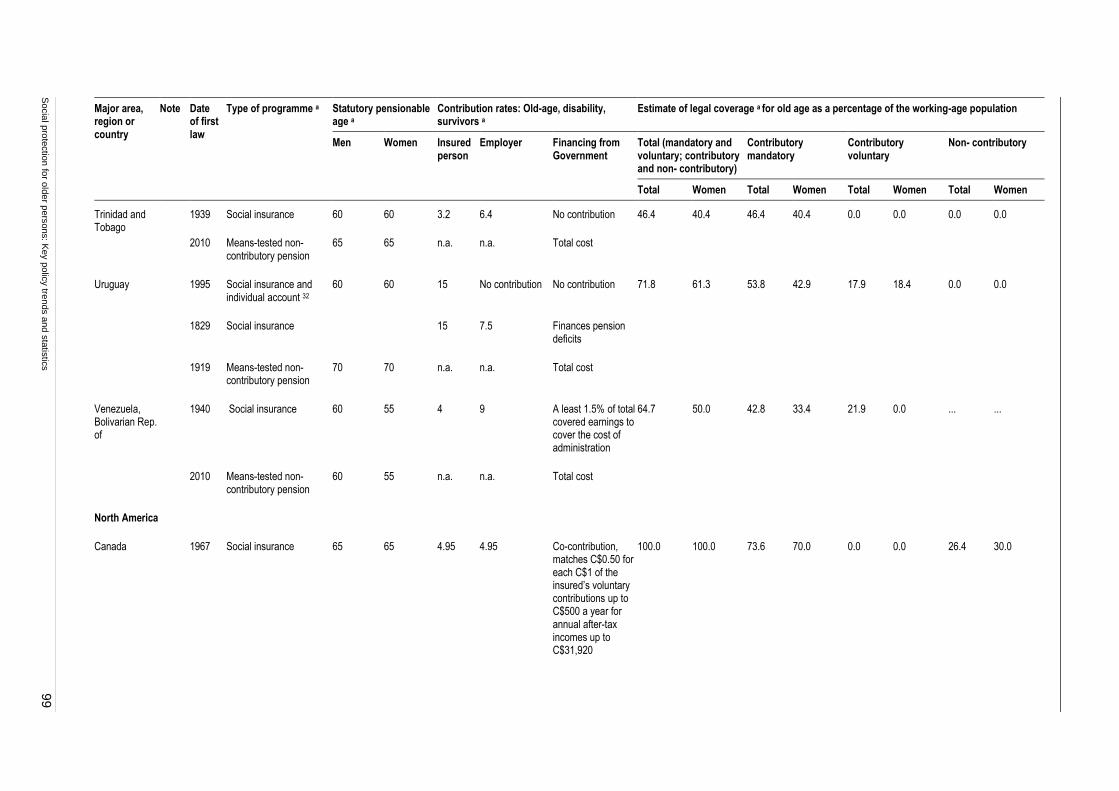
Socia
l pro
tectio
n fo
r old
er p
ers
ons: K
ey p
olic
y tre
nds a
nd s
tatis
tics
99
Major area, region or country
Note Date of first law
Type of programme a Statutory pensionable age a
Contribution rates: Old-age, disability, survivors a
Estimate of legal coverage a for old age as a percentage of the working-age population
Men Women Insured person
Employer Financing from Government
Total (mandatory and voluntary; contributory and non- contributory)
Contributory mandatory
Contributory voluntary
Non- contributory
Total Women Total Women Total Women Total Women
Trinidad and Tobago
1939 Social insurance 60 60 3.2 6.4 No contribution 46.4 40.4 46.4 40.4 0.0 0.0 0.0 0.0
2010 Means-tested non-contributory pension
65 65 n.a. n.a. Total cost
Uruguay
1995 Social insurance and individual account 32
60 60 15 No contribution No contribution 71.8
61.3
53.8
42.9
17.9
18.4
0.0
0.0
1829 Social insurance 15 7.5 Finances pension deficits
1919 Means-tested non-contributory pension
70 70 n.a. n.a. Total cost
Venezuela, Bolivarian Rep. of
1940 Social insurance 60 55 4 9 A least 1.5% of total covered earnings to cover the cost of administration
64.7 50.0 42.8 33.4 21.9 0.0 ... ...
2010 Means-tested non-contributory pension
60 55 n.a. n.a. Total cost
North America
Canada
1967 Social insurance 65 65 4.95 4.95 Co-contribution, matches C$0.50 for each C$1 of the insured’s voluntary contributions up to C$500 a year for annual after-tax incomes up to C$31,920
100.0 100.0 73.6 70.0 0.0 0.0 26.4 30.0
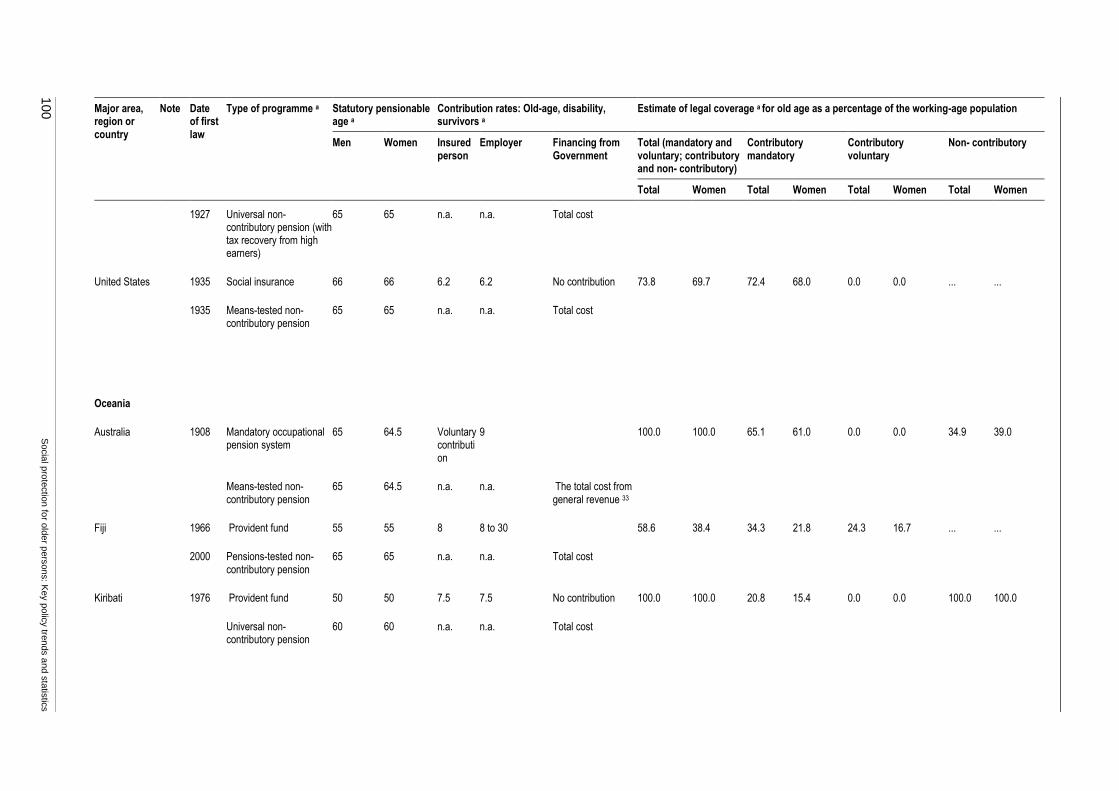
100
S
ocia
l pro
tectio
n fo
r old
er p
ers
ons: K
ey p
olic
y tre
nds a
nd s
tatis
tics
Major area, region or country
Note Date of first law
Type of programme a Statutory pensionable age a
Contribution rates: Old-age, disability, survivors a
Estimate of legal coverage a for old age as a percentage of the working-age population
Men Women Insured person
Employer Financing from Government
Total (mandatory and voluntary; contributory and non- contributory)
Contributory mandatory
Contributory voluntary
Non- contributory
Total Women Total Women Total Women Total Women
1927 Universal non-contributory pension (with tax recovery from high earners)
65 65 n.a. n.a. Total cost
United States
1935 Social insurance 66 66 6.2 6.2 No contribution 73.8 69.7 72.4 68.0 0.0 0.0 ... ...
1935 Means-tested non-contributory pension
65 65 n.a. n.a. Total cost
Oceania
Australia
1908
Mandatory occupational pension system
65 64.5 Voluntary contribution
9 100.0 100.0 65.1 61.0 0.0 0.0 34.9 39.0
Means-tested non-contributory pension
65 64.5 n.a. n.a. The total cost from general revenue 33
Fiji
1966 Provident fund 55 55 8 8 to 30 58.6 38.4 34.3 21.8 24.3 16.7 ... ...
2000 Pensions-tested non-contributory pension
65 65 n.a. n.a. Total cost
Kiribati
1976 Provident fund 50 50 7.5 7.5 No contribution 100.0 100.0 20.8 15.4 0.0 0.0 100.0 100.0
Universal non-contributory pension
60 60 n.a. n.a. Total cost

Socia
l pro
tectio
n fo
r old
er p
ers
ons: K
ey p
olic
y tre
nds a
nd s
tatis
tics
101
Major area, region or country
Note Date of first law
Type of programme a Statutory pensionable age a
Contribution rates: Old-age, disability, survivors a
Estimate of legal coverage a for old age as a percentage of the working-age population
Men Women Insured person
Employer Financing from Government
Total (mandatory and voluntary; contributory and non- contributory)
Contributory mandatory
Contributory voluntary
Non- contributory
Total Women Total Women Total Women Total Women
Marshall Islands
1967 Social insurance 60 60 7 7 No contribution 55.0 33.3 55.0 33.3 0.0 0.0 0.0 0.0
Micronesia (Fed. States of)
1968 Social insurance 65 65 7.5 7,5 34 No contribution
New Zealand 1898 Universal non-contributory pension with means-tested top-up
65 65 n.a. n.a. Total cost 100.0 100.0 0.0 0.0 0.0 0.0 100.0 100.0
Palau Islands 1967 Social insurance 60 60 6 6 No contribution
Papua New Guinea
1980 Provident fund 55 55 6 8.4 No contribution 15.5 15.7 6.2 6.3 9.3 9.4 0.0 0.0
Samoa
1972
Provident fund with annuity option
55 55 5 5 No contribution 100.0 100.0 23.5 17.9 2.3 1.6 74.2 80.5
Universal 65 65 n.a. n.a. Total cost
Solomon Islands
1973 Provident fund 50 50 5 7.5 No contribution 10.1 5.5 10.1 5.5 0.0 0.0 0.0 0.0
Vanuatu 1986 Provident fund 55 55 4 4 No contribution 61.7 53.3 17.9 13.3 43.8 40.0 0.0 0.0
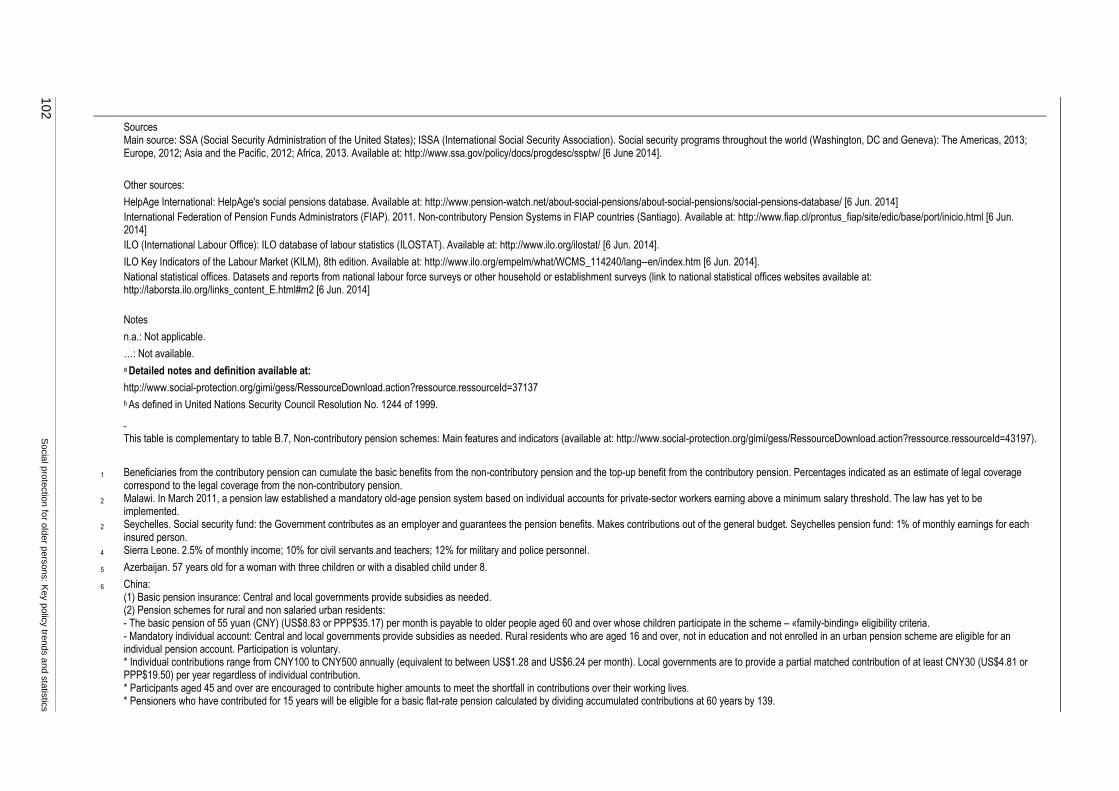
102
S
ocia
l pro
tectio
n fo
r old
er p
ers
ons: K
ey p
olic
y tre
nds a
nd s
tatis
tics
Sources
Main source: SSA (Social Security Administration of the United States); ISSA (International Social Security Association). Social security programs throughout the world (Washington, DC and Geneva): The Americas, 2013; Europe, 2012; Asia and the Pacific, 2012; Africa, 2013. Available at: http://www.ssa.gov/policy/docs/progdesc/ssptw/ [6 June 2014].
Other sources:
HelpAge International: HelpAge's social pensions database. Available at: http://www.pension-watch.net/about-social-pensions/about-social-pensions/social-pensions-database/ [6 Jun. 2014]
International Federation of Pension Funds Administrators (FIAP). 2011. Non-contributory Pension Systems in FIAP countries (Santiago). Available at: http://www.fiap.cl/prontus_fiap/site/edic/base/port/inicio.html [6 Jun. 2014]
ILO (International Labour Office): ILO database of labour statistics (ILOSTAT). Available at: http://www.ilo.org/ilostat/ [6 Jun. 2014].
ILO Key Indicators of the Labour Market (KILM), 8th edition. Available at: http://www.ilo.org/empelm/what/WCMS_114240/lang--en/index.htm [6 Jun. 2014].
National statistical offices. Datasets and reports from national labour force surveys or other household or establishment surveys (link to national statistical offices websites available at: http://laborsta.ilo.org/links_content_E.html#m2 [6 Jun. 2014]
Notes
n.a.: Not applicable.
…: Not available.
a Detailed notes and definition available at:
http://www.social-protection.org/gimi/gess/RessourceDownload.action?ressource.ressourceId=37137
b As defined in United Nations Security Council Resolution No. 1244 of 1999.
This table is complementary to table B.7, Non-contributory pension schemes: Main features and indicators (available at: http://www.social-protection.org/gimi/gess/RessourceDownload.action?ressource.ressourceId=43197).
1 Beneficiaries from the contributory pension can cumulate the basic benefits from the non-contributory pension and the top-up benefit from the contributory pension. Percentages indicated as an estimate of legal coverage correspond to the legal coverage from the non-contributory pension.
2 Malawi. In March 2011, a pension law established a mandatory old-age pension system based on individual accounts for private-sector workers earning above a minimum salary threshold. The law has yet to be implemented.
2 Seychelles. Social security fund: the Government contributes as an employer and guarantees the pension benefits. Makes contributions out of the general budget. Seychelles pension fund: 1% of monthly earnings for each insured person.
4 Sierra Leone. 2.5% of monthly income; 10% for civil servants and teachers; 12% for military and police personnel.
5 Azerbaijan. 57 years old for a woman with three children or with a disabled child under 8.
6 China: (1) Basic pension insurance: Central and local governments provide subsidies as needed. (2) Pension schemes for rural and non salaried urban residents: - The basic pension of 55 yuan (CNY) (US$8.83 or PPP$35.17) per month is payable to older people aged 60 and over whose children participate in the scheme – «family-binding» eligibility criteria. - Mandatory individual account: Central and local governments provide subsidies as needed. Rural residents who are aged 16 and over, not in education and not enrolled in an urban pension scheme are eligible for an individual pension account. Participation is voluntary. * Individual contributions range from CNY100 to CNY500 annually (equivalent to between US$1.28 and US$6.24 per month). Local governments are to provide a partial matched contribution of at least CNY30 (US$4.81 or PPP$19.50) per year regardless of individual contribution. * Participants aged 45 and over are encouraged to contribute higher amounts to meet the shortfall in contributions over their working lives. * Pensioners who have contributed for 15 years will be eligible for a basic flat-rate pension calculated by dividing accumulated contributions at 60 years by 139.
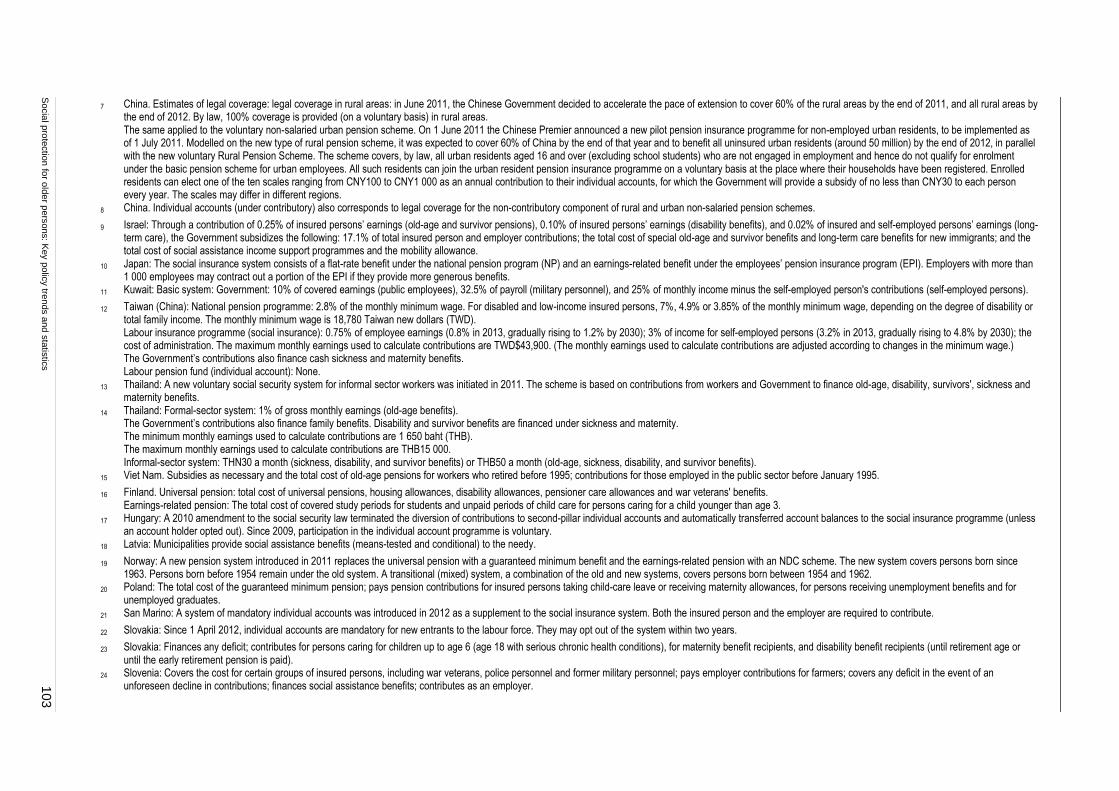
Socia
l pro
tectio
n fo
r old
er p
ers
ons: K
ey p
olic
y tre
nds a
nd s
tatis
tics
103
7 China. Estimates of legal coverage: legal coverage in rural areas: in June 2011, the Chinese Government decided to accelerate the pace of extension to cover 60% of the rural areas by the end of 2011, and all rural areas by the end of 2012. By law, 100% coverage is provided (on a voluntary basis) in rural areas. The same applied to the voluntary non-salaried urban pension scheme. On 1 June 2011 the Chinese Premier announced a new pilot pension insurance programme for non-employed urban residents, to be implemented as of 1 July 2011. Modelled on the new type of rural pension scheme, it was expected to cover 60% of China by the end of that year and to benefit all uninsured urban residents (around 50 million) by the end of 2012, in parallel with the new voluntary Rural Pension Scheme. The scheme covers, by law, all urban residents aged 16 and over (excluding school students) who are not engaged in employment and hence do not qualify for enrolment under the basic pension scheme for urban employees. All such residents can join the urban resident pension insurance programme on a voluntary basis at the place where their households have been registered. Enrolled residents can elect one of the ten scales ranging from CNY100 to CNY1 000 as an annual contribution to their individual accounts, for which the Government will provide a subsidy of no less than CNY30 to each person every year. The scales may differ in different regions.
8 China. Individual accounts (under contributory) also corresponds to legal coverage for the non-contributory component of rural and urban non-salaried pension schemes.
9 Israel: Through a contribution of 0.25% of insured persons’ earnings (old-age and survivor pensions), 0.10% of insured persons’ earnings (disability benefits), and 0.02% of insured and self-employed persons’ earnings (long-term care), the Government subsidizes the following: 17.1% of total insured person and employer contributions; the total cost of special old-age and survivor benefits and long-term care benefits for new immigrants; and the total cost of social assistance income support programmes and the mobility allowance.
10 Japan: The social insurance system consists of a flat-rate benefit under the national pension program (NP) and an earnings-related benefit under the employees’ pension insurance program (EPI). Employers with more than 1 000 employees may contract out a portion of the EPI if they provide more generous benefits.
11 Kuwait: Basic system: Government: 10% of covered earnings (public employees), 32.5% of payroll (military personnel), and 25% of monthly income minus the self-employed person's contributions (self-employed persons).
12 Taiwan (China): National pension programme: 2.8% of the monthly minimum wage. For disabled and low-income insured persons, 7%, 4.9% or 3.85% of the monthly minimum wage, depending on the degree of disability or total family income. The monthly minimum wage is 18,780 Taiwan new dollars (TWD). Labour insurance programme (social insurance): 0.75% of employee earnings (0.8% in 2013, gradually rising to 1.2% by 2030); 3% of income for self-employed persons (3.2% in 2013, gradually rising to 4.8% by 2030); the cost of administration. The maximum monthly earnings used to calculate contributions are TWD$43,900. (The monthly earnings used to calculate contributions are adjusted according to changes in the minimum wage.) The Government’s contributions also finance cash sickness and maternity benefits. Labour pension fund (individual account): None.
13 Thailand: A new voluntary social security system for informal sector workers was initiated in 2011. The scheme is based on contributions from workers and Government to finance old-age, disability, survivors', sickness and maternity benefits.
14 Thailand: Formal-sector system: 1% of gross monthly earnings (old-age benefits). The Government’s contributions also finance family benefits. Disability and survivor benefits are financed under sickness and maternity. The minimum monthly earnings used to calculate contributions are 1 650 baht (THB). The maximum monthly earnings used to calculate contributions are THB15 000. Informal-sector system: THN30 a month (sickness, disability, and survivor benefits) or THB50 a month (old-age, sickness, disability, and survivor benefits).
15 Viet Nam. Subsidies as necessary and the total cost of old-age pensions for workers who retired before 1995; contributions for those employed in the public sector before January 1995.
16 Finland. Universal pension: total cost of universal pensions, housing allowances, disability allowances, pensioner care allowances and war veterans' benefits. Earnings-related pension: The total cost of covered study periods for students and unpaid periods of child care for persons caring for a child younger than age 3.
17 Hungary: A 2010 amendment to the social security law terminated the diversion of contributions to second-pillar individual accounts and automatically transferred account balances to the social insurance programme (unless an account holder opted out). Since 2009, participation in the individual account programme is voluntary.
18 Latvia: Municipalities provide social assistance benefits (means-tested and conditional) to the needy.
19 Norway: A new pension system introduced in 2011 replaces the universal pension with a guaranteed minimum benefit and the earnings-related pension with an NDC scheme. The new system covers persons born since 1963. Persons born before 1954 remain under the old system. A transitional (mixed) system, a combination of the old and new systems, covers persons born between 1954 and 1962.
20 Poland: The total cost of the guaranteed minimum pension; pays pension contributions for insured persons taking child-care leave or receiving maternity allowances, for persons receiving unemployment benefits and for unemployed graduates.
21 San Marino: A system of mandatory individual accounts was introduced in 2012 as a supplement to the social insurance system. Both the insured person and the employer are required to contribute.
22 Slovakia: Since 1 April 2012, individual accounts are mandatory for new entrants to the labour force. They may opt out of the system within two years.
23 Slovakia: Finances any deficit; contributes for persons caring for children up to age 6 (age 18 with serious chronic health conditions), for maternity benefit recipients, and disability benefit recipients (until retirement age or until the early retirement pension is paid).
24 Slovenia: Covers the cost for certain groups of insured persons, including war veterans, police personnel and former military personnel; pays employer contributions for farmers; covers any deficit in the event of an unforeseen decline in contributions; finances social assistance benefits; contributes as an employer.
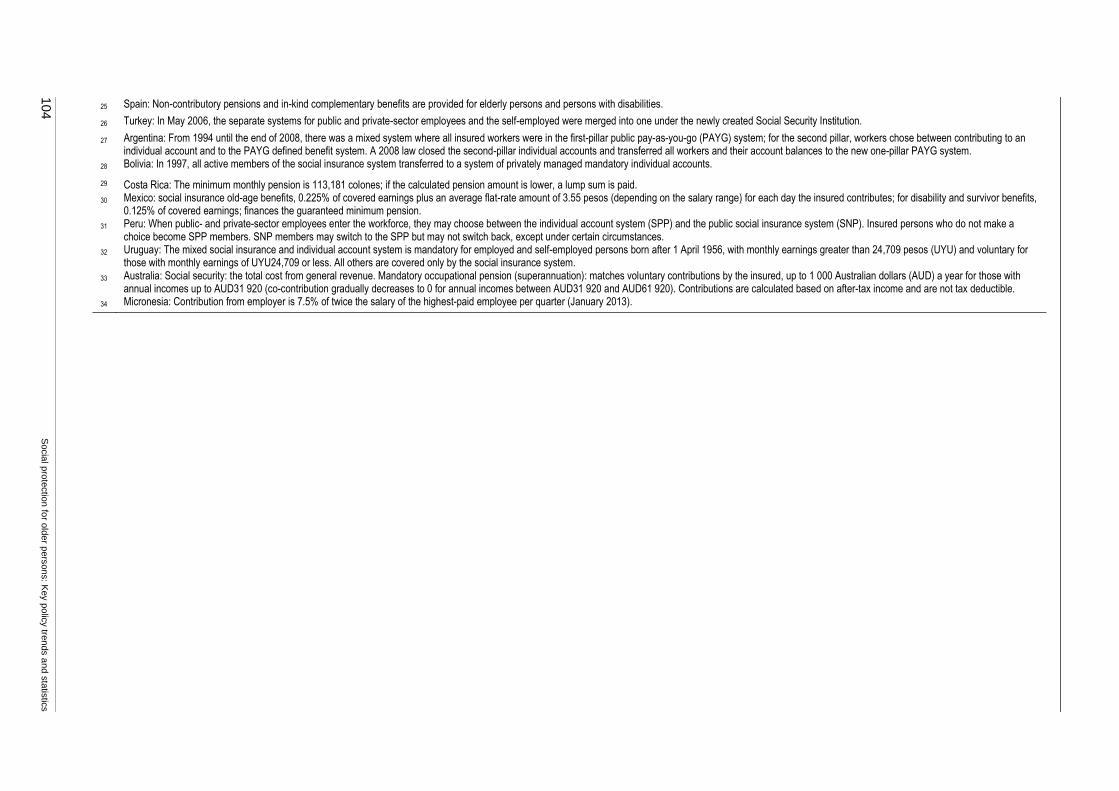
104
S
ocia
l pro
tectio
n fo
r old
er p
ers
ons: K
ey p
olic
y tre
nds a
nd s
tatis
tics
25 Spain: Non-contributory pensions and in-kind complementary benefits are provided for elderly persons and persons with disabilities.
26 Turkey: In May 2006, the separate systems for public and private-sector employees and the self-employed were merged into one under the newly created Social Security Institution.
27 Argentina: From 1994 until the end of 2008, there was a mixed system where all insured workers were in the first-pillar public pay-as-you-go (PAYG) system; for the second pillar, workers chose between contributing to an individual account and to the PAYG defined benefit system. A 2008 law closed the second-pillar individual accounts and transferred all workers and their account balances to the new one-pillar PAYG system.
28 Bolivia: In 1997, all active members of the social insurance system transferred to a system of privately managed mandatory individual accounts.
29 Costa Rica: The minimum monthly pension is 113,181 colones; if the calculated pension amount is lower, a lump sum is paid.
30 Mexico: social insurance old-age benefits, 0.225% of covered earnings plus an average flat-rate amount of 3.55 pesos (depending on the salary range) for each day the insured contributes; for disability and survivor benefits, 0.125% of covered earnings; finances the guaranteed minimum pension.
31 Peru: When public- and private-sector employees enter the workforce, they may choose between the individual account system (SPP) and the public social insurance system (SNP). Insured persons who do not make a choice become SPP members. SNP members may switch to the SPP but may not switch back, except under certain circumstances.
32 Uruguay: The mixed social insurance and individual account system is mandatory for employed and self-employed persons born after 1 April 1956, with monthly earnings greater than 24,709 pesos (UYU) and voluntary for those with monthly earnings of UYU24,709 or less. All others are covered only by the social insurance system.
33 Australia: Social security: the total cost from general revenue. Mandatory occupational pension (superannuation): matches voluntary contributions by the insured, up to 1 000 Australian dollars (AUD) a year for those with annual incomes up to AUD31 920 (co-contribution gradually decreases to 0 for annual incomes between AUD31 920 and AUD61 920). Contributions are calculated based on after-tax income and are not tax deductible.
34 Micronesia: Contribution from employer is 7.5% of twice the salary of the highest-paid employee per quarter (January 2013).

Socia
l pro
tectio
n fo
r old
er p
ers
ons: K
ey p
olic
y tre
nds a
nd s
tatis
tics
105
Table B.4. Non-contributory pension schemes: Main features and indicators
Country Notes Year Intro-duced
Name of Scheme Legal requirements and characteristics of the schemes Level of benefit (monthly) Coverage (number, %) Cost
Age of eligibility
Citizen- ship
Residency Income test
Asset test
Pension tested
National currency
US$ PPP Year % of average age
No. of recipients (units)
Population 60 and over (%)
Population 65 and over (%)
Population above eligible age (%)
Year Cost (% of GDP)
Year
Algeria 1994 Allocation forfaitaire de solidarité ... ... ... ... ... 3000 41.2 70.9 2009 11.8% 292,664 12.5% 18.4% … 2009 0.13% 2009
Antigua and Barbuda 1993 Old-Age Assistance Programme 77 … ... ... 255 94.4 125.4 2012 ... 152 1.8% 2.4% 7.3% 2011 ...
Argentina 1948 Pensiones Graciables y Asistenciales 70 1020 246.5 393.1 2011 40.4% 143,650 2.3% 3.2% 4.7% 2012 0.50% 2012
Aruba 1960 Pensioen di biehes AOV 60 1057 2013 14,000 79.3% 100.0% 79.3% 2013 …
Armenia … Old-Age Social Pension 65 ... ... 10500 28.2 49.6 2011 9.1% 48,000 11.6% 14.2% 14.2% 2007 …
Australia 1900 Age Pension 65 (m) 64.5 (w)
1654 1590.2 1067.1 2013 37.4% 2,116,798 51.6% 72.4% 72.4% 2009 2.24% 2009
Austria 1978 Ausgleichszulage (Austrian Compensatory Supplement)
65 (m) 60 (w)
… … ... 837.63 1110.7 959.5 2013 25.6% 103,431 5.3% 6.8% 5.9% 2011 …
Azerbaijan 2006 Social Allowance (old-age) 67(m) 62 (w)
... ... 45 54.9 91.3 2008 12.4% 231,000 30.1% 43.6% 40.9% 2012 …
Bahamas 1972 Old-Age Non-Contributory Pension (OANCP)
65 268 268.0 362.7 2012 ... 2,024 4.8% 7.3% 7.3% 2012 0.08% 2012
Bangladesh 1998 Old-Age Allowance and Allowance for Widow, Deserted and Destitute Women
65 (m) 62 (w)
... ... 300 3.8 8.8 2013 5.5% 2,475,000 23.6% 34.6% 39.2% 2011 0.17% 2011
Barbados 1937 Non-contributory Old-Age Pension 66 ... 579.6 289.8 477.4 2012 ... 10,403 23.9% 35.1% 36.9% 2011 0.67% 2011
Belarus … Social old-age pension (social assistance)
65 (m) 60 (w)
... 133115 44.7 105.8 2010 6.9% 51,900 2.9% 4.0% 3.2% 2011 …
Belgium 2001 IGO/GRAPA (Income Guarantee for the Elderly)
65 ... 1011.7 1341.5 1115.4 2013 35.7% 93,620 3.6% 4.8% 4.8% 2012 0.12% 2012
Belize 2003 Non-Contributory Pension Programme (NCP)
67 (m) 65 (w)
... 100 50.0 95.7 2010 ... 4,297 22.2% 32.6% 35.4% 2013 0.18% 2013
Bermuda 1967 Non-contributory old-age pension 65 449.22 2011 ... … … … … …
Bolivia (Plurinational State of)
1996 Renta Dignidad or Renta Universal de Vejez (previously Bonosol)
60 ... 200 29.2 58.5 2012 21.3% 788,969 100.0% 100.0% 100.0% 2013 1.06% 2013
Botswana 1996 Old-age Pension (OAP) 65 ... 220 27.0 59.1 2013 5.0% 91,446 87.5% 100.0% 100.0% 2010 0.33% 2010
Brazil 1974 Beneficio de Prestacao Continuada (BPC / Continuous Cash Benefit)
65 ... … ... 622 318.3 329.3 2012 39.9% 5,851,554 28.3% 41.8% 41.8% 2011 0.30% 2010
Brazil 1971 Previdencia Rural (Rural Pension) 65 (m) 60 (w)
... ,,, … ... 622 318.3 329.3 2012 39.9% 1,660,446 8.0% 11.9% 9.5% 2009 1.30% 2009
Brunei Darussalam 1984 Old-Age pension 60 250 198.8 250.8 2011 ... 21,888 81.7% 100.0% 81.7% 2011 0.40% 2011
Bulgaria … Pensions not Related to Labour Activity Fund
70 ... ... 101 76.0 145.3 2008 14.3% 4,917 0.3% 0.4% 0.5% 2011 0.03% 2011
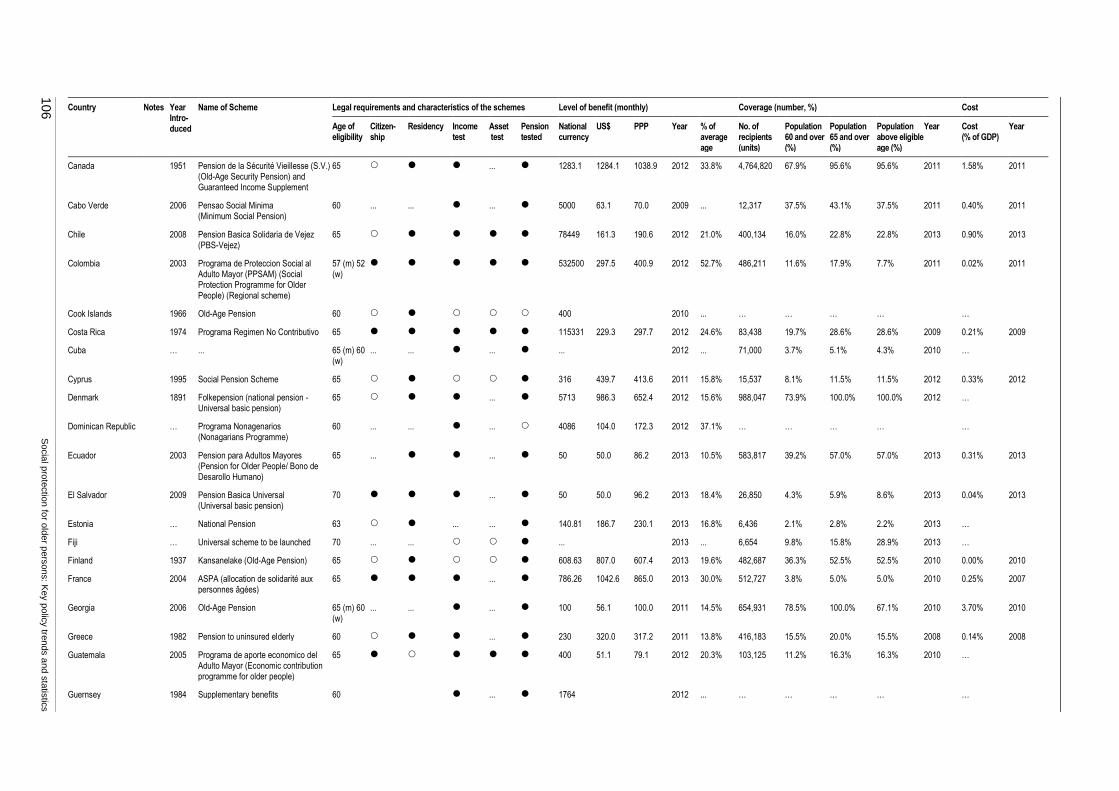
106
S
ocia
l pro
tectio
n fo
r old
er p
ers
ons: K
ey p
olic
y tre
nds a
nd s
tatis
tics
Country Notes Year Intro-duced
Name of Scheme Legal requirements and characteristics of the schemes Level of benefit (monthly) Coverage (number, %) Cost
Age of eligibility
Citizen- ship
Residency Income test
Asset test
Pension tested
National currency
US$ PPP Year % of average age
No. of recipients (units)
Population 60 and over (%)
Population 65 and over (%)
Population above eligible age (%)
Year Cost (% of GDP)
Year
Canada 1951 Pension de la Sécurité Vieillesse (S.V.) (Old-Age Security Pension) and Guaranteed Income Supplement
65 ... 1283.1 1284.1 1038.9 2012 33.8% 4,764,820 67.9% 95.6% 95.6% 2011 1.58% 2011
Cabo Verde 2006 Pensao Social Minima (Minimum Social Pension)
60 ... ... ... 5000 63.1 70.0 2009 ... 12,317 37.5% 43.1% 37.5% 2011 0.40% 2011
Chile 2008 Pension Basica Solidaria de Vejez (PBS-Vejez)
65 78449 161.3 190.6 2012 21.0% 400,134 16.0% 22.8% 22.8% 2013 0.90% 2013
Colombia 2003 Programa de Proteccion Social al Adulto Mayor (PPSAM) (Social Protection Programme for Older People) (Regional scheme)
57 (m) 52 (w)
532500 297.5 400.9 2012 52.7% 486,211 11.6% 17.9% 7.7% 2011 0.02% 2011
Cook Islands 1966 Old-Age Pension 60 400 2010 ... … … … … …
Costa Rica 1974 Programa Regimen No Contributivo 65 115331 229.3 297.7 2012 24.6% 83,438 19.7% 28.6% 28.6% 2009 0.21% 2009
Cuba … ... 65 (m) 60 (w)
... ... ... ... 2012 ... 71,000 3.7% 5.1% 4.3% 2010 …
Cyprus 1995 Social Pension Scheme 65 316 439.7 413.6 2011 15.8% 15,537 8.1% 11.5% 11.5% 2012 0.33% 2012
Denmark 1891 Folkepension (national pension - Universal basic pension)
65 ... 5713 986.3 652.4 2012 15.6% 988,047 73.9% 100.0% 100.0% 2012 …
Dominican Republic … Programa Nonagenarios (Nonagarians Programme)
60 ... ... ... 4086 104.0 172.3 2012 37.1% … … … … …
Ecuador 2003 Pension para Adultos Mayores (Pension for Older People/ Bono de Desarollo Humano)
65 ... ... 50 50.0 86.2 2013 10.5% 583,817 39.2% 57.0% 57.0% 2013 0.31% 2013
El Salvador 2009 Pension Basica Universal (Universal basic pension)
70 ... 50 50.0 96.2 2013 18.4% 26,850 4.3% 5.9% 8.6% 2013 0.04% 2013
Estonia … National Pension 63 ... ... 140.81 186.7 230.1 2013 16.8% 6,436 2.1% 2.8% 2.2% 2013 …
Fiji … Universal scheme to be launched 70 ... ... ... 2013 ... 6,654 9.8% 15.8% 28.9% 2013 …
Finland 1937 Kansanelake (Old-Age Pension) 65 608.63 807.0 607.4 2013 19.6% 482,687 36.3% 52.5% 52.5% 2010 0.00% 2010
France 2004 ASPA (allocation de solidarité aux personnes âgées)
65 ... 786.26 1042.6 865.0 2013 30.0% 512,727 3.8% 5.0% 5.0% 2010 0.25% 2007
Georgia 2006 Old-Age Pension 65 (m) 60 (w)
... ... ... 100 56.1 100.0 2011 14.5% 654,931 78.5% 100.0% 67.1% 2010 3.70% 2010
Greece 1982 Pension to uninsured elderly 60 ... 230 320.0 317.2 2011 13.8% 416,183 15.5% 20.0% 15.5% 2008 0.14% 2008
Guatemala 2005 Programa de aporte economico del Adulto Mayor (Economic contribution programme for older people)
65 400 51.1 79.1 2012 20.3% 103,125 11.2% 16.3% 16.3% 2010 …
Guernsey 1984 Supplementary benefits 60 ... 1764 2012 ... … … … … …
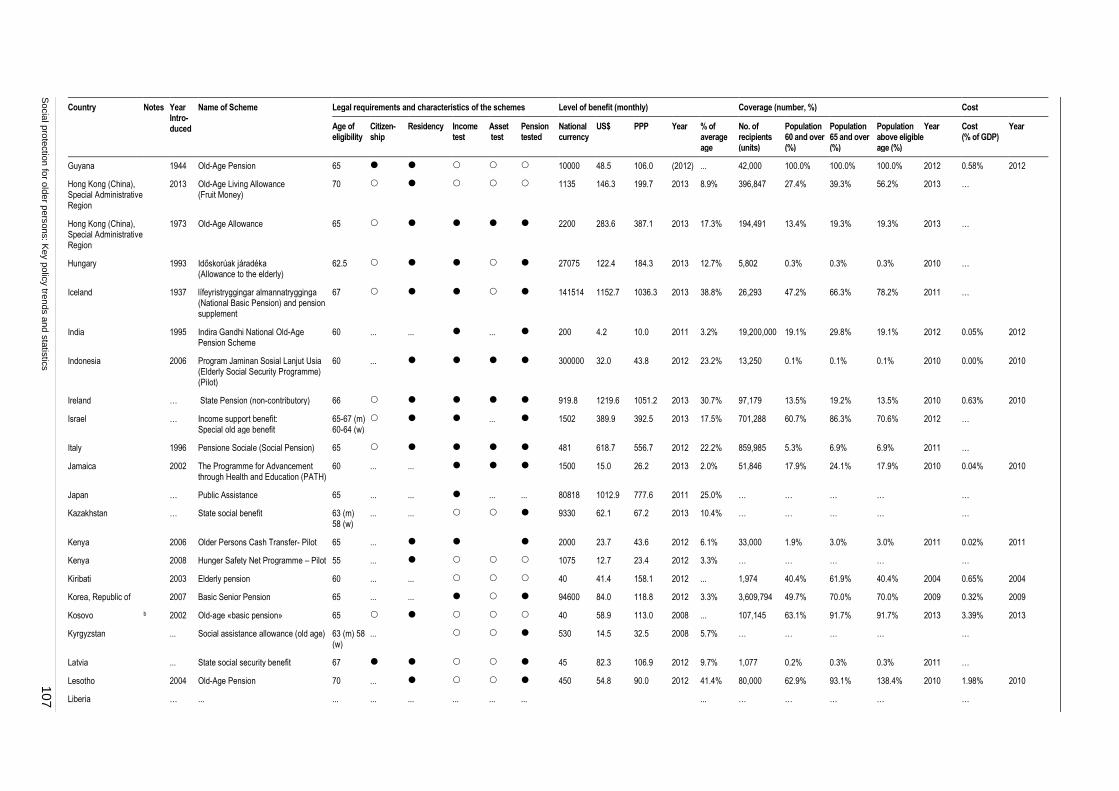
Socia
l pro
tectio
n fo
r old
er p
ers
ons: K
ey p
olic
y tre
nds a
nd s
tatis
tics
107
Country Notes Year Intro-duced
Name of Scheme Legal requirements and characteristics of the schemes Level of benefit (monthly) Coverage (number, %) Cost
Age of eligibility
Citizen- ship
Residency Income test
Asset test
Pension tested
National currency
US$ PPP Year % of average age
No. of recipients (units)
Population 60 and over (%)
Population 65 and over (%)
Population above eligible age (%)
Year Cost (% of GDP)
Year
Guyana 1944 Old-Age Pension 65 10000 48.5 106.0 (2012) ... 42,000 100.0% 100.0% 100.0% 2012 0.58% 2012
Hong Kong (China), Special Administrative Region
2013 Old-Age Living Allowance (Fruit Money)
70 1135 146.3 199.7 2013 8.9% 396,847 27.4% 39.3% 56.2% 2013 …
Hong Kong (China), Special Administrative Region
1973 Old-Age Allowance 65 2200 283.6 387.1 2013 17.3% 194,491 13.4% 19.3% 19.3% 2013 …
Hungary 1993 Időskorúak járadéka (Allowance to the elderly)
62.5 27075 122.4 184.3 2013 12.7% 5,802 0.3% 0.3% 0.3% 2010 …
Iceland 1937 lífeyristryggingar almannatrygginga (National Basic Pension) and pension supplement
67 141514 1152.7 1036.3 2013 38.8% 26,293 47.2% 66.3% 78.2% 2011 …
India 1995 Indira Gandhi National Old-Age Pension Scheme
60 ... ... ... 200 4.2 10.0 2011 3.2% 19,200,000 19.1% 29.8% 19.1% 2012 0.05% 2012
Indonesia 2006 Program Jaminan Sosial Lanjut Usia (Elderly Social Security Programme) (Pilot)
60 ... 300000 32.0 43.8 2012 23.2% 13,250 0.1% 0.1% 0.1% 2010 0.00% 2010
Ireland … State Pension (non-contributory) 66 919.8 1219.6 1051.2 2013 30.7% 97,179 13.5% 19.2% 13.5% 2010 0.63% 2010
Israel … Income support benefit: Special old age benefit
65-67 (m) 60-64 (w)
... 1502 389.9 392.5 2013 17.5% 701,288 60.7% 86.3% 70.6% 2012 …
Italy 1996 Pensione Sociale (Social Pension) 65 481 618.7 556.7 2012 22.2% 859,985 5.3% 6.9% 6.9% 2011 …
Jamaica 2002 The Programme for Advancement through Health and Education (PATH)
60 ... ... 1500 15.0 26.2 2013 2.0% 51,846 17.9% 24.1% 17.9% 2010 0.04% 2010
Japan … Public Assistance 65 ... ... ... ... 80818 1012.9 777.6 2011 25.0% … … … … …
Kazakhstan … State social benefit 63 (m) 58 (w)
... ... 9330 62.1 67.2 2013 10.4% … … … … …
Kenya 2006 Older Persons Cash Transfer- Pilot 65 ... 2000 23.7 43.6 2012 6.1% 33,000 1.9% 3.0% 3.0% 2011 0.02% 2011
Kenya 2008 Hunger Safety Net Programme – Pilot 55 ... 1075 12.7 23.4 2012 3.3% … … … … …
Kiribati 2003 Elderly pension 60 ... ... 40 41.4 158.1 2012 ... 1,974 40.4% 61.9% 40.4% 2004 0.65% 2004
Korea, Republic of 2007 Basic Senior Pension 65 ... ... 94600 84.0 118.8 2012 3.3% 3,609,794 49.7% 70.0% 70.0% 2009 0.32% 2009
Kosovo b 2002 Old-age «basic pension» 65 40 58.9 113.0 2008 ... 107,145 63.1% 91.7% 91.7% 2013 3.39% 2013
Kyrgyzstan ... Social assistance allowance (old age) 63 (m) 58 (w)
... 530 14.5 32.5 2008 5.7% … … … … …
Latvia ... State social security benefit 67 45 82.3 106.9 2012 9.7% 1,077 0.2% 0.3% 0.3% 2011 …
Lesotho 2004 Old-Age Pension 70 ... 450 54.8 90.0 2012 41.4% 80,000 62.9% 93.1% 138.4% 2010 1.98% 2010
Liberia … ... ... ... ... ... ... ... ... … … … … …
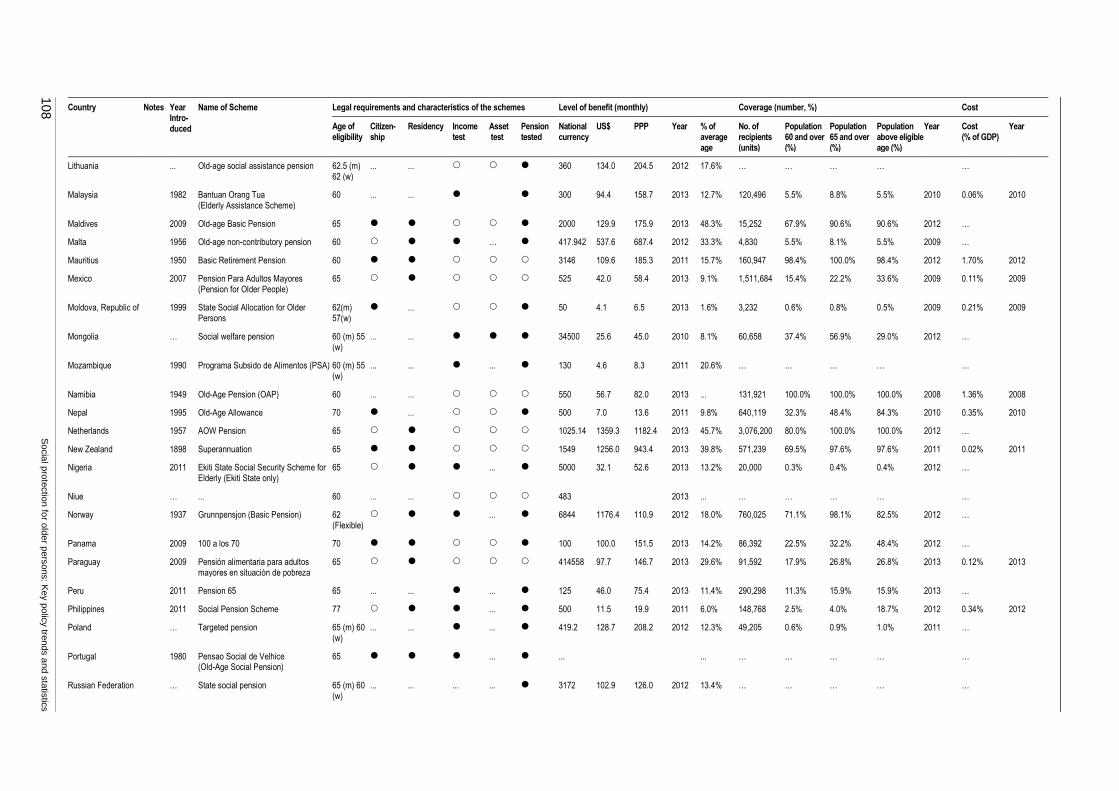
108
S
ocia
l pro
tectio
n fo
r old
er p
ers
ons: K
ey p
olic
y tre
nds a
nd s
tatis
tics
Country Notes Year Intro-duced
Name of Scheme Legal requirements and characteristics of the schemes Level of benefit (monthly) Coverage (number, %) Cost
Age of eligibility
Citizen- ship
Residency Income test
Asset test
Pension tested
National currency
US$ PPP Year % of average age
No. of recipients (units)
Population 60 and over (%)
Population 65 and over (%)
Population above eligible age (%)
Year Cost (% of GDP)
Year
Lithuania ... Old-age social assistance pension 62.5 (m) 62 (w)
... ... 360 134.0 204.5 2012 17.6% … … … … …
Malaysia 1982 Bantuan Orang Tua (Elderly Assistance Scheme)
60 ... ... 300 94.4 158.7 2013 12.7% 120,496 5.5% 8.8% 5.5% 2010 0.06% 2010
Maldives 2009 Old-age Basic Pension 65 2000 129.9 175.9 2013 48.3% 15,252 67.9% 90.6% 90.6% 2012 …
Malta 1956 Old-age non-contributory pension 60 … 417.942 537.6 687.4 2012 33.3% 4,830 5.5% 8.1% 5.5% 2009 …
Mauritius 1950 Basic Retirement Pension 60 3146 109.6 185.3 2011 15.7% 160,947 98.4% 100.0% 98.4% 2012 1.70% 2012
Mexico 2007 Pension Para Adultos Mayores (Pension for Older People)
65 525 42.0 58.4 2013 9.1% 1,511,684 15.4% 22.2% 33.6% 2009 0.11% 2009
Moldova, Republic of 1999 State Social Allocation for Older Persons
62(m) 57(w)
... 50 4.1 6.5 2013 1.6% 3,232 0.6% 0.8% 0.5% 2009 0.21% 2009
Mongolia … Social welfare pension 60 (m) 55 (w)
... ... 34500 25.6 45.0 2010 8.1% 60,658 37.4% 56.9% 29.0% 2012 …
Mozambique 1990 Programa Subsido de Alimentos (PSA) 60 (m) 55 (w)
... ... ... 130 4.6 8.3 2011 20.6% … … … … …
Namibia 1949 Old-Age Pension (OAP) 60 ... ... 550 56.7 82.0 2013 ... 131,921 100.0% 100.0% 100.0% 2008 1.36% 2008
Nepal 1995 Old-Age Allowance 70 ... 500 7.0 13.6 2011 9.8% 640,119 32.3% 48.4% 84.3% 2010 0.35% 2010
Netherlands 1957 AOW Pension 65 1025.14 1359.3 1182.4 2013 45.7% 3,076,200 80.0% 100.0% 100.0% 2012 …
New Zealand 1898 Superannuation 65 1549 1256.0 943.4 2013 39.8% 571,239 69.5% 97.6% 97.6% 2011 0.02% 2011
Nigeria 2011 Ekiti State Social Security Scheme for Elderly (Ekiti State only)
65 ... 5000 32.1 52.6 2013 13.2% 20,000 0.3% 0.4% 0.4% 2012 …
Niue … ... 60 ... ... 483 2013 ... … … … … …
Norway 1937 Grunnpensjon (Basic Pension) 62 (Flexible)
... 6844 1176.4 110.9 2012 18.0% 760,025 71.1% 98.1% 82.5% 2012 …
Panama 2009 100 a los 70 70 100 100.0 151.5 2013 14.2% 86,392 22.5% 32.2% 48.4% 2012 …
Paraguay 2009 Pensión alimentaria para adultos mayores en situación de pobreza
65 414558 97.7 146.7 2013 29.6% 91,592 17.9% 26.8% 26.8% 2013 0.12% 2013
Peru 2011 Pension 65 65 ... ... ... 125 46.0 75.4 2013 11.4% 290,298 11.3% 15.9% 15.9% 2013 …
Philippines 2011 Social Pension Scheme 77 ... 500 11.5 19.9 2011 6.0% 148,768 2.5% 4.0% 18.7% 2012 0.34% 2012
Poland … Targeted pension 65 (m) 60 (w)
... ... ... 419.2 128.7 208.2 2012 12.3% 49,205 0.6% 0.9% 1.0% 2011 …
Portugal 1980 Pensao Social de Velhice (Old-Age Social Pension)
65 ... ... ... … … … … …
Russian Federation … State social pension 65 (m) 60 (w)
... ... ... ... 3172 102.9 126.0 2012 13.4% … … … … …
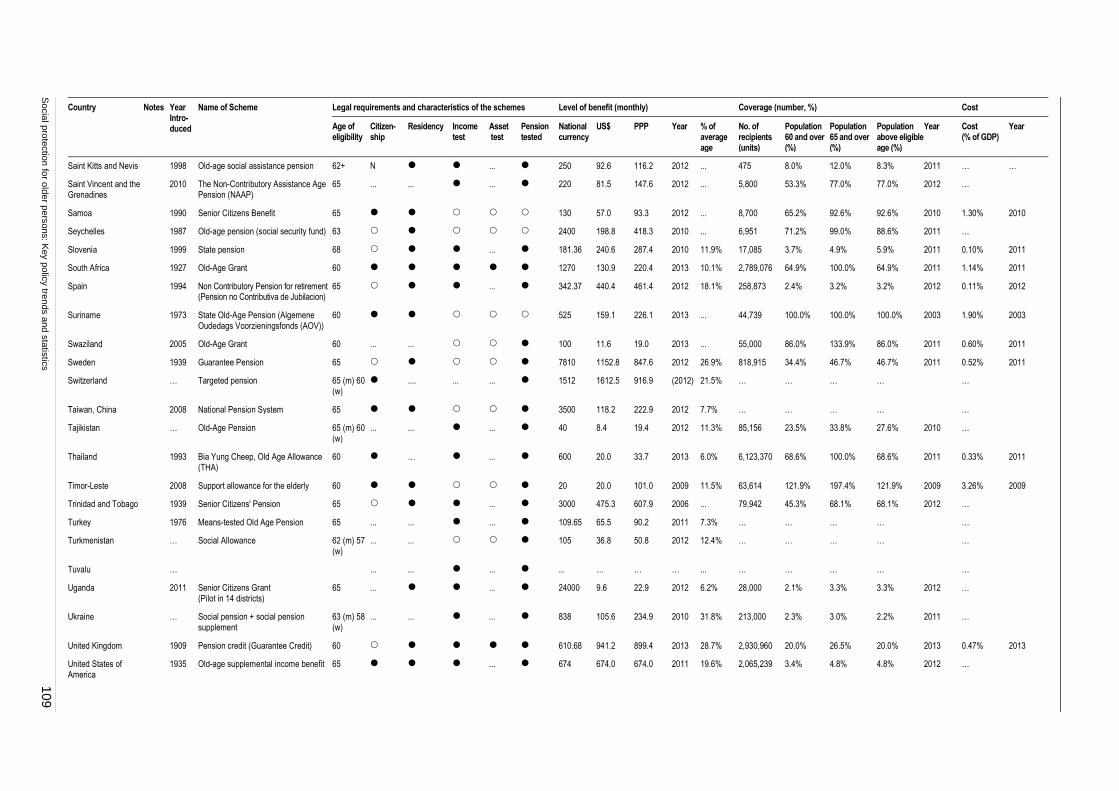
Socia
l pro
tectio
n fo
r old
er p
ers
ons: K
ey p
olic
y tre
nds a
nd s
tatis
tics
109
Country Notes Year Intro-duced
Name of Scheme Legal requirements and characteristics of the schemes Level of benefit (monthly) Coverage (number, %) Cost
Age of eligibility
Citizen- ship
Residency Income test
Asset test
Pension tested
National currency
US$ PPP Year % of average age
No. of recipients (units)
Population 60 and over (%)
Population 65 and over (%)
Population above eligible age (%)
Year Cost (% of GDP)
Year
Saint Kitts and Nevis 1998 Old-age social assistance pension 62+ N ... 250 92.6 116.2 2012 ... 475 8.0% 12.0% 8.3% 2011 … …
Saint Vincent and the Grenadines
2010 The Non-Contributory Assistance Age Pension (NAAP)
65 ... ... ... 220 81.5 147.6 2012 ... 5,800 53.3% 77.0% 77.0% 2012 …
Samoa 1990 Senior Citizens Benefit 65 130 57.0 93.3 2012 ... 8,700 65.2% 92.6% 92.6% 2010 1.30% 2010
Seychelles 1987 Old-age pension (social security fund) 63 2400 198.8 418.3 2010 ... 6,951 71.2% 99.0% 88.6% 2011 …
Slovenia 1999 State pension 68 ... 181.36 240.6 287.4 2010 11.9% 17,085 3.7% 4.9% 5.9% 2011 0.10% 2011
South Africa 1927 Old-Age Grant 60 1270 130.9 220.4 2013 10.1% 2,789,076 64.9% 100.0% 64.9% 2011 1.14% 2011
Spain 1994 Non Contributory Pension for retirement (Pension no Contributiva de Jubilacion)
65 ... 342.37 440.4 461.4 2012 18.1% 258,873 2.4% 3.2% 3.2% 2012 0.11% 2012
Suriname 1973 State Old-Age Pension (Algemene Oudedags Voorzieningsfonds (AOV))
60 525 159.1 226.1 2013 ... 44,739 100.0% 100.0% 100.0% 2003 1.90% 2003
Swaziland 2005 Old-Age Grant 60 ... ... 100 11.6 19.0 2013 ... 55,000 86.0% 133.9% 86.0% 2011 0.60% 2011
Sweden 1939 Guarantee Pension 65 7810 1152.8 847.6 2012 26.9% 818,915 34.4% 46.7% 46.7% 2011 0.52% 2011
Switzerland … Targeted pension 65 (m) 60 (w)
.... ... ... 1512 1612.5 916.9 (2012) 21.5% … … … … …
Taiwan, China 2008 National Pension System 65 3500 118.2 222.9 2012 7.7% … … … … …
Tajikistan … Old-Age Pension 65 (m) 60 (w)
... ... ... 40 8.4 19.4 2012 11.3% 85,156 23.5% 33.8% 27.6% 2010 …
Thailand 1993 Bia Yung Cheep, Old Age Allowance (THA)
60 … ... 600 20.0 33.7 2013 6.0% 6,123,370 68.6% 100.0% 68.6% 2011 0.33% 2011
Timor-Leste 2008 Support allowance for the elderly 60 20 20.0 101.0 2009 11.5% 63,614 121.9% 197.4% 121.9% 2009 3.26% 2009
Trinidad and Tobago 1939 Senior Citizens' Pension 65 ... 3000 475.3 607.9 2006 ... 79,942 45.3% 68.1% 68.1% 2012 …
Turkey 1976 Means-tested Old Age Pension 65 ... ... ... 109.65 65.5 90.2 2011 7.3% … … … … …
Turkmenistan … Social Allowance 62 (m) 57 (w)
... ... 105 36.8 50.8 2012 12.4% … … … … …
Tuvalu … ... ... ... ... … … … ... … … … … …
Uganda 2011 Senior Citizens Grant (Pilot in 14 districts)
65 ... ... 24000 9.6 22.9 2012 6.2% 28,000 2.1% 3.3% 3.3% 2012 …
Ukraine … Social pension + social pension supplement
63 (m) 58 (w)
... ... ... 838 105.6 234.9 2010 31.8% 213,000 2.3% 3.0% 2.2% 2011 …
United Kingdom 1909 Pension credit (Guarantee Credit) 60 610.68 941.2 899.4 2013 28.7% 2,930,960 20.0% 26.5% 20.0% 2013 0.47% 2013
United States of America
1935 Old-age supplemental income benefit 65 ... 674 674.0 674.0 2011 19.6% 2,065,239 3.4% 4.8% 4.8% 2012 …
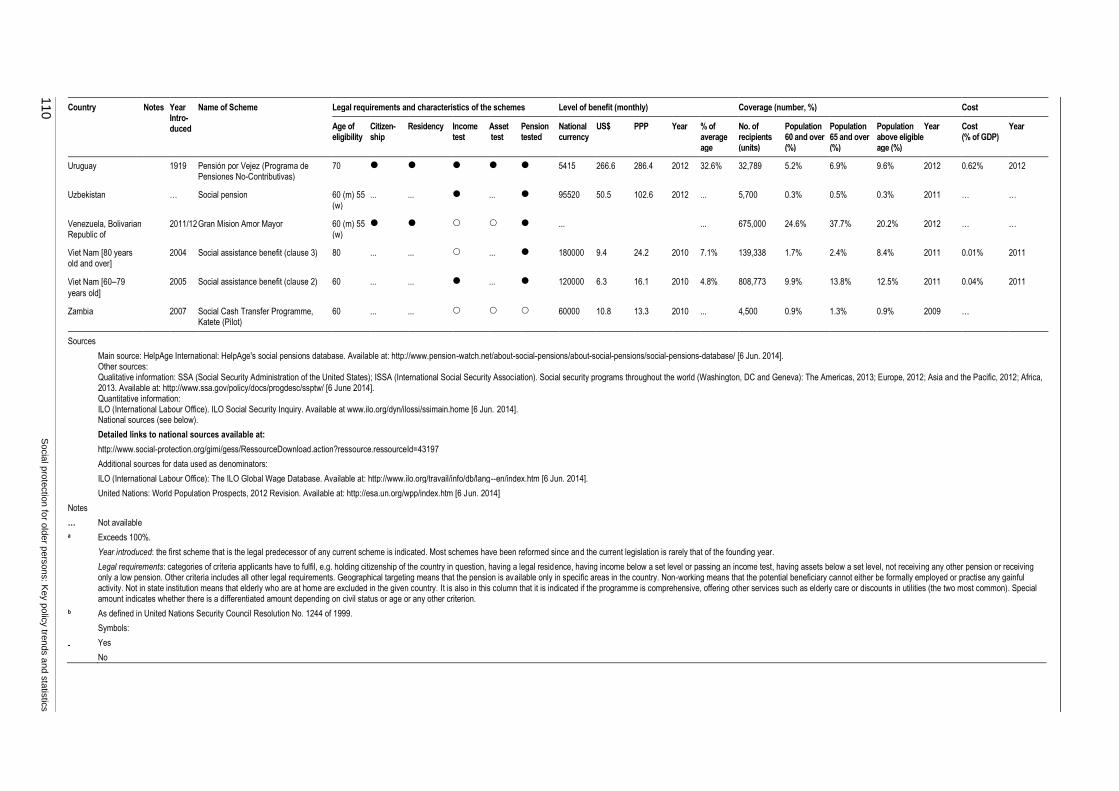
110
S
ocia
l pro
tectio
n fo
r old
er p
ers
ons: K
ey p
olic
y tre
nds a
nd s
tatis
tics
Country Notes Year Intro-duced
Name of Scheme Legal requirements and characteristics of the schemes Level of benefit (monthly) Coverage (number, %) Cost
Age of eligibility
Citizen- ship
Residency Income test
Asset test
Pension tested
National currency
US$ PPP Year % of average age
No. of recipients (units)
Population 60 and over (%)
Population 65 and over (%)
Population above eligible age (%)
Year Cost (% of GDP)
Year
Uruguay 1919 Pensión por Vejez (Programa de Pensiones No-Contributivas)
70 5415 266.6 286.4 2012 32.6% 32,789 5.2% 6.9% 9.6% 2012 0.62% 2012
Uzbekistan … Social pension 60 (m) 55 (w)
... ... ... 95520 50.5 102.6 2012 ... 5,700 0.3% 0.5% 0.3% 2011 … …
Venezuela, Bolivarian Republic of
2011/12 Gran Mision Amor Mayor 60 (m) 55 (w)
... ... 675,000 24.6% 37.7% 20.2% 2012 … …
Viet Nam [80 years old and over]
2004 Social assistance benefit (clause 3) 80 ... ... ... 180000 9.4 24.2 2010 7.1% 139,338 1.7% 2.4% 8.4% 2011 0.01% 2011
Viet Nam [60–79
years old]
2005 Social assistance benefit (clause 2) 60 ... ... ... 120000 6.3 16.1 2010 4.8% 808,773 9.9% 13.8% 12.5% 2011 0.04% 2011
Zambia 2007 Social Cash Transfer Programme, Katete (Pilot)
60 ... ... 60000 10.8 13.3 2010 ... 4,500 0.9% 1.3% 0.9% 2009 …
Sources
Main source: HelpAge International: HelpAge's social pensions database. Available at: http://www.pension-watch.net/about-social-pensions/about-social-pensions/social-pensions-database/ [6 Jun. 2014]. Other sources: Qualitative information: SSA (Social Security Administration of the United States); ISSA (International Social Security Association). Social security programs throughout the world (Washington, DC and Geneva): The Americas, 2013; Europe, 2012; Asia and the Pacific, 2012; Africa, 2013. Available at: http://www.ssa.gov/policy/docs/progdesc/ssptw/ [6 June 2014]. Quantitative information: ILO (International Labour Office). ILO Social Security Inquiry. Available at www.ilo.org/dyn/ilossi/ssimain.home [6 Jun. 2014]. National sources (see below).
Detailed links to national sources available at:
http://www.social-protection.org/gimi/gess/RessourceDownload.action?ressource.ressourceId=43197
Additional sources for data used as denominators:
ILO (International Labour Office): The ILO Global Wage Database. Available at: http://www.ilo.org/travail/info/db/lang--en/index.htm [6 Jun. 2014].
United Nations: World Population Prospects, 2012 Revision. Available at: http://esa.un.org/wpp/index.htm [6 Jun. 2014]
Notes
… Not available
a Exceeds 100%.
Year introduced: the first scheme that is the legal predecessor of any current scheme is indicated. Most schemes have been reformed since and the current legislation is rarely that of the founding year.
Legal requirements: categories of criteria applicants have to fulfil, e.g. holding citizenship of the country in question, having a legal residence, having income below a set level or passing an income test, having assets below a set level, not receiving any other pension or receiving only a low pension. Other criteria includes all other legal requirements. Geographical targeting means that the pension is available only in specific areas in the country. Non-working means that the potential beneficiary cannot either be formally employed or practise any gainful activity. Not in state institution means that elderly who are at home are excluded in the given country. It is also in this column that it is indicated if the programme is comprehensive, offering other services such as elderly care or discounts in utilities (the two most common). Special amount indicates whether there is a differentiated amount depending on civil status or age or any other criterion.
b As defined in United Nations Security Council Resolution No. 1244 of 1999.
Symbols:
Yes
No
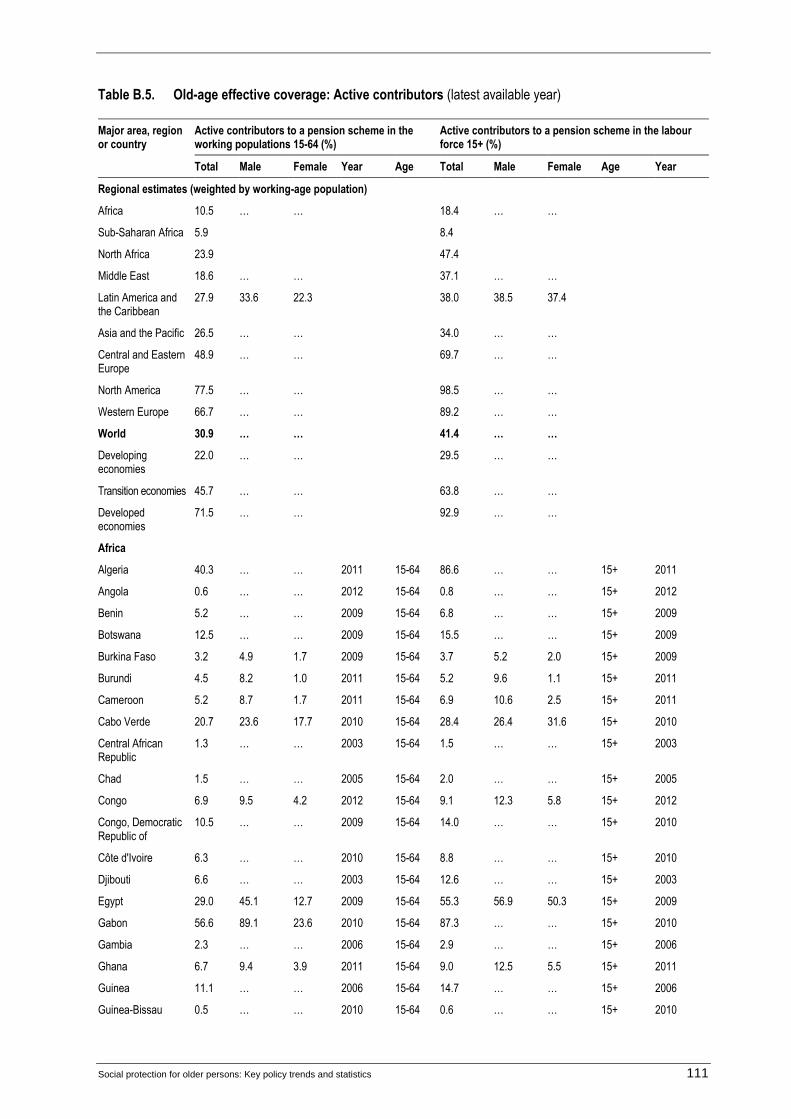
Social protection for older persons: Key policy trends and statistics 111
Table B.5. Old-age effective coverage: Active contributors (latest available year)
Major area, region or country
Active contributors to a pension scheme in the working populations 15-64 (%)
Active contributors to a pension scheme in the labour force 15+ (%)
Total Male Female Year Age Total Male Female Age Year
Regional estimates (weighted by working-age population)
Africa 10.5 … … 18.4 … …
Sub-Saharan Africa 5.9 8.4
North Africa 23.9 47.4
Middle East 18.6 … … 37.1 … …
Latin America and the Caribbean
27.9 33.6 22.3 38.0 38.5 37.4
Asia and the Pacific 26.5 … … 34.0 … …
Central and Eastern Europe
48.9 … … 69.7 … …
North America 77.5 … … 98.5 … …
Western Europe 66.7 … … 89.2 … …
World 30.9 … … 41.4 … …
Developing economies
22.0 … … 29.5 … …
Transition economies 45.7 … … 63.8 … …
Developed economies
71.5 … … 92.9 … …
Africa
Algeria 40.3 … … 2011 15-64 86.6 … … 15+ 2011
Angola 0.6 … … 2012 15-64 0.8 … … 15+ 2012
Benin 5.2 … … 2009 15-64 6.8 … … 15+ 2009
Botswana 12.5 … … 2009 15-64 15.5 … … 15+ 2009
Burkina Faso 3.2 4.9 1.7 2009 15-64 3.7 5.2 2.0 15+ 2009
Burundi 4.5 8.2 1.0 2011 15-64 5.2 9.6 1.1 15+ 2011
Cameroon 5.2 8.7 1.7 2011 15-64 6.9 10.6 2.5 15+ 2011
Cabo Verde 20.7 23.6 17.7 2010 15-64 28.4 26.4 31.6 15+ 2010
Central African Republic
1.3 … … 2003 15-64 1.5 … … 15+ 2003
Chad 1.5 … … 2005 15-64 2.0 … … 15+ 2005
Congo 6.9 9.5 4.2 2012 15-64 9.1 12.3 5.8 15+ 2012
Congo, Democratic Republic of
10.5 … … 2009 15-64 14.0 … … 15+ 2010
Côte d'Ivoire 6.3 … … 2010 15-64 8.8 … … 15+ 2010
Djibouti 6.6 … … 2003 15-64 12.6 … … 15+ 2003
Egypt 29.0 45.1 12.7 2009 15-64 55.3 56.9 50.3 15+ 2009
Gabon 56.6 89.1 23.6 2010 15-64 87.3 … … 15+ 2010
Gambia 2.3 … … 2006 15-64 2.9 … … 15+ 2006
Ghana 6.7 9.4 3.9 2011 15-64 9.0 12.5 5.5 15+ 2011
Guinea 11.1 … … 2006 15-64 14.7 … … 15+ 2006
Guinea-Bissau 0.5 … … 2010 15-64 0.6 … … 15+ 2010

112 Social protection for older persons: Key policy trends and statistics
Major area, region or country
Active contributors to a pension scheme in the working populations 15-64 (%)
Active contributors to a pension scheme in the labour force 15+ (%)
Total Male Female Year Age Total Male Female Age Year
Kenya 11.3 … … 2009 15-64 16.3 … … 15+ 2009
Lesotho 3.1 … … 2005 15-64 4.2 … … 15+ 2005
Libya 11.2 18.5 3.5 2008 15-64 19.6 22.9 10.9 15+ 2008
Madagascar 5.7 … … 2011 15-64 6.2 … … 15+ 2011
Malawi 0.0 0.0 0.0 2011 15-64 0.0 … … 15+ 2011
Mali 4.4 … … 2010 15-64 7.9 … … 15+ 2010
Mauritania 9.4 … … 2005 15-64 17.2 … … 15+ 2005
Mauritius 39.7 … … 2010 15-64 60.9 … … 15+ 2010
Morocco 15.6 … … 2011 15-64 30.2 … … 15+ 2011
Mozambique 3.8 … … 2008 15-64 4.2 … … 15+ 2008
Namibia 5.6 … … 2008 15-64 8.2 … … 15+ 2008
Niger 1.3 1.9 0.7 2006 15-64 1.9 2.0 1.6 15+ 2006
Nigeria 5.3 7.6 3.1 2010 15-64 9.0 11.3 6.0 15+ 2010
Rwanda 3.8 5.7 2.0 2009 15-64 4.3 6.5 2.2 15+ 2009
Sao Tome and Principe
10.4 … … 2010 15-64 16.4 … … 15+ 2010
Senegal 5.0 … … 2008 15-64 6.2 … … 15+ 2008
Sierra Leone 4.6 … … 2007 15-64 6.6 … … 15+ 2007
South Africa 3.5 … … 2010 15-64 6.3 … … 15+ 2010
Sudan 2.8 … … 2008 15-64 4.9 … … 15+ 2008
Swaziland 15.2 … … 2010 15-64 25.5 … … 15+ 2010
Tanzania, United Republic of
3.1 4.2 1.9 2007 15-64 3.3 4.5 2.1 15+ 2007
Togo 3.1 … … 2009 15-64 3.7 … … 15+ 2009
Tunisia 41.4 … … 2011 15-64 79.0 … … 15+ 2011
Uganda 3.8 3.4 4.2 2007 15-64 4.6 4.1 5.1 15+ 2007
Zambia 8.8 12.1 5.5 2010 15-64 10.5 13.4 7.0 15+ 2010
Zimbabwe 17.0 … … 2009 15-64 18.3 … … 15+ 2009
Asia, Oceania and the Middle East
Afghanistan 2.2 … … 2006 15-64 4.4 … … 15+ 2006
Armenia 22.4 … … 2009 15-64 31.7 … … 15+ 2009
Australia 69.6 74.5 64.6 2008 15-64 88.8 87.1 90.9 15+ 2008
Azerbaijan 22.5 … … 2007 15-64 33.3 … … 15+ 2007
Bahrain 10.5 12.4 7.3 2007 15-64 15.1 14.1 19.0 15+ 2007
Bangladesh 0.0 0.0 0.0 2011 15-64 0.0 … … 15+ 2011
Bhutan 9.1 12.1 6.1 2012 15-64 12.1 14.8 8.6 15+ 2012
Cambodia 0.0 0.0 0.0 2010 15-64 0.0 0.0 0.0 15+ 2010
China 46.4 … … 2011 15-64 56.1 … … 15+ 2011
Fiji 64.2 … … 2011 15-64 99.0 … … 15+ 2011
Georgia 22.7 … … 2008 15-64 29.5 … … 15+ 2008
Hong Kong (China), Special Administrative Region
52.3 … … 2011 15-64 75.7 … … 15+ 2011
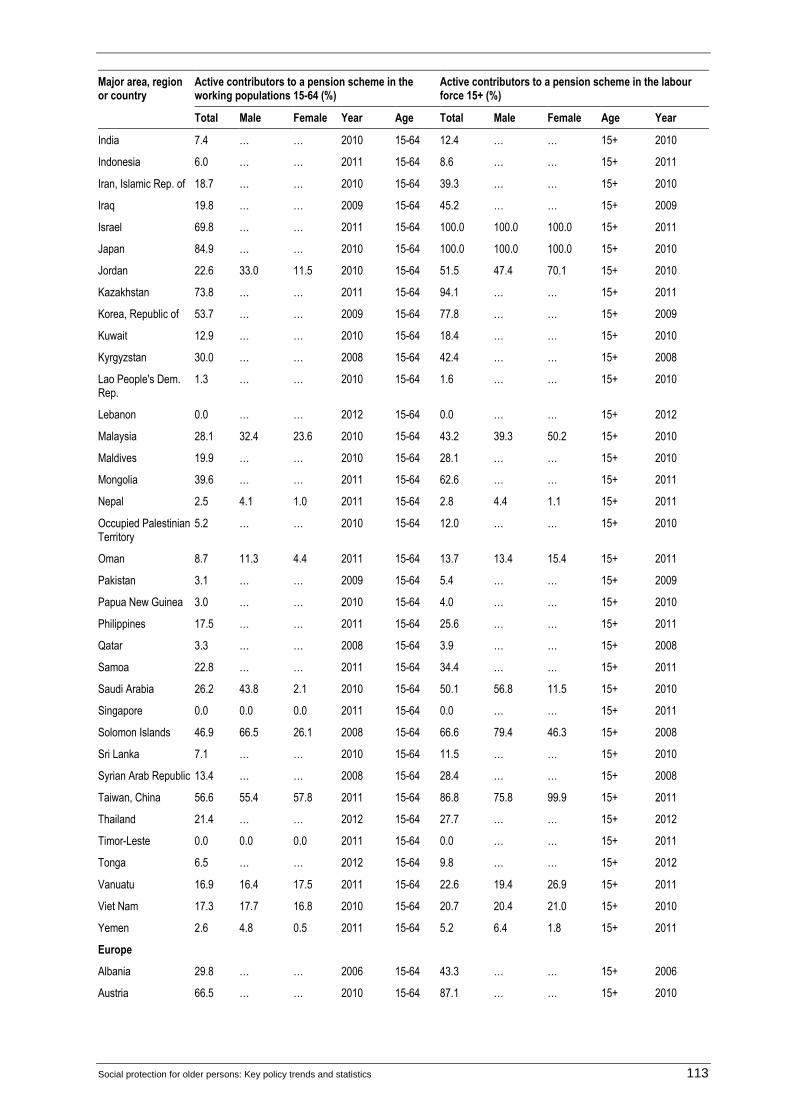
Social protection for older persons: Key policy trends and statistics 113
Major area, region or country
Active contributors to a pension scheme in the working populations 15-64 (%)
Active contributors to a pension scheme in the labour force 15+ (%)
Total Male Female Year Age Total Male Female Age Year
India 7.4 … … 2010 15-64 12.4 … … 15+ 2010
Indonesia 6.0 … … 2011 15-64 8.6 … … 15+ 2011
Iran, Islamic Rep. of 18.7 … … 2010 15-64 39.3 … … 15+ 2010
Iraq 19.8 … … 2009 15-64 45.2 … … 15+ 2009
Israel 69.8 … … 2011 15-64 100.0 100.0 100.0 15+ 2011
Japan 84.9 … … 2010 15-64 100.0 100.0 100.0 15+ 2010
Jordan 22.6 33.0 11.5 2010 15-64 51.5 47.4 70.1 15+ 2010
Kazakhstan 73.8 … … 2011 15-64 94.1 … … 15+ 2011
Korea, Republic of 53.7 … … 2009 15-64 77.8 … … 15+ 2009
Kuwait 12.9 … … 2010 15-64 18.4 … … 15+ 2010
Kyrgyzstan 30.0 … … 2008 15-64 42.4 … … 15+ 2008
Lao People's Dem. Rep.
1.3 … … 2010 15-64 1.6 … … 15+ 2010
Lebanon 0.0 … … 2012 15-64 0.0 … … 15+ 2012
Malaysia 28.1 32.4 23.6 2010 15-64 43.2 39.3 50.2 15+ 2010
Maldives 19.9 … … 2010 15-64 28.1 … … 15+ 2010
Mongolia 39.6 … … 2011 15-64 62.6 … … 15+ 2011
Nepal 2.5 4.1 1.0 2011 15-64 2.8 4.4 1.1 15+ 2011
Occupied Palestinian Territory
5.2 … … 2010 15-64 12.0 … … 15+ 2010
Oman 8.7 11.3 4.4 2011 15-64 13.7 13.4 15.4 15+ 2011
Pakistan 3.1 … … 2009 15-64 5.4 … … 15+ 2009
Papua New Guinea 3.0 … … 2010 15-64 4.0 … … 15+ 2010
Philippines 17.5 … … 2011 15-64 25.6 … … 15+ 2011
Qatar 3.3 … … 2008 15-64 3.9 … … 15+ 2008
Samoa 22.8 … … 2011 15-64 34.4 … … 15+ 2011
Saudi Arabia 26.2 43.8 2.1 2010 15-64 50.1 56.8 11.5 15+ 2010
Singapore 0.0 0.0 0.0 2011 15-64 0.0 … … 15+ 2011
Solomon Islands 46.9 66.5 26.1 2008 15-64 66.6 79.4 46.3 15+ 2008
Sri Lanka 7.1 … … 2010 15-64 11.5 … … 15+ 2010
Syrian Arab Republic 13.4 … … 2008 15-64 28.4 … … 15+ 2008
Taiwan, China 56.6 55.4 57.8 2011 15-64 86.8 75.8 99.9 15+ 2011
Thailand 21.4 … … 2012 15-64 27.7 … … 15+ 2012
Timor-Leste 0.0 0.0 0.0 2011 15-64 0.0 … … 15+ 2011
Tonga 6.5 … … 2012 15-64 9.8 … … 15+ 2012
Vanuatu 16.9 16.4 17.5 2011 15-64 22.6 19.4 26.9 15+ 2011
Viet Nam 17.3 17.7 16.8 2010 15-64 20.7 20.4 21.0 15+ 2010
Yemen 2.6 4.8 0.5 2011 15-64 5.2 6.4 1.8 15+ 2011
Europe
Albania 29.8 … … 2006 15-64 43.3 … … 15+ 2006
Austria 66.5 … … 2010 15-64 87.1 … … 15+ 2010
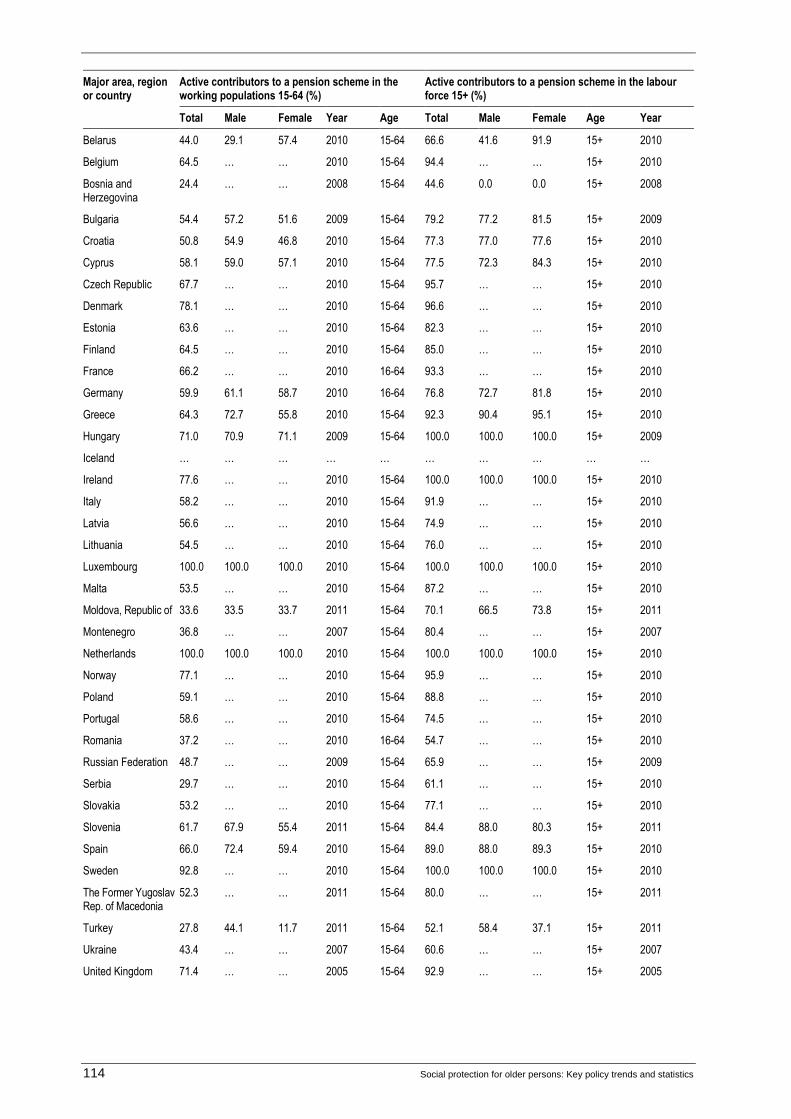
114 Social protection for older persons: Key policy trends and statistics
Major area, region or country
Active contributors to a pension scheme in the working populations 15-64 (%)
Active contributors to a pension scheme in the labour force 15+ (%)
Total Male Female Year Age Total Male Female Age Year
Belarus 44.0 29.1 57.4 2010 15-64 66.6 41.6 91.9 15+ 2010
Belgium 64.5 … … 2010 15-64 94.4 … … 15+ 2010
Bosnia and Herzegovina
24.4 … … 2008 15-64 44.6 0.0 0.0 15+ 2008
Bulgaria 54.4 57.2 51.6 2009 15-64 79.2 77.2 81.5 15+ 2009
Croatia 50.8 54.9 46.8 2010 15-64 77.3 77.0 77.6 15+ 2010
Cyprus 58.1 59.0 57.1 2010 15-64 77.5 72.3 84.3 15+ 2010
Czech Republic 67.7 … … 2010 15-64 95.7 … … 15+ 2010
Denmark 78.1 … … 2010 15-64 96.6 … … 15+ 2010
Estonia 63.6 … … 2010 15-64 82.3 … … 15+ 2010
Finland 64.5 … … 2010 15-64 85.0 … … 15+ 2010
France 66.2 … … 2010 16-64 93.3 … … 15+ 2010
Germany 59.9 61.1 58.7 2010 16-64 76.8 72.7 81.8 15+ 2010
Greece 64.3 72.7 55.8 2010 15-64 92.3 90.4 95.1 15+ 2010
Hungary 71.0 70.9 71.1 2009 15-64 100.0 100.0 100.0 15+ 2009
Iceland … … … … … … … … … …
Ireland 77.6 … … 2010 15-64 100.0 100.0 100.0 15+ 2010
Italy 58.2 … … 2010 15-64 91.9 … … 15+ 2010
Latvia 56.6 … … 2010 15-64 74.9 … … 15+ 2010
Lithuania 54.5 … … 2010 15-64 76.0 … … 15+ 2010
Luxembourg 100.0 100.0 100.0 2010 15-64 100.0 100.0 100.0 15+ 2010
Malta 53.5 … … 2010 15-64 87.2 … … 15+ 2010
Moldova, Republic of 33.6 33.5 33.7 2011 15-64 70.1 66.5 73.8 15+ 2011
Montenegro 36.8 … … 2007 15-64 80.4 … … 15+ 2007
Netherlands 100.0 100.0 100.0 2010 15-64 100.0 100.0 100.0 15+ 2010
Norway 77.1 … … 2010 15-64 95.9 … … 15+ 2010
Poland 59.1 … … 2010 15-64 88.8 … … 15+ 2010
Portugal 58.6 … … 2010 15-64 74.5 … … 15+ 2010
Romania 37.2 … … 2010 16-64 54.7 … … 15+ 2010
Russian Federation 48.7 … … 2009 15-64 65.9 … … 15+ 2009
Serbia 29.7 … … 2010 15-64 61.1 … … 15+ 2010
Slovakia 53.2 … … 2010 15-64 77.1 … … 15+ 2010
Slovenia 61.7 67.9 55.4 2011 15-64 84.4 88.0 80.3 15+ 2011
Spain 66.0 72.4 59.4 2010 15-64 89.0 88.0 89.3 15+ 2010
Sweden 92.8 … … 2010 15-64 100.0 100.0 100.0 15+ 2010
The Former Yugoslav Rep. of Macedonia
52.3 … … 2011 15-64 80.0 … … 15+ 2011
Turkey 27.8 44.1 11.7 2011 15-64 52.1 58.4 37.1 15+ 2011
Ukraine 43.4 … … 2007 15-64 60.6 … … 15+ 2007
United Kingdom 71.4 … … 2005 15-64 92.9 … … 15+ 2005
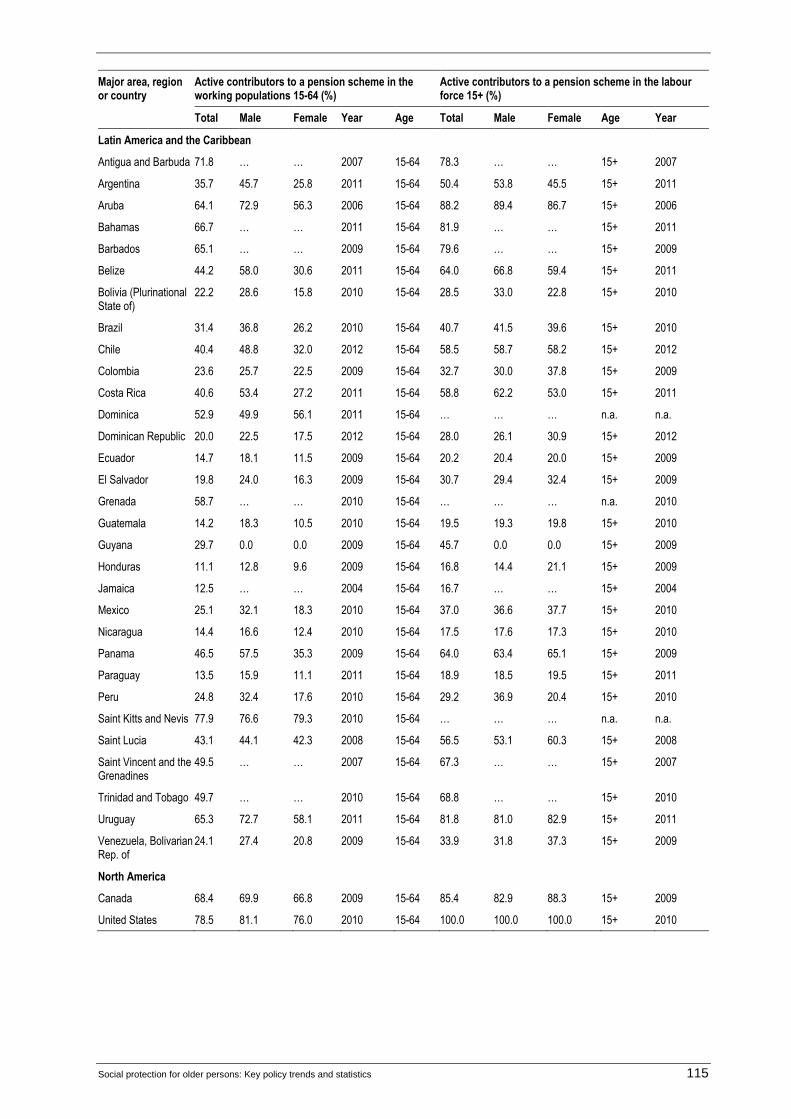
Social protection for older persons: Key policy trends and statistics 115
Major area, region or country
Active contributors to a pension scheme in the working populations 15-64 (%)
Active contributors to a pension scheme in the labour force 15+ (%)
Total Male Female Year Age Total Male Female Age Year
Latin America and the Caribbean
Antigua and Barbuda 71.8 … … 2007 15-64 78.3 … … 15+ 2007
Argentina 35.7 45.7 25.8 2011 15-64 50.4 53.8 45.5 15+ 2011
Aruba 64.1 72.9 56.3 2006 15-64 88.2 89.4 86.7 15+ 2006
Bahamas 66.7 … … 2011 15-64 81.9 … … 15+ 2011
Barbados 65.1 … … 2009 15-64 79.6 … … 15+ 2009
Belize 44.2 58.0 30.6 2011 15-64 64.0 66.8 59.4 15+ 2011
Bolivia (Plurinational State of)
22.2 28.6 15.8 2010 15-64 28.5 33.0 22.8 15+ 2010
Brazil 31.4 36.8 26.2 2010 15-64 40.7 41.5 39.6 15+ 2010
Chile 40.4 48.8 32.0 2012 15-64 58.5 58.7 58.2 15+ 2012
Colombia 23.6 25.7 22.5 2009 15-64 32.7 30.0 37.8 15+ 2009
Costa Rica 40.6 53.4 27.2 2011 15-64 58.8 62.2 53.0 15+ 2011
Dominica 52.9 49.9 56.1 2011 15-64 … … … n.a. n.a.
Dominican Republic 20.0 22.5 17.5 2012 15-64 28.0 26.1 30.9 15+ 2012
Ecuador 14.7 18.1 11.5 2009 15-64 20.2 20.4 20.0 15+ 2009
El Salvador 19.8 24.0 16.3 2009 15-64 30.7 29.4 32.4 15+ 2009
Grenada 58.7 … … 2010 15-64 … … … n.a. 2010
Guatemala 14.2 18.3 10.5 2010 15-64 19.5 19.3 19.8 15+ 2010
Guyana 29.7 0.0 0.0 2009 15-64 45.7 0.0 0.0 15+ 2009
Honduras 11.1 12.8 9.6 2009 15-64 16.8 14.4 21.1 15+ 2009
Jamaica 12.5 … … 2004 15-64 16.7 … … 15+ 2004
Mexico 25.1 32.1 18.3 2010 15-64 37.0 36.6 37.7 15+ 2010
Nicaragua 14.4 16.6 12.4 2010 15-64 17.5 17.6 17.3 15+ 2010
Panama 46.5 57.5 35.3 2009 15-64 64.0 63.4 65.1 15+ 2009
Paraguay 13.5 15.9 11.1 2011 15-64 18.9 18.5 19.5 15+ 2011
Peru 24.8 32.4 17.6 2010 15-64 29.2 36.9 20.4 15+ 2010
Saint Kitts and Nevis 77.9 76.6 79.3 2010 15-64 … … … n.a. n.a.
Saint Lucia 43.1 44.1 42.3 2008 15-64 56.5 53.1 60.3 15+ 2008
Saint Vincent and the Grenadines
49.5 … … 2007 15-64 67.3 … … 15+ 2007
Trinidad and Tobago 49.7 … … 2010 15-64 68.8 … … 15+ 2010
Uruguay 65.3 72.7 58.1 2011 15-64 81.8 81.0 82.9 15+ 2011
Venezuela, Bolivarian Rep. of
24.1 27.4 20.8 2009 15-64 33.9 31.8 37.3 15+ 2009
North America
Canada 68.4 69.9 66.8 2009 15-64 85.4 82.9 88.3 15+ 2009
United States 78.5 81.1 76.0 2010 15-64 100.0 100.0 100.0 15+ 2010
116 Social protection for older persons: Key policy trends and statistics
Sources
Main source: ILO (International Labour Office): ILO Social Security Inquiry; Indicator: old-age contributor ratio: % working age. Available at: http://www.ilo.org/dyn/ilossi/ssiindic.viewMultiIndic3?p_lang=en&p_indicator_code=CP-1b%20OA [6 Jun. 2014].
Other sources:
ADB (Asian Development Bank): Social Protection Index database. Available at: http://spi.adb.org/spidmz/index.jsp [6 Jun. 2014]
CISSTAT (Interstate Statistical Committee of the Commonwealth of Independent States): WEB Database Statistics of the CIS. Available at: http://www.cisstat.org/0base/index-en.htm [6 Jun. 2014].
European Commission. 2012c. The 2012 ageing report: Economic and budgetary projections for the 27 EU Member States (2010–2060) (Brussels). Available at: http://ec.europa.eu/economy_finance/publications/european_economy/2012/2012-ageing-report_en.htm [16 Apr. 2014].
Hirose, K. (ed.). 2011. Pension reform in Central and Eastern Europe in times of crisis, austerity and beyond (Budapest, ILO Regional Office for Central and Eastern Europe).
World Bank pensions data. Available at: http://web.worldbank.org/WBSITE/EXTERNAL/TOPICS/EXTSOCIALPROTECTION/EXTPENSIONS/0,,contentMDK:23231994~menuPK:8874064~pagePK:148956~piPK:216618~theSitePK:396253,00.html [20 Apr. 2014].
National sources (see below).
Detailed notes and sources available at:
http://www.social-protection.org/gimi/gess/RessourceDownload.action?ressource.ressourceId=37917
Notes
n.a: Not applicable
…: Not available
Additional notes by country
Africa
Algeria: Including old age 'reversion pension' but excluding anticipated pension. Office national de la statistique (available at: http://www.ons.dz/IMG/pdf/AQC_R_2011_ED_2012_-_Francais.pdf, accessed May 2014).
Burundi: Includes old age, survivors pensions for people aged 60 and over.
Cabo Verde: For the contributory pension provided by CNPS, the statutory pensionable age is 65 and over for men and 60 and over for women. As the non-contributory pension targets people aged 60 and over (either men or women), the population of reference for the denominator has been set at age 60.
Côte d'Ivoire: Data from the CNPS (Caisse Nationale de Prévoyance Sociale) and CGRAE (Caisse Générale de Retraite des Agents de l’Etat).
Madagascar: Data refer to the Caisse Nationale de la Prévoyance Sociale (CNaPS) and two occupational schemes for civil servants: the Caisse de Retraites Civiles et Militaires (CRCM), which covers civil servants, government workers and the military; and the Caisse de Prévoyance et de Retraites (CPR), which covers auxiliary agents employed by the Government, who have not yet been granted full government employee status.
Malawi: There is no national social insurance scheme in Malawi. The Government Public Pension Scheme is a non-contributory, defined benefit, PAYG system. There are around 600 private pension funds in Malawi not included here.
Asia, Oceania and the Middle East
Bangladesh: The Government of Bangladesh provides its own employees with a non-contributory, defined benefit pension with survivor benefits, funded through tax revenues. Civil servants are eligible to receive a pension at the age of 57.
China: The indicator for China includes contributors to the new rural social pension plan introduced nationwide in 2009. This new pension has two components: a basic pension component financed by local and central Government and a personal account component based on contributions from enrolled individuals. In relatively poor regions the central Government pays approximately 80% of the cost of the basic pension component and the local Government bears the rest. The first basic pension component justifies inclusion in this indicator, focusing on periodic cash benefits for the elderly to ensure basic income security.
Iran, Islamic Rep. of: Corresponds to total number of insured as principal contributors and refers to the social security organization and State retirement fund.
Lebanon: There is currently no income security for the elderly through regular old-age pension benefits, only a lump sum.
Sri Lanka: Number of contributors under the widows and orphans and widowers and orphans pensions, 2003–09, which is in Sri Lanka the only mandatory contributory scheme providing pensions, i.e. monthly cash periodic benefits. This indicator refers to contributory mandatory schemes providing pensions for people above statutory retirement age (i.e. it excludes PSPS, which is a non-contributory schemes; EPF and ETF, providing lump sums; and the three voluntary social security schemes, Farmers’ Pension and Social Security Benefit Scheme, Fishermen’s Pension and Social Security Benefit Scheme, and Social Pension and Social Security Benefit Scheme (initially for self-employed only), which are voluntary and provide either lump-sum or periodic benefits.
Tonga: In September 2010, the National Retirement Benefits Scheme (NRBS) Bill 2010 was passed by the Legislative Assembly, providing a similar mandatory superannuation plan for the private sector and other organizations. No statistics available yet (see: http://www.nrbf.to/, accessed May 2014).
Vanuatu: Active member refers to a person who has at least one contribution paid on that member's behalf for the current or any of the preceding three months (see: http://www.vnpf.com.vu/p/vnpf-index.html, accessed May 2014).
Latin America and the Caribbean
Uruguay: According to household survey data, where the question is put to employed persons, the proportions were lower in 2011 (52.6% of people of working age and 67.6% of the labour force). See Insituto Nacional de Estadística: Encuesta continua de hogares 2011 (available at: http://www.ine.gub.uy/microdatos/microdatosnew2008.asp#ech, accessed May 2014).

Social protection for older persons: Key policy trends and statistics 117
Table B.6. Old-age effective coverage: Old-age pension beneficiaries. Proportion of older women and men (above statutory pensionable age) receiving an old-age pension
Major area, region or country
Proportion by sex (%) Proportion by type of programme (contributory or not) %
Year Statutory pensionable age (basis for reference population)
Total Male Female No distinction available
Contributory Non- contributory 1
Regional estimates (weighted by total population)
Africa 21.5 … …
Middle East 29.5 … …
Latin America and the Caribbean
56.1 62.3 52.4
Asia and the Pacific 47.0 … …
Central and Eastern Europe
94.3 97.2 93.8
North America 93.0 … …
Western Europe 92.4 99.2 86.5
World 51.5 … …
Developing economies 44.3 … …
Least developed countries 1
16.8 … …
Low- and medium- income countries 2
24.6 … …
Emerging economies 3 71.5 … …
Developed economies 89.1 … …
Africa
Algeria 63.6 ... ... ... 51.1 12.5 2010 60+ Men | 55+ Women
Angola 14.5 ... ... ... 14.5 … 2012 60+
Benin 9.7 ... ... ... 9.7 … 2009 60+
Botswana 100.0 100.0 100.0 ... ... 100.0 2010 65+
Burkina Faso 3.2 7.1 0.5 ... 3.2 … 2009 55+
Burundi 4.0 6.8 2.0 ... 4.0 … 2011 60+
Cameroon 12.5 20.2 5.9 ... 12.5 … 2011 60+
Cabo Verde 55.7 59.8 52.8 ... 18.2 37.5 2009 60+
Chad 1.6 ... ... ... 1.6 … 2008 55+
Congo 22.1 42.4 4.7 ... 22.1 … 2011 60+
Congo, Democratic Republic of
15.0 ... ... ... 15.0 … 2009 60+ Women | 65+ Men
Côte d'Ivoire 7.7 ... ... ... 7.7 … 2010 55+ as common denominator (Eligibility: 65+ for non contributory pension except 60 in specific region)

118 Social protection for older persons: Key policy trends and statistics
Major area, region or country
Proportion by sex (%) Proportion by type of programme (contributory or not) %
Year Statutory pensionable age (basis for reference population)
Total Male Female No distinction available
Contributory Non- contributory 1
Djibouti 12.0 ... ... ... 12.0 … 2002 60+
Egypt 32.7 61.7 8.0 32.7 … … 2008 60+
Ethiopia 9.0 ... ... ... 9.0 … 2006 60+
Gabon 38.8 ... ... ... 38.8 … 2010 55+
Gambia 10.8 ... ... ... 10.8 … 2006 60+
Ghana 7.6 ... ... ... 7.6 … 2011 60+
Guinea 8.8 ... ... ... 8.8 … 2008 55+
Guinea-Bissau 6.2 ... ... ... 6.2 … 2008 60+
Kenya 7.9 ... ... ... 6.6 1.4 2010 55+ -
Lesotho 100.0 100.0 100.0 ... … 100.0 2010 70+
Libya 43.3 ... ... ... 43.3 … 2006 65+ Men | 60+ Women
Madagascar 4.6 ... ... ... 4.6 … 2011 60+
Malawi 4.1 ... ... ... 4.1 … 2010 60+
Mali 5.7 8.5 3.7 ... 5.7 … 2010 58+
Mauritania 9.3 ... ... ... 9.3 … 2002 60+ Men | 55+ Women
Mauritius 100.0 100.0 100.0 ... … 100.0 2010 60+
Morocco 39.8 ... ... ... 39.8 … 2009 60+
Mozambique 17.3 20.0 15.9 ... 1.7 15.6 2011 60+ Men | 55+ Women
Namibia 98.4 ... ... ... … 98.4 2011 60+
Niger 6.1 ... ... ... 6.1 … 2007 60+
Nigeria ... ... ... ... … 0.4 n.a.
Rwanda 4.7 ... ... ... 4.7 … 2004 55+
Sao Tome and Principe 41.8 ... ... ... 41.8 … 2010 62 + Men | 57 + Women
Senegal 23.5 ... ... ... 23.5 … 2010 55+
Seychelles 100.0 100.0 100.0 ... 11.4 88.6 2011 63+
Sierra Leone 0.9 ... ... ... 0.9 … 2007 60+
South Africa 92.6 ... ... ... 27.7 64.9 2012 60+
Sudan 4.6 ... ... ... 4.6 … 2010 60+
Swaziland 86.0 ... ... ... … 86.0 2011 60+
Tanzania, United Republic of
3.2 ... ... ... 3.2 … 2008 60+
Togo 10.9 ... ... ... 10.9 … 2009 60+
Tunisia 68.8 ... ... ... 68.8 … 2006 60+
Uganda 6.6 ... ... ... 4.5 2.1 2012 55+
Zambia 7.7 ... ... ... 6.9 0.8 2008 55+
Zimbabwe 6.2 ... ... ... 6.2 … 2006 60+
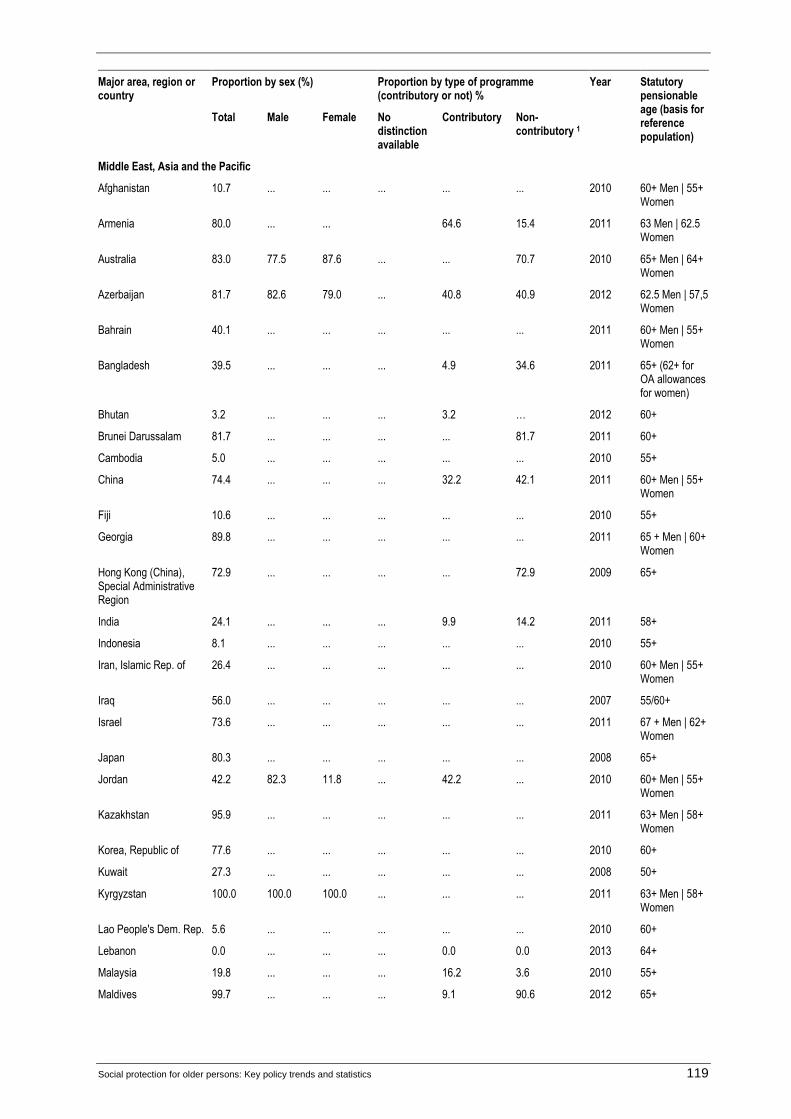
Social protection for older persons: Key policy trends and statistics 119
Major area, region or country
Proportion by sex (%) Proportion by type of programme (contributory or not) %
Year Statutory pensionable age (basis for reference population)
Total Male Female No distinction available
Contributory Non- contributory 1
Middle East, Asia and the Pacific
Afghanistan 10.7 ... ... ... ... ... 2010 60+ Men | 55+ Women
Armenia 80.0 ... ... 64.6 15.4 2011 63 Men | 62.5 Women
Australia 83.0 77.5 87.6 ... ... 70.7 2010 65+ Men | 64+ Women
Azerbaijan 81.7 82.6 79.0 ... 40.8 40.9 2012 62.5 Men | 57,5 Women
Bahrain 40.1 ... ... ... ... ... 2011 60+ Men | 55+ Women
Bangladesh 39.5 ... ... ... 4.9 34.6 2011 65+ (62+ for OA allowances for women)
Bhutan 3.2 ... ... ... 3.2 … 2012 60+
Brunei Darussalam 81.7 ... ... ... ... 81.7 2011 60+
Cambodia 5.0 ... ... ... ... ... 2010 55+
China 74.4 ... ... ... 32.2 42.1 2011 60+ Men | 55+ Women
Fiji 10.6 ... ... ... ... ... 2010 55+
Georgia 89.8 ... ... ... ... ... 2011 65 + Men | 60+ Women
Hong Kong (China), Special Administrative Region
72.9 ... ... ... ... 72.9 2009 65+
India 24.1 ... ... ... 9.9 14.2 2011 58+
Indonesia 8.1 ... ... ... ... ... 2010 55+
Iran, Islamic Rep. of 26.4 ... ... ... ... ... 2010 60+ Men | 55+ Women
Iraq 56.0 ... ... ... ... ... 2007 55/60+
Israel 73.6 ... ... ... ... ... 2011 67 + Men | 62+ Women
Japan 80.3 ... ... ... ... ... 2008 65+
Jordan 42.2 82.3 11.8 ... 42.2 ... 2010 60+ Men | 55+ Women
Kazakhstan 95.9 ... ... ... ... ... 2011 63+ Men | 58+ Women
Korea, Republic of 77.6 ... ... ... ... ... 2010 60+
Kuwait 27.3 ... ... ... ... ... 2008 50+
Kyrgyzstan 100.0 100.0 100.0 ... ... ... 2011 63+ Men | 58+ Women
Lao People's Dem. Rep. 5.6 ... ... ... ... ... 2010 60+
Lebanon 0.0 ... ... ... 0.0 0.0 2013 64+
Malaysia 19.8 ... ... ... 16.2 3.6 2010 55+
Maldives 99.7 ... ... ... 9.1 90.6 2012 65+
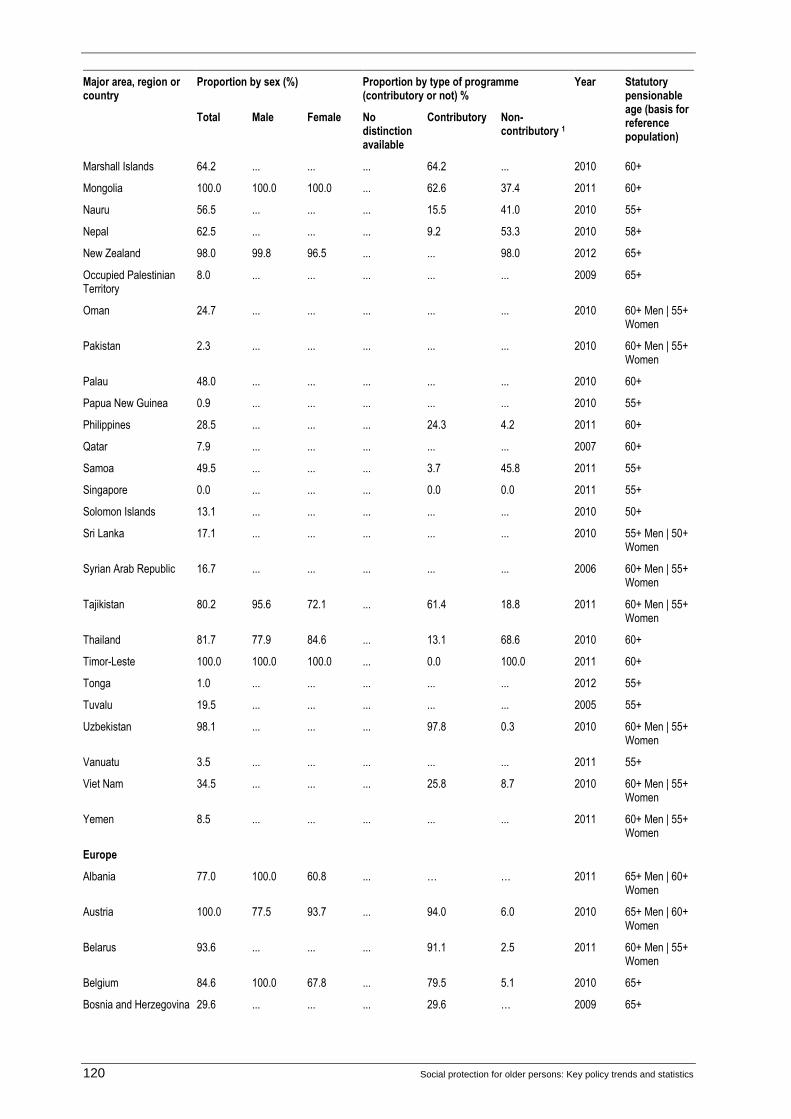
120 Social protection for older persons: Key policy trends and statistics
Major area, region or country
Proportion by sex (%) Proportion by type of programme (contributory or not) %
Year Statutory pensionable age (basis for reference population)
Total Male Female No distinction available
Contributory Non- contributory 1
Marshall Islands 64.2 ... ... ... 64.2 ... 2010 60+
Mongolia 100.0 100.0 100.0 ... 62.6 37.4 2011 60+
Nauru 56.5 ... ... ... 15.5 41.0 2010 55+
Nepal 62.5 ... ... ... 9.2 53.3 2010 58+
New Zealand 98.0 99.8 96.5 ... ... 98.0 2012 65+
Occupied Palestinian Territory
8.0 ... ... ... ... ... 2009 65+
Oman 24.7 ... ... ... ... ... 2010 60+ Men | 55+ Women
Pakistan 2.3 ... ... ... ... ... 2010 60+ Men | 55+ Women
Palau 48.0 ... ... ... ... ... 2010 60+
Papua New Guinea 0.9 ... ... ... ... ... 2010 55+
Philippines 28.5 ... ... ... 24.3 4.2 2011 60+
Qatar 7.9 ... ... ... ... ... 2007 60+
Samoa 49.5 ... ... ... 3.7 45.8 2011 55+
Singapore 0.0 ... ... ... 0.0 0.0 2011 55+
Solomon Islands 13.1 ... ... ... ... ... 2010 50+
Sri Lanka 17.1 ... ... ... ... ... 2010 55+ Men | 50+ Women
Syrian Arab Republic 16.7 ... ... ... ... ... 2006 60+ Men | 55+ Women
Tajikistan 80.2 95.6 72.1 ... 61.4 18.8 2011 60+ Men | 55+ Women
Thailand 81.7 77.9 84.6 ... 13.1 68.6 2010 60+
Timor-Leste 100.0 100.0 100.0 ... 0.0 100.0 2011 60+
Tonga 1.0 ... ... ... ... ... 2012 55+
Tuvalu 19.5 ... ... ... ... ... 2005 55+
Uzbekistan 98.1 ... ... ... 97.8 0.3 2010 60+ Men | 55+ Women
Vanuatu 3.5 ... ... ... ... ... 2011 55+
Viet Nam 34.5 ... ... ... 25.8 8.7 2010 60+ Men | 55+ Women
Yemen 8.5 ... ... ... ... ... 2011 60+ Men | 55+ Women
Europe
Albania 77.0 100.0 60.8 ... … … 2011 65+ Men | 60+ Women
Austria 100.0 77.5 93.7 ... 94.0 6.0 2010 65+ Men | 60+ Women
Belarus 93.6 ... ... ... 91.1 2.5 2011 60+ Men | 55+ Women
Belgium 84.6 100.0 67.8 ... 79.5 5.1 2010 65+
Bosnia and Herzegovina 29.6 ... ... ... 29.6 … 2009 65+

Social protection for older persons: Key policy trends and statistics 121
Major area, region or country
Proportion by sex (%) Proportion by type of programme (contributory or not) %
Year Statutory pensionable age (basis for reference population)
Total Male Female No distinction available
Contributory Non- contributory 1
Bulgaria 96.9 99.4 95.5 ... 96.5 0.4 2010 63 + Men | 60+ Women
Croatia 57.6 85.1 44.2 ... … … 2010 65 + Men | 60+ Women
Cyprus 85.2 100.0 57.2 ... 72.3 12.9 2010 65+
Czech Republic 100.0 100.0 100.0 ... … 0.0 2010 62.2 + Men | 60.7 Women
Denmark 100.0 100.0 100.0 ... … 100.0 2011 65+
Estonia 98.0 98.5 97.5 ... 96.0 2.0 2011 63 + Men | 61+ Women
Finland 100.0 100.0 100.0 ... 47.5 52.5 2010 65+
France 100.0 100.0 100.0 ... 95.0 5.0 2010 60+
Germany 100.0 100.0 100.0 ... … … 2010 65+
Greece 77.4 100.0 54.6 ... 60.4 17.0 2010 65 + Men | 60+ Women
Hungary 91.4 97.7 87.6 ... 91.1 0.3 2010 62+
Iceland 100.0 100.0 100.0 ... 17.2 82.8 2010 67+
Ireland 90.5 100.0 66.3 ... 71.3 19.2 2010 65+
Italy 81.1 100.0 69.2 ... 75.1 6.0 2010 65 + Men | 60+ Women
Latvia 100.0 100.0 100.0 ... 99.8 0.2 2010 62+
Lithuania 100.0 100.0 100.0 ... 96.0 4.0 2010 62.5 + Men | 60+ Women
Luxembourg 90.0 100.0 56.4 ... … … 2010 65+
Malta 60.5 97.5 32.0 ... 55.3 5.2 2010 61 + Men | 60+ Women
Moldova, Republic of 72.8 63.7 77.0 ... … … 2011 62+ Men | 57 + Women
Montenegro 52.3 ... ... ... … … 2011 65 + Men | 60+ Women
Netherlands 100.0 100.0 100.0 ... … … 2010 65+
Norway 100.0 100.0 100.0 ... … … 2010 67+
Poland 96.5 100.0 94.9 ... 93.9 2.6 2009 65 + Men | 60+ Women
Portugal 100.0 100.0 100.0 ... … … 2010 65+
Romania 98.0 100.0 88.0 ... … … 2010 63.75 + Men | 58.75+ Women
Russian Federation 100.0 100.0 100.0 ... … … 2011 60+ Men | 55+ Women
Serbia 46.1 48.4 44.8 ... … … 2010 64+ Men | 59+ Women
Slovakia 100.0 100.0 100.0 ... 99.5 0.5 2010 62+
Slovenia 95.1 100.0 85.9 ... 91.1 4.0 2010 63+ Men | 61+ Women
Spain 68.2 97.4 46.6 ... 64.9 3.3 2010 65+
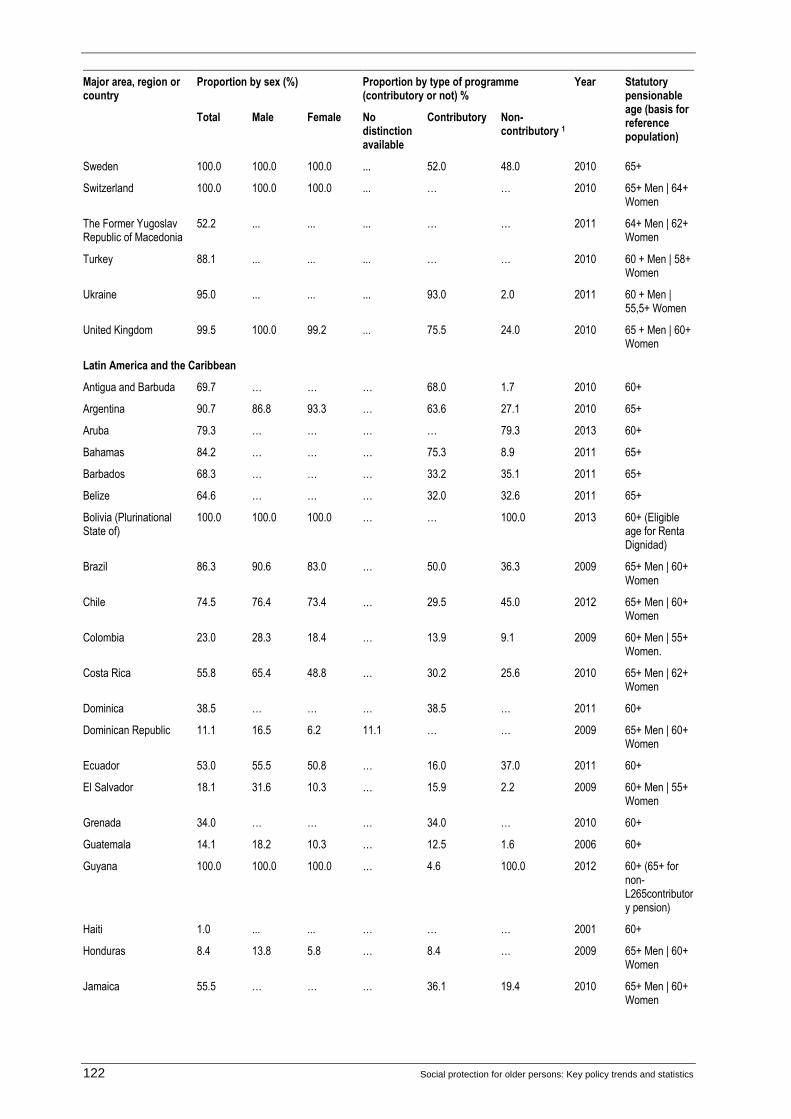
122 Social protection for older persons: Key policy trends and statistics
Major area, region or country
Proportion by sex (%) Proportion by type of programme (contributory or not) %
Year Statutory pensionable age (basis for reference population)
Total Male Female No distinction available
Contributory Non- contributory 1
Sweden 100.0 100.0 100.0 ... 52.0 48.0 2010 65+
Switzerland 100.0 100.0 100.0 ... … … 2010 65+ Men | 64+ Women
The Former Yugoslav Republic of Macedonia
52.2 ... ... ... … … 2011 64+ Men | 62+ Women
Turkey 88.1 ... ... ... … … 2010 60 + Men | 58+ Women
Ukraine 95.0 ... ... ... 93.0 2.0 2011 60 + Men | 55,5+ Women
United Kingdom 99.5 100.0 99.2 ... 75.5 24.0 2010 65 + Men | 60+ Women
Latin America and the Caribbean
Antigua and Barbuda 69.7 … … … 68.0 1.7 2010 60+
Argentina 90.7 86.8 93.3 … 63.6 27.1 2010 65+
Aruba 79.3 … … … … 79.3 2013 60+
Bahamas 84.2 … … … 75.3 8.9 2011 65+
Barbados 68.3 … … … 33.2 35.1 2011 65+
Belize 64.6 … … … 32.0 32.6 2011 65+
Bolivia (Plurinational State of)
100.0 100.0 100.0 … … 100.0 2013 60+ (Eligible age for Renta Dignidad)
Brazil 86.3 90.6 83.0 … 50.0 36.3 2009 65+ Men | 60+ Women
Chile 74.5 76.4 73.4 … 29.5 45.0 2012 65+ Men | 60+ Women
Colombia 23.0 28.3 18.4 … 13.9 9.1 2009 60+ Men | 55+ Women.
Costa Rica 55.8 65.4 48.8 … 30.2 25.6 2010 65+ Men | 62+ Women
Dominica 38.5 … … … 38.5 … 2011 60+
Dominican Republic 11.1 16.5 6.2 11.1 … … 2009 65+ Men | 60+ Women
Ecuador 53.0 55.5 50.8 … 16.0 37.0 2011 60+
El Salvador 18.1 31.6 10.3 … 15.9 2.2 2009 60+ Men | 55+ Women
Grenada 34.0 … … … 34.0 … 2010 60+
Guatemala 14.1 18.2 10.3 … 12.5 1.6 2006 60+
Guyana 100.0 100.0 100.0 … 4.6 100.0 2012 60+ (65+ for non-L265contributory pension)
Haiti 1.0 ... ... … … … 2001 60+
Honduras 8.4 13.8 5.8 … 8.4 … 2009 65+ Men | 60+ Women
Jamaica 55.5 … … … 36.1 19.4 2010 65+ Men | 60+ Women
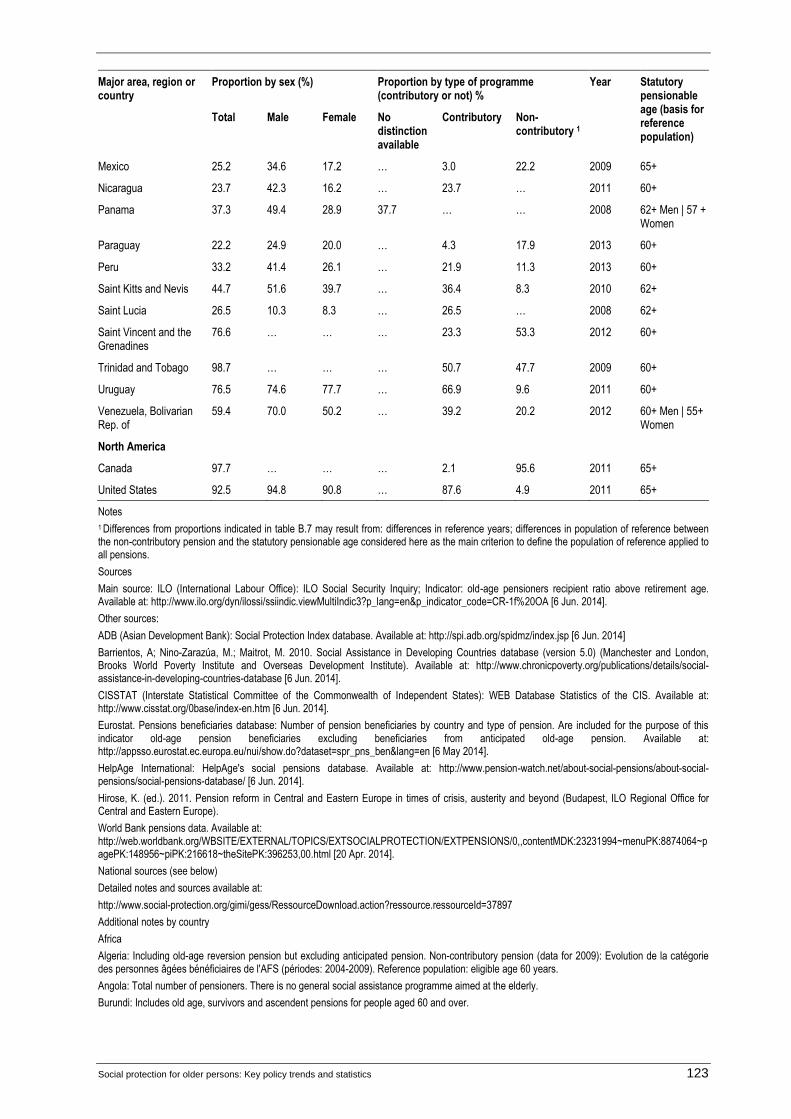
Social protection for older persons: Key policy trends and statistics 123
Major area, region or country
Proportion by sex (%) Proportion by type of programme (contributory or not) %
Year Statutory pensionable age (basis for reference population)
Total Male Female No distinction available
Contributory Non- contributory 1
Mexico 25.2 34.6 17.2 … 3.0 22.2 2009 65+
Nicaragua 23.7 42.3 16.2 … 23.7 … 2011 60+
Panama 37.3 49.4 28.9 37.7 … … 2008 62+ Men | 57 + Women
Paraguay 22.2 24.9 20.0 … 4.3 17.9 2013 60+
Peru 33.2 41.4 26.1 … 21.9 11.3 2013 60+
Saint Kitts and Nevis 44.7 51.6 39.7 … 36.4 8.3 2010 62+
Saint Lucia 26.5 10.3 8.3 … 26.5 … 2008 62+
Saint Vincent and the Grenadines
76.6 … … … 23.3 53.3 2012 60+
Trinidad and Tobago 98.7 … … … 50.7 47.7 2009 60+
Uruguay 76.5 74.6 77.7 … 66.9 9.6 2011 60+
Venezuela, Bolivarian Rep. of
59.4 70.0 50.2 … 39.2 20.2 2012 60+ Men | 55+ Women
North America
Canada 97.7 … … … 2.1 95.6 2011 65+
United States 92.5 94.8 90.8 … 87.6 4.9 2011 65+
Notes
1 Differences from proportions indicated in table B.7 may result from: differences in reference years; differences in population of reference between the non-contributory pension and the statutory pensionable age considered here as the main criterion to define the population of reference applied to all pensions.
Sources
Main source: ILO (International Labour Office): ILO Social Security Inquiry; Indicator: old-age pensioners recipient ratio above retirement age. Available at: http://www.ilo.org/dyn/ilossi/ssiindic.viewMultiIndic3?p_lang=en&p_indicator_code=CR-1f%20OA [6 Jun. 2014].
Other sources:
ADB (Asian Development Bank): Social Protection Index database. Available at: http://spi.adb.org/spidmz/index.jsp [6 Jun. 2014]
Barrientos, A; Nino-Zarazúa, M.; Maitrot, M. 2010. Social Assistance in Developing Countries database (version 5.0) (Manchester and London, Brooks World Poverty Institute and Overseas Development Institute). Available at: http://www.chronicpoverty.org/publications/details/social-assistance-in-developing-countries-database [6 Jun. 2014].
CISSTAT (Interstate Statistical Committee of the Commonwealth of Independent States): WEB Database Statistics of the CIS. Available at: http://www.cisstat.org/0base/index-en.htm [6 Jun. 2014].
Eurostat. Pensions beneficiaries database: Number of pension beneficiaries by country and type of pension. Are included for the purpose of this indicator old-age pension beneficiaries excluding beneficiaries from anticipated old-age pension. Available at: http://appsso.eurostat.ec.europa.eu/nui/show.do?dataset=spr_pns_ben&lang=en [6 May 2014].
HelpAge International: HelpAge's social pensions database. Available at: http://www.pension-watch.net/about-social-pensions/about-social-pensions/social-pensions-database/ [6 Jun. 2014].
Hirose, K. (ed.). 2011. Pension reform in Central and Eastern Europe in times of crisis, austerity and beyond (Budapest, ILO Regional Office for Central and Eastern Europe).
World Bank pensions data. Available at: http://web.worldbank.org/WBSITE/EXTERNAL/TOPICS/EXTSOCIALPROTECTION/EXTPENSIONS/0,,contentMDK:23231994~menuPK:8874064~pagePK:148956~piPK:216618~theSitePK:396253,00.html [20 Apr. 2014].
National sources (see below)
Detailed notes and sources available at:
http://www.social-protection.org/gimi/gess/RessourceDownload.action?ressource.ressourceId=37897
Additional notes by country
Africa
Algeria: Including old-age reversion pension but excluding anticipated pension. Non-contributory pension (data for 2009): Evolution de la catégorie des personnes âgées bénéficiaires de l'AFS (périodes: 2004-2009). Reference population: eligible age 60 years.
Angola: Total number of pensioners. There is no general social assistance programme aimed at the elderly.
Burundi: Includes old age, survivors and ascendent pensions for people aged 60 and over.
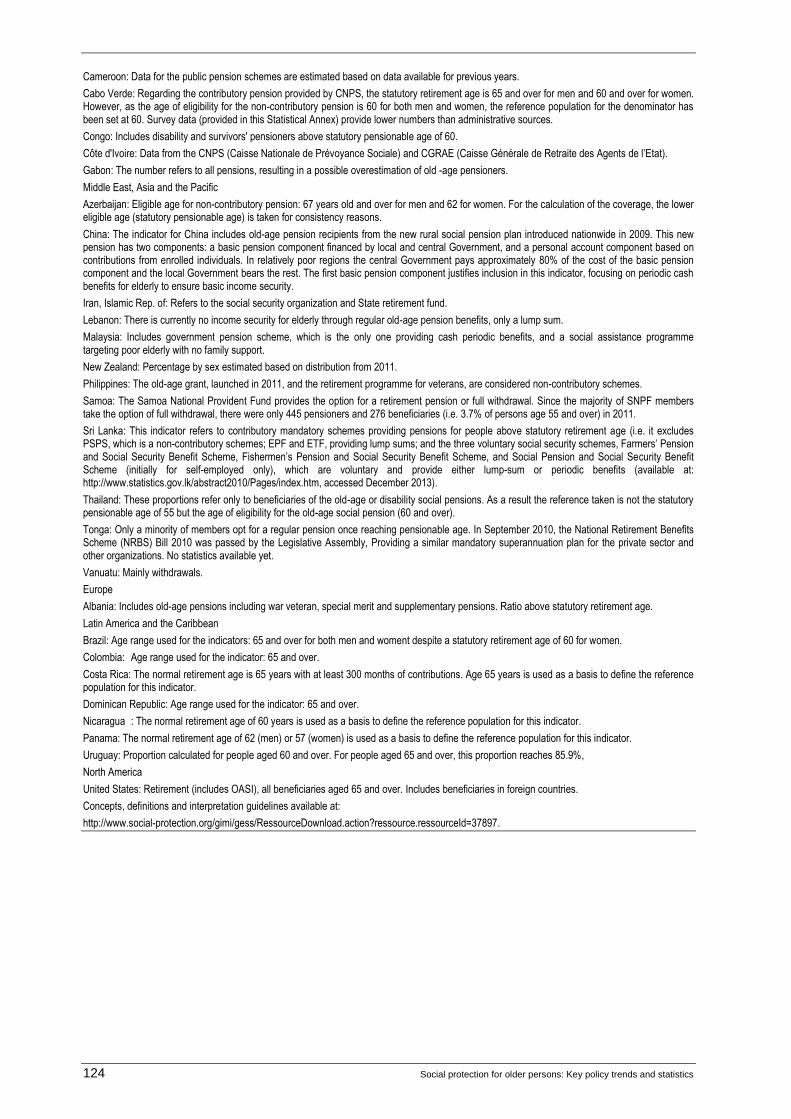
124 Social protection for older persons: Key policy trends and statistics
Cameroon: Data for the public pension schemes are estimated based on data available for previous years.
Cabo Verde: Regarding the contributory pension provided by CNPS, the statutory retirement age is 65 and over for men and 60 and over for women. However, as the age of eligibility for the non-contributory pension is 60 for both men and women, the reference population for the denominator has been set at 60. Survey data (provided in this Statistical Annex) provide lower numbers than administrative sources.
Congo: Includes disability and survivors' pensioners above statutory pensionable age of 60.
Côte d'Ivoire: Data from the CNPS (Caisse Nationale de Prévoyance Sociale) and CGRAE (Caisse Générale de Retraite des Agents de l’Etat).
Gabon: The number refers to all pensions, resulting in a possible overestimation of old -age pensioners.
Middle East, Asia and the Pacific
Azerbaijan: Eligible age for non-contributory pension: 67 years old and over for men and 62 for women. For the calculation of the coverage, the lower eligible age (statutory pensionable age) is taken for consistency reasons.
China: The indicator for China includes old-age pension recipients from the new rural social pension plan introduced nationwide in 2009. This new pension has two components: a basic pension component financed by local and central Government, and a personal account component based on contributions from enrolled individuals. In relatively poor regions the central Government pays approximately 80% of the cost of the basic pension component and the local Government bears the rest. The first basic pension component justifies inclusion in this indicator, focusing on periodic cash benefits for elderly to ensure basic income security.
Iran, Islamic Rep. of: Refers to the social security organization and State retirement fund.
Lebanon: There is currently no income security for elderly through regular old-age pension benefits, only a lump sum.
Malaysia: Includes government pension scheme, which is the only one providing cash periodic benefits, and a social assistance programme targeting poor elderly with no family support.
New Zealand: Percentage by sex estimated based on distribution from 2011.
Philippines: The old-age grant, launched in 2011, and the retirement programme for veterans, are considered non-contributory schemes.
Samoa: The Samoa National Provident Fund provides the option for a retirement pension or full withdrawal. Since the majority of SNPF members take the option of full withdrawal, there were only 445 pensioners and 276 beneficiaries (i.e. 3.7% of persons age 55 and over) in 2011.
Sri Lanka: This indicator refers to contributory mandatory schemes providing pensions for people above statutory retirement age (i.e. it excludes PSPS, which is a non-contributory schemes; EPF and ETF, providing lump sums; and the three voluntary social security schemes, Farmers’ Pension and Social Security Benefit Scheme, Fishermen’s Pension and Social Security Benefit Scheme, and Social Pension and Social Security Benefit Scheme (initially for self-employed only), which are voluntary and provide either lump-sum or periodic benefits (available at: http://www.statistics.gov.lk/abstract2010/Pages/index.htm, accessed December 2013).
Thailand: These proportions refer only to beneficiaries of the old-age or disability social pensions. As a result the reference taken is not the statutory pensionable age of 55 but the age of eligibility for the old-age social pension (60 and over).
Tonga: Only a minority of members opt for a regular pension once reaching pensionable age. In September 2010, the National Retirement Benefits Scheme (NRBS) Bill 2010 was passed by the Legislative Assembly, Providing a similar mandatory superannuation plan for the private sector and other organizations. No statistics available yet.
Vanuatu: Mainly withdrawals.
Europe
Albania: Includes old-age pensions including war veteran, special merit and supplementary pensions. Ratio above statutory retirement age.
Latin America and the Caribbean
Brazil: Age range used for the indicators: 65 and over for both men and woment despite a statutory retirement age of 60 for women.
Colombia: Age range used for the indicator: 65 and over.
Costa Rica: The normal retirement age is 65 years with at least 300 months of contributions. Age 65 years is used as a basis to define the reference population for this indicator.
Dominican Republic: Age range used for the indicator: 65 and over.
Nicaragua : The normal retirement age of 60 years is used as a basis to define the reference population for this indicator.
Panama: The normal retirement age of 62 (men) or 57 (women) is used as a basis to define the reference population for this indicator.
Uruguay: Proportion calculated for people aged 60 and over. For people aged 65 and over, this proportion reaches 85.9%,
North America
United States: Retirement (includes OASI), all beneficiaries aged 65 and over. Includes beneficiaries in foreign countries.
Concepts, definitions and interpretation guidelines available at:
http://www.social-protection.org/gimi/gess/RessourceDownload.action?ressource.ressourceId=37897.
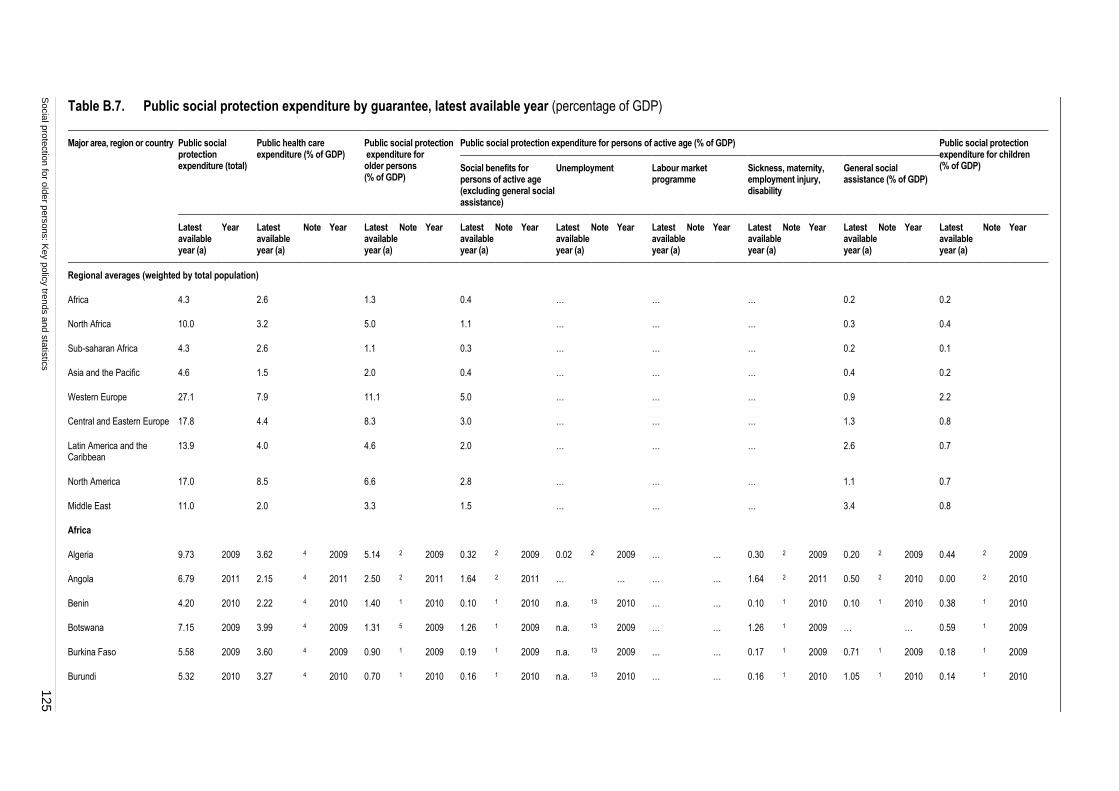
Socia
l pro
tectio
n fo
r old
er p
ers
ons: K
ey p
olic
y tre
nds a
nd s
tatis
tics
125
Table B.7. Public social protection expenditure by guarantee, latest available year (percentage of GDP)
Major area, region or country Public social protection expenditure (total)
Public health care expenditure (% of GDP)
Public social protection expenditure for older persons (% of GDP)
Public social protection expenditure for persons of active age (% of GDP) Public social protection expenditure for children (% of GDP) Social benefits for
persons of active age (excluding general social assistance)
Unemployment Labour market programme
Sickness, maternity, employment injury, disability
General social assistance (% of GDP)
Latest available year (a)
Year Latest available year (a)
Note Year Latest available year (a)
Note Year Latest available year (a)
Note Year Latest available year (a)
Note Year Latest available year (a)
Note Year Latest available year (a)
Note Year Latest available year (a)
Note Year Latest available year (a)
Note Year
Regional averages (weighted by total population)
Africa 4.3 2.6 1.3 0.4 … … … 0.2 0.2
North Africa 10.0 3.2 5.0 1.1 … … … 0.3 0.4
Sub-saharan Africa 4.3 2.6 1.1 0.3 … … … 0.2 0.1
Asia and the Pacific 4.6 1.5 2.0 0.4 … … … 0.4 0.2
Western Europe 27.1 7.9 11.1 5.0 … … … 0.9 2.2
Central and Eastern Europe 17.8 4.4 8.3 3.0 … … … 1.3 0.8
Latin America and the Caribbean
13.9 4.0 4.6 2.0 … … … 2.6 0.7
North America 17.0 8.5 6.6 2.8 … … … 1.1 0.7
Middle East 11.0 2.0 3.3 1.5 … … … 3.4 0.8
Africa
Algeria 9.73 2009 3.62 4 2009 5.14 2 2009 0.32 2 2009 0.02 2 2009 … … 0.30 2 2009 0.20 2 2009 0.44 2 2009
Angola 6.79 2011 2.15 4 2011 2.50 2 2011 1.64 2 2011 … … … … 1.64 2 2011 0.50 2 2010 0.00 2 2010
Benin 4.20 2010 2.22 4 2010 1.40 1 2010 0.10 1 2010 n.a. 13 2010 … … 0.10 1 2010 0.10 1 2010 0.38 1 2010
Botswana 7.15 2009 3.99 4 2009 1.31 5 2009 1.26 1 2009 n.a. 13 2009 … … 1.26 1 2009 … … 0.59 1 2009
Burkina Faso 5.58 2009 3.60 4 2009 0.90 1 2009 0.19 1 2009 n.a. 13 2009 … … 0.17 1 2009 0.71 1 2009 0.18 1 2009
Burundi 5.32 2010 3.27 4 2010 0.70 1 2010 0.16 1 2010 n.a. 13 2010 … … 0.16 1 2010 1.05 1 2010 0.14 1 2010
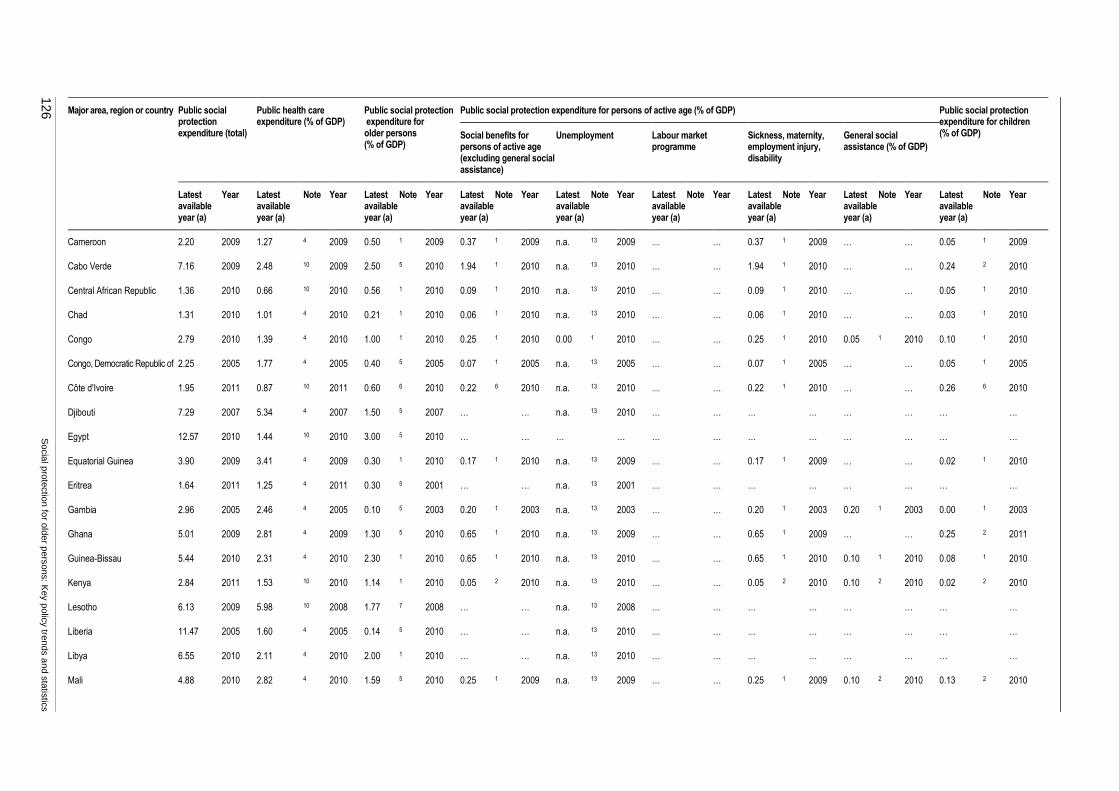
126
S
ocia
l pro
tectio
n fo
r old
er p
ers
ons: K
ey p
olic
y tre
nds a
nd s
tatis
tics
Major area, region or country Public social protection expenditure (total)
Public health care expenditure (% of GDP)
Public social protection expenditure for older persons (% of GDP)
Public social protection expenditure for persons of active age (% of GDP) Public social protection expenditure for children (% of GDP) Social benefits for
persons of active age (excluding general social assistance)
Unemployment Labour market programme
Sickness, maternity, employment injury, disability
General social assistance (% of GDP)
Latest available year (a)
Year Latest available year (a)
Note Year Latest available year (a)
Note Year Latest available year (a)
Note Year Latest available year (a)
Note Year Latest available year (a)
Note Year Latest available year (a)
Note Year Latest available year (a)
Note Year Latest available year (a)
Note Year
Cameroon 2.20 2009 1.27 4 2009 0.50 1 2009 0.37 1 2009 n.a. 13 2009 … … 0.37 1 2009 … … 0.05 1 2009
Cabo Verde 7.16 2009 2.48 10 2009 2.50 5 2010 1.94 1 2010 n.a. 13 2010 … … 1.94 1 2010 … … 0.24 2 2010
Central African Republic 1.36 2010 0.66 10 2010 0.56 1 2010 0.09 1 2010 n.a. 13 2010 … … 0.09 1 2010 … … 0.05 1 2010
Chad 1.31 2010 1.01 4 2010 0.21 1 2010 0.06 1 2010 n.a. 13 2010 … … 0.06 1 2010 … … 0.03 1 2010
Congo 2.79 2010 1.39 4 2010 1.00 1 2010 0.25 1 2010 0.00 1 2010 … … 0.25 1 2010 0.05 1 2010 0.10 1 2010
Congo, Democratic Republic of 2.25 2005 1.77 4 2005 0.40 5 2005 0.07 1 2005 n.a. 13 2005 … … 0.07 1 2005 … … 0.05 1 2005
Côte d'Ivoire 1.95 2011 0.87 10 2011 0.60 6 2010 0.22 6 2010 n.a. 13 2010 … … 0.22 1 2010 … … 0.26 6 2010
Djibouti 7.29 2007 5.34 4 2007 1.50 5 2007 … … n.a. 13 2010 … … … … … … … …
Egypt 12.57 2010 1.44 10 2010 3.00 5 2010 … … … … … … … … … … … …
Equatorial Guinea 3.90 2009 3.41 4 2009 0.30 1 2010 0.17 1 2010 n.a. 13 2009 … … 0.17 1 2009 … … 0.02 1 2010
Eritrea 1.64 2011 1.25 4 2011 0.30 5 2001 … … n.a. 13 2001 … … … … … … … …
Gambia 2.96 2005 2.46 4 2005 0.10 5 2003 0.20 1 2003 n.a. 13 2003 … … 0.20 1 2003 0.20 1 2003 0.00 1 2003
Ghana 5.01 2009 2.81 4 2009 1.30 5 2010 0.65 1 2010 n.a. 13 2009 … … 0.65 1 2009 … … 0.25 2 2011
Guinea-Bissau 5.44 2010 2.31 4 2010 2.30 1 2010 0.65 1 2010 n.a. 13 2010 … … 0.65 1 2010 0.10 1 2010 0.08 1 2010
Kenya 2.84 2011 1.53 10 2010 1.14 1 2010 0.05 2 2010 n.a. 13 2010 … … 0.05 2 2010 0.10 2 2010 0.02 2 2010
Lesotho 6.13 2009 5.98 10 2008 1.77 7 2008 … … n.a. 13 2008 … … … … … … … …
Liberia 11.47 2005 1.60 4 2005 0.14 5 2010 … … n.a. 13 2010 … … … … … … … …
Libya 6.55 2010 2.11 4 2010 2.00 1 2010 … … n.a. 13 2010 … … … … … … … …
Mali 4.88 2010 2.82 4 2010 1.59 5 2010 0.25 1 2009 n.a. 13 2009 … … 0.25 1 2009 0.10 2 2010 0.13 2 2010

Socia
l pro
tectio
n fo
r old
er p
ers
ons: K
ey p
olic
y tre
nds a
nd s
tatis
tics
127
Major area, region or country Public social protection expenditure (total)
Public health care expenditure (% of GDP)
Public social protection expenditure for older persons (% of GDP)
Public social protection expenditure for persons of active age (% of GDP) Public social protection expenditure for children (% of GDP) Social benefits for
persons of active age (excluding general social assistance)
Unemployment Labour market programme
Sickness, maternity, employment injury, disability
General social assistance (% of GDP)
Latest available year (a)
Year Latest available year (a)
Note Year Latest available year (a)
Note Year Latest available year (a)
Note Year Latest available year (a)
Note Year Latest available year (a)
Note Year Latest available year (a)
Note Year Latest available year (a)
Note Year Latest available year (a)
Note Year
Mauritania 4.47 2009 3.37 4 2009 0.60 5 2007 … … n.a. 13 2009 … … … … … … … …
Mauritius 9.12 2011 2.39 10 2011 5.02 1 2011 0.88 1 2011 0.01 1 2011 … … 0.87 1 2011 0.50 2 2011 0.33 1 2011
Morocco 6.57 2010 2.07 4 2010 2.90 5 2011 1.50 1 2010 n.a. 13 2010 … … 1.50 1 2010 0.05 1 2010 0.06 1 2010
Mozambique 5.32 2010 3.29 6 2010 1.84 5 2010 0.12 1 2010 n.a. 13 2010 … … 0.12 1 2010 0.06 1 2010 … …
Namibia 7.40 2011 2.80 4 2011 3.20 1 2011 0.30 1 2011 n.a. 13 2011 … … 0.30 1 2011 0.80 1 2011 0.30 1 2011
Niger 3.29 2009 2.69 4 2009 0.70 5 2006 … … … … … … … … … … … …
Nigeria 3.70 2009 2.30 12 2009 0.91 5 2004 0.29 1 2009 n.a. 13 2004 … … 0.29 1 2004 0.20 1 2009 0.00 13 2004
Rwanda 6.87 2009 5.37 4 2009 0.75 1 2009 0.50 1 2009 n.a. 13 2009 … … … … 0.10 1 2009 0.15 1 2009
Senegal 5.34 2010 3.28 4 2010 1.78 5 2010 0.15 1 2010 n.a. 13 2010 … … 0.15 1 2010 0.05 1 2010 0.08 1 2010
Seychelles 7.52 2011 3.14 10 2011 3.00 2 2010 1.39 2 2010 n.a. 13 2010 … … 1.00 2 2010 … … 0.00 13 2010
Sierra Leone 2.07 2006 1.46 4 2009 0.47 5 2009 0.14 1 2010 n.a. 13 2010 … … 0.14 1 2010 … … … …
South Africa 9.79 2010 4.74 10 2010 2.18 5 2010 1.63 1 2010 0.17 1 2010 … … 1.45 1 2010 … … 1.24 1 2010
Swaziland 7.32 2010 5.54 4 2010 0.60 7 2010 1.18 1 2010 n.a. 13 2010 … … 1.18 1 2010 0.00 1 2010 0.00 13 2010
Tanzania, United Republic of 6.81 2010 4.48 1 2010 1.89 1 2010 0.03 1 2010 n.a. 13 2010 … … 0.03 1 2010 0.40 1 2010 0.00 1 2010
Togo 5.49 2009 3.28 4 2009 2.00 1 2009 0.01 1 2009 n.a. 13 2009 … … 0.01 2 2009 0.00 2 2009 0.20 2 2009
Tunisia 10.40 2011 1.50 10 2011 4.70 1 2010 3.36 1 2010 … 2010 … … 2.35 1 2010 0.70 1 2010 0.15 1 2010
Uganda 3.46 2011 2.30 10 2011 0.40 5 2011 0.38 1 2010 n.a. 13 2011 … … 0.38 1 2011 0.30 1 2011 0.08 1 2011
Zambia 5.46 2011 3.66 4 2011 1.40 5 2008 0.35 1 2008 n.a. 13 2008 … … 0.35 1 2008 0.05 1 2011 0.00 1 2008
Zimbabwe 5.60 2011 4.30 2 2011 0.95 1 2010 0.05 1 2010 n.a. 13 2010 … … 0.05 2 2010 0.08 2 2011 0.22 2 2010
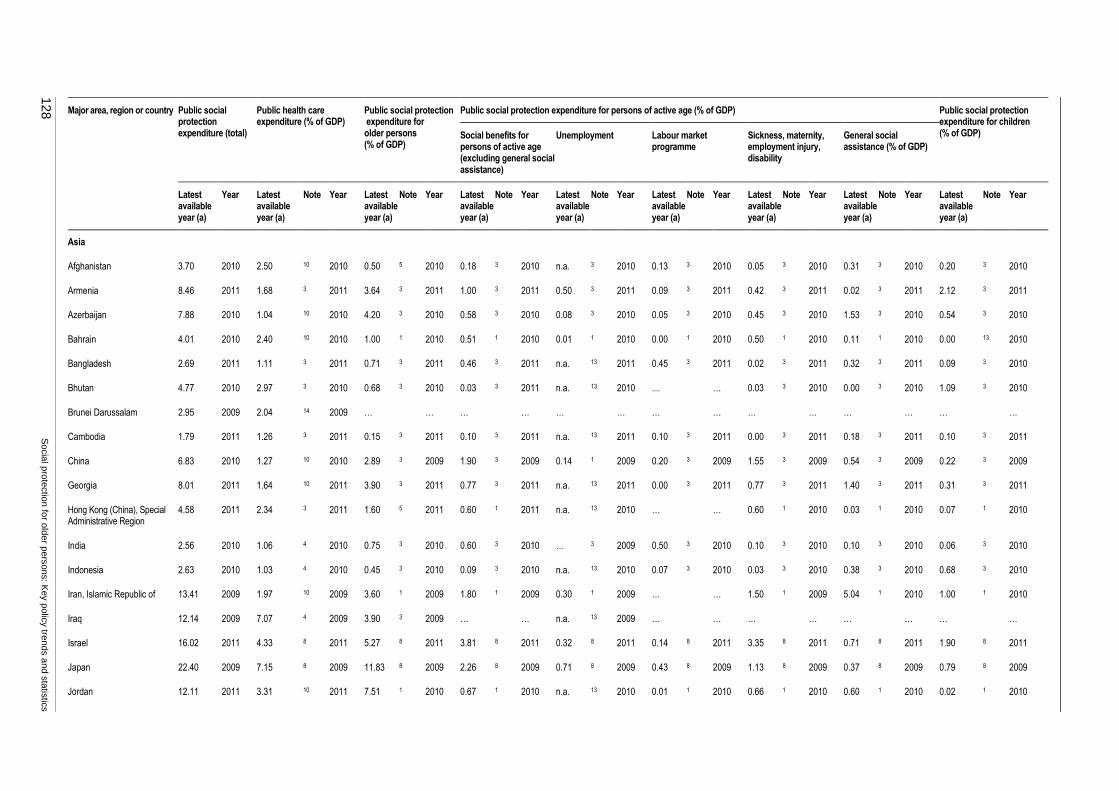
128
S
ocia
l pro
tectio
n fo
r old
er p
ers
ons: K
ey p
olic
y tre
nds a
nd s
tatis
tics
Major area, region or country Public social protection expenditure (total)
Public health care expenditure (% of GDP)
Public social protection expenditure for older persons (% of GDP)
Public social protection expenditure for persons of active age (% of GDP) Public social protection expenditure for children (% of GDP) Social benefits for
persons of active age (excluding general social assistance)
Unemployment Labour market programme
Sickness, maternity, employment injury, disability
General social assistance (% of GDP)
Latest available year (a)
Year Latest available year (a)
Note Year Latest available year (a)
Note Year Latest available year (a)
Note Year Latest available year (a)
Note Year Latest available year (a)
Note Year Latest available year (a)
Note Year Latest available year (a)
Note Year Latest available year (a)
Note Year
Asia
Afghanistan 3.70 2010 2.50 10 2010 0.50 5 2010 0.18 3 2010 n.a. 3 2010 0.13 3 2010 0.05 3 2010 0.31 3 2010 0.20 3 2010
Armenia 8.46 2011 1.68 3 2011 3.64 3 2011 1.00 3 2011 0.50 3 2011 0.09 3 2011 0.42 3 2011 0.02 3 2011 2.12 3 2011
Azerbaijan 7.88 2010 1.04 10 2010 4.20 3 2010 0.58 3 2010 0.08 3 2010 0.05 3 2010 0.45 3 2010 1.53 3 2010 0.54 3 2010
Bahrain 4.01 2010 2.40 10 2010 1.00 1 2010 0.51 1 2010 0.01 1 2010 0.00 1 2010 0.50 1 2010 0.11 1 2010 0.00 13 2010
Bangladesh 2.69 2011 1.11 3 2011 0.71 3 2011 0.46 3 2011 n.a. 13 2011 0.45 3 2011 0.02 3 2011 0.32 3 2011 0.09 3 2010
Bhutan 4.77 2010 2.97 3 2010 0.68 3 2010 0.03 3 2011 n.a. 13 2010 … … 0.03 3 2010 0.00 3 2010 1.09 3 2010
Brunei Darussalam 2.95 2009 2.04 14 2009 … … … … … … … … … … … … … …
Cambodia 1.79 2011 1.26 3 2011 0.15 3 2011 0.10 3 2011 n.a. 13 2011 0.10 3 2011 0.00 3 2011 0.18 3 2011 0.10 3 2011
China 6.83 2010 1.27 10 2010 2.89 3 2009 1.90 3 2009 0.14 1 2009 0.20 3 2009 1.55 3 2009 0.54 3 2009 0.22 3 2009
Georgia 8.01 2011 1.64 10 2011 3.90 3 2011 0.77 3 2011 n.a. 13 2011 0.00 3 2011 0.77 3 2011 1.40 3 2011 0.31 3 2011
Hong Kong (China), Special Administrative Region
4.58 2011 2.34 3 2011 1.60 5 2011 0.60 1 2011 n.a. 13 2010 … … 0.60 1 2010 0.03 1 2010 0.07 1 2010
India 2.56 2010 1.06 4 2010 0.75 3 2010 0.60 3 2010 … 3 2009 0.50 3 2010 0.10 3 2010 0.10 3 2010 0.06 3 2010
Indonesia 2.63 2010 1.03 4 2010 0.45 3 2010 0.09 3 2010 n.a. 13 2010 0.07 3 2010 0.03 3 2010 0.38 3 2010 0.68 3 2010
Iran, Islamic Republic of 13.41 2009 1.97 10 2009 3.60 1 2009 1.80 1 2009 0.30 1 2009 … … 1.50 1 2009 5.04 1 2010 1.00 1 2010
Iraq 12.14 2009 7.07 4 2009 3.90 3 2009 … … n.a. 13 2009 … … … … … … … …
Israel 16.02 2011 4.33 8 2011 5.27 8 2011 3.81 8 2011 0.32 8 2011 0.14 8 2011 3.35 8 2011 0.71 8 2011 1.90 8 2011
Japan 22.40 2009 7.15 8 2009 11.83 8 2009 2.26 8 2009 0.71 8 2009 0.43 8 2009 1.13 8 2009 0.37 8 2009 0.79 8 2009
Jordan 12.11 2011 3.31 10 2011 7.51 1 2010 0.67 1 2010 n.a. 13 2010 0.01 1 2010 0.66 1 2010 0.60 1 2010 0.02 1 2010

Socia
l pro
tectio
n fo
r old
er p
ers
ons: K
ey p
olic
y tre
nds a
nd s
tatis
tics
129
Major area, region or country Public social protection expenditure (total)
Public health care expenditure (% of GDP)
Public social protection expenditure for older persons (% of GDP)
Public social protection expenditure for persons of active age (% of GDP) Public social protection expenditure for children (% of GDP) Social benefits for
persons of active age (excluding general social assistance)
Unemployment Labour market programme
Sickness, maternity, employment injury, disability
General social assistance (% of GDP)
Latest available year (a)
Year Latest available year (a)
Note Year Latest available year (a)
Note Year Latest available year (a)
Note Year Latest available year (a)
Note Year Latest available year (a)
Note Year Latest available year (a)
Note Year Latest available year (a)
Note Year Latest available year (a)
Note Year
Kazakhstan 6.38 2011 2.27 10 2011 2.70 5 2011 1.00 1 2011 … … … … … … 0.21 1 2011 0.20 1 2011
Korea, Republic of 9.19 2010 4.12 8 2010 2.36 8 2010 1.24 8 2010 0.31 8 2010 0.38 8 2010 0.54 8 2010 0.68 8 2010 0.78 8 2010
Kuwait 11.44 2011 2.23 10 2011 3.50 1 2011 … … n.a. 13 2011 … … … … … … … …
Kyrgyzstan 8.30 2011 3.31 3 2011 1.54 3 2010 3.11 3 2010 0.01 3 2010 0.01 3 2010 3.08 3 2010 0.02 3 2010 0.33 3 2010
Lao People's Democratic Republic
1.74 2005 1.22 4 2010 0.10 3 2010 0.06 3 2010 n.a. 13 2010 … … 0.06 3 2010 0.34 3 2010 0.02 3 2010
Malaysia 2.99 2012 1.99 3 2012 0.89 3 2012 0.07 3 2012 n.a. 13 2012 0.00 3 2012 0.07 3 2012 0.03 3 2012 0.02 3 2012
Maldives 5.74 2010 3.63 10 2010 1.66 3 2010 0.23 3 2010 n.a. 13 2010 0.01 3 2010 0.22 3 2010 0.21 3 2010 0.02 3 2010
Mongolia 18.61 2011 2.97 3 2011 7.82 3 2011 1.97 3 2011 0.18 3 2011 0.38 3 2011 1.41 3 2011 5.53 3 2011 0.33 3 2011
Myanmar 0.96 2004 0.26 10 2011 0.60 5 2011 0.06 1 2011 n.a. 13 2011 … … 0.06 1 2011 0.04 1 2011 0.00 2 2011
Nepal 2.33 2011 1.61 10 2011 0.54 3 2011 0.07 3 2011 n.a. 13 2011 0.01 3 2011 0.06 3 2011 0.02 3 2011 0.09 3 2011
Pakistan 1.68 2010 0.38 2 2010 1.01 3 2010 0.03 3 2010 n.a. 13 2010 0.03 3 2010 0.00 3 2010 0.25 3 2010 0.01 3 2010
Philippines 1.55 2012 0.56 3 2012 0.58 3 2012 0.27 3 2012 n.a. 13 2012 0.02 3 2012 0.25 3 2012 0.01 3 2012 0.14 3 2012
Singapore 2.83 2011 1.20 10 2011 0.70 1 2011 0.91 1 2011 n.a. 13 2011 0.02 1 2011 0.89 1 2011 0.01 1 2011 0.01 1 2011
Sri Lanka 3.14 2011 1.26 10 2011 1.68 3 2011 0.04 3 2011 n.a. 13 2011 0.02 3 2011 0.01 3 2011 0.02 3 2011 0.15 3 2011
Syrian Arab Republic 1.99 2009 1.63 4 2009 1.30 5 2004 … … … … … … … … … … … …
Taiwan 10.54 2009 3.75 2 2009 4.74 2 2009 1.09 2 2009 0.29 1 2009 0.19 2 2009 0.61 2 2009 0.53 2 2009 0.43 2 2009
Tajikistan 5.31 2011 1.80 3 2011 0.85 3 2011 1.88 3 2010 0.02 3 2010 0.02 3 2010 1.83 3 2010 0.35 3 2011 0.43 3 2011
Thailand 7.24 2011 2.27 10 2011 4.20 3 2011 0.31 3 2011 0.11 3 2011 0.00 3 2011 0.20 3 2011 0.01 3 2011 0.45 3 2011
Timor-Leste 4.24 2010 0.83 3 2010 1.40 3 2010 0.10 3 2010 n.a. 13 2010 0.10 3 2010 0.00 3 2010 1.22 3 2010 0.69 3 2010

130
S
ocia
l pro
tectio
n fo
r old
er p
ers
ons: K
ey p
olic
y tre
nds a
nd s
tatis
tics
Major area, region or country Public social protection expenditure (total)
Public health care expenditure (% of GDP)
Public social protection expenditure for older persons (% of GDP)
Public social protection expenditure for persons of active age (% of GDP) Public social protection expenditure for children (% of GDP) Social benefits for
persons of active age (excluding general social assistance)
Unemployment Labour market programme
Sickness, maternity, employment injury, disability
General social assistance (% of GDP)
Latest available year (a)
Year Latest available year (a)
Note Year Latest available year (a)
Note Year Latest available year (a)
Note Year Latest available year (a)
Note Year Latest available year (a)
Note Year Latest available year (a)
Note Year Latest available year (a)
Note Year Latest available year (a)
Note Year
Uzbekistan 11.16 2010 2.73 4 2010 5.75 3 2010 0.69 3 2010 … 3 2010 0.00 3 2010 0.69 3 2010 0.10 3 2010 1.88 3 2010
Viet Nam 6.28 2010 2.54 4 2010 3.13 3 2010 0.51 3 2010 0.02 3 2010 0.16 3 2010 0.33 3 2010 0.09 3 2010 0.02 3 2010
Yemen 1.86 2010 1.13 10 2010 0.50 2 2010 0.17 1 2010 n.a. 13 2010 … … 0.17 2 2010 0.05 2 2010 0.01 2 2010
Europe
Albania 10.83 2011 2.68 10 2011 5.20 5 2011 2.67 2 2010 … … … … … … … … 0.28 2 2010
Austria 29.10 2009 7.32 8 2009 14.00 8 2009 4.58 8 2009 1.10 8 2009 0.85 8 2009 2.63 8 2009 0.44 8 2009 2.76 8 2009
Belarus 16.35 2011 4.55 10 2010 10.00 5 2009 1.06 1 2010 … … … … 1.06 1 2010 0.34 2 2010 0.40 2 2010
Belgium 29.70 2009 8.11 8 2009 10.20 8 2009 7.76 8 2009 3.68 8 2009 1.40 8 2009 2.68 8 2009 1.02 8 2009 2.62 8 2009
Bosnia and Herzegovina 17.45 2011 6.95 4 2011 9.40 5 2009 0.80 1 2010 0.10 1 2010 … … 0.70 1 2010 0.10 1 2010 0.20 5 2010
Bulgaria 17.20 2011 4.31 9 2011 8.31 9 2010 2.73 9 2010 0.49 9 2010 … … 2.24 9 2010 0.40 9 2010 1.45 9 2010
Croatia 21.16 2011 6.38 10 2010 10.60 5 2010 3.09 2 2010 0.40 2 2010 … … 2.69 2 2010 0.14 1 2010 0.96 2 2010
Cyprus 21.31 2010 3.27 9 2010 9.91 9 2010 3.98 9 2010 1.04 9 2010 … … 2.95 9 2010 2.75 9 2010 2.20 9 2010
Czech Republic 20.71 2009 6.71 8 2009 8.55 8 2009 4.40 8 2009 1.02 8 2009 0.22 8 2009 3.17 8 2009 0.20 8 2009 0.85 8 2009
Denmark 30.19 2009 7.68 8 2009 8.17 8 2009 9.44 8 2009 2.30 8 2009 1.61 8 2009 5.53 8 2009 1.61 8 2009 3.29 8 2009
Estonia 20.04 2009 5.18 8 2009 8.07 8 2009 5.58 8 2009 1.09 8 2009 0.24 8 2009 4.25 8 2009 0.15 8 2009 1.06 8 2009
Finland 29.44 2009 6.79 8 2009 11.13 8 2009 7.77 8 2009 1.98 8 2009 0.92 8 2009 4.88 8 2009 1.21 8 2009 2.54 8 2009
France 32.07 2009 8.99 8 2009 14.11 8 2009 4.80 8 2009 1.53 8 2009 0.99 8 2009 2.29 8 2009 1.29 8 2009 2.89 8 2009
Germany 27.12 2010 8.52 8 2010 11.00 8 2010 4.97 8 2010 1.53 8 2010 0.94 8 2010 2.50 8 2010 0.81 8 2010 1.82 8 2010
Greece 23.88 2009 6.52 8 2009 13.16 8 2009 2.04 8 2009 0.72 8 2009 0.22 8 2009 1.11 8 2009 0.89 8 2009 1.27 8 2009

Socia
l pro
tectio
n fo
r old
er p
ers
ons: K
ey p
olic
y tre
nds a
nd s
tatis
tics
131
Major area, region or country Public social protection expenditure (total)
Public health care expenditure (% of GDP)
Public social protection expenditure for older persons (% of GDP)
Public social protection expenditure for persons of active age (% of GDP) Public social protection expenditure for children (% of GDP) Social benefits for
persons of active age (excluding general social assistance)
Unemployment Labour market programme
Sickness, maternity, employment injury, disability
General social assistance (% of GDP)
Latest available year (a)
Year Latest available year (a)
Note Year Latest available year (a)
Note Year Latest available year (a)
Note Year Latest available year (a)
Note Year Latest available year (a)
Note Year Latest available year (a)
Note Year Latest available year (a)
Note Year Latest available year (a)
Note Year
Hungary 23.93 2009 5.08 8 2009 10.45 8 2009 4.88 8 2009 0.88 8 2009 0.45 8 2009 3.54 8 2009 0.75 8 2009 2.76 8 2009
Iceland 18.47 2009 6.17 8 2009 2.22 8 2009 5.12 8 2009 1.68 8 2009 0.04 8 2009 3.40 8 2009 1.70 8 2009 3.27 8 2009
Ireland 23.72 2010 6.39 8 2010 5.84 8 2010 6.32 8 2010 2.60 8 2010 0.96 8 2010 2.75 8 2010 1.03 8 2010 4.15 8 2010
Italy 27.81 2009 7.42 8 2009 15.56 8 2009 3.38 8 2009 0.79 8 2009 0.44 8 2009 2.15 8 2009 0.07 8 2009 1.38 8 2009
Latvia 17.60 2010 2.95 9 2010 8.39 9 2010 4.49 9 2010 1.70 9 2010 … … 2.79 9 2010 0.29 9 2010 1.48 9 2010
Lithuania 18.30 2010 4.29 9 2010 7.89 9 2010 3.66 9 2010 0.78 9 2010 … … 2.88 9 2010 0.33 9 2010 2.13 9 2010
Luxembourg 23.57 2009 6.65 8 2009 7.67 8 2009 4.86 8 2009 1.17 8 2009 0.50 8 2009 3.19 8 2009 0.82 8 2009 3.58 8 2009
Malta 19.57 2008 4.28 9 2010 10.41 9 2010 3.08 9 2010 0.60 9 2010 … … 2.49 9 2010 0.56 9 2010 1.24 9 2010
Moldova, Republic of 18.61 2011 5.17 10 2011 7.40 5 2012 … … … … … … … … … … … …
Montenegro 20.05 2011 6.24 4 2011 11.00 5 2011 1.54 1 2011 … … 0.25 5 2011 1.29 5 2011 1.12 5 2011 0.15 5 2011
Netherlands 23.18 2009 7.90 8 2009 6.07 8 2009 5.77 8 2009 1.45 8 2009 1.22 8 2009 3.11 8 2009 1.73 8 2009 1.71 8 2009
Norway 23.29 2009 6.17 8 2009 7.41 8 2009 6.26 8 2009 0.43 8 2009 0.47 8 2009 5.36 8 2009 0.89 8 2009 2.56 8 2009
Poland 21.52 2009 5.17 8 2009 11.84 8 2009 3.56 8 2009 0.28 8 2009 0.63 8 2009 2.65 8 2009 0.21 8 2009 0.75 8 2009
Portugal 25.55 2009 7.20 8 2009 12.47 8 2009 4.39 8 2009 1.21 8 2009 0.77 8 2009 2.41 8 2009 0.31 8 2009 1.19 8 2009
Romania 17.39 2010 4.19 9 2010 8.87 9 2010 2.48 9 2010 0.41 9 2010 … … 2.07 9 2010 0.23 9 2010 1.63 9 2010
Russian Federation 15.97 2011 3.96 10 2011 6.80 5 2011 2.90 1 2010 0.18 1 2010 … … 2.72 1 2010 1.77 1 2010 0.55 1 2010
Serbia 24.00 2010 6.51 10 2010 12.84 9 2010 3.25 9 2010 0.75 9 2010 … … 2.50 9 2010 0.40 9 2010 1.00 9 2010
Slovakia 18.74 2009 6.01 8 2009 7.36 8 2009 3.49 8 2009 0.68 8 2009 0.23 8 2009 2.59 8 2009 0.40 8 2009 1.48 8 2009
Slovenia 22.58 2009 6.80 8 2009 10.96 8 2009 3.71 8 2009 0.48 8 2009 0.33 8 2009 2.90 8 2009 0.52 8 2009 0.59 8 2009

132
S
ocia
l pro
tectio
n fo
r old
er p
ers
ons: K
ey p
olic
y tre
nds a
nd s
tatis
tics
Major area, region or country Public social protection expenditure (total)
Public health care expenditure (% of GDP)
Public social protection expenditure for older persons (% of GDP)
Public social protection expenditure for persons of active age (% of GDP) Public social protection expenditure for children (% of GDP) Social benefits for
persons of active age (excluding general social assistance)
Unemployment Labour market programme
Sickness, maternity, employment injury, disability
General social assistance (% of GDP)
Latest available year (a)
Year Latest available year (a)
Note Year Latest available year (a)
Note Year Latest available year (a)
Note Year Latest available year (a)
Note Year Latest available year (a)
Note Year Latest available year (a)
Note Year Latest available year (a)
Note Year Latest available year (a)
Note Year
Spain 25.98 2009 7.04 8 2009 9.88 8 2009 7.40 8 2009 3.45 8 2009 0.86 8 2009 3.09 8 2009 0.47 8 2009 1.18 8 2009
Sweden 29.82 2009 7.30 8 2009 10.75 8 2009 7.60 8 2009 0.73 8 2009 1.12 8 2009 5.75 8 2009 1.18 8 2009 2.99 8 2009
Switzerland 18.37 2008 6.02 8 2008 6.56 8 2008 3.79 8 2008 0.53 8 2008 0.33 8 2008 2.94 8 2008 0.73 8 2008 1.27 8 2008
The Former Yugoslav Republic of Macedonia
18.08 2009 4.08 4 2010 8.00 5 2010 … … … … … … … … … … … …
Turkey 13.11 2011 5.90 8 2011 6.98 8 2011 0.24 8 2011 0.06 8 2011 0.00 8 2011 0.17 8 2011 0.00 8 2011 0.00 8 2011
Ukraine 17.42 2011 3.82 10 2011 7.90 1 2011 2.41 1 2011 0.17 1 2011 … … 2.25 1 2011 2.74 1 2011 0.54 1 2011
United Kingdom 24.05 2009 8.08 8 2009 6.76 8 2009 4.07 8 2009 0.46 8 2009 0.33 8 2009 3.28 8 2009 1.67 8 2009 3.47 8 2009
Latin America and the Caribbean
Antigua and Barbuda 5.82 2009 2.95 4 2006 2.50 1 2006 0.27 1 2006 0.00 1 2006 0.00 0 0 0.27 1 2006 0.00 1 2006 0.10 1 2006
Argentina 21.10 2009 6.21 12 2009 6.79 2 2009 5.12 2 2009 0.05 2 2009 … … 5.07 2 2009 2.03 12 2009 0.95 2 2009
Aruba 17.80 2009 9.60 2 2009 4.30 1 2009 1.09 1 2009 0.04 1 2009 … … 1.05 1 2009 1.81 1 2009 1.00 1 2009
Bahamas 6.29 2011 3.50 2 2011 1.93 2 2011 0.86 2 2011 0.11 2 2011 … … 0.75 2 2011 0.00 2 2011 0.00 1 2011
Barbados 9.85 2009 3.75 4 2009 4.08 1 2009 1.83 1 2009 0.61 1 2009 … … 1.22 1 2009 0.18 1 2009 0.00 13 2009
Belize 5.85 2011 3.85 4 2010 0.23 1 2010 0.64 1 2010 n.a. 13 2010 … … 0.64 1 2009 1.13 1 2010 0.00 12 2010
Bolivia (Plurinational State of) 10.41 2008 3.21 12 2008 2.70 2 2009 2.54 2 2009 n.a. 13 2009 … … 2.54 2 2009 1.46 1 2008 0.50 1 2009
Brazil 21.29 2010 5.79 1 2010 7.76 1 2010 2.60 1 2010 0.67 1 2010 0.26 1 2010 1.66 1 2010 4.54 1 2010 0.60 1 2010
Chile 10.43 2011 3.63 8 2011 3.30 8 2011 1.28 8 2011 0.04 1 2011 0.25 8 2011 0.99 8 2011 1.30 8 2011 0.93 8 2011
Colombia 10.49 2010 1.91 12 2010 3.50 5 2010 3.94 1 2009 n.a. 13 2009 … … 3.94 1 2009 0.75 12 2010 0.39 12 2009
Costa Rica 15.45 2010 6.57 12 2010 2.76 5 2009 3.42 1 2010 n.a. 13 2010 … … 3.42 1 2010 2.31 12 2010 0.39 12 2009

Socia
l pro
tectio
n fo
r old
er p
ers
ons: K
ey p
olic
y tre
nds a
nd s
tatis
tics
133
Major area, region or country Public social protection expenditure (total)
Public health care expenditure (% of GDP)
Public social protection expenditure for older persons (% of GDP)
Public social protection expenditure for persons of active age (% of GDP) Public social protection expenditure for children (% of GDP) Social benefits for
persons of active age (excluding general social assistance)
Unemployment Labour market programme
Sickness, maternity, employment injury, disability
General social assistance (% of GDP)
Latest available year (a)
Year Latest available year (a)
Note Year Latest available year (a)
Note Year Latest available year (a)
Note Year Latest available year (a)
Note Year Latest available year (a)
Note Year Latest available year (a)
Note Year Latest available year (a)
Note Year Latest available year (a)
Note Year
Cuba 22.80 2010 9.70 21 2010 … … … … … … … … … … 2.67 1 2010 … …
Dominica 7.99 2011 4.19 4 2010 3.15 1 2011 0.50 1 2011 n.a. 13 2011 … … 0.50 1 2011 0.15 1 2011 0.00 1 2011
Dominican Republic 4.82 2010 1.75 12 2010 0.70 5 2010 1.97 1 2010 n.a. 13 2010 … … 1.97 1 2010 … … 0.40 12 2010
Ecuador 4.37 2010 2.07 12 2010 1.80 5 2010 0.15 1 2010 n.a. 13 2010 … … 0.15 1 2010 0.00 12 2010 0.35 12 2009
El Salvador 7.77 2011 3.80 10 2011 1.70 5 2010 1.25 1 2010 n.a. 13 2010 … … 1.25 1 2010 0.75 12 2009 0.27 12 2010
Grenada 4.95 2009 3.05 4 2009 2.00 5 2006 … … n.a. 13 2006 … … … … … … … …
Guatemala 4.60 2009 1.40 12 2009 1.20 5 2009 1.68 1 2009 n.a. 13 2009 … … 1.68 1 2009 0.00 12 2009 0.32 12 2009
Guyana 9.72 2009 5.32 4 2009 0.07 5 2010 … … n.a. 13 2010 … … … … … … … …
Haiti 3.27 2013 2.21 27 2013 … … … … … … … … … … … … … …
Honduras 4.39 2010 3.45 12 2010 0.21 1 2010 0.20 1 2010 n.a. 13 2010 … … 0.20 1 2009 0.29 12 2010 0.24 12 2010
Jamaica 4.42 2011 2.82 10 2011 0.12 5 2009 0.39 1 2009 n.a. 13 2009 … … 0.39 1 2009 0.77 1 2009 0.33 12 2011
Mexico 7.72 2011 2.76 8 2011 1.88 8 2011 0.09 1 2011 n.a. 13 2011 0.03 8 2011 0.06 8 2011 1.92 8 2011 1.08 8 2011
Nicaragua 6.95 2009 4.06 12 2009 1.60 2 2009 0.50 2 2009 n.a. 13 2009 … … 0.50 2 2009 0.68 1 2009 0.11 12 2009
Paraguay 6.35 2010 2.28 12 2010 1.63 5 2010 1.54 1 2010 n.a. 13 2010 … … 1.54 1 2010 0.70 1 2010 0.20 1 2010
Peru 6.85 2010 1.58 12 2010 2.47 5 2010 0.78 1 2010 n.a. 13 2010 … … 0.78 1 2010 1.88 12 2010 0.14 12 2009
Saint Kitts and Nevis 5.61 2010 2.60 4 2010 1.30 1 2009 1.52 1 2009 n.a. 13 2009 … … 1.52 1 2009 0.19 1 2009 0.00 1 2009
Saint Lucia 6.58 2009 4.68 4 2009 1.20 1 2009 0.50 1 2009 n.a. 13 2009 … … 0.50 1 2009 0.10 1 2009 0.10 1 2009
Saint Vincent and the Grenadines
6.52 2004 3.22 10 2006 1.50 5 2006 1.20 1 2006 n.a. 13 2009 … … 1.20 1 2006 0.40 1 2006 0.20 1 2006
Trinidad and Tobago 7.02 2008 3.41 12 2008 2.80 1 2008 0.20 1 2008 n.a. 13 2008 … … 0.20 1 2008 0.51 1 2008 0.10 1 2008

134
S
ocia
l pro
tectio
n fo
r old
er p
ers
ons: K
ey p
olic
y tre
nds a
nd s
tatis
tics
Major area, region or country Public social protection expenditure (total)
Public health care expenditure (% of GDP)
Public social protection expenditure for older persons (% of GDP)
Public social protection expenditure for persons of active age (% of GDP) Public social protection expenditure for children (% of GDP) Social benefits for
persons of active age (excluding general social assistance)
Unemployment Labour market programme
Sickness, maternity, employment injury, disability
General social assistance (% of GDP)
Latest available year (a)
Year Latest available year (a)
Note Year Latest available year (a)
Note Year Latest available year (a)
Note Year Latest available year (a)
Note Year Latest available year (a)
Note Year Latest available year (a)
Note Year Latest available year (a)
Note Year Latest available year (a)
Note Year
Uruguay 18.17 2009 4.85 12 2010 8.90 1 2010 0.84 1 2010 0.36 1 2010 … … 0.48 1 2010 3.08 1 2010 0.50 1 2010
Venezuela, Bolivarian Republic of
7.97 2006 1.80 12 2006 4.98 5 2010 … … … … … … … … … … … …
North America
Canada 18.63 2010 7.97 8 2010 4.40 8 2010 2.30 8 2010 0.81 8 2010 0.30 8 2010 1.19 8 2010 3.18 8 2010 0.78 8 2010
United States 19.92 2010 8.57 8 2010 6.89 8 2010 2.85 8 2010 1.13 8 2010 0.13 8 2010 1.59 8 2010 0.91 8 2010 0.70 8 2010
Oceania
Australia 17.90 2010 6.21 8 2010 5.07 8 2010 3.49 8 2010 0.51 8 2010 0.31 8 2010 2.67 8 2010 0.58 8 2010 2.55 8 2010
Fiji 3.37 2010 1.87 3 2010 0.77 3 2010 0.01 3 2010 n.a. 13 2010 0.01 3 2010 0.00 3 2010 0.16 3 2010 0.57 3 2010
Kiribati 10.37 2010 8.72 14 2010 … … … … … … … … … … … … … …
Marshall Islands 24.01 2010 14.37 4 2010 7.11 3 2010 0.73 3 2010 n.a. 13 2010 0.11 3 2010 0.62 3 2010 0.00 3 2010 1.81 3 2010
Nauru 9.49 2010 8.33 4 2010 0.88 3 2010 0.28 3 2010 n.a. 13 2010 0.00 3 2010 0.28 3 2010 0.00 3 2010 0.00 3 2010
New Zealand 21.20 2010 8.39 8 2010 4.74 8 2010 3.39 8 2010 0.46 1 2010 0.26 8 2010 2.67 8 2010 1.23 8 2010 3.46 8 2010
Palau 15.79 2010 8.79 4 2010 5.07 3 2010 0.25 3 2010 n.a. 13 2010 0.00 3 2010 0.24 3 2010 0.00 3 2010 1.69 3 2010
Papua New Guinea 4.39 2010 3.27 14 2012 0.10 3 2010 0.20 3 2010 n.a. 13 2010 0.00 3 2010 0.00 3 2010 0.72 3 2010 0.10 3 2010
Solomon Islands 8.25 2010 6.95 4 2010 1.25 3 2010 0.05 3 2010 0.03 1 2010 0.02 3 2010 0.00 3 2010 0.00 3 2010 0.00 3 2010
Tonga 8.11 2005 7.06 3 2005 0.90 3 2005 0.05 3 2005 n.a. 13 2005 0.04 3 2005 0.01 3 2005 0.07 3 2005 0.04 3 2005
Tuvalu 13.36 2005 8.68 4 2005 3.31 1 2005 1.37 2 2005 n.a. 13 2005 0.14 1 2005 1.23 1 2005 0.00 1 2005 0.00 1 2005
Vanuatu 5.43 2010 4.68 4 2010 0.22 3 2010 0.16 3 2010 n.a. 13 2010 0.00 3 2010 0.16 3 2010 0.02 3 2010 0.36 3 2010
Western Samoa 5.54 2011 4.34 3 2011 0.65 3 2011 0.12 3 2011 n.a. 13 2011 0.10 3 2011 0.02 3 2011 0.38 3 2011 0.06 3 2011

Socia
l pro
tectio
n fo
r old
er p
ers
ons: K
ey p
olic
y tre
nds a
nd s
tatis
tics
135
Notes
… Not available.
n.a. Not applicable.
a Differences in global estimates from table B.12 result from differences in reference years and in number of countries considered.
Sources
1 ILO (International Labour Office): ILO Social Security Inquiry. Available at: http://www.ilo.org/dyn/ilossi/ssimain.home [6 Jun. 2014].
2 National source: Ministry of Finance.
3 ADB (Asian Development Bank): ADB Social Protection Index database. Available at: http://spi.adb.org/spidmz/index.jsp [6 Jun. 2014].
4 WHO (World Health Organization): National Health Accounts (Global Health Expenditure database). Available at: http://apps.who.int/nha/database [6 Jun. 2014].
5 World Bank pensions data. Available at: http://web.worldbank.org/WBSITE/EXTERNAL/TOPICS/EXTSOCIALPROTECTION/EXTPENSIONS/0,,contentMDK:23231994~menuPK:8874064~pagePK:148956~piPK:216618~theSitePK:396253,00.html [20 Apr. 2014].
6 UNICEF country report.
7 HelpAge International: HelpAge's social pensions database. Available at: http://www.pension-watch.net/about-social-pensions/about-social-pensions/social-pensions-database/ [6 Jun. 2014].
8 OECD (Organisation for Economic Co-operation and Development). OECD Social and welfare statistics: Social Expenditure Database (SOCX) (Paris, 2013). Available at: http://stats.oecd.org/Index.aspx?datasetcode=SOCX_AGG [6 Jun. 2014].
9 European Commission, Eurostat, Living conditions and welfare: Social Protection Database (ESSPROS) (Luxembourg, 2013). Available at: http://epp.eurostat.ec.europa.eu/portal/page/portal/living_conditions_and_social_protection/data/database [6 Jun. 2014]
10 IMF (International Monetary Fund): Government Finance Statistics, March 2014. (Washington, DC, 2014).
11 Overseas Development Institute (ODI).
12 UN ECLAC (United Nations Economic Commission for Latin America and the Caribbean): Statistics and indicators, social public expenditure (Santiago de Chile, 2014). Available at: http://www.cepal.org/default.asp?idioma=IN [6 Jun. 2014].
13 SSA (Social Security Administration of the United States); ISSA (International Social Security Association). Social security programs throughout the world (Washington, DC and Geneva): The Americas, 2013; Europe, 2012; Asia and the Pacific, 2012; Africa, 2013. Available at: http://www.ssa.gov/policy/docs/progdesc/ssptw/ [6 June 2014].
14 GSW (Government Spending Watch). Available at: http://www.governmentspendingwatch.org/spending-data [20 May 2014].