Embed Size (px)
Citation preview
Social Problems in FinlandMikko MäntysaariSlides are available at my webpage:
http://www.jyu.fi/~mmantys/teaching.html
1

Contents:
• The social problems - research tradition
• Income inequality and poverty in Finland
• Deviance
• Child care
2

1 The research tradition of social problems
The social problems are social phenomena considered to bedysfunctional in the society, at least for some people. There is agroup of people, who consider it as a good thing to get rid of thephenomena. The background for the unwanted phenomena can beeither social, natural, or biological.
3
Research on social problems can be located in different fields ofsocial studies.
• Sociology has dealt with social problems: many of the centraltheorists in sociology are important: Blumer, Merton, Kitsuse.Sociology of deviance
• social policy and social work
• economics ?
4
Traditionally, the schools of thought in social problems can bedivided in two main groups:a
• Objectivists take the objectionable or problematic conditionidentified with a social problem to be a given – that is, to be bothobjectively real and objectively harmful – and proceed toexamine the causes, characteristics, and consequences of thatcondition as a condition. “Criminal behaviour as socialproblem”. (Funktionalistit, Robert Merton, marxistit.)
• Subjectivists on the other hand deny that objective conditions areeither necessary or sufficient for a social problem to exist. Theycontend that social problems are the outcome of group activity.Problems, in other words, are accomplishments.“Claims-making about criminality is a social problem.” (Socialconstructivists, symbolic interactionism.)
aStallings, Robert (1997) Sociological Theories and Disaster Studies.
5
According to C. Wright Mills, there is a difference between personaldifficulties and social problems. If I would be the only person inJyväskylä to be unemployed, it would be my personal difficulty, butif there are a group of people unemployed, it is a social problem.
It is possible to alleviate personal difficulties by helping theindividual, but not social problems – they have to be dealt withsocially.
Simple, but elegant.
6

A “Social problem” is not an objective state of affairs in a society.There have to be a group of people who consider this state aproblem. Usually this group is in a power position or the definitionof a problem is connected to their profession. Journalists, politicians,police, and social workers are that kind of professions.
Defining something as a social problem is always power-play.
7

Herbert Blumer and John Kitsuse speak about a theory of theevolutionary change in social problems.
1. the birth of the problem
2. the legitimation of the problem
3. the mobilization of people to change the problem
4. official program is made
5. the program is enacted
There are other theories about the “life history” of the socialproblems, too.
8
Professor Jorma Sipilä (University of Tampere) defined socialproblems consisting of three types of phenomena:
• Poverty.
• Helplessness.
• Deviance.
(Sipilä 1979)
9
On the following, I will deal with issues of income inequality,poverty and unemployment, and deviant behaviour. I will not go onto the questions of helplessness.
10

2 Income inequality in Finland
On the following slide, the inequality of incomes in Finland aredescribed by using Gini coefficient.
[The Gini coefficient was developed by the Italian statistician Corrado Gini.It is a measure of the income inequality in a society. The Gini coefficient is anumber between 0 and 100, where 0 means perfect equality (everyone hasthe same income) and 100 means perfect inequality (one person has all theincome, everyone else earns nothing). While the Gini coefficient is normallyused to measure income inequality, it can be used to measure inequality ofassets as well. (From Wikipedia, the free encyclopedia.)]
Inequality in incomes has risen from a very low 20.5 to 26.
11

0
20
40
60
80
100
1986 1988 1990 1992 1994 1996 1998 2000
Gin
i coe
ffici
ent
year
Usable Income Gini−coefficient 1985−2000
12

Some other gini-coefficients:
• Australia, 1990, gini-coefficient 41.72
• Brazil, 1989, gini-coefficient 59.60
• Bulgaria, 1989 = 20.69 / 1993 = 34.42
• Chile, 1994 = 56.49
• China, 1992 = 37.80
• Sweden 1992 = 32.44
• USA 1991 = 37.90
13
Income inequality can even be measured by considering the amountof wealth which the poorest and the richest people in the society canuse. The richest decile (richest 10 % of the population) is gettingmore than before the recession. And the poorest decile is getting lessthan in the beginning of the 1990’s.
14

5
10
15
20
25
1990 1992 1994 1996 1998 2000
shar
e in
%
year
Two highest and lowest deciles of income
III
IXX
15

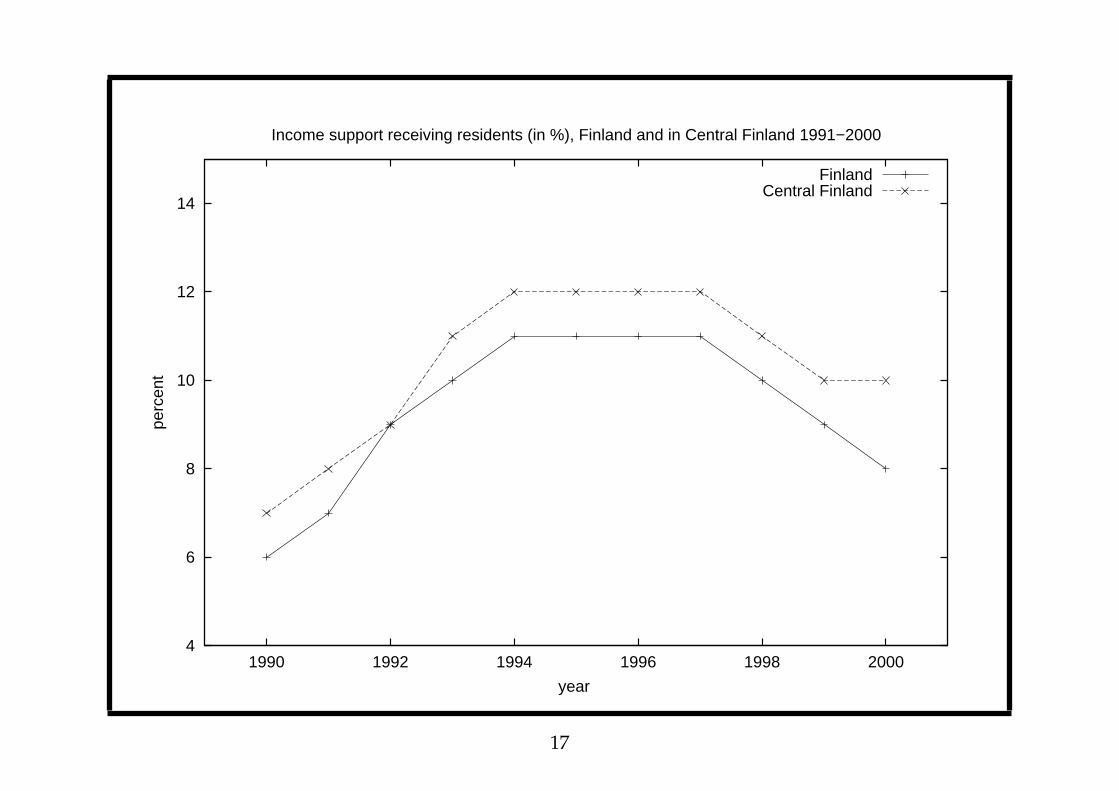
Poverty can be measured in a variety of ways. According to prof.Veli-Matti Ritakallio, poverty is measured
• using relative income method
• using relative consumption method
• political-administrative measurement
• counting income-support receivers
On the following slides the last of these is being used.
16
4
6
8
10
12
14
1990 1992 1994 1996 1998 2000
perc
ent
year
Income support receiving residents (in %), Finland and in Central Finland 1991−2000
FinlandCentral Finland
17
One of the models of analyzing poverty is concentrating on visualpoverty. Visual poverty can be seen in the streets, and in most of thelarge cities of the world, it can be easily recognized. In Finland,living in the streets is not easy, for the obvious reasons. However,there is a group of people who do not have permanent residence.Usually they dwell in various forms of shelters, but even underbridges, tents and corridors of houses.
18
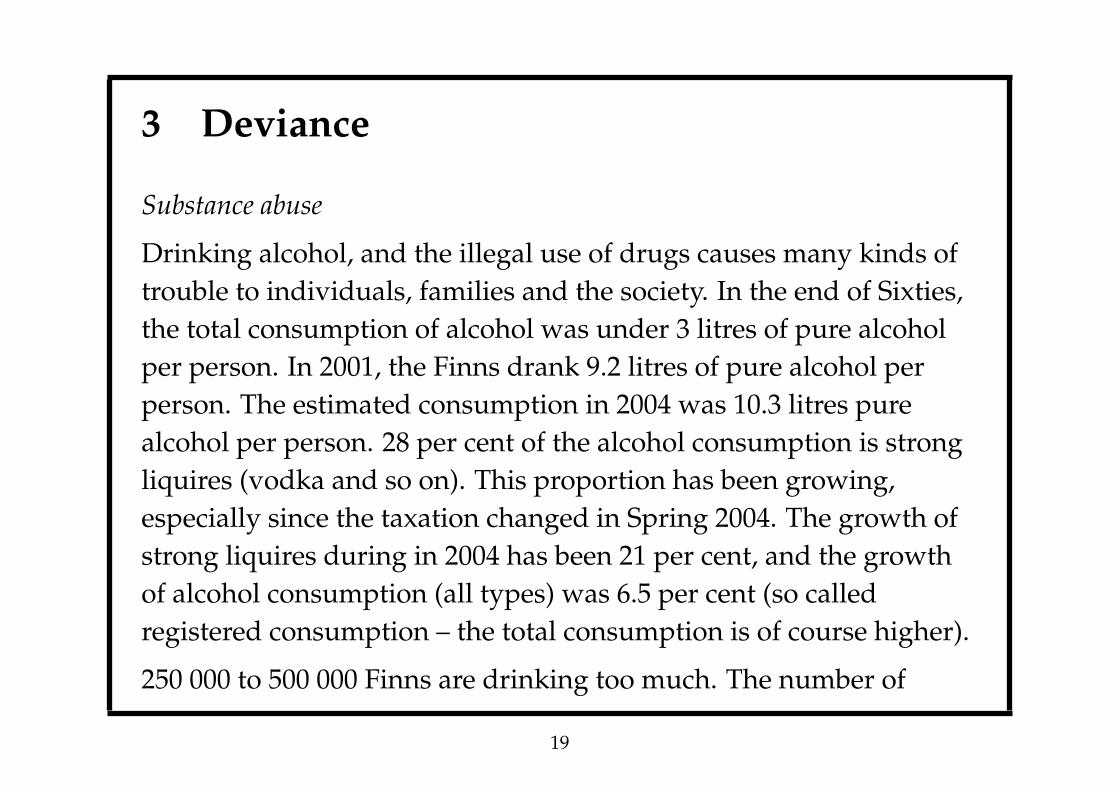
3 Deviance
Substance abuse
Drinking alcohol, and the illegal use of drugs causes many kinds oftrouble to individuals, families and the society. In the end of Sixties,the total consumption of alcohol was under 3 litres of pure alcoholper person. In 2001, the Finns drank 9.2 litres of pure alcohol perperson. The estimated consumption in 2004 was 10.3 litres purealcohol per person. 28 per cent of the alcohol consumption is strongliquires (vodka and so on). This proportion has been growing,especially since the taxation changed in Spring 2004. The growth ofstrong liquires during in 2004 has been 21 per cent, and the growthof alcohol consumption (all types) was 6.5 per cent (so calledregistered consumption – the total consumption is of course higher).
250 000 to 500 000 Finns are drinking too much. The number of
19
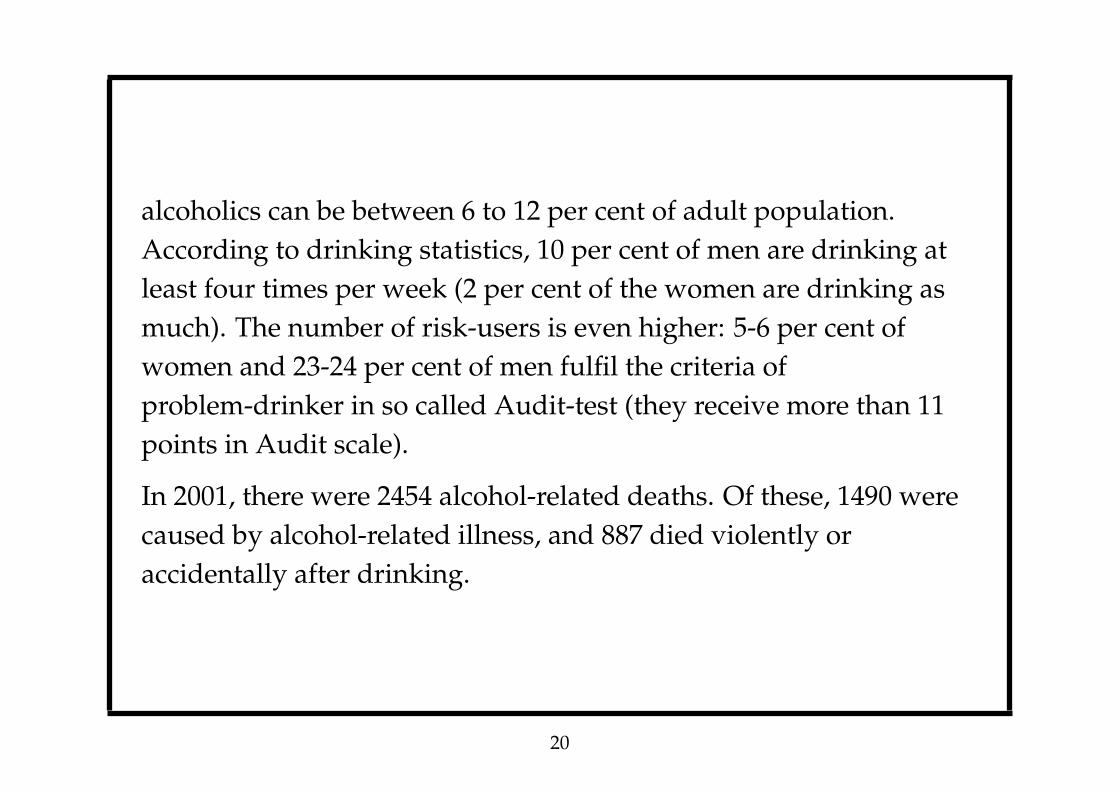
alcoholics can be between 6 to 12 per cent of adult population.According to drinking statistics, 10 per cent of men are drinking atleast four times per week (2 per cent of the women are drinking asmuch). The number of risk-users is even higher: 5-6 per cent ofwomen and 23-24 per cent of men fulfil the criteria ofproblem-drinker in so called Audit-test (they receive more than 11points in Audit scale).
In 2001, there were 2454 alcohol-related deaths. Of these, 1490 werecaused by alcohol-related illness, and 887 died violently oraccidentally after drinking.
20
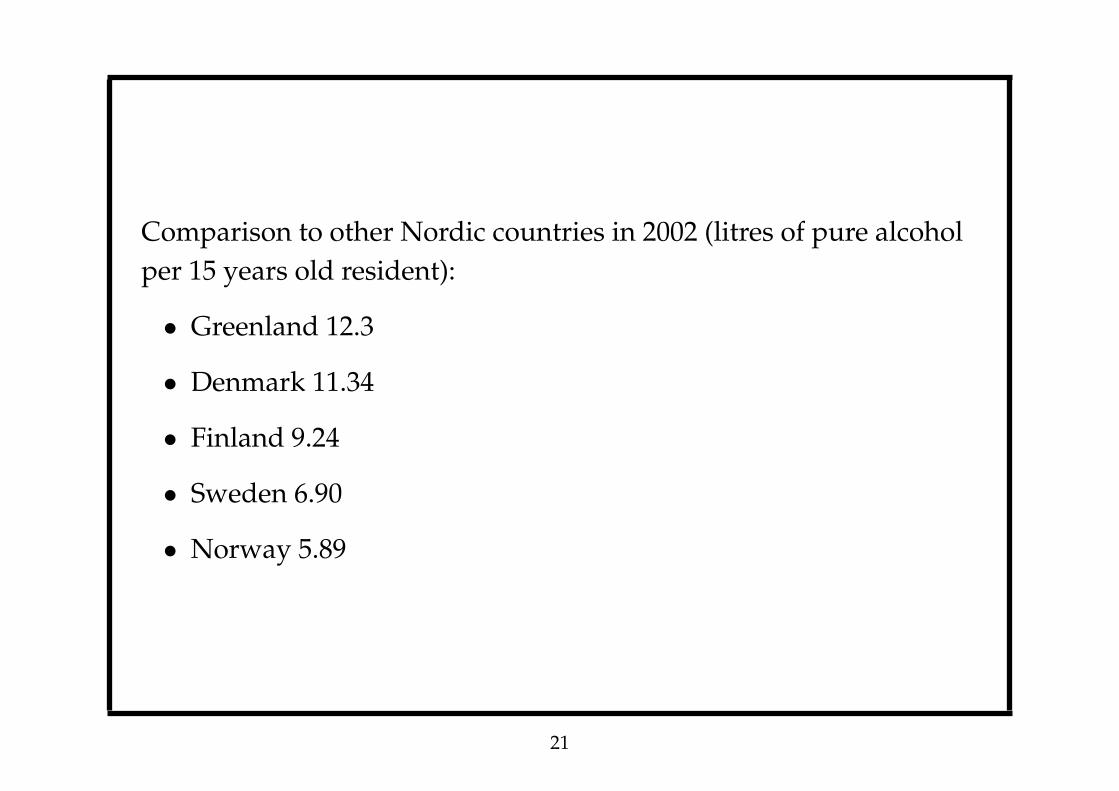
Comparison to other Nordic countries in 2002 (litres of pure alcoholper 15 years old resident):
• Greenland 12.3
• Denmark 11.34
• Finland 9.24
• Sweden 6.90
• Norway 5.89
21

Drug use is still a small problem compared to alcohol abuse. It isgrowing, though. Around 30 000 persons are problem-users ofdrugs. In 1999, around 20 per cent of the conscripts had triednarcotics. Cannabis is the typical drug. In 2001, Finland had 150drug-related deaths. (Nuorvala 2002, 130)
In the survey conducted in 2002, 12 per cent of adult respondentsreported having tried or used some narcotic substance duringlifetime. Drug use during last year was reported by three per cent,while one per cent had used drugs during last 30 days. (STAKES -REPORT TO THE EMCDDA)
22

1992 1994 1996 1998 2000 2002 2004
68
1012
14
Purchased alcohol in Finland, 1991−2004
year
abs.
alc
ohol
litr
es/1
8 ye
ars
23

100
150
200
250
300
1996 1997 1998 1999 2000 2001 2002
inde
x
year
service−users in municipal rehab−clinics in Jyväskylä and Central Finland, (Finland = 100)
Central−FinlandJyväskylä
24
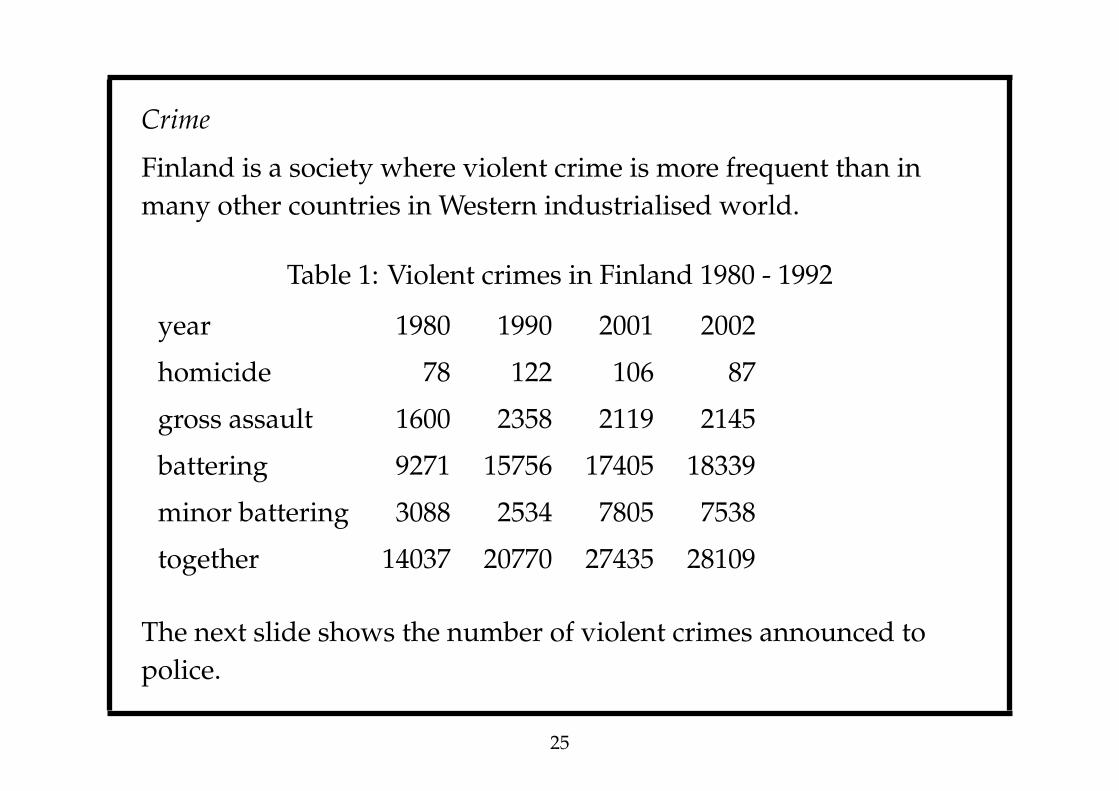
Crime
Finland is a society where violent crime is more frequent than inmany other countries in Western industrialised world.
Table 1: Violent crimes in Finland 1980 - 1992
year 1980 1990 2001 2002
homicide 78 122 106 87
gross assault 1600 2358 2119 2145
battering 9271 15756 17405 18339
minor battering 3088 2534 7805 7538
together 14037 20770 27435 28109
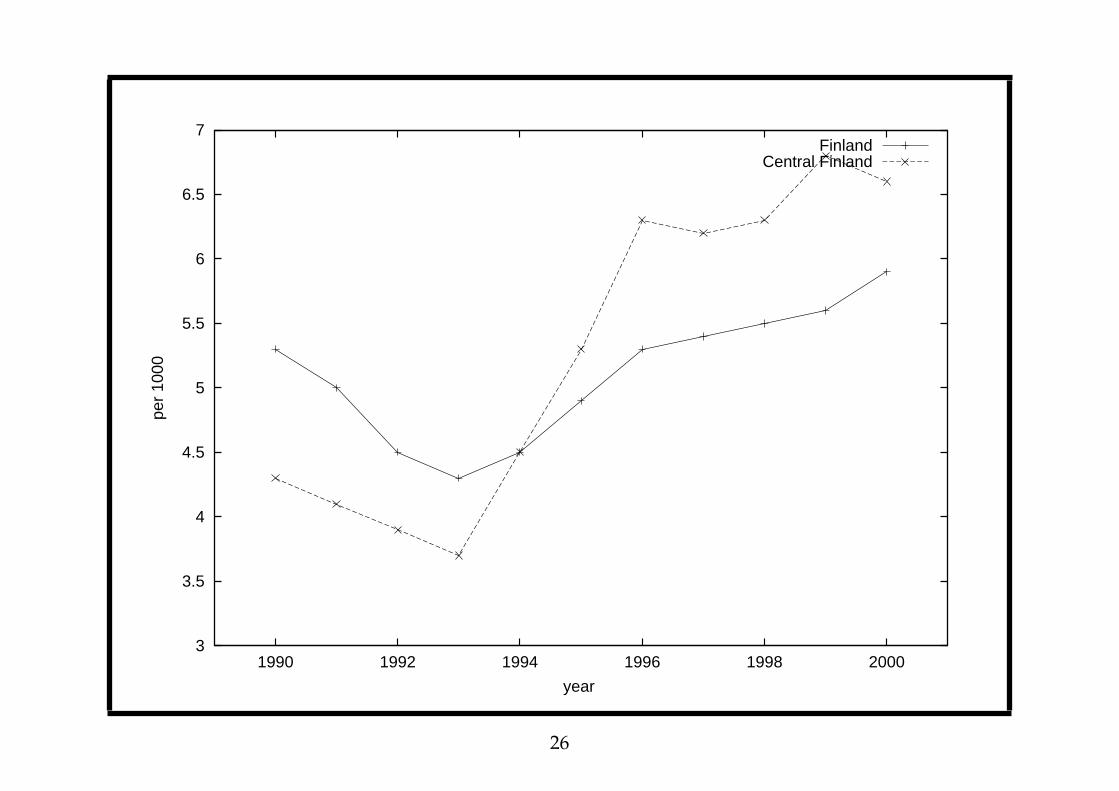
The next slide shows the number of violent crimes announced topolice.
25
3
3.5
4
4.5
5
5.5
6
6.5
7
1990 1992 1994 1996 1998 2000
per
1000
year
FinlandCentral Finland
26

In Finland, the crime-rate seems to decline a bit during the recession,but after the recovery there is a slight growth in crime-rate. InCentral Finland this tendency is more clear than in the wholecountry.
27
2 4 6 8 10 12
24
68
10
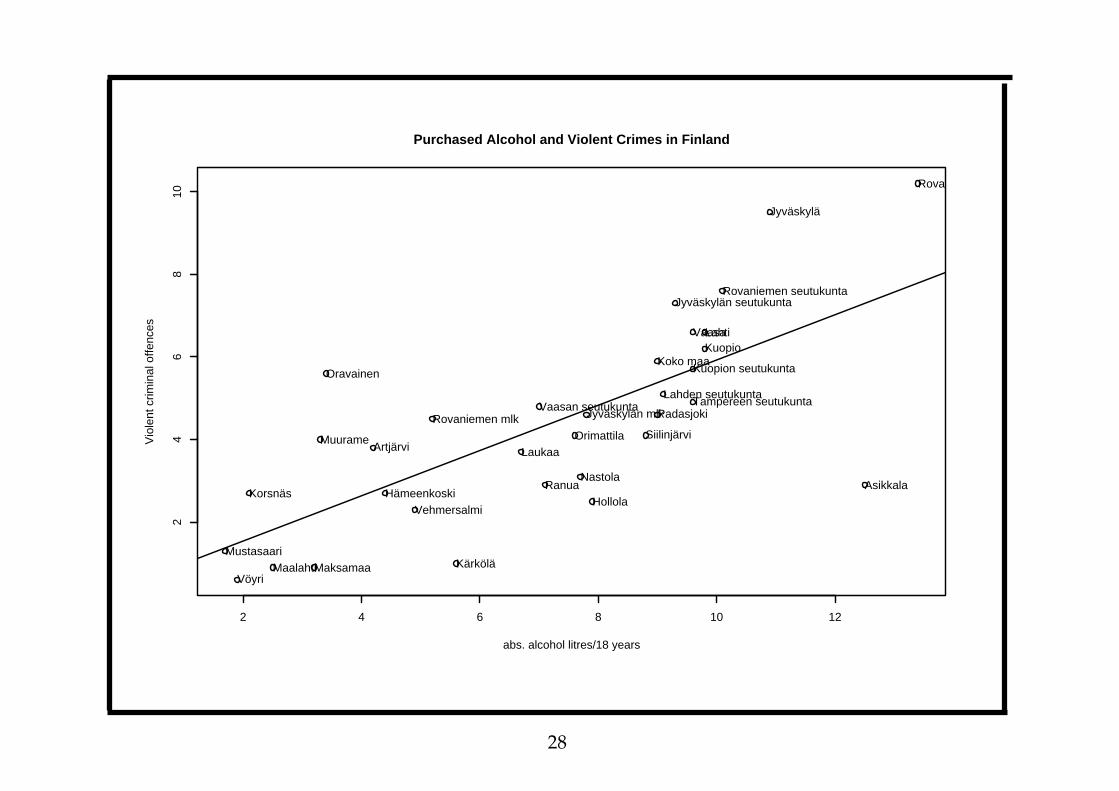
Purchased Alcohol and Violent Crimes in Finland
abs. alcohol litres/18 years
Vio
lent
crim
inal
offe
nces
Jyväskylän seutukunta
Jyväskylä
Jyväskylän mlk
LaukaaMuurame
Koko maaKuopion seutukunta
Lahden seutukuntaTampereen seutukunta
Kuopio
Siilinjärvi
Vehmersalmi
Artjärvi
AsikkalaHollola
Hämeenkoski
Kärkölä
Lahti
Nastola
Orimattila
Padasjoki
Rovaniemen seutukunta
Ranua
Rovaniemen mlk
Rovaniemi
Korsnäs
MaalahtiMaksamaaMustasaari
Oravainen
Vaasa
Vöyri
Vaasan seutukunta
28
Foreigners and crime.
In 2001, almost 98 577 foreigners had residence in Finland. In thesame year, the police registered 14 800 cases where the suspectedperson was from abroad. The number of offences committed byforeigners has increased almost 40% since 1996. The scope is stillquite limited: out of all persons suspected of offences known to thepolice, 2.5% were foreigners.
(CRIME TRENDS IN FINLAND, English Summary)
29
The foreigners living in Finland report of racist deeds. EspeciallySomalians are subjected to racist abuses quite often. In 2000, thePolice got 289 announcements about racist crimes. 19 per cent ofthese were directed against Somalians.
(CRIME TRENDS IN FINLAND)
30

4 Child Welfare Services
The divorce rate has been growing since the family legislationchanged in 1988. According to this law, divorce is given to spouses,if they apply for it. (No questions asked.)
• Till 1988, 10 000 divorces per year
• Since 1988, 13 000 - 14 000 divorces per year
(Taskinen 2002, 61)
31
The growth in child welfare services is eminent. The next graph isabout the amount of open care services in child welfare. Even in thesupport interventions in community care has expanded.
32

0
10000
20000
30000
40000
50000
60000
1994 1996 1998 2000 2002 2004
Avo
huol
lon
piiri
ssä
Vuosi
33
In 1990, 20 000 children were using child-care services, in 2000 thisnumber has grown to 50 000 children which means that 4.3 % ofchildren under 18 years of age were using child-care services.
The child-care statistics show that the number of children taken intocustody (either foster care or institutional care) has risen during the1990’s. The number of children in custody has grown 15 % in tenyears. In 2000, 1467 children were taken in custody, and a total of7300 children were in custody. (Taskinen 2002, 69)
Again, here is a difference between Central Finland and the wholecountry.
34

5
6
7
8
9
10
11
12
1990 1992 1994 1996 1998 2000
per
1000
year
FinlandCentral Finland
35
3500
4000
4500
5000
5500
6000
1990 1992 1994 1996 1998 2000
N
year
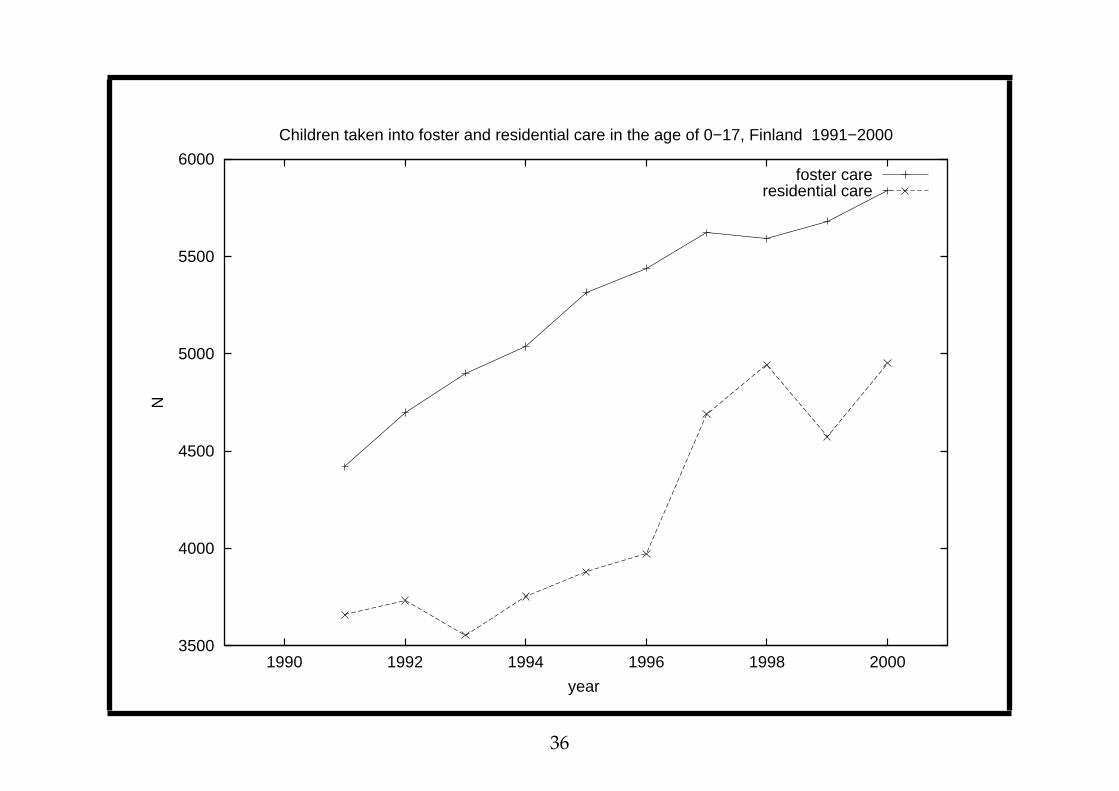
Children taken into foster and residential care in the age of 0−17, Finland 1991−2000
foster careresidential care
36

The foster care of children seems to grow all the time, but ininstitutional care there is a drop during the recession. Since 1996 thegrowth is more rapid.
37