Embed Size (px)
Citation preview

Social Networks as Signaling Mechanisms:Evidence from Online Peer-to-Peer Lending
Mingfeng Lin∗, N.R. Prabhala**, and Siva Viswanathan*
Abstract
We study the online market for peer-to-peer (P2P) lending in which
individuals bid on unsecured microloans sought by other individual bor-
rowers. Using a large sample of consummated and failed listings from the
largest online P2P lending marketplace - Prosper.com, we test whether
social networks lead to better lending outcomes, focusing on the distinc-
tion between the structural and relational aspects of networks. While
the structural aspects have limited to no significance, the relational as-
pects are consistently significant predictors of lending outcomes, with a
striking gradation based on the verifiability and visibility of a borrower’s
social capital. Stronger and more verifiable relational network measures
are associated with a higher likelihood of a loan being funded, a lower
risk of default, and lower interest rates. We discuss the implications of
our findings for financial disintermediation and the design of decentralized
electronic lending markets.
This version: October 2009
∗Decision, Operations and Information Technologies Department, **Finance Department. Allthe authors are at Robert H. Smith School of Business, University of Maryland, College Park, MD20742. Mingfeng Lin can be reached at [email protected]. Prabhala can be reached [email protected]. Viswanathan can be reached at [email protected]. The au-thors thank Ethan Cohen-Cole, Jerry Hoberg, Dalida Kadyrzhanova, De Liu, Vojislav Maksimovic,Gordon Phillips, Kislaya Prasad, Galit Shmueli, Kelly Shue, and seminar participants at CarnegieMellon University, University of Utah, the 2008 Summer Doctoral Program of the Oxford Inter-net Institute, the 2008 INFORMS Annual Conference, the Workshop on Information Systems andEconomics (Paris), and Western Finance Association for their valuable comments and suggestions.Mingfeng Lin also thanks to the Ewing Marion Kauffman Foundation for the 2009 Dissertation Fel-lowship Award, and to the Economic Club of Washington D.C. (2008) for their generous financialsupport. We also thank Prosper.com for making the data for the study available. The contents ofthis publication are the sole responsibility of the authors.
1

1 Introduction
The ability of online markets to efficiently bring together buyers and sellers has trans-
formed businesses, spawned several success stories, and redefined the roles of tradi-
tional intermediaries. In this paper, we study the online market for peer-to-peer
(P2P) lending, where individuals make unsecured microloans to other individual bor-
rowers. This market was virtually nonexistent in 2005 but has experienced significant
growth since then. The biggest of them, Prosper.com, has logged over 200,000 list-
ings seeking $1 billion in funding since its inception. Because the online P2P lending
marketplace is highly decentralized with little opportunity for face-to-face contact
between borrowers and lenders, the asymmetric information problems in traditional
credit markets are especially amplified. Our study examines whether social networks
alleviate information asymmetry, and if so, what aspects of these networks help. We
show that the social networks, specifically the relational aspects of networks based on
the roles and identities of the network members, matter. Networks mitigate adverse
selection and lead to better outcomes in all aspects of the lending process.
There are two types of networks that we can observe in the P2P lending market-
place. Borrowers can become members of a “group,” an affiliation that cannot be
undone before a loan has been repaid in full. In addition, borrowers can create social
networks of friends. We focus on these social networks, particularly on the roles and
identities of the friends of a borrower’s network. For instance, we examine whether
a friend has undergone the verification necessary to become a Prosper.com lender. If
so, we observe whether the friend has bid on the borrower’s listing or other listings
and whether the bids were successful. In other words, we observe different grades of
“the company that borrowers keep.” This relational aspect of a borrower’s network is
the focus of our study. We examine whether it explains the probability of attracting
funding, the interest rate paid by borrowers, and the ex-post loan defaults.
The theoretical motivation for our tests comes from a growing body of research
in economics, finance, and management on whether social capital affects economic
outcomes. Section 2 reviews this work. Social networks have been of special interest
because they are perhaps the most promising avenue for disentangling the effects of
social capital on economic outcomes (Durlauf and Fafchamps 2004). Research on
social networks most often stresses structural aspects such as the connections or the
centrality of individuals. We focus on the relational aspects, viz., the roles and iden-
1

tities of the individuals on a the network. Figure 1 illustrates this dimension in the
context of P2P lending. At the top level is the number of friends on a borrower’s
network. The next level distinguishes between friends who have no roles on Pros-
per.com and friends who elect to undergo verification as lenders or borrowers. We
then distinguish between lenders and borrowers, lenders who bid versus those who
do not, and at a still finer level, between those placing winning or losing bids. The
lower the level in the hierarchy in Figure 1, the greater the relation-specific social
capital that is verifiable and visible to potential lenders. We examine the relationship
between these grades of the network variables and lending outcomes on Prosper.com.
Our sample comprises 205,132 listings on Prosper.com from January 2007 to May
2008 seeking to borrow an aggregate amount of $1.7 billion. Of these, 16,500 listings
for $114 million are successfully funded. We first analyze the probability that a listing
is funded. We find little evidence that the structural aspects of a borrower’s network
are related to lending outcomes. On the other hand, the roles and identities of the
members of a borrower’s network matter and show a striking gradation effect along the
hierarchy depicted in Figure 1. The stronger a tie and the more verifiable and visible
it is to lenders, the greater the probability of attracting funding. Interestingly, non-
actions by particularly verifiable relationships, such as non-participation by several
lender-friends, also lead to less favorable outcomes. We find similar effects when
social capital is measured using group affiliations rather than friendship networks.
Verifiable antecedents matter. Borrowers linked to verifiable groups such as affiliation
with alumni groups of universities or common employers are more likely to be funded.
To assess price effects of social capital, we estimate a censored regression model
in which social capital potentially has separate price and quantity effects through
different coefficients on the probability of funding and on the loan rate conditional
on the loan attracting funding. Social network variables have beneficial effects: they
reduce the interest rates on funded loans. We also use survival models to test whether
social networks have information about default probabilities beyond that contained
in traditional credit variables. Borrowers with strong and verifiable relationships are
less likely to default. The results survive several robustness tests including analyses
of subsamples without images, controls for non-linearities, content of images and text
descriptions in listings. We also consider whether social networks matter enough by
testing the effect of social network variables on interest rates compared to their effects
on default relative to similar comparisons for hard credit variables, We describe the
various tests and results subsequently in the paper.
Our evidence suggests a novel role for social capital in economic transactions.
Social capital is conventionally conceptualized either as an individual attribute that
2

generates an economic benefit (Granovetter 1972), or as a group attribute of a collec-
tion of individuals that enhances the efficacy of transactions between the individuals
for economic gain. Examples in sociology include Coleman (1988), Mizruchi (1992),
or Putnam (1993) while recent applications in finance include Hochberg, Ljungqvist,
and Yu (2007) as well as Cohen, Frazzini, and Malloy (2008a, 2008b). Our evidence
suggests that social capital plays another role: the social capital between individuals
generates an informational externality that can be harvested to facilitate transactions
with outsiders such as lenders in financial markets. Podolny (1993, 2001) articulates
such a role for social networks. Podolny argues that ties between two market actors
in the network can be understood as “pipes” that convey resources or information
between them. Alternatively, the ties can be an informational cue that others rely to
draw inferences about the quality of one or both of the market actors (Podolny 2001,
page 34). The P2P market evidence is consistent with the latter view. We find that
a borrower’s social network serves as a prism through which potential lenders deduce
which borrowers to fund and at what interest rate.
Our findings are of interest from at least two other perspectives. One view of our
study is that it represents data from credit markets that have an especially severe
Akerlof (1970) style lemons problem. From this viewpoint, our findings represent
evidence that individuals adapt to mitigate adverse selection in ways remarkably
consistent with economic theory. In particular, our evidence suggests a positive role
for “soft” information in credit markets. Soft information is fuzzy, hard-to-quantify
information about borrowers beyond the data such as credit scores or the financials of
borrowers. The finance literature argues that soft information is critical to successful
lending outcomes (Petersen and Rajan, 2002; Rajan, 2002) and it is traditionally
regarded as a province of financial intermediaries such as banks (Fama, 1985). It is
interesting that even atomistic individuals with small sums of money at stake seem
to seek and act based on soft information such as the nature of borrowers’ social
networks. In this regard, one concern is that financial disintermediation driven by
electronic markets could compromise the production of soft information, with adverse
impact on credit markets. Our study suggests that these concerns may be at least
partially mitigated because while information technology could subtract some form
of soft information generation, it could also make new new forms of soft information
available by making it feasible to extract, codify, and convey “softer” information
such as a borrower’s social capital. From a market design perspective, our study
underlines that the new information is most useful when there are credible mechanisms
to enhance its verifiability to outside bidders.
An alternative perspective of our study is that it analyzes the economic value of
3

social networks. While it is widely accepted in economics and sociology that networks
matter, especially to the sets of individuals forming the networks and the organiza-
tions that employ them, our study quantifies its value and puts additional boundary
conditions to the claim. We find that networks are valuable not merely to individuals
or organizations forming or containing them, but also to third-party outsiders, by
helping mitigate informational asymmetry and adverse selection problems between
the individuals in the network and outsiders.
Our study is also of separate interest because of its focus on the economic value
of online social networks, an area on which there is little prior work. While online
networks may be as valuable as their offline counterparts, this is not obvious given the
relative ease of creating and building them. The P2P lending marketplace is an espe-
cially interesting context to study online networks because these types of networks are
integral to the marketplace. Furthermore, our study addresses a major limitation of
the received work on online networks: the difficulty of quantifying economic outcomes
or the strength of ties. This necessitates costly methods such as surveys or interviews
(e.g. Karlan 2007; Moran 2005; Uzzi 1999), or subjective measures of outcomes (e.g.,
Bagozzi and Dholakia 2006; Uzzi and Lancaster 2003). In our study of credit markets,
both the network itself and the associated economic outcomes are quantifiable using
relatively objective measures such as funding probability and interest rates.
The paper is organized as follows. Section 2 provides theoretical background and
reviews the related literature. Section 3 provides an overview of the research context
followed by a description of the data used in the study. Section 4 describes the
empirical methodology, and Section 5 contains the results of the study. Section 6
discusses the implications of our results and concludes.
2 Theoretical Motivation and Literature Review
Our study draws on and contributes to multiple streams of research including work in
economics, finance, management, and sociology. To place our findings in perspective,
we review the related literature.
The literature on social capital originates in sociology but its role in facilitating
economic exchange has attracted considerable attention in economics. Granovetter
(2005) overviews applications in such diverse areas as labor economics, price set-
ting, production, financial innovation, and entrepreneurship. Recent work on the
role of social capital in trade and financial contracts includes Guiso, Sapienza and
Zingales (2004), and Sapienza, Toldra and Zingales (2007). An individual’s social
4

capital is often identified using her social networks. For instance, Burt (1992, page
9) describes an individual’s social capital as “friends, colleagues, and more general
contacts through whom you receive opportunities to use your financial and human
capital.” Portes (1998, page 6) adds that there is growing consensus on social cap-
ital being “the ability of actors to secure benefits by virtue of membership in social
networks or other social structures.” Durlauf and Fafchamps (2004) carefully sur-
vey the methodology used in empirical studies of social capital. They argue that the
“most successful theoretical work and the most compelling empirical work” is the role
of networks in facilitating economic exchange. Our work, which studies how social
capital is leveraged through networks, has precisely this focus.
The social networks literature also offers a useful taxonomy of the different dimen-
sions of social capital. (e.g. Granovetter 1992; Moran 2005). Structural embedded-
ness refers to the position of an actor in the network. Relational embeddedness refers
to the quality of the relationship among actors in the network. Empirical evidence on
structural aspects includes work on venture capital by Shane and Cable (2002) and
Hochberg, Ljungqvist and Yu (2007). Cohen, Frazzini, and Malloy (2008a, 2008b)
find that educational network ties influence fund manager investments and analyst
recommendations. Studies in sociology and management show that certain positions
on a given network endow individuals control over resources, e.g., individuals in hubs,
those with weak ties (Granovetter, 1972) or those occupying structural holes (Burt
1992). Bampo, Ewing, Mather, Stewart, and Wallace (2008) investigate the structure
of digital networks on the performance of viral marketing campaigns. Studies of re-
lational embeddedness include work on open software projects by Grewal, Lilien, and
Mallapragada (2006), who study open software projects and the study of networks of
collaborators by Cowan, Jonard, and Zimmerman (2007).
Theory suggests two primary avenues by which an actor’s social network can
influence transactional outcomes. Social networks can act as a direct channel for
the transfer of information and resources. This role of social networks is termed
as “pipes” by Podolny (1993, 2001). As noted by Granovetter (1973), information
can flow through links, thereby either reducing the search costs for individuals, or
enabling the gathering of heterogeneous information from different parts of the net-
work. Within organizations, individuals occupying certain positions in the network
can enjoy better information, easier access to resources, and therefore enjoy more
power. Here again, the network ties serve as the channel for the flow of resources and
utility accrues to the individuals on the nodes. Alternatively, Podolny (1993, 2001)
argues that social networks can serve as “prisms” that reflect otherwise unobservable
characteristics. When networks play this role, it is critical that the social networks be
5

credibly verifiable. Verifiability is particularly important in online networks relative
to their offline counterparts because the ease of forming online networks may compro-
mise their credibility. The verifiability issue is also important from a behavioral and
marketing perspective, rather than a purely economic one. As noted by Rosenthal
(1971), a message “must be testable by means independent of its source and available
to its receiver” to be verifiable. Such requirement of verifiability applies to online
social networks as well. A borrower’s social network is also subject to skepticism
from lenders; it is credible only to the extent it is verifiable.
Our study also adds to an extensive literature in finance and economics on credit
markets. A key theme in this literature is information asymmetry, which presents
itself through ex ante adverse selection and ex post moral hazard. The ex-ante in-
formation asymmetry essentially considers the Akerlof (1970) style adverse selection
problems in lending. Social networks can provide information relevant to lending
outcomes. If someone who knows the borrower personally can attest to his or her
creditworthiness, or even better, participate in lending to the borrower, the loan
should be relatively less risky. Obtaining and transforming such information into a
usable format was traditionally difficult. Digitization and information technology has
helped overcome this constraint. The key issue with such information is its reliability,
which can be mitigated if the marketplace has credible verifiability standards.
Empirical studies seek to understand “soft information” in financial intermedia-
tion. Using survey data on small business loans, Petersen and Rajan (1994) find that
soft information in bank or supplier relationships could increase the supply of credit
to small firms. In related work, Agarwal and Hauswald (2007) argue that “private
information drives relationship-debt transactions, whereas public information facil-
itates arm’s-length lending.” Drucker and Puri (2007) provide evidence that sales
of loans are associated with durable relationships. Organizational researchers apply
social network theories to the banking sector. Using a social embeddedness approach,
Granovetter (1985) and Uzzi (1999) study how bank-borrower relationships affect a
firm’s acquisition and cost of capital and introduce the idea of networks in these pa-
pers. Our study adds to this literature by focusing explicitly on the role of social
networks as a source of soft information. We illustrate how technology hardens it
into usable form for lenders, show it use in lending decisions, and quantify its effect.
An alternative view of why social networks are useful in credit markets is based on
search-cost minimizing theories of intermediaries. It is costly to set up a market where
multiple borrowers and lenders are matched in a decentralized fashion. Intermediaries
such as banks add value because they economize on the transaction costs of matching
by centralizing search efforts. However, the Internet significantly reduces transaction
6

costs of search (see, e.g., Malone, Yates and Benjamin 1987) and shifts the tradeoff
between search and intermediation, making disintermediated search more viable. An
additional effect of digitization, particularly Web 2.0 technologies, is that they alter
the way in which users interact and connect with each other. This process can result
in generation of alternative sources of information and social capital and new methods
of transmitting the information efficiently. The net effect of these forces is to facilitate
the growth of lending networks that are decentralized.
There is a small but growing body of research on peer-to-peer lending that focuses
on the personal characteristics of borrowers to test theories of taste-based discrimina-
tion (Pope and Sydnor 2008; Ravina 2008). Pope and Sydnor examine loan listings
between June 2006 and May 2007 while Ravina examines listings for a one month
period between March 12, 2007 and April 16, 2007. The most robust results of the
two studies is with regard to race. Blacks are less likely to receive credit, default
more, and pay higher interest rates, though not high enough according to Pope and
Sydnor. Ravina also finds a beauty effect in which attractive borrowers are more
likely to get funded and pay lower rates but are not less likely to become delinquent.
Our study has a different focus. We examine social networks, especially relational
aspects, and their role in mitigating informational asymmetry. Image data serve as
controls in some of our specifications. Our findings that P2P lenders extract and use
outcome-relevant information is similar in spirit to Iyer, Khwaja, Luttmer, and Shue
(2009), who find that subjective information extracted by lenders can account for
about one third of the statistical content of the true credit score of borrowers.
Finally, online P2P lending can be viewed as a digitized and somewhat modified
version of traditional microfinance programs (see, e.g., Morduch 1999 for a review
of this work). Like peer-to-peer lending, microfinance is typically collateral-free and
there are similar information asymmetry problems in both settings. Our results sug-
gest an additional parallel. P2P lenders also appear to rely on soft collateral implied
by social networks or group attributes for repayment, as do lenders in microfinance
(Ledgerwood 1999). The scalability of P2P lending across geographic regions and bor-
rower types suggest that digitization and technology could help mitigate the problems
that limit the scaling of traditional microfinance programs.
3 Institutional background on P2P lending
Our data come from a leading online peer-to-peer lending website, Prosper.com. Pros-
per.com opened to the public on February 5th, 2006. At the end of 2008, it had
7
830,000 members and more than $178 million in funded loans. We describe the lend-
ing process and the information provided by borrowers seeking loans on this network.
3.1 Verification
Potential users initially join Prosper.com by providing an email address, which is
verified by the website. To actually engage in a transaction, users must go through
additional verification. Borrowers must reside in the U.S., have a valid social security
number, a valid bank account number, a minimum FICO (Fair Isaac Credit Organi-
zation) credit score of 520, and provide a a driver’s license number and address. The
details are verified by Prosper.com, which also extracts a credit report from Experian,
one of the major credit reporting agencies in the US. Loan proceeds are credited to
the bank account and funds withdrawn automatically for monthly loan repayments.
In the time period we study, borrowers can borrow a maximum of $25,000, and a
maximum of 2 concurrent loans. All loans amortize over a 36 month period.
A lender who joins Prosper is also subject to a verification process. A social
security number, driver’s license number, and bank account information are necessary
before a lending transaction. To protect privacy, the true identity of borrowers and
lenders is never revealed in the website. Communication occurs through usernames
that are chosen when signing up.
3.2 The Listing
Before borrowing, a borrower creates a personal profile. The actual loan request is a
listing that indicates the amount sought, the maximum interest rate that the borrower
will pay. The borrower can also post images and write a free-format description that
often lists the loan circumstances and the ability to repay. Neither the image nor the
text is verified by the website. Borrowers choose either a closed auction that closes as
soon as the total amount bid reaches the amount sought at the borrower’s asking rate.
In the open auction format, the auction remains open even after the entire amount
requested is funded for up to 7 days and during this period, lenders can continue to
bid down the interest rate of the loan.
Figure 2 provides a screenshot of a sample listing. The listing displays information
from the borrower’s credit such as the number of credit inquiries, the debt-to-income
ratio, and a letter credit grade, which is a coarse version of the borrower’s FICO
score. The credit grade ranges from AA (high quality) to HR (low quality) high risk
borrowers. The correspondence between letter credit grades and the actual FICO
8

score is shown in Table 1. During our sample period, lenders could not see the
borrower’s actual score but only the letter grade The purpose of a loan is tagged as
a field in the listings. The listing indicates information about the borrower’s friends
and groups to which he belongs. With all the above information in place, the listing
can go live to solicit bids from lenders.
3.3 Bidding
When a lender sees a listing, she can decide whether or not to lend to the borrower.
An important feature of online peer-to-peer lending is that an individual lender does
not have to finance the entire loan request. A lender can bid an amount of $50 or
more and specify the minimum interest rate she desires. The actual bidding process
uses a proxy bidding mechanism. If the loan has not yet been funded 100%, the
ongoing interest rate will be the borrower’s asking rate, even if the lenders’ minimum
rate is lower. Once 100% of the requested funding has been reached and the format
of the auction is open, the ongoing rate decreases as the lender with the highest
rate-bid is competed out. In a sense, the auction is similar to a second-price auction.
All bids are firm commitment bids and no withdrawals are allowed. From a lender’s
viewpoint, a bid could win or be outbid, in which case the lender can place a second
bid to rejoin the auction. Once the auction ends, the loan could be fully funded. If
not, the auction is deemed to have failed and no funds are transferred.
3.4 Post-bidding, funding and repayment
Once the bidding process ends, the listing is closed and submitted to Prosper staff
for further review, and sometimes additional documentation is required of borrowers.
Once the review process is completed, funds are collected from the winning bidders’
accounts and transferred to the borrower’s account after deducting fees of up to 2%
of the loan amount.
Loans on Prosper.com have a fixed maturity of 36 months with repayments in
equated monthly installments. The monthly repayment is automatically deducted
from a borrower’s bank account and distributed to lenders’ Prosper accounts. If the
borrower pays his monthly amount due in time, the loan status for that month (or
payment cycle) is considered current. If a monthly bill is not paid, the loan status
will be changed to “late,” “1 month late,” “2 months late,” etc. If a loan is late for 2
months or more, it is sent to a collection agency. Lenders on prosper.com must agree
that the proceeds of the collection represent the full settlement of loans. Delinquencies
9

are reported to the credit report agencies and can affect borrowers’ credit scores.
3.5 Social networks
A member who signs up with Prosper.com and has a verified email account can create
or join a social network. We consider two types of social networks, friendship networks
and groups. In a friendship network, a member can be friends with other members
who already have a valid user ID on Prosper.com. Alternatively, the member can ask
offline friends to join Prosper.com and become an online friend on the network.
In our sample, 56,584 listings report friends. Friendships are typically created
through an automated process. After the inviting member fills out the friend’s email
address and a short message, Prosper.com generates an email message that contains a
link to join Prosper. The recipient can click on the link contained in the email to sign
up, or use the link to establish friendship with an already-registered account. Friends
may elect to have no roles or elect to be verified as lenders or borrowers. Friendship
ties are bi-directional. From an empirical viewpoint, a member’s friendship network
is visible on the profile page or a loan listing page. Other members can click through
the link to see the profile information of those friends. Friends who bid on a listing
are also tagged very clearly in the list of bidders so they are readily visible to outside
bidders considering participation.
A second type of social network on Prosper.com is a group. There are 4,139 groups
in our sample. 41% of listings in our sample are associated with a group. Any member
can create a group and a member can typically join any group whose membership
criteria are met. However, in our sample, each individual can be a member of only one
group at a time. Entry or exit into a group is free but this bar is raised for borrowers.
If a borrower is a member of a group when requesting a loan, the borrower cannot
leave the group or join any other group until the outstanding loan is repaid in full.
The leader of each group can determine the rules regarding who can become group
members and how others may join. Some groups, such as alumni groups, typically
require a high degree of verification. Applicants must prove that they are indeed
affiliated with the institution. Other groups require very little verification.
4 Data
Our sample comprises all listings that seek funding on Prosper.com between January
2007 and May 2008. We obtained information regarding borrower’s credit history,
10

their unique Prosper ID, the social network variables, features of their auctions, and
outcome of their loan listings using an API provided by Prosper.com. The information
on the website is updated in real time. We ensure that the downloaded data is
measurable as of the listing date and in the information set of potential lenders. We
describe the variables used in our analysis and discuss some descriptive statistics.
4.1 Social networks
The friendship network and group-based affiliations capture soft information in a
borrower’s social network. The commonly used metrics of a network structure include
degree centrality, betweenness centrality, coreness, effective size, and efficiency (e.g.,
Hanneman and Riddle 2005, Burt 1992). We extract all components in friendship
networks of size 3 and up using the software package Pajek. While we report some
results based on some of these metrics, they are largely insignificant. We turn to the
more important relational aspects next.
The relational social network measures concern the roles and identities of the
members in the network. Figure 1 describes the hierarchical levels underlying our
analysis. Level 1 distinguishes friends according to whether their identities are verified
on Prosper versus individuals who have merely registered and are thus little more than
a verified email address. Level 2 categorizes the verified friends based on their specific
roles — whether these friends are borrowers or lenders. Lenders are individuals with
extra financial capital while borrowers are likely to be facing financial constraints.
On the other hand, borrowers are subject to greater scrutiny as they have verifiable
credit grades that form a backbone of their listings. Level 3 further differentiates
between real lender friends — those who have lent prior to the current listing; and
potential lender friends — those who have provided enough information to Prosper
to be listed as lenders but have yet to participate in a loan. Level 4 differentiates real
lender friends according to whether they bid on the specific borrower’s listing or not.
Level 5, the finest classification, distinguishes between lender friends who bid on the
borrower’s listing and won and those who bid but did not win. As we progress from
Level 1 to Level 5, the relationship between the borrower and lender becomes more
actionable, verifiable and more strongly embedded.
In addition to friendship networks, we consider membership of groups. We man-
ually coded all groups that have at least 3 members and are active in the generation
of loans. We categorize all groups into one or more of several categories. One set
of groups, for instance, are based on religion. In this group, members can identify
themselves as belonging to a particular religious or church denomination. A second
11

category of groups uses alumni affiliation, based on whether an applicant graduated
from a particular university or whether an applicant has been a past employee at a
company. These antecedents tend to be verified by group leaders. Other categories
include geography-based groups, in which members live in a particular region (e.g.,
greater Washington DC area), which is verified based on applicant addresses.
We also find group categories based on military membership, groups with medical
needs, demographics (such as being of Hispanic or Vietnamese origin), groups based
on hobbies, and groups affiliated with business development or those with a gener-
alized purpose of helping members financially. Each group has admission criteria
of varying stringency and verification required for membership. We include dummy
variables for the types of groups to which applicants belong, testing whether group
affiliations matter for lending outcomes, particularly those involving verifiable an-
tecedents. The correlation among groups is fairly low although a few groups can span
multiple categories.
In addition to group dummies, we also include controls for group size. A priori,
the sign of group size for lending outcomes is not clear. Larger groups may involve
more peer pressure to repay and are perhaps associated with better loans. On the
other hand, larger groups may be subject to less overall oversight. The actual sign is
thus an empirical issue. An interesting group variable is whether the leader of a group
is rewarded for listings of group members that are successfully funded. These rewards
create incentives similar to the originate-sell model of intermediaries held responsible
for the 2008 financial crisis. This reward structure was discontinued by Prosper.com
in October 2007. We include a dummy for group leader incentives in our analysis.
4.2 Hard credit information
Prosper.com provides a letter grade for each borrower ranging from AA to HR, which
correspond to the credit scores listed in Table 1. In addition, we include the other hard
credit information provided by the website, including a borrowers’ debt-to-income ra-
tio and the number of credit inquires in the six months prior to the listing. We include
these variables as additional credit indicators to allow for the possibility that the let-
ter grade itself is not a sufficient statistic for credit risk. Rather than a numerical
score (e.g., AA=1, A=2, etc.), we include a full set of dummy variables for each letter
grade.
12

4.3 Other control variables
In addition to the above soft and hard credit information, we also gather information
on whether the auction is conducted via the open or closed format. The latter closes
as soon as it is funded 100% and perhaps indicates borrowers with more urgent finan-
cial need. We include a dummy for the auction type. We also considered maximum
auction duration, which could range between 3 and 10 days but has been since stan-
dardized to 7 days. This variable showed little significance in any of our models and
we omit it.
Some states in the US have usury laws that enforce a cap on the allowable interest
rate on consumer loans. While usury laws are intended to protect customers, these
laws could negatively affect the likelihood of funding if the supply curve for funds
intersects the demand curve at a rate above a state’s usury limit. Whether the laws
have this bite or not is an empirical issue. After April 15 2008, Prosper started
collaboration with a bank in an effort to circumvent that limit. Our sample spans
both periods, so we include a control for usury laws.
Each borrower indicates a maximum borrowing rate that she is willing to pay.
We include this variable in quadratic format. While low rates indicate less profitable
loans, high rates could also indicate less profitable loans because the effect of higher
rates could be swamped by the greater likelihood of default for borrowers willing
to pay high rates (Stiglitz and Weiss 1981). The setting of an intermediary and the
sophisticated reasoning modeled in Stiglitz and Weiss is probably far from our setting
of atomistic lenders bidding for a small piece of a listing. However, we include the
quadratic term as a hypothetical possibility.
To control for broad lending rates, we could use a proxy such as the LIBOR, the
Fed Funds rate, or prime rates, many of which serve as floating rate indexes used by
banks to set interest rates. However, these rates could be noisy because they do not
incorporate credit spreads for different quality borrowers, any regional variation in
the spread, or the shape of the term structure since the rates are short-term while
Prosper.com loans are of 36-month duration. We purchased a proprietary dataset
from a professional company that collects information on interest rates in different
US markets. This dataset gives us the average interest rate for borrowers in each
credit grade, in each regional market, for a given month. The term of loans is 36
months, consistent with Prosper loans. In our analysis, this variable serves as a
proxy for the “outside option” of borrowers.
In terms of other controls, we follow the finance literature and control for loan
purpose. We read listings to assess the purposes for which Prosper.com loans are
13

sought. Borrowers indicate several types of needs, including debt consolidation, home
improvement, business loans, personal loans for a variety of purposes (including vaca-
tions), or student or auto loans. The loan purpose is self-indicated by borrowers and
can thus be thought of as cheap talk. However, potential lenders often communicate
with borrowers during the auction process and seek more tangible details. In balance,
we thought that it is likely that there is some information in the loan purpose, so we
include this in the regressions.
As a new business model, Prosper.com has received significant media exposure
since its inception. Articles in the media make it more likely to attract new borrowers
and lenders to the website after their publication. To control for the potential influ-
ence of such news, we include an additional variable to absorb these exogenous shocks
to this marketplace. We download the search volume on Google for Prosper.com and
construct a dummy variable based on whether there is a significant change in search
volume, which we call spikedays. Finally, we include quarterly dummy variables to
control for unobserved time effects in the marketplace.
5 Results and Discussion
Our sample has 205,132 listings with an average loan amount of $6,973. Of these,
56,584 (27.58%) report friends while 148,548 (71.42%) report no friends. The group
of listings in which borrowers have friends is spread across the Prosper.com credit
grade spectrum. For instance, of the 6,523 AA listings, 1,881 or 28.84% have friends,
while of the 33,068 D grade listings, 9,462 or 28.61% have friends. In the high risk,
or HR category, 22,556 out of 62,904 listings, or 26.39%, are associated with a friend.
Listings in which borrowers have no friends have mean debt-to-income ratios of 58%
while listings of borrowers with friends have debt to income ratios of 57%. Borrowers
with no friends have about 4.17 credit inquiries in the six-month period prior to the
listing date against 4.22 inquiries for borrowers with friends.
In our data, 16,500 (8.04%) listings attract full funding. For the sample of borrow-
ers with no friends, 10,410 out of 148,548 listings, or 7.04% are successfully funded,
while 6,090 or 10.76% of listings where borrowers have friends are successfully funded.
Our other social network variable is group membership. 29% of all requests or 59,978
listings indicate a group affiliation. Of this sample, 28,006 listings, or 46.63%, are
associated with an incentive structure in which group leaders are rewarded with a
fee for successful listing.Likewise, 7.09% of listings not affiliated with a group are
successfully funded, while 10.36% of listings with a group affiliation are funded.
14

We explore loan funding, interest rate spreads, and loan default in multivariate
specifications. Table 2 provides a full list of the explanatory variables. Tables 3
and 4 describes the different models that we report in the paper and the set of
variables used in each specification. For instance, specification P1 is a model of
funding probability that uses variable set 1 (Table 3), and from Table 4 we can see
that variable set 1 corresponds to the root level of the friendship hierarchy, and the
model is a funding probability model using “ttlfriends”, or the number of friends, and
“Common variables” listed in Table 2 as explanatory variables. Section 5.1 reports
the probit results while Sections 5.2 and 5.3 model the interest rate of funded loans
and the probability of default. Each section focuses on the results relating to social
network variables. Section 5.4 discussed the coefficients for control variables.1
5.1 Funding probability
Table 5 reports estimates of a probit model for the probability that a listing is suc-
cessfully funded.
Probability (Fund) = α1Hard Credit + α2Social Network + α3Controls + εi (1)
We report six sets of results that include the different social network variables in
Figure 1. All specifications include a common set of controls. We discuss the results
related to the social network variables first and then turn to the control variables.
5.1.1 Social networks: Friendship network
We start by considering structural measures of networks. The degree centrality mea-
sures a borrower’s position in the friendship network. Specification P1 in Table 5
shows that degree centrality is positively related to the probability of being funded.
As discussed below, this relation reflects a more extensive relation caused by the roles
and identities of the members of the friendship network. Other structural network
measures such as coreness, effective size of network, and efficiency have no significant
effects on the probability of funding.
Specification P2 in Table 5 distinguishes friends according to whether their iden-
tities are verified on Prosper or not. This process effectively decomposes degree
1While the main results are reported in Tables 5-7, we also emphasize that we conduct severalrobustness tests. For brevity and because these results do not alter our main conclusions, we do notinclude full tables with the results. They are available upon request to readers.
15

centrality into two orthogonal pieces, friends who are verified and those who are not.
We find that unverified connections, i.e., connection that merely signify a valid email
address, represent insignificant cheap talk or even negative signals at the 10% sig-
nificance level. In contrast, TTLROLE, verified friends with roles on Prosper, has a
positive coefficient that is significant at 1%. These results constitute the first evidence
that roles and identities, or the nature of the company that borrowers keep, matters.
We next categorize the friends of borrowers based on the nature of their roles.
To this end, we decompose the verified friends into orthogonal and additive pieces:
friends with roles as borrowers and those with roles as lenders, both adding up to the
total number of friends with roles. In addition to these two components of friends
with roles, we also include the total number of friends with no roles. Specification
P3 gives the results. Friends with no verified roles have negative effects as before.
Connections to borrowers have insignificant effects while having friends with roles as
lenders increases the probability of the loan being funded.
Specification P4 further differentiates between real lender friends — the ones that
have made loans on Prosper.com prior to the current listing — and potential lender
friends who have not yet made loans on Prosper.com prior to the start of the current
listing. We continue to include the excluded variables, all friends with no roles, and
friends who are borrowers but not lenders as control variables. There is a continued
gradation of the friendship effects. Having lender-friends matters only to the extent
that the friends are real lenders who have already bid. The coefficient almost doubles
relative to that for the total number of lender friends.
Specification P5 reports results when we decompose the real lender-friends into
the ones who bid on the specific borrower’s listing and ones who do not. At this level,
it is also possible that a potential lender who has not lent in the past now chooses
to initiate bidding with the current loan. Thus, we decompose both potential lenders
and real (past) lenders into ones who bid on the current listing and ones who do not.
We find positive and significant effects for potential lenders who bid on the current
listing. Interestingly, borrowers with potential lender-friends who do not bid on the
listing are less likely to get funded. In contrast, having real lender-friends bid on a
listing elevates the chances of a successful funding. The funding probability equation
does not decompose real bidders into those who win and those who lose because
whether a bidder wins or not is observable only after the outcome is known.
In sum, we find that social capital, as reflected in borrowers’ social networks,
matters in attracting outside financial capital. In this regard, the structural aspects
of the social networks are not necessarily critical. Rather, the role and identity of
the network members are important. It is interesting that social capital matters
16

even when the outside lenders are atomistic individuals participating in arm’s-length
transactions with the individuals possessing the social capital.
5.1.2 Social networks: Groups
We next test whether group variables matter. Proceeding as before, we first consider
group size, measured as the natural logarithm of number of members in a group.
The results for group size are decidedly mixed. In specifications P1 through P4,
larger groups are less likely to result in a successful listing. Membership of a group
appears to lose informational relevance when the group is large. Perhaps the effect
of default of a group member on the overall group credit quality declines when the
membership is very high.. Alternatively, members who choose to belong to a larger
group are voluntarily foregoing membership of a smaller group, recognizing which
potential lenders may become less willing to fund a listing. The group size variable
loses significance in specifications P5 and P6.
We next consider the group type, distinguishing between group memberships that
are less or more verifiable based on the criteria imposed for joining a group. We find
two categories of groups where there is a relatively high bar on verifiability: alumni
memberships based on university or former or current employers, and geography-
based groups. For both variables, group membership results in a greater chance
of listings being funded in all six specifications. Interestingly, being affiliated with
religious groups also matters. Other things equal, borrowers indicating a religious
group affiliation are more likely to draw funding. It is not readily clear why this result
should be obtained. One possibility is that individuals with religious affiliations may
default less; alternatively, some lenders may have a taste for lending to people with
religious affiliations, in the spirit of the taste-based discrimination hypothesis (Becker
1971). We examine this issue in Section 5.3, which deals with loan defaults.
5.2 Interest Rates
Section 5.1 shows that social network variables increase the probability of successful
funding. We next examine whether these variables have complementary price effects.
We regress interest rate spreads on loans on social network variables and controls. We
control for the selection bias that interest rates are only observed when listings are
successfully funded by including the inverse Mills ratio from the funding probability
equation in the interest rate specification. This is the familiar two-step method of
Heckman (1979). The model can be identified through the non-linearity intrinsic
17

to selection models or through exclusion restrictions. The results are similar under
either approach. We use as the variable SPIKEDAYS in the probit model as an
instrument. It has an F -statistic exceeding 50, well above the the cutoff of 10 for
a strong instrument suggested by Staiger and Stock (1997). The results with the
instrument included are reported in Table 6.
The results relating the social network variables to interest rates are remarkably
consistent with those for funding probability and default rates. The variables re-
flecting the role and identity of network members show a direction and gradation
consistent with the results for funding probability. Connections to friends not veri-
fied by Prosper.com tend to increase interest rates, as reflected by the coefficient for
the variable ttlNoRole. More importantly, connections to verified friends with lender
roles has the opposite effect. Both connections to real lenders and those to potential
lenders lower interest rates. Interest rates fall the most when real lender-friends who
have participated in past loans on Prosper.com and also participate in the current
listings and the effects are significant regardless of whether they win in the listing or
not. Having potential lender-friends who do not participate in a borrower’s auction
increases loan spreads by about 20 basis points.
Interestingly, group variables also explain interest rates in a fashion largely consis-
tent with the funding probability model. The group size itself has marginal statistical
significance and little economic significance in explaining interest rates. As in the
funding probability model, belonging to a group that has a religious motif lowers the
interest rate on loans by between 70 and 200 basis points. Geography-based groups
do not show consistent results, with significant effects in models P1–P4 but insignif-
icant interest rate effects in models P5–P6. Groups based on business or university
alumni affiliations, which tend to have verifiable criteria, show strong effects, lowering
interest rates by close to 120 basis points.
5.3 Loan defaults
Prosper.com records the status of loans in each month, or payment cycle. Loans
are current if repayments occur on time. Otherwise, loans can be “late”, “1 month
late,” “2 months late,” and so on. We model a default as occurring if a payment
is late by at least two months. As in the consumer finance literature (e.g, Gross
and Souleles, 2002), we use a survival model to estimate the default process. The
dependent variable is the hazard function h(t), which is the probability of surviving
for the next instant of time given that a subject has survived until time T:
18
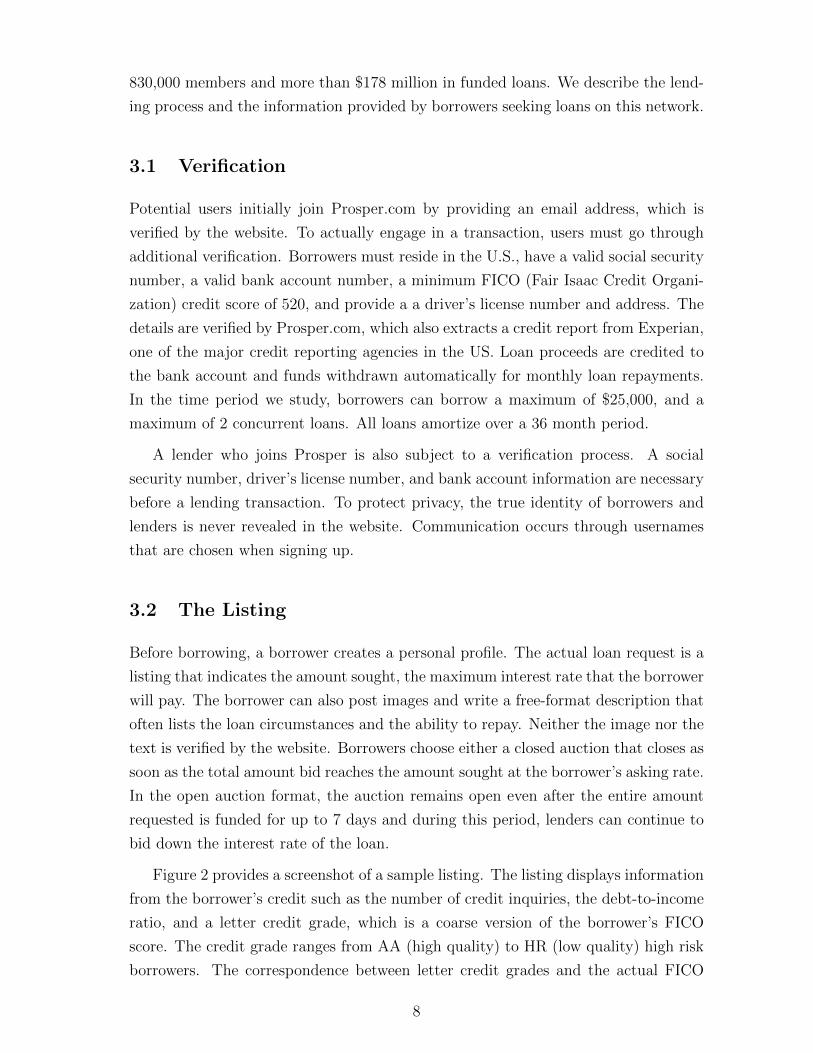
h(t) = Pr(t ≤ T ≤ t+ ∆t | t ≥ T ) (2)
Survival models vary based on how they specify the survival function. We em-
ploy the Cox proportional hazards model (see, e.g., Cleves, Gould, Gutierrez and
Marchenko 2008), which specifies the hazard as
h(t | x) = h0(t)exp(xβ) (3)
where h0(t) is a baseline hazard rate, and x denotes a vector of covariates. For each
covariate xj in the Cox model, we report the exponentiated form of the coefficient βx,
which is called the hazards ratio. The standard error of the exponentiated coefficients
are obtained by applying the Delta method to standard errors of the coefficients
(Cleves et al 2008, page 133). A hazards ratio greater than 1.0 for variable xj indicates
that it increases the probability of default, while a ratio less than 1.0 indicates that
xj decreases the probability of default. The Cox hazards model estimates of β can be
used to recover estimates of the baseline hazard function (Kalbfleisch and Prentice
2002; Cleves et al 2008). Figure 3 gives the results. The baseline hazard of default
increases sharply at the beginning, reaching a peak at about 10 months, and then
slowly wears off. This pattern is remarkably consistent with the analysis of consumer
lending delinquency patterns in Gross and Souleles (2002, page 327).
Table 7 reports estimates of coefficients β in equation (3). In specification C1,
the total number of friends is insignificant as a predictor of default. Specification
C2 decomposes friends into those with verified identities as lenders or borrowers and
friends with no verification. Having more unverified friends increases the odds of
default, as indicated by a hazards ratio of 1.05, while friends with verified identity
decrease the odds of default. However, neither variable is significant. Specification C3
shows statistically significant effects for Prosper.com verified friends who are lenders
in a borrower’s social network. The hazards ratio of 0.91 is significant at 1%, so
having friends registered as lenders decreases default risk by 9% on average.
Specification C4 includes the number of lender-friends but controls for whether
they actually participated in lending prior to the borrower’s listing. The hazards ratio
for real lender-friends is 0.88, indicating that having real lender-friends decreases the
odds of default. Likewise, the hazards ratio is 0.86 when when we consider lender-
friends who bid on the borrower’s listing. Both coefficients are significant at 1%. The
hazards ratio for friends who bid on and win a listing is 0.79 and is significant at 1%.
Thus, the odds of default are significantly lower when lender-friends bid and win on
the borrower’s listing.
19

The result for the real lenders who bid indicate that financial stakes taken by
friends are strong information signals for outside lenders that a borrower is credit-
worthy. Alternatively, perhaps peer pressure is generated when friends take stakes
in a borrower’s listing, generating a positive externality to not default on loans. The
data suggest that this is not a first order force because the median contribution of
friends to a listing is less than 1%. The evidence is more consistent with a prism
effect in which borrowers’ attributes are reflected in the nature of the company they
keep, i.e., serve as a source of soft information about borrower quality. Equivalently,
the positive social capital communicated by friends who bid appears to be the major
reason why social networks reduce defaults.
In terms of group characteristics, Table 7 shows that only two matter for loan
performance, alumni groups and geography-based groups. Interestingly, of the various
groups considered in our study, only these two groups contain verifiable information
about members: borrowers need to prove that they were actually part of the relevant
organization before they can join alumni groups (such as universities or companies),
and geography information is verified during the registration process. Being members
of these two groups increases the probability of the loan being funded and decreases
the risk of default. None of the other groups impacts the risk of default. We also test
for and rule out the hypothesis that non-linearities in group sizes explain default risk.
5.4 Controls
While Sections 5.1-5.3 focus on the role of social networks, we now turn to the major
results for control variables. In terms of hard credit variables, we find that lower
credit grade listings are less likely to be funded, attract higher interest rates, and
are more likely to default. Bank card utilization has a positive coefficient while its
square has a negative coefficient in all three specifications. Some card utilization
appears to be beneficial as it signals creditworthiness. However, very high utilization
seems undesirable because it signals stretched borrowers vulnerable to shocks and
leads to lower funding probability and higher interest rates. More credit inquiries in
the last six months may indicate that borrowers have rather urgent funding needs
or that they have been rejected in credit card markets; therefore the probability of
funding decreases, the interest rate increases, and the associated ex-post default rate
is also higher. A higher debt-to-income ratio indicates a borrower less able to take
on additional debt and results in lower funding probability, higher interest rates, and
greater default probability.
Auctions that close immediately when funding reaches 100% can encourage ag-
20

gressive early bidding, enhancing funding probability but result in higher interest
rates because there are fewer opportunities for lenders to bid down the interest rate.
The results in Tables 5 and 6 support this view: closed auctions result in higher
funding probability and higher interest rates. A closed auction may be indicative of
weaker borrowers who are willing to forgo price competition, which could result in in-
creased default rates. However, the hazard ratio for auction format is not significantly
different from 1.0 in any of our specifications.
In the funding probability models, three types of purpose variables are significant.
Business loans (listingcatg4) appear to be viewed as being more risky. These are
less likely to be funded and when funded, attract higher interest rates. These loans
are also about 24% more likely to default, though the result is only significant at
the 10% level. Debt consolidation loans (listingcatg2) are more likely to be funded
than other loans at lower interest rates, indicating that lenders value the fact that
borrowers are using Prosper.com to shop interest rates or limit credit card debt.
However, there is no guarantee that borrowers will necessarily adhere to their plans
successfully. Debt consolidation loans are about as likely to default as other loans.
Specifying some purpose, category (listingcatg1), increases the overall probability of
funding and lowers interest rates but has little effect on default.
Borrowers willing to pay low rates may be less profitable to lenders and may be
less likely to be funded. However, in the spirit of credit rationing theories, high rates
may signal risky borrowers, who may also be less likely to be funded. To capture this
nonlinearity, we include both the linear and the squared terms of the maximum rate a
borrower is willing to pay. In Tables 5 and 6, the linear term has a positive coefficient
and the quadratic term has a negative sign, as predicted. While rationing theories
argue for linear and quadratic terms in the funding probability equation, it is less
obvious that there is a similar implication for the loans that are actually funded. The
linear interest rate term is negative in four specifications and positive in two others
while the squared term is consistently positive in all models. In unreported results,
we in models with the linear term alone, we find a positive and significant coefficient.
We examine the effect of usury laws. In states with usury law limits on interest
rates, riskier borrowers screened out of other credit markets may seek to come to
Prosper.com, in which case lenders may perceive these borrowers as being riskier.
The results in Tables 5 and 6 suggest that this is the case. Lenders are wary of bor-
rowers from usury law states, who are less likely to get funded and when funded, pay
higher interest rates. While the survival model point estimate for the usury law state
coefficient is greater than 1.0, the difference is not significant. Group leader incen-
tives matter. When group leaders have financial incentives for promoting listings, the
21

listings are more likely to be funded, face lower interest rates, but are not less likely to
default. This mirrors the perverse incentives of the originate-sell securitization model
that is often held to be at the heart of the 2008 financial crisis.2
6 Robustness Tests
To examine the robustness of our findings, we conducted several additional tests.
We discuss the main results, especially the implications for social network variables,
below. A full set of results is available from the authors upon request. The results
are qualitatively discussed below.
6.1 One Borrower, Multiple Listings
We consider panel data effects in the probability of funding equation. Borrowers
whose listings have failed can relist on Prosper.com with a fresh request. Thus, there
can be correlations among listings created by the same borrowers. We note that ours is
a highly unbalanced panel dataset, with over 53% of members posting only one listing.
We use a random effects probit model to estimate the probability of funding using
a panel data setup, where each borrower is a unit. The results from this panel data
model are similar to the previous results for the funding probability. We also consider
an alternative approach in which we model the number of listings that a borrower
needs to post before getting funded. Reversing the terminology of survival analysis, a
“failure” occurs when the borrower is able to obtain their first loan on Prosper.com.
We estimate the time to failure using a Cox proportional hazards model. Our main
results do not change. For instance, having one additional unverified friend decreases
the probability of getting funded by 5.6%, while having a real lender friend who bids
and wins increases the probability of getting funded by 33%.
6.2 Exploratory Network Analysis
We also conduct an exploratory social network analysis of the online network of
friends. The friendship network consists of many disjoint components. The largest
component has 403 members. There is very little overlap between the friendship
2We also test for potential effects of some other variables not included in our primary models.These variables yield results that have marginal significance at best. An interesting variable isthe number of years since a borrower’s first credit line, a proxy for the borrower’s age and creditexperience. It has small effects on the funding probability and interest rate and no effect on default.
22

network and the group network. For instance, few friends in the large component
networks belong to similar groups, so there is little correlation between friendship
and group metrics. Friends with prominent positions on the friendship networks
often have no roles and members with no roles are actually cutpoints in the friendship
network. In other words, removing them increases the number of components. This
further strengthens our argument that it is important to look at the roles and nature
of friends before we can argue for the effect of friendships. Finally, Coleman (1988)
argues that the enforcement of norms depends on network closure; therefore closures
can help reduce unethical and opportunistic behaviors (Burt, 2005). A closure exists
when two friends of an ego are connected to each other, thereby reducing the power
of the ego. In our exploratory analysis however, we found that many components of
the friendship network are actually star-shaped, with very little closure.
In terms of using other social network variables, we considered the number of
endorsements. As noted earlier, friends can also endorse or recommend borrowers but
this is relatively cheap talk and should add little to the results based on friendship
network or actual bidding by friends. Our results show that having endorsements has
no impact on defaults. This result holds for both having/not-having endorsements
as well as for the number of endorsements received. Our previous work examines
bids from friends. It might be possible that bids from other members in the same
group as the borrower can help reduce the risk of loans. We do not find evidence for
these group member bidding effects. One variable that does matter is the number
of friends’ defaults in a borrower’s neighborhood (ego network). The results indicate
that a higher number of defaults in a neighborhood of a borrower is associated with
higher risk of the ego’s loan (Cohen-Cole and Duygan-Bump, 2008).
6.3 Images and Text
Individuals seeking funding on prosper.com can upload and display images on the
listing webpage. Additionally, borrowers can post descriptive text about the loan
listing. A priori, it is not clear whether the social network variables will necessarily
be subsumed by image and/or text data. The social network variables are verified to
varying degrees while the image and text data are self-reported fields not authenti-
cated by Prosper.com. On the other hand, borrowers with higher quality friends may
post more persuasive text descriptions that might lead to better funding probabilities.
In this section, we consider the role played by text and images. To conserve space
and maintain focus, we only report the coefficients for the social network variables
for the subsamples studied in this section. The detailed coefficients for the text and
23

image variables are available to the reader upon request.
6.3.1 No-Image Sample
Close to half the listings on Prosper.com post no images. We consider the role of
the social network variables in the subsample without image data. We report only
the coefficients for the social network variables of interest in Figure 5. All key social
network variables - friends, friends who are potential lenders, real lenders, or real
lenders who bid on listings - remain significant in the no-image subsample.
6.3.2 Subsample With Images
While the no-image sample results are quite suggestive, it is still perhaps useful
to estimate the effects of social networks in samples with images. We experiment
with automatic image processing software but ultimately discard the results because
variations in image content, quality, and perspective make the results too unreliable
for our purposes. We must manually code the data. Because of the high costs of
manually coding the entire sample, we focus on subsamples. One subsample comprises
a random 10% of the funded and unfunded listings. To ensure representativeness,
we preserve the proportions of successful listings, credit grades, and the degrees of
relations depicted in Figure 1. A second subsample consists of all 16,500 funded
listings.
In the 10% random sample of 20,513 listings, 15,928 post images, of which 7,986
contain images of adult humans. In the sample of 16,500 funded loans, 10,198 list-
ings have images, of which 8,279 listings contain images of adult humans. We hire
assistants to code objective aspects of the data including race, age, and gender. We
implement a very extensive set of screens to ensure output quality. Details of these
checks and the process are available to readers upon request.
To provide context, we discuss some univariate statistics and then turn to the
regression results. 14.55% of the random 10% subsample of all listings have images of
blacks, while the proportion of blacks in the funded loans is only about 8.79%. As in
Pope and Sydnor (2008) and Ravina (2008), blacks are less likely to be funded. The
differences for other minority racial groups are less significant. 6.20% of listings are
Asian and 4.75% are Hispanic, while these populations represent 6.91% and 4.21% of
loans funded. Females form 30% of the listings but 37% of all funded loans, suggesting
that women are more likely to attract funding. Young people below 25 form 23% of
all listings but 19.33% of all funded loans. Older people of age 50+ form 6.65% of the
24

listings but only 6.24% of the funded loans. These univariate statistics may reflect
unobserved correlations. For instance, younger people may have less credit history or
lower credit grades. We consider multivariate specifications to evaluate these issues
and more importantly, to assess whether the images alter the coefficients for the social
network variables.
We briefly discuss the key results for the image variables first. Listings with
images of older people of age 50+ and those with images of black adults are less
likely to be funded at the 5% and the 10% levels, respectively. Blacks pay between
40 and 50 basis points more in interest rates, which is slightly lower than the point
estimate of 60-80 basis points reported in Pope and Sydnor (2008). Our estimate is
not significant, a finding similar to that in Ravina (2008), perhaps because there are
fewer observations in the sample with race data. As in Pope and Sydnor, we find
that blacks are significantly more likely to default with a hazards ratio of 1.20 that
is significant at 1%. The more interesting question is whether images subsume the
content of social network variables. Figure 6 reports the results. The standard errors
in Figure 6 exceed the corresponding numbers in Figure 4, reflecting a smaller sample
size. Nevertheless, the point estimates of the key variables are similar and show similar
gradation depending on the verifiability and visibility of the social network variables
to outside lenders. Friends with verified roles in Prosper.com, especially verified roles
as lenders, matter; among these lender friends, those who have participated in prior
loans matter more; and the lender friends who bid on the current listing matter even
more.
6.3.3 Controls For Descriptive Text
Borrowers on prosper.com can include additional descriptive text in their listings.
Over 99% of the listings in our funded sample of 16,500 listings and in the 10%
subsample of 20,513 listings have additional descriptive text. We examine the role
played by text, and in particular whether it explains some of the content of the social
network variables.
Following Tetlock (2007), we use a disambiguation routine to classify text. We
employ the program LIWC (Linguistics Inquiry and Word Count), which is similar to
the General Inquirer program used by Tetlock. LIWC classifies words into five broad
categories, which are further divided into 80 (overlapping) sub-categories including
basic counts of words, long words, punctutation marks, and more complex categories
denoting psychological, social, and personal constructs. The classification is based on
an extensively validated and updated dictionary of words and word stems (Slatcher
25

and Pennebaker 2006; Cohn et al 2004; Friedman et al 2004). We experimented with
several approaches towards using the LIWC output, including the factor analysis used
by Tetlock, using categories that represent at least 5% of the total word count, and
finally, using a set of 12 categories that in our judgment seem the most relevant in
the P2P context. We settled on the last approach.
On average, funded listings are likely to have more words per listing, shorter sen-
tences, more non-dictionary words, use more numerals, more words in the “money”
subcategory, slightly more positive emotions, more words of certainty and fewer tenta-
tive words. Most variables, however, do not survive in the multivariate specifications.
“Money” words are more likely to result in funding and lead to lower interest rates
but have an insignificant effect on default. On the flip side, quantifiers such as “few”
or “many” lower defaults, and “certainty” words increase defaults, but these variables
are insignificant in the funding equation. Not surprisingly, including the text variables
has little effect on the key social network variables, as shown in Figure 6. Even after
controlling for text descriptions, they key social network coefficients display similar
gradation across the roles and identities of the members in borrowers’ networks.
We do not necessarily view the text results as a comprehensive verdict on the role
of linguistic content in determining lending outcomes. The major finding is that the
text variables show little of the consistency that the social network variables have
across the funding probability, interest rate, and default specifications. Thus, it is
not surprising that these variables do not alter the effects of social network variables,
which have more consistent results across the three dependent variables. The results
on images and text suggest that there is a difference in how investors process different
types of soft information. Self-reported information in the text descriptions, which is
not authenticated or verifiable by Prosper.com, appears to be processed unevenly and
less rationally than information in social networks, which is perhaps more credible
given the extensive verification process put in place by Prosper.com.
6.4 Do Networks Matter Enough?
Our previous results show that investors use social networks in making their funding
decisions. However, it is also interesting to assess whether the usage is quantitatively
reasonable. In other words, do borrowers receive enough credit in the form of lower
interest rates given the reduction in default rate implied by their friendship network?
In this section, we attempt to provide a quantitative sense of how investors use the
social network information.
A rather complex approach to quantifying the effect of social networks on loan
26

prices is to recover the pricing kernel used by P2P investors and test whether the
implied parameters are reasonable given the patterns of ex-post defaults. However, if
the goal is to assess how investors use social network information relative to other in-
formation, a simpler approach suggests itself. The intuition underlying this approach
is that similar shifts in the hazard function should result in similar effects on loan
spreads regardless of the covariate that generates the shift. An example illustrates
this intuition.
Consider a $1 loan repaid at t = T by a payment exp(cT ) where c ≡ c(x) is the in-
terest rate spread expressed in continuously compounded terms. With the Cox hazard
function in equation (3), λ0(t)eXβ, the survival function Λt equals exp {exp(xβ)
∫ T0λ0(s) ds}.
The spread c that compensates for default gives a PV of $1, so it solves
1 = exp (c(x)T ) exp(−rT ) Λt = exp (c(x)T ) exp(−rT ) exp {exp(xβ)
∫ T
0
λ0(s) ds}
⇒ exp {(c(x)− r)T} = exp{exp(xβ)
∫ T
0
λ0(s) ds} (4)
Equation (4) suggests to compare how a pair of covariates x1 and x2 are used in loan
pricing relative to their effects on default, we could compare the effect of each on loan
spreads with its effect on the exponentiated hazards ratio. A variable that has a high
interest rate effect ∂c∂x
relative to its effect on the hazards ratio exp(xβ) is weighted
more by investors, while another variable that has a lower interest rate effect for a
similar hazard ratio is weighted less.3
Accordingly, we standardize each coefficient in the interest rate regression esti-
mated in Table 6 so the explanatory variable has a unit standard deviation. We
compute this standardized coefficient relative to the exponentiated hazards ratio for
each social network variable and compute the same ratio for the other variables. The
most informative comparison is perhaps that of the social network variables to the
hard credit variables. The standardized spread scaled for default for the social net-
work variables ranges from 22 to 45 basis points depending on specification. For
instance, in specification #6, which includes real friends who bid on a loan, it equals
27 basis points. In contrast, the hard credit variables have much stronger effects.
From Table 6, the raw credit spreads scale quite steeply in the P2P market and this
is also true for the spreads adjusted for default. For instance, relative to AA bor-
rowers (the omitted category), spreads for A and B borrowers are 80 basis points
3The features essential for the result are (1) The time invariance of the covariates in the Coxmodel; (2) Covariates are individual borrower attributes that do not alter the kernel used to priceloans; (3) zero or fixed recovery rates across categories.
27

and 190 basis points respectively and escalate to 660 basis points for E rated credits.
Scaled for hazard rates, the spreads are 47, 94, and 132 basis points for A, B, and C
rated credits respectively. Lenders appear to be very averse to default risk. But more
importantly, the effect for the hard credit variables exceeds that for any of the social
network variables, suggesting that investors use social network information conser-
vatively. In other words, while investors use social networks while making funding
decisions, the interest rate adjustments they offer appear to be conservative relative
to the ex-post changes in default rates.4
7 Conclusions and Implications
Developments in Web 2.0 technologies have significantly altered the way in which in-
dividuals interact and connect with each other. Perhaps the most significant outcome
of this change is the growth in social networks. Online networks such as facebook.com
have become ubiquitous in a very short span of time since their inception. We study
one of the first attempts to build businesses based on networks. We study peer-to-
peer lending, in which individuals make unsecured loans to other individuals without
the intervention of financial intermediaries. We find that social networks, especially
their relational aspects, lead to better outcomes in all aspects of the lending process.
Our findings are of interest from a number of viewpoints. One perspective of our
study is that it represents data from a credit market in which there is an especially
severe problem of adverse selection. An interesting question is what mechanisms
individual agents use to adapt, given that they lack the sophisticated risk assessment
methodologies, scale economies, or soft information in lending from a broader vector
of banking relationships that is available to traditional financial intermediaries such
as banks. Our evidence suggests that soft information is sought and used in credit
decisions. Social networks act as a new source of “soft” information.
Our study also sheds light on the role of soft information in in credit markets. An
extensive literature in finance argues that credit markets suffer from a problem of ad-
verse selection that can be mitigated by soft information. The literature traditionally
views financial intermediaries are the producers and repositories of soft information.
As financial markets undergo disintermediation driven by information technology, a
natural concern is that the loss of soft information produced by traditional intermedi-
4In unreported results, we examine patterns for other variables and in particular for the subsam-ples with images. While the default hazard for blacks is 1.20 times higher, the spread increases byan average of 40 basis points, consistent with the view of Pope and Sydnor (2008) that markets donot appear to make sufficient adjustments for race effects.
28
aries could adversely affect credit flows. Our results highlight that this concern may
at least be partially mitigated. While information technology could supplant some
sources of soft information, it could also increase its supply by hardening new sources
of soft information and making it available to lenders. The use of social networks
may be seen as one manifestation of such an effect. The realization of such benefits,
however, depends on the ability to make the new information credible and verifiable
by lenders in the credit market.
Our study can also be viewed as new evidence on whether social capital facilitates
economic exchange, a question of growing interest in economics, finance, and man-
agement. The P2P lending marketplace offers micro-level data on this issue with two
significant empirical advantages. One, we have relatively well defined measures of so-
cial capital, which is identified through social networks. In addition, we also have well
defined measures of transactional outcomes, viz., funding, interest rates, and ex-post
default. Our results support the view that social capital is beneficial in facilitating
economic exchange and also point to the avenue by which it acts. While prior work
stresses the relevance of social capital to individuals in networks or the organizations
that employ them, our work suggests that social capital can be harvested by individ-
uals in transactions with outside third parties such as the anonymous lenders that
populate the P2P marketplace. As Podolny (2001) writes, an individual’s network
acts as a prism, or serves as an informational cue that outsiders use to judge the
quality of the individual. Merely having several friends does not assure economically
useful social capital. The roles and identities of the members populating the network
matters. Individuals are judged by the nature of the company they keep.
Finally, our results have implications for design of businesses based on online net-
works. One implication is that such businesses could incorporate and facilitate ease
of using multiple social network metrics for end-users. In particular, the number of
connections and their structure may not be sufficient, but the nature of the relations
also matters. In fact, one could make a reasonable case that P2P markets should
incorporate functionalities that not only promote interactions among members, but
also enable borrowers to credibly signal their embeddedness in their social networks to
lenders. Indeed, Prosper.com has taken steps in this direction in more recent listings
where social network information is given greater prominence in listings seeking fund-
ing. In a similar vein, our results show that in addition to friendship networks, groups
can also play a valuable role in reducing information asymmetries. Thus, increasing
the interdependence among group members and making these ties verifiable can fa-
cilitate capital flows, thus enlarging the scope and applicability of microfinance-style
mechanisms.
29

References
Agarwal, S., and Hauswald, R. B., 2007. The choice between arm’s-length andrelationship debt: evidence from eloans. http://ssrn.com/abstract=968010
Akerlof, G. A., 1970. The market for “lemons”: quality uncertainty and the marketmechanism. The Quarterly Journal of Economics 84(3), 488-500.
Bagozzi, R. P., and Dholakia, U. M., 2006. Open source software user communities, astudy of participation in linux user groups. Management Science 52, 1099-1115
Bampo, M., Ewing, M. T., Mather, D. R., Stewart, D., and Wallace, M., 2008. Theeffects of the social structure of digital networks on viral marketing performance.Information Systems Research 19, 273-290.
Becker, Gary S., 1971. The economics of discrimination. University of ChicagoPress, Chicago.
Burt, R. 1992, Structural holes. Cambridge, MA, Westview Press.
Burt, R. 2005. Brokerage and closure: an introduction to social capital. OxfordUniversity Press.
Cleves, M., Gould, W., Gutierrez, R., and Marchenko, Y., 2008. An introduction tosurvival analysis using Stata. Stata Press.
Cohen-Cole, E., and Duygan-Bump, B., 2008. Household bankruptcy decision, therole of social stigma vs. information sharing. Working paper, Federal ReserveBank of Boston.
Cohen, Lauren, Andrea Frazzini, and Christopher Malloy, 2008a. The small worldof investing, board connections and mutual fund returns. Journal of PoliticalEconomy 116 (5), 951-979.
Cohen, Lauren, Andrea Frazzini, and Christopher Malloy, 2008b. Sell-side schoolties. Working paper, Harvard University.
Cohn, M. A., Mehl, M. R., and Pennebaker, J. W. 2004. Linguistic markers ofpsychological change surrounding September 11, 2001. Psychological Science15(10), 687-93
Coleman, J. S., 1988. Social capital in the creation of human capital. AmericanJournal of Sociology, 94(s1), S95.
Cowan, R., Jonard, N., and Zimmermann, J.-B. 2007. Bilateral collaboration andthe emergence of innovation networks. Management Science 53, 1051-1067.
Drucker, Steve and Manju Puri, 2007. Banks in capital markets, in the Handbookof Empirical Corporate Finance, B. Espen Eckbo, ed., North-Holland.
Durlauf, S. N., and Fafchamps, M, 2004. Social capital. in Handbook of EconomicGrowth, Steven Durlauf and Philippe Aghion (eds), forthcoming.
Fama, E., 1985. What’s different about banks. Journal of Monetary Economics 15,29-39.
Friedman, R., Anderson, C., Brett, J., Olekalns, M., Goates, N., and Lisco, C.C.,2004. The positive and negative effects of anger on dispute resolution: evidenceFrom electronically mediated disputes. Journal of Applied Psychology 89(2),369-376
30

Granovetter, M., 1972. The strength of weak ties. American Journal of Sociology78(6), 1360-1380.
Granovetter, M., 1985. Economic action and social structure: the problem of em-beddedness. American Journal of Sociology 91(3), 481-510.
Granovetter, M., 1992. Problems of explanation in economic sociology. Networksand Organizations, 25-56.
Granovetter, M., 2005. The impact of social structure on economic outcomes. Jour-nal of Economic Perspectives 19(1), 33-50.
Grewal, R., Lilien, G. L., and Mallapragada, G., 2006. Location, location, loca-tion: how network embeddedness affects project success in open source systems.Management Science 52, 1043-1056.
Gross, D. B. and N. S. Souleles, 2002. An empirical analysis of personal bankruptcyand delinquency, Review of Financial Studies 15 (1), 319-347.
Guiso, G., Sapienza, P., and Zingales, L., 2004. Role of social capital in financialdevelopment. American Economic Review 94(3), 526-556.
Hanneman, Robert A. and Mark Riddle, 2005. Introduction to social network meth-ods. Riverside, CA: University of California, Riverside
Heckman, J. 1979. Sample selection bias as a specification error. Econometrica47(1), 153-161.
Hochberg, Y. V., Ljungqvist, A., and Lu, Y, 2007. Whom you know matters: venturecapital networks and investment performance. Journal of Finance 62 (1), 251-301.
Iyer, Rajkamal, Asim Khwaja, Erzo Luttmer, and Kelly Shue, 2009, Can individ-ual lenders infer borrower credit worthiness in peer-to-peer lending?, WorkingPaper, Kennedy School, Harvard University.
Kalbfleisch, J. D., and R. L. Prentice, 2002. The statistical analysis of failure timedata. 2nd ed. Wiley, New York
Karlan, D., 2007. Social connections and group banking. The Economic Journal117(517), 52-84.
Ledgerwood, J. , 1999. Microfinance handbook: The World Bank.
Malone, T. W., Yates, J., and Benjamin, R. I., 1987. Electronic markets and elec-tronic hierarchies, Communications of the ACM 30(6), 484-497.
Mizruchi, M. S., 1992. The structure of corporate political action: inter-firm rela-tions and their consequences: Harvard University Press.
Moran, P., 2005. Structural vs. relational embeddedness: social capital and man-agerial performance. Strategic Management Journal 26(12), 1129-1151.
Morduch, J., 1999. The microfinance promise. Journal of Economic Literature 37(4), 1569-1614.
Petersen, M., 2002. Information: hard and soft. Working paper, NorthwesternUniversity
Petersen, M., and Rajan, R., 1994. The benefits of lending relationships: evidencefrom small business data. Journal of Finance 49, 3-37.
31

Petersen, M. A., and Rajan, R., 2002. Does distance still matter? the informationrevolution in small business lending. Journal of Finance 57(6), 2533-2570.
Podolny, J. M. 1993. A status-based model of market competition. American Jour-nal of Sociology 98(4), 829-72
Podolny, J. M. 2001. Networks as the pipes and prisms of the market. AmericanJournal of Sociology 107(1), 33-60
Pope, Devin and Justin Sydnor, 2008. What’s in a picture? Evidence of discrimi-nation from Prosper.com. Working Paper, University of Pennsylvania.
Portes, A., 1998. Social capital: its origins and applications in modern sociology.Annual Review of Sociology 24, 1-24.
Putnam, R., 1993. The prosperous community: social capital and economic growth.American Prospect 4(13), 35-42.
Ravina, Enrichetta, 2008. The effect of beauty and personal characteristics in creditmarkets. Working paper, Columbia University.
Rosenthal, P. I., 1971. Specificity, verifiability, and message credibility. QuarterlyJournal of Speech 57, 393-401.
Sapienza, P., Toldra, A., and Zingales, L., 2007. Understanding trust. NBERWorking Paper.
Shane, S., and Cable, D., 2002. Network ties, reputation, and the financing of newventures. Management Science 48, 364-381.
Slatcher, R.B., and J. W. Pennebaker, 2006. How do I love thee? Let me countthe words: The social effects of expressive writing. Psychological Science 17(8),660-664 .
Staiger, D., and Stock, J.H., 1997. Instrumental variables regression with weakinstruments. Econometrica 65(3), 557-586.
Stiglitz, J. E., and Weiss, A., 1981. Credit rationing in markets with imperfectinformation. American Economic Review 71(3), 393-410.
Tetlock, Paul, 2007. Giving content to investor sentiment: the role of media in thestock market. Journal of Finance 62, 1139-1168.
Uzzi, B., 1999. Embeddedness in the making of financial capital: how social relationsand networks benefit firms seeking financing. American Sociological Review 64,481-505.
Uzzi, B., and Lancaster, R., 2003. Relational embeddedness and learning: the caseof bank loan managers and their clients. Management Science 49, 383-399
32
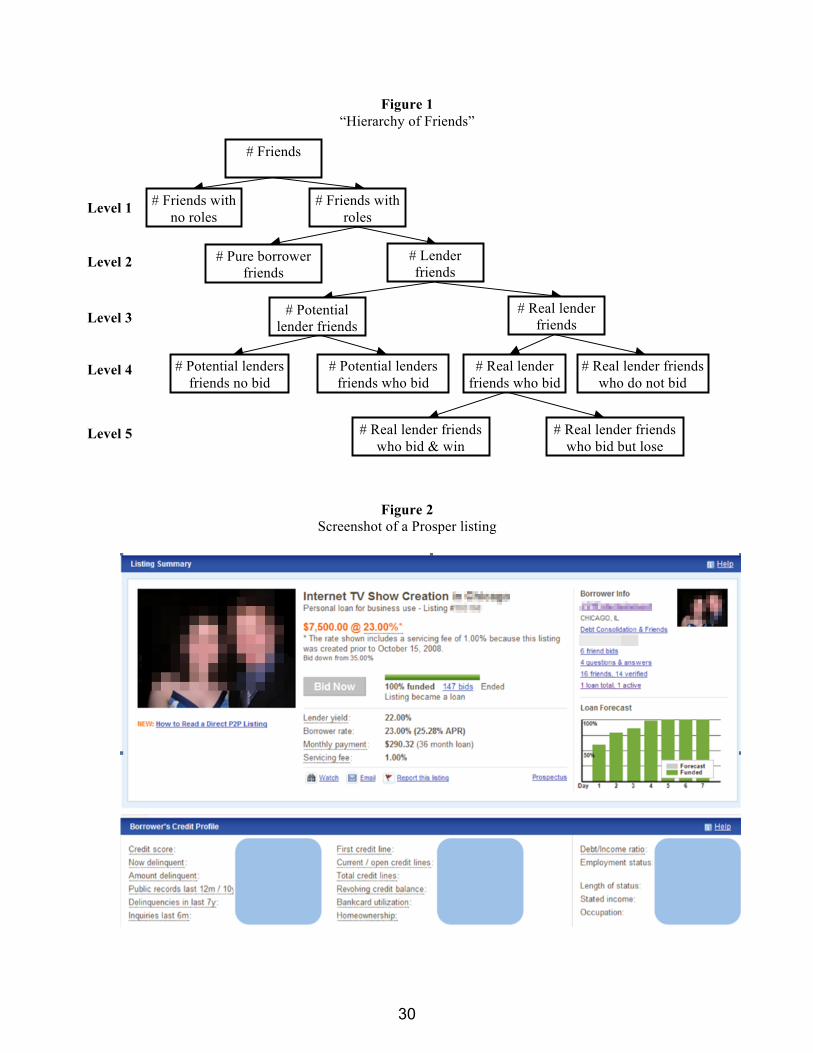
Figure 1 “Hierarchy of Friends”
Figure 2 Screenshot of a Prosper listing
# Friends
# Friends with roles
# Friends with no roles
# Lender friends
# Pure borrower friends
# Real lender friends
# Potential lender friends
# Potential lenders friends no bid
# Potential lenders friends who bid
# Real lender friends who bid
# Real lender friends who do not bid
# Real lender friends who bid & win
# Real lender friends who bid but lose
Level 1
Level 2
Level 3
Level 4
Level 5
30

Figure 3
Smoothed Baseline hazard function
Figure 4 "The Hierarchy of Friends": Results
The three numbers in each box are the coefficient for funding probability, coefficient for interest rate on funded loans, and the hazards ratio in the Cox model, respectively. * p<0.1; ** p<0.05; *** p<0.01.
31
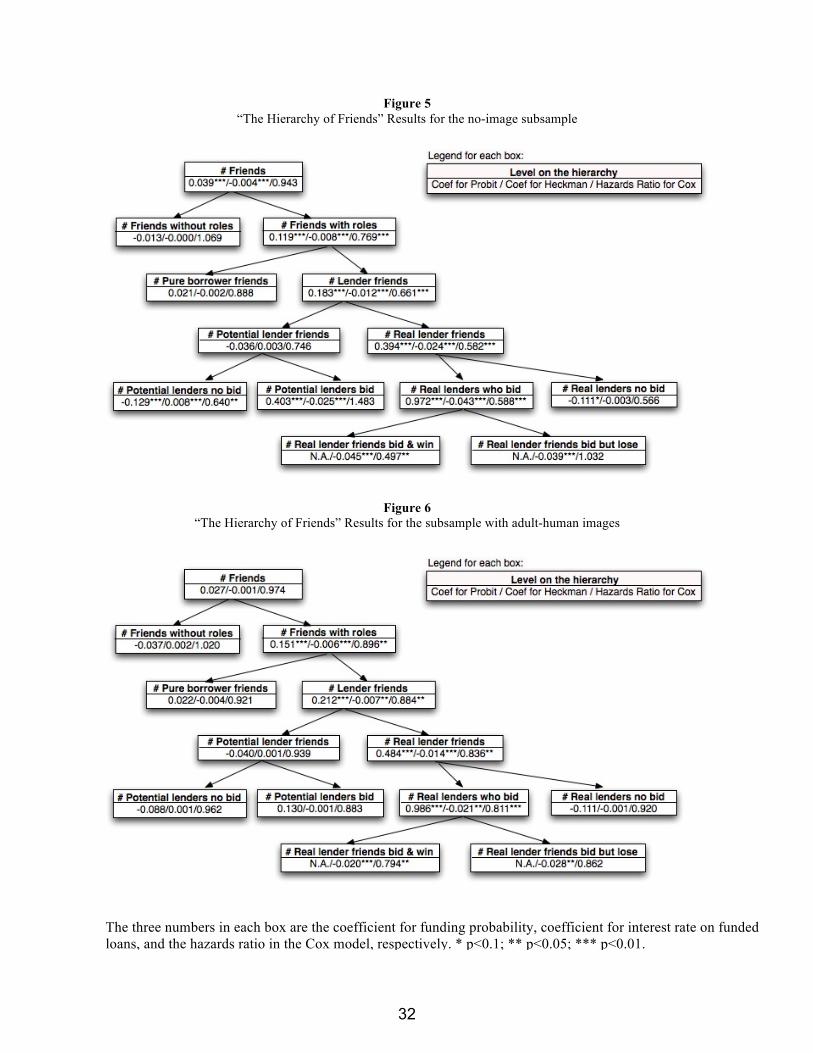
Figure 5 “The Hierarchy of Friends” Results for the no-image subsample
Figure 6 “The Hierarchy of Friends” Results for the subsample with adult-human images
The three numbers in each box are the coefficient for funding probability, coefficient for interest rate on funded loans, and the hazards ratio in the Cox model, respectively. * p<0.1; ** p<0.05; *** p<0.01.
32

Table 1
Correspondence between borrowers’ FICO score and Prosper credit grades
Prosper Credit Grade: AA A B C D E HR
Borrower’s FICO Score: 760 and up 720-759 680-719 640-679 600-639 560-599 520-559
This table reports the correspondence between the letter ratings assigned by Prosper.com to a listing and the listing borrower’s Fair Isaac Credit Score.
Table 2
Variables and their descriptions Table 2 reports descriptive statistics for the independent variables used in the paper. Our sample
comprises 205,131 borrower listings on Prosper.com that have a listing date between January 2007 and May 2008.
Variable Name Variable Description Variable Name Variable Description
Hard Credit Information
CreditGradeAA
1 if borrower's credit grade at time of listing is in grade AA; 0 otherwise. This is the baseline grade, not included in estimation.
CreditGradeHR 1 if borrower's credit grade at time of listing is in grade HR; 0 otherwise
CreditGradeA 1 if borrower's credit grade at time of listing is in grade A; 0 otherwise
DebtToIncomeRatio
Debt-to-income ratio of borrower at listing
CreditGradeB 1 if borrower's credit grade at time of listing is in grade B; 0 otherwise
BankCardUtilization
Bank Card Utilization of borrower at time of listing, or the percentage of credit line issued by the bank that has been utilized
CreditGradeC 1 if borrower's credit grade at time of listing is in grade C; 0 otherwise BankCard2 Quadratic term of
BankCardUtilization
CreditGradeD 1 if borrower's credit grade at time of listing is in grade D; 0 otherwise
InquiriesLast6months
Number of credit inquiries in the prior 6 months before listing
CreditGradeE 1 if borrower's credit grade at time of listing is in grade E; 0 otherwise
YearsSinceFirstCredit
Number of years between the the borrower's first credit line and the time of listing
Auction Characteristics
AuctionFormat Dummy: 1 for a close auction ListingCat5 1 if the borrower chooses "Student Loans" as the listing category
BorrowerMaxRate
Borrower's asking interest rate on the listing ListingCat6 1 if the borrower chooses "Auto
Loans" as the listing category BorrowerMaxRate2 Quadratic term of borrower’s max rate ListingCat7 1 if the borrower chooses "Other
Loans" as the listing category AmountRequested
Amount requested by borrower in listing Duration3 1 if the duration of the listing is 3
days. This is the baseline duration
TotalText Total length of texts provided in borrower profile and listing descriptions
Duration5 1 if the duration of the listing is 5 days, 0 otherwise
ListingCat0 1 if the listing category information is available; this is the baseline category and is not included in the estimation.
Duration7 1 if the duration of the listing is 7 days, 0 otherwise
33

Variable Name Variable Description Variable Name Variable Description
ListingCat1 1 if the borrower chooses "Home Improvement Loans" as the listing category
Duration10 1 if the duration of the listing is 10 days, 0 otherwise
ListingCat2 1 if the borrower chooses " Debt Consolidation " as the listing category BorrowerFee Borrower closing fee charged by
Prosper.com at the time of listing
ListingCat3 1 if the borrower chooses "Personal Loans" as the listing category LenderFee Lender service fee charged by
Prosper.com at the time of listing
ListingCat4 1 if the borrower chooses "Business Loans" as the listing category
Social Network Information - Groups
GroupSize Number of members of the group where the borrower is a member.
_Medical
1 if the borrower belongs to a group specifically mentioning helping with medical needs (e.g. medical costs financing); 0 otherwise
Grouplederrewarded 1 if the borrower's group leader is
awarded when loans are generated; 0 otherwise
_Demographic
1 if the borrower belongs to a group targeting at particular demographic groups, such as Hispanics, Vietnamese, or single parents; 0 otherwise
_Alumni 1 if the borrower belongs to an alumni group - groups targeting at alumni of universities or companies; 0 otherwise
_Hobbies 1 if the borrower belongs to a group targeting at people with specific hobbies or careers; 0 otherwise
_Geography
1 if the borrower belongs to a geographically-oriented group - groups targeting at members of certain geographical regions; 0 otherwise
_Religion 1 if the borrower belongs to a religious group. 0 otherwise
_Military 1 if the borrower belongs to a group targeting at military members or their families; 0 otherwise
_Business
1 if the borrower belongs to a group specifically with the goal of helping small businesses or business developments; 0 otherwise
Social Network Information - Friendship Network
ttlFriends
Total number of friends of the borrower. This is the simplest measure of degree centrality in the friendship network, regardless of their roles or actions
ttlPotentBid
Total number of borrower's potential lender friends who bid on the borrower's listing. This equals the difference between ttlPotentLend and ttlPotentNoBid
ttlRole Total number of friends of the borrower who are either borrowers or lenders (i.e. have their identities verified)
ttlRealBid Total number of borrower's real lender friends who bid on the borrower's listing
ttlNoRole Total number of friends of the borrower who are neither borrowers nor lenders. This equals the difference between ttlFriends and ttlRole
ttlRealNoBid
Total number of borrower's real lender friends who did not bid on the borrower's listing. Equals the difference between ttlRealLend and ttlRealBid
ttlPureBorrow Total number of borrower's friends who are borrowers but not lenders.
ttlRealBidWin Total number of borrower's real lender friends who bid on the borrower's listing and win
ttlLend Total number of borrower's friends who are lenders. This equals the difference between ttlRole and ttlPureBorrow
ttlRealBidLose Total number of borrower's real lender friends who bid on the borrower's listing but lost
34

Variable Name Variable Description Variable Name Variable Description
ttlRealLend
Total number of borrower's lender friends who are "real lenders", or those who have already made loans prior to the time that the borrower (ego) posts the listing
ttlPotentBidWin Total number of borrower's potential lender friends who bid on the borrower's listing and win
ttlPotentLend
Total number of borrower's lender friends who are "potential lenders", or those who has not made any actual loans prior to the time that the borrower (ego) posts the listing. This equals the difference between ttlLend and ttlRealLend
ttlPotentBidLose Total number of borrower's potential lender friends who bid on the borrower's listing and lost
ttlPotentNoBid Total number of borrower's potential lender friends who did not bid on the borrower's listing
ttlPotentBid
Total number of borrower's potential lender friends who bid on the borrower's listing. This equals the difference between ttlPotentLend and ttlPotentNoBid
Additional Control Variables
UsuryState 1 if borrower resides in a state with usury laws; 0 otherwise LenderRole 1 if the borrower has a lender role; 0
otherwise
BankRate
The average interest rate on a 36-month consumer loan from a bank in the same market as the borrower, in the same month as the time of listing, and in the same credit grade of the borrower.
LeaderRole 1 if the borrower is also a group leader; 0 otherwise
SpikeDays 1 if there is abnormal search activities on Google for Prosper.com; 0 otherwise
35

Table 3 Estimated models
Model Variable Set
1 2 3 4 5 6 Funding
Probability Spec. P1 Spec. P2 Spec. P3 Spec. P4 Spec. P5
Interest Rate Spec. H1 Spec. H2 Spec. H3 Spec. H4 Spec. H5 Spec. H6 Loan Default Spec. C1 Spec. C2 Spec. C3 Spec. C4 Spec. C5 Spec. C6
* The sets of variables used in each model are described in Table 4.
Table 4 Variable Sets used in the Models
Variable
sets Corresponding level of the
friendship hierarchy Common variables
(see Table 2) Additional variables
1 Root level ttlFriends 2 1 ttlNoRole, ttlRole 3 2 ttlNoRole, ttlPureBorrow, ttlLend 4 3 ttlNoRole, ttlPureBorrow,
ttlPotentLend, ttlRealLend 5 4 ttlNoRole, ttlPureBorrow,
ttlPotentLend, ttlRealNoBid, ttlRealBid
6 5
Hard credit information Auction characteristics Social network info – Groups; Additional control variables ttlNoRole, ttlPureBorrow,
ttlPotentLend, ttlRealNoBid, ttlRealBidWin, ttlRealBidLose
36

Table 5 Probability of Funding
The table reports estimates of a probit specification in which the dependent variable is one if a listing on prosper.com is funded and zero otherwise. The explanatory variables include a borrower’s hard credit variables, social network variables, group affiliation, and other characteristics of the loan, the loan domicile, and the borrower plus quarterly time period fixed effects. Table 2 gives the detailed definitions of the variables. Robust standard errors are in parentheses. * p<0.1, ** p<0.05, *** p<0.01
Spec. P1 Spec. P2 Spec. P3 Spec. P4 Spec. P5 ttlFriends 0.033*** (0.008) ttlNoRole -0.020* -0.020** -0.017* -0.017 (0.010) (0.010) (0.010) (0.010) ttlRole 0.106*** (0.017) ttlPureBorrow -0.006 -0.002 0.018 (0.023) (0.021) (0.018) ttlLend 0.170*** (0.023) ttlPotentLend 0.025 (0.022) ttlRealLend 0.312*** (0.055) ttlPotentNobid -0.062** (0.028) ttlPotentBid 0.325*** (0.050) ttlRealBid 0.849*** (0.044) ttlrealnobid -0.148*** (0.022) ttlRealBidWin ttlRealBidLose bankrate -0.698 -0.752 -0.662 -0.662 -0.558 (1.693) (1.682) (1.685) (1.682) (1.697) borrowerFee -5.722*** -5.629*** -5.732*** -5.648*** -5.672*** (1.775) (1.737) (1.763) (1.743) (1.682) lenderFee -29.932*** -29.540*** -29.387*** -29.036*** -30.203*** (4.583) (4.508) (4.512) (4.514) (4.592) usurystate -0.077** -0.075** -0.074** -0.071** -0.072** (0.034) (0.034) (0.034) (0.033) (0.034) loggroupsize -0.005** -0.004** -0.004* -0.004** -0.003 (0.002) (0.002) (0.002) (0.002) (0.002) leaderdummy 0.054** 0.047** 0.048** 0.043** 0.073*** (0.022) (0.022) (0.022) (0.022) (0.022) creditgrdA -0.375*** -0.372*** -0.372*** -0.373*** -0.381*** (0.037) (0.037) (0.037) (0.037) (0.036) creditgrdB -0.806*** -0.805*** -0.805*** -0.805*** -0.814*** (0.062) (0.061) (0.061) (0.061) (0.063) creditgrdC -1.457*** -1.455*** -1.456*** -1.457*** -1.470***
(Continued on next page)
37

(0.056) (0.056) (0.056) (0.056) (0.057) creditgrdD -2.105*** -2.102*** -2.107*** -2.109*** -2.133*** (0.094) (0.094) (0.093) (0.094) (0.094) creditgrdE -2.831*** -2.825*** -2.833*** -2.837*** -2.867*** (0.139) (0.138) (0.138) (0.139) (0.139) creditgrdHR -3.310*** -3.304*** -3.312*** -3.318*** -3.354*** (0.132) (0.131) (0.131) (0.131) (0.131) bankcardutilization 0.359*** 0.356*** 0.357*** 0.355*** 0.357*** (0.105) (0.104) (0.103) (0.103) (0.102) bankcard2 -0.203** -0.201** -0.200** -0.200** -0.199** (0.096) (0.096) (0.095) (0.096) (0.095) inquirieslast6months -0.020*** -0.019*** -0.019*** -0.019*** -0.019*** (0.001) (0.001) (0.001) (0.001) (0.001) debttoincomeratio -0.102*** -0.102*** -0.102*** -0.103*** -0.106*** (0.005) (0.005) (0.005) (0.005) (0.005) listingcat4 -0.164*** -0.162*** -0.164*** -0.158*** -0.162*** (0.033) (0.034) (0.034) (0.033) (0.033) listingcat2 0.145*** 0.146*** 0.146*** 0.147*** 0.148*** (0.016) (0.017) (0.016) (0.016) (0.017) listingcat1 0.176*** 0.176*** 0.175*** 0.174*** 0.168*** (0.024) (0.024) (0.024) (0.024) (0.025) logamount -0.706*** -0.707*** -0.708*** -0.709*** -0.714*** (0.012) (0.012) (0.012) (0.012) (0.012) borrowermaximumrate 24.308*** 24.307*** 24.406*** 24.558*** 24.844*** (1.099) (1.095) (1.093) (1.094) (1.092) borrowermaxrate2 -37.911*** -37.904*** -38.057*** -38.357*** -38.849*** (2.234) (2.220) (2.212) (2.217) (2.220) auctionformat 0.122*** 0.125*** 0.126*** 0.127*** 0.133*** (0.017) (0.017) (0.017) (0.017) (0.018) grpleaderrewarded 0.141*** 0.145*** 0.146*** 0.145*** 0.141*** (0.026) (0.025) (0.025) (0.025) (0.025) _Religion 0.280*** 0.287*** 0.283*** 0.273*** 0.246*** (0.089) (0.088) (0.087) (0.085) (0.084) _Geography 0.572** 0.536** 0.512** 0.467*** 0.411** (0.241) (0.220) (0.200) (0.176) (0.161) _Alumni 0.529*** 0.526*** 0.519*** 0.519*** 0.527*** (0.098) (0.096) (0.098) (0.097) (0.100) logttltext 0.225*** 0.228*** 0.227*** 0.228*** 0.222*** (0.009) (0.009) (0.009) (0.009) (0.009) borrowerintermediary 0.164*** 0.142*** 0.132*** 0.137*** 0.136*** (0.014) (0.016) (0.017) (0.018) (0.016) _cons 2.494*** 2.473*** 2.474*** 2.458*** 2.528*** (0.192) (0.190) (0.192) (0.193) (0.190) N 205131 205131 205131 205131 205131 pseudo R-sq 0.322 0.323 0.324 0.325 0.331
(Table 5, continued)
38

Table 6 Interest Rate on Funded Listings
The table reports two-stage estimates of a model in which the dependent variable is the interest rate on Prosper.com listings that are successfully funded. The probit selection equation models the probability of a listing being successfully funded. The explanatory variables include a borrower’s hard credit variables, social network variables, group affiliation, and other characteristics of the loan, the loan domicile, and the borrower plus quarterly time period fixed effects. We report all estimated coefficients for the interest rate equation but suppress coefficients for all probit variables that are included in Table 5. The coefficients for all suppressed variables in the selection equation are consistent with the probit model in Table 5. Robust standard errors are in parentheses. * p<0.1; ** p<0.05; *** p<0.01
Spec. H1 Spec. H2 Spec. H3 Spec. H4 Spec. H5 Spec. H6 ttlFriends -0.002*** (0.001) ttlNoRole 0.002*** 0.002*** 0.002*** 0.001*** 0.001*** (0.001) (0.001) (0.000) (0.000) (0.000) ttlRole -0.005*** (0.001) ttlPureBorrow 0.000 -0.000 -0.001 -0.001 (0.001) (0.001) (0.001) (0.001) ttlLend -0.006*** (0.001) ttlPotentLend -0.001 (0.001) ttlRealLend -0.007*** (0.001) ttlPotentNobid 0.002** 0.002** (0.001) (0.001) ttlPotentBid -0.008*** -0.008*** (0.001) (0.001) ttlRealBid -0.007*** (0.001) ttlrealnobid 0.002 0.001 (0.001) (0.001) ttlRealBidWin -0.006*** (0.001) ttlRealBidLose -0.006*** (0.002) bankrate 0.104* 0.106** 0.102** 0.102*** 0.100*** 0.099*** (0.053) (0.048) (0.042) (0.032) (0.027) (0.027) lenderservicing100 0.024*** 0.021*** 0.019*** 0.015*** 0.008*** 0.008*** (0.003) (0.003) (0.003) (0.002) (0.001) (0.001) borrowerclosing100 0.003** 0.002* 0.002* 0.001 -0.001* -0.001** (0.001) (0.001) (0.001) (0.001) (0.001) (0.001) usurystate 0.005*** 0.005*** 0.004*** 0.003*** 0.002*** 0.001*** (0.001) (0.001) (0.001) (0.001) (0.000) (0.000) loggroupsize 0.000 -0.000 -0.000 -0.000 -0.000* -0.000* (0.000) (0.000) (0.000) (0.000) (0.000) (0.000) leaderdummy -0.005** -0.004** -0.004** -0.003** -0.003*** -0.002*** (0.002) (0.002) (0.002) (0.001) (0.001) (0.001) creditgrdA 0.026*** 0.024*** 0.021*** 0.017*** 0.009*** 0.008*** (0.003) (0.003) (0.002) (0.002) (0.001) (0.001)
(Continued on next page)
39

creditgrdB 0.058*** 0.053*** 0.048*** 0.038*** 0.020*** 0.019*** (0.005) (0.004) (0.004) (0.003) (0.002) (0.001) creditgrdC 0.103*** 0.094*** 0.085*** 0.066*** 0.034*** 0.031*** (0.008) (0.007) (0.006) (0.004) (0.002) (0.002) creditgrdD 0.150*** 0.138*** 0.124*** 0.097*** 0.049*** 0.045*** (0.011) (0.010) (0.008) (0.006) (0.003) (0.003) creditgrdE 0.209*** 0.192*** 0.173*** 0.137*** 0.072*** 0.066*** (0.015) (0.014) (0.012) (0.008) (0.005) (0.004) creditgrdHR 0.244*** 0.223*** 0.201*** 0.158*** 0.082*** 0.075*** (0.018) (0.016) (0.013) (0.009) (0.005) (0.005) bankcardutilization -0.024*** -0.021*** -0.019*** -0.014*** -0.005*** -0.005*** (0.003) (0.003) (0.002) (0.002) (0.001) (0.001) bankcard2 0.015*** 0.013*** 0.012*** 0.009*** 0.004*** 0.003*** (0.002) (0.002) (0.002) (0.001) (0.001) (0.001) inquirieslast6months 0.002*** 0.001*** 0.001*** 0.001*** 0.001*** 0.000*** (0.000) (0.000) (0.000) (0.000) (0.000) (0.000) debttoincomeratio 0.007*** 0.006*** 0.006*** 0.004*** 0.002*** 0.002*** (0.001) (0.001) (0.001) (0.000) (0.000) (0.000) listingcat4 0.010*** 0.008*** 0.007*** 0.005*** 0.001 0.001 (0.002) (0.002) (0.002) (0.001) (0.001) (0.001) listingcat2 -0.009*** -0.008*** -0.007*** -0.005*** -0.002** -0.001* (0.002) (0.002) (0.001) (0.001) (0.001) (0.001) listingcat1 -0.016*** -0.015*** -0.013*** -0.011*** -0.007*** -0.006*** (0.003) (0.002) (0.002) (0.002) (0.001) (0.001) logamount 0.047*** 0.043*** 0.038*** 0.030*** 0.014*** 0.012*** (0.004) (0.003) (0.003) (0.002) (0.001) (0.001) borrowermaximumrate -1.008*** -0.854*** -0.688*** -0.368*** 0.206*** 0.255*** (0.135) (0.119) (0.102) (0.071) (0.038) (0.036) borrowermaxrate2 2.749*** 2.507*** 2.246*** 1.746*** 0.846*** 0.769*** (0.221) (0.195) (0.167) (0.117) (0.068) (0.064) auctionformat 0.030*** 0.031*** 0.031*** 0.033*** 0.035*** 0.036*** (0.001) (0.001) (0.001) (0.001) (0.001) (0.001) grpleaderrewarded -0.005*** -0.004*** -0.003*** -0.002* 0.002** 0.002** (0.002) (0.001) (0.001) (0.001) (0.001) (0.001) _Religion -0.020*** -0.019*** -0.017*** -0.014*** -0.007*** -0.007*** (0.006) (0.005) (0.004) (0.003) (0.003) (0.002) _Geography -0.031*** -0.026*** -0.021*** -0.014*** -0.002 -0.001 (0.008) (0.007) (0.006) (0.004) (0.003) (0.003) _Alumni -0.036*** -0.033*** -0.030*** -0.024*** -0.013*** -0.012*** (0.006) (0.006) (0.005) (0.004) (0.003) (0.002) logttltext -0.015*** -0.014*** -0.013*** -0.010*** -0.004*** -0.004*** (0.001) (0.001) (0.001) (0.001) (0.000) (0.000) borrowerintermediary -0.011*** -0.010*** -0.008*** -0.007*** -0.004*** -0.003*** (0.002) (0.001) (0.001) (0.001) (0.001) (0.001) Inverse Mills Ratio -0.081*** -0.073*** -0.064*** -0.047*** -0.016*** -0.013*** (0.007) (0.006) (0.005) (0.003) (0.002) (0.002) _cons -0.083*** -0.073*** -0.065*** -0.050*** -0.027*** -0.024*** (0.010) (0.009) (0.008) (0.006) (0.004) (0.004)
Selection Equation: All variables used but not reported for conciseness spikedays -0.050** -0.053*** -0.053*** -0.054*** -0.052*** -0.051** (0.020) (0.020) (0.020) (0.020) (0.020) (0.020) N 205,132 205,132 205,132 205,132 205,132 205,132
(Table 6, continued)
40

Table 7 Time to Default of Successful Listings
The table reports hazards ratio estimates of a Cox proportional hazards model of the time to default for borrower listings that are successfully funded on prosper.com. The explanatory variables include a borrower’s hard credit variables, social network variables, group affiliation, and other characteristics of the loan, the loan domicile, and the borrower plus quarterly time period fixed effects. Table 2 gives the detailed definitions of the variables. The table reports the exponentiated coefficients (hazards ratio), where values greater than 1 suggest that a higher value of the explanatory variable increases the risk of default. Robust standard errors are in parentheses. * p<0.1, ** p<0.05, *** p<0.01
Spec. C1 Spec. C2 Spec. C3 Spec. C4 Spec. C5 Spec. C6 ttlFriends 1.017 (0.021) ttlNoRole 1.048 1.048 1.047 1.047 1.047 (0.031) (0.031) (0.031) (0.031) (0.031) ttlRole 0.968 (0.027) ttlPureBorrow 1.061 1.061 1.058 1.055 (0.055) (0.055) (0.055) (0.053) ttlLend 0.912** (0.034) ttlPotentLend 0.950 (0.061) ttlRealLend 0.877*** (0.044) ttlPotentNobid 0.964 0.964 (0.073) (0.071) ttlPotentBid 0.910 0.916 (0.150) (0.150) ttlRealBid 0.856** (0.052) ttlrealnobid 0.938 0.938 (0.113) (0.113) ttlRealBidWin 0.791*** (0.062) ttlRealBidLose 1.086 (0.146) bankrate100 0.958 0.958 0.958 0.958 0.958 0.957 (0.034) (0.033) (0.033) (0.033) (0.033) (0.033) usurystate 1.102 1.100 1.098 1.098 1.098 1.100 (0.100) (0.100) (0.099) (0.099) (0.099) (0.099) loggroupsize 1.005 1.005 1.004 1.004 1.004 1.004 (0.008) (0.008) (0.008) (0.008) (0.008) (0.008) leaderdummy 1.043 1.050 1.051 1.051 1.049 1.048 (0.084) (0.083) (0.082) (0.082) (0.082) (0.083) bankcard100 0.996*** 0.996*** 0.996*** 0.996*** 0.996*** 0.996*** (0.001) (0.001) (0.001) (0.001) (0.001) (0.001) bankcard2_100 1.000*** 1.000*** 1.000*** 1.000*** 1.000*** 1.000*** (0.000) (0.000) (0.000) (0.000) (0.000) (0.000) inquirieslast6months 1.037*** 1.037*** 1.037*** 1.037*** 1.037*** 1.037*** (0.006) (0.006) (0.006) (0.006) (0.006) (0.006) (Continued on next page)
41
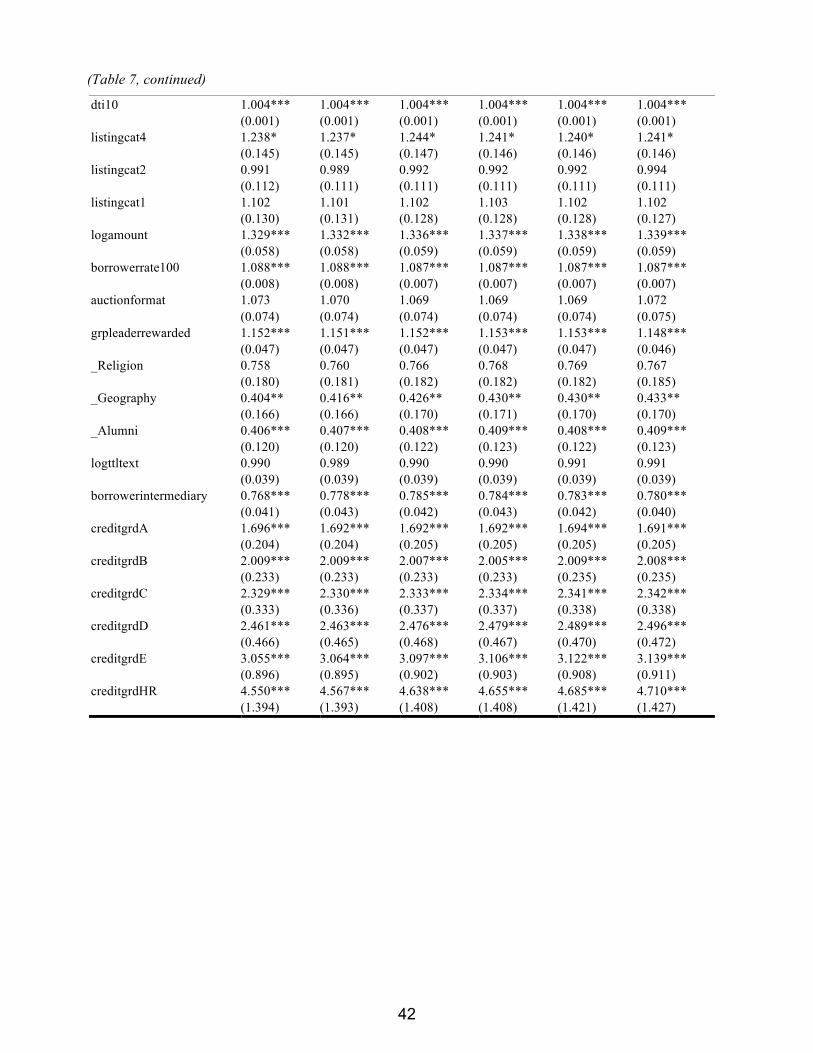
dti10 1.004*** 1.004*** 1.004*** 1.004*** 1.004*** 1.004*** (0.001) (0.001) (0.001) (0.001) (0.001) (0.001) listingcat4 1.238* 1.237* 1.244* 1.241* 1.240* 1.241* (0.145) (0.145) (0.147) (0.146) (0.146) (0.146) listingcat2 0.991 0.989 0.992 0.992 0.992 0.994 (0.112) (0.111) (0.111) (0.111) (0.111) (0.111) listingcat1 1.102 1.101 1.102 1.103 1.102 1.102 (0.130) (0.131) (0.128) (0.128) (0.128) (0.127) logamount 1.329*** 1.332*** 1.336*** 1.337*** 1.338*** 1.339*** (0.058) (0.058) (0.059) (0.059) (0.059) (0.059) borrowerrate100 1.088*** 1.088*** 1.087*** 1.087*** 1.087*** 1.087*** (0.008) (0.008) (0.007) (0.007) (0.007) (0.007) auctionformat 1.073 1.070 1.069 1.069 1.069 1.072 (0.074) (0.074) (0.074) (0.074) (0.074) (0.075) grpleaderrewarded 1.152*** 1.151*** 1.152*** 1.153*** 1.153*** 1.148*** (0.047) (0.047) (0.047) (0.047) (0.047) (0.046) _Religion 0.758 0.760 0.766 0.768 0.769 0.767 (0.180) (0.181) (0.182) (0.182) (0.182) (0.185) _Geography 0.404** 0.416** 0.426** 0.430** 0.430** 0.433** (0.166) (0.166) (0.170) (0.171) (0.170) (0.170) _Alumni 0.406*** 0.407*** 0.408*** 0.409*** 0.408*** 0.409*** (0.120) (0.120) (0.122) (0.123) (0.122) (0.123) logttltext 0.990 0.989 0.990 0.990 0.991 0.991 (0.039) (0.039) (0.039) (0.039) (0.039) (0.039) borrowerintermediary 0.768*** 0.778*** 0.785*** 0.784*** 0.783*** 0.780*** (0.041) (0.043) (0.042) (0.043) (0.042) (0.040) creditgrdA 1.696*** 1.692*** 1.692*** 1.692*** 1.694*** 1.691*** (0.204) (0.204) (0.205) (0.205) (0.205) (0.205) creditgrdB 2.009*** 2.009*** 2.007*** 2.005*** 2.009*** 2.008*** (0.233) (0.233) (0.233) (0.233) (0.235) (0.235) creditgrdC 2.329*** 2.330*** 2.333*** 2.334*** 2.341*** 2.342*** (0.333) (0.336) (0.337) (0.337) (0.338) (0.338) creditgrdD 2.461*** 2.463*** 2.476*** 2.479*** 2.489*** 2.496*** (0.466) (0.465) (0.468) (0.467) (0.470) (0.472) creditgrdE 3.055*** 3.064*** 3.097*** 3.106*** 3.122*** 3.139*** (0.896) (0.895) (0.902) (0.903) (0.908) (0.911) creditgrdHR 4.550*** 4.567*** 4.638*** 4.655*** 4.685*** 4.710*** (1.394) (1.393) (1.408) (1.408) (1.421) (1.427)
(Table 7, continued)
42