Embed Size (px)
Citation preview

Mechanisms of Glutamate Metabolic Signaling in Retinal Glial(Muller) Cells
Serge Poitry,1 Carol Poitry-Yamate,1 Joern Ueberfeld,2 Peter R. MacLeish,3 and Marcos Tsacopoulos1
1Department of Physiology, University of Geneva Medical School, 1211 Geneva 4, Switzerland, 2Department of AppliedPhysics, University of Geneva, 1211 Geneva 4, Switzerland, and 3Neuroscience Institute, Morehouse School of Medicine,Atlanta, Georgia 30310-1495
Retinal Muller (glial) cells metabolize glucose to lactate, which ispreferentially taken up by photoreceptor neurons as fuel fortheir oxidative metabolism. We explored whether lactate supplyto neurons is a glial function controlled by neuronal signals. Forthis, we used subcellular fluorescence imaging and either am-perometric or optical biosensors to monitor metabolic re-sponses simultaneously from mitochondrial and cytosolic com-partments of individual Muller cells from salamander retina. Ourresults demonstrate that lactate production and release is con-trolled by the combined action of glutamate and NH4
1, both atmicromolar concentrations. Transport of glutamate by a high-affinity carrier can produce in Muller cells a rapid rise of gluta-mate concentration. In our isolated Muller cells, glutamine syn-thetase (GS) converted transported glutamate to glutamine thatwas released. This reaction, predominant when enough NH4
1
is available, was limited at micromolar concentrations of NH41,
and more glutamate entered then as substrate into the mito-chondrial tricarboxylic acid cycle (TCA). Increased productionof glutamine by GS leads to increased utilization of ATP, someof which is generated glycolytically. Methionine sulfoximine, aspecific inhibitor of GS, suppressed the stimulatory effect ofglutamate and NH4
1 on glycolysis and induced massive entryof glutamate into the TCA cycle. The rate of glutamine produc-tion also determined the amount of pyruvate transaminated byglutamate to alanine. Lactate, alanine, and glutamine can betaken up and metabolized by photoreceptor neurons. We con-clude that a major function of Muller glial cells is to nourishretinal neurons and to metabolize the neurotoxic ammonia andglutamate.
Key words: ammonia; glutamine synthetase; biosensor;NADH; fluorescence imaging; lactate; retina
There is experimental evidence suggesting the existence of lac-tate trafficking from astrocytes to neurons (for review, see Tsaco-poulos and Magistretti, 1996). For example, lactate transportacross the cytoplasmic membrane of astrocytes and neurons wasshown to be mediated by cell type-specific monocarboxylatetransporters (Broer et al., 1997; Pellerin et al., 1998), but probablythe most convincing evidence to date for such trafficking andutilization of lactate as fuel by neurons was provided by quanti-tative studies on the metabolic fate of glucose in retinal cells.Indeed, Poitry-Yamate et al. (1995) found that acutely isolatedMuller cells metabolize glucose to synthesize and release largeamounts of lactate. This lactate, in turn, is taken up by photore-ceptor neurons and serves as the preferred fuel for oxidativemetabolism. Moreover, because the metabolism of glucose andglycogen in Muller cells was modulated by light absorbed by thevisual pigment of the photoreceptors, it appears that these twocells function as metabolically coupled units and that there is a
signal controlling the transfer of substrates from glial cells toneurons.
In the honeybee retina, the exact signaling mechanism has beenrecently elucidated (Tsacopoulos et al., 1997a,b): functioningphotoreceptor neurons produce and release, in a stimulus-dependent manner, NH4
1 and glutamate which, in turn, aretransported into glia. A stimulus-induced transient rise in theintraglial concentration of NH4
1 and glutamate caused a netactivation of glycolysis by a direct and synchronous action onthree enzymatic reactions. These clear findings are possibly ofinterest to vertebrate studies. Indeed, glutamate is the predomi-nant excitatory neurotransmitter in the mammalian retina andbrain, and it has been shown that glutamate stimulates the uptakeand phosphorylation of glucose and increases the amount oflactate released by cultured astrocytes (Pellerin and Magistretti,1994). However, the exact metabolic signaling mechanism ofglutamate has not been established in vertebrates because gluta-mate transported into astrocytes is known to participate as asubstrate in several reactions that occur in the cytosol or in themitochondria (Cooper and Plum, 1987; for review, see Schousboeet al., 1997), and there was no model of extreme metaboliccompartmentation equivalent to the honeybee retina. We ex-plored metabolic signaling in acutely isolated Muller glial cellsfrom the salamander retina because they present this high degreeof metabolic compartmentation. Indeed, mitochondria are foundalmost exclusively in the distal processes, located in the retinanear the glutamatergic synaptic terminal of photoreceptors(Tsacopoulos et al., 1998, their Fig. 5b). This feature permittedthe use of novel techniques to monitor metabolic responses from
Received Aug. 3, 1999; revised Dec. 16, 1999; accepted Dec. 22, 1999.This work was supported by Swiss National Science Foundation Grant 31-
50893.97, the Sandoz Foundation for Advancement of Biomedical Sciences, theSwiss Foundation for Fight against Blindness, the Hans Wilsdorf Foundation, theMEDIC Foundation, and National Institutes of Health Grant NS35510 (P.R.M.).We thank Dr. J. B. Clark (University College, London) for critical comments, Dr.K. Do and B. Benz (Centre de Recherche en Neurosciences Psychiatriques, Prilly-Lausanne) for HPLC measurements, and P. Perrottet for expert technicalassistance.
Correspondence should be addressed to Marcos Tsacopoulos, Centre MedicalUniversitaire, 1 rue Michel-Servet, 1211 Geneva 4, Switzerland. E-mail: [email protected] © 2000 Society for Neuroscience 0270-6474/00/201809-13$15.00/0
The Journal of Neuroscience, March 1, 2000, 20(5):1809–1821
metabolically different regions of solitary Muller cells. Here weshow that glutamate, in coordination with NH4
1, exerts a strongactivation of glycolysis via the glutamine synthetase reaction. Asa result, the production and release of lactate, glutamine, andalanine by these glial cells are modulated to meet, presumably,the requirements of the functioning neurons. We believe that thisevidence provides a basis for interpreting the observed couplingbetween brain activity and metabolism (Magistretti et al., 1999).
MATERIALS AND METHODSMaterials. Papain was purchased from Worthington (Freehold, NJ), andneutral glutaminase from Applied Enzyme Technology (Leeds, UK).2,7-Biscarboxyethyl-5(6)-carboxyfluorescein-AM (BCECF-AM) and5-carboxy-49,59-dimethylfluorescein (CDMF) were obtained from Mo-lecular Probes (Leiden, The Netherlands). Amytal (amobarbital) sodiumwas from Serva Feinbiochemica (Heidelberg, Germany). All other chem-icals were purchased from Sigma (Buchs, Switzerland).
Preparation of Muller cells isolated from the salamander retina. Tigersalamanders (Ambystoma tigrinum) were purchased from Charles Sulli-van (Nashville, TN) and were kept in a tank filled with tap watermaintained at 10°C. The procedure for cell isolation followed that ofMacLeish and Townes-Anderson (1988) with some modifications.Salamanders were decapitated and pithed. Eyes were enucleated andtranssected, and the retinas were removed and placed in an enzymesolution that contained (in mM): 112 NaCl, 3 KCl, 0.1 CaCl2, 0.1 MgCl2,0.5 NaH2PO4, 1 NaHCO3, 0.1 choline-Cl, 16 glucose, 10 HEPES, and 5cysteine-HCl, and 0.001% phenol red and ;15 U/ml papain, pH 6.4. Theactivity of the enzyme solution was routinely checked before use bymeasuring the rate of acid production from benzoyl-L-arginine ethyl ester(see Worthington Manual). The 16 mM glucose concentration in theenzyme solution was to provide the retina with ample substrate duringincubation. Retinas were incubated at 22–25°C with gentle agitation for1 hr (or more, depending on the activity of the enzyme) and then rinsedseveral times with a slightly hyperosmotic solution of similar composi-tion, but without cysteine and papain, and with 32 mM sucrose added.Retinas were then gently triturated using a fire-polished Pasteur pipettepreviously treated with bovine serum albumin (BSA; 0.1 mg/ml). Ali-quots of the cell suspension were then placed onto a glass coverslipcoated with salamander-specific antibody (Sal-1) serving as adhesionsubstrate for the cells (MacLeish et al., 1983; MacLeish and Townes-Anderson, 1988). Coating of the coverslip was obtained by applyingovernight 100 ml of goat affinity-purified antibody to mouse IgG (GaM;Cappel Research Products, Durham, NC) over the thoroughly cleanedglass surface and by adding then for 1 hr before cell isolation, a 100 mlsample of salt solution containing the Sal-1 antibody. Cells were left 30min to adhere to the coverslip and were then covered with salamanderRinger’s solution with the following composition (in mM): 112 NaCl, 3KCl, 1.8 CaCl2, 0.5 MgCl2, 0.5 MgSO4, 0.5 NaH2PO4, 1 NaHCO3, 0.1choline-Cl, 0.5 glucose, and 10 HEPES and 0.001% phenol red, pH 7.4.This concentration of glucose in normal Ringer’s solution is close to theextracellular concentration measured in rat striatum (Lowry et al., 1998)and was intended to mimic the extracellular concentration in the retina,which has not yet been measured. To maintain cells as long as possible,and because larval tiger salamanders are poikilotherms living in coolwater, dissociated cells were maintained at 17°C, before and during theexperiment.
Purified Muller cell islands. The procedure was similar to the generalprocedure described above, with a few modifications. First, only dropletsof GaM coating (see above) were deposited onto the surface of the glasscoverslip; when dried, these produced islands 300–800 mm in diameterthat were then covered with 100 ml of Sal-1 solution. Muller cellsdissociated as described above were purified by gravity sedimentationthrough a column of salt solution carrying BSA (500 ml of cell suspensionon 500 ml of 10% BSA–Ringer’s solution, in an Eppendorf tube). After20 min of sedimentation, a 300 ml band of purified Muller cells waslocated and removed. These were allowed to settle on the island for ;10min and were then rinsed several times with salamander Ringer’s solu-tion. Cellular debris remaining after purification and not adhering to theantibody were then washed away with medium. To obtain completepurification, in some experiments, cellular debris adhering to the Sal-1antibody was removed by aspiration into a micropipette.
Fluorescence imaging of individual cells. Fluorescence was measured onan inverted Axiovert 135TV epifluorescence microscope (Carl Zeiss
AG, Feldbach, Switzerland) equipped with Zeiss Pan-Neofluar 633 oilimmersion lens (1.25 numerical aperture) and fitted with a xenon arclamp, interference and neutral density filters, and an electromagneticshutter. Selected cells were positioned in the middle of the optical field,and puffer pipettes (tip diameter, ;4 mm) containing the test solutionwere advanced to within 50 mm from the central portion of the cell andremained in place for the duration of the experiment. Images, obtainedby collecting fluorescence for 200 msec, were captured every 3 sec with avideo CCD camera (Photonic Science, Robertsbridge, UK) and pro-cessed by Ion Vision Software (ImproVision, Coventry, UK) on a PowerMacintosh 8100/100AV computer. Some data were obtained on anothersetup, equipped with an Eclipse TE300-DV microscope (Nikon AG,Kusnacht, Switzerland), a Nikon Plan Fluor 1003 oil immersion lens (1.3numerical aperture), a monochromator (T.I.L.L. Photonics, Planegg,Germany), a cooled intensified CCD camera (Photonic Science), Open-lab software (ImproVision), and a Power Macintosh 9600/350 computer.The NAD(P)H traces presented in Figure 4 were recorded with anothercooled CCD camera (Photometrics Ltd, Tuscon, AZ), as described inTsacopoulos et al. (1998). For pHi measurements, cells were exposed for5 min to BCECF-AM (2.5 mg/ml). After washout of extracellular dye,pHi was measured from the ratio of light emitted near 550 nm onexcitation at 490 and at 440 nm. For NAD(P)H fluorescence, excitationwas at 360 nm, and light emitted between 450 and 490 nm was collected;we refer to this fluorescence as “NAD(P)H fluorescence”, meaning “thesum of NADH and NADPH fluorescence”, because the fluorescence ofNADH cannot be distinguished from that of NADPH (Barbour et al.,1993). For FAD fluorescence, excitation was at 440 nm, and light emittedbetween 515 and 565 nm was collected. Fluorescence of different com-pounds was measured sequentially (e.g., first NAD(P)H imaging, thenBCECF loading and imaging). A slight drift of the baseline was observedon the recordings of NAD(P)H or FAD fluorescence. This drift, whichwas probably attributable to bleaching of the fluorophore, caused onaverage a signal decrease of 1.7 6 0.3% per min (estimation on 78 tracesfrom 53 cells). To facilitate comparison between individual responses, allthe data were corrected for baseline drift. For this, we calculated for eachtrace the average slope of the signal during the 30 sec preceding stimu-lation and then subtracted the extrapolated baseline from the wholesignal trace.
Lactate measurements. Lactate-sensitive microelectrodes (see Fig. 7A)consisted in glass-insulated platinum (Pt) microelectrodes onto which apolymer layer immobilizing some lactate oxidase was deposited. Theprocedure for fabricating such microelectrodes has been described indetail (Cosnier et al., 1997; Poitry et al., 1997). Briefly, the tip of a glassmicropipette was broken with a diamond cutter to an inner diameter of20–40 mm. A Pt wire [Pt 90%, iridium (Ir) 10%; 125 mm diameter] wasetched by electrolysis in saturated KCN solution until its tip diameter wasonly 2–5 mm. This Pt wire was then introduced into the micropipette andadvanced until its tip protruded from the opening of the micropipette.Insulation of the Pt wire was obtained by gently melting the tip of themicropipette to produce a glass sleeve around the tip of the Pt wire. Theexcess Pt wire still protruding from the tip of the micropipette was thenetched by electrolysis under a thin jet of 2 M NaCl solution. Finally, apolypyrrole film in which lactate oxidase was immobilized was depositedonto the exposed Pt surface by electropolymerization. Lactate oxidasefrom Pedioccocus oxidizes L-lactate (but not D-lactate; Eichel and Rem,1962; Naka, 1993) to pyruvate and hydrogen peroxide. The pH depen-dence of the reaction is weak, with an optimal pH of ;7.5 (Clark et al.,1984; Raba and Motola, 1994), and the Km of the enzyme for L-lactate is700 mM (Sigma datasheet). The amperometric detection of L-lactate wasachieved by holding the potential of the microelectrode at 10.6 Vrelative to an Ag–AgCl reference electrode to detect the hydrogenperoxide produced in the reaction. We previously used the same tech-nique to make glutamate-sensitive microelectrodes based on the entrap-ment of glutamate oxidase, and the performance of this type of micro-electrode has been described in detail (Cosnier et al., 1997; Poitry et al.,1997). The response of the microelectrodes used in the present study waslinear in the range 0–50 mM L-lactate, and it was not affected by 200 mMalanine, glutamine, glutamate, or NH4Cl (Fig. 1); it was also not affectedby possible pH changes induced by lactate released from the cells: the 10mM HEPES buffer in our Ringer’s solution was largely in excess of theconcentration of lactate released, so that pH changes could not haveexceeded 0.01 pH unit in this study. The response times were always ,10sec. Microelectrodes kept at 4°C retained their sensitivity for up to 3weeks. This type of microelectrode cannot be used for accurate mea-surements in cells and tissues releasing catecholamines or ascorbic acid
1810 J. Neurosci., March 1, 2000, 20(5):1809–1821 Poitry et al. • Glutamate Metabolic Signaling in Muller Cells

(i.e., molecules that can be oxidized directly on the Pt surface), unlessthese interfering signals are subtracted. Control experiments with thesame Pt microelectrode as used for lactate measurements, but withoutdeposited enzyme, showed us that Muller cells do not release detectableamounts of directly oxidizable compounds. For this test, the old enzymelayer was removed from the Pt surface by briefly dipping the microelec-trode in 1 M HCl, followed by rinsing in distilled water and rapidelectrolysis of the Pt surface in 2 M NaCl solution.
Ammonia measurements. The ammonia sensor was made of a micropi-pette whose tip was filled with a droplet of fluorescent pH indicatorcovered with a gas-permeable membrane. This sensor is a miniaturizedversion of the sensor described by Kar and Arnold (1992). The methodfor fabricating this sensor was similar to that described by Elamari et al.(1997), with some modifications. A glass micropipette with short stemwas made, using a vertical homemade puller, and its tip was broken witha diamond cutter to an inner diameter of 50 mm and fire-polished. ATeflon membrane (standard 65 N; DuPont de Nemours) was stretchedand fitted over the opening of a 10 mm glass tube and then heated for 10min at 300°C. Then, the fire-polished micropipette was pushed throughthe heated membrane at its thinnest part, so that a membrane patchremained attached over the tip of the micropipette, thus closing theopening. This membrane was impermeable to water and ions, but per-meable to gases. Only the stem of the micropipette, situated proximallyto the Teflon-covered tip, was back-filled with a droplet of solutioncontaining 115 mM NaCl and 0.5 mM CDMF indicator, pH 5.4. Unpro-tonated CDMF is fluorescent (peak excitation, ;505 nm; peak emission,537 nm), but the protonated CDMF is not. Because its pKa is close to 7,CDMF can be used as a fluorescent pH indicator from approximately pH5–9. An optical fiber (120 mm diameter; CeramOptech, Bonn, Germany)was then introduced into the micropipette by means of a speciallyconstructed holder, so that the extremity of the fiber was positioned inthe droplet as close as possible to the Teflon membrane. Thus, thevolume of the solution trapped between the fiber end and the Teflonmembrane was typically ,1 nl, and indicator fluorescence was monitoredonly in this minute volume. The other end of the optical fiber wasconnected to the collecting end of a multimode optical fiber coupler (Ytype, GI 100/140 mm, 0.29 numerical aperture; Corning, Corning, NY).One arm of the optical fiber coupler received the light beam from a greenLED (Sibalco, Basel, Switzerland) that passed through a 509 nm inter-ference filter; this light, traveling down the optical fiber, excited thefluorescent solution trapped inside the sensor tip. The emitted fluores-cence was collected by the same optical fiber and measured through thesecond arm of the optical fiber coupler; this emitted light passed througha 537 nm interference filter and was directed, via an optical fiber pigtail,to a single-photon counting module (SPCM-100 PQ; E G & G, Vau-dreuil, Canada) connected to a timer/counter board of data acquisition(CTM-05/A; Keithley Instruments S.A., Dubendorf, Switzerland). Inprinciple, the sensor detects pH-changing gas molecules such as NH3 orCO2. However, the signals generated by these molecules are opposite:NH3 causes alkalinization (and thus increased fluorescence) of theindicator, whereas CO2 produces acidification of the indicator. In addi-tion, the detection efficiency of the sensor is much higher for NH3 thanfor CO2: because the pH of the indicator solution is 5.4 and the pKa of
ammonia is 9.15, 99.98% of NH3 molecules entering the sensor reactwith H 1 in the indicator solution and are converted to NH4
1; incontrast, the pKa of CO2-bicarbonate is 6.17 and therefore only 14.5% ofthe CO2 molecules entering the sensor are converted to bicarbonate andgenerate H 1. To increase further the detection efficiency for NH3 in ourexperiments, all ammonia measurements were performed in HEPES-buffered Ringer’s solution, with no added bicarbonate, and at pH 7.8:thus, only 2.3% of CO2-bicarbonate released by the cells was found asCO2 in the Ringer’s, whereas 4.3% of ammonia released by the cells wasfound as NH3. Typically, the sensor signal measured for 5 mM NH4Cl inRinger’s at pH 7.8 corresponded to an increase of 0.3 pH unit in indicatorpH, close to the Teflon membrane. The integrity of the Teflon mem-brane, which is essential for proper functioning of the sensor, wascontinuously monitored via the sensor fluorescence signal: any leakthrough the membrane resulted immediately in indicator dilution and,therefore, in irreversible decrease of fluorescence.
Chromatographic analysis. HPLC analysis was performed in the labo-ratory of Dr. Kim Q. Do (Brain Research Institute, University of Zurich)using a Hewlett-Packard chromatograph (model 1090) combined with avariable autoinjector, a cooled (4°C) autosampler, a programmable flu-orescence detector (HP 1046A), and analytical Hyperchrome HPLCcolumns, 250 3 4.6 mm (Bischoff, Leonberg, Germany) packed withHypersil ODS 5 mm (Shandon, Cheshire, UK). For further detail, see Doet al. (1995).
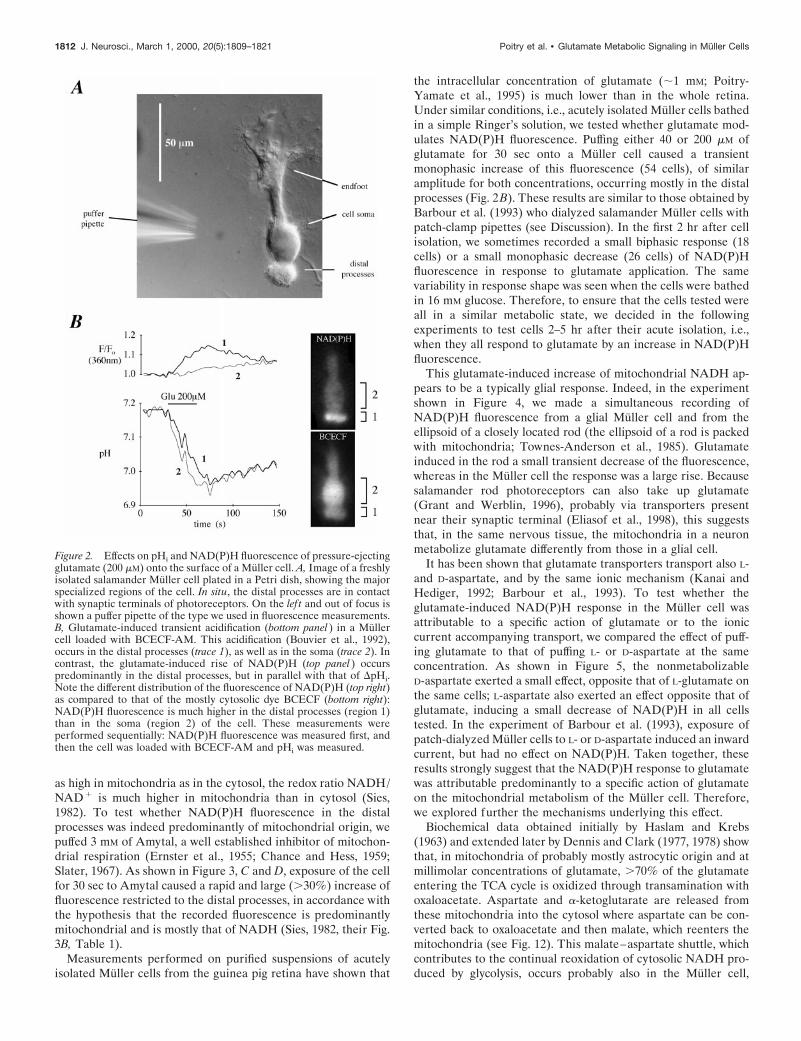
RESULTSGlutamate transport and signalingExperiments in which the transport of glutamate is monitored astransmembrane current (Brew and Attwell, 1987) or as intracel-lular pH change (Bouvier et al., 1992) indicate that the uptake hasan apparent Km of ;20 mM and is fast enough to cause a rapid risein the intracellular concentration of glutamate (Barbour et al.,1993). As previously shown (Brew and Attwell, 1987; Tsacopou-los et al., 1998), the magnitude of the glutamate-induced inwardcurrent in salamander Muller cells is largest at the level of thedistal processes and at the cell soma (Fig. 2A). In the intactretina, these are regions extending from the glutamatergic syn-apses between photoreceptors and bipolar cells, to near theglutamatergic synapses between bipolar and ganglion cells (Brewand Attwell, 1987, their diagram in Fig. 4). These are also regionswhere the analog of the excitatory amino acid transporter subtypeEAAT1 is found in salamander Muller cells (Eliasof et al., 1998;see also Rauen et al., 1998, for similar results on the rat retina).Thus, after a puff application of 40–200 mM glutamate, the changein the intracellular concentration of glutamate is expected to beas large in the distal processes, where most mitochondria arefound (Tsacopoulos et al., 1998, their Fig. 5B), as in themitochondria-poor soma of the cell. The similarity in the timecourse of the glutamate-induced DpHi measured in the distalprocesses and soma (Fig. 2B) is indeed consistent with thisreasoning.
Because the metabolism of glutamate through the tricarboxylicacid (TCA) cycle is associated with the control of the cytosolicreoxidation of NADH (see Fig. 12, reaction 3; Dennis and Clark,1978), we developed a technique for imaging NAD(P)H fluores-cence (see Materials and Methods) at the subcellular level insingle acutely isolated Muller cells. As shown in Figures 2B and3, basal NAD(P)H fluorescence was much more intense in thedistal processes than in either the soma or the endfoot, in sharpcontrast to the distribution of the mostly cytosolic dye BCECF(Fig. 2B, pictures). This distribution of NAD(P)H fluorescence isconsistent with the distribution of mitochondria: estimates basedon Figure 5B from Tsacopoulos et al. (1998) indicate that thenumber of mitochondria is 5–10 times higher in the distal pro-cesses than in the rest of the cell, and it is well known that,although the total concentration of pyridine nucleotides is at least
Figure 1. Current recording showing the sensitivity and the selectivity ofthe lactate sensor. Initially, the sensor was in Ringer’s solution, and arrowsindicate the times at which the sensor was exposed to new solution. R,Ringer’s solution; 1AA, 1 alanine 1 glutamine 1 glutamate 1 NH4Cl(200 mM each); 30 (or 15), Ringer’s solution 1 30 (or 15) mM lactate.
Poitry et al. • Glutamate Metabolic Signaling in Muller Cells J. Neurosci., March 1, 2000, 20(5):1809–1821 1811
as high in mitochondria as in the cytosol, the redox ratio NADH/NAD1 is much higher in mitochondria than in cytosol (Sies,1982). To test whether NAD(P)H fluorescence in the distalprocesses was indeed predominantly of mitochondrial origin, wepuffed 3 mM of Amytal, a well established inhibitor of mitochon-drial respiration (Ernster et al., 1955; Chance and Hess, 1959;Slater, 1967). As shown in Figure 3, C and D, exposure of the cellfor 30 sec to Amytal caused a rapid and large (.30%) increase offluorescence restricted to the distal processes, in accordance withthe hypothesis that the recorded fluorescence is predominantlymitochondrial and is mostly that of NADH (Sies, 1982, their Fig.3B, Table 1).
Measurements performed on purified suspensions of acutelyisolated Muller cells from the guinea pig retina have shown that
the intracellular concentration of glutamate (;1 mM; Poitry-Yamate et al., 1995) is much lower than in the whole retina.Under similar conditions, i.e., acutely isolated Muller cells bathedin a simple Ringer’s solution, we tested whether glutamate mod-ulates NAD(P)H fluorescence. Puffing either 40 or 200 mM ofglutamate for 30 sec onto a Muller cell caused a transientmonophasic increase of this fluorescence (54 cells), of similaramplitude for both concentrations, occurring mostly in the distalprocesses (Fig. 2B). These results are similar to those obtained byBarbour et al. (1993) who dialyzed salamander Muller cells withpatch-clamp pipettes (see Discussion). In the first 2 hr after cellisolation, we sometimes recorded a small biphasic response (18cells) or a small monophasic decrease (26 cells) of NAD(P)Hfluorescence in response to glutamate application. The samevariability in response shape was seen when the cells were bathedin 16 mM glucose. Therefore, to ensure that the cells tested wereall in a similar metabolic state, we decided in the followingexperiments to test cells 2–5 hr after their acute isolation, i.e.,when they all respond to glutamate by an increase in NAD(P)Hfluorescence.
This glutamate-induced increase of mitochondrial NADH ap-pears to be a typically glial response. Indeed, in the experimentshown in Figure 4, we made a simultaneous recording ofNAD(P)H fluorescence from a glial Muller cell and from theellipsoid of a closely located rod (the ellipsoid of a rod is packedwith mitochondria; Townes-Anderson et al., 1985). Glutamateinduced in the rod a small transient decrease of the fluorescence,whereas in the Muller cell the response was a large rise. Becausesalamander rod photoreceptors can also take up glutamate(Grant and Werblin, 1996), probably via transporters presentnear their synaptic terminal (Eliasof et al., 1998), this suggeststhat, in the same nervous tissue, the mitochondria in a neuronmetabolize glutamate differently from those in a glial cell.
It has been shown that glutamate transporters transport also L-and D-aspartate, and by the same ionic mechanism (Kanai andHediger, 1992; Barbour et al., 1993). To test whether theglutamate-induced NAD(P)H response in the Muller cell wasattributable to a specific action of glutamate or to the ioniccurrent accompanying transport, we compared the effect of puff-ing glutamate to that of puffing L- or D-aspartate at the sameconcentration. As shown in Figure 5, the nonmetabolizableD-aspartate exerted a small effect, opposite that of L-glutamate onthe same cells; L-aspartate also exerted an effect opposite that ofglutamate, inducing a small decrease of NAD(P)H in all cellstested. In the experiment of Barbour et al. (1993), exposure ofpatch-dialyzed Muller cells to L- or D-aspartate induced an inwardcurrent, but had no effect on NAD(P)H. Taken together, theseresults strongly suggest that the NAD(P)H response to glutamatewas attributable predominantly to a specific action of glutamateon the mitochondrial metabolism of the Muller cell. Therefore,we explored further the mechanisms underlying this effect.
Biochemical data obtained initially by Haslam and Krebs(1963) and extended later by Dennis and Clark (1977, 1978) showthat, in mitochondria of probably mostly astrocytic origin and atmillimolar concentrations of glutamate, .70% of the glutamateentering the TCA cycle is oxidized through transamination withoxaloacetate. Aspartate and a-ketoglutarate are released fromthese mitochondria into the cytosol where aspartate can be con-verted back to oxaloacetate and then malate, which reenters themitochondria (see Fig. 12). This malate–aspartate shuttle, whichcontributes to the continual reoxidation of cytosolic NADH pro-duced by glycolysis, occurs probably also in the Muller cell,
Figure 2. Effects on pHi and NAD(P)H fluorescence of pressure-ejectingglutamate (200 mM) onto the surface of a Muller cell. A, Image of a freshlyisolated salamander Muller cell plated in a Petri dish, showing the majorspecialized regions of the cell. In situ, the distal processes are in contactwith synaptic terminals of photoreceptors. On the lef t and out of focus isshown a puffer pipette of the type we used in fluorescence measurements.B, Glutamate-induced transient acidification (bottom panel ) in a Mullercell loaded with BCECF-AM. This acidification (Bouvier et al., 1992),occurs in the distal processes (trace 1), as well as in the soma (trace 2). Incontrast, the glutamate-induced rise of NAD(P)H (top panel ) occurspredominantly in the distal processes, but in parallel with that of DpHi.Note the different distribution of the fluorescence of NAD(P)H (top right)as compared to that of the mostly cytosolic dye BCECF (bottom right):NAD(P)H fluorescence is much higher in the distal processes (region 1)than in the soma (region 2) of the cell. These measurements wereperformed sequentially: NAD(P)H fluorescence was measured first, andthen the cell was loaded with BCECF-AM and pHi was measured.
1812 J. Neurosci., March 1, 2000, 20(5):1809–1821 Poitry et al. • Glutamate Metabolic Signaling in Muller Cells

because acutely isolated Muller cells metabolizing 14C(U)-glucose produce large amounts of 14C-aspartate (Poitry-Yamate etal., 1995), and also 14C-malate and 14C-a-ketoglutarate (Poitry-Yamate, 1994). However, because aspartate and a-ketoglutarateare also released from Muller cells, the TCA cycle in these cellsmust be supplied with new intermediates through an anapleroticprocess, to avoid depletion. Among such processes are the deami-nation of glutamate to a-ketoglutarate by mitochondrial gluta-mate dehydrogenase (GDH), or the carboxylation of pyruvate tooxaloacetate by the glial enzyme pyruvate carboxylase (see Fig.12; for review, see Schousboe et al., 1997). Of these, only theprocess catalyzed by GDH directly produces NADH (see reac-tion 4 in Discussion). In contrast, pyruvate carboxylase hydro-
lyzes ATP and may therefore indirectly cause a decrease inmitochondrial NADH by increasing mitochondrial respiration.
To probe the relative importance of transamination in thereactions occurring in an intact isolated Muller cell, we per-formed experiments using either a high concentration of pyruvateor the well known inhibitor of transaminases, aminooxyacetate(AOAA; Westergaard et al., 1996). Haslam and Krebs (1963)found that 10 mM of pyruvate strongly inhibited oxaloacetatetransamination in brain homogenates, and Dennis and Clark(1978) observed the same in their nonsynaptic mitochondria. Ourresults in acutely isolated Muller cells show that, after 15 min ofexposure to 10 mM pyruvate, a puff of glutamate did not inducemore of an increase of NAD(P)H fluorescence (Fig. 6A). Incontrast, exposure of a Muller cell for 1 hr to a high concentrationof AOAA (5 mM), had a negligible effect on the basal NAD(P)H
Figure 3. Relation of NAD(P)H fluorescenceand FAD fluorescence to mitochondrial metabo-lism. A, Both types of fluorescence are observedpredominantly in the distal processes of freshlyisolated Muller cells, where mitochondria arepacked (Tsacopoulos et al., 1998). Peak wave-lengths of fluorescence excitation and of mea-sured emission are given in parentheses. Compart-mentation of fluorescence is more apparent forNAD(P)H than for FAD mainly because thefluorescence intensity of FAD is much lower(Masters and Chance, 1993). B, Schematic repre-sentation showing how the mitochondrial redoxpotential is linked to the functioning of the tri-carboxylic acid cycle (TCA) and to respiration.Boxes indicate which member of each redox cou-ple is fluorescent. C, Pressure-ejecting the inhib-itor of mitochondrial respiration Amytal (3 mM;solid bar) onto a Muller cell induced a rapid riseof NAD(P)H fluorescence only in region 1 (topleft panel), which corresponds to the distal pro-cesses of the cell. a.u., Arbitrary units. D, Samerecordings as in C, but represented as relativechanges, to show that the absence of NAD(P)Hresponse from regions 2 and 3 is not attributableto the lower level of fluorescence.
Figure 4. Comparison of the NAD(P)H fluorescence change induced byglutamate (200 mM) in a freshly isolated Muller cell and in a rod.Although pressure ejection of glutamate induced a monophasic rise ofNAD(P)H fluorescence in the distal processes of a Muller cell, the samepressure ejection induced a small transient decrease of NAD(P)H fluo-rescence in a neighboring rod inner segment, also packed with mitochon-dria. This indicates that the response of mitochondria to glutamatedepends on their environment. The 30 sec period during which the cellwas exposed to glutamate is shown by the thick solid line.
Figure 5. The glutamate-induced NAD(P)H response does not simplyreflect the activity of the glutamate transporter. Comparison of the effectsof glutamate (200 mM) and either D- or L-aspartate (200 mM), which bothenter Muller cells by the same transporter as glutamate (Barbour et al.,1993), on NAD(P)H fluorescence in the distal processes of Muller cells.The histogram gives the amplitude of the NAD(P)H response at the end(white columns; 6SE), and 30 sec after the end (shaded columns; 6SE), ofthe 30 sec period during which the test solution was pressure-ejected. Thenumber of cells in which response pairs were recorded is given inparentheses.
Poitry et al. • Glutamate Metabolic Signaling in Muller Cells J. Neurosci., March 1, 2000, 20(5):1809–1821 1813
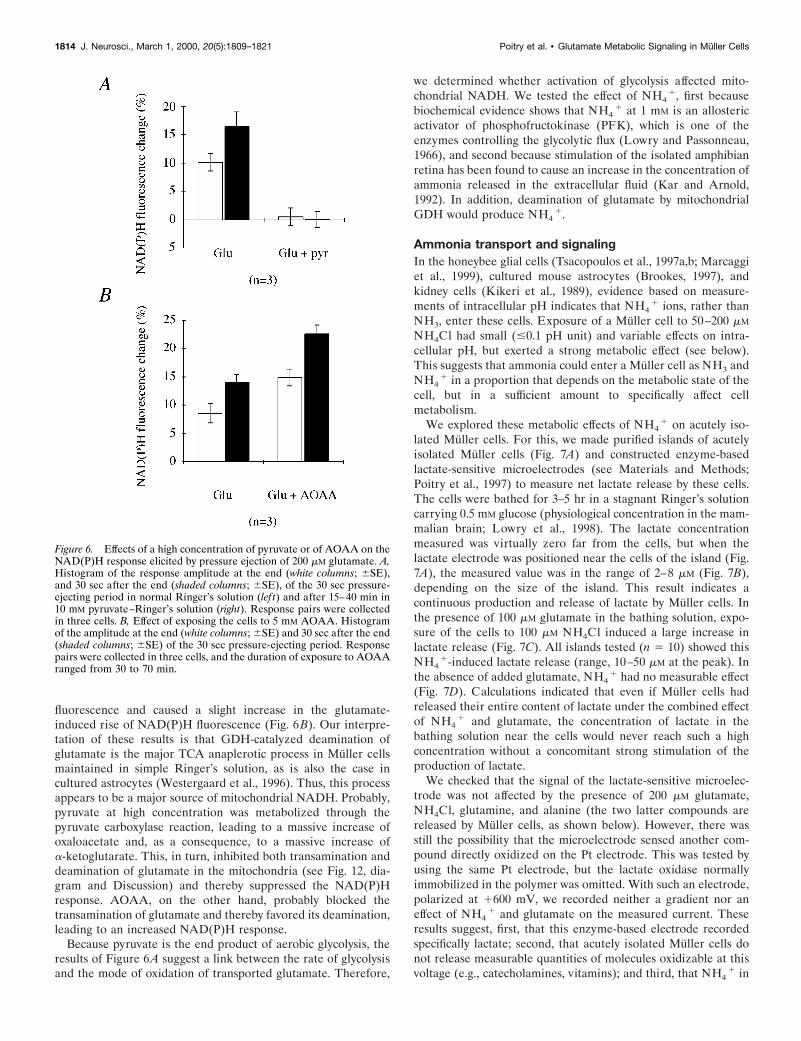
fluorescence and caused a slight increase in the glutamate-induced rise of NAD(P)H fluorescence (Fig. 6B). Our interpre-tation of these results is that GDH-catalyzed deamination ofglutamate is the major TCA anaplerotic process in Muller cellsmaintained in simple Ringer’s solution, as is also the case incultured astrocytes (Westergaard et al., 1996). Thus, this processappears to be a major source of mitochondrial NADH. Probably,pyruvate at high concentration was metabolized through thepyruvate carboxylase reaction, leading to a massive increase ofoxaloacetate and, as a consequence, to a massive increase ofa-ketoglutarate. This, in turn, inhibited both transamination anddeamination of glutamate in the mitochondria (see Fig. 12, dia-gram and Discussion) and thereby suppressed the NAD(P)Hresponse. AOAA, on the other hand, probably blocked thetransamination of glutamate and thereby favored its deamination,leading to an increased NAD(P)H response.
Because pyruvate is the end product of aerobic glycolysis, theresults of Figure 6A suggest a link between the rate of glycolysisand the mode of oxidation of transported glutamate. Therefore,
we determined whether activation of glycolysis affected mito-chondrial NADH. We tested the effect of NH4
1, first becausebiochemical evidence shows that NH4
1 at 1 mM is an allostericactivator of phosphofructokinase (PFK), which is one of theenzymes controlling the glycolytic flux (Lowry and Passonneau,1966), and second because stimulation of the isolated amphibianretina has been found to cause an increase in the concentration ofammonia released in the extracellular fluid (Kar and Arnold,1992). In addition, deamination of glutamate by mitochondrialGDH would produce NH4
1.
Ammonia transport and signalingIn the honeybee glial cells (Tsacopoulos et al., 1997a,b; Marcaggiet al., 1999), cultured mouse astrocytes (Brookes, 1997), andkidney cells (Kikeri et al., 1989), evidence based on measure-ments of intracellular pH indicates that NH4
1 ions, rather thanNH3, enter these cells. Exposure of a Muller cell to 50–200 mM
NH4Cl had small (#0.1 pH unit) and variable effects on intra-cellular pH, but exerted a strong metabolic effect (see below).This suggests that ammonia could enter a Muller cell as NH3 andNH4
1 in a proportion that depends on the metabolic state of thecell, but in a sufficient amount to specifically affect cellmetabolism.
We explored these metabolic effects of NH41 on acutely iso-
lated Muller cells. For this, we made purified islands of acutelyisolated Muller cells (Fig. 7A) and constructed enzyme-basedlactate-sensitive microelectrodes (see Materials and Methods;Poitry et al., 1997) to measure net lactate release by these cells.The cells were bathed for 3–5 hr in a stagnant Ringer’s solutioncarrying 0.5 mM glucose (physiological concentration in the mam-malian brain; Lowry et al., 1998). The lactate concentrationmeasured was virtually zero far from the cells, but when thelactate electrode was positioned near the cells of the island (Fig.7A), the measured value was in the range of 2–8 mM (Fig. 7B),depending on the size of the island. This result indicates acontinuous production and release of lactate by Muller cells. Inthe presence of 100 mM glutamate in the bathing solution, expo-sure of the cells to 100 mM NH4Cl induced a large increase inlactate release (Fig. 7C). All islands tested (n 5 10) showed thisNH4
1-induced lactate release (range, 10–50 mM at the peak). Inthe absence of added glutamate, NH4
1 had no measurable effect(Fig. 7D). Calculations indicated that even if Muller cells hadreleased their entire content of lactate under the combined effectof NH4
1 and glutamate, the concentration of lactate in thebathing solution near the cells would never reach such a highconcentration without a concomitant strong stimulation of theproduction of lactate.
We checked that the signal of the lactate-sensitive microelec-trode was not affected by the presence of 200 mM glutamate,NH4Cl, glutamine, and alanine (the two latter compounds arereleased by Muller cells, as shown below). However, there wasstill the possibility that the microelectrode sensed another com-pound directly oxidized on the Pt electrode. This was tested byusing the same Pt electrode, but the lactate oxidase normallyimmobilized in the polymer was omitted. With such an electrode,polarized at 1600 mV, we recorded neither a gradient nor aneffect of NH4
1 and glutamate on the measured current. Theseresults suggest, first, that this enzyme-based electrode recordedspecifically lactate; second, that acutely isolated Muller cells donot release measurable quantities of molecules oxidizable at thisvoltage (e.g., catecholamines, vitamins); and third, that NH4
1 in
Figure 6. Effects of a high concentration of pyruvate or of AOAA on theNAD(P)H response elicited by pressure ejection of 200 mM glutamate. A,Histogram of the response amplitude at the end (white columns; 6SE),and 30 sec after the end (shaded columns; 6SE), of the 30 sec pressure-ejecting period in normal Ringer’s solution (lef t) and after 15–40 min in10 mM pyruvate–Ringer’s solution (right). Response pairs were collectedin three cells. B, Effect of exposing the cells to 5 mM AOAA. Histogramof the amplitude at the end (white columns; 6SE) and 30 sec after the end(shaded columns; 6SE) of the 30 sec pressure-ejecting period. Responsepairs were collected in three cells, and the duration of exposure to AOAAranged from 30 to 70 min.
1814 J. Neurosci., March 1, 2000, 20(5):1809–1821 Poitry et al. • Glutamate Metabolic Signaling in Muller Cells

the presence of glutamate, or vice versa, strongly increases theproduction and the release of lactate.
As shown in Figure 7E, the increased production of lactate wastransient, in spite of the continuous presence of NH4
1 in thebathing solution, and it could be elicited again only after furtheraddition of glutamate and NH4
1. Bathing the cells in a Ringer’ssolution carrying a 10 times higher concentration of glucose didnot prolong the duration of this lactate increase (result notshown), indicating that the reaction was not limited by glucoseavailability. Therefore, the result of Figure 7E suggests that theincrease in lactate production is linked to a reaction shared by themetabolism of both glutamate and NH4
1, and that this reactionmay have been limited in our experiments by the availability ofeither one of the reactants. Indeed, to allow detection of releasedlactate, the bath was left stagnant after the addition of glutamateand NH4
1; thus, after the first addition of glutamate and NH41,
a high uptake rate of either glutamate or NH41 may have caused
their concentration to decrease much below bath value, in thevicinity of the cells, so that the reaction became diffusion-limited.After further addition of glutamate and NH4
1, the solution wasmixed, and the concentration near the cells probably increasedtransiently to the bath value, allowing lactate production to in-
crease transiently again. This interpretation is in agreement withthe large decrease in [NH4
1] measured with our ammonia sensor(see below and Fig. 8B). We show below that the reaction sharedby glutamate and NH4
1 is the synthesis of glutamine.
Glutamine synthesis and releaseThe ammonia content of isolated glial cells decreases with timeafter isolation, in solution containing no added ammonia (Tsaco-poulos et al., 1997a,b). In cultured cortical astrocytes, Waniewski(1992) showed that, at very low concentrations of ammonia in thebathing medium, the production and release of glutamine wereincreased when the cells were exposed to added NH4
1, at aconcentration as low as 50 mM. The enzyme that catalyzes theformation of glutamine from glutamate and NH4
1 at the expenseof ATP is glutamine synthetase (GS). Using classical immunocy-tochemistry, we found that in the salamander retina GS activity islocalized throughout the cytosol of Muller cells, consistent withprevious findings in the mammalian retina and brain (Derouicheand Rauen, 1995; Derouiche et al., 1996). It is particularly inter-esting that this activity is preserved in acutely isolated cellsmaintained under the conditions described above (results notshown). Consequently, we expected that exposure of these cells to
Figure 7. Cooperative effect of NH41 and glu-
tamate on lactate production and release. A, Pic-ture showing a portion of a microisland made of;250 freshly isolated Muller cells. Also shown isa lactate microsensor with its tip positioned closeto the cells. Scale bar, 100 mm. B, When themicrosensor was approaching the cells from thebath, the lactate signal increased, indicating theexistence of a lactate concentration gradient. C,Exposure of the cells to 100 mM glutamate (solidbar) had no effect on the lactate signal, but addi-tion of 100 mM NH4Cl ( gray bar) in the presenceof 100 mM glutamate induced a large increase inlactate concentration. Withdrawal of the micro-probe from the cells into the bath caused thelactate signal to decrease close to zero (zero levelis indicated by the dotted line). The interruptionin the trace corresponds to a 30 min period. D,Exposure of the cells to 100 mM NH4Cl was byitself insufficient to induce a detectable increaseof lactate concentration. Only after further addi-tion of 100 mM glutamate was a lactate responserecorded. E, Lactate responses elicited by thecooperative action of glutamate and NH4Cl (100mM each) were transient, but could be repeatedby further addition of glutamate and NH4Cl(bath concentration increased to 200 mM foreach, indicated by thickening of the solid bars).The measurement in E was done on the is-land shown in A, which comprised three to fourtimes more cells than those used in the othermeasurements.
Poitry et al. • Glutamate Metabolic Signaling in Muller Cells J. Neurosci., March 1, 2000, 20(5):1809–1821 1815

micromolar concentrations of NH41 would elicit an increase of
glutamine synthesis and release.We tested this expectation by monitoring the release of glu-
tamine by Muller cells, using a technique that combines a fiber-
optic ammonia sensor with the extracellular application of par-tially purified glutaminase diluted in the bathing solution, at pH7.8. At this pH, the “neutral” enzyme we used has its maximumactivity, and ;4% of the ammonia produced is in gaseous formand thus sensed by the probe. Under these conditions, and be-cause the added glutaminase solution had the same pH as thebathing solution and did not contain ammonia (Fig. 8A), anyincrease in ammonia detected after addition of glutaminaseshould result only from the hydrolysis of glutamine by glutami-nase. To detect glutamine produced by the cells, a purified Mullercell island was bathed with Ringer’s solution containing 5 mM
NH41. The ammonia sensor was advanced in the bath, and its tip
was positioned close to the cells. No gradient of NH41 concen-
tration was detected. The addition of 50 mM glutamate inducedthen a rapid decrease of NH4
1 in the bath near the cells (Fig.8B). We suggest that added glutamate was transported into theMuller cells where it induced an increase of glutamine synthesis.This is likely because the Km of brain GS for glutamate is muchhigher than for NH4
1 (see Pamiljans et al., 1962; for humanbrain, Listrom et al., 1997). Probably, in our experiments, theglutamate-induced increase of glutamine synthesis used intracel-lular NH4
1, thus increasing the transmembrane gradient ofNH4
1 concentration. This, in turn, facilitated the entry of NH41
from the extracellular space and caused the observed decrease of[NH4
1] near the cells. Demonstration that the glutamate-induced decrease of extracellular [NH4
1] might be attributable
Figure 9. The lactate response is linked to the activity of glutaminesynthetase. A, Lactate measurements showing that exposure of Mullercells to 1 mM methionine sulfone inhibits the increase in lactate produc-tion induced by glutamate 1 NH4
1 (100 mM each). B, Histogram showingthe effects of 3 mM methionine sulfoximine (white columns; 2 cells) and 3mM methionine sulfone (black columns; 6 cells) on the lactate responseinduced by glutamate 1 NH4
1. Suppression of the response duringexposure to the inhibitor (central column, MSO) was not reversed 1 hrafter returning the preparation to normal Ringer’s (right columns, wash).
Figure 8. Glutamine is produced and released by Muller cells exposedsimultaneously to glutamate and NH4Cl. A, B, Measurements of [NH4
1]by a fiber-optic ammonia sensor. To optimize the detection of ammonia,the pH of the bathing solution in this type of experiment was adjusted to7.8. A, Control experiment. When the sensor was in the bath, addition ofneutral glutaminase (100 ml, in Ringer’s solution at pH 7.8, added to 2 mlbath; final activity: 0.01 U/ml) did not produce an increase in the [NH4
1]signal, but a decrease caused by dilution, indicating that the glutaminasesolution contained much less than 10 mM NH4
1. B, When the sensor waspositioned close to freshly isolated Muller cells forming a microisland(Fig. 7A), and after cells were exposed to glutamate and NH4
1, additionof glutaminase caused a large increase in [NH4
1]. Twenty minutes beforethe beginning of this record, 5 mM NH4Cl was added to the Ringer’ssolution bathing the cells. As shown, further addition of 50 mM glutamatecaused a rapid drop of [NH4
1] near the cells, indicating substantialuptake of ammonia by the cells. The time constant of this drop was similarto the time constant of the sensor response. After 10 min of exposing thecells to glutamate and NH4
1, glutaminase was added to the bath, causingthe rapid hydrolysis of glutamine present in the bath and a concomitantincrease of [NH4
1]. C, Amounts of glutamine (Gln, filled triangles) andalanine (Ala, open circles) released into the bath by a microisland of ;850Muller cells after 30 min incubating periods in normal Ringer’s solution(all bath collections except third) or in Ringer’s solution containingglutamate and NH4Cl (50 mM each, third bath collection). Exposure toglutamate and NH4Cl caused a sizable increase in the production andrelease of glutamine and alanine. Amino acid content of bath collectionswas measured by HPLC, using ortho-phthalaldehyde derivatization.
1816 J. Neurosci., March 1, 2000, 20(5):1809–1821 Poitry et al. • Glutamate Metabolic Signaling in Muller Cells

to an increased rate of glutamine synthesis was provided byshowing that the cells had produced and released an equivalentamount of glutamine. Indeed, as shown in Figure 8B, addition of0.02 U of glutaminase to the bathing solution caused a sharpincrease of the concentration of ammonia, because glutaminaserapidly transformed the glutamine released by the cells to gluta-mate and NH4
1. Similar results were obtained in five Muller cellislands with five different sensors. The concentration of ammoniaafter glutaminase addition was higher than before the addition ofglutamate probably because some glutamine synthesis and releaseoccurred before the exposure to glutamate.
These results are confirmed by HPLC analysis of the bathingsolution showing that, before the exposure of Muller cells to 200mM NH4
1 and glutamate and the consecutive increase in glu-tamine production, there was a measurable, but slowly decreasing,release of glutamine into the bath (Fig. 8C). We conclude thatacutely isolated Muller cells produce and release glutamine andthat this production in the presence of micromolar concentrationof ammonia is strongly stimulated by glutamate.
Link between glutamine synthesis and glycolysisBecause exposure to NH4
1 and glutamate caused a massiveincrease in lactate production (Fig. 7), the natural question thenwas whether this effect was a direct consequence of the increasedrate of glutamine synthesis. This possibility was tested by mea-suring lactate concentration near Muller cell islands in the pres-ence of 1 or 3 mM methionine sulfoximine (MSO), a well estab-lished specific inhibitor of GS (Meister, 1974). Whereas the basallevel of lactate production and release by Muller cells did notchange significantly after addition of MSO, the increase in lactateproduction elicited by NH4
1 and glutamate was irreversibly sup-pressed within 30 min (Fig. 9B). The irreversibility of this effectwas expected, because MSO has been shown to undergo phos-phorylation after binding to the glutamate site of GS, therebypermanently inactivating the enzyme (Meister, 1974). However, 1or 3 mM of methionine sulfone, whose inhibitory action on GSwas reported to be more reversible than MSO (Rowe et al., 1969),produced the same effects (Fig. 9A), irreversible within 1 hr afterapplication (Fig. 9B), which suggests that these inhibitors tend toaccumulate in the cells.
The effects of MSO and methionine sulfone were consistentwith the idea that the increase in lactate production elicited byNH4
1 1 glutamate was a consequence of the increased rate ofglutamine synthesis. Moreover, because the inhibition of GSshould produce an elevation of the intracellular level of NH4
1,these effects excluded a direct role of NH4
1 in the activation ofglycolysis and lactate production. A possible link between glyco-lysis and glutamine synthesis is ATP (or its hydrolysis productsADP and Pi), because the GS reaction consumes ATP and be-cause the activity of PFK is known to be regulated by the levelsof ADP and Pi (Lowry and Passonneau, 1966). As mentionedabove, GS is also present in the distal processes of the Muller celland, therefore, changes in the cytosolic levels of ADP and Pi
caused by increased glutamine synthesis may also lead to in-creased mitochondrial respiration. We explored this possibility bymeasuring NAD(P)H fluorescence during exposure of the Muller
Figure 10. Changes in the mitochondrial redox potential of Muller cellsare linked to the activity of glutamine synthetase. A, B, Exposure of aMuller cell to 200 mM NH4Cl caused a decrease of NAD(P)H fluores-cence and an increase of FAD fluorescence in the distal processes (thicksolid traces, see inset) where mitochondria are packed, but not in otherregions of the cell. C, The NAD(P)H response elicited by NH4
1 in thedistal processes is decreased by 3 mM MSO, an inhibitor of glutaminesynthetase. The response in MSO–Ringer’s (dashed line) was recorded 50min after switching solution. D, Effect of MSO on the NAD(P)H responseinduced by 200 mM NH4Cl. Histogram of the amplitude at the end (whitecolumns; 6SE), and 30 sec after the end (shaded columns; 6SE), of the 30
4
sec pressure-ejecting period in normal Ringer’s (lef t) and after 10–60 minof exposure to 3 mM MSO–Ringer’s (right). Response pairs were collectedin three cells. Response amplitudes at the end of the pressure-ejectingperiod were significantly lower in MSO ( p , 0.01; paired t test).
Poitry et al. • Glutamate Metabolic Signaling in Muller Cells J. Neurosci., March 1, 2000, 20(5):1809–1821 1817

cell to NH41. As shown in Figure 10A, puffing 200 mM NH4Cl for
30 sec induced a large monophasic and transient decrease ofNAD(P)H, a change occurring only in the distal processes of thecell. The same puff caused a parallel, but smaller, increase inflavin adenine dinucleotide (FAD) fluorescence (Fig. 10B). FADis the hydrogen acceptor of the reaction converting succinate tofumarate in the TCA cycle and is produced by the respiratory
chain (Fig. 3B). Thus, probably ADP and Pi produced by theincreased flux through the GS reaction stimulated mitochondrialrespiration. As shown in Figure 10, C and D, exposure to MSOdecreased significantly, but did not abolish the effect of NH4
1 onNAD(P)H fluorescence. This incomplete effect of MSO, evenafter a rather long incubation period, indicates that NH4
1 prob-ably decreases NAD(P)H fluorescence also via another reactionthan that catalyzed by GS, for example by decreasing the flux ofglutamate through the glutamate dehydrogenase reaction (seeFig. 12).
Then we asked whether inhibition of glutamine synthetase byMSO has as a major consequence an increase in intraglial gluta-mate availability to other metabolic pathways. As shown in Figure11A, we measured the mitochondrial NAD(P)H fluorescence as afunction of time after exposure of Muller cells to normal(glutamate-free) Ringer’s solution. The basal NAD(P)H fluores-cence decreased steadily with time, possibly because of a sus-tained loss of TCA intermediates, but puffs of glutamate inducedlarge rises of NAD(P)H (Fig. 11A). Then, the cell was exposed to3 mM MSO, which caused a rapid 40% rise of the basal NAD(P)Hfluorescence in the distal processes and suppressed theglutamate-induced rise of NAD(P)H fluorescence (Fig. 11A,B).Our interpretation is that, in the presence of MSO, glutamate isavailable to enter the TCA cycle, thus leading to a nearly maxi-mum turnover rate of the cycle and consequently to the accumu-lation of NADH. Under this condition, the transported glutamatecould not increase further mitochondrial NAD(P)H.
DISCUSSIONBased on the average current generated by the glutamate uptake,Barbour et al. (1993) calculated that the intracellular concentra-tion of glutamate in Muller cells may rise at a rate of ;0.5mM/sec. Therefore, exposing these cells for 30 sec to 200 mM
glutamate may cause the intracellular concentration to increaseup to ;15 mM, if no transformation of glutamate occurred.However, the similarity of the time courses of DNAD(P)H andDpHi, both measured by optical techniques in this study (Fig. 2B),clearly demonstrates that transported glutamate activates meta-bolic reactions within seconds.
Our observations are consistent with the occurrence in a Mul-ler cell of four biochemical reactions involving glutamate: (1)glutamate 1 NH4
11 ATP3 glutamine 1 ADP 1 Pi; (2) gluta-mate 1 pyruvate 3 alanine 1 a-ketoglutarate; (3) glutamate 1oxaloacetate N a-ketoglutarate 1 aspartate; (4) glutamate 1NAD1 3 a-ketoglutarate 1 NADH 1 NH3. These reactions,already well established by previous biochemical work on brainhomogenates, isolated brain mitochondria, and cultured astro-cytes (for review, see Sonnewald et al., 1997), occur in the cytosol(reactions 1, 2, and 3), or in the mitochondria (reactions 3 and 4).Although they are all related in some way to the NADH redoxpotential, only reaction 4 is directly linked to it.
The interest of our work resides in the use of subcellularimaging of NAD(P)H fluorescence in an acutely isolated type ofastrocyte in which there is a clear metabolic compartmentation.Measurements in the cytosol and in the mitochondria were thuspossible, allowing us to probe simultaneously both cellular com-partments and to explore the relationships between the above-mentioned reactions and the complex signaling role of glutamate.We found that significant and rapid glutamate-inducedNAD(P)H changes occurred only in the distal processes of theMuller cell, where most mitochondria are located. The rapidresponse is explained by the finding that the mitochondria are
Figure 11. The glutamate-induced NAD(P)H response is linked to theactivity of glutamine synthetase. A, Plot of the basal level of NAD(P)Hfluorescence ( filled circles) and of the fluorescence at the peak ofglutamate-induced responses (open triangles) as a function of time aftercell isolation, and effects of exposure to 3 mM MSO (solid bar). The basalfluorescence decreased slightly with time after cell isolation, but MSOcaused it to increase back toward a maximal value and suppressed theglutamate-induced increase of fluorescence. Arrows indicate the times atwhich the glutamate-induced NAD(P)H responses shown in insets wererecorded. Insets, Time course of the glutamate-induced NAD(P)H re-sponses recorded at the times indicated by arrows on the plot. Glutamate(200 mM) was pressure-ejected during 30 sec, as indicated by the solid barunder the traces. B, Effect of exposing the cells to 3 mM MSO on theglutamate-induced NAD(P)H response. Histogram of the amplitude atthe end (white columns; 6SE), and 30 sec after the end (shaded columns;6SE), of the 30 sec pressure-ejecting period. The number of cells in whichresponse pairs were recorded is given in parentheses.
1818 J. Neurosci., March 1, 2000, 20(5):1809–1821 Poitry et al. • Glutamate Metabolic Signaling in Muller Cells
located in a region of the cell where glutamate transport is intense(Tsacopoulos et al., 1998), so that intracellular glutamate concen-tration can increase rapidly. The observation that glutamate didnot induce measurable changes of NAD(P)H in the soma, whereglutamate transport is also intense, is compatible with the ideathat metabolism there, as well as in the endfoot region, is pre-dominantly glycolytic and that glutamate alone does not cause arapid activation of glycolysis (see below and Hertz et al., 1998).
The shape of the glutamate-induced change of NAD(P)Hdepended strongly on whether the cell was tested shortly afterisolation or a few hours later. With regard to this observation, weexcluded a damage of the transport carrier because L- andD-aspartate elicited transport currents and NAD(P)H fluores-cence decreases in all Muller cells, independently of time afterisolation. We therefore believe that the parameter that changedover time after isolation was principally the metabolic state of thecells that was determined by the intracellular levels of glutamateand NH4
1.Our data show that reaction 1 catalyzed by GS (Fig. 12), which
was found in the cytosol of isolated salamander Muller cells, wasthe major route for fixation of NH4
1 and hence for the transfor-mation of cytosolic glutamate to glutamine. The demonstration,made by Cooper et al. (1979) in the intact rat brain, of glutaminesynthesis 1–2 sec after a bolus injection of 13N-labeled ammoniainto the blood stream, is consistent with our data. The highaffinity of GS for ammonia and the lower affinity for glutamate,implies that at low, physiological concentrations of both reactants,ammonia is trapped by GS, and the production of glutamine isfinely controlled by glutamate (Waniewski, 1992). Consequently,when the supply of ammonia is limited, as it was for our isolatedMuller cells, production of glutamine continues until almost allavailable ammonia in the cells is trapped. When the flux throughthe GS reaction is limited by lack of sufficient amounts of ammo-nia (below 10 mM), then more glutamate is available to enterreactions 3 and 4 occurring in mitochondria. This is consistentwith what occurs in MSO-treated rats (Cooper et al., 1979) andwhen cultured astrocytes are exposed to MSO (McKenna et al.,1996; Westergaard et al., 1996).
The metabolic fixation of ammonia utilizes ATP (reaction 1).Because the Km of GS for ATP is high (2.5 mM; Meister, 1974),the cell must restore rapidly the ATP level to maintain glutaminesynthesis. In Muller cells of all species examined so far, GS isfound to be cytosolic, and the elegant study of Derouiche andRauen (1995) demonstrated a colocalization of GS and of theglutamate transporter in the fine lateral processes of Muller cells.The uneven distribution of mitochondria, restricted to the distalprocesses of salamander Muller cells, suggests that a major part ofthe ATP used by GS is produced through the glycolytic pathway.Indeed, in the absence of mitochondrial contribution, lactatesynthesis from pyruvate is necessary to maintain the redox po-tential of glycolysis, and exposure of Muller cells to micromolarconcentrations of NH4
1 and glutamate stimulated the produc-tion and release of both lactate and glutamine. Moreover, thefinding that the specific inhibitor of GS MSO suppressed thelactate increase induced by glutamate and NH4
1 strongly sug-gests that glutamine synthesis and glycolysis are coupled, proba-
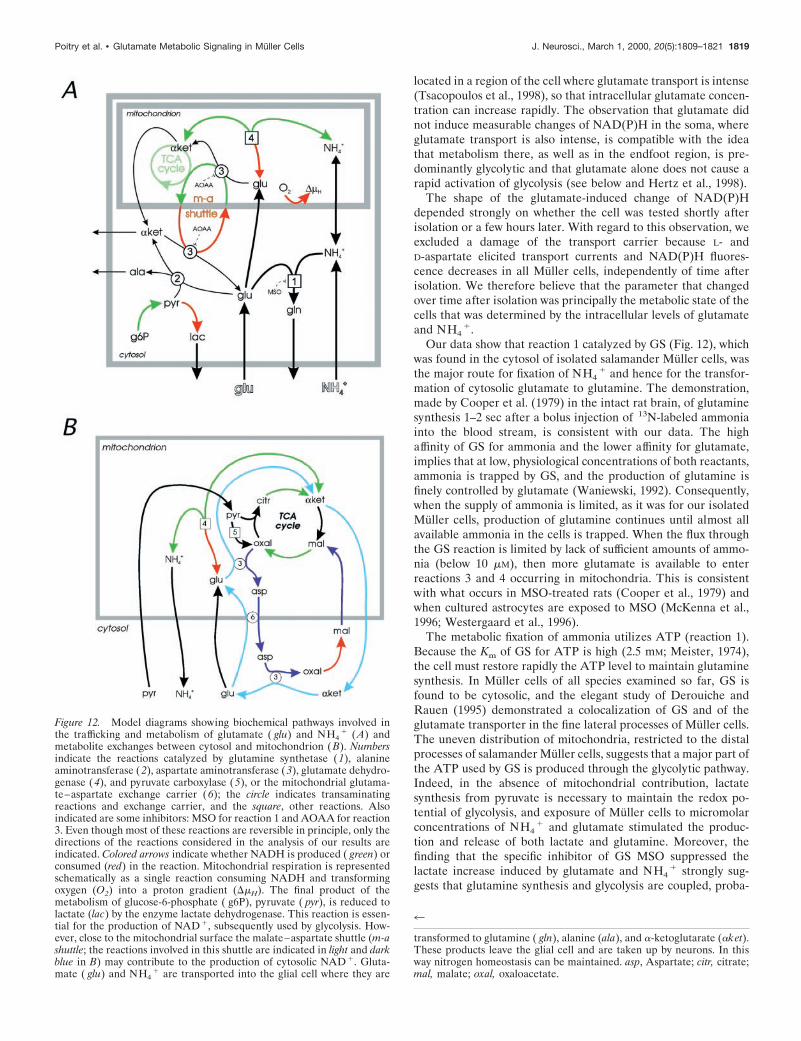
Figure 12. Model diagrams showing biochemical pathways involved inthe trafficking and metabolism of glutamate ( glu) and NH4
1 (A) andmetabolite exchanges between cytosol and mitochondrion (B). Numbersindicate the reactions catalyzed by glutamine synthetase (1), alanineaminotransferase (2), aspartate aminotransferase (3), glutamate dehydro-genase (4), and pyruvate carboxylase ( 5), or the mitochondrial glutama-te–aspartate exchange carrier (6); the circle indicates transaminatingreactions and exchange carrier, and the square, other reactions. Alsoindicated are some inhibitors: MSO for reaction 1 and AOAA for reaction3. Even though most of these reactions are reversible in principle, only thedirections of the reactions considered in the analysis of our results areindicated. Colored arrows indicate whether NADH is produced ( green) orconsumed (red) in the reaction. Mitochondrial respiration is representedschematically as a single reaction consuming NADH and transformingoxygen (O2) into a proton gradient (DmH). The final product of themetabolism of glucose-6-phosphate ( g6P), pyruvate ( pyr), is reduced tolactate (lac) by the enzyme lactate dehydrogenase. This reaction is essen-tial for the production of NAD 1, subsequently used by glycolysis. How-ever, close to the mitochondrial surface the malate–aspartate shuttle (m-ashuttle; the reactions involved in this shuttle are indicated in light and darkblue in B) may contribute to the production of cytosolic NAD 1. Gluta-mate ( glu) and NH4
1 are transported into the glial cell where they are
4
transformed to glutamine ( gln), alanine (ala), and a-ketoglutarate (aket).These products leave the glial cell and are taken up by neurons. In thisway nitrogen homeostasis can be maintained. asp, Aspartate; citr, citrate;mal, malate; oxal, oxaloacetate.
Poitry et al. • Glutamate Metabolic Signaling in Muller Cells J. Neurosci., March 1, 2000, 20(5):1809–1821 1819
bly via the cytosolic phosphate potential (ATP/ADP 1 Pi). Asimilar scheme was adopted by Sibson et al. (1998) in interpretingtheir brain 13C-NMR spectroscopy results obtained in anesthe-tized rats. We postulate that GS, like other ATP-requiring en-zymes, is bound close to glycolytic enzymes, constituting anenzymatic complex. Hence, Pi and ADP leaving the enzymecould stimulate glycolysis via allosteric activation of PFK (Lowryand Passonneau, 1966), and this activation of glycolysis might beefficient in restoring rapidly the level of ATP, in the vicinity ofGS. Thus, under physiological conditions, the flux through the GSreaction might not be limited by the level of ATP, but by theintracellular concentration of ammonia. This hypothesis is con-sistent with findings obtained on rat brain by 1H-15 N-NMR,showing that GS activity is kinetically limited by suboptimal insitu concentration of ammonia (Kanamori et al., 1995).
The activation of glycolysis via increased glutamine productionmust lead to increased production of pyruvate. Despite the pre-dominant reduction of pyruvate to lactate, some small amountmight be transaminated by glutamate to alanine. The similar timecourse of the rises in glutamine and alanine elicited by glutamateand NH4
1 (Fig. 8B) supports this idea. Mammalian Muller cellsand brain-cultured astrocytes produce alanine (Yudkoff et al.,1986; Poitry-Yamate et al., 1995). However, in contrast to hon-eybee retinal glial cells (Tsacopoulos et al., 1994), they do notpossess a cytosolic glutamate dehydrogenase and, therefore, can-not reduce cytosolic a-ketoglutarate back to glutamate to main-tain the redox potential of glycolysis. In the perimitochondrialcytosol however, the aspartate–malate shuttle may contribute toregenerating cytoplasmic NAD1, by carrying malate, in lieu ofNADH, across the mitochondrial membrane (Fig. 12). Thus, alink probably exists between the redox potential of glycolysis andthe redox potential generated by the aspartate–malate shuttle.However, the results of Figure 6A indicate that normally littlepyruvate is available to enter the TCA cycle through the pyruvatecarboxylase reaction and consequently the major anaplerotic pro-cess that fuels the TCA cycle with intermediates is the reactioncatalyzed by glutamate dehydrogenase (reaction 4). This reactionyields the major part of the glutamate-induced increase ofNAD(P)H fluorescence that we measured in this study. Thequantity of glutamate that enters the TCA cycle was determined,in turn, by the flux through the GS reaction and the requirementof intramitochondrial transamination of oxaloacetate to aspar-tate. When more transported glutamate was available to enter theTCA cycle, the turnover of the cycle increased via the mitochon-drial glutamate dehydrogenase reaction (for review, see Cooperand Plum, 1987), leading to a large rise of NAD(P)H fluores-cence. This rise of NAD(P)H indicates that the increased turn-over of the TCA cycle induced by glutamate transiently exceededthe flux of NADH through the respiratory chain (Fig. 3B). Theresults of Barbour et al. (1993) showing a glutamate-induced riseof NAD(P)H fluorescence in Muller cells dialyzed with patch-clamp pipettes filled with 20 mM 2-deoxyglucose to abolish gly-colysis and 0.1 mM malonate to inhibit succinate dehydrogenase,provide strong support to this hypothesis.
We conclude that ammonia fixation by GS controls the amountof lactate, glutamine, and alanine (and possibly also a-ketogluta-rate; Poitry-Yamate, 1994; Poitry-Yamate et al., 1995) producedand released by Muller cells in the extracellular space. Recentdata show that solitary salamander rods, which in the intact retinaare in close contact to Muller cells, take up lactate and alanine (inthe presence of a-ketoglutarate), but not glucose, and use them tofuel the TCA cycle in the mitochondria packed in the ellipsoid
region of the rod (Kapetanios et al., 1998). The fate of glutamineis not known. Although it has not yet been established whetherthese nutrients contribute to the replenishment of neurotransmit-ter glutamate in photoreceptor-neurons (Yudkoff, 1997), our re-sults strongly support the hypothesis that glutamate signals toMuller cells the metabolic requirements of neurons.
REFERENCESBarbour B, Magnus C, Szatkowski M, Gray PT, Attwell D (1993)
Changes in NAD(P)H fluorescence and membrane current producedby glutamate uptake into salamander Muller cells. J Physiol (Lond)466:573–597.
Bouvier M, Szatkowski M, Amato A, Attwell D (1992) The glial cellglutamate uptake carrier countertransports pH-changing anions. Na-ture 360:471–474.
Brew H, Attwell D (1987) Electrogenic glutamate uptake is a majorcurrent carrier in the membrane of axolotl retinal glial cells. Nature327:707–709.
Broer S, Rahman B, Pellegri G, Pellerin L, Martin JL, Verleysdonk S,Hamprecht B, Magistretti PJ (1997) Comparison of lactate transportin astroglial cells and monocarboxylate transporter 1 (MCT 1) express-ing Xenopus laevis oocytes. Expression of two different monocarboxy-late transporters in astroglial cells and neurons. J Biol Chem272:30096–30102.
Brookes N (1997) Intracellular pH as a regulatory signal in astrocytemetabolism. Glia 21:64–73.
Chance B, Hess B (1959) Metabolic control mechanisms. I. Electrontransfer in the mammalian cell. J Biol Chem 234:2404–2412.
Clark LC, Noyes LK, Grooms TA, Moore MS (1984) Rapid micromea-surement of lactate in whole blood. Crit Care Med 12:461–464.
Cooper AJ, Plum F (1987) Biochemistry and physiology of brain ammo-nia. Physiol Rev 67:440–519.
Cooper AJ, McDonald JM, Gelbard AS, Gledhill RF, Duffy TE (1979)The metabolic fate of 13N-labeled ammonia in rat brain. J Biol Chem254:4982–4992.
Cosnier S, Innocent C, Allien L, Poitry S, Tsacopoulos M (1997) An easyelectrochemical method for making enzyme microsensors. Applicationto the detection of dopamine and glutamate. Anal Chem 69:968–971.
Dennis SC, Clark JB (1977) The pathway of glutamate metabolism in ratbrain mitochondria. Biochem J 168:521–527.
Dennis SC, Clark JB (1978) The regulation of glutamate metabolism bytricarboxylic acid-cycle activity in rat brain mitochondria. Biochem J172:155–162.
Derouiche A, Rauen T (1995) Coincidence of L-glutamate/L-aspartatetransporter (GLAST) and glutamine synthetase (GS) immunoreactionsin retinal glia: evidence for coupling of GLAST and GS in transmitterclearance. J Neurosci Res 42:131–143.
Derouiche A, Hartig W, Brauer K, Bruckner G (1996) Spatial relation-ship of lectin-labelled extracellular matrix and glutamine synthetase-immunoreactive astrocytes in rat cortical forebrain regions. J Anat189:363–72.
Do KQ, Lauer CJ, Schreiber W, Zollinger M, Gutteck-Amsler U, Cue-nod M, Holsboer F (1995) gamma-Glutamylglutamine and taurineconcentrations are decreased in the cerebrospinal fluid of drug-naivepatients with schizophrenic disorders. J Neurochem 65:2652–2662.
Eichel HJ, Rem LT (1962) Respiratory enzyme studies in Tetrahymenapyriformis. V. Some properties of an L-lactic oxidase. J Biol Chem237:940–945.
Elamari A, Gisin N, Munoz JL, Poitry S, Tsacopoulos M, Zbinden H(1997) Photon-counting optical-fiber sensor for the detection of am-monia in neurochemical applications. Sensors and Actuators [B]38–39:183–188.
Eliasof S, Arriza JL, Leighton BH, Kavanaugh MP, Amara SG (1998)Excitatory amino acid transporters of the salamander retina: identifi-cation, localization, and function. J Neurosci 18:698–712.
Ernster L, Jalling O, Low H, Lindberg O (1955) Alternative pathways ofmitochondrial DPNH oxidation, studied with amytal. Exp Cell Res[Suppl]3:124–132.
Grant GB, Werblin FS (1996) A glutamate-elicited chloride current withtransporter-like properties in rod photoreceptors of the tigersalamander. Vis Neurosci 13:135–144.
Haslam RJ, Krebs HA (1963) The metabolism of glutamate in homog-enates and slices of brain cortex. Biochem J 88:566–578.
Hertz L, Swanson RA, Newman GC, Marrif H, Juurlink BHJ, Peng L
1820 J. Neurosci., March 1, 2000, 20(5):1809–1821 Poitry et al. • Glutamate Metabolic Signaling in Muller Cells

(1998) Can experimental conditions explain the discrepancy over glu-tamate stimulation of aerobic glycolysis? Dev Neurosci 20:339–347.
Kanai Y, Hediger MA (1992) Primary structure and functional charac-terization of a high-affinity glutamate transporter. Nature 360:467–471.
Kanamori K, Ross BD, Kuo EL (1995) Dependence of in vivo glutaminesynthetase activity on ammonia concentration in rat brain studied by1H - 15N heteronuclear multiple-quantum coherence-transfer NMR.Biochem J 311:681–688.
Kapetanios AD, Poitry S, Poitry-Yamate CL, Tsacopoulos M (1998)Exposure to lactate induces rapid mitochondrial metabolic changes insolitary rods. Invest Ophthalmol Vis Sci 39:S1057.
Kar S, Arnold MA (1992) Fiber-optic ammonia sensor for measuringsynaptic glutamate and extracellular ammonia. Anal Chem 64:2438–2443.
Kikeri D, Sun A, Zeidel ML, Hebert SC (1989) Cell membranes imper-meable to NH3. Nature 339:478–480.
Listrom CD, Morizono H, Rajagopal BS, McCann MT, Tuchman M,Allewell NM (1997) Expression, purification, and characterization ofrecombinant human glutamine synthetase. Biochem J 328:159–163.
Lowry JP, O’Neill RD, Boutelle MG, Fillenz M (1998) Continuousmonitoring of extracellular glucose concentrations in the striatum offreely moving rats with an implanted glucose biosensor. J Neurochem70:391–396.
Lowry OH, Passonneau JV (1966) Kinetic evidence for multiple bindingsites on phosphofructokinase. J Biol Chem 241:2268–2279.
MacLeish PR, Townes-Anderson E (1988) Growth and synapse forma-tion among major classes of adult salamander retinal neurons in vitro.Neuron 1:751–760.
MacLeish PR, Barnstable CJ, Townes-Anderson E (1983) Use of amonoclonal antibody as a substrate for mature neurons in vitro. ProcNatl Acad Sci USA 80:7014–7018.
Magistretti PJ, Pellerin L, Rothman DL, Shulman RG (1999) Energy ondemand. Science 283:496–497.
Marcaggi P, Thwaites DT, Deitmer JW, Coles JA (1999) Chloride-dependent transport of NH41 into bee retinal glial cells. Eur J Neu-rosci 11:167–177.
Masters BR, Chance B (1993) Redox confocal imaging: intrinsic fluo-rescent probes of cellular metabolism. In: Fluorescent and luminescentprobes for biological activity (Mason WT, ed), pp 44–57. New York:Academic.
McKenna MC, Sonnewald U, Huang X, Stevenson J, Zielke HR (1996)Exogenous glutamate concentration regulates the metabolic fate ofglutamate in astrocytes. J Neurochem 66:386–393.
Meister A (1974) Glutamine synthetase of mammals. In: The enzymes,Ed 3, Vol 10 (Boyer PD, ed), pp 699–754. New York: Academic.
Naka K (1993) Enzyme confusion. Clin Chem 39:2351.Pamiljans V, Krishnaswamy PR, Dumville G, Meister A (1962) Studies
on the mechanism of glutamine synthesis: isolation and properties ofthe enzyme from sheep brain. Biochemistry 1:153–158.
Pellerin L, Magistretti PJ (1994) Glutamate uptake into astrocytes stim-ulates aerobic glycolysis: a mechanism coupling neuronal activity toglucose utilization. Proc Natl Acad Sci USA 91:10625–10629.
Pellerin L, Pellegri G, Martin JL, Magistretti PJ (1998) Expression ofmonocarboxylate transporter mRNAs in mouse brain: support for adistinct role of lactate as an energy substrate for the neonatal vs. adultbrain. Proc Natl Acad Sci USA 95:3990–3995.
Poitry S, Poitry-Yamate C, Innocent C, Cosnier S, Tsacopoulos M (1997)Detection of glutamate released by neurons with an enzyme-basedmicroelectrode: applications and limitations. Electrochim Acta42:3217–3223.
Poitry-Yamate CL (1994) Biosynthesis, release, and possible transfer ofglucose-derived carbohydrate intermediates and amino acids frommammalian glial cells to photoreceptor-neurons. PhD dissertation,University of Geneva.
Poitry-Yamate CL, Poitry S, Tsacopoulos M (1995) Lactate released byMuller glial cells is metabolized by photoreceptors from mammalianretina. J Neurosci 15:5179–5191.
Raba J, Motola HA (1994) On-line enzymatic amplification by substratecycling in a dual bioreactor with rotation and amperometric detection.Anal Biochem 220:297–302.
Rauen T, Taylor WR, Kuhlbrodt K, Wiessner M (1998) High-affinityglutamate transporters in the rat retina: a major role of the glialglutamate transporter GLAST-1 in transmitter clearance. Cell TissueRes 291:19–31.
Rowe WB, Ronzio RA, Meister A (1969) Inhibition of glutamine syn-thetase by methionine sulfoximine. Studies on methionine sulfoximinephosphate. Biochemistry 8:2674–2680.
Schousboe A, Westergaard N, Waagepetersen HS, Larsson OM, BakkenIJ, Sonnewald U (1997) Trafficking between glia and neurons of TCAcycle intermediates and related metabolites. Glia 21:99–105.
Sibson NR, Dhankhar A, Mason GF, Rothman DL, Behar KL, ShulmanRG (1998) Stoichiometric coupling of brain glucose metabolism andglutamatergic neuronal activity. Proc Natl Acad Sci USA 95:316–321.
Sies H (1982) Nicotinamide nucleotide compartmentation. In: Metaboliccompartmentation (Sies H, ed), pp 205–231. London: Academic.
Slater EC (1967) Application of inhibitors and uncouplers for a study ofoxidative phosphorylation. Methods Enzymol 10:48–57.
Sonnewald U, Westergaard N, Schousboe A (1997) Glutamate transportand metabolism in astrocytes. Glia 21:56–63.
Townes-Anderson E, MacLeish PR, Raviola E (1985) Rod cells disso-ciated from mature salamander retina: ultrastructure and uptake ofhorseradish peroxidase. J Cell Biol 100:175–188.
Tsacopoulos M, Magistretti PJ (1996) Metabolic coupling between gliaand neurons. J Neurosci 16:877–885.
Tsacopoulos M, Veuthey AL, Saravelos SG, Perrottet P, Tsoupras G(1994) Glial cells transform glucose to alanine, which fuels the neuronsin the honeybee retina. J Neurosci 14:1339–1351.
Tsacopoulos M, Poitry-Yamate CL, Poitry S (1997a) Ammonium andglutamate released by neurons are signals regulating the nutritivefunction of a glial cell. J Neurosci 17:2383–2390.
Tsacopoulos M, Poitry-Yamate CL, Poitry S, Perrottet P, Veuthey AL(1997b) The nutritive function of glia is regulated by signals releasedby neurons. Glia 21:84–91.
Tsacopoulos M, Poitry-Yamate CL, MacLeish PR, Poitry S (1998) Traf-ficking of molecules and metabolic signals in the retina. Prog Retin EyeRes 17:429–442.
Waniewski RA (1992) Physiological levels of ammonia regulate glu-tamine synthesis from extracellular glutamate in astrocyte cultures.J Neurochem 58:167–174.
Westergaard N, Drejer J, Schousboe A, Sonnewald U (1996) Evaluationof the importance of transamination versus deamination in astrocyticmetabolism of [U-13C]glutamate. Glia 17:160–168.
Yudkoff M (1997) Brain metabolism of branched-chain amino acids.Glia 21:92–98.
Yudkoff M, Nissim I, Hummeler K, Medow M, Pleasure D (1986) Uti-lization of [15N]glutamate by cultured astrocytes. Biochem J 234:185–192.
Poitry et al. • Glutamate Metabolic Signaling in Muller Cells J. Neurosci., March 1, 2000, 20(5):1809–1821 1821