Embed Size (px)
Citation preview
Social Media News Communities: Gatekeeping, Coverage,and Statement Bias
Diego Saez-TrumperUniversitat Pompeu Fabra
Barcelona, [email protected]
Carlos CastilloQCRI
Doha, [email protected]
Mounia LalmasYahoo! Labs
Barcelona, [email protected]
ABSTRACTWe examine biases in online news sources and social me-dia communities around them. To that end, we introduceunsupervised methods considering three types of biases: se-lection or “gatekeeping” bias, coverage bias, and statementbias, characterizing each one through a series of metrics.Our results, obtained by analyzing 80 international newssources during a two-week period, show that biases are sub-tle but observable, and follow geographical boundaries moreclosely than political ones. We also demonstrate how thesebiases are to some extent amplified by social media.
Categories and Subject DescriptorsH.1.2 [User/Machine Systems]: Human information pro-cessing
General TermsMeasurement, Human Factors
KeywordsOnline News, Framing, News Bias
1. INTRODUCTIONWhat is published by the news media depends on numer-
ous factors, an important one being the newsworthiness ofa story, but also factors such a space constraint, timeliness,and how close a story is to readers in a geographical and cul-tural sense [7]. Since it is impossible to report everything,selectivity is inevitable. Nonetheless, reputable news mediaare expected to be objective in which stories they report andhow they report them; their role is to inform people aboutwhat is happening either locally, nationally or worldwide.
It is however known that media bias exists. For instance,Fox News has been formally accused of misrepresenting facts
Permission to make digital or hard copies of all or part of this work for personal orclassroom use is granted without fee provided that copies are not made or distributedfor profit or commercial advantage and that copies bear this notice and the full citationon the first page. Copyrights for components of this work owned by others than theauthor(s) must be honored. Abstracting with credit is permitted. To copy otherwise, orrepublish, to post on servers or to redistribute to lists, requires prior specific permissionand/or a fee. Request permissions from [email protected]’13, October 27–November 01 2013, San Francisco, CA, USACopyright is held by the owner/author(s). Publication rights licensed to ACM.ACM 978-1-4503-2263-8/13/10 ... $15.00.http://dx.doi.org/10.1145/2505515.2505623.
in an effort to appeal to conservative viewers.1 Exposureto biases in news reporting has numerous consequences. Ithas been shown to have the capability to foster intoleranceas well as ideological segregation, and even antagonisms inmajor political and social issues [8]. Bias can also affectvoting behavior, depending on the degree and direction ofit, and on voters’ reliance on media [6, 10]. Being aware,tracking, and overcoming bias in news reporting is importantfor a fair society, as media indeed has the power to shape ademocratic society.
Twitter is a major component of the online news ecosys-tem. Once passive, users consuming news online filter newsand discuss what media publish on Twitter. Social mediacan play a major role in terms of overcoming biases, sincesocial media users can freely (in principle) report on currentevents showing other angles of a story, and also help us un-derstand the presence of bias in the news online ecosystem.In this paper, we focus on the latter.
Bias can happen in a number of ways [19]: which storiesare selected, selection bias, how much attention is given to astory, coverage bias, and how a story is reported, statementbias. We analyze data from dozens of international newsmedia organizations to answer how can we quantify biases inonline news? Naturally, we do not expect that media biascan be reduced to a single quantity or metric. Therefore,for each type of bias, we introduce a set of metrics thatcapture different aspects of it. Our main contributions arethe following:
• We introduce unsupervised methods to characterizebiases in online news media and in their communitiesin social media.
• We demonstrate multiple metrics that capture geo-graphical and political biases in a large sample of in-ternational news media.
• We describe how, in some cases, biases in social mediaare amplified with respect to traditional news sources.
2. DEFINITIONSThis section introduces the concepts we use in this paper.
We start with three definitions.
News article. An online news article or simply “article”is any document with a publicly-accessible URL, posted onone of the news websites we follow.
1http://www.guardian.co.uk/media/2004/jun/15/broadcasting.ofcom
News story. An online news story or simply “story” isa collection of several articles that are strongly related to aseminal event [15], e.g. “Death of former UK PM Thatcher”.
Entity. We focus on people mentioned in the news, i.e.named entities of type person appearing in the content ofnews articles or Twitter messages. This typically includespoliticians, athletes, and artists, among many others.
2.1 BiasBias is offering a partial perspective on facts [18]. The
degree to which bias is present on a text is often subjectof considerable debate. We consider three types of bias,following the work by [5]:
Selection bias or gatekeeping. In partisan politics, thepreference for selecting stories from one party. We observeselection bias by determining which media/community cov-ers a certain story or person.
Coverage bias. In partisan politics, the preference forgiving a larger amount of coverage (time/space) to storiesabout one party. We observe coverage bias by looking at theamount of attention each story or person is given.
Statement bias. In partisan politics, the preference forexpressing more favorable (or more disfavorable) statementsfor one party. We observe statement bias by looking at thesentiments in statements mentioning different people.
2.2 Social media news communitiesAll of the news sources we study have a community of
social media users who follows and reposts their stories insocial media. There are at least two ways in which thesecommunities can be understood. On one hand, social mediacommunities can be considered a type of “fan” of the newssource. On the other hand, some community members canalso be considered as part of the interpretive community ofnews [24], as they are becoming more accustomed to par-ticipate actively on the news process (e.g., discovering newstories or placing them into context).
Both interpretations agree that some users will be moreactive than others and motivate our next definition. Wedefine the active social media community of an online newssource (or “community” in the rest of this paper), as theset of users who are regularly exposed to articles from thatsource (most days of the week for instance), are interestedin sharing those articles, and are active in social media. Inthe next section we operationalize this definition.
3. DATA PROCESSINGWe assembled two collections, one containing news articles
and the other containing Twitter messages (“tweets”).2
3.1 Collecting news articlesOur data collection covers a large fraction of the English-
speaking audience of online news. Alexa3 maintains a list ofthe most visited sites on the Web; from this list, we pickedthe top 100 websites under the category “news”. We addedto this list prominent international news sources listed on
2Both collections are available upon request for research pur-poses.3http://www.alexa.com/topsites/category/Top/News
Wikipedia.4 We discarded news aggregators (e.g., Yahoo!News) and websites that do not belong to traditional newsorganizations (e.g., Reddit, The Onion, and PR Web).
Next we determined the RSS feed for each news source,when available, and their corporate Twitter account(s). Anews website may have more than one corporate Twitteraccount. For the cases where they correspond to differentsections of the site (e.g., @BBCWorld and @BBCBusiness), weconsidered each account as a separate news source. For thecases where one account links to a subset of the news postedfrom a second account (e.g., @AJELive and @AJEnglish), wemerged them.
During a period of two weeks in April 2013, we checkedeach source every 30 minutes for new articles. We consideredURLs appearing in the RSS feed (when present), or postedthrough a corporate Twitter account. After downloading,we removed the ancillary elements of each page (commonheaders, footers, navigational elements, etc.) using a ser-vice5 that applies an heuristic based on tag-to-text ratio.Finally, named entities where extracted using Open Calais.6
3.2 Aggregating articles into storiesNews articles can be aggregated into stories that discuss
a common event or topic. In order to create news stories,we measured the cosine similarity of pairs of articles usingTF.IDF weighting. We use the same measure of text sim-ilarity in other tasks throughout the paper. Two articleshaving a similarity larger than θ = 0.4 (set empirically ona hold-out set) were considered equivalent in terms of con-tent. We built a graph containing all articles, joining by anedge all articles having a similarity larger than the thresh-old. Each story corresponds to one connected component ofthis graph, similarly to [25]. These sub-graphs were post-processed to increase precision, ensuring that all articles oneach group were closely related to each other. The post-process consisted in recursively removing all vertices withdegree less than 2.
3.3 Determining social media communitiesThe active social media community of a news source should
include people who are likely to read the news source almostevery day, and who frequently share on Twitter articles fromthat source. For each article from a news source, we collectedthe usernames of all Twitter users who posted that URL7 onTwitter in the first 12 hours after the article’s publication.A recent study [11] showed that almost all shares of newsarticles happen during this period. To avoid automatic ac-counts (bots) we blacklisted all users posting more than 10articles from a single source within a day.8 Twitter’s APIallows to obtain up to 1,500 tweets for each URL, which wasenough for all the articles in our observation period.
We define the community of a news source on a given day,as the set of all the people who have tweeted at least K1
4http://en.wikipedia.org/wiki/International_broadcasting http://en.wikipedia.org/wiki/International_news_channels5http://viewtext.org/ with ratio 0.7.6http://www.opencalais.com/7Shortened URLs (e.g. bit.ly ones) were expanded, andall URLs were normalized by removing unnecessary and/ortracking-related parameters.8We actually observed that many of these accounts werelater removed/deactivated by Twitter.
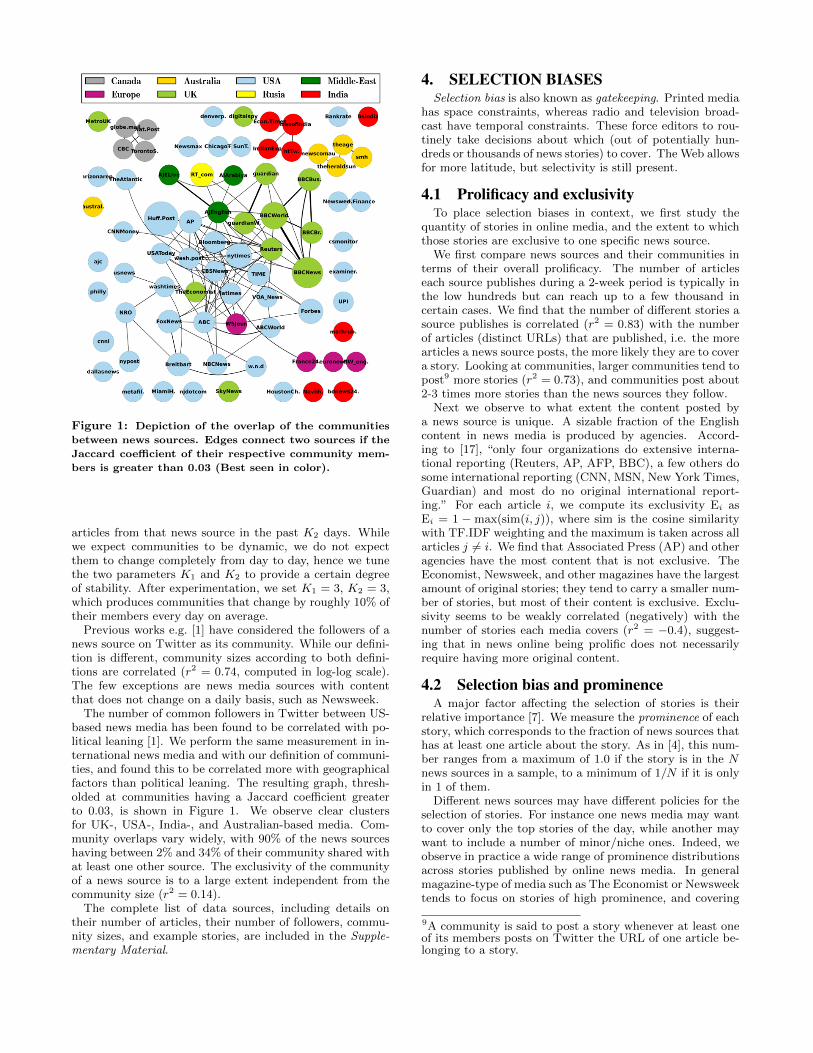
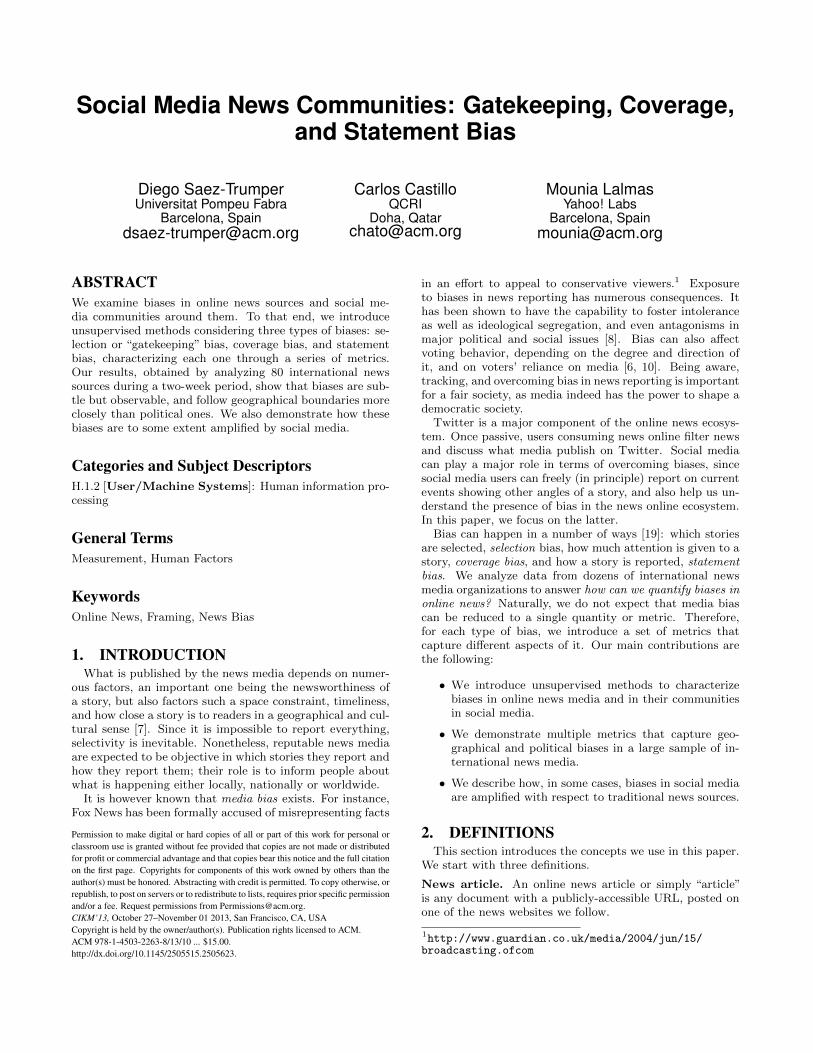
Figure 1: Depiction of the overlap of the communities
between news sources. Edges connect two sources if the
Jaccard coefficient of their respective community mem-
bers is greater than 0.03 (Best seen in color).
articles from that news source in the past K2 days. Whilewe expect communities to be dynamic, we do not expectthem to change completely from day to day, hence we tunethe two parameters K1 and K2 to provide a certain degreeof stability. After experimentation, we set K1 = 3, K2 = 3,which produces communities that change by roughly 10% oftheir members every day on average.
Previous works e.g. [1] have considered the followers of anews source on Twitter as its community. While our defini-tion is different, community sizes according to both defini-tions are correlated (r2 = 0.74, computed in log-log scale).The few exceptions are news media sources with contentthat does not change on a daily basis, such as Newsweek.
The number of common followers in Twitter between US-based news media has been found to be correlated with po-litical leaning [1]. We perform the same measurement in in-ternational news media and with our definition of communi-ties, and found this to be correlated more with geographicalfactors than political leaning. The resulting graph, thresh-olded at communities having a Jaccard coefficient greaterto 0.03, is shown in Figure 1. We observe clear clustersfor UK-, USA-, India-, and Australian-based media. Com-munity overlaps vary widely, with 90% of the news sourceshaving between 2% and 34% of their community shared withat least one other source. The exclusivity of the communityof a news source is to a large extent independent from thecommunity size (r2 = 0.14).
The complete list of data sources, including details ontheir number of articles, their number of followers, commu-nity sizes, and example stories, are included in the Supple-mentary Material.
4. SELECTION BIASESSelection bias is also known as gatekeeping. Printed media
has space constraints, whereas radio and television broad-cast have temporal constraints. These force editors to rou-tinely take decisions about which (out of potentially hun-dreds or thousands of news stories) to cover. The Web allowsfor more latitude, but selectivity is still present.
4.1 Prolificacy and exclusivityTo place selection biases in context, we first study the
quantity of stories in online media, and the extent to whichthose stories are exclusive to one specific news source.
We first compare news sources and their communities interms of their overall prolificacy. The number of articleseach source publishes during a 2-week period is typically inthe low hundreds but can reach up to a few thousand incertain cases. We find that the number of different stories asource publishes is correlated (r2 = 0.83) with the numberof articles (distinct URLs) that are published, i.e. the morearticles a news source posts, the more likely they are to covera story. Looking at communities, larger communities tend topost9 more stories (r2 = 0.73), and communities post about2-3 times more stories than the news sources they follow.
Next we observe to what extent the content posted bya news source is unique. A sizable fraction of the Englishcontent in news media is produced by agencies. Accord-ing to [17], “only four organizations do extensive interna-tional reporting (Reuters, AP, AFP, BBC), a few others dosome international reporting (CNN, MSN, New York Times,Guardian) and most do no original international report-ing.” For each article i, we compute its exclusivity Ei asEi = 1 − max(sim(i, j)), where sim is the cosine similaritywith TF.IDF weighting and the maximum is taken across allarticles j 6= i. We find that Associated Press (AP) and otheragencies have the most content that is not exclusive. TheEconomist, Newsweek, and other magazines have the largestamount of original stories; they tend to carry a smaller num-ber of stories, but most of their content is exclusive. Exclu-sivity seems to be weakly correlated (negatively) with thenumber of stories each media covers (r2 = −0.4), suggest-ing that in news online being prolific does not necessarilyrequire having more original content.
4.2 Selection bias and prominenceA major factor affecting the selection of stories is their
relative importance [7]. We measure the prominence of eachstory, which corresponds to the fraction of news sources thathas at least one article about the story. As in [4], this num-ber ranges from a maximum of 1.0 if the story is in the Nnews sources in a sample, to a minimum of 1/N if it is onlyin 1 of them.
Different news sources may have different policies for theselection of stories. For instance one news media may wantto cover only the top stories of the day, while another maywant to include a number of minor/niche ones. Indeed, weobserve in practice a wide range of prominence distributionsacross stories published by online news media. In generalmagazine-type of media such as The Economist or Newsweektends to focus on stories of high prominence, and covering
9A community is said to post a story whenever at least oneof its members posts on Twitter the URL of one article be-longing to a story.
less stories is correlated with having larger average promi-nence (r2 = −0.51).
Social media, in principle, should allow a broader selectionof stories, including niche ones. In general the prominenceof stories posted by social media communities is significantlysmaller than the prominence of the news media source theyfollow. In particular, stories of large prominence are notposted as often by social media users. Two factors maycontribute to this. First, given that social media users donot need to appeal to a broad audience, they may have astronger preference for niche content. Second, saturationeffects have been observed in Twitter; [20] demonstratedthat the probability that a user posts something initiallyincreases with the number of exposures to it, but then drops.Both factors may contribute to observing more stories ofsmaller prominence in social media.
Statistics for each data source in terms of exclusivity, aswell as details on our analysis of prolificacy and examples ofprominence distribution for some media can be found in theSupplementary Material.
4.3 Selection bias and geographyNext we compare news media according to the overlap in
the stories they post, measured by computing for every pairof media the Jaccard coefficient of their sets of stories. In
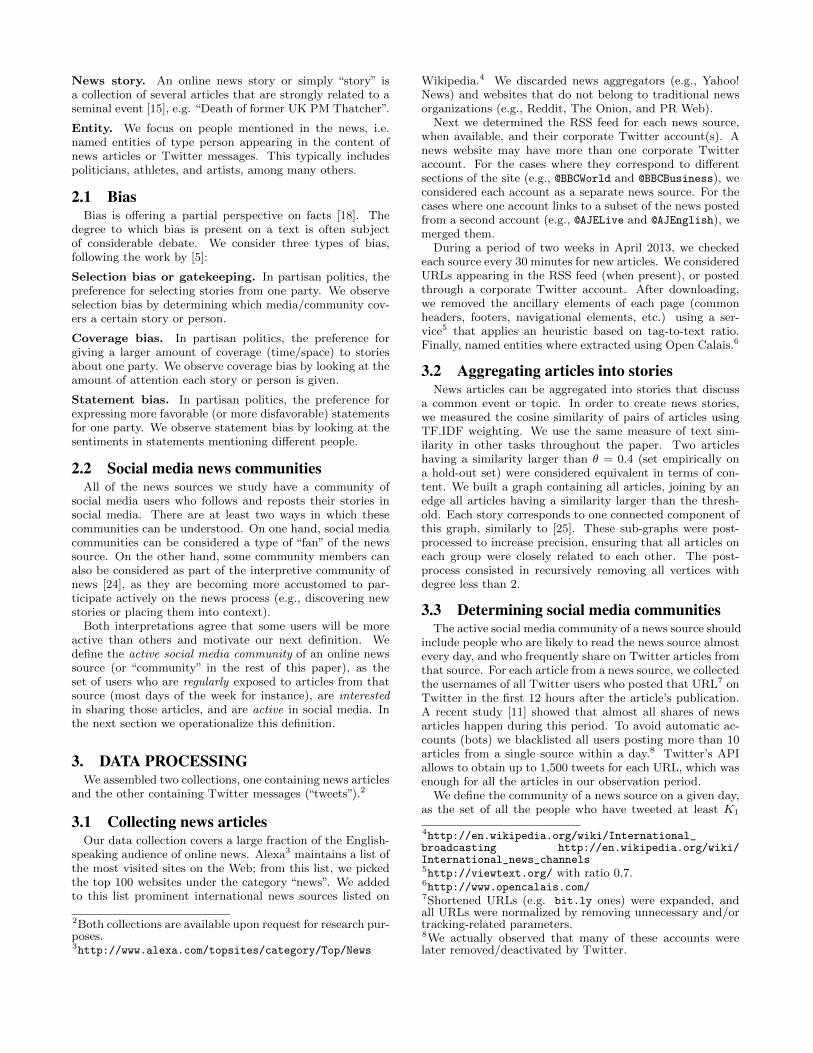
(a) Selection biasin sources
(b) Selection biasin communities
(c) Coverage biasin sources (#words)
(d) Coverage bias in communities (#tweets)
Figure 2: Similarity according to selection bias in (a)
and (b). Similarity according to coverage bias in (c) and
(d) (Best seen in color.)
order to visualize this similarity matrix, we project it in twodimensions using Principal Component Analysis (PCA).
The result is shown in Figures 2(a) for news sources and 2(b)for social media communities. For online news sources, thereis a clear separation between US-based media and the rest.In social media communities, there is much more mixingof different regions. This means that US-based news me-dia tends to agree in their selection of stories, while theircommunities in social media are interested in a more diverserange of issues. However, as shown next in Section 5.2, theyboth tend to be more geographically homogeneous whenlooking at the amount of attention they devote to stories.
5. COVERAGE BIASCoverage bias is a preference for giving more airtime, space,
or attention to some issues in contrast to others [5]. Whiletwo news media may publish articles about the same story,it might be the case that one gives the story much moreattention than the other.
5.1 Measuring coverage biasThere are several ways in which the distribution of at-
tention given to stories can be quantified. In each newssource, we can look at the length of the articles coveringthe story, counting words and adding across multiple arti-cles of the same story, when necessary. In social media, wecount the number of tweets containing links to articles on agiven story. Communities tend to be influenced by the newsmedia source they follow. A story prominently displayedand promoted by traditional news sources should obtain alarger number of social media reactions from its community.In addition to observing the distribution of coverage of sto-ries, we can also quantify coverage biases in the treatmentof different people, by measuring the distribution of numberof mentions per person across different media. These dis-tributions are compared by using the Jensen-Shannon (JS)divergence between them for each pair of news sources, andfor each pair of social media communities. Coverage bias bystory words and by people mentions are somewhat correlated(r = 0.68). Interestingly, news media coverage as measuredby the length of the stories is correlated with the one ob-served in the distribution of social media reactions acrossall communities (r = 0.84), but not so correlated with thedistribution of tweets in each media’s community (r = 0.40).This is in agreement with classical results by [13]; the im-portance given by people to different issues tends to be morecorrelated with media as a whole than with the specific me-dia source(s) each person follows.
More details on the correlations between selection andcoverage bias can be found in the Supplementary Material.
5.2 Coverage bias, geography, and politicsWe measure the extent of coverage bias with respect to
geographical regions and partisan politics.The distribution of the coverage of different stories, as
measured in terms of number of words, is strongly corre-lated with geographical regions, as shown in Figure 2(c).The same happens if we look at the distribution of tweetsgiven to different stories by communities, depicted in Fig-ure 2(d). In both cases, the geographical biases are moreevident than when measured using selection-bias metrics.This means that, as expected [7], news media tends to writearticles about the country/region where they are based, and
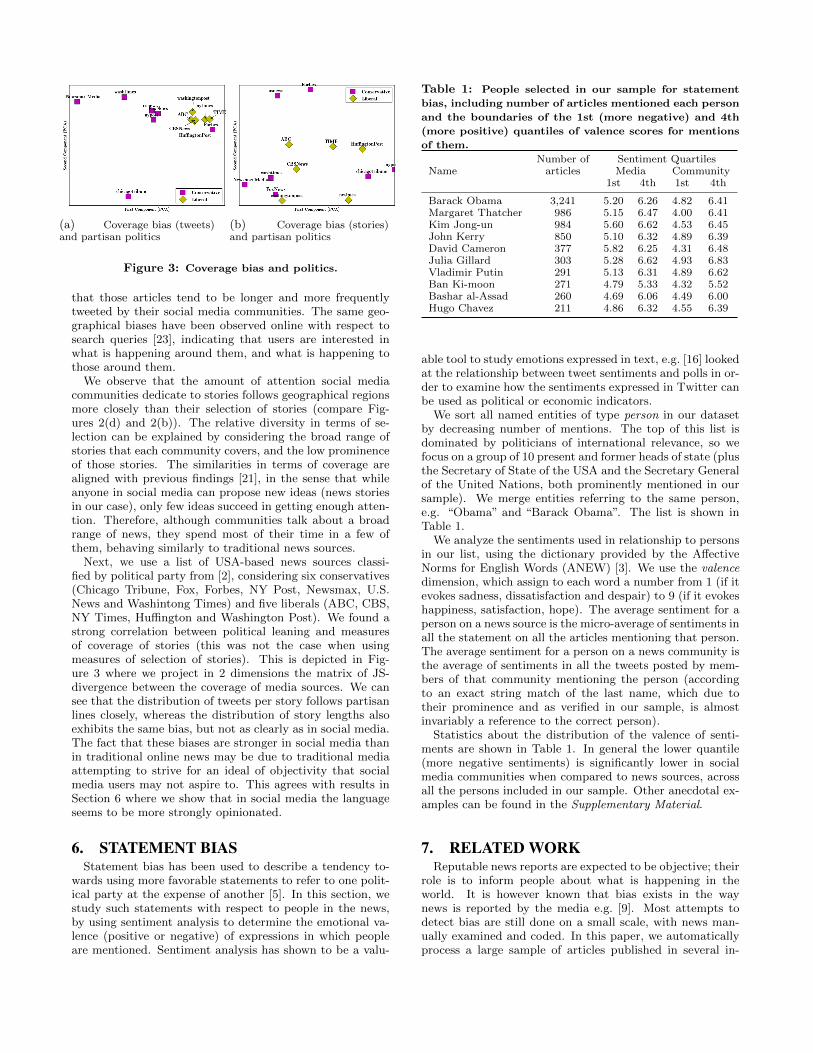
(a) Coverage bias (tweets)and partisan politics
(b) Coverage bias (stories)and partisan politics
Figure 3: Coverage bias and politics.
that those articles tend to be longer and more frequentlytweeted by their social media communities. The same geo-graphical biases have been observed online with respect tosearch queries [23], indicating that users are interested inwhat is happening around them, and what is happening tothose around them.
We observe that the amount of attention social mediacommunities dedicate to stories follows geographical regionsmore closely than their selection of stories (compare Fig-ures 2(d) and 2(b)). The relative diversity in terms of se-lection can be explained by considering the broad range ofstories that each community covers, and the low prominenceof those stories. The similarities in terms of coverage arealigned with previous findings [21], in the sense that whileanyone in social media can propose new ideas (news storiesin our case), only few ideas succeed in getting enough atten-tion. Therefore, although communities talk about a broadrange of news, they spend most of their time in a few ofthem, behaving similarly to traditional news sources.
Next, we use a list of USA-based news sources classi-fied by political party from [2], considering six conservatives(Chicago Tribune, Fox, Forbes, NY Post, Newsmax, U.S.News and Washintong Times) and five liberals (ABC, CBS,NY Times, Huffington and Washington Post). We found astrong correlation between political leaning and measuresof coverage of stories (this was not the case when usingmeasures of selection of stories). This is depicted in Fig-ure 3 where we project in 2 dimensions the matrix of JS-divergence between the coverage of media sources. We cansee that the distribution of tweets per story follows partisanlines closely, whereas the distribution of story lengths alsoexhibits the same bias, but not as clearly as in social media.The fact that these biases are stronger in social media thanin traditional online news may be due to traditional mediaattempting to strive for an ideal of objectivity that socialmedia users may not aspire to. This agrees with results inSection 6 where we show that in social media the languageseems to be more strongly opinionated.
6. STATEMENT BIASStatement bias has been used to describe a tendency to-
wards using more favorable statements to refer to one polit-ical party at the expense of another [5]. In this section, westudy such statements with respect to people in the news,by using sentiment analysis to determine the emotional va-lence (positive or negative) of expressions in which peopleare mentioned. Sentiment analysis has shown to be a valu-
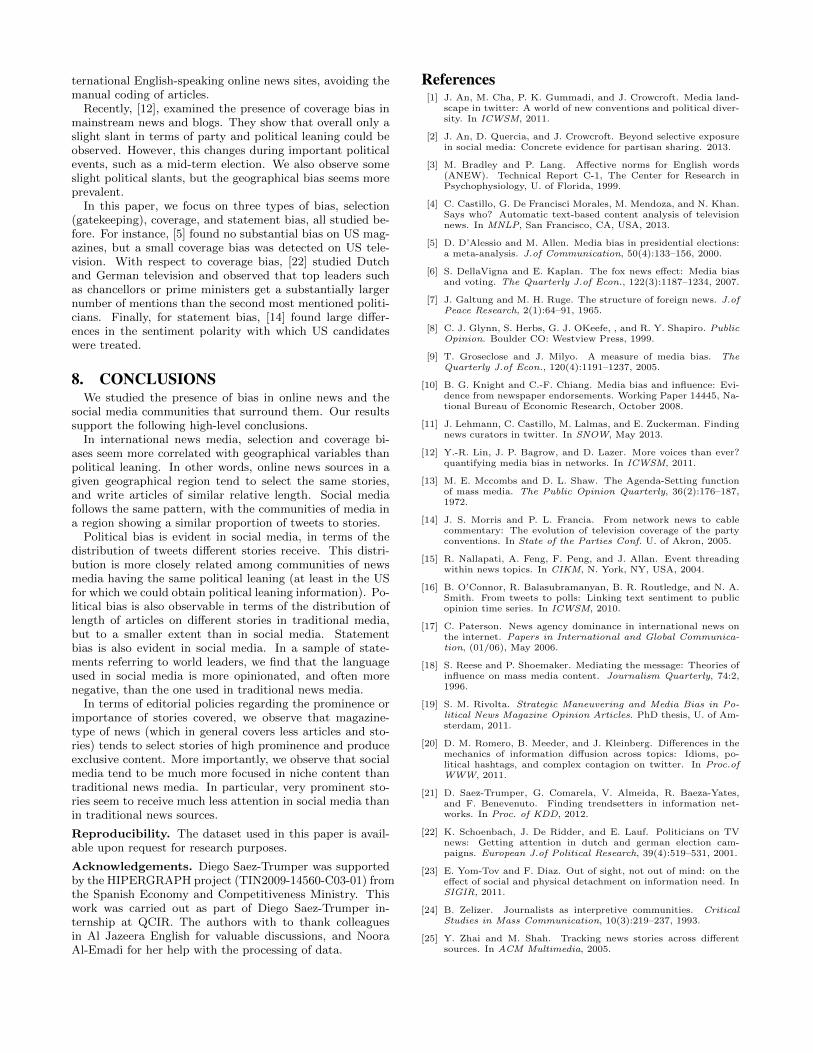
Table 1: People selected in our sample for statement
bias, including number of articles mentioned each person
and the boundaries of the 1st (more negative) and 4th
(more positive) quantiles of valence scores for mentions
of them.
Number of Sentiment QuartilesName articles Media Community
1st 4th 1st 4th
Barack Obama 3,241 5.20 6.26 4.82 6.41Margaret Thatcher 986 5.15 6.47 4.00 6.41Kim Jong-un 984 5.60 6.62 4.53 6.45John Kerry 850 5.10 6.32 4.89 6.39David Cameron 377 5.82 6.25 4.31 6.48Julia Gillard 303 5.28 6.62 4.93 6.83Vladimir Putin 291 5.13 6.31 4.89 6.62Ban Ki-moon 271 4.79 5.33 4.32 5.52Bashar al-Assad 260 4.69 6.06 4.49 6.00Hugo Chavez 211 4.86 6.32 4.55 6.39
able tool to study emotions expressed in text, e.g. [16] lookedat the relationship between tweet sentiments and polls in or-der to examine how the sentiments expressed in Twitter canbe used as political or economic indicators.
We sort all named entities of type person in our datasetby decreasing number of mentions. The top of this list isdominated by politicians of international relevance, so wefocus on a group of 10 present and former heads of state (plusthe Secretary of State of the USA and the Secretary Generalof the United Nations, both prominently mentioned in oursample). We merge entities referring to the same person,e.g. “Obama” and “Barack Obama”. The list is shown inTable 1.
We analyze the sentiments used in relationship to personsin our list, using the dictionary provided by the AffectiveNorms for English Words (ANEW) [3]. We use the valencedimension, which assign to each word a number from 1 (if itevokes sadness, dissatisfaction and despair) to 9 (if it evokeshappiness, satisfaction, hope). The average sentiment for aperson on a news source is the micro-average of sentiments inall the statement on all the articles mentioning that person.The average sentiment for a person on a news community isthe average of sentiments in all the tweets posted by mem-bers of that community mentioning the person (accordingto an exact string match of the last name, which due totheir prominence and as verified in our sample, is almostinvariably a reference to the correct person).
Statistics about the distribution of the valence of senti-ments are shown in Table 1. In general the lower quantile(more negative sentiments) is significantly lower in socialmedia communities when compared to news sources, acrossall the persons included in our sample. Other anecdotal ex-amples can be found in the Supplementary Material.
7. RELATED WORKReputable news reports are expected to be objective; their
role is to inform people about what is happening in theworld. It is however known that bias exists in the waynews is reported by the media e.g. [9]. Most attempts todetect bias are still done on a small scale, with news man-ually examined and coded. In this paper, we automaticallyprocess a large sample of articles published in several in-
ternational English-speaking online news sites, avoiding themanual coding of articles.
Recently, [12], examined the presence of coverage bias inmainstream news and blogs. They show that overall only aslight slant in terms of party and political leaning could beobserved. However, this changes during important politicalevents, such as a mid-term election. We also observe someslight political slants, but the geographical bias seems moreprevalent.
In this paper, we focus on three types of bias, selection(gatekeeping), coverage, and statement bias, all studied be-fore. For instance, [5] found no substantial bias on US mag-azines, but a small coverage bias was detected on US tele-vision. With respect to coverage bias, [22] studied Dutchand German television and observed that top leaders suchas chancellors or prime ministers get a substantially largernumber of mentions than the second most mentioned politi-cians. Finally, for statement bias, [14] found large differ-ences in the sentiment polarity with which US candidateswere treated.
8. CONCLUSIONSWe studied the presence of bias in online news and the
social media communities that surround them. Our resultssupport the following high-level conclusions.
In international news media, selection and coverage bi-ases seem more correlated with geographical variables thanpolitical leaning. In other words, online news sources in agiven geographical region tend to select the same stories,and write articles of similar relative length. Social mediafollows the same pattern, with the communities of media ina region showing a similar proportion of tweets to stories.
Political bias is evident in social media, in terms of thedistribution of tweets different stories receive. This distri-bution is more closely related among communities of newsmedia having the same political leaning (at least in the USfor which we could obtain political leaning information). Po-litical bias is also observable in terms of the distribution oflength of articles on different stories in traditional media,but to a smaller extent than in social media. Statementbias is also evident in social media. In a sample of state-ments referring to world leaders, we find that the languageused in social media is more opinionated, and often morenegative, than the one used in traditional news media.
In terms of editorial policies regarding the prominence orimportance of stories covered, we observe that magazine-type of news (which in general covers less articles and sto-ries) tends to select stories of high prominence and produceexclusive content. More importantly, we observe that socialmedia tend to be much more focused in niche content thantraditional news media. In particular, very prominent sto-ries seem to receive much less attention in social media thanin traditional news sources.
Reproducibility. The dataset used in this paper is avail-able upon request for research purposes.
Acknowledgements. Diego Saez-Trumper was supportedby the HIPERGRAPH project (TIN2009-14560-C03-01) fromthe Spanish Economy and Competitiveness Ministry. Thiswork was carried out as part of Diego Saez-Trumper in-ternship at QCIR. The authors with to thank colleaguesin Al Jazeera English for valuable discussions, and NooraAl-Emadi for her help with the processing of data.
References[1] J. An, M. Cha, P. K. Gummadi, and J. Crowcroft. Media land-
scape in twitter: A world of new conventions and political diver-sity. In ICWSM, 2011.
[2] J. An, D. Quercia, and J. Crowcroft. Beyond selective exposurein social media: Concrete evidence for partisan sharing. 2013.
[3] M. Bradley and P. Lang. Affective norms for English words(ANEW). Technical Report C-1, The Center for Research inPsychophysiology, U. of Florida, 1999.
[4] C. Castillo, G. De Francisci Morales, M. Mendoza, and N. Khan.Says who? Automatic text-based content analysis of televisionnews. In MNLP, San Francisco, CA, USA, 2013.
[5] D. D’Alessio and M. Allen. Media bias in presidential elections:a meta-analysis. J.of Communication, 50(4):133–156, 2000.
[6] S. DellaVigna and E. Kaplan. The fox news effect: Media biasand voting. The Quarterly J.of Econ., 122(3):1187–1234, 2007.
[7] J. Galtung and M. H. Ruge. The structure of foreign news. J.ofPeace Research, 2(1):64–91, 1965.
[8] C. J. Glynn, S. Herbs, G. J. OKeefe, , and R. Y. Shapiro. PublicOpinion. Boulder CO: Westview Press, 1999.
[9] T. Groseclose and J. Milyo. A measure of media bias. TheQuarterly J.of Econ., 120(4):1191–1237, 2005.
[10] B. G. Knight and C.-F. Chiang. Media bias and influence: Evi-dence from newspaper endorsements. Working Paper 14445, Na-tional Bureau of Economic Research, October 2008.
[11] J. Lehmann, C. Castillo, M. Lalmas, and E. Zuckerman. Findingnews curators in twitter. In SNOW, May 2013.
[12] Y.-R. Lin, J. P. Bagrow, and D. Lazer. More voices than ever?quantifying media bias in networks. In ICWSM, 2011.
[13] M. E. Mccombs and D. L. Shaw. The Agenda-Setting functionof mass media. The Public Opinion Quarterly, 36(2):176–187,1972.
[14] J. S. Morris and P. L. Francia. From network news to cablecommentary: The evolution of television coverage of the partyconventions. In State of the Parties Conf. U. of Akron, 2005.
[15] R. Nallapati, A. Feng, F. Peng, and J. Allan. Event threadingwithin news topics. In CIKM, N. York, NY, USA, 2004.
[16] B. O’Connor, R. Balasubramanyan, B. R. Routledge, and N. A.Smith. From tweets to polls: Linking text sentiment to publicopinion time series. In ICWSM, 2010.
[17] C. Paterson. News agency dominance in international news onthe internet. Papers in International and Global Communica-tion, (01/06), May 2006.
[18] S. Reese and P. Shoemaker. Mediating the message: Theories ofinfluence on mass media content. Journalism Quarterly, 74:2,1996.
[19] S. M. Rivolta. Strategic Maneuvering and Media Bias in Po-litical News Magazine Opinion Articles. PhD thesis, U. of Am-sterdam, 2011.
[20] D. M. Romero, B. Meeder, and J. Kleinberg. Differences in themechanics of information diffusion across topics: Idioms, po-litical hashtags, and complex contagion on twitter. In Proc.ofWWW, 2011.
[21] D. Saez-Trumper, G. Comarela, V. Almeida, R. Baeza-Yates,and F. Benevenuto. Finding trendsetters in information net-works. In Proc. of KDD, 2012.
[22] K. Schoenbach, J. De Ridder, and E. Lauf. Politicians on TVnews: Getting attention in dutch and german election cam-paigns. European J.of Political Research, 39(4):519–531, 2001.
[23] E. Yom-Tov and F. Diaz. Out of sight, not out of mind: on theeffect of social and physical detachment on information need. InSIGIR, 2011.
[24] B. Zelizer. Journalists as interpretive communities. CriticalStudies in Mass Communication, 10(3):219–237, 1993.
[25] Y. Zhai and M. Shah. Tracking news stories across differentsources. In ACM Multimedia, 2005.
Supplementary Material – Social Media News Communities:
Gatekeeping, Coverage, and Statement Bias
This document contains supplementary materials to the paper “Social Media News Communities: Gatekeeping,Coverage, and Statement Bias.”
1 Data processing
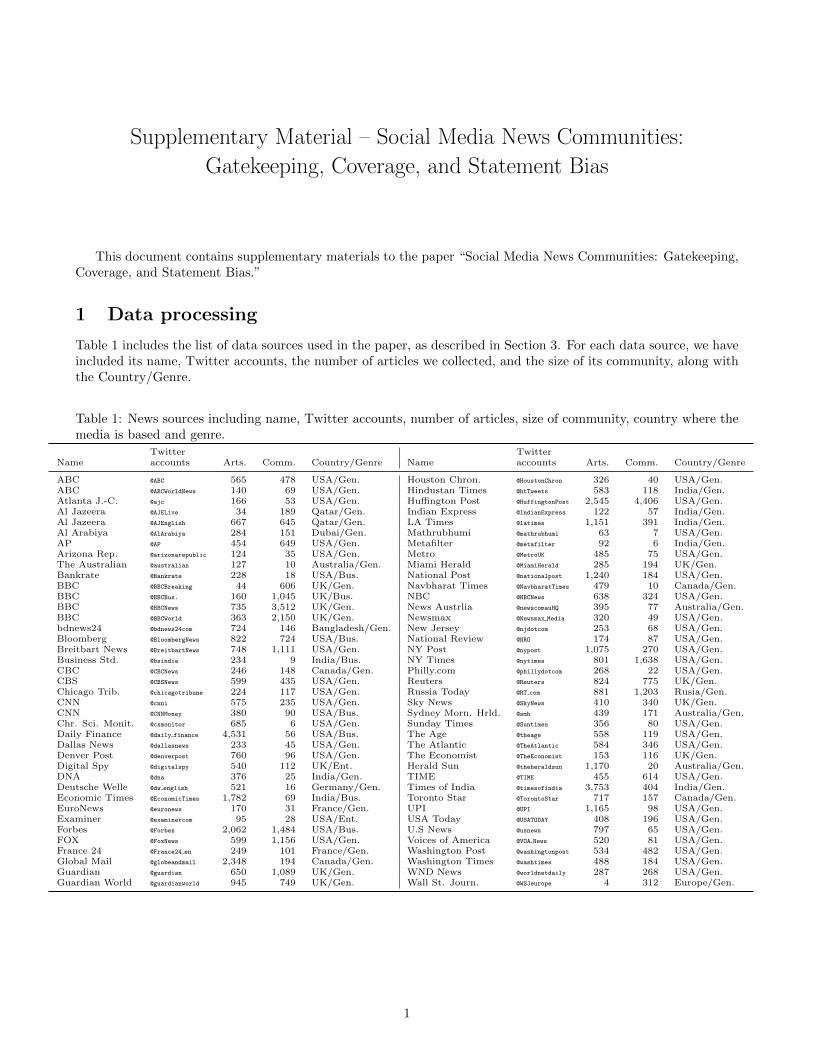
Table 1 includes the list of data sources used in the paper, as described in Section 3. For each data source, we haveincluded its name, Twitter accounts, the number of articles we collected, and the size of its community, along withthe Country/Genre.
Table 1: News sources including name, Twitter accounts, number of articles, size of community, country where themedia is based and genre.
Twitter TwitterName accounts Arts. Comm. Country/Genre Name accounts Arts. Comm. Country/Genre
ABC @ABC 565 478 USA/Gen. Houston Chron. @HoustonChron 326 40 USA/Gen.ABC @ABCWorldNews 140 69 USA/Gen. Hindustan Times @htTweets 583 118 India/Gen.Atlanta J.-C. @ajc 166 53 USA/Gen. Huffington Post @HuffingtonPost 2,545 4,406 USA/Gen.Al Jazeera @AJELive 34 189 Qatar/Gen. Indian Express @IndianExpress 122 57 India/Gen.Al Jazeera @AJEnglish 667 645 Qatar/Gen. LA Times @latimes 1,151 391 India/Gen.Al Arabiya @AlArabiya 284 151 Dubai/Gen. Mathrubhumi @mathrubhumi 63 7 USA/Gen.AP @AP 454 649 USA/Gen. Metafilter @metafilter 92 6 India/Gen.Arizona Rep. @arizonarepublic 124 35 USA/Gen. Metro @MetroUK 485 75 USA/Gen.The Australian @australian 127 10 Australia/Gen. Miami Herald @MiamiHerald 285 194 UK/Gen.Bankrate @Bankrate 228 18 USA/Bus. National Post @nationalpost 1,240 184 USA/Gen.BBC @BBCBreaking 44 606 UK/Gen. Navbharat Times @NavbharatTimes 479 10 Canada/Gen.BBC @BBCBus. 160 1,045 UK/Bus. NBC @NBCNews 638 324 USA/Gen.BBC @BBCNews 735 3,512 UK/Gen. News Austrlia @newscomauHQ 395 77 Australia/Gen.BBC @BBCWorld 363 2,150 UK/Gen. Newsmax @Newsmax Media 320 49 USA/Gen.bdnews24 @bdnews24com 724 146 Bangladesh/Gen. New Jersey @njdotcom 253 68 USA/Gen.Bloomberg @BloombergNews 822 724 USA/Bus. National Review @NRO 174 87 USA/Gen.Breitbart News @BreitbartNews 748 1,111 USA/Gen. NY Post @nypost 1,075 270 USA/Gen.Business Std. @bsindia 234 9 India/Bus. NY Times @nytimes 801 1,638 USA/Gen.CBC @CBCNews 246 148 Canada/Gen. Philly.com @phillydotcom 268 22 USA/Gen.CBS @CBSNews 599 435 USA/Gen. Reuters @Reuters 824 775 UK/Gen.Chicago Trib. @chicagotribune 224 117 USA/Gen. Russia Today @RT com 881 1,203 Rusia/Gen.CNN @cnni 575 235 USA/Gen. Sky News @SkyNews 410 340 UK/Gen.CNN @CNNMoney 380 90 USA/Bus. Sydney Morn. Hrld. @smh 439 171 Australia/Gen.Chr. Sci. Monit. @csmonitor 685 6 USA/Gen. Sunday Times @Suntimes 356 80 USA/Gen.Daily Finance @daily finance 4,531 56 USA/Bus. The Age @theage 558 119 USA/Gen.Dallas News @dallasnews 233 45 USA/Gen. The Atlantic @TheAtlantic 584 346 USA/Gen.Denver Post @denverpost 760 96 USA/Gen. The Economist @TheEconomist 153 116 UK/Gen.Digital Spy @digitalspy 540 112 UK/Ent. Herald Sun @theheraldsun 1,170 20 Australia/Gen.DNA @dna 376 25 India/Gen. TIME @TIME 455 614 USA/Gen.Deutsche Welle @dw english 521 16 Germany/Gen. Times of India @timesofindia 3,753 404 India/Gen.Economic Times @EconomicTimes 1,782 69 India/Bus. Toronto Star @TorontoStar 717 157 Canada/Gen.EuroNews @euronews 170 31 France/Gen. UPI @UPI 1,165 98 USA/Gen.Examiner @examinercom 95 28 USA/Ent. USA Today @USATODAY 408 196 USA/Gen.Forbes @Forbes 2,062 1,484 USA/Bus. U.S News @usnews 797 65 USA/Gen.FOX @FoxNews 599 1,156 USA/Gen. Voices of America @VOA News 520 81 USA/Gen.France 24 @France24 en 249 101 France/Gen. Washington Post @washingtonpost 534 482 USA/Gen.Global Mail @globeandmail 2,348 194 Canada/Gen. Washington Times @washtimes 488 184 USA/Gen.Guardian @guardian 650 1,089 UK/Gen. WND News @worldnetdaily 287 268 USA/Gen.Guardian World @guardianworld 945 749 UK/Gen. Wall St. Journ. @WSJeurope 4 312 Europe/Gen.
1
Examples of stories found using the method in Sec-tion 3.2 are listed on Table 2.
Table 2: Examples of stories found in our dataset.
Story (date 2013) Arts. Sources Tweets Comms.
Former UK PM MargaretThatcher dies (Apr 9th)
309 67 49K 51
Tensions in the Koreanpeninsula (Apr 11th)
402 62 53K 48
Presidental elections inVenezuela (Apr 13th)
18 16 1.2K 52
The correlation of r2 = 0.74 described in Section 3.3is supported by Figure 1.
Figure 1: Number of followers of the corporate accountof each news source versus size of the (active) com-munity of each source. These quantities are correlated(r2 = 0.74), but communities are 3 orders of magnitudesmaller than the number of followers.
2 Selection biases
The correlations described in Section 4.1 are a sub-setof those found in Table 3.
Table 3: Correlation between quantities of articles andstories and community sizes. The table shows the Per-son correlation between the logarithm of the metrics.
MA MS TF TS TP Median
MA. Articles in media - 454MS. Stories in media 0.83 - 98TF. Followers of media 0.36 0.49 - 105 KTS. Stories in comm. 0.29 0.48 0.80 - 263TP. People in comm. 0.23 0.38 0.74 0.73 - 117
The fraction of exclusive stories per each data sourceis depicted in Figure 2
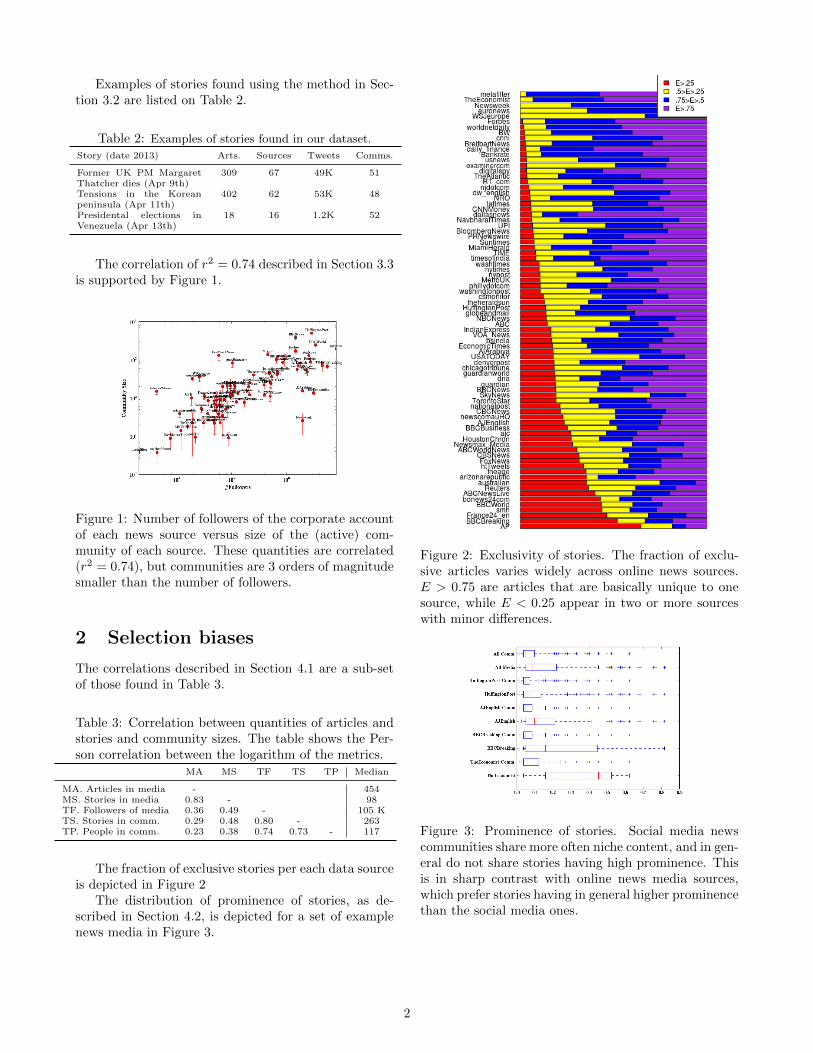
The distribution of prominence of stories, as de-scribed in Section 4.2, is depicted for a set of examplenews media in Figure 3.
Figure 2: Exclusivity of stories. The fraction of exclu-sive articles varies widely across online news sources.E > 0.75 are articles that are basically unique to onesource, while E < 0.25 appear in two or more sourceswith minor differences.
Figure 3: Prominence of stories. Social media newscommunities share more often niche content, and in gen-eral do not share stories having high prominence. Thisis in sharp contrast with online news media sources,which prefer stories having in general higher prominencethan the social media ones.
2
3 Coverage bias
Table 4 presents more correlations between selectionand coverage biases, as described in Section 5.1.
Table 4: Correlation between selection and coverage bi-ases as presented by news media sources. Correlationsabove 0.8 between different biases are shown in bold-face.
SS SP CS CP CT CT’
SS. Selection bias by sto-ries
1 - - - - -
SP. Selection bias bypeople
0.66 1 - - - -
CS. Coverage bias bystory words
0.81 0.63 1 - - -
CP. Coverage bias bypeople mentions
0.68 0.94 0.68 1 - -
CT. Coverage bias bytweets (all)
0.65 0.53 0.84 0.60 1 -
CT’. Coverage bias bytweets (community)
0.30 0.22 0.40 0.28 0.37 1
4 Statement bias
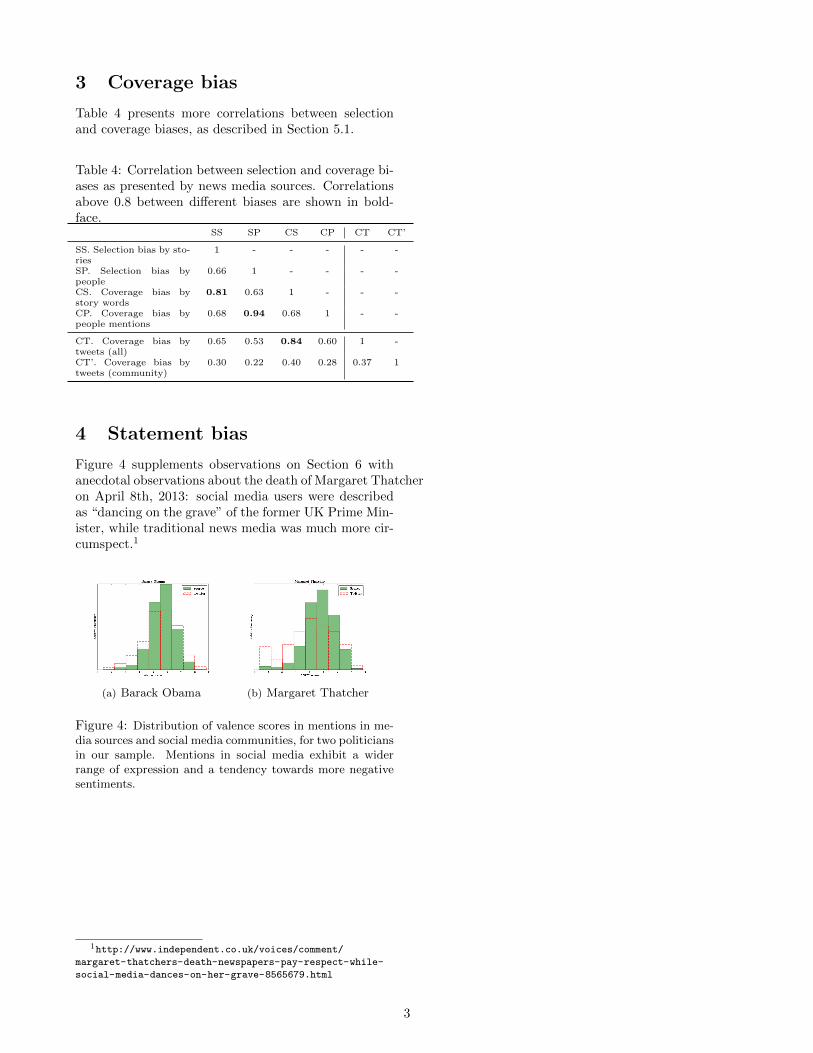
Figure 4 supplements observations on Section 6 withanecdotal observations about the death of Margaret Thatcheron April 8th, 2013: social media users were describedas “dancing on the grave” of the former UK Prime Min-ister, while traditional news media was much more cir-cumspect.1
(a) Barack Obama (b) Margaret Thatcher
Figure 4: Distribution of valence scores in mentions in me-dia sources and social media communities, for two politiciansin our sample. Mentions in social media exhibit a widerrange of expression and a tendency towards more negativesentiments.
1http://www.independent.co.uk/voices/comment/
margaret-thatchers-death-newspapers-pay-respect-while-
social-media-dances-on-her-grave-8565679.html
3