Embed Size (px)
Citation preview

Competition, Gatekeeping, and Health Care Access
Geir Godager�
Tor Iversen�
Ching-to Albert Ma��
May 2013
Abstract
We study gatekeeping physicians�referrals of patients to specialty care. We derive two theoret-ical results when competition in the physician market intensi�es. First, physicians refer patientsto specialty care more often due to competitive pressure. Second, physicians earn more by treat-ing patients themselves, so refer patients to specialty care less often. We assess empirically theoverall e¤ect of competition with data from a Norwegian survey in 2008-9 and Statistics Norway.From the data we construct three measures of competition: the number of open primary physicianpractices with and without population adjustment, and the Her�ndahl-Hirschman Index. The em-pirical results suggest that competition has negligible or small positive e¤ects on referrals overall.Our results do not support the policy claim that increasing the number of primary care physiciansreduces secondary care.
Acknowledgement: We are grateful to the Research Council of Norway for �nancial supportthrough the Health Economics Research Program at the University of Oslo (HERO). Tinna As-geirsdottir, and seminar participants at Boston University, Indiana University Purdue UniversityIndianapolis, Stony Brook University, Universidad Computense de Madrid, the 31st Nordic HealthEconomists Study Group Meeting in Umeå, Sweden, the 4th Biennial Conference of the AmericanSociety of Health Economists in Minneapolis, the 8th European Conference on Health Economicsin Helsinki, and the 8th iHEA World Congress in Toronto gave us useful comments.
�Department of Health Management and Health Economics, University of Oslo;[email protected] and [email protected]��Department of Economics, Boston University and University of Oslo; [email protected]

1 Introduction
Primary health care has generated many policy discussions. In many European countries, each in-
habitant must be enrolled with a primary care physician to receive national health services. In the
United States, Title V of the A¤ordable Health Care Act provides subsidies for the training of pri-
mary care physicians and allied health professionals (see http://www.healthcare.gov/law/full/index.html).
Furthermore, Title IV of the Act promotes prevention, and it is expected that preventive care will
be provided by primary care physicians.
Primary health care is less expensive than secondary and specialty care, so the emphasis on
primary care for cost control is understandable. Perhaps, the most explicit cost-control perspec-
tive is the primary care physician�s gatekeeping function. In many health plans in the U.S. and
European countries, a patient can only obtain specialty care upon a referral made by his primary
care doctor, also referred to as a gatekeeper. In this paper, we model the primary care physician�s
referral decision, and empirically assess the relationship between physician market conditions and
gatekeeping.
A referral decision by a primary care physician or general practitioner (GP) likely depends
on many factors such as medical conditions, current medical practice guidelines, availability of
secondary care, the GP�s service capacity, and �nancial incentives. The current policy recommen-
dation of increasing the number of GPs adds one more dimension to the complex referral decision.
Given a population of patients, more GPs will ultimately mean a more competitive market for the
doctors. This paper studies the relationship between competition in the GP market and a GP�s
referrals of patients to specialist care.
Such a study faces a number of di¢ culties. First, the number of GPs in any market changes
slowly, even under any policy intervention. For example, subsidies in the U.S. A¤ordable Care Act
are for physician training. This �natural�experiment will generate data only after many years, or
perhaps even a decade. Similarly, in an experiment of a long duration, confounding factors a¤ecting
referral decisions will change over time. These changes may be di¢ cult to track or unobservable to
the analyst. Second, in a multi-payer system such as the U.S., di¤erent health plans use di¤erent
incentive contracts. Referral decisions likely will be in�uenced by these incentives. However,
information on physician payment contracts is seldom available.
Our strategy is to use a cross-sectional data set, which can be interpreted as a snapshot that
1

captures long-run changes, because di¤erent locations have had unique experiences for some time.
(For example, di¤erences between two countries at a given point in time result from long-term
cultural developments.) We use data from a 2008-2009 survey in Norway as our primary source, and
supplement them with register data from Statistics Norway, and from the National Health Insurance
Administration. Because data are collected over a one-year period, time-varying confounding factors
are irrelevant. The details of the survey and data are in the next section. Here, we would like to
point out that i) all self-employed Norwegian GPs are paid by the same �nancial contract, ii) 95%
of all Norwegians GPs are self-employed, and iii) each Norwegian should be listed with a GP who
is a gatekeeper for secondary care. In sum, problematic selection issues in multi-payer systems are
avoided.
In Norway, a GP either lets his or her medical practice be open or closed to new patients. We use
the number of open practices (with and without population density adjustments) as a measure of
competition intensity in the GP market. The GP market is more competitive when there are more
open practices because consumers have more options and each GP faces a more elastic demand.
We also use the more conventional Her�ndahl-Hirschman index as an alternative measure. Our use
of the number of open practices in a geographical area as a measure of competition is unique. We
are unaware of any other data set that contains similar information.
Our empirical work seeks to explain specialty referral by competition intensity. We start with
a model of GPs�referral decisions. As in much of the literature, we assume that a GP is guided by
a pro�t motive and a concern for the patient. A GP�s practice style is how he values a patient�s
potential bene�ts from specialty care and pro�ts from providing services himself. Practice styles
are assumed to be a¤ected by market conditions. When the GP market becomes more competitive,
the patient has more options. A GP who wants to retain a patient should adopt a practice style
that values the patient�s bene�ts more. Competition may have a second e¤ect. As the GP market
becomes more competitive, a GP has less patients. Therefore, the GP incurs less disutility when
he treats the patient himself. For a �xed reimbursement rate the net pro�t from providing services
increases.
Competition in the GP market has two opposing e¤ects on referrals. More competition encour-
ages a GP to show more concern for the patient, and therefore increases specialty referral. More
competition also raises a GP�s net pro�t for providing service himself, and therefore decreases spe-
cialty referral. Our model o¤ers this new perspective, and we are able to assess empirically the
2

overall e¤ects of competition on specialty referrals.
The data sets allow us to control for patients�socioeconomic status, age and gender, as well as
self-assessed health and chronic illness conditions. We also control for general and specialty health
care access at the market level. Our (logit and negative binomial) regressions also account for
clustering at the municipality levels. We �nd that competition either has insigni�cant or positive
e¤ects on GPs�referrals for patients to specialty care. In other words, we �nd no evidence that
more competition among GPs will reduce their specialty referrals. Our results do not lend support
to the secondary-care-reduction e¤ect envisioned by a policy that promotes primary care.
Our data do not let us estimate separately the two opposing e¤ects derived from our theoretical
model. This, however, does not make our results less relevant. Our model of referral does capture
the multi-faceted e¤ects of competition on referrals, and an increase in primary care physician
density results in more than a single change. This is an important aspect of the complexity in
physician-patient interaction.
The literature on the primary and secondary health services is huge, whether that literature
refers to health economics, health services research, or medicine. The health economics literature on
the relations between primary and secondary care is smaller but growing. In any case, the interest
in primary care and health cost is topical. Using U.S. data, Baicker and Chandra (2004), and
Chernew et al. (2009) �nd that the percentage of primary care physicians in a market is negatively
associated with Medicare�s reimbursement per bene�ciary. Chernew et al. (2009), however, �nd no
correlation between the percentage of primary care physicians and the growth in Medicare spending;
thus Medicare policies that seek to reduce spending levels, but not growth rates, will ultimately
fail to address cost issues.
Bradley Wright and Ricketts III (2010) use area-level data to show that within a location, a
higher density of primary care physicians is associated with less inpatient admission and emergency
room visits. Fortney et al. (2005) present results from a natural experiment at the U.S. Department
for Veterans A¤airs, in which the number of primary care facilities were increased in some districts
but not in others. Using a di¤erence-in-di¤erence analysis of longitudinal data and instrumental
variables for potential endogeneity problems, they �nd that an increase in primary care encounters
is associated with a decrease in specialty medical encounters. Fortney et al. conclude that primary
care is a substitute for specialist health care. With survey data at the individual-patient level, Atella
and Deb (2008) study whether primary care physicians and secondary specialists are substitutes
3
or complements. They estimate a structural simultaneous equation model where visits to di¤erent
types of physicians are endogeneous. When unobserved heterogeneity is appropriately accounted
for, they �nd that primary care physicians and specialists are substitutes.
We model primary care physicians�referral decisions. The theoretical literature on referrals is
quite rich. Barros and Olivella (2005) study cream skimming due to physicians working in public
service self-referring patients to their own private practice. Biglaiser and Ma (2007) examine the
welfare e¤ects of allowing dual practice and self-referrals. In our model the physician does not
self-refer. Also, the referred specialists can reject referrals; this option has not been considered by
existing papers in the literature.
Allard et al. (2011) consider how referral to secondary care is a¤ected by incentive contracts
for primary care physicians. Jeolvac (2003) compares optimal payment schemes with and without
gatekeeping. Brekke et al. (2007) study the e¤ect of GP gatekeeping on equilibrium quality in
an imperfectly competitive secondary care market. Gonzales (2010) investigates the interactions
between patients and GPs when some patients are informed about whether specialty care is appro-
priate. Our paper does not deal with the issues in these four papers. Our model is parsimonious,
and focuses on competition in the GP market. Yet, it derives a set of predictions that we have
taken to data.
The literature on competition in the health market is extensive; Gaynor and Town (2011)
provide the latest review. It is fair to say that studies of competition have mainly focused on
prices, qualities, costs, and health outcomes, and studies that use U.S. data outnumber those that
use non-U.S. data. We are not aware of another paper that addresses the e¤ect of competition in
the primary care physician market on secondary care referral. Our paper therefore is the �rst to
o¤er some evidence on this issue.
The common measures of competition in the literature are the number of providers (hospitals,
physicians, nursing homes, etc.) within a geographical area, the n-�rm concentration ratio, and the
Her�ndahl-Hirschman Index (see for example Wong et al. (2005)). In a patient-list system such
as Norway, these measures do not capture the fact that patients can switch to another GP only if
they can �nd open practices. We are unaware of any other study that uses the number of open
GP practices as a measure of competition, with one exception Iversen and Ma (2011) show that
more intense competition, measured either by GP open practices or GP�s desired practice sizes,
signi�cantly leads to more diagnostic radiology referrals.
4

The rest of the paper is organized as follows. The next Section describes the Study Setting. A
model of GP referral to either private or public specialist is set up in Section 3. Then we present
our data set and descriptives in Section 4. The estimation results are in Section 5 while concluding
remarks follow in Section 6. Finally, an Appendix contains the proofs of propositions.
2 Study setting
Norway has a three-tier government structure. At the top is the state, the next tier consists of
18 county councils, and the bottom tier consists of 430 municipalities. Norwegians�health care
is covered by a decentralized national health services system. Municipalities are responsible for
primary health care. Since 2002, secondary health care is the responsibility of the state.
Each Norwegian is listed with a primary care physician, or a General Practitioner (GP). The
Norwegian government is concerned about geographical distribution of GPs, and strictly regulates
the entry of new GPs into municipalities. Licenses for GPs to practice at municipalities are allocated
by the Directorate of Health. Patients may switch GPs twice a year, and in a year about 3% of
the patients do so. Patterns of patients switching physicians vary considerably, and depend on
physician characteristics (Iversen and Lurås, 2011). Almost all GPs (95%) are self-employed. A
GP typically contracts with his resident municipality. A GP�s revenue from practicing medicine can
be divided into three roughly equal parts. First, he receives a capitation fee from the contracted
municipality for each listed patient. Second, he receives fee-for-service reimbursements from the
National Insurance Scheme (NIS, a public scheme that is an integral part of the state account)
according to a �xed schedule negotiated between the state and the Norwegian Medical Association.
Third, a GP receives copayments from patients for o¢ ce consultations and tests. All fees and
copayments are set at the national level, without any geographical variations. Hence, to GPS (and
specialists) the payment system is entirely given.
Almost all hospitals in Norway are public. Four Regional Health Authorities (RHAs) manage
public hospitals. A number of private hospitals, both for-pro�t and not-for-pro�t, operate in
Norway. Major private not-for-pro�t hospitals contract with the RHAs, and provide acute and
elective care on the same terms as public hospitals. Private for-pro�t hospitals are very few and are
geographically concentrated around the capital Oslo. The RHAs buy some services from private
for-pro�t hospitals. The remaining services are paid for by private health insurance or by patients
5
directly.
Patients receive specialty outpatient consultations at public hospitals or at private o¢ ces. Spe-
cialists working at public hospitals receive salaries. Most private specialists contract with RHAs.
Such a contract gives a private specialist an annual practice allowance from an RHA and fee-
for-service reimbursements from the NIS. Private specialists are mainly located in urban areas.
Approximately one third of all outpatient consultations are given by private specialists. A patient
pays the same copayment whether the consultation is at a public hospital or a private o¢ ce.
A GP is a gatekeeper. A GP must grant a referral before a patient receives specialty care at
a public hospital or at a private o¢ ce operated by a specialist under an RHA contract. A referral
allows a patient to go to several visits for a de�ned medical condition within a year.
In 2009, the Norwegian government presented a major proposal for reforming the health care
sector (Report No. 47 (2008�2009)). The coordination reform was to solve problems due to low care
quality for patients with chronic diseases, and high care costs. A part of the proposal suggested a
substantial increase in GPs and related resources. However, due to lack of evidence, the Norwegian
parliament rejected this part of the reform. Our research, therefore, provides evidence for this
policy discussion.
3 A model of referral
A patient is under the care of a primary care physician, or a General Practitioner (GP). The GP
has to decide between treating the patient himself and referring the patient to secondary care. A
referral can be made to a Public Specialist or a Private Specialist, who work, respectively, in the
public and private sectors.
3.1 Patient, GP, and Specialists
The patient is fully insured, and delegates treatment decisions to physicians. Let u denote the
patient�s bene�t from the GP�s treatment. This bene�t depends on a patient�s health status, and
may take any value in an interval [0; L]. The GP observes this bene�t u before making the referral
decision. The GP does not know how much bene�t the patient may obtain from secondary care,
but believes that this is a random variable v. To simplify notation, we also let v vary on [0; L], and
it has a distribution F , and a density f . We assume that the distribution of v is independent of u;
6

if they were correlated, we would simply replace the distribution F by a conditional one.
Upon seeing the patient, a Specialist learns the value of v, as well as the value of u. Our
interpretation is that the GP sends along the patient�s medical information to the Specialist, who
can infer the bene�t u from primary care. There is a delay when a patient is referred to the
Public Specialist, so the bene�t becomes �v, 0 < � < 1, if the patient is treated by the Public
Specialist. Most public systems use waiting time as a rationing mechanism. This is true in Norway,
and motivates our delay assumption. There is no delay when the patient is referred to the Private
Specialist, so if the Private Specialist provides treatment, the patient�s bene�t is v.
A private physician working in the private sector is paid according to a fee-for-service contract
with a national insurance system. The private GP has a fee-for-service rate p, while the Private
Specialist has a rate q. We interpret p and q as unit pro�ts, net of service costs. Very often we have
p < q, so a Specialist receives a higher rate than a GP (although we do not use this inequality).
The Public Specialist receives a salary. This di¤erence in payments implies di¤erent incentives for
service provisions.
Physicians behave as if their preferences are weighted average of pro�ts and patient�s (expected)
bene�ts. Physicians practice medicine according to professional protocols, but also care about
pro�ts. Alternatively, we can regard medical services as implicit or explicit bargaining outcomes
between physicians and patients. Such outcomes (such as the Nash bargaining solution) are often
a weighted average of a physician�s pro�t and a patient�s bene�t. In the literature a physician�s
tradeo¤ between patient bene�t and pro�t is said to constitute his practice style.
It is well-known that physician practice styles vary widely. De�nitive medical guidlines and
protocols are not always available, and doctors operate under a grey area of medicine (Iversen and
Lurås, 2000, and Chandra et al.,2011). It is well documented that the same medical condition
may be treated di¤erently across locations. Further, patients� preferences may have an e¤ect
on how physicians select treatments (Skinner, 2011). We further hypothesize that practice-style
variations are in�uenced by GP market conditions. When GPs compete vigorously for patients,
they may adjust their practice styles to put on more weight on patient bene�t. Alternatively, a
more competitive GP market may endow patients with better outside options. This implies a better
bargaining outcome for them.
7
3.2 The referral process and physician utilities
We allow a Specialist the option to reject a referral and send the patient back to the GP for
primary care services; this option is often ignored in the literature. The referral process is modelled
as follows:
Stage 1: The GP observes the patient�s bene�t value u from his treatment, and decides between
treating the patient, referring the patient to the Private Specialist, and referring the patient
to the Public Specialist.
Stage 2: Upon a referral, the Private or Public Specialist gets to learn both u and v, the latter
having being drawn according to distribution F . The Specialist decides between treating the
patient and sending the patient back to the GP (who then has to treat the patient). There
will be a delay if the referral has been to the Public Specialist.
The GP�s utility is p + �u if he treats the patient; he values pro�t p from fee-for-service (net)
revenue and the patient�s bene�t at �u, where the strictly positive practice-style parameter �
measures the importance of the patient�s bene�t. If the GP refers the patient to the Private
Specialist, and the referral is accepted, his utility is �v. In this case, the GP no longer receives
the fee-for-service payment p, but his concern for the patient remains. We continue to use the
practice-style parameter � to measure how the GP values the patient�s bene�t v from specialty
care. If the GP refers the patient to the Public Specialist, the patient experiences a delay, so the
GP�s utility is discounted by a factor of � to ��v. In the Norwegian system, the GP also receives
a capitation payment for each patient under his care. At the time of referral, the GP has already
received the capitation payment, so we do not write it down explicitly.
The Private Specialist�s utility is similarly de�ned as q + �v if he accepts the referral, where
the practice-style parameter � > 0 is the Specialist�s weight on the patient�s bene�t. If he rejects
the referral and sends the patient back to the GP, his utility is �u. Again, the Specialist values the
patient�s utility at the practice-style parameter � even when the patient is referred back to the GP.
The Public Specialist receives a �xed salary, so we let his payo¤ from treating the patient derive
entirely from his concern for the patient. We normalize the Public Specialist�s salary to 0, and his
practice-style parameter to 1. When the Public Specialist sees the patient, the delay is already a
sunk cost, so we write his utility from treating the patient as v, and his utility from sending the
8
patient back to the GP as u.
3.3 Equilibrium decisions by Specialists
The Public Specialist receives a salary and acts in the patient�s best interest, so he treats the patient
if v > u, and sends the patient back to the GP otherwise. The Private Specialist, however, may not
act in the patient�s best interest. If the Private Specialist accepts the referral, his payo¤ is q + �v.
If he rejects the referral, the patient receives treatment from the GP, so the Private Specialist�s
payo¤ is �u. The Private Specialist accepts the referral if and only if q + �v � �u. Even when
v < u, he may not redirect the patient back to the GP because he earns a monetary pro�t q by
providing treatment. He will send the patient back to the GP only if the monetary payo¤, q, is less
than the incremental utility, �(u� v), or equivalently v < u� q=�.
3.4 GP�s utilities from treating and referring the patient
We now consider the GP�s expected utilities from his three options in Stage 1. He takes into
consideration the best responses of both Specialists. First, if the GP treats the patient, his utility
is
p+ �u: (1)
Second, if the GP refers the patient to the Public Specialist, the referral will be accepted if and
only if v � u. The GP�s expected utility from this referral isZv<u
�[p+ �u] dF (v) +Zv�u
��v dF (v): (2)
Here, the �rst integral (for v < u) corresponds to the Public Specialist rejecting the referral, so the
GP�s payo¤ is p+ �u, and this happens after a delay. The second integral (for v > u) corresponds
to the Public Specialist accepting the referral, so the GP�s payo¤ is �v, and again this happens
after a delay.
Third, if the GP refers the patient to the Private Specialist, the referral will be accepted if and
only if q + �v � �u. The GP�s expected utility from referring the patient to the Private Specialist
is Zv<u�q=�
[p+ �u] dF (v) +Z
v�u�q=�
�v dF (v): (3)
9

Here, the �rst integral (for v < u� q=�) corresponds to the Private Specialist rejecting the referral.
The second integral (for v � u� q=�) corresponds to the Private Specialist accepting the referral.
3.5 GP�s equilibrium referral
We assume that the parameter con�guration in the model admits equilibria in which a referral may
occur. The GP�s equilibrium choice is obtained by comparing the treatment payo¤ p + �u, and
referral to Specialists�payo¤s, respectively, expressions (2), and (3). His choice is guided by two
considerations. First, the GP and the Private Specialist value both pro�ts and the patient�s bene�t,
but the Public Specialist is paid a salary, so a perfect agent for the patient. Second, referring the
patient to the Public Specialist means a delay. The �rst consideration is in favor of the GP referring
the patient to the Public Specialist, but the second is against it.
First, suppose that u is large. The GP�s best strategy is to provide treatment himself. There
is only a small chance that a referral will show that v is higher than u. A referral to the Public
Specialist is suboptimal because of the delay. A referral to the Private Specialist is suboptimal
because the Private Specialist�s concern for the patient is only partial. Second, suppose that u
is small. Here, secondary care likely will bene�t the patient. Referring the patient to the Public
Specialist causes a delay, so the GP�s equilibrium choice must be to refer the patient to the Private
Specialist. Third, for medium values of u, the information about v is valuable, as in the second
case. Here, the GP should also make a referral. However, whether the GP will refer the patient
to the Public or Private Specialist depends on the discount factor �, the parameters � and �, the
fee-for-service rates p and q, and the distribution F .
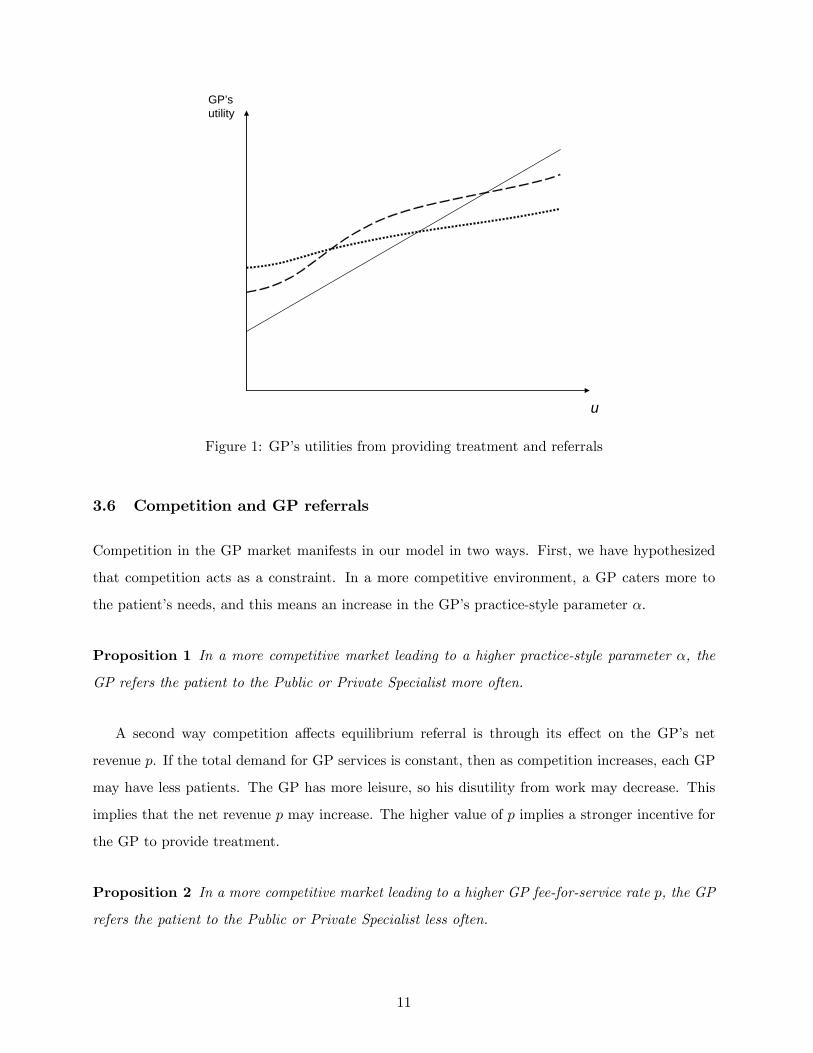
Figure 1 plots the GP�s typical expected utilities from his three choices, as functions of the
patient�s bene�t from the GP, u: The solid line is the GP�s utility from treating the patient (ex-
pression (1)). The dashed line is the utility from referring the patient to the Public Specialist
(expression (2)). The dotted line is the utility from referring the patient to the Private Specialist
(expression (3)). The GP�s equilibrium utility is given by the upper envelope of the three utility
lines. In this example, at small u, the GP obtains the highest utility from referring the patient to
the Private Specialist. For medium u, the highest utility is from referring the patient to the Public
Specialist, while for large u, the highest utility is from the GP treating the patient himself. In
general, however, each pair of the three expected utility lines can cross multiple times.
10
GP’sutility
u
Figure 1: GP�s utilities from providing treatment and referrals
3.6 Competition and GP referrals
Competition in the GP market manifests in our model in two ways. First, we have hypothesized
that competition acts as a constraint. In a more competitive environment, a GP caters more to
the patient�s needs, and this means an increase in the GP�s practice-style parameter �.
Proposition 1 In a more competitive market leading to a higher practice-style parameter �, the
GP refers the patient to the Public or Private Specialist more often.
A second way competition a¤ects equilibrium referral is through its e¤ect on the GP�s net
revenue p. If the total demand for GP services is constant, then as competition increases, each GP
may have less patients. The GP has more leisure, so his disutility from work may decrease. This
implies that the net revenue p may increase. The higher value of p implies a stronger incentive for
the GP to provide treatment.
Proposition 2 In a more competitive market leading to a higher GP fee-for-service rate p, the GP
refers the patient to the Public or Private Specialist less often.
11

A more competitive GP market means higher values of p and �. More intense competition,
therefore, produces e¤ects that act in opposite directions. Our empirical work investigates which
of the two e¤ects is stronger.
4 Data and descriptives
Statistics Norway conducts an annual, cross-sectional �Survey of living conditions in Norway�
(available at http://www.ssb.no/a/english/innrapportering/lev/). The main topic rotates. Every
three to four years the population�s self-assessed health and reported health care utilization will
be the main topic. The main data for our study are from the Survey with health as the main
topic conducted in 2008 and 2009 (Wilhelmsen, 2009). Statistics Norway drew a representative
sample of 10,000 non-institutionalized residents aged 16 and above. The response rate was 66.8%.
In total, 6,465 face-to-face or telephone interviews were completed. Compared with the Norwegian
population, our sample is somewhat overly represented by women and those between 45 and 66
years old.
The Survey asked for information on living and health conditions such as common socioeconomic
characteristics, self-assessed health status, etc. Data of respondents� income and education are
obtained from the national registers. For our empirical work, the key information from the Survey
includes the respondent�s self-assessed health, number and types of chronic diseases, and use of
primary and secondary health services during the twelve-month period before the survey. From
the national registers, we obtain the identity of a respondent�s regular GP. This information is
merged with the survey data. We also add information of GPs and specialty care at the level of
the respondent�s municipality.
Our interest is to measure the intensity of competition between GPs. We use three measures
of competition intensity. The variable #OPEN is the number of GP practices in a respondent�s
municipality that accept new patients. The variable #OPEN/CAPITA is #OPEN divided by
the municipality�s population measured in units of 10,000. Finally, the variable HERFINDAHL
is the Her�ndahl-Hirschmann index. We explain our choices for these three competition-intensity
measures in turn.
More GPs with open practices means more choices for those patients who are dissatis�ed with
their current GPs. Norwegian GPs receive a capitation payment for each patient in his list.
12
It likely is an economic loss for the GP when a patient leaves his practice. A higher value of
#OPEN, therefore, indicates a more competitive market for GPs. The variable #OPEN, how-
ever, is strongly correlated with municipality population. To control for municipality population
size, we use #OPEN/CAPITA as another measure of competition intensity.
In Norway, almost all GPs contract with a municipality, while most Norwegians list with GPs
in their home municipalities. However, Norwegians are free to use GPs outside of their home
municipalities. Our third index for competition intensity, HERFINDAHL, takes into account
these details. The Her�ndahl-Hirschman index is often used for measuring market concentration.
Its use for the health market is also common (Gaynor and Town 2011, and Pauly 2004). For a
given market, the index is the sum of squares of each �rm�s market share; a �rm�s market share is
the ratio of a �rm�s output to the total market output. For a monopoly, the index is 1, while for
a market consisting of N identical �rms, the index is 1=N (=PNi=1(1=N)
2). A lower value of the
index indicates a more competitive market.
For each GP, his output is the number of patients listed with him. A GP competes against
other GPs in a market, that is constructed as follows (see also Chen and Godager 2011). For each
GP in our data, we identify a geographical area within a 10-kilometer radius from the center of his
postal code. We call this a GP�s circle. A GP competes against another GP if and only if their two
circles intersect. Therefore, the market for a GP consists of all the GPs with circles overlapping
with his. For each GP, we compute the Her�ndahl index using patient lists of GPs in his market.
Being based on actual market outcomes, the Her�ndahl index does not take into account any excess
demand for a GP or a GP�s excess capacity. Our other competition measures, the number of open
GP practices with and without population adjustment, do capture excess demand or supply.
In our regressions, we seek to explain specialty care by market conditions. The three key vari-
ables to identify competition intensity are #OPEN, #OPEN/CAPITA, and HERFINDAHL.
We do not use the list size of a respondent�s GP because that is endogenous; physician supply
may well correlate with patients�health status, and hence the specialty referral decision (see, for
example, Dranove and Wehner 1994). Our market-level measures for competition, however, are
arguably exogenous or predetermined. Most important, our competition measures are aggregated
over many physicians. A single GP�s referral decision for a single patient cannot in�uence market
competition intensity. Furthermore, whether a GP practice is open to new patients has been sta-
ble over time. Our regressions are identi�ed by variations of #OPEN across municipalities, and
13
variations of HERFINDAHL across markets. The #OPEN measure is based on municipality
boundaries but the HERFINDAHL measure is not. Our choices provide a robustness check on
the patients�choice sets when they consider switching between GPs.
We use municipality-level indexes to control for patients�access to health care. These indexes
are calculated in Lafkiri (2010), and updates of those in Iversen and Kopperud (2005). We use
two indexes: access to hospital care, and access to specialty care by private practitioners in a
nonhospital setting. Access to hospital care is measured by the variable Accesspub, that re�ects
hospital capacity in terms of the number of physicians, and is constructed as follows. Hospitals (in
a municipality) have catchment municipalities. The variable Accesspub is the number of physician
specialists at public hospitals per 10,000 standardized inhabitants in the catchment municipalities.
The standardization is according to automobile travel time between catchment municipalities to
hospitals, with lower weights on populations farther away from hospitals. Access to private spe-
cialists, Accesspriv, is constructed similarly, but now with the number of private specialists as
the capacity measure. Indexes are standardized over the total number of Norwegian municipali-
ties. We note that while the Her�ndahl index is based on distances, not on patients�residential
municipalities, all other capacity measures describe access in municipalities where patients reside.
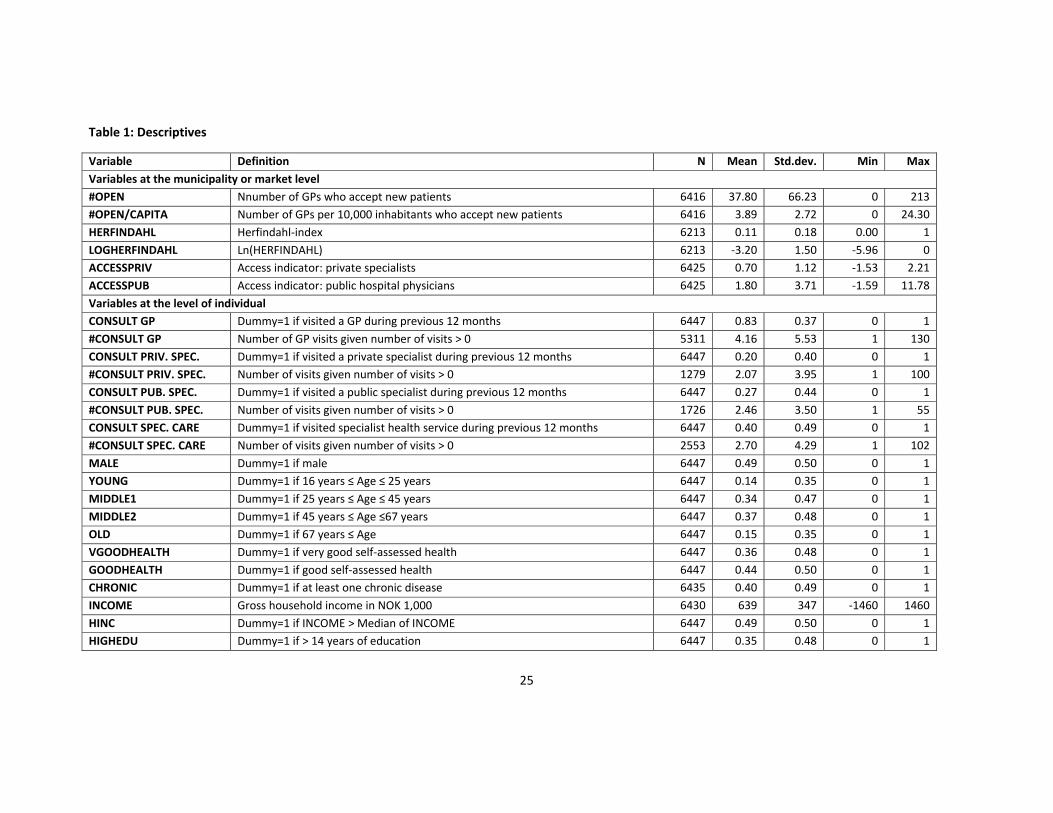
Table 1 presents de�nitions of variables and descriptive statistics. In the sample, 83% of respon-
dents reported seeing a GP in the twelve-month period before the interviews, while 40% reported
having a consultation with a specialist. Since some patients visited both private and public spe-
cialists, the respective percentages of visits (at 20% and 27%) sum to more than 40%. On average,
among respondents who had at least one GP consultation, they saw the GP more than 4 times. The
corresponding average numbers of specialty consultations with the private specialist, public spe-
cialist, and any specialist are, respectively, 2.07, 2.46, and 2.70. Table 1 also presents respondents�
gender and age information.
We use a number of variables to control for health status. Respondents were asked to rate their
health in �ve grades. About 80% reported that their health status was either very good or good.
The remaining 20% reported that their health status was fair, poor, or very poor. Although the
self-assessed health status variables suggest a relatively healthy sample, 40% of the respondents
had at least one chronic disease.
The mean (truncated) gross household income is 639,000 Norwegian Kroners (about US$106,000
at the approximate exchange rate of US$1 to 6Kr in 2008 and 2009). While there may be a nonlinear
14
relationship between specialty-care utilization and a patient�s income, we decided to exclude higher-
order income terms to avoid multicollinearity. To capture this potentially nonlinear e¤ect, in the
estimations we use a binary variable Hinc which is set to 1 for those with gross household income
above the median, and 0 otherwise. Education may also have a nonlinear e¤ect. There may be
signi�cant utilization di¤erences between those with higher education and those without. Again,
we use a binary variable Highedu which is set to 1 for those with 14 or more years of education.
In the sample, 35% of the respondents achieved at least two years of education beyond the high
school.
On average, 37.8 GPs in the respondent�s municipality would accept new patients. This corre-
sponds to 45% of all GPs in the sample. Adjusting for the population size, we �nd a mean of 3.89
for #OPEN/CAPITA which is the number of open GP practices per 10,000 of inhabitants. The
variable of HERFINDAHL has a mean of 0.11. The means of the two standardized variables of
health care access Accesspub and Accesspriv are 1.80 and 0.70, respectively.
TABLE 1 ABOUT HERE
5 Estimation and results
We would like to estimate the impact of competition intensity on GPs�secondary care referrals. Our
estimation strategy takes into account data characteristics. GPs are clustered in municipalities.
In our sample, the number of patients listed with the same GP varies between 1 and 22, with a
median of 2. The number of individuals residing in the same municipality varies between 1 and
744, with a median of 30. Observations within each cluster likely are correlated due to unobserved
characteristics such as physician practice style, location, and customs. Therefore, we allow for
correlated error terms within municipality clusters, and estimate population-averaged panel-data
models with robust standard errors by Stata 11.
We use a logit regression for estimating the probability of any specialty referral by a GP, and a
negative binomial regression for estimating the number of speciality referrals. In each, we separately
estimate regressions for referrals to Private and Public Specialists. In many cases, especially for
chronically ill patients, a single GP referral is all that is needed for many secondary-care visits. The
logit model lets us make a distinction between those patients who have at least one referral, and
15

those who have none. Nevertheless, a patient may require multiple modalities of secondary care or
visits. The actual number of specialty visits is therefore of interest. We can regard the number of
referrals as counts. After having rejected the Poisson model, we use a negative binomial regression.
There are three measures of competition intensity, and we separately estimate referrals to Pri-
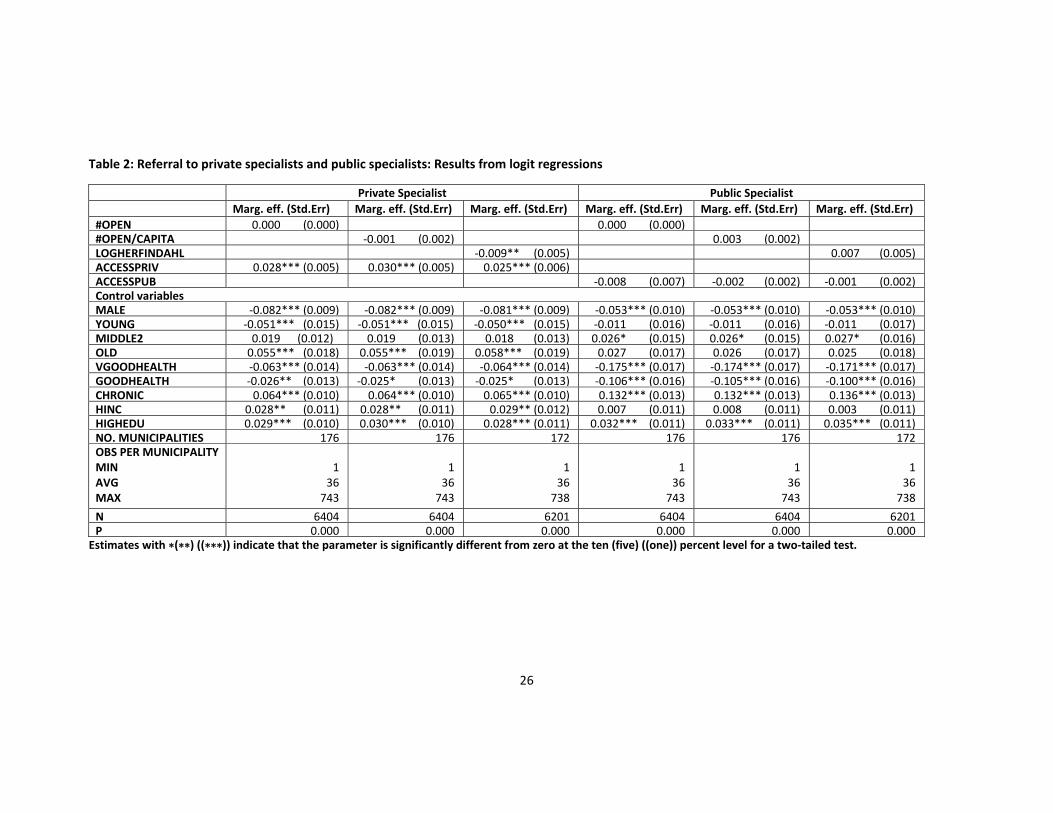
vate and Public Specialists, so there are a total of six sets of regression results in Table 2. All
estimated coe¢ cients are marginal e¤ects at the sample mean. Again, the dependent variable in
Table 2 is the probability of one or more GP referrals. Columns 2, 3, and 4, respectively, use
#OPEN, #OPEN/CAPITA, and LOGHERFINDAHL (the logarithm of HERFINDAHL)
to measure competition intensity, and report results for referrals to Private Specialists. In these
three regressions, we use the variable Accesspriv to control for access to private secondary care.
Columns 5, 6, and 7 are for referrals to Public Specialists, and have the same format, except that
we use the variable Accesspub to control for access to hospital care.
TABLE 2 ABOUT HERE
The competition intensity indicators #OPEN and #OPEN/CAPITA have no e¤ect on the
probability of GPs referring a patient to specialty care at private or public settings. For the
third competition-intensity measure, LOGHERFINDAHL, has no e¤ect on referrals to Public
Specialists, but a negative and signi�cant (at 5%) e¤ect on referrals to Private Specialist. A
higher value of LOGHERFINDAHL indicates a higher market concentration, which proxies less
competition. Hence, the negative e¤ect says that as competition becomes more intense, GPs refer
patients to Private Specialists more often. Our results do not support the hypothesis that more
GPs would lead to reductions in secondary care.
Our results cannot be attributed GPs�tendency to locate in municipalities where illnesses (and
hence referrals) are more prevalent. This is because our market-condition measures, #OPEN and
#OPEN/CAPITA, are measures of excess capacities. We do not use GPs�actual list sizes except
in the construction of the Her�ndahl-Hirschman index. There is no reason to expect a positive
correlation between excess capacity and illness. (In fact, a negative correlation might be more
likely because GPs have more cases to take care of when they are located in areas with sicker
patients.)
The reverse association that more specialty referrals result in more open GP practices is im-
plausible. An open practice is a signal of excess capacity, but the current payment system does
16
not reward GPs for having open practices. Also, a GP receives a capitation payment when he
enrolls a patient. If the GP makes his practice open to new patients, the capitation payment must
be attractive to him. More specialty referrals mean less treatment provision, so a GP loses the
fee-for-service payment also.
We have used Accesspriv and Accesspub to control for access to private and public specialty
care. Although Accesspriv has the expected positive and signi�cant e¤ects on referrals to Private
Specialists, Accesspub has insigni�cant e¤ects on referrals to Public Specialists.
In all regressions, we have controlled for gender, age, socioeconomic status and self-assessed
health. The estimated marginal e¤ects of all these controls are as expected. Being female raises
the probability of a referral for specialty care at both private and public settings. Senior citizens
are more likely to have a referral than the young, but the e¤ects are only signi�cant for referrals
to Private Specialists. Those with better self-assessed health have a smaller probability of con-
sulting secondary care providers, while the opposite is true for those who have chronic diseases.
Well-educated individuals and those with above-median incomes have higher probabilities of using
specialty care. but for the latter group the positive e¤ects are insigni�cant for referrals to Public
Specialists.
We considered including Accesspriv and Accesspub in each of the regressions. However,
these two access variables are strongly correlated, and we chose only the natural one for the corre-
sponding regression (for example Accesspriv for the regressions with private specialist referral as
the dependent variable). We also considered estimating a system of equations for a decision process.
Here, the GP �rst decides between providing treatment and referring the patient to specialty care.
If the GP decides against providing treating, then he chooses between a private specialist referral
and a public specialist referral. However, no information in our data would allow us to identify
each individual equation in this system.
TABLE 3 ABOUT HERE
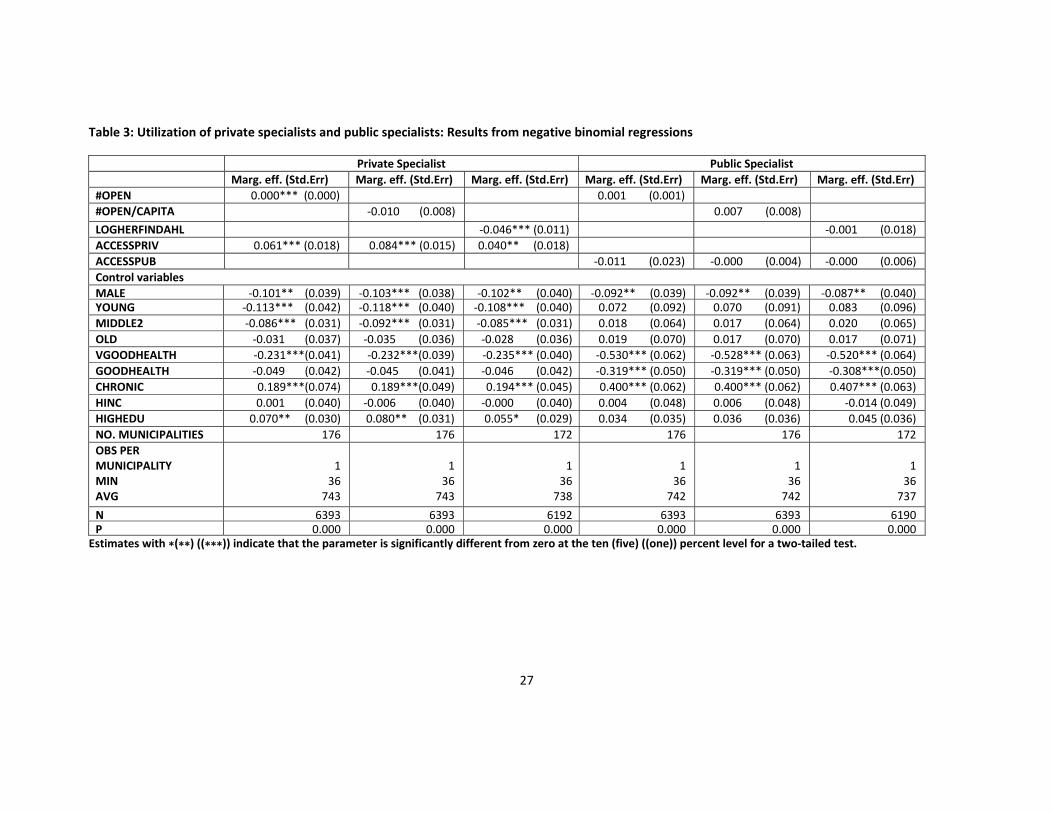
In Table 3, we report results from the negative binomial regressions. The dependent variables
are the number of visits to the Private and Public Specialists. Again, there are six sets of regression
results, and they follow the same format as those in Table 2. More intense competition as measured
by LOGHERFINDAHL has a positive and signi�cant (at 1%) e¤ect on the number of visits to
Private Specialists but no e¤ect on the number of visits to Public Specialists. The competition
17

measure#OPEN has a similar e¤ect. These are the only signi�cant marginal e¤ects of competition
measures on specialty visits. The estimated marginal e¤ects of the control variables generally follow
the same corresponding patterns as in the logit regressions.
6 Concluding remarks
In many policy discussions, the idea of having more primary care physicians has been promoted.
It is thought that that will lead to better primary care, and reduce secondary care at the same
time. We have constructed a model of GPs�secondary care referrals. Then we have used a set of
Norwegian survey data and register data to test whether competition among GPs will lead to more
or less referrals.
We model the referral decision of a GP who is paid by both capitation and fee-for-service. Our
theory predicts two opposing e¤ects when the GP market becomes more competitive. First, GPs
become more concerned with patients�welfare as the GP market becomes more competitive, so
they refer patients to secondary care more often. Second, competition may reduce GPs�workload,
so they earn a higher net pro�t from providing treatments to patients themselves, so they refer
patients to secondary care less often.
Using data from a representative survey of Norwegian citizens conducted by Statistics Norway
in 2008-2009 and linked data of survey respondents�GPs and municipalities, we assess the overall
e¤ects of competition. We �nd no evidence that more competition in the GP market will reduce
speciality care. Our three competition measures either have insigni�cant e¤ects or small and positive
e¤ects on the likelihood of a referral and the number of specialty visits.
The basis for a policy to increase primary care physicians seems straightforward. When there
are more GPs, patients have more choices, and likely receive more care from them. Nevertheless,
the relationship between GP competition and secondary care is multifaceted. One might even argue
that making referrals is one of the GP�s responsibility, so increasing the number of GPs will increase
referrals.
A policy that aims to reduce costly specialty care seems to require a change in medical practices.
A success in cost reduction is achieved when secondary care is substituted by primary care. This
means that the traditional guidelines for GPs�and specialists�responsibilities have to be redrawn.
Alternatively, an integrated approach, in which GPs and specialists together internalize cost and
18

bene�t may o¤er a better avenue for e¢ ciency.
7 Appendix
Proof of Proposition 1: A GP refers a patient if and only if his expected utility from referral is
higher than the utility from treating the patient. This is equivalent to
p+ �u � min
8>>>>><>>>>>:
Zv<u
�[p+ �u] dF (v) +Zv�u
��v dF (v);
Zv<u�q=�
[p+ �u] dF (v) +Z
v�u�q=�
�v dF (v)
9>>>>>=>>>>>;; (4)
the two terms on the right-hand side of the inequality being the expected utilities from referrals to
the Public and Private Specialists, respectively.
The derivative of (1) with respect to � is u. The derivative of (2) with respect to � isZv<u
�u dF (v) +Zv�u
�v dF (v): (5)
Finally, the derivative of (3) with respect to � isZv<u�q=�
u dF (v) +Z
v�u�q=�
v dF (v): (6)
Suppose that at some u, say bu, we havep+ �bu = Z
v<bu�[p+ �bu] dF (v) + Z
v�bu��v dF (v)
so that the GP is indi¤erent between treating the patient and referring the patient to the Public
Specialist. We rewrite this condition as
p+ �bu = �pF (bu) + �8><>:Zv<bu
�bu dF (v) + Zv�bu
�v dF (v)
9>=>; : (7)
Because p > �pF (bu), we have�bu < �
8><>:Zv<bu
�bu dF (v) + Zv�bu
�v dF (v)
9>=>; :
19
This inequality says that at bu, the derivative of (1) with respect to �, namely bu, is strictly smallerthan (5), the derivative of (2) with respect to �.
At bu, as � increases, the GP�s expected utility from referring the patient to the Public Specialistincreases faster than the utility from treating the patient. Because of (7), we conclude that at buthe GP refers the patient to the Public Specialist when � increases.
Next, suppose that at some u, say eu, we havep+ �eu = Z
v<eu�q=�[p+ �eu] dF (v) + Z
v�eu�q=��v dF (v)
so that the GP is indi¤erent between treating the patient and referring the patient to the Private
Specialist. We rewrite this condition as
p+ �eu = pF (eu� q=�) + �8><>:
Zv<eu�q=�
eu dF (v) + Zv�eu�q=�
v dF (v)
9>=>; : (8)
Because p > pF (eu� q=�), we have�eu < �
8><>:Z
v<eu�q=�eu dF (v) + Z
v�eu�q=�v dF (v)
9>=>; :This inequality says that at eu, the derivative of (1) with respect to �, namely eu, is strictly smallerthan (6), the derivative of (3) with respect to �.
At eu, as � increases, the GP�s expected utility from referring the patient to the Private Specialistincreases faster than the utility from treating the patient. Because of (8), we conclude that at eu,the GP refers the patient to the Private Specialist when � increases.
Proof of Proposition 2: With respect to p, the derivative of the GP�s utility from treating
the patient in (1) is 1. The derivative of the GP�s utility from referring the patient to the Public
Specialist (2) is Zv<u
� dF (v) < 1:
Finally, the derivative of the GP�s utility from referring the patient to the Private Specialist (3) isZv<u�q=�
dF (v) < 1:
Clearly, the GP�s utility rises faster in p when he treats the patient than when he refers the patient
to either the Public or Private Specialists.
20

If the GP treats a patient at some u, we have
p+ �u � max
8>>>>><>>>>>:
Zv<u
�[p+ �u] dF (v) +Zv�u
��v dF (v);
Zv<u�q=�
[p+ �u] dF (v) +Z
v�u�q=�
�v dF (v)
9>>>>>=>>>>>;: (9)
As p increases, the utility term on the left-hand side of (9) increases at a rate of 1, but each utility
term on the right-hand side of (9) increases at a rate less than 1. Hence, the inequality in (9)
remains valid as p increases.
21
References
[1] Allard,M., Jelovac, I., Léger P.T. (2011): Treatment and referral decisions under di¤erent
physician payment mechanisms. Journal of Health Economics 30, 880�893.
[2] Atella, V., Deb,P. (2008): Are primary care physicians, public and private sector specialists
substitutes or complements? Evidence from a simultaneous equations model for count data.
Journal of Health Economics 27, 770�785.
[3] Baicker K., Chandra, A. (2004): The productivity of physician specialization: evidence from
the Medicare program. American Economic Review 94, 357�61.
[4] Barros P.P., Olivella, P. (2005): Waiting lists and patient selection. Journal of Economics &
Management Strategy 14, 623�646.
[5] Biglaiser, G., Ma, C.A. (2007): Moonlighting: public service and private practice. RAND
Journal of Economics 38, 1113� 1133.
[6] Bradley Wright, T., Ricketts III, C. (2010): The road to e¢ ciency? Re-examining the impact
of the primary care physician workforce on health care utilization rates. Social Science &
Medicine 70, 2006-2010.
[7] Brekke, K. R., R. Nuscheler, and O. R. Straume (2007). Gatekeeping in health care. Journal
of health economics 26 (1), 149�170.
[8] Chandra, A., D. Cutler, and Z. Song (2011). Who ordered that? The economics of treatment
choices in medical care. Handbook of Health Economics 2, 397�432.
[9] Chen, X., Godager G. (2011): Development of competition indicators in the Norwegian general
practice: Constructing a postal code-speci�c Her�ndahl-Hirschman index applying STATA
software. HEROWorking Paper 2011:1, Health Economics Research Program at the University
of Oslo, Norway.
[10] Chernew, M.E., Sabik, L., Chandra, A., Newhouse, J.P. (2009): Would having more primary
care doctors cut health spending growth? Health A¤airs 28, 1327-1335.
22

[11] Dranove, D.,Wehner, P., (1994): Physician-induced demand for childbirths. Journal of Health
Economics 13, 61�73.
[12] Fortney, J.C., Ste¢ ck, D.E., Burgess Jr, J.F. , Maciejewski, M.L., Petersen, L. A. (2005): Are
primary care services a substitute or complement for specialty and inpatient services. Health
Services Research 40, 1422-1442.
[13] Gaynor, M., Town, R.J. (2011): Competition in health care markets. In M.V. Pauly, T.G.
Mcguire and P.P. Barros (Eds.) Handbook of Health Economics, Volume 2, Elsevier Science,
Amsterdam,: 499-637.
[14] González, P. (2010). Gatekeeping versus direct-access when patient information matters. Health
economics 19 (6), 730�754.
[15] Iversen, T. and H. Lurås (2000). Economic motives and professional norms: the case of general
medical practice. Journal of Economic Behavior & Organization 43 (4), 447�470.
[16] Iversen, T., Kopperud, G. S. (2005): Regulation versus practice: The impact of accessibility
on the use of specialist health care in Norway. Health Economics 14, 1231�1238.
[17] Iversen, T., Lurås, H. (2011): Patient switching in general practice. Journal of Health Eco-
nomics 30, 894�903.
[18] Iversen, T., Ma, C.A. (2011): Market conditions and general practicioners�referrals. Interna-
tional Journal of Health Care Finance and Economics 11, 245-265.
[19] Lafkiri, K. (2010): Municipality level accessibility to specialized health care in Norway. HERO
Working Paper 2010:7, Health Economics Research Program at the University of Oslo, Norway.
[20] Mariñoso, B. G. and I. Jelovac (2003). Gps� payment contracts and their referral practice.
Journal of Health Economics 22 (4), 617�635.
[21] Pauly, M. V. (2004): Competition in medical services and the quality of care: concepts and
history. International Journal of Health Care Finance and Economics 4, 113�130.
[22] Skinner, J. (2011). Causes and consequences of regional variations in health care. Handbook of
health economics 2, 45�93.
23

[23] White paper No. 47 (2008�2009) to the Storting: The Coordination Reform: Proper treatment
�at the right place and right time. The Government of Norway, Oslo.
[24] Wilhelmsen, M. (2009): Samordnet levekårsundersøkelse 2008 � Tverrsnittsundersøkelsen.
Dokumentasjonsrapport 2009:40. Statistisk sentralbyrå, Oslo.
[25] Wong, H.S., Zhan, C., Mutter, R. (2005): Do di¤erent measures of competition measures
matter in empirical investigations of hospital behavior? Review of Industrial Organization 26,
61-87.
24
25
Table 1: Descriptives
Variable Definition N Mean Std.dev. Min MaxVariables at the municipality or market level #OPEN Nnumber of GPs who accept new patients 6416 37.80 66.23 0 213#OPEN/CAPITA Number of GPs per 10,000 inhabitants who accept new patients 6416 3.89 2.72 0 24.30HERFINDAHL Herfindahl‐index 6213 0.11 0.18 0.00 1LOGHERFINDAHL Ln(HERFINDAHL) 6213 ‐3.20 1.50 ‐5.96 0ACCESSPRIV Access indicator: private specialists 6425 0.70 1.12 ‐1.53 2.21ACCESSPUB Access indicator: public hospital physicians 6425 1.80 3.71 ‐1.59 11.78Variables at the level of individual CONSULT GP Dummy=1 if visited a GP during previous 12 months 6447 0.83 0.37 0 1#CONSULT GP Number of GP visits given number of visits > 0 5311 4.16 5.53 1 130CONSULT PRIV. SPEC. Dummy=1 if visited a private specialist during previous 12 months 6447 0.20 0.40 0 1#CONSULT PRIV. SPEC. Number of visits given number of visits > 0 1279 2.07 3.95 1 100CONSULT PUB. SPEC. Dummy=1 if visited a public specialist during previous 12 months 6447 0.27 0.44 0 1#CONSULT PUB. SPEC. Number of visits given number of visits > 0 1726 2.46 3.50 1 55CONSULT SPEC. CARE Dummy=1 if visited specialist health service during previous 12 months 6447 0.40 0.49 0 1#CONSULT SPEC. CARE Number of visits given number of visits > 0 2553 2.70 4.29 1 102MALE Dummy=1 if male 6447 0.49 0.50 0 1YOUNG Dummy=1 if 16 years ≤ Age ≤ 25 years 6447 0.14 0.35 0 1MIDDLE1 Dummy=1 if 25 years ≤ Age ≤ 45 years 6447 0.34 0.47 0 1MIDDLE2 Dummy=1 if 45 years ≤ Age ≤67 years 6447 0.37 0.48 0 1OLD Dummy=1 if 67 years ≤ Age 6447 0.15 0.35 0 1VGOODHEALTH Dummy=1 if very good self‐assessed health 6447 0.36 0.48 0 1GOODHEALTH Dummy=1 if good self‐assessed health 6447 0.44 0.50 0 1CHRONIC Dummy=1 if at least one chronic disease 6435 0.40 0.49 0 1INCOME Gross household income in NOK 1,000 6430 639 347 ‐1460 1460HINC Dummy=1 if INCOME > Median of INCOME 6447 0.49 0.50 0 1HIGHEDU Dummy=1 if > 14 years of education 6447 0.35 0.48 0 1
26
Table 2: Referral to private specialists and public specialists: Results from logit regressions
Private Specialist Public Specialist Marg. eff. (Std.Err) Marg. eff. (Std.Err) Marg. eff. (Std.Err) Marg. eff. (Std.Err) Marg. eff. (Std.Err) Marg. eff. (Std.Err)#OPEN 0.000 (0.000) 0.000 (0.000)#OPEN/CAPITA ‐0.001 (0.002) 0.003 (0.002) LOGHERFINDAHL ‐0.009** (0.005) 0.007 (0.005)ACCESSPRIV 0.028*** (0.005) 0.030*** (0.005) 0.025*** (0.006)ACCESSPUB ‐0.008 (0.007) ‐0.002 (0.002) ‐0.001 (0.002)Control variables MALE ‐0.082*** (0.009) ‐0.082*** (0.009) ‐0.081*** (0.009) ‐0.053*** (0.010) ‐0.053*** (0.010) ‐0.053*** (0.010)YOUNG ‐0.051*** (0.015) ‐0.051*** (0.015) ‐0.050*** (0.015) ‐0.011 (0.016) ‐0.011 (0.016) ‐0.011 (0.017)MIDDLE2 0.019 (0.012) 0.019 (0.013) 0.018 (0.013) 0.026* (0.015) 0.026* (0.015) 0.027* (0.016)OLD 0.055*** (0.018) 0.055*** (0.019) 0.058*** (0.019) 0.027 (0.017) 0.026 (0.017) 0.025 (0.018)VGOODHEALTH ‐0.063*** (0.014) ‐0.063*** (0.014) ‐0.064*** (0.014) ‐0.175*** (0.017) ‐0.174*** (0.017) ‐0.171*** (0.017)GOODHEALTH ‐0.026** (0.013) ‐0.025* (0.013) ‐0.025* (0.013) ‐0.106*** (0.016) ‐0.105*** (0.016) ‐0.100*** (0.016)CHRONIC 0.064*** (0.010) 0.064*** (0.010) 0.065*** (0.010) 0.132*** (0.013) 0.132*** (0.013) 0.136*** (0.013)HINC 0.028** (0.011) 0.028** (0.011) 0.029** (0.012) 0.007 (0.011) 0.008 (0.011) 0.003 (0.011)HIGHEDU 0.029*** (0.010) 0.030*** (0.010) 0.028*** (0.011) 0.032*** (0.011) 0.033*** (0.011) 0.035*** (0.011)NO. MUNICIPALITIES 176 176 172 176 176 172OBS PER MUNICIPALITY MIN AVG MAX
1 36 743
1 36 743
1 36 738
1 36 743
1 36 743
1 36 738
N 6404 6404 6201 6404 6404 6201P 0.000 0.000 0.000 0.000 0.000 0.000
Estimates with ( ) (( )) indicate that the parameter is significantly different from zero at the ten (five) ((one)) percent level for a two‐tailed test.
27
Table 3: Utilization of private specialists and public specialists: Results from negative binomial regressions
Private Specialist Public Specialist Marg. eff. (Std.Err) Marg. eff. (Std.Err) Marg. eff. (Std.Err) Marg. eff. (Std.Err) Marg. eff. (Std.Err) Marg. eff. (Std.Err)#OPEN 0.000*** (0.000) 0.001 (0.001)#OPEN/CAPITA ‐0.010 (0.008) 0.007 (0.008)
LOGHERFINDAHL ‐0.046*** (0.011) ‐0.001 (0.018)ACCESSPRIV 0.061*** (0.018) 0.084*** (0.015) 0.040** (0.018)ACCESSPUB ‐0.011 (0.023) ‐0.000 (0.004) ‐0.000 (0.006)Control variables MALE ‐0.101** (0.039) ‐0.103*** (0.038) ‐0.102** (0.040) ‐0.092** (0.039) ‐0.092** (0.039) ‐0.087** (0.040)YOUNG ‐0.113*** (0.042) ‐0.118*** (0.040) ‐0.108*** (0.040) 0.072 (0.092) 0.070 (0.091) 0.083 (0.096)MIDDLE2 ‐0.086*** (0.031) ‐0.092*** (0.031) ‐0.085*** (0.031) 0.018 (0.064) 0.017 (0.064) 0.020 (0.065)OLD ‐0.031 (0.037) ‐0.035 (0.036) ‐0.028 (0.036) 0.019 (0.070) 0.017 (0.070) 0.017 (0.071)VGOODHEALTH ‐0.231***(0.041) ‐0.232***(0.039) ‐0.235*** (0.040) ‐0.530*** (0.062) ‐0.528*** (0.063) ‐0.520*** (0.064)GOODHEALTH ‐0.049 (0.042) ‐0.045 (0.041) ‐0.046 (0.042) ‐0.319*** (0.050) ‐0.319*** (0.050) ‐0.308***(0.050)CHRONIC 0.189***(0.074) 0.189***(0.049) 0.194*** (0.045) 0.400*** (0.062) 0.400*** (0.062) 0.407*** (0.063)HINC 0.001 (0.040) ‐0.006 (0.040) ‐0.000 (0.040) 0.004 (0.048) 0.006 (0.048) ‐0.014 (0.049)HIGHEDU 0.070** (0.030) 0.080** (0.031) 0.055* (0.029) 0.034 (0.035) 0.036 (0.036) 0.045 (0.036)NO. MUNICIPALITIES 176 176 172 176 176 172OBS PER MUNICIPALITY MIN AVG
1 36 743
1 36 743
136738
1 36 742
1 36 742
1 36 737
N 6393 6393 6192 6393 6393 6190P 0.000 0.000 0.000 0.000 0.000 0.000
Estimates with ( ) (( )) indicate that the parameter is significantly different from zero at the ten (five) ((one)) percent level for a two‐tailed test.